journal of energy storage - stanford university
TRANSCRIPT

Contents lists available at ScienceDirect
Journal of Energy Storage
journal homepage: www.elsevier.com/locate/est
Aging characterization and modeling of nickel-manganese-cobalt lithium-ion batteries for 48V mild hybrid electric vehicle applications
Zifan Liua, Andrej Ivancoa, Simona Onorib,⁎
a Automotive Engineering Department, Clemson University, Greenville, SC, 29607 USAb Energy Resources Engineering Department, Stanford University, USA
A R T I C L E I N F O
Keywords:Lithium-ion battery48V mild hybridModeling
A B S T R A C T
This paper investigates the cycle aging behavior of nickel-manganese-cobalt (NMC) lithium ion battery cellsunder high current rates and narrow window of State-of-Charge (SOC) variation for 48 V mild hybrid electricvehicle (HEV) applications. The charge sustaining aging profiles were synthesized from real-world duty cycles insome of the authors’ previous work [44,45] and used in the laboratory for life cycle aging testing spaced out byperiodic cell capacity tests performed to assess cell aging conditions. Furthermore, at each 1C discharged agingcharacterization stage, the parameters of a physics-based electrochemical cell model were identified using theBayesian Markov Chain Monte Carlo (MCMC) method. Among the parameters that can be identified with suf-ficient accuracy from the experimental data, the concentration of lithium-ions at the negative electrode after fullcharge is found to be strongly correlated with the system-level loss of capacity. These results provide newinsights on the aging performance of NMC lithium ion cells in battery management system for 48 V hybridvehicles.
1. Introduction
Hybrid electric vehicles (HEVs), plug-in hybrid electric vehicles(PHEVs) and battery electric vehicles (BEVs) are being widely deployedto improve powertrain fuel efficiency and reduce tailpipe emissions.Their market acceptance demands refined battery technologies in termsof lifetime, safety, specific energy, specific power and cost. The lithium-ion chemistry is gaining popularity and expanding dominance intoelectric vehicles. However, to fulfill customer expectations with respectto electric range and service life across real-world usage, manufactureshave often chosen to oversize the lithium ion battery pack in sacrifice ofcosts. Therefore, efficient management and optimized design alongwith deeper understandings on lithium ion battery aging have been themain research foci to minimize ownership costs [1].
It is common to separate lithium ion battery aging processes bycalendar aging under storage and cycle aging upon usage. While ca-lendar aging is stressed by time, temperature and State of Charge (SOC),cycle aging introduces additional stressors such as Ampere-hour (Ah)throughput, SOC change (ΔSOC), and current rate. To understand theimpacts from these aging stressors, well-controlled test activities areusually conducted in laboratory. Previous testing efforts have been re-ported for lithium ion chemistries with different positive electrodematerials, such as, lithium nickel-manganese-cobalt (NMC) [2–8],
lithium manganese oxide (LMO) [9,10], lithium NMC-LMO composite[11–14], lithium iron-phosphate (LFP) [15–18], and lithium nickel-cobalt-aluminum (NCA) [19,20]. This study focuses on the cycle agingperformance of NMC cells in a 48 V system. The test matrices used inprevious studies [2–7] combine different ΔSOCs around different SOCsand at 1C discharge/charge rate with fixed temperatures. In [8], on theother hand, an extended design of experiment comprises 5 ΔSOCs, 3charging rates (0.2C, 0.5C, 1C), 3 discharge rates (0.5C, 1C, 2C) and 3temperatures (25 °C, 35 °C, 50 °C) at 50% SOC. Given the low currentrate (≤2C) and wide ΔSOCs, these experiments were mainly designedfor high energy applications such as BEV and PHEV. A gap clearly existsin the understandings of NMC cell aging performance in HEV applica-tions with high current rates and narrow state of charge excursion(compatible with a ΔSOC in the range of 15–30%) for charge sustainingoperation.
The aging of lithium-ion battery cells manifests as capacity loss andresistance growth [21,22]. Aging models are regarded as useful tools tointerpret aging test results and predict cell performance. While data-driven (see [23,24],) and empirical (see [2,7,25–31,42],) aging modelsview the cell as a whole entity, physics-based aging models offer analternative perspective to look into the cell at the electrode or evenfiner levels. The basis for the construction of physics-based agingmodels is the physics-based electrochemical cell model which describes
https://doi.org/10.1016/j.est.2018.11.016Received 30 September 2018; Received in revised form 2 November 2018; Accepted 15 November 2018
⁎ Corresponding author.E-mail addresses: [email protected] (Z. Liu), [email protected] (A. Ivanco), [email protected] (S. Onori).
Journal of Energy Storage 21 (2019) 519–527
2352-152X/ © 2018 Published by Elsevier Ltd.
T

the fresh cell dynamics [32–41]. In some studies [33,39], the electro-chemical cell models are extended to aging models by adding thegoverning equations of aging reactions; in other studies [35,41], asubset of parameters of the electrochemical cell model are updatedaccording to empirical relations to account for aging effects. This studyadopts the single particle (SP) electrochemical cell model for the aginginvestigation [33–35].
However, one challenge of using the electrochemical cell model liesin the identification of multiple model parameters. It is common prac-tice to regard the parameter identification problem as a nonlinear op-timization problem, aimed at minimizing the least-square differencebetween model outputs and experiment measurements. Several nu-merical algorithms are available and have been successfully applied forthis nonlinear optimization problem. They can be categorized as gra-dient-based algorithms, such as Levenberg-Marquardt method [35],trust region algorithm [36], and Newton method [41]; and non-gra-dient-based algorithms, such as genetic algorithm [38], simplex searchmethod [40], and particle swarm optimization algorithm [40]. Whilethe results of gradient-based algorithm can be easily trapped in localminima, the non-gradient-based algorithms have the potential to con-verge to the global minima or maxima from any initial values.
Additionally, experimental data might fail to provide the informa-tion needed to carry out full parameter set identification. In this regard,the single-factored sensitivity analysis can generally be used as the baseline study to assess the dependence of the model output on eachparameter as done in [36], where different aging scenarios were testedto identify aging parameters of an electrochemical model for the 26650Lithium-ion battery cells based on iron-phosphate chemistry.
This approach, though, only gives local sensitivity results whenapplied to nonlinear models. To gain more insights about the ability toidentify model parameters from output measurements, the Fisher in-formation method can be used, as in [37,40], where single-factoredsensitivity analysis study and covariance matrix evaluation from mea-surements were combined in a unified approach. Nevertheless, thepotential interaction among all parameters is not taken into account. In[41], a Markov Chain Monte Carlo (MCMC) method was proposed tostochastically estimate the parameter distributions. The effectiveparameters and their uncertainties are estimated using a reformulationand simplification of the pseudo-two-dimensional (P2D) model from[32] for offline application. The cell chemistry and type, along with thespecific battery application used in [41] were not reported, leaving theapplicability and generalization of the results debatable.
In this paper, we identify and validate a single particle (SP) elec-trochemical model using data collected on 18650 NMC lithium-ionbatteries to mimic the behavior of a 48 V HEV battery. The MCMC-based method is used to carried out the parameter identification. Thenovel contribution of the paper is in the experimental aging campaigncarried out for a micro hybrid battery application and the application ofMCMC to identify the parameters of a SP model to predict the agingbehavior of a 48 V battery.
The rest of this paper is organized as follows. Section II reports theexperimental setup of the cycle aging tests along with test results.Section III details the SP electrochemical cell model, and in Section IVthe MCMC algorithm used to identify the SP model parameters acrossaging is introduced and a discussion of the aging mechanisms occurringin the NMC cell tested using the customized test campaign is provided.Results and their relevance for the NMC cell aging performance in 48 Vsystems is summarized in Section V.
2. Experimental setup
In this study, aging experiments are conducted over cylindricalNMC 18650 lithium ion cells with rated capacity of 2 Ah (at 1C dis-charge rate) and nominal voltage of 3.6 V. Cell specifications are listedin Table 1. The aging test profiles were designed by synthesizing cellduty cycles experienced by a 48 V mild hybrid vehicle battery [43]. In
particular, the duty cycles were categorized in terms of driving style(calm/normal/aggressive) and mean cycle speed (low/medium/high).They were synthesized for cell aging testing through a frequency ana-lysis based on a power spectral density estimation approach [44]. Theaging campaign consists of cycling NMC cells using the calm low (CLS)speed and the aggressive high speed (AHS) profiles, shown in Fig. 1 (a)and (b), at two different temperatures, i.e. 23 °C and 45 °C. The CLS andAHS driving cycles are a synthetic representation, in terms of meanspeed and driving style, of a set of naturalistic vehicle drive cyclescarried out using Welch’s power spectral density approach [44]. Thedrive cycle data source used in [44] was obtained from the householdtravel survey from June 2001 to March 2002 conducted by SCAG(Southern California Association of Governments). The data were madepublicly available through the U.S. Department of Energy’s NationalRenewable Energy Laboratory (NREL) [49].
For validation purposes, a new aging profile, shown in Fig. 1 (c),was designed and used in the experimental campaign. It was con-structed by adding one micro charge profile to the aggressive highspeed profile while using the shorter discharge time period from thecalm low speed profile. In this way, the new condition accounts for anaverage discharge current of 16.1 A. Such a high current rate representsan accelerating stress factor in the context of hybrid vehicle applica-tions. The temperature was fixed at 45 °C for the new validation profile.Moreover, for repeatability considerations, two cells (Cell#9 andCell#10) were tested under this new condition. All aging profiles keptcycling the cells around 50% SOC to represent the typical HEV chargesustaining operating conditions.
Experiments were carried out in the Battery Aging andCharacterization (BACh) Laboratory at the Automotive EngineeringDepartment, Clemson University. The experimental setup used for theaging campaign, shown in Fig. 2, is composed of the Arbin BT-2000battery cycler with a programmable power supply and an electronicload; a MITS Pro data acquisition software for the programming of testprofiles and the control of the Arbin cycler; Peltier junctions that are indirect contact with the cell fixtures for thermoelectric temperaturecontrol. All cells underwent periodic capacity and internal resistancecharacterization tests at room temperature (∼23 °C) throughout theaging campaign. The capacity test at 1C rate (2 A, nominal capacityvalue) consists of four steps: 1) charging the cell to 4.2 V at 1C constantcurrent; 2) holding constant voltage at 4.2 V until the current drops toC/50; 3) 1 h rest; 4) discharging at 1C to the cut-off voltage of 2.5 V.
For calculation of the internal resistance, the hybrid pulse powercharacterization (HPPC) profile was executed [50]. The HPPC profileconsists of an 18s 2C discharge pulse followed by a 40 s rest period and10 s 1.5C charge pulse followed by a 40 s rest period. Each pulse isapplied every 10% SOC decrease between 90% and 20% SOC. Both thecapacity and HPPC tests profiles are depicted in Fig. 3. The 10 cells usedin the aging campaign are listed in Table 2 based on their aging con-dition, e.g., CLS45 indicates a cell tested using the Calm Low Speedprofile at 45 °C. Cells #7 and #8 were tested using the AHS45 profile foronly 9 weeks due to the premature aging that occurred under the high-rate and high-temperature condition. Cells #9 and #10, tested under
Table 1NMC 18650 cell specifications.
Specifications Unit Values
Chemistry Nickel-Manganese-Cobalt (NMC)Lithium ion
Nominal Capacity Ah 2.0 (at 1C discharge)Nominal Voltage V 3.6Max Discharge Continuous Current A 32Discharge Cutoff Voltage V 2.5Max Charge Continuous Current A 12Charge Cutoff Voltage V 4.2Internal Impedance mΩ 12 (measured by AC 1 kHz)
Z. Liu et al. Journal of Energy Storage 21 (2019) 519–527
520

the New Condition cycle and characterized by a higher C-rate than theAHS45 cycle, lasted for only 6 weeks. On the other hand, cells #1, #3and #5 were cycled for 12 weeks whereas their ‘sister’ cells, #2, #4 and#6, tested under the same conditions, were terminated earlier than 12weeks given that similar aging trends were observed. The normalizedcapacity losses are compiled in Fig. 4 (a), for the time-based aging andFig. 4 (b), for kAh-throughput-based aging. For both scenarios, Cells #1and #2 under CLS23 cycle show no capacity loss after 3-month ofaging. Interestingly, for CLS45 Cell#3 and AHS23 Cell#6, capacityrecoveries are observed during the first few aging characterizationstages. The recovery in capacity is suggested to possibly be due to in-creased electrode active surface area, resulting from cracking of thepositive electrode material grains [39,40]. But when compared to theirrepeated counterparts, those recoveries can be regarded as outliers. Theobserved capacity loss severity is in following order: the AHS45 andNC45 cases as the most severe, the CLS45 cases are next followed by theAHS23 cases, and, finally, the CLS23 cases. The aging results can beinterpreted as: 1) the impact from temperature is larger than the impacton discharge current magnitude; 2) the impact from discharge currentmagnitude is larger at high temperature; 3) the impact from tempera-ture is larger at higher discharge current rate.
When comparing the AHS45 cases and NC45 cases, in Fig. 4 (a), the
test time compression can be observed since in the NC45 cases 10%capacity loss is achieved after only 6 weeks, whereas AHS45 cases needabout 9 weeks. To understand the accelerating factors behind the timecompression effect, both cases are further compared in Fig. 4 (b) whichit shows that for AHS45 and NC45 cases, they actually achieve 10%capacity loss with almost equivalent Ah-throughput despite differentdischarge current rate.
Therefore, the time compression effect in Fig. 4 (a) is mainly at-tributed to more battery usage in terms of Ah-throughput, but not tomore aggressive battery usage in terms of higher current rate. In otherwords, the impact from discharge current rate on battery aging is lim-ited beyond the AHS45 cases in our aging campaign for the NMC li-thium ion chemistry.
3. Single particle electrochemical cell model
In this section, a physics-based electrochemical model is introduced.While physical phenomena inside the cell are intrinsically due to mi-croscale dynamics, reduced-complexity macro-scale models can be usedto capture cell level dynamics. The pseudo-two-dimensional (P2D)model, firstly proposed in [32], uses nonlinear coupled partial differ-ential equations to describe the mass diffusion and the potential dis-tribution inside and between the porous electrodes and the electrolyte.A tradeoff between model fidelity and model complexity is achieved bysimplifying the P2D model through approximation of each porouselectrode as a single spherical particle. This results in either the single-particle (SP) model [33,35] or the enhanced single-particle (ESP) model[36,37]. The difference among these two models is that the latter in-cludes the electrolyte dynamics that are not negligible in high currentscenarios. In contrast, the SP model holds accuracy when used in lowcurrent rate applications (≤1C). With 1C discharge capacity test data,this study pertains to the application of the physics-based SP model toexecute the parameter identification algorithm.
The lithium ion battery can be simplified by representing eachelectrode as a spherical particle, as shown in Fig. 5. The lithium ionsintercalate between two electrodes during discharging and charging.The intercalation resistance at the electrode surface exhibits in the formof overpotential. These phenomena can be described by the SP modelthrough the following equations.
The concentration of lithium ions within the spherical particle ateach electrode follows the Fick’s diffusion law:
⎜ ⎟
∂∂
− ∂∂
⎛⎝
∂∂
⎞⎠
=ct
D 1r r
r cr
0ii
i2
ii2
i (1)
which is subject to boundary conditions:
∂∂
= = ≥D cr
0, at r 0 and for t 0ii
ii (2)
∂∂
= − = ≥D cr
j , at r R and for t 0ii
ii i i (3)
where the subscript =i n is used for negative electrode, =i p is used for
Fig. 1. Aging test profiles designed to represent different driver styles, (a) Calm Low Speed (CLS) profile, (b) Aggressive High Speed (AHS) profile, and (c) NewCondition (NC) profile which is designed to validate the cycle aging performance of NMC lithium-ion cell.
Fig. 2. Experimental test set-up at the BACh Laboratory. The Arbin BT-2000cycler discharges and charges the cell continuously, according to the requestfrom the interface of the MITS Pro data acquisition software. During testing, thePeltier junctions maintain the cell at a constant temperature.
Z. Liu et al. Journal of Energy Storage 21 (2019) 519–527
521

positive electrode; c (r, t)i is the solid-phase concentration (mol/m3); Diis the diffusion coefficient of the electrolyte in the solid particle (m2/s);Ri is the radius of the solid particle (m); ri is the distance from the centerof the particle (m); t is the time instant (s); j (t)i is the lithium ion in-tercalation flux density (A/m2), calculated as:
=j (t) I(t)Ai
i (4)
where I(t) is the applied current (A), positive for discharge, negative forcharge and Ai is the equivalent electro-active surface area (m2).
It is common practice to reduce the Eq. (1) into an ordinary dif-ferential equation by assuming a parabolic electrode lithium ion con-centration profile [45]:
= +c (r ,t) a (t) b (t)rRi i i i
12
i2 (5)
After substituting Eq. (5) into Eq. (1), one obtains:
+ =d(a (t))dt
rR
d(b (t))dt
6 D b (t)R
i i2
i2
i i i
i2 (6)
And after substituting Eq. (5) into Eq. (3), one obtains:
= −2 D b (t)R
j (t)i i
ii (7)
Two quantities are of interests for the present study, i.e., the averageconcentration, c (t)avg,i and the surface lithium ion concentration, c (t)s,i .The c (t)avg,i is calculated as:
∫==
c (t) 3rR
c (r ,t)d(r )avg,i r 0
R i2
i3 i i i
i
i
(8)
which, after substituting Eq.(5) into Eq.(8), becomes:
= +c (t) a (t) 35
b (t)avg,i i i (9)
On the other hand, c (t)s,i is obtained by substituting ri =Ri into Eq.(5):
= +c (t) a (t) b (t)s,i i i (10)
Combining Eqs. (7), (9) and (10),
+ =ddt
c 3j (t)R
0avg,ii
i (11)
− = −DR
(c c )j (t)
5i
is,i avg,i
i
(12)
From c (t)avg,i , one can determine the state-of-charge at the electrodes,SOC (t)i , after normalizing c (t)avg,i with respect to the maximum elec-trode lithium ion concentration (mol/m3), cmax,i:
=SOC (t)c (t)ciavg,i
max,i (13)
The electrode surface overpotentials, ηi (t), which are caused by theresistance of the flow of electrons at the electrode-electrolyte interface,can be calculated as:
Fig. 3. The current and voltage responses for 1C discharge capacity test (top)and HPPC test (below) from fresh new cell#1. The discharge capacity test isdone at 1C (or 2 A), the HPPC test profile consists of 2C (or 4 A) discharge pulseand 1.5C (or 3 A) charge pulse at every 10% SOC increment.
Table 2The aging test matrix with the aging conditions and their corresponding cells.
Aging Conditions Cell No. #
Calm Low Speed 23 °C (CLS23) Cell#1 / Cell#2Calm Low Speed 45 °C (CLS45) Cell#3 / Cell#4Aggressive High Speed 23 °C (AHS23) Cell#5 / Cell#6Aggressive High Speed 45 °C (AHS45) Cell#7 / Cell#8New Condition 45 °C
(NC45)Cell#9 / Cell#10
Z. Liu et al. Journal of Energy Storage 21 (2019) 519–527
522

=η (t) RT0.5F
asinh(j (t)
2d (t))i
i
0,i (14)
where
= ⋅ ⋅ ⋅ ⋅ −d (t) F k c (t) c (t) (c c (t))0,i i e s,i max,i s,i (15)
represents the exchange current density (A/m2); R is the universalgas constant, 8.314 J mol−1 K−1; T is the temperature (K); F is theFaraday constant, 96487 (C/mol); ki is the reaction rate constant (m2.5/mol0.5/ s); c (t)e is the solution phase concentration (mol/m3).
The cell voltage response output, V (t)output , is determined by theopen circuit potentials (OCP), U (t)i at the two electrodes, and theoverpotentials, η (t)i of the two electrodes, and the contact resistancevoltage drop, ⋅R I(t)f . The OCP curves, U (t)i , are shown in Fig. 6 whereSOC (t)i is calculated according to Eq. (13).
= + − − − ⋅V (t) U (t) η (t) U (t) η (t) R I(t)output p p n n f (16)
The SP electrochemical model described above introduces 14parameters which are summarized in Table 3. The initial values are
compiled from previous literature [25,38]. The coupling between ki andce in the form of k ci e in Eq. (9) indicates that only 13 effectiveparameters should be identified. In this study ce is always fixed at1000mol/m3 to enable the effective identification of ki. The inherentdrawback of neglecting solution phase dynamics limits the applicationof single-particle model to the low current rate scenarios (usually lessthan 1C). In our case, the discharge capacity measurements (at 1C) arequalified for the adoption of SP model.
In the following section, the parameters of the SP electrochemicalcell model are fitted at different aging stages. The identification algo-rithm is detailed in the next section. The parameters are identified interms of their stochastic distributions and their correlations with cell-level aging quantities, such as capacity, are investigated.
4. Parameter identification with MCMC algorithm
In this study the MCMC algorithm is used to identify the stochasticdistribution of the parameters of the SP cell model. The MCMC algo-rithm integrates the Bayesian stochastic-based feature, as it treats eachparameter as a probabilistic distribution, with the stochasticity ofMonte Carlo method, which uses sampling methods to approximate theparameter distributions [48]. The MCMC algorithm is applied to fit theparameters of the SP model with the 1C discharge capacity test data atdifferent aging stages. The progression of the most significant aging-related parameters can provide new insights for NMC Li-ion batteryaging. The application of the MCMC algorithm on the SP model forNMC aged cells operating for a 48 V system is proposed for the firsttime.
In the context of full discharge capacity test, in [38] it is indicatedthat SOCn,100, SOCp,100, Ap are the most significant parameters related toaging when the SP model is used; [41] evaluated the drift of the Dn, Dp,kn kp parameters during aging based on the P2D model. SOCn,100,SOCp,100, Dn, kn are assumed to account for the resistive film growth atthe negative electrode; Ap, Dp, kp are mainly considered to account foractive material losses at the positive electrode. Other parameters are
Fig. 4. The capacity loss in the aging campaign; (a) time-based, (b) kAh-throughput-based.
Fig. 5. Schematic of the electrochemical battery model using SP approximation.
Fig. 6. Electrode OCPs for NMC and Graphite [46].
Z. Liu et al. Journal of Energy Storage 21 (2019) 519–527
523
regarded as non-aging-related.The parameter identification process is conducted in two steps.
First, all parameters are identified from capacity test data from a freshbattery using the simplex search method aimed at minimizing thesquare errors between experimental and simulated voltage responses. Inthe second step, the non-aging-related parameters are regarded asconstants, and the identification is run for the subset of parameters thatare affected by aging using the MCMC algorithm. The aging-relatedparameters are identified as distributions.
The Bayesian methodology for parameter identification treatsparameters as stochastic distributions rather than a constant. The es-sence of this approach lies in the Bayes’ relation:
∫= =θ
θ θ θ θθ θ
p( Data)p(Data )p( )
p(Data)p(Data )p( )
p(Data )d (17)
where the vector θ = [Ap, Dn, Dp, kn, kp, SOCn,BOD, SOCp,BOD] containsthe aging-related parameter set in this study. θp( ) is the prior dis-tribution of the parameter set, which quantifies the prior knowledge ofθ ; θp(Data ) is the likelihood distribution, which quantifies the prob-ability of the observed voltage data given the parameter set θ ; p(Data)is the normalizing constant, representing the probability of the ob-served voltage data; θp( Data) is the posterior distribution whichquantifies the conditional probability distribution of the parameter set θgiven the observed voltage data.
While the analytical solution of Eq. (17) is intractable, numericalsampling methodologies are desired for the approximation of prob-abilistic distribution θp( Data). The MCMC algorithm is one of the ef-fective methodologies, and is applied according to following steps [47]:
Step 1: Set the number of sampling iterations N=50,000 in thisstudy.
Step 2: Start with initial values of the aging-related parameter set θ0,which can be determined arbitrarily or from some preliminary resultsbased on efficient optimization routines, such as the simplex searchmethod. The latter is recommended because it can help the MCMC al-gorithm approximate its results more efficiently [47].
Step 3: Initialize aging-related variables for the implementation ofthe MCMC algorithm.
(1) The error variance of the initial fit is defined as:
=−
⋅err 1n p
SEθ2
The n is the length of the time vectors, p is the length of the para-meter set θ, the SEθ is the square error between simulated and experi-mental voltage responses under certain parameter set θ:
∑= −=
V θ VSE [ ( ) ]θj 1
n
model,j exp,j2
The Vmodel,j and Vexp,j are the voltage outputs of the SP model and theexperiment at each time instance j;
(2) Set = ⋅ ⋅D θ I0.01 0 as the constant parameter walking distance for thefollowing steps; θ0 is the vector containing initial values of theaging-related parameter set.
I is the identity matrix of size 7× 7, which is determined by thelength of parameter set θ.
Step 4: Approximate the parameter distributions for N iterationsFor = …i 1, 2, , NGenerate a new candidate set of parameters in a random-walk
manner:
= +−θ θ Dz* i 1
where z is a random variable drawn from a normal distribution withzero mean value and standard deviation 1, Normal(0,1), to facilitate therandom walk of the parameters;
Compute = ∑ −= θV VSE [ ( ) ]θ j 1n
model,j*
exp,j2* ;
Sample a random variable u from a uniform distribution, e.g.∈u Uniform(0 1);
Compute =− −− −
θ θα( , ) min(1, e )[ ]
* i 1θ θ
SE * SE i 1
2err2 ;If < −u θ θα( , )* i 1
Set =θ θi *, =SE SEθ θi *;ElseSet = −θ θi i 1, = −SE SEθ θi i 1;End
EndThe traces of the seven aging-related parameters (Ap, Dn, Dp, kn, kp,
SOCn,100, SOCp,100) over the 50,000 iteration window are displayed inFigs. 7(a)–(g). Generally speaking, it is common to identify a “Burn-in”period and a “Stable” period. The “Burn-in” period is the time windowover which the parameter trace, after starting from an initial value,settles to its steady state. This phase is the transient phase for theidentified parameter. In contrast, the “Stable” period is the timewindow over which the mean value of the parameter trace stays ap-proximately constant. While the SOCn,BOD in Fig. 7(a) and the Ap inFig. 7(b) quickly reach steady states, the kp in Fig. 7(f) is the slowestone, taking nearly 30,000 iterations. The choice made in this work is toseparate the 50,000 iterations into the initial “Burn-in” period, con-sisting of the first 30,000 iterations, and the “Stable” period related tothe last 20,000 iterations. Information from the “burn-in” period shouldbe discarded due to its transient nature, whereas the data in the “stable”period are used to obtain the estimate of the parameter distributions.
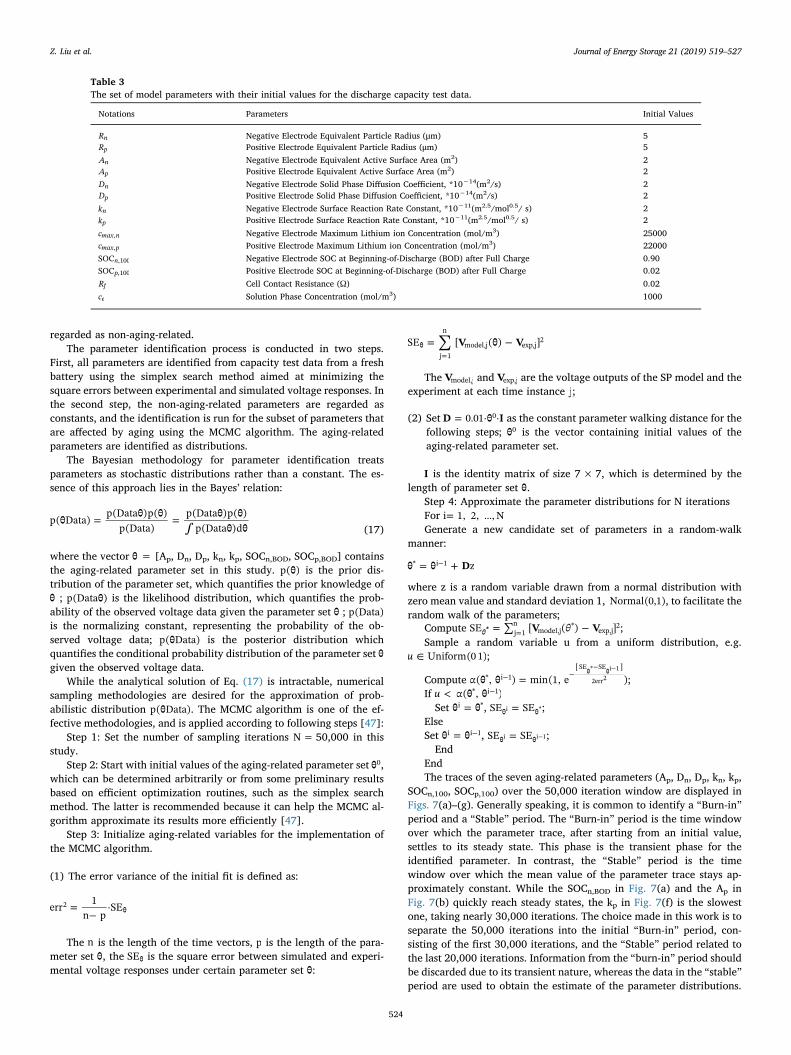
Table 3The set of model parameters with their initial values for the discharge capacity test data.
Notations Parameters Initial Values
Rn Negative Electrode Equivalent Particle Radius (μm) 5Rp Positive Electrode Equivalent Particle Radius (μm) 5An Negative Electrode Equivalent Active Surface Area (m2) 2Ap Positive Electrode Equivalent Active Surface Area (m2) 2Dn Negative Electrode Solid Phase Diffusion Coefficient, *10−14(m2/s) 2Dp Positive Electrode Solid Phase Diffusion Coefficient, *10−14(m2/s) 2kn Negative Electrode Surface Reaction Rate Constant, *10−11(m2.5/mol0.5/ s) 2kp Positive Electrode Surface Reaction Rate Constant, *10−11(m2.5/mol0.5/ s) 2cmax n, Negative Electrode Maximum Lithium ion Concentration (mol/m3) 25000cmax p, Positive Electrode Maximum Lithium ion Concentration (mol/m3) 22000SOCn,100 Negative Electrode SOC at Beginning-of-Discharge (BOD) after Full Charge 0.90SOCp,100 Positive Electrode SOC at Beginning-of-Discharge (BOD) after Full Charge 0.02Rf Cell Contact Resistance (Ω) 0.02ce Solution Phase Concentration (mol/m3) 1000
Z. Liu et al. Journal of Energy Storage 21 (2019) 519–527
524

Figs. 7(h)–(n) show the parameter distributions for the SP model fromthe MCMC algorithm. The distributions of Ap, in Fig. 7(h), and SOCn,100
in Fig. 7(i), vary in much narrower windows than the other parameters,which have rather wide variation windows, indicating high uncertaintyof parameter identification. In other words, among the aging-related
parameters, only Ap and SOCn,100 can be identified with high con-fidence under the scenario of 1C discharge capacity test.
The cell capacity test data at different aging stages were fitted forcell #5 and #7 as examples in Fig. 8. Under both test scenarios with thesame aging profile at two different temperatures (23 °C and 45 °C), the
Fig. 7. The traces of aging-related parameters in the MCMC exploration with 50,000 iterations (a) – (g); the distributions of the aging-related parameters with the last20,000 iterations of the parameter traces (h) – (n), which are all visualized in the [-25%, 25%] normalized deviation window around their mean values forcomparison.
Z. Liu et al. Journal of Energy Storage 21 (2019) 519–527
525
root mean square (RMS) errors between experimental and simulateddata were kept under 0.03 V, indicating satisfactory parameter identi-fication performance. The Ap, which indicates the positive electrodeactive material loss, decreases in all cases. The SOCn,100, which implies
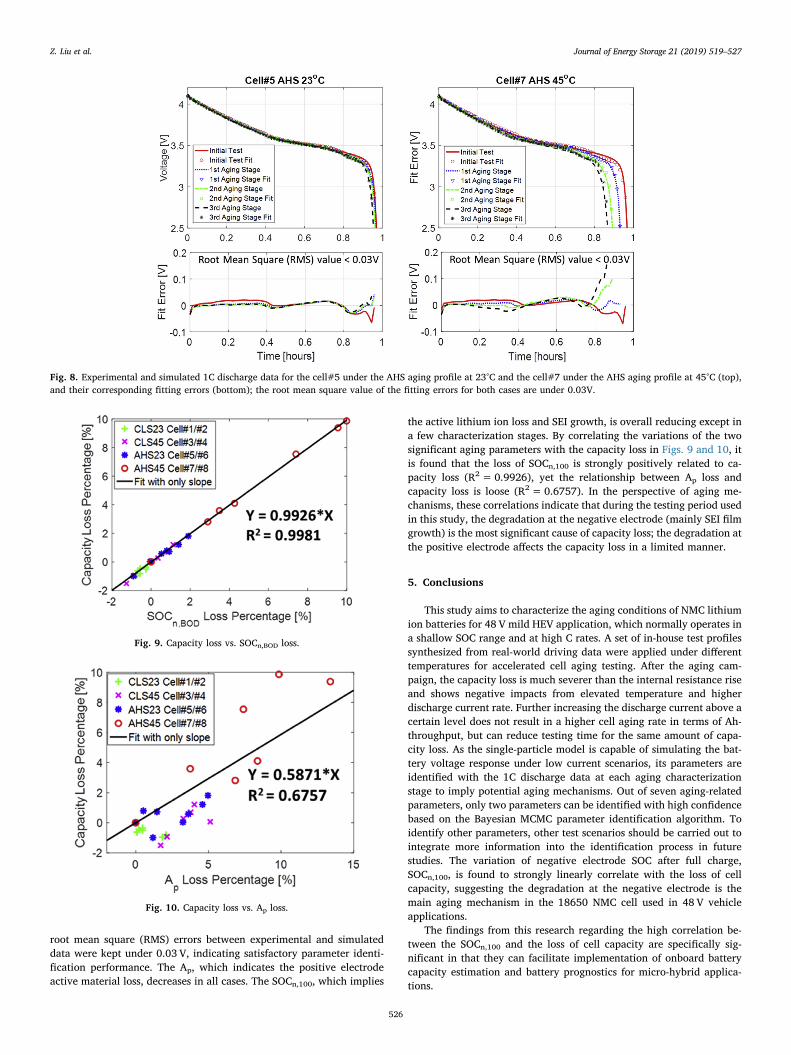
the active lithium ion loss and SEI growth, is overall reducing except ina few characterization stages. By correlating the variations of the twosignificant aging parameters with the capacity loss in Figs. 9 and 10, itis found that the loss of SOCn,100 is strongly positively related to ca-pacity loss (R2= 0.9926), yet the relationship between Ap loss andcapacity loss is loose (R2=0.6757). In the perspective of aging me-chanisms, these correlations indicate that during the testing period usedin this study, the degradation at the negative electrode (mainly SEI filmgrowth) is the most significant cause of capacity loss; the degradation atthe positive electrode affects the capacity loss in a limited manner.
5. Conclusions
This study aims to characterize the aging conditions of NMC lithiumion batteries for 48 V mild HEV application, which normally operates ina shallow SOC range and at high C rates. A set of in-house test profilessynthesized from real-world driving data were applied under differenttemperatures for accelerated cell aging testing. After the aging cam-paign, the capacity loss is much severer than the internal resistance riseand shows negative impacts from elevated temperature and higherdischarge current rate. Further increasing the discharge current above acertain level does not result in a higher cell aging rate in terms of Ah-throughput, but can reduce testing time for the same amount of capa-city loss. As the single-particle model is capable of simulating the bat-tery voltage response under low current scenarios, its parameters areidentified with the 1C discharge data at each aging characterizationstage to imply potential aging mechanisms. Out of seven aging-relatedparameters, only two parameters can be identified with high confidencebased on the Bayesian MCMC parameter identification algorithm. Toidentify other parameters, other test scenarios should be carried out tointegrate more information into the identification process in futurestudies. The variation of negative electrode SOC after full charge,SOCn,100, is found to strongly linearly correlate with the loss of cellcapacity, suggesting the degradation at the negative electrode is themain aging mechanism in the 18650 NMC cell used in 48 V vehicleapplications.
The findings from this research regarding the high correlation be-tween the SOCn,100 and the loss of cell capacity are specifically sig-nificant in that they can facilitate implementation of onboard batterycapacity estimation and battery prognostics for micro-hybrid applica-tions.
Fig. 8. Experimental and simulated 1C discharge data for the cell#5 under the AHS aging profile at 23°C and the cell#7 under the AHS aging profile at 45°C (top),and their corresponding fitting errors (bottom); the root mean square value of the fitting errors for both cases are under 0.03V.
Fig. 9. Capacity loss vs. SOCn,BOD loss.
Fig. 10. Capacity loss vs. Ap loss.
Z. Liu et al. Journal of Energy Storage 21 (2019) 519–527
526
Acknowledgment
The authors would like to acknowledge Johnson Controls PowerSolutions Group for their financial support. In particular, we would liketo thank Mike Andrew for overseeing our collaboration and Dr. Zoe Jinfor sharing her technical knowledge throughout the duration of theproject. The help of Anirudh Allam with the experimental batterytesting is also acknowledged.
References
[1] A. Dinger, R. Martin, X. Mosquet, M. Rabl, D. Rizoulis, M. Russo, G. Sticher,Batteries for Electric Cars: Challenges, Opportunities, and the Outlook to 2020 7The Boston Consulting Group, 2010, p. 2017.
[2] J. Schmalstieg, S. Käbitz, M. Ecker, D.U. Sauer, A holistic aging model for Li(NiMnCo) O 2 based 18650 lithium-ion batteries, J. Power Sources 257 (2014)325–334.
[3] M. Ecker, N. Nieto, S. Käbitz, J. Schmalstieg, H. Blanke, A. Warnecke, D.U. Sauer,Calendar and cycle life study of Li (NiMnCo) O 2-based 18650 lithium-ion batteries,J. Power Sources 248 (2014) 839–851.
[4] S.F. Schuster, T. Bach, E. Fleder, J. Müller, M. Brand, G. Sextl, A. Jossen, Nonlinearaging characteristics of lithium-ion cells under different operational conditions, J.Energy Storage 1 (2015) 44–53.
[5] A. Barré, B. Deguilhem, S. Grolleau, M. Gérard, F. Suard, D. Riu, A review on li-thium-ion battery ageing mechanisms and estimations for automotive applications,J. Power Sources 241 (2013) 680–689.
[6] M. Ecker, J.B. Gerschler, J. Vogel, S. Käbitz, F. Hust, P. Dechent, D.U. Sauer,Development of a lifetime prediction model for lithium-ion batteries based on ex-tended accelerated aging test data, J. Power Sources 215 (2012) 248–257.
[7] S. Käbitz, J.B. Gerschler, M. Ecker, Y. Yurdagel, B. Emmermacher, D. André,D.U. Sauer, Cycle and calendar life study of a graphite| LiNi 1/3 Mn 1/3 Co 1/3 O 2Li-ion high energy system. Part A: full cell characterization, J. Power Sources 239(2013) 572–583.
[8] W. Waag, S. Käbitz, D.U. Sauer, Experimental investigation of the lithium-ionbattery impedance characteristic at various conditions and aging states and its in-fluence on the application, Appl. Energy 102 (2013) 885–897.
[9] K. Amine, J. Liu, S. Kang, I. Belharouak, Y. Hyung, D. Vissers, G. Henriksen,Improved lithium manganese oxide spinel/graphite Li-ion cells for high-powerapplications, J. Power Sources 129 (1) (2004) 14–19.
[10] M.M. Joglekar, N. Ramakrishnan, Cyclic capacity fade plots for aging studies of Li-ion cells, J. Power Sources 230 (2013) 143–147.
[11] A. Cordoba-Arenas, S. Onori, Y. Guezennec, G. Rizzoni, Capacity and power fadecycle-life model for plug-in hybrid electric vehicle lithium-ion battery cells con-taining blended spinel and layered-oxide positive electrodes, J. Power Sources 278(2015) 473–483.
[12] M. Dubarry, C. Truchot, M. Cugnet, B.Y. Liaw, K. Gering, S. Sazhin,C. Michelbacher, Evaluation of commercial lithium-ion cells based on compositepositive electrode for plug-in hybrid electric vehicle applications. Part I: initialcharacterizations, J. Power Sources 196 (23) (2011) 10328–10335.
[13] M. Dubarry, C. Truchot, B.Y. Liaw, K. Gering, S. Sazhin, D. Jamison,C. Michelbacher, Evaluation of commercial lithium-ion cells based on compositepositive electrode for plug-in hybrid electric vehicle applications. Part II.Degradation mechanism under 2C cycle aging, J. Power Sources 196 (23) (2011)10336–10343.
[14] B. Stiaszny, J.C. Ziegler, E.E. Krauß, J.P. Schmidt, E. Ivers-Tiffée, Electrochemicalcharacterization and post-mortem analysis of aged LiMn 2 O 4–Li (Ni 0.5 Mn 0.3 Co0.2) O 2/graphite lithium ion batteries. Part I: cycle aging, J. Power Sources 251(2014) 0439–0450.
[15] Y. Zhang, C.Y. Wang, X. Tang, Cycling degradation of an automotive LiFePO 4 li-thium-ion battery, J. Power Sources 196 (3) (2011) 1513–1520.
[16] J. Wang, P. Liu, J. Hicks-Garner, E. Sherman, S. Soukiazian, M. Verbrugge,P. Finamore, Cycle-life model for graphite-LiFePO 4 cells, J. Power Sources 196 (8)(2011) 3942–3948.
[17] S. Onori, P. Spagnol, V. Marano, Y. Guezennec, G. Rizzoni, A new life estimationmethod for lithium-ion batteries in plug-in hybrid electric vehicles applications, Int.J. Power Electron. 4 (3) (2012) 302–319.
[18] D.I. Stroe, M. Świerczyński, A.I. Stan, R. Teodorescu, S.J. Andreasen, Acceleratedlifetime testing methodology for lifetime estimation of lithium-ion batteries used inaugmented wind power plants, IEEE Trans. Ind. Appl. 50 (6) (2014) 4006–4017.
[19] R.G. Jungst, G. Nagasubramanian, H.L. Case, B.Y. Liaw, A. Urbina, T.L. Paez,D.H. Doughty, Accelerated calendar and pulse life analysis of lithium-ion cells, J.Power Sources 119 (2003) 870–873.
[20] E.V. Thomas, H.L. Case, D.H. Doughty, R.G. Jungst, G. Nagasubramanian, E.P. Roth,Accelerated power degradation of Li-ion cells, J. Power Sources 124 (1) (2003)254–260.
[21] M. Broussely, P. Biensan, F. Bonhomme, P. Blanchard, S. Herreyre, K. Nechev,R.J. Staniewicz, Main aging mechanisms in Li ion batteries, J. Power Sources 146(1) (2005) 90–96.
[22] B. Stiaszny, J.C. Ziegler, E.E. Krauß, J.P. Schmidt, E. Ivers-Tiffée, Electrochemicalcharacterization and post-mortem analysis of aged LiMn 2 O 4–Li (Ni 0.5 Mn 0.3 Co0.2) O 2/graphite lithium ion batteries. Part I: cycle aging, J. Power Sources 251(2014) 439–450.
[23] R.G. Jungst, G. Nagasubramanian, H.L. Case, B.Y. Liaw, A. Urbina, T.L. Paez,D.H. Doughty, Accelerated calendar and pulse life analysis of lithium-ion cells, J.Power Sources 119 (2003) 0870–0873.
[24] J.D. Kozlowski, Electrochemical cell prognostics using online impedance mea-surements and model-based data fusion techniques, Aerospace Conference, 2003.Proceedings 7 (2003) 3257–3270 (2003, March) IEEE, IEEE.
[25] M. Safari, M. Morcrette, A. Teyssot, C. Delacourt, Life prediction methods for li-thium-ion batteries derived from a fatigue approach ii. Capacity-loss prediction ofbatteries subjected to complex current profiles, J. Electrochem. Soc. 157 (7) (2010)A892–A898.
[26] J. Wang, P. Liu, J. Hicks-Garner, E. Sherman, S. Soukiazian, M. Verbrugge,P. Finamore, Cycle-life model for graphite-LiFePO 4 cells, J. Power Sources 196 (8)(2011) 03942–03948.
[27] L. Serrao, S. Onori, G. Rizzoni, Y. Guezennec, “A novel model-based algorithm forbattery prognosis,”, Proceeding of the 7th IFAC Symposium on Fault Detection,Supervision and Safety of Technical Processes, (2009).
[28] X. Hu, S. Li, H. Peng, A comparative study of equivalent circuit models for Li-ionbatteries, J. Power Sources 198 (2012) 359–367.
[29] G.K. Prasad, C.D. Rahn, Development of a first principles equivalent circuit modelfor a lithium ion battery, October), ASME 2012 5th Annual Dynamic Systems andControl Conference Joint With the JSME 2012 11th Motion and VibrationConference (2012) 369–375.
[30] B. Saha, S. Poll, K. Goebel, J. Christophersen, An Integrated Approach to BatteryHealth Monitoring Using Bayesian Regression and State Estimation. In 2007 IEEEAutotestcon (September) IEEE, (2007), pp. 646–653.
[31] U. Tr ltzsch, O. Kanoun, H.R. Tränkler, Characterizing aging effects of lithium ionbatteries by impedance spectroscopy, Electrochim. Acta 51 (8) (2006) 1664–1672.
[32] M. Doyle, T.F. Fuller, J. Newman, J. Electrochem. Soc. 140 (1526) (1993).[33] G. Ning, B.N. Popov, Cycle life modeling of lithium-ion batteries, J. Electrochem.
Soc. 151 (10) (2004) A1584–A1591.[34] S. Santhanagopalan, Q. Guo, P. Ramadass, R.E. White, Review of models for pre-
dicting the cycling performance of lithium ion batteries, J. Power Sources 156 (2)(2006) 620–628.
[35] Q. Zhang, R.E. White, Capacity fade analysis of a lithium ion cell, J. Power Sources179 (2) (2008) 793–798.
[36] J. Marcicki, F. Todeschini, S. Onori, M. Canova, Nonlinear parameter estimation forcapacity fade in lithium-ion cells based on a reduced-order electrochemical model,2012 American Control Conference (ACC), (2012), pp. 572–577 June IEEE.
[37] A.P. Schmidt, M. Bitzer, Á.W. Imre, L. Guzzella, Experiment-driven electrochemicalmodeling and systematic parameterization for a lithium-ion battery cell, J. PowerSources 195 (15) (2010) 5071–5080.
[38] M. Safari, M. Morcrette, A. Teyssot, C. Delacourt, Multimodal physics-based agingmodel for life prediction of Li-ion batteries, J. Electrochem. Soc. 156 (3) (2009)A145–A153.
[39] X. Lin, J. Park, L. Liu, Y. Lee, A.M. Sastry, W. Lu, A comprehensive capacity fademodel and analysis for Li-ion batteries, J. Electrochem. Soc. 160 (10) (2013)A1701–A1710.
[40] J.C. Forman, S.J. Moura, J.L. Stein, H.K. Fathy, Genetic parameter identification ofthe doyle-fuller-newman model from experimental cycling of a lifepo 4 battery,American Control Conference (ACC), (2011), pp. 362–369 (2011, June)IEEE.
[41] V. Ramadesigan, K. Chen, N.A. Burns, V. Boovaragavan, R.D. Braatz,V.R. Subramanian, Parameter estimation and capacity fade analysis of lithium-ionbatteries using reformulated models, J. Electrochem. Soc. 158 (9) (2011)A1048–A1054.
[42] R. Ahmed, J. Gazzarri, S. Onori, S. Habibi, R. Jackey, K. Rzemien, J. Tjong,J. LeSage, Model-based parameter identification of healthy and aged li-ion batteriesfor electric vehicles, SAE Int. J. Altern. Power 4 (2) (2015), https://doi.org/10.4271/2015-01-0252.
[43] P. Ramadass, B. Haran, P.M. Gomadam, R. White, B.N. Popov, Development of firstprinciples capacity fade model for Li-ion cells, J. Electrochem. Soc. 151 (2) (2004)A196–A203.
[44] Z. Liu, A. Ivanco, Z.S. Filipi, Impacts of real-world driving and driver aggressivenesson fuel consumption of 48V mild hybrid vehicle, Sae Int. J. Altern. Powertrains 5(2016) 2016-01-1166.
[45] Z. Liu, S. Onori, A. Ivanco, Synthesis and experimental validation of battery agingtest profiles based on real-world duty cycles for 48V mild hybrid vehicles, IEEETrans. Veh. Technol. (2017).
[46] V.R. Subramanian, V.D. Diwakar, D. Tapriyal, Efficient macro-micro scale coupledmodeling of batteries, J. Electrochem. Soc. 152 (10) (2005) A2002–A2008.
[47] S.B. Chikkannanavar, D.M. Bernardi, L. Liu, A review of blended cathode materialsfor use in Li-ion batteries, J. Power Sources 248 (2014) 91–100.
[48] A. Solonen, Monte Carlo Methods in Parameter Estimation of Nonlinear Models,Master Thesis, Lappeenranta University of Technology, 2006.
[49] National Renewable Energy Laboratory, Transportation Secure Data Center, 2014,www.nrel.gov/tsdc.
[50] USABC electric vehicle Battery Test Procedures Manual. http://www.uscar.org/guest/article_view.php?articles_id=74.
Z. Liu et al. Journal of Energy Storage 21 (2019) 519–527
527