journal of economic geography - rutgers university
TRANSCRIPT

1
Police Shootings, Civic Unrest, and Student Achievement: Evidence from Ferguson
Seth Gershenson, American University and IZA1
Michael S. Hayes, Rutgers University-Camden2
This article is forthcoming in Journal of Economic Geography. The appropriate citation is:
Gershenson, Seth, & Hayes, Michael S. 2017. Police Shootings, Civil Unrest, and Student
Achievement: Evidence from Ferguson. Forthcoming, Journal of Economic Geography.
Abstract
We document externalities of the police shooting of an unarmed black teenager and the resultant
civic unrest experienced in Ferguson, MO. Difference-in-differences estimates compare
Ferguson-area schools to neighboring schools in the greater St. Louis area and find that the
unrest led to statistically significant, arguably causal declines in elementary school students’
math and reading achievement. Attendance is one mechanism through which this effect operated,
as chronic absence increased by five percent in Ferguson-area schools. Impacts were
concentrated in the bottom of the achievement distribution and spilled over into majority black
schools throughout the greater St. Louis area.
JEL Codes: I2; R00
Keywords: Civic Unrest; Ferguson; Human Capital; Natural Experiment; Externalities
1 Corresponding author. Email: [email protected]. American University, School of Public
Affairs, 4400 Massachusetts Avenue NW. Washington DC, 20016-8070. The authors thank
David Deming, Dave Marcotte, Nicholas Papageorge, and seminar participants at the College
Board and the 2016 SOLE Meetings for providing helpful comments. Elizabeth Pancotti
provided helpful research assistance. This manuscript was previously circulated as IZA
Discussion Paper No. 10091, entitled “Short-Run Externalities of Civic Unrest: Evidence from
Ferguson, Missouri.” Any remaining errors are our own.
2 Email: [email protected].

2
1. Introduction
The August 2014 police shooting of Michael Brown, an unarmed black teenager, in
Ferguson, MO prompted local protests against real and perceived racial inequities in police
departments’ treatment of citizens and communities in the Ferguson area northwest of St. Louis.
These protests quickly attracted activists and media coverage from across the country. Similar
protests, and accompanying civic unrest, spread to several major American cities during the
latter half of 2014, both in response to the events in Ferguson and to similar incidents in which
unarmed black males were killed by police. Notable examples include the killings of 43 year old
Eric Garner in New York and 12 year old Tamir Rice in Cleveland. Unrest in Ferguson and in
other parts of the country continued into 2015, when the officers involved in previous incidents
were neither indicted nor formally charged. New, external events generated renewed unrest in
Ferguson, such as the death of Freddie Gray while in police custody in Baltimore in April 2015.
Ensuing protests, demonstrations, civic unrest, riots, and growth of socio-political
movements (e.g., Black Lives Matter) renewed public discussion of racial differences in citizens’
exposure to, and interactions with, law enforcement and the criminal justice system.3 Of course,
whether these events and movements create long-run, permanent changes in policing practices,
racial segregation, and living conditions in inner city, historically disadvantaged communities
remains to be seen.
In the short run, however, episodes of civic unrest associated with protests potentially
impose both direct and indirect costs on society. These knock-on costs are in addition to the
direct effects (e.g., trauma and stress) of the shooting itself, though it is difficult, if not
impossible, to disentangle the effects of each shock. This is not to say that demonstrations and
protests associated with social movements are “bad” in the sense that they necessarily reduce
social welfare. Indeed, they may be catalysts for change that alleviate social injustices, establish
human rights, and create social benefits that far outweigh any associated costs. Rather,
understanding the size, distribution, and burdens of these costs is crucial for policy makers and
community leaders seeking to minimize short-run harm. For example, direct costs of the riots in
Ferguson include upwards of $4 million in property damage (Unglesbee, 2014) and as much as
3 See, for example, Mullainathan’s (2015) piece in the New York Times. More recently, three
police shootings of black men in Baton Rouge, LA, Dallas, TX, and St. Paul, MN in July 2016
have touched off another round of discussion and protests regarding black communities’
relationships with law enforcement agencies and the criminal justice system.

3
$20 million in spending by local and state governments, mainly for overtime for first responders
(Davis, 2014). Wenger (2015 a, b) reports similar direct costs of the 2015 Baltimore riots.
There are other potential short run costs that policy makers and institutions can
potentially mitigate. However, such costs have received relatively little attention thus far,
perhaps because they are inherently difficult to quantify. Doing so is important, as identifying the
nature and magnitude of negative externalities is paramount to devising effective and efficient
policy responses. The current study investigates one potential class of such indirect costs: the
causal effect of a police shooting and the subsequent prolonged, acute civic unrest associated
with the incident on schools and student achievement.
Identifying the impact of highly publicized, racially charged citizen-police interactions,
and the ensuing civic unrest, on student outcomes is important for at least three reasons. First,
there is likely room for schools and communities to intervene and mitigate the associated harms.
Second, educational success is likely to play a key role in breaking cycles of poverty and
violence in disadvantaged neighborhoods, given the well documented association between
educational attainment and earnings (Blundell, Dearden, and Sianesi, 2005; Card, 1999), civic
engagement (Dee, 2004; Milligan, Moretti, and Oreopoulos, 2004), and crime (Deming, 2011;
Lochner and Moretti, 2004; Machin, Marie, and Vujic, 2011). Finally, in an era of consequential
accountability in which schools are sanctioned for low aggregate performance on standardized
tests (e.g., Figlio & Loeb, 2011), sanctions that result from shootings, civic unrest, and other
community-wide shocks outside schools’ control present additional hurdles that schools serving
disadvantaged communities must overcome.
The police shooting of Michael Brown in Ferguson, MO provides an ideal natural
experiment with which to analyze the impact of intense, prolonged civic unrest and attention to
racial disparities in interactions with the criminal justice system following a racially-charged
incident on student achievement: the shooting occurred on the eve of the 2014-15 school year
and intermittent protests occurred throughout the subsequent 9 months (i.e., the entirety of the
2014-15 school year). While Ferguson schools were already relatively low performing and
serving disproportionately large numbers of high-needs students compared to other schools in the
St. Louis area, it is possible that the added stress and distractions associated with the shooting
and subsequent protests, riots, violence, out of town visitors, and media attention further harmed
student achievement, through some combination of causing student and teacher absences,

4
shifting classroom time from curricular instruction to discussion of current events, changing
home and parental behaviors, causing mental stress and concern for the safety of students’
neighborhoods and family members, and by disrupting learning environments.
To account for preexisting differences between schools in the Ferguson area and schools
in other parts of the state, we attempt to identify the impact of the events in Ferguson using
difference-in-differences (DD) methods that explicitly control for preexisting differences (and
differential trends) between schools.4 We do so using school-level data on annual academic
achievement and student attendance, both overall and for the subset of high-needs students, from
2010 to 2015.5
This paper contributes to a growing body of literature that investigates the effects of
exposure to stressors such as acute violence, natural disasters, and community-wide violence
(i.e., civil wars) on student achievement. Particularly relevant to the context of urban centers in
the U.S., a series of papers by Patrick Sharkey and coauthors (Sharkey, 2010; Sharkey et al.,
2012; Sharkey et al., 2014) estimate the effect of students’ geographical proximity to homicides
on various cognitive measures and standardized tests in inner city neighborhoods in Chicago and
New York by exploiting arguably random temporal variation in homicides within
neighborhoods. Beland and Kim (2016) estimate the impact of school shootings (i.e., homicides
that occurred on school grounds) using a similar identification strategy. While these studies
consistently find evidence of a short-run effect of exposure to one-off incidents of acute violence
on student achievement, their implications for the harm attributable to unexpected, longer lasting
neighborhood- or city-level disruptions is unclear. One of the few studies to investigate the
impact of sustained exposure to a communitywide traumatic event in the U.S. context is
Gershenson and Tekin (2015). The authors find that exposure to the “Beltway Sniper” attacks,
which occurred during a three week period in October 2002, reduced primary school students’
math achievement. They use a DD strategy that compares schools in the I-95 corridor that were
within five miles of a sniper attack to those that were not, which is similar to the DD strategy
applied in the current study.
4 District-level synthetic control method (SCM) analyses (Abadie & Gardeazabal, 2003) yield
qualitatively similar results. 5 We henceforth refer to academic years by spring semester.
5
While Gershenson and Tekin (2015) provide evidence that less acute, longer term
exposure to external stressors can harm student achievement, the stress and disruption
attributable to the police shooting and resultant civic unrest in Ferguson was fundamentally
different in at least two ways. First, it was sustained, with intermittent outbreaks of extreme
disruption, over an entire academic year. Second, the source of the stress was not a random
targeting, but rather a specific incident that caused long simmering racial and socioeconomic
tensions in the community to erupt. Thus, the current study contributes to this literature by
documenting the short-run impact of a police shooting and the subsequent, sustained civic unrest
in a relatively segregated, disadvantaged community on students’ educational outcomes.
Additionally, we investigate some potential mechanisms through which such effects operate.
The paper proceeds as follows: Section 2 reviews the timeline of events in Ferguson, MO
that precipitated and sustained the civic unrest throughout the 2015 academic year and describes
the geography and district catchment areas used to define the treatment. Section 3 describes the
data. Section 4 describes the identification strategy. The school-level DD results are presented in
Section 5. Section 6 concludes.
2. Background
2.1 Ferguson Timeline
The civic unrest in Ferguson, MO began shortly after Michael Brown, an 18 year old
black male, was shot and killed by a white police officer on August 9, 2014.6 Brown was
unarmed and some witnesses claimed that he was surrendering at the time he was shot. Shortly
thereafter, crowds gathered at the scene, and later that evening some rioting and looting occurred
on nearby West Florissant Avenue. For the next ten days or so, the Ferguson area witnessed
several tense standoffs and encounters between protestors and police. There was a heavy media
presence as well. A strong police response, which included militaristic vehicles and arms, may
have escalated the tension. Tensions eased as Brown’s funeral was held on August 25, though a
series of sporadic protests, arrests, and announcements from the authorities occurred throughout
September and October.
6 Detailed timelines are available from numerous media outlets, including The Telegraph and
The New York Times (part 1, part 2).

6
A second round of intense violence, riots, and standoffs between protestors and police
occurred in the second half of November 2014, this time due to a grand jury’s failure to indict
the police officer involved in the shooting of Michael Brown. This series of protests and rioting
lasted for about one week. Protests spread to other cities across the country in response to the
grand jury’s decision. Smaller outbreaks of violence in Ferguson occurred in March and April of
2015, in response to the Ferguson police chief’s resignation and the death of Freddie Gray in
police custody in Baltimore, respectively.
The cycle of civic unrest came full circle when additional looting and shootings occurred
in concert with demonstrations and protests commemorating the one year anniversary of
Brown’s death in August 2015. Thus, from the time of the shooting two weeks before school was
scheduled to start, throughout the entire 2014-15 academic year and into the subsequent summer
vacation, residents of Ferguson experienced a persistent, elevated state of civic unrest,
disruption, stress, and violence. This is in addition to the initial trauma caused by the shooting of
an unarmed black graduate of an area high school. Viewed through the lens of a natural
experiment, the disruptions experienced in Ferguson throughout the 2014-15 academic year
provide leverage with which to identify their impacts on short-run student outcomes.
2.2 Ferguson Geography
The St. Louis Metropolitan Statistical Area (MSA) straddles the Mississippi River and
includes counties in both Missouri and Illinois.7 According to the 2010 U.S. Census, the MSA
was home to about 2.8 million individuals and was about 77% white, 18% black, 2.5% Hispanic,
and 2.1% Asian. St. Louis County, in which Ferguson is located, is the most populous county in
the MSA. We restrict our analysis to the St. Louis MSA because its labor market and
demographics are quite different from those in other parts of Missouri. We further restrict our
analytic sample to schools and districts on the Missouri side of the MSA, because the Missouri
and Illinois tests are not directly comparable.
Defining the “treated group” is not straightforward for several reasons. First, media
reports and discussion of the unrest frequently refer to the city of Ferguson, which is technically
7 The six St. Louis MSA counties in Missouri are Lincoln, Warren, St. Charles, Franklin,
Jefferson, and St. Louis County (which contains Ferguson). St. Louis is an independent city in
Missouri in the MSA. Appendix Figure A.1 shows a map of the entire MSA.

7
accurate as this is the jurisdiction in which the shooting of Michael Brown and much of the
looting and protests occurred. However, Ferguson-Florissant School District is not synonymous
with Ferguson City. In fact, Ferguson City proper contains several smaller school districts,
notably Riverview Gardens District, whose catchment area includes the specific sites of Brown’s
shooting and the initial protests on West Florissant Ave. Moreover, Brown himself actually
completed high school in the Normandy District, which is adjacent to the South of both the
Ferguson and Riverview Gardens districts. A fourth independent school district, Jennings, is
surrounded by these three districts, and by St. Louis City District to the East. Thus, as the map in
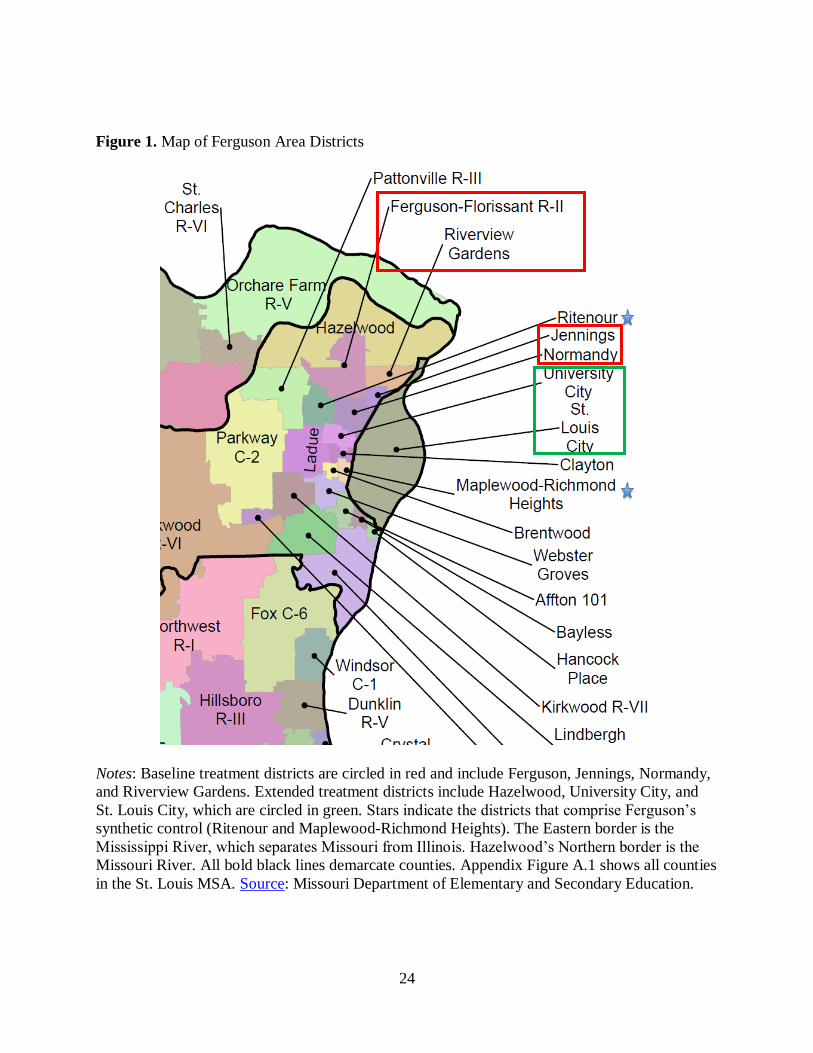
Figure 1 makes clear, it is potentially misleading to consider Ferguson as the sole “treated”
district. In the baseline school-level DD models, we therefore consider schools in the
geographically contiguous block of four districts (Ferguson, Jennings, Normandy, and Riverview
Gardens) as treated. We also estimate models that allow the treatment effect to vary across these
four districts and investigate the sensitivity of the main results to using a broader definition of
treatment that adds three additional geographically contiguous districts to the treatment group:
St. Louis City, University City, and Hazelwood. The main results are robust to these, and to
alternative configurations, of the treatment group, as well as to including all MO schools in the
control group. We also use a triple-difference specification to test whether majority-black
schools in the MSA, but outside the immediate vicinity of Ferguson, were affected by the racial
tensions exacerbated by fear of police interactions, discussions, and protests associated with the
shooting of Michael Brown.
3. Data
We analyze school-level data from 2010-2015 made available by Missouri’s Department
of Elementary and Secondary Education via their Comprehensive Data System.8 Achievement
data comes from school-level aggregate performance on Missouri Assessment Program (MAP)
standardized tests that are administered in grades 3-8 and in certain high school subjects between
March and May of each academic year. Exact testing dates vary by district and by grade level.
For example, in Ferguson in 2015, the grade-3 tests were administered in the first two weeks of
April and the grade-5 tests were administered in the second two weeks of April.
8 See http://mcds.dese.mo.gov/Pages/default.aspx.

8
The state codes student performance on these exams into four mutually exclusive
performance categories: advanced, proficient, basic, and below basic. The percent of all schools’
and districts’ students that fit in each category are publicly released. The empirical analysis
focuses on the top and bottom categories, as we find that changes in advanced are approximately
offset by changes in proficient, and changes in below basic are approximately offset by changes
in basic.9
In addition to aggregate performance measures, in accordance with the No Child Left
Behind Act (NCLB), the state also reports aggregate performance measures separately by student
subgroups. Specifically, the state reports results for what it calls “Super Subgroup” students, who
are high-needs students who are in at least one of the following specific subgroups: black,
Hispanic, students with disabilities, English language learners, or low income students.10
Because many students in the Ferguson area qualify for Super-Subgroup status, we report results
both overall and for the Super Subgroup, as the latter ensures that the DD analyses compare the
performance of high-needs students in treated and control schools.11
Missouri’s Comprehensive Data System also provides a wealth of information about
schools in the state, which we summarize along with the academic performance data in Table
1.12 We report means separately by treatment status for schools in the St. Louis MSA, which
highlights baseline differences between Ferguson-area schools and other schools in the MSA.13
There are 53 schools in the four treated districts and 439 schools elsewhere in the MSA. Several
stark differences emerge. First, in both reading and math, Ferguson-area schools perform
significantly worse than control schools: on average, students in Ferguson-area schools are about
twice as likely to score “Below Basic” and less than half as likely to score “Advanced” as
students in other districts in the MSA.
9 Specifically, see Appendix Table A.1, which reports the estimated impact on the percent of
students scoring in each of the four mutually exclusive achievement categories. In any given
column (specification), the four point estimates sum to approximately zero, as these categories
are both mutually exclusive and inclusive of all students. 10 Low-income is measured by students’ eligibility for free/reduced price school lunches (FRL). 11 We focus on the Super-Subgroup designation rather than race-specific results because there is
insufficient within-school variation in race with which to make valid comparisons between
treatment and control schools. 12 Appendix Table A.2 similarly summarizes the subset of elementary schools. 13 As described in section two, the baseline “treatment” group includes schools in four districts:
Ferguson, Jennings, Normandy, and Riverview Gardens.

9
Second, there is also an attendance differential between treated and control schools, for
both male and female students, that is less pronounced among low-income (FRL) students.14 The
attendance rates reported in Missouri refer to the percentage of a school’s students who were
absent fewer than 10 percent of school days. Being absent more than 10 percent of school days is
a common definition of chronic absence (Balfanz & Byrnes, 2012), so the reported attendance
rates are best interpreted as the percentage of students who are not chronically absent. These are
informative measures of school attendance, which is an important input in the education
production function: chronically absent students score about 0.12 test-score standard deviations
lower than students who are rarely absent (Gershenson et al., 2017). Attendance is an
intermediate educational outcome that may have been affected by the civic unrest in Ferguson,
and therefore a possible channel through which the unrest in Ferguson harmed academic
achievement.
Finally, Table 1 summarizes numerous school characteristics. Teachers and
administrators have higher salaries in treated schools, on average, than their counterparts in
control schools. Ferguson-area teachers are also slightly more experienced than their
counterparts elsewhere in the MSA. However, student-teacher ratios are larger in treated
districts. Finally, the socio-demographic composition of the enrollments in Ferguson-area
schools is quite different from the rest of the MSA: these schools are 90 percent black and 82
percent FRL, on average, while control schools are only 27 percent black and 45 percent FRL.
This concentration of low income, racial minority students has been a focus of many discussions
of the events that precipitated the civic unrest in Ferguson (e.g., Goodman, 2014 a; Kneebone,
2014). These differences underscore the importance of accounting for pre-existing differences
between treated and control schools in the econometric analysis and the value of the Super-
Subgroup performance measures, which facilitate comparisons of high-needs students in and
outside Ferguson.
Figures 2 and 3 motivate the empirical analysis by providing suggestive evidence of a
departure from trend in Ferguson-area schools in 2015 that is unlikely to be due to chance.
Figure 2 plots the average school’s deviance from the MSA-wide school average in percent
below basic in math in each year, separately for control and treated schools. We report these
figures relative to the MSA-wide, year-specific mean to account for MSA-wide changes to the
14 Unfortunately, attendance is not reported at the Super-Subgroup level.

10
tests and make the results comparable over time. Two aspects of Figure 2 are worth noting. First,
trends in overall and Super-Subgroup math achievement in both treated and control schools are
similar in the pre-treatment period (2010-2014). This suggests that any effects of the events in
Ferguson are not driven by pre-existing differential trends between treated and control groups,
though we formally test this assumption below. Second, the trend line for control schools
continues to be flat in 2015, the treatment year, while there is a notable uptick in the frequency of
below-basic scores in treated schools in 2015, both overall and among Super-Subgroup students.
Indeed, Figure 2 shows that what was approximately a ten percentage point gap between treated
and control schools in percent below basic in math roughly doubled to a 20 percentage point gap
in 2015, both overall and among high-needs students.15 Appendix Figure A.2 shows a similar
pattern in the doubling of the treatment-control gap in the percent of students scoring below
basic in reading. Accordingly, for brevity, the main analyses focus on math achievement.
Figure 3 addresses the stylized fact that test scores are noisy and prone to mean reversion
by plotting the full distribution of within-school, year-to-year changes in percent below basic in
math for the 2012-2013, 2013-2014, and 2014-2015 transitions. Treated Ferguson-area schools
are shaded black and control schools are shaded gray. Panel A shows a preponderance of black
15 It is also possible to use the Synthetic Control Method (SCM) (Abadie, Diamond, &
Hainmueller, 2010; Abadie & Gardeazabal, 2003) to identify a “synthetic” Ferguson school
district to serve as the control group. As a robustness check, we implement a SCM using
Ferguson as the sole treated district. We exclude the other six Ferguson-area districts that
comprise the “broad treatment” from the donor pool, which consists of all other districts in the
St. Louis MSA. The SCM identifies a “synthetic Ferguson” that is a weighted average of two
districts: Ritenour and Maplewood-Richmond Heights. Both are nearby Ferguson and visible in
the map in Figure 1. The SCM results are plotted in Appendix Figure A.3. The top panel plots
the percent below basic in math in the real and synthetic Ferguson districts, relative to the
statewide mean, from 2010 to 2015. From 2010 to 2014, Ferguson and its synthetic control
follow the same pattern and are nearly overlapping. This is consistent with the raw data plotted
in Figure 2 and indicates that the SCM matching algorithm identified a valid synthetic control. In
2015, there is an increase in the percentage of students scoring below basic in math in both the
actual and synthetic Ferguson districts. However, the increase in the real Ferguson is noticeably
steeper than that in the synthetic control. This difference indicates an impact of more than ten
percentage points, which is similar in size to the impacts identified in the school-level DD
analyses. The smaller uptick in the synthetic Ferguson is consistent with spillover effects of the
acute unrest in the Ferguson area on neighboring, majority-black districts. The bottom panel
plots the annual difference between Ferguson and its synthetic control in each year. Prior to
treatment, this difference fluctuates around zero. The departure from this trend in 2015 can be
interpreted as the impact of the unrest on math achievement in the district.

11
in the distribution’s right tail, indicating that most Ferguson-area schools exhibited relatively
large increases in percent below basic. Specifically, more than half of the top 5 percent declines
and 60 percent of the top 1 percent declines occurred in the Ferguson area, despite Ferguson
schools representing only about 11 percent of all schools. This is in stark contrast to panels B and
C of Figure 3, which present analogous figures for the two transitions prior to the unrest in
Ferguson. Here, Ferguson-area schools constitute only 20 percent of the top 1 percent declines
and only 26 to 33 percent of top 5 percent declines. As in Figure 2, Figure 3 suggests that while
Ferguson-area schools were underperforming relative to other schools in the St. Louis MSA,
they experienced a pronounced departure from trend in 2015, the year following the shooting.
4. Identification Strategy
As suggested by Figures 2 and 3, Ferguson-area (treated) schools are systematically
different from other schools in the MSA and there may have been secular statewide changes in
student performance over the period 2010-2015. We address these confounding factors by using
school-level data to estimate a variety of difference-in-differences (DD) style regressions that
control for school fixed effects (FE), year FE, time-varying observed school characteristics, and
school-specific time trends. The preferred baseline model conditions on time-varying school
characteristics, school FE, year FE, and school-specific linear time trends. Specifically, we
estimate models of the form
1 2015 ,st s st s t s stY Ferguson t X t (1)
where s and t index schools and academic years, respectively; Y is a school-level outcome;
Ferguson is a binary indicator equal to one if the school was in one of the four districts in the
immediate vicinity of the protests, and zero otherwise; 1{·} is the indicator function; X is a
vector of the time-varying school characteristics summarized in table 1; θ and δ are school and
year FE, respectively; and ε is an idiosyncratic error. Equation (1) will also be augmented to
condition on quadratic school time trends. The parameter of interest is τ, which represents the
departure from trend of Ferguson-area schools in the 2015 academic year. Standard errors are
clustered at the district level, which makes inference robust to arbitrary serial correlation within
schools and districts, as schools are nested in districts.
The key identifying assumption for OLS estimation of equation (1) is a variant of the
parallel slopes assumption: i.e., conditional on school-specific linear time trends, schools in and

12
outside the Ferguson area were trending similarly prior to the 2015 school year. We provide two
pieces of empirical evidence that suggest this assumption holds. First, we estimate versions of
equation (1) that either restrict β = 0, restrict γ = 0, replace the linear school time trends with
linear district time trends, or augment the model to include quadratic school time trends.
Importantly, if estimates of τ are similar across these alternative specifications, the baseline
results are unlikely to be the result of differential pre-existing trends between “treated” and
“control” schools. Second, we estimate event study versions of equation (1) that interact
Ferguson with each year indicator, which provides a direct test for “effects” of the events in
years prior to their occurrence in 2015. If the event study analysis yields significant “effects” in
Ferguson in the years prior to 2015, we would be concerned that the DD estimates of equation
(1) are biased by pre-existing differential trends in the treated schools. As shown in section 5.4,
the results of these sensitivity analyses corroborate a causal interpretation of OLS estimates of τ
in equation (1).
5. Results
This section presents the results. Section 5.1 presents estimates of the baseline DD model
(equation 1). Section 5.2 investigates whether the effects persisted into the 2016 school year.
Section 5.3 tests for heterogeneous responses to the events in Ferguson. Finally, Section 5.4
probes the robustness of the DD estimates and tests the “parallel slopes” identifying assumption.
5.1 Baseline Difference-in-Differences Estimates
Table 2 reports estimates of the baseline DD regression model specified in equation (1).
Each cell of Table 2 reports the DD estimate of τ from a unique regression. The models
estimated in column 1, which pool all schools, document practically large, statistically
significant effects on the percentage of students scoring “below basic” in math. Overall, there
was a 16.9 percentage point increase in the share of students who scored “below basic,” which
constitutes a substantively large doubling of the previous year’s share. The effect on the fraction
of Super-Subgroup students scoring below basic is smaller, yet still statistically and
economically significant: among this high-needs population, the share of students scoring below
basic increased by 10.9 percentage points (68%). These point estimates are consistent with the
patterns observed in Figure 2. There are also modest, negative effects on “Percent Advanced” in

13
math, though the point estimate is not statistically significant for Super-Subgroup students.
While these point estimates are smaller in magnitude and less precisely estimated than those for
“Below Basic,” in the treated Ferguson-area districts, only a small base of students ever score
“Advanced.” These results are troubling, as they suggest that many marginal students fell further
behind while some high achievers were harmed as well.16
Of course, assuming that elementary, middle, and high schools were affected in the same
ways is unrealistic, as the school contexts differ substantially and older students have more
agency over intermediate inputs such as attendance. Accordingly, columns 2-4 of Table 2 show
that the overall effects reported in column 1 were primarily driven by the response in elementary
schools, which is consistent with the results of Gershenson and Tekin (2015) and Sharkey et al.
(2014).17 The estimated effects in high schools are generally in the same direction, but smaller in
magnitude and never statistically significant. Sharkey et al. (2014) hypothesize that this could be
because older students, who have grown up in disadvantaged neighborhoods, are more resilient
to unexpected shocks and disruption. Alternatively, this result could be due to cognitive ability
being more malleable at younger ages (e.g., Cunha, Heckman, Lochner, & Masterov, 2006).
Table 3 investigates a potential channel through which the events in Ferguson might
have harmed student achievement. The absence of student- or teacher-level data limits the
channels that we can investigate, but school data on the percentage of students who were not
chronically absent is reported. Specifically, this variable measures the percent of students who
are absent less than 10 percent of school days. The causal link between attendance and
achievement is well established (e.g., Aucejo & Romano, 2016; Gershenson et al., 2017;
Goodman, 2014 b), and it is plausible that the civic unrest in Ferguson affected student
attendance by creating safety concerns over the commute to school, causing students to
disengage from school more generally, or distracting parents from ensuring that students
attended school on a regular basis. Column 1 of Table 3 reports baseline DD estimates of the
impact of the events in Ferguson on Ferguson-area schools’ overall attendance rates and
16 Appendix Table A.3 shows that the main results presented in Table 2 are robust to weighting
by school enrollments (Solon, Haider, & Wooldridge, 2015) and to using a broader definition of
“treatment” that includes three additional nearby school districts. 17 Appendix Table A.4 shows that this interpretation is robust to instead looking separately at
performance on end-of-year math tests in third, fifth, and eighth grades, and in high school
Algebra 1 exams. Specifically, the effects are concentrated on third- and fifth-grade tests.

14
attendance rates for specific socio-demographic groups. Columns 2-4 do the same separately for
elementary, middle, and high schools. Thus each cell in Table 3 reports the DD estimate of τ for
a unique regression.
Overall, the first entry in column 1 shows that the events in Ferguson led to a 3.1
percentage point decrease in the attendance measure, which means that chronic-absence rates
increased by this amount. This effect is strongly statistically significant and represents an
approximate decline of four percent in treated schools. The effect was similar for both male and
female students, and IEP students. The elementary school estimates in column 2 are quite similar
to those in column 1, while the estimates for middle and high schools in columns 3 and 4,
respectively, tend to be smaller and are imprecisely estimated. This is the same pattern observed
for math achievement in Table 2. Overall, the absence results presented in Table 3 are consistent
with a causal interpretation of the main result of Table 2: that the events in Ferguson prior to and
during the 2015 school year harmed student achievement in area elementary schools. Moreover,
these results suggest that increased absenteeism was an important channel through which the
events in Ferguson harmed student achievement in area elementary schools. Because the impacts
on both achievement and attendance are concentrated almost entirely in elementary schools,
subsequent analyses focus exclusively on elementary schools.
5.2 Persistence
Having uncovered arguably causal effects of the disruptions experienced in the Ferguson
area during the 2014-15 school year on student attendance and spring-2015 test scores, a natural,
policy-relevant question arises: did student achievement recover or remain depressed in
subsequent school years? The models estimated in Table 4 address this question by utilizing an
additional year of data and an augmented version of the baseline model (equation 1) that allows
for such effects to persist in 2016. Generally, the “long-run” effects in 2016 are in the same
direction, but smaller in magnitude and less precisely estimated, than the immediate effects in
2015. In only one instance is the long-run effect in 2016 individually statistically significant:
column 1 shows that the overall increase in percent below basic persisted into 2016, though this
effect is only half as large as the immediate impact in 2015. Still, the effects on percent below
basic in 2016 are significantly smaller than those in 2015. The long-run impacts on percent
advanced and attendance rates in 2016 are not statistically significant.

15
Overall, the results in Table 4 suggest that the disruptions experienced in Ferguson during
the 2014-15 school year had modest, if any, lasting impact on elementary school students’
academic performance and attendance habits in the 2015-16 school year. The lack of strongly
persistent effects is consistent with previous research on the impact of similar community
traumatic events: for example, Gershenson and Tekin (2015) find no evidence that exposure to
the Beltway Sniper attacks harmed student achievement in the following school year.
This could be due to parents and school administrators responding in the following
academic year to reverse the immediate negative effects observed in 2015. Unfortunately, data
limitations prohibit testing these hypotheses. However, this is not an implausible scenario given
the considerable national attention received by these schools and neighborhoods in the aftermath
of the shooting. Of course, even if the effects on test scores faded out, effects on socio-emotional
and attitudinal outcomes might persist in ways that affect long-run socioeconomic outcomes
(e.g., Chetty et al. 2011). Nonetheless, it is comforting that the negative impacts on test scores
and attendance associated with the unrest in Ferguson appear to be short-lived. The reason that
this lack of persistence is comforting is that while reversing the harmful impacts of community
traumatic events on student achievement may be possible, doing so would require the
reallocation of scarce resources.
5.3 Heterogeneity
The racially charged events and conversations in Ferguson might well have affected
predominantly black schools and communities across the St. Louis MSA, even those not in close
proximity to the shooting and subsequent unrest in the Ferguson area. For example, stress, fear,
and concern caused by the highly publicized shooting of an unarmed black teenager could easily
distract students in other parts of the MSA, especially given the amount of national media
attention that Ferguson received. Accordingly, we estimate a triple-difference version of
equation (1) that allows the racially-charged events in Ferguson to affect all majority-black
schools in the MSA, and for this effect to differ in Ferguson-area schools, which themselves are
uniformly majority black. Estimates of these triple-difference models are reported in Table 5.
Before estimating the full triple-difference model, column 1 of Table 5 simply changes
the treatment indicator in the baseline model from “Ferguson area” to “majority black.” The
resulting point estimate in column 1 is smaller than the analogous estimate in column 2 of Table
16
2, but is similarly positive and statistically significant. Intuitively, this suggests that the impact of
the events in Ferguson was not isolated to the four “treated” districts in the immediate vicinity of
the shooting and subsequent unrest, though the effects were larger in magnitude in districts
physically closer to the epicenter of the unrest. Column 2 formalizes this idea by estimating a
triple-interaction model that allows the response of majority-black schools to vary by proximity
to Ferguson. As expected, the triple interaction term shows that the effects were significantly
larger in magnitude in Ferguson-area schools. Columns 3 and 4 repeat this exercise for the subset
of super-subgroup students, where a similar pattern is observed: the impact of the events in
Ferguson was significantly larger in the majority-black schools in the Ferguson-area than in
other majority-black schools in the St. Louis MSA. Specifically, the overall and super-subgroup
effects of the civic unrest in Ferguson on percent below basic in math were 66% and 125%
larger, respectively, in Ferguson-area elementary schools than in majority-black elementary
schools elsewhere in the MSA. Similarly, column 6 shows that the effects of the events in
Ferguson on elementary school attendance rates were 86% larger in the Ferguson area than in
majority-black schools elsewhere in the MSA. These results are consistent with a causal impact
of the events in Ferguson on student achievement in Ferguson-area elementary schools.
Moreover, these results suggest that attendance was an important, but not the only, mechanism
through which student learning was affected.
One interpretation of the triple-difference estimates reported in Table 5 is that the psychic
costs of stress and changes in the allocation of instructional time away from academic topics
covered by MAP tests and towards conversations about race, social and criminal justice, and
inequality were more important channels through which achievement was affected than direct
disruptions to schools, households, and neighborhoods in the Ferguson area. That the impact
spread to other parts of the MSA, state, and nation is plausible, as the nightly news coverage of
the events in Ferguson, New York, Baltimore, Cleveland, and elsewhere made racial inequities
in the U.S. salient and a topic of conversation in majority-black schools.18 Together with the
effect on student attendance, these findings reinforce the main result of the baseline school-level
DD analyses: the police shooting and subsequent civic unrest experienced in Ferguson, MO had
18 Another possible interpretation of the triple interaction terms in Table 5 is that they represent
lower bounds of the impact of the civic unrest in Ferguson on math achievement. This would be
the case if, for example, some other event or policy shock disproportionately affected majority-
black schools in the St. Louis MSA in 2015.

17
a nontrivial, arguably causal impact on elementary school students’ academic achievement,
which occurred at least partly due to an increase in chronic absenteeism, and was concentrated at
the bottom of the achievement distribution.
It is also possible that the four distinct districts that comprise the “Ferguson Area”
treatment group were differentially affected. Table 6 tests this hypothesis by estimating an
augmented version of the baseline model (equation 1) in which the treatment indicator is
disaggregated into four separate district indicators. In all models, the four interaction terms
(district-specific treatments) are jointly statistically significant. While the main result of a
positive, sizable, and statistically significant effect on the percent Below Basic is upheld in all
four “treated” districts, the effect is about twice as large in Ferguson and Normandy as it is in
Jennings and Riverview Gardens. This is perhaps unsurprising, as Ferguson was the name
mentioned in most media accounts of the events and home to much of the violence that occurred
along W. Florissant Ave and Normandy is the district that Michael Brown graduated from. Thus,
for different reasons, it is intuitive that the impact on achievement was more severe in these
districts. Column 5 shows that the impact on attendance was fairly constant across districts.
5.4 Sensitivity Analysis
This section presents evidence that the key identifying “parallel trends” assumption made
by the difference-in-differences (DD) identification strategy is valid, and thus that the OLS
estimates of equation (1) and its variants presented in sections 5.1-5.3 can be given causal
interpretations. We begin by showing that estimates of τ are robust to conditioning on time-
varying school characteristics, linear school and district time trends, and quadratic school time
trends. Specifically, column 1 of Table 7 reports estimates of parsimonious specifications that
condition only on school and year fixed effects (FE). Moving from left to right, each column of
Table 7 augments the model estimated in column 1 to include a richer conditioning set: column 2
adds time-varying school controls, column 3 adds linear district-specific time trends, column 4
adds linear school-specific time trends (which subsume the district trends), and column 5 adds
quadratic school-specific time trends. Panels A and B of Table 7 report the DD estimates for
percent below basic in math and percent advanced in math, respectively, both for all students and
for Super Subgroup students. Each cell of Table 7 therefore reports the DD estimate of τ from a
18
unique regression. Appendix Table A.5 reports analogous results for reading (ELA)
achievement, which are similarly robust to model specification.
Importantly, the estimates are remarkably stable across columns, within rows of Table 7.
In other words, the baseline DD estimates are robust to controlling (or not) for time-variant
school characteristics and various school and district time trends. This stability strongly suggests
that the DD estimates are not biased by pre-existing differential trends (i.e., failure of the parallel
trends assumption) (Angrist & Pischke, 2009). We address this issue further by estimating event-
study specifications, which are presented in Table 8.
The robustness of the baseline results to controlling for school and district-specific time
trends, and for time-varying school observables, suggests that the DD estimates are not driven by
pre-existing differential trends in the treated (Ferguson-area) schools. In Table 8, we formally
test this assumption using an event study version of equation (1) that fully interacts the Ferguson
indicator with the full set of year FE. Relative to the omitted 2010 reference group, the other
2011-2014 pre-treatment interactions tend to be statistically insignificant and small in magnitude.
In fact, they are often the opposite sign of the actual 2015 treatment effect, which itself remains
similar in magnitude to the baseline estimates reported in Table 2 and strongly statistically
significant for three of the four outcomes. Coupled with the results in Table 7, the event study
estimates reported in Table 8 provide further evidence that the main identifying assumption
holds and, as a result, that the baseline DD estimates can be given a causal interpretation.
6. Conclusion
This paper documents the negative impact of a police shooting, and the many months of
civic unrest that followed, on student achievement in Ferguson, MO. While we cannot separately
identify the impacts of the shooting and the subsequent unrest, we find statistically significant,
arguably causal effects of the bundle of treatments on students’ math and reading achievement in
Ferguson-area elementary schools relative to other schools in the St. Louis MSA. Smaller
negative effects are found in majority-black schools elsewhere in the MSA. These difference-in-
difference (DD) and triple-difference estimates are not driven by pre-existing differential trends
in treated schools and are robust to controlling for time-varying school characteristics and linear
and quadratic school-specific time trends. Effects are relatively large, particularly at the lower
end of the math-score distribution. For example, a conservative estimate suggests that the

19
fraction of high-needs students scoring “below basic” in math increased by about 10 percentage
points following the unrest.
Reductions in achievement were concentrated in elementary schools, and were at least
partly driven by corresponding increases in student absences: the rate of chronic absence
increased by about four percentage points (5%) in Ferguson-area elementary schools. However,
attendance is unlikely the sole mechanism through which the events in Ferguson affected student
achievement in the area, as smaller, but statistically significant, declines in achievement occurred
in other majority-black school districts farther away from the physical unrest. For example, the
events in Ferguson might have affected schools through other channels, such as creating stress
and causing teachers and parents to reallocate instructional time away from math and reading
skills and towards non-tested topics such as race, inequality, and the criminal justice system. Of
course, without objective data on these intermediate outcomes, it is impossible to definitively say
to what extent the disruptions in Ferguson affected student achievement through these channels,
in Ferguson or elsewhere in the MSA, state, and country.
Because decreased attendance and lost instructional time are likely mechanisms through
which the events in Ferguson may have affected achievement, we contextualize our results by
comparing them to those from similar analyses of the impact of disruptions to school schedules
on school-level proficiency rates. For example, Marcotte and Hemelt (2008) find that ten
unscheduled, weather-related school closings reduced third and fifth grade math proficiency rates
by between 5 and 7 percentage points in Maryland. Similarly, Gershenson and Tekin (2015) find
that proximity to the 2002 Beltway Sniper Attacks reduced schools’ fifth-grade math proficiency
rates by about 5 percentage points in schools serving black and low-income communities. These
effects are similar in size to the conservative triple-difference estimates reported in Table 5 and
smaller than the baseline estimates in Table 2 of the current study. That the effects of the events
in Ferguson are larger than those of the beltway sniper attacks is intuitive, since even if the two
events created similar levels of stress and safety concerns, the unrest in Ferguson played out over
an entire school year while those in the sniper case lasted about three weeks, early in the school
year. Still, these impacts are large enough to change schools’ standings under consequential
accountability regimes such as No Child Left Behind (Gershenson & Tekin, 2015; Marcotte and
Hemelt, 2008). The attendance results in the current study further our understanding of the
mechanisms through which external disruptions to school environments and school schedules

20
can affect student achievement and highlight the importance of attendance in the education
production function (Gershenson et al. 2017; Goodman, 2014 b).
More generally, these results highlight the potential benefits of local and state
interventions that respond to community traumatic events, civic unrest, and related distractions
and disruptions to schools. For example, providing additional resources, support, and guidance to
affected schools and communities might reduce the harm to achievement associated with such
events. Weems et al. (2009) describe one school-based intervention that reduced test anxiety in a
predominantly black sample of students who were exposed to Hurricane Katrina. This type of
reactive policy and support would be further justified by the fact that the police shooting and
subsequent civic unrest in Ferguson occurred in what were already relatively disadvantaged and
under-resourced schools and communities.

21
REFERENCES
Abadie, A., & Gardeazabal, J. (2003). The economic costs of conflict: A case study of the
Basque Country. American Economic Review, 93(1): 113-132.
Abadie, A., Diamond, A., & Hainmueller, J. (2010). Synthetic control methods for comparative
case studies: Estimating the effect of California’s tobacco control program. Journal of the
American Statistical Association, 105(490): 493-505.
Angrist, J. D., & Pischke, J. S. (2009). Mostly harmless econometrics: An empiricist's
companion. Princeton, NJ: Princeton University Press.
Aucejo, E. M., & Romano, T. F. (2016). Assessing the effect of school days and absences on test
score performance. Economics of Education Review, 55: 70-87.
Balfanz, Robert, & Byrnes, Vaughan. (2012). Chronic absenteeism: Summarizing what we know
from nationally available data. Baltimore, MD: Johns Hopkins University Center for Social
Organization of Schools.
Beland, L-P., & Kim, D. (2016). The effect of high school shootings on schools and student
performance. Educational Evaluation and Policy Analysis, 38(1): 113-126.
Blundell, R., Dearden, L., & Sianesi, B. (2005). Evaluating the effect of education on earnings:
Models, methods and results from the National Child Development Survey. Journal of the Royal
Statistical Society, 168(3): 473-512.
Card, David. (1999). The causal effect of education on earnings. Handbook of Labor Economics
3: 1801-1863.
Chetty, Raj, Friedman, John N., Hilger, Nathaniel, Saez, Emmanuel, Schanzenbach, Diane W.,
Yagan, Danny. (2011). How does your kindergarten classroom affect your earnings? Evidence
from Project Star. The Quarterly Journal of Economics, 126(4): 1593-1660.
Cunha, F., Heckman, J. J., Lochner, L., & Masterov, D. V. (2006). Interpreting the evidence on
life cycle skill formation. Handbook of the Economics of Education, 1, pp. 697-812.
Davis, Elliot. (2014). The cost taxpayers will have to shell out for Ferguson. Fox 2 News, St.
Louis. http://fox2now.com/2014/12/09/the-cost-taxpayer-will-have-to-shell-out-for-ferguson/
(accessed October 22, 2015).
Dee, T. S. (2004). Are there civic returns to education? Journal of Public Economics, 88(9):
1697-1720.
Deming, D. J. (2011). Better schools, less crime? The Quarterly Journal of Economics, 126(4):
2063-2115.

22
Figlio, D., & Loeb, S. (2011). School accountability. In E. Hanushek, S. Machin, & L.
Woessmann (Eds.), Handbook of the Economics of Education, vol. 3, (pp. 383-421). Amsterdam:
North Holland.
Gershenson, S., Jacknowitz, A., & Brannegan, A. (2017). Are student absences worth the worry
in U.S. primary schools? Education Finance & Policy, 12(2). DOI:10.1162/EDFP_a_00207
Gershenson, S., & Tekin, E. (2015). The effect of community traumatic events on student
achievement: Evidence from the beltway sniper attacks. NBER Working Paper No. 21055.
Goodman, H. A. (2014 a). Ferguson resulted from Republican talking points that ignore the
economic segregation of blacks in America. Huff Post Politics. Accessed October 27, 2015
http://www.huffingtonpost.com/h-a-goodman/ferguson-resulted-from-re_b_5680955.html.
Goodman, J. (2014 b). Flaking out: Student absences and snow days as disruptions of
instructional time. NBER Working Paper No. 20221.
Kneebone, E. (2014). Ferguson, Mo. Emblematic of Growing Suburban Poverty. Brookings – f
The Avenue. http://www.brookings.edu/blogs/the-avenue/posts/2014/08/15-ferguson-suburban-
poverty Accessed October 27, 2015.
Lochner, Lance and Enrico Moretti. (2004). The Effect of education on crime: Evidence from
prison inmates, arrests, and self-reports. American Economic Review, 94 (1):155-189.
Machin, S., Marie, O., & Vujic, S. (2011). The crime reducing effect of education. The
Economic Journal, 121 (552): 463-484.
Marcotte, D. E., & Hemelt, S. W. (2008). Unscheduled school closings and student performance.
Education Finance and Policy, 3(3): 316-338.
Milligan, Kevin, Enrico Moretti, and Philip Oreopoulos. (2004). Does education improve
citizenship? Evidence from the United States and the United Kingdom. Journal of Public
Economics, 88(9): 1667-1695.
Mullainathan, S. (2015). Police killings of blacks: Here is what the data say. New York Times:
The Upshot. October 16, 2015.
Sharkey, P. (2010). The acute effect of local homicides on children's cognitive performance.
Proceedings of the National Academy of Sciences, 107(26): 11733-11738.
Sharkey, P. T., Tirado-Strayer, N., Papachristos, A. V., & Raver, C. C. (2012). The effect of
local violence on children’s attention and impulse control. American Journal of Public Health,
102(12): 2287-2293.

23
Sharkey, P., Schwartz, A. E., Ellen, I. G., & Lacoe, J. (2014). High stakes in the classroom, high
stakes on the street: The effects of community violence on students’ standardized test
performance. Sociological Science, 1: 199-220.
Solon, G., Haider, S. J., & Wooldridge, J. M. (2015). What are we weighting for? Journal of
Human Resources, 50(2): 301-316.
Unglesbee, B. (2014). Buildings destroyed in Ferguson riots worth millions. St. Louis Business
Journal. December 4, 2014. http://www.bizjournals.com/stlouis/news/2014/12/04/buildings-
destroyed-in-ferguson-riots-worth.html (accessed October 28, 2015).
Weems, C. F., Taylor, L. K., Costa, N. M., Marks, A. B., Romano, D. M., Verrett, S. L., &
Brown, D. M. (2009). Effect of a school-based test anxiety intervention in ethnic minority youth
exposed to Hurricane Katrina. Journal of Applied Developmental Psychology, 30(3): 218-226.
Wenger, Y. (2015). Unrest will cost city $20 million, officials estimate. Baltimore Sun, May 26,
2015. http://www.baltimoresun.com/news/maryland/baltimore-city/bs-md-ci-unrest-cost-
20150526-story.html (accessed October 28, 2015).
Wenger, Y. (2015). One estimate of business damage from Baltimore riot estimated at $9M, total
cost unknown. Baltimore Sun, May 13, 2015.
http://www.baltimoresun.com/news/maryland/baltimore-city/bs-md-ci-damage-estimate-
20150513-story.html (accessed October 28, 2015).
24
Figure 1. Map of Ferguson Area Districts
Notes: Baseline treatment districts are circled in red and include Ferguson, Jennings, Normandy,
and Riverview Gardens. Extended treatment districts include Hazelwood, University City, and
St. Louis City, which are circled in green. Stars indicate the districts that comprise Ferguson’s
synthetic control (Ritenour and Maplewood-Richmond Heights). The Eastern border is the
Mississippi River, which separates Missouri from Illinois. Hazelwood’s Northern border is the
Missouri River. All bold black lines demarcate counties. Appendix Figure A.1 shows all counties
in the St. Louis MSA. Source: Missouri Department of Elementary and Secondary Education.

25
Figure 2. School Average “Percent Below Basic” in Math Rates
Figure 2.A. Percent Below Basic in Math, All Students
Figure 2.B. Percent Below Basic in Math, Super Subgroup
Notes: Ferguson-area Schools include all schools in four Missouri school districts including
Ferguson, Jennings, Normandy, and Riverview Gardens. Control schools include all other public
schools in the St. Louis MSA. Each dot represents the annual school average deviation from the
MSA, year-specific mean.

26
Figure 3. Distribution of Annual Within-School Changes in “Percent Below Basic” in Math
Figure 3.A: Changes from 2014 to 2015.
Figure 3.B: Changes from 2013-2014.
Figure 3.C: Changes from 2012-2013.
Notes: In panel A, Treatment = 54.5% of top 5% schools and 60.0% of top 1% schools. In panel
B, Treatment = 33.3% of top 5% schools and 20.0% of top 1% schools. In panel C, Treatment =
26.1% of top 5% schools and 20% of top 1% schools.

27
Table 1. Descriptive Statistics for St. Louis MSA Public Schools
Ferguson Area Schools Control Schools
Mean SD Mean SD
Reading Achievement
% Below (All Students) 19.0 11.6 9.0 10.4
% Advanced (All Students) 7.5 5.3 23.3 13.4
% Below (Super Subgroup) 19.4 11.5 12.7 10.2
% Advanced (Super Subgroup) 6.7 4.4 14.5 8.7
Math Achievement
% Below (All Students) 23.7 15.8 23.7 15.8
% Advanced (All Students) 5.2 4.6 5.2 4.6
% Below (Super Subgroup) 24.1 15.9 24.1 15.9
% Advanced (Super Subgroup) 4.7 4.3 4.7 4.3
Attendance
All Students 80.8 11.3 89.8 7.6 Male Students 79.3 11.7 89.5 7.7
Female Students 82.5 11.4 90.0 7.8
IEP Students 75.1 12.9 85.0 9.8
FRL Students 79.8 11.5 84.6 8.6
School Characteristics
Average Admin Salary $94,656 18,753 $92,612 21,489
# of FTE Teachers 29.5 17.6 39.7 24.1
Average Teacher Salary $57,696 4,998 $53,127 7,371
Average Teacher Experience 13.9 2.8 12.2 2.5
% Teachers w/ Masters 63.4 12.8 65.7 16.4
Total Enrollment 474.6 319.4 585 406.5 Student to Teacher Ratio 15.8 2.3 14.3 2.3
% White Students 6.9 10.2 64.5 32.5
% Black Students 89.5 13.3 27.2 33.3
% Hispanic Students 1.4 2.8 3.3 3.3
% Asian Students 0.4 0.6 3.2 4.1
% Multiracial Students 1.7 2.4 1.5 2
% Other Race Students 0.5 0.6 3.5 4.1
% LEP Students 0.7 2.6 3.5 6.2
% FRL Students 82 14.7 44.6 27.7
N (School Years) 300 2,513
N (Unique Schools ) 53 439
N (Unique Districts) 4 46 N (Years) 6 6
Notes: Ferguson-area (control) schools are schools in the following school districts: Ferguson,
Normandy, Jennings, and Riverview Gardens. Control schools are all other schools in the St.
Louis Metropolitan Statistical Area (MSA) on the Missouri side of the Mississippi River. Super
Subgroup includes high needs students who are black, Hispanic, low-income, or have an
Individualized Education Plan (IEP). Attendance rates are the percentage of a school’s students
who were absent fewer than ten percent of school days (i.e., who were not chronically absent).

28
Table 2. Baseline School-Level DD Estimates of Effects on Student Math Achievement
School Type
All Schools
(1)
Elementary
(2)
Middle
(3)
High
(4)
A. Math Achievement, Below Basic
All Students 16.9*** 18.4*** 16.2*** 11.3
(4.6) (4.1) (4.9) (12.2)
Super Subgroup 10.9** 12.8*** 8.0* 6.6
(4.4) (3.8) (4.3) (12.8)
B. Math Achievement, Advanced
All Students -6.2*** -9.9*** -1.9 -1.0
(2.1) (2.9) (4.4) (2.9)
Super Subgroup -1.6 -4.1 -1.2 2.2
(2.1) (2.8) (4.2) (2.5)
N (school years) 2,813 1,744 495 574
Notes: Each cell reports the estimate of τ for a unique regression that controls for school and
year fixed effects, linear school time trends, and time-varying school characteristics. Outcomes
are school performance rates for both all students and for super-subgroup (high needs) students
who are black, Hispanic, eligible for free or reduced-price lunch (FRL), have an individual
education plan (IEP), or English language learners (ELL). Each panel represents a different
dependent variable: percent below basic or percent advanced. Standard errors are clustered by
school district. DD = difference-in-difference. *** p<0.01, ** p<0.05, and * p<0.1.

29
Table 3. Baseline School-Level DD Estimates of Effects on Student Attendance
School Type
Outcome
All Schools
(1)
Elementary
(2)
Middle
(3)
High
(4)
Total Attendance Rate -3.1*** -4.2*** -1.8 -1.0
(0.8) (0.5) (2.3) (4.9)
Male Attendance Rate -2.8*** -3.9*** -2.9 0.6
(0.5) (0.7) (2.0) (4.9)
Female Attendance Rate -3.5*** -4.8*** -0.4 -2.5
(1.0) (0.5) (2.6) (4.9)
IEP Attendance Rate -2.8*** -3.8* -4.5 -0.0
(0.9) (1.9) (3.5) (5.1)
FRL Attendance Rate -0.8 -2.3** 0.8 1.2
(0.6) (1.0) (2.1) (4.1)
N (school years) 2,813 1,744 495 574
Notes: Each cell reports the coefficient estimate on the interaction between the “treated
school” and 2015 indicators from a unique regression that controls for school and year fixed
effects, linear district time trends, and time-varying school characteristics. The dependent
variable, attendance rate, is the percentage of a school’s students who were absent fewer than
10 percent of school days (i.e., who were not chronically absent). Standard errors are clustered
by school district. IEP = Individualized Education Plan. FRL = Free or reduced price lunch.
*** p<0.01, ** p<0.05, and * p<0.1.

30
Table 4. Persistence of Effects on Elementary Student Achievement and Attendance
Outcome: Below Basic, Math Advanced, Math Attendance
Students: All Super
Subgroup All
Super
Subgroup All FRL
(1) (2) (3) (4) (5) (6)
2015×Treated 17.6*** 13.4*** -9.8*** -6.0*** -3.1*** -1.9*
(4.0) (4.0) (2.3) (1.5) (0.7) (1.0)
2016×Treated 8.5** 4.1 -7.0 -3.5 -1.9 -0.8
(3.4) (3.1) (5.0) (3.7) (1.3) (1.7)
Diff. (p value) 0.00 0.00 0.53 0.55 0.27 0.36
N (school years) 2,002 1,992 1,968 1,934 2,031 1,990
Notes: Each column reports coefficient estimates from a unique regression that controls for
school and year fixed effects, linear district time trends, and time-varying school characteristics.
Attendance is the percentage of a school’s students who were absent fewer than 10 percent of
school days (i.e., who were not chronically absent). The super-subgroup (high needs)
classification includes students who are black, Hispanic, eligible for free or reduced-price lunch
(FRL), have an individual education plan (IEP), or English language learners (ELL). Standard
errors are clustered by school district. *** p<0.01, ** p<0.05, and * p<0.1.

31
Table 5. School-Level DDD Estimates of Effects on Student Achievement and Attendance
Outcome: Below Basic, Math Attendance
Students: All Students Super-
Subgroup All Students
(1) (2) (3) (4) (5) (6)
2015×Black 14.9*** 12.2*** 8.7*** 6.1*** -2.7*** -2.1***
(2.3) (2.3) (2.2) (2.1) (0.5) (0.6)
2015×Black×Ferguson 8.1** 7.6* -1.8**
(3.5) (3.9) (0.8)
Notes: The analytic sample contains 1,744 unique school-year observations, 50 unique
districts, 302 unique elementary schools, and six academic years (2010-2015). Black is a
binary indicator equal to one if the school’s enrollment is more than 50% black, and zero
otherwise. All Ferguson-Area schools are more than 50% black. Each column reports
coefficient estimates from a single regression, in which indicators for each of the four
“treated” districts are interacted with the 2015 indicator. Each regression controls for school
and year fixed effects, linear school time trends, and time-varying school characteristics.
Outcomes are school performance rates for both all students and for super-subgroup (high
needs) students who are black, Hispanic, eligible for free or reduced-price lunch (FRL), have
an individual education plan (IEP), or English language learners (ELL). Attendance reflects
the percentage of a school’s students who were absent fewer than 10 percent of school days.
Standard errors are clustered by school district. *** p<0.01, ** p<0.05, and * p<0.1.

32
Table 6. Geographic Heterogeneity in Effect of Unrest on Student Outcomes
Below Basic, Math Advanced, Math Attendance
All Students
Super Subgroup
All Students
Super Subgroup
All Students
(1) (2) (3) (4) (5)
2015×Ferguson 23.3*** 17.9*** -11.6*** -4.0 -3.0*** (2.9) (2.4) (3.0) (2.9) (0.6)
2015×Jennings 12.4*** 8.0*** -10.9*** -8.5*** -3.8***
(2.3) (1.1) (1.6) (0.9) (0.6)
2015×Normandy 18.0*** 12.6*** -6.1** -3.4** -3.8*** (3.5) (2.2) (2.3) (1.4) (0.8)
2015×Riverview Gardens 14.6*** 7.0** -7.7** 0.3 -4.5***
(3.5) (2.8) (3.6) (3.6) (0.6) Tests of Equality (p-values)
Ferguson = Jennings 0.00 0.00 0.72 0.13 0.11
Ferguson = Normandy 0.00 0.00 0.01 0.81 0.31
Ferguson = Riverview Gardens 0.00 0.00 0.00 0.00 0.00 Jennings = Normandy 0.00 0.00 0.00 0.00 0.99
Jennings = Riverview Gardens 0.16 0.64 0.23 0.02 0.15
Normandy = Riverview Gardens
0.00 0.00 0.50 0.24 0.30
Notes: The analytic sample contains 1,744 unique school-year observations, 50 unique districts,
302 unique elementary schools, and six academic years (2010-2015). Each column reports
coefficient estimates from a single regression, in which indicators for each of the four “treated” districts
are interacted with the 2015 indicator. Each regression controls for school and year fixed effects, linear
school time trends, and time-varying school characteristics. Outcomes are school performance rates for both all students and for super-subgroup (high needs) students who are black, Hispanic, eligible for free
or reduced-price lunch (FRL), have an individual education plan (IEP), or English language learners
(ELL). Standard errors are clustered by school district. *** p<0.01, ** p<0.05, and * p<0.1.

33
Table 7. School Level Difference-in-Difference Estimates
(1) (2) (3) (4) (5)
A. Math Achievement, Below Basic
All Students 18.6*** 19.1*** 17.9*** 18.4*** 17.7***
(3.5) (3.6) (3.6) (4.1) (4.3)
Super Subgroup 14.2*** 13.5*** 12.4*** 12.8*** 12.6***
(3.4) (3.4) (3.3) (3.8) (4.3)
B. Math Achievement, Advanced
All Students -9.8*** -10.1*** -9.6*** -9.9*** -11.6***
(1.9) (2.7) (3.1) (2.9) (4.1)
Super Subgroup -5.6*** -4.0* -3.8 -4.1 -4.4
(1.1) (2.1) (2.9) (2.8) (3.2)
School & Year FE √ √ √ √ √
School Controls √ √ √ √
Linear District Trends √
Linear School Trends √ √
Quadratic School Trends √
Notes: The analytic sample contains 1,744 unique school-year observations, 50 unique districts,
302 unique elementary schools, and six academic years (2010-2015). Each cell reports the
estimate of τ for a unique regression. Outcomes are school performance rates for either all
students or for super-subgroup (high needs) students who are black, Hispanic, eligible for free
or reduced-price lunch (FRL), have an individual education plan (IEP), or English language
learners (ELL). Each panel represents a different dependent variable: percent below basic or
percent advanced, in either math or reading. Standard errors are clustered by school district. FE
= fixed effects. *** p<0.01, ** p<0.05, and * p<0.1.

34
Table 8. School Level Math Achievement Event Study Estimates
Below Basic Advanced
All Students Super Subgroup All Students Super Subgroup
(1) (2) (3) (4)
2011×Treated 0.5 0.9 -0.1 0.1
(0.5) (0.5) (1.0) (0.9)
2012×Treated 0.1 1.2 0.2 -0.1
(0.7) (0.9) (1.1) (1.0)
2013×Treated -0.6 0.1 1.2 1.3
(0.6) (0.7) (1.5) (1.6)
2014×Treated 1.1 1.5* 0.8 0.5
(0.8) (0.9) (1.2) (1.1)
2015×Treated 19.4*** 14.3*** -9.7*** -3.6*
0.5 0.9 -0.1 0.1
Notes: The analytic sample contains 1,744 unique school-year observations, 50 unique districts,
302 unique elementary schools, and six academic years (2010-2015). Each column reports the
coefficient estimates on the interactions between the “treated school” and year indicators from a
unique event-study regression that controls for school and year fixed effects and time-varying
school characteristics. Outcomes are school performance rates for both all students and for
super-subgroup (high needs) students who are black, Hispanic, eligible for free or reduced-price
lunch (FRL), have an individual education plan (IEP), or English language learners (ELL).
Each row represents a different dependent variable: percent below basic or percent advanced, in
math. Standard errors are clustered by school district. *** p<0.01, ** p<0.05, and * p<0.1.