journal of earth science and climatic change
TRANSCRIPT

x
X`
Program Against Cancer in Liberia
Journal of Earth Science and Climatic Change
The Impact of Climate Change on the River Jordan-Lake Kinneret (Israel) Ecosystem
Re
sear
ch A
rtic
le
Moshe Gophen
MIGAL-Galilee Scientific Research Institute, Israel
Corresponding Author: Moshe Gophen, MIGAL-Galilee Scientific Research Institute, Israel. Email; [email protected]
Citation: Gophen M (2020) The Impact of Climate Change on the River Jordan-Lake Kinneret (Israel) Ecosystem. Jou EarSci&ClimChange: JESCC-105. DOI: 10.46715/jescc2020.10.1000105
Received Date: 9 September, 2020; Accepted Date: 28 September, 2020; Published Date: 5 October, 2020
Keywords: Kinneret; Watershed; Climate Change;
Nutrients; Hydrology; Phytoplankton
Introduction
Study Area
Lake Kinneret (Surface area-168 km2; Volume - 4 km2) and
its watershed is part of the Northern section of the Syrian-
African Great Rift Valley. The Watershed area (2730 km2)
of Lake Kinneret is stretched between 32° 40` and 33° 38`
North (Serruya 1978) [37]. The drainage basin length,
directed North-South axis is 110 km. The Altitude gradient
is between 2814 masl and 214 mbsl (average slope 2.75%).
The Lake is located between 320 42` 15``and 320 53` 44``
North and longitudes 350 30` 52`` and 350 38` 55`` East.
Lake Kinneret is a warm monomictic lake which is fully
mixed during cold and wet winter, from mid-December
until early May. (Serruya et al 1978; Gophen and Gal 1992;
Gophen 2019a) [15, 37, 44]. Three major headwater rivers
(Hatzbani, Banyas and Dan) flow southerly downstream
from the Hermon mountain region. The Hula Valley
drainage (1950`s) changed the hydrological conditions:
Jordan river crossing the Hula Valley splitting into two
canals which joint at the south end of the Hula Valley
flowing southerly downstream into Lake Kinneret
maintain its Water Level (WL) (Gvirzman 2002; Givati and
Rosenfeld 2007;Givati et al 2019; Gophen2018)[1,3,14, 23].
Jou EarSci&ClimChange: JESCC-105 1
Limnological Features of Lake Kinneret
The lake is stably stratified from May through Mid-December.
The content of anoxic Hypolimnion is rich with Ammonium,
CO2, and Sulfids. Stratification exist during May-early June and
De-stratification take occur from mid October through Mid
December. Lake management is aimed at water supply,
commercial fishery, recreation, and tourism. Lake Kinneret is
the only natural body of freshwater in Israel. (Serruya 1978)
[37]. Water supply from Lake Kinneret (about 106 m3 daily) is
carried out through the National Water Carrier (inaugurated
10.6.1964) (Serruya et al 1980). [38] Since 2010 desalinization
technology was implemented and lake water withdraw was
significantly reduced leaving free volume for different
consumers (Gophen 2019a) [15]. A dam was constructed at the
south end of the lake in 1934. A salty springs diversion was
operated in 1967 which caused together with heavy floods
(1968-1969) lake water salinity decline from 400 ppm to 210
ppm Chloride. Since Mid 1980`s climate change conditions
significantly affected the hydro-ecological trait of the
ecosystem (Serruya 1978; Gophen 2016b; 2018) [10, 14, 37].
The significance of those modification are discussed in this
paper.
Lake Kinneret supplies national multi-ecological services. Besides water supply and recreation, the lake is also exploited for fishing by about 200 licensed fishermen, who remove commercially an average of 1600 ton of fish (94 kg/ha) per
Abstract
The long-term record of River Jordan-Lake Kinneret ecosystem indicates some significant climate condition
changes: water temperature increase, decline in rainfall, and diminishing river discharges and lake water inflows
accompanied by a reduction in nitrogen and a slight increase in phosphorus in the Lake upper layers (Epilimnion).
Lake Water level decreased, Prolongation of Residence Time was documented, nutrient inputs and dynamics
modifications resulting water quality deterioration. As a result of temperature elevation and nitrogen deficiency,
the biomass of Peridinium spp significantly reduced and was replaced by Cyanobacterial biomass enhancement.
Dryness trend expressed as enhanced frequency of drought seasons initiated an elevation of lake water salinity. It
has been suggested that these changes in the phytoplankton community structure are caused by regional climate
change. This study evaluates a multi-annual respective approach although the summer is the most critical. The
objective of this research is evaluate the background of the ecosystem structure modification aimed at define
future potential management design.
DOI: 10.46715/jescc2020.10.1000105
Citation: Gophen M (2020) The Impact of Climate Change on the River Jordan-Lake Kinneret (Israel) Ecosystem. Jou EarSci&ClimChange: JESCC-105. DOI: 10.46715/jescc2020.10.1000105
annum. Before the 2000`s the zooplanktivorous fish, Lavnun (Bleak, Acanthobrama spp.), comprises 55% by weight of total catches and over 50% of the stock biomass. Eight out of the 24 recorded species are commercial, with the native Tilapine, Sarotherodon galilaeus (Galilee St. Peters `s Fish; Hebrew: Amnoon Ha`Galil; Arabic Musht Abyad) (average of 326 t/year) the most important in the commercial landings. The protection of water quality and water level (WL) management are of national concern. The definition of uppermost and lowest WL maintenance is a significant part of the management policy. The WL definition is limited between two constraints – the highest 208.8 and the potential lowest of 215.00-but water quality and fishery management might deserve amplitude ranges in-between these two. Nevertheless, the present study is aimed at the impact of climate change on nutrient dynamics and the attendant consequences on the algal community structure, i.e. water quality (Serruya et al 1980; Gophen 2018) [38, 14].
Globality of Climate Change and Cyanobacteria Outbreak
Global climate change was widely documented whilst its consequence with the Cyanobacteria global enhancement became recently internationally common topic of research. A vast relevant scientific information was documented by Reichwaldt and Ghadouani,( 2012), O`Neil ,et al (2012)., Toth and Padisak. (1986), Kosten et al (2012), Paerl and Huisman (2008). Gophen (2019b), Johnk,et al (2008). Jensch and Belerkuhnlein (2008), Fristachi, and Sinclair, (2008), Izydorczyk, et al (2008), Taranu et al, (2012) and Wu et al (2008) [1, 16, 27, 28, 29 , 30, 34, 35, 36, 41, 42, 43]. The main impact on Cyanobacteria global outbreak are climate change condition, mostly Temperature increase and consequent nutrient dynams controlled by Hydrological modifications.
Material and Methods
Data Sources
The long-term datasets (1970–2018) of Lake Kinneret and its watershed, including the water and air temperature, rainfall gauge, nutrient dynamics, lake plankton community structure, lake water level (WL) and river discharges (in mcm/y, that is 106 m3 annually),(LKDB-IOLR 1969-2020; Gophen 1992; 2019a; Gvirzman 2002; Givati et al 2019) [3, 15, 23, 31, 44] were statistically evaluated. Data were obtained from the following sources: Annual Reports, Kinneret Limnological Laboratory, annual reports of the Israeli National Meteorological Service and the Israeli National Hydrological Service (National Water Authority). Other data sources were MIGAL, Hula Project Service (Gophen 2018) [14], Interim and Annual Reports by Mekorot Water Supply Company Ltd., Monitoring Unit Jordan District, Agriculture Ministry Northern Branch – Upper Galilee Office, and TAHAL Water Planning for Israel.
Statistical Methods
Statistical analyses (fractional polynomial regression, Linear Regression and simple averages, Line scattered) were carried out using STATA 9.1.
Statistical analyses (fractional polynomial regression) (FP) were carried out using STATA 9.1, Statistics-Data Analysis: Chapter Fracpoly-Fractional, Polynomial regression StataCorp. 2005. Stata Statistical Software: Release 9. College Stration TX: StataCorp LP.pp.357-370; See also: Royston, P. and D. G. Altman, 1994.) Regression using Fractional Polynomial of continuous covariates: Parsimonious parametric modeling (with discussion): Applied Statistics 43: 429-467.) The purpose of FPs is to increase the flexibility by the family of conventional polynomial models. Although polynomials are popular in data analysis, linear and quadratic functions are severely limited in their range of curve shape, whereas cubic and higher order curve often produce undesirable artifacts such as "edge effects and "waves" (STATA 9)".
Sampling Procedures
The sampling procedures (spatial, temporal and batimetrical
program) for the analysis of phytoplankton biomass
calculation and chemical parameters are available in LKDB-
IOLR Co. Ltd. Jordan water samples were collected at the
station located at Huri Bridge (Gesher Ha’Pkak). This sampling
site is located downstream of the Hula Valley and 12 km to the
north of the lake, and represents all historical water input
quality used since 60 years of Lake Kinneret research,
Information about sampling procedures (frequencies, location,
sample treatment is given in (Serruya 1978; Givati et al 2019;
Gophen 2018; 2019b, c; Gophen and Gal 1992; LKDB-IOLR
1969-2020) [3, 14, 16, 17, 31, 37].
Results and Discussion
Climate Change: Temperature, Rainfall, River discharge:
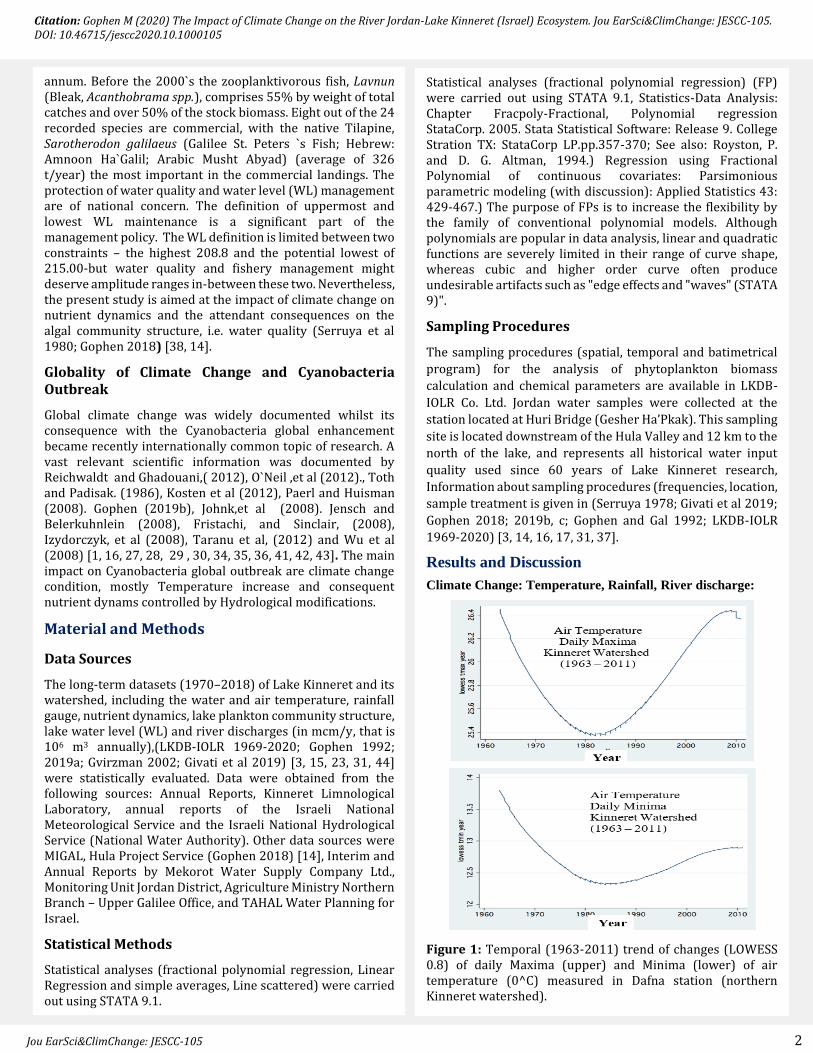
Figure 1: Temporal (1963-2011) trend of changes (LOWESS 0.8) of daily Maxima (upper) and Minima (lower) of air temperature (0^C) measured in Dafna station (northern Kinneret watershed).
Jou EarSci&ClimChange: JESCC-105 2
Citation: Gophen M (2020) The Impact of Climate Change on the River Jordan-Lake Kinneret (Israel) Ecosystem. Jou EarSci&ClimChange: JESCC-105. DOI: 10.46715/jescc2020.10.1000105
Data given in Figure 1 indicates temperature decline between 1960-1980 and increase afterwards in the Kinneret watershed
region. Consequently elevation of lake water temperature increase was documented (Figure 2). Several documentations of the
relation between Temperature elevation and Cyanobacteria enhancements were published by Toth and Padisak (1986) [42] and
Paerl and Huisman (2008) [35]. Since Mid-1980`s Rainfall decline (Figure 3) and consequently Headwaters discharge reduced
(Givati et al 2019; Gophen 2018; Gophen 2019b,c) [3, 14,16, 17] resulting Nutrient concentrations decline and consequently
reduction of their loads in the river inflows (Figures 4,5,6).
Moreover, dryness trend enhancement increased frequency of drought season. Lake water inputs diminished, and Water level
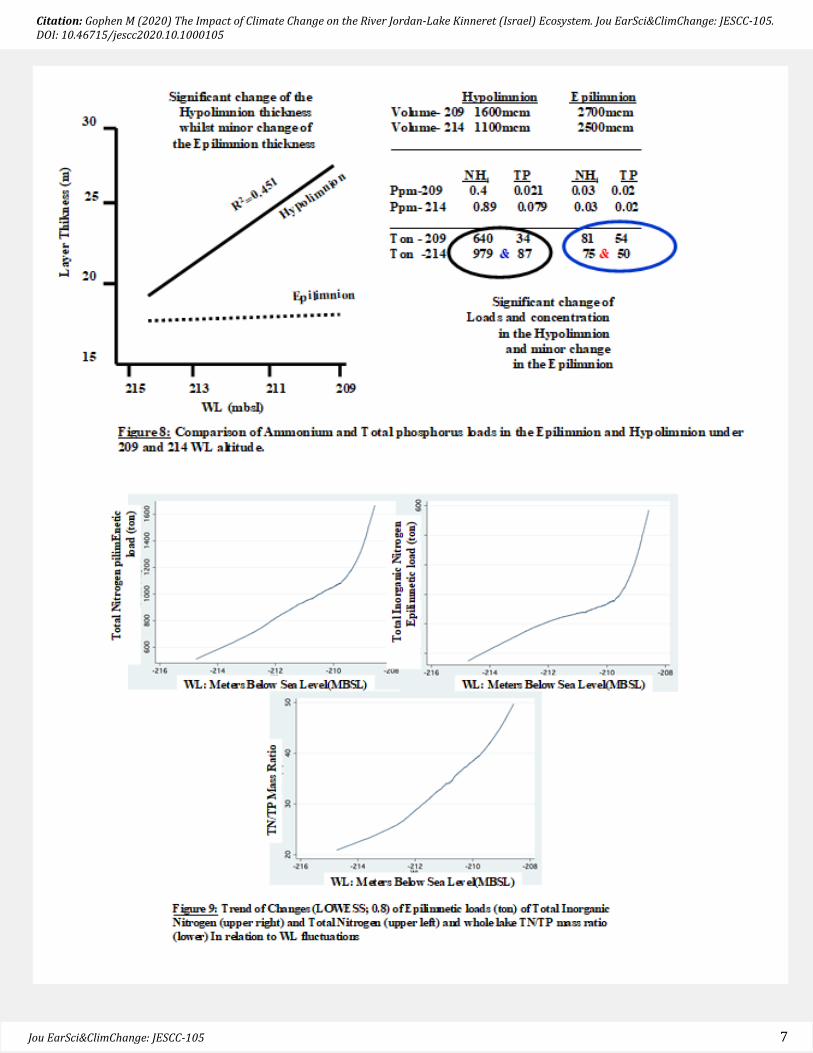
declined (Figure 7) and Thermal structure modified: Epilimnion became thinner by 4% and the Hypolimnion by 23.4% resulting
Nutrient concentrations decline in the Epilimnion and increase in the Hypolimnion (Figures 8,9).
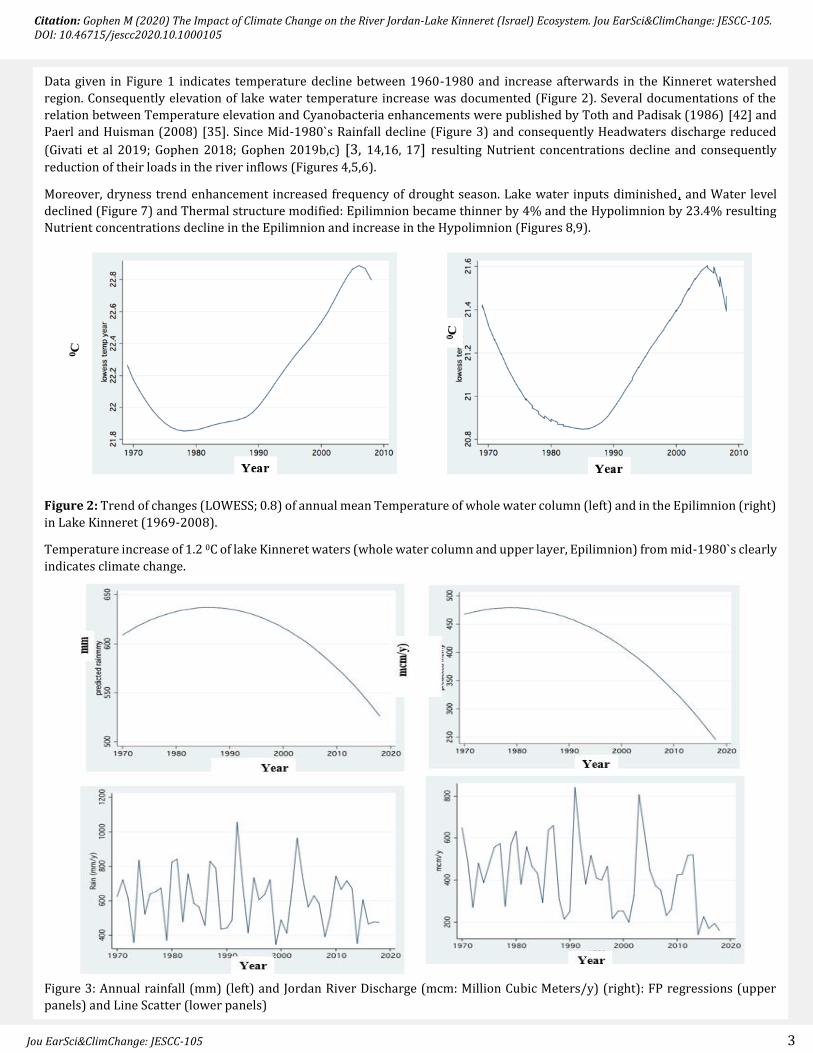
Figure 2: Trend of changes (LOWESS; 0.8) of annual mean Temperature of whole water column (left) and in the Epilimnion (right)
in Lake Kinneret (1969-2008).
Temperature increase of 1.2 0C of lake Kinneret waters (whole water column and upper layer, Epilimnion) from mid-1980`s clearly
indicates climate change.
Figure 3: Annual rainfall (mm) (left) and Jordan River Discharge (mcm: Million Cubic Meters/y) (right): FP regressions (upper
panels) and Line Scatter (lower panels)
Jou EarSci&ClimChange: JESCC-105 3
Citation: Gophen M (2020) The Impact of Climate Change on the River Jordan-Lake Kinneret (Israel) Ecosystem. Jou EarSci&ClimChange: JESCC-105. DOI: 10.46715/jescc2020.10.1000105
Long term (1970-2020) trend of climate change confirmed by rainfall and river Jordan discharge decline is shown in Figure 3.
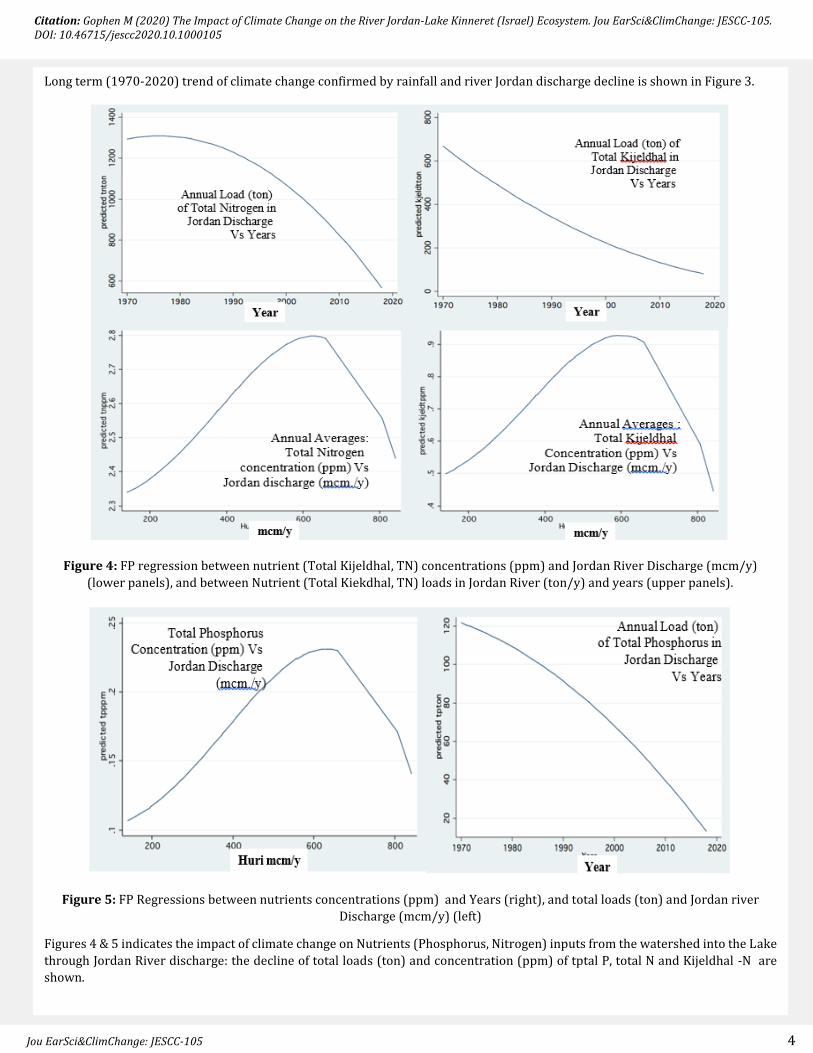
Figure 4: FP regression between nutrient (Total Kijeldhal, TN) concentrations (ppm) and Jordan River Discharge (mcm/y)
(lower panels), and between Nutrient (Total Kiekdhal, TN) loads in Jordan River (ton/y) and years (upper panels).
Figure 5: FP Regressions between nutrients concentrations (ppm) and Years (right), and total loads (ton) and Jordan river
Discharge (mcm/y) (left)
Figures 4 & 5 indicates the impact of climate change on Nutrients (Phosphorus, Nitrogen) inputs from the watershed into the Lake
through Jordan River discharge: the decline of total loads (ton) and concentration (ppm) of tptal P, total N and Kijeldhal -N are
shown.
Jou EarSci&ClimChange: JESCC-105 4

Citation: Gophen M (2020) The Impact of Climate Change on the River Jordan-Lake Kinneret (Israel) Ecosystem. Jou EarSci&ClimChange: JESCC-105. DOI: 10.46715/jescc2020.10.1000105
Figure 6: Linear Regression (parameters are given) between River Jordan Discharge (m3/s) and total Nitrogen load input
through the Jordan flows. Calculated r2 values for other nutrients are: TP - 0.596, TIN - 0.776, SO4 - 0.816, Org. N - 0.606, Chloride
- 0.886 (p<0.0001).
Figure 7: Ten year Group averages of monthly means of water level in Lake Kinneret (1933-2018).
0
200
400
600
TN
-Hu
ri:
t/m
on
th
0 10 20 30 40 50
Discharge (m^3 per second)
R^2 = 0.86
p<0.0001
Jou EarSci&ClimChange: JESCC-105 5

Citation: Gophen M (2020) The Impact of Climate Change on the River Jordan-Lake Kinneret (Israel) Ecosystem. Jou EarSci&ClimChange: JESCC-105. DOI: 10.46715/jescc2020.10.1000105
WL Altitude
(MBSL)
Epilimnion
Volume
(mcm)
Hypolimnion Volume
(mcm)
209 1981 2411
210 1866 2365
211 1864 2122
212 1839 1983
213 1814 1846
Table 1: WL Decline of 209-213 (4 m): Epilimnion volume
reduction of 4% (from 1891 to 1814 mcm*) and Hypolimnion
volume reduction of 23.4% (from 2411 to 1846 mcm*)
*mcm=106m3
Data shown in Figure 6 indicates the linear relation between
discharge and nutrient load capacities: the higher the
discharge is the higher is he load inputs. Figure 7 and Table 1,
represent the long-term decline of Water Level (WL) in Lake
Kinneret.
The data given in Figure 8 indicates the different response of
the Epilimnion and the Hypolimnion to Water Level decline:
the Hypolimnion volume reduced by 23.4% and that of the
epilimnion by 4.5% only. Moreover nutrient concentrations
and total mass in the Hypolimnion increase and that of the
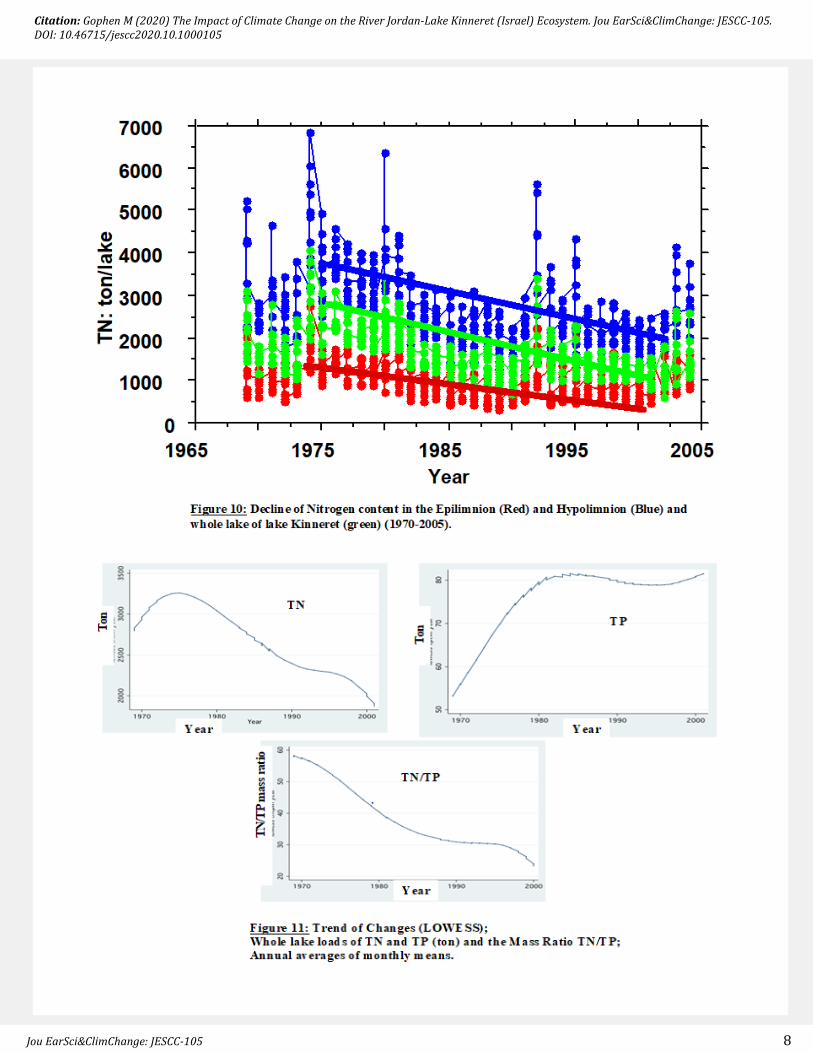
Epilimnion decline (Figure 8 & 9). Date given in Figure 10
indicates the decline trend of Nitrogen stock in the Epilimnion
and Hypolimnion and obviously in the whole lake. The
resulted conditions of nutrient (P and N) stocks decline of
Nitrogen, increase of Phosphorus and decrease of the TN/TP
mass ratio. These long-term changes initiated conditions of
Peridinium suppression whereas suitable for Cyanobacteria
enhancement as shown in Figures 12, 13 & 14.Peridinium
require Nitrogen and Cyanobacteria are able to incorporate
atmospheric Nitrogen by Nitrogenase enzyme through
Nitrogen fixation process. Therefore Peridinium disappeared
and replaced by Cyanobacteria. A documentation of the
invasion of the HFCB`s species Aphanizomenon ovalisporum
(APO) was done by Hadas et al (2012) [25]. The impact of
insufficient ambient Nitrogen accompanied by APO ability to
maintain atmospheric Nitrogen fixation supported its invasion
(Hadas et al 2012) [25]. The Nitrogen decline not only
enhanced bloom of a Diazotrophic Cyanobacterium but also
generated a modification of the Phytoplankton community
structure in Lake Kinneret (Hadas et al 2015). [26] These kind
of changes were widely studied: O`Neil et al (2012) [34]
indicate HFCB domination as a symptom of Eutrophication.
Essential consideration is given in many studies to the role of
Nitrogen in association with Phosphorus availabilities to the
outbreak of Cyanobacteria (Guilford and Hecky 2000;
McQueen and Lean 1987; Smith 1983; Fristachi and Sinclair).
Residence Time
As a result of WL decline, nutrient concentrations in the
Hypolimnion significantly increased whilst in the Epilimnion a
minor change was documented (Figure 10, 11). Nevertheless,
dissimilar developments of Epilimnetic Nitrogen and
Phosphorus concentrations occur: Nitrogen concentration
decrease, whilst Phosphorus concentration was partly stable
and slightly increase by dust deposition (Nishri 2014) [33] and
released from bottom sediments, therefore TN/TP mass ratio
decline (Figure 11) .The prominent consequence of climate
change was Nitrogen insufficiency (Figure 10). Nitrogen
depletion caused Peridinium suppression and enhancement of
Cyanobacteria. Peridinium domination decline occur as a
result of the ultimate demand for available Nitrogen by
Peridinium, whilst Cyanobacteria recover Nitrogen
insufficiency by Nitrogen fixation (Figures 12, 13). Water
inflow decline affected WL decline and consequently
prolongation of Residence Time (RT) which supported also
enhancement of changes of nutrient dynamics and
modification of Phytopkankton composition (Figure 14).
Residence Time (RT) computation was as follows:
RT (in months or years) = V/W.
Where:
W = Monthly inflow in mcm per month (106 m3/month)
V = Monthly values of lake Volume in mcm (106 m3)
Temperature increase and dryness enhancement and the
increase of negative trend of Kinneret Water Balance caused
elevation of lake water salinity making the need for RT
shortening (water exchange) critical.
Jou EarSci&ClimChange: JESCC-105 6
Citation: Gophen M (2020) The Impact of Climate Change on the River Jordan-Lake Kinneret (Israel) Ecosystem. Jou EarSci&ClimChange: JESCC-105. DOI: 10.46715/jescc2020.10.1000105
Jou EarSci&ClimChange: JESCC-105 7
Citation: Gophen M (2020) The Impact of Climate Change on the River Jordan-Lake Kinneret (Israel) Ecosystem. Jou EarSci&ClimChange: JESCC-105. DOI: 10.46715/jescc2020.10.1000105
Jou EarSci&ClimChange: JESCC-105 8

Citation: Gophen M (2020) The Impact of Climate Change on the River Jordan-Lake Kinneret (Israel) Ecosystem. Jou EarSci&ClimChange: JESCC-105. DOI: 10.46715/jescc2020.10.1000105
Jou EarSci&ClimChange: JESCC-105 9
Citation: Gophen M (2020) The Impact of Climate Change on the River Jordan-Lake Kinneret (Israel) Ecosystem. Jou EarSci&ClimChange: JESCC-105. DOI: 10.46715/jescc2020.10.1000105
Jou EarSci&ClimChange: JESCC-105 10

Citation: Gophen M (2020) The Impact of Climate Change on the River Jordan-Lake Kinneret (Israel) Ecosystem. Jou EarSci&ClimChange: JESCC-105. DOI: 10.46715/jescc2020.10.1000105
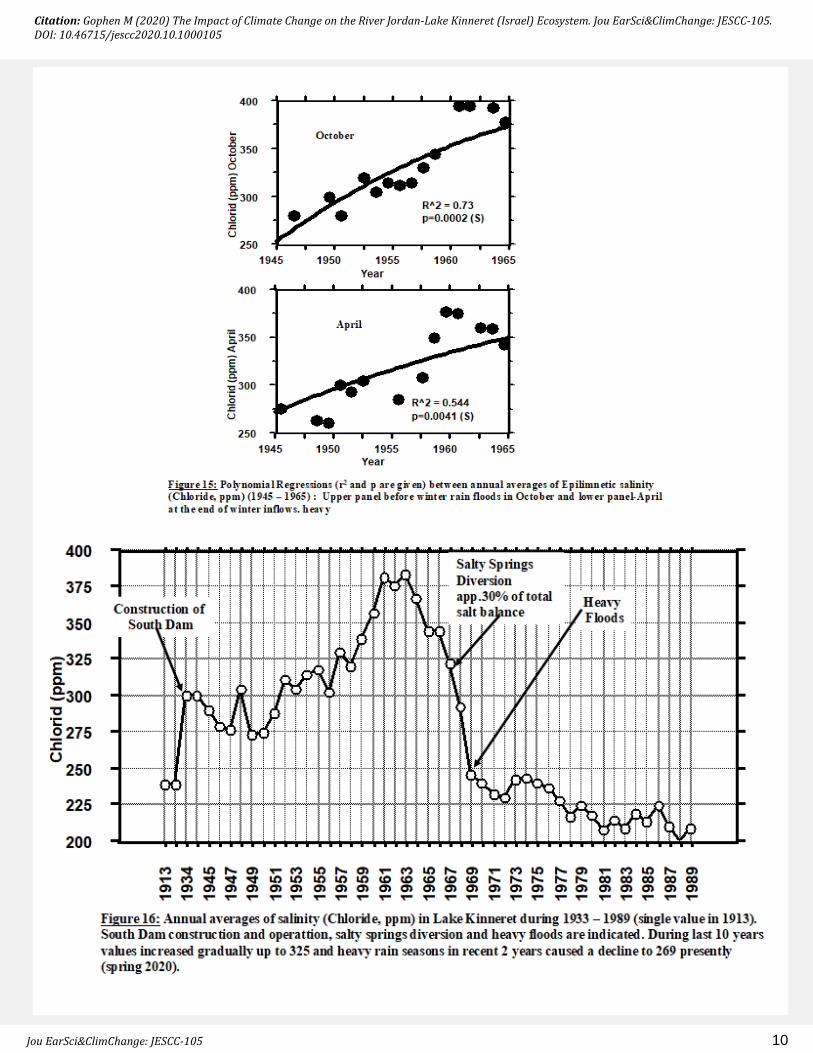
Salinity
Another aspect of long term Climate Change development was
the increased salinity of Lake Kinneret waters (as shown in
figures 15 &16.
The major supply of salt into the lake is fluxed through the lake
bottom through surface infiltration (superficial) and welling
up. Salts contribution through rivers and tributaries inflows
are much lower than the sub-lacustrine sources. Until late
1957 about 25% (total about 160000 tons) of salt input
influxed into the lake through the runoff of two hot-salty
springs located close to the north-western lake shoreline.
Those two springs were diverted (1967) and about 40,000
tons of salt were eliminated from the lake budget (Serruya
1978: Gvirzman 2002; Gophen and Gal 1992; Gophen 2016b,
2018 ;) [10, 14, 23, 37]. As a result lake water salinity declined
from 400 to 210 ppm Chloride. Results indicated that open
Dam operation enhanced water replacement (exchange)
(Gophen 2020a, b,c) [20, 21, 22] which is Residence Time
shortening and salinity decline. It is therefore recommended
to enhance water exchange (shorter Residence Time) through
open Dam or pumping regime to remove salt and other
pollutants (including biomass of Cyanobacteria (Figures 15,
16). Increase salinity might be favoured by Cyanobacteri
(Tonk et al 2007) [40].
Summary
Precipitation decline followed by headwater discharge
reduction caused high frequency of drought conditions
Temperature increase and dryness enhancement Increase of
negative trend of Kinneret Water Balance caused elevation of
lake water salinity the need for RT shortening became critical,
that is to say- water exchange enhancement is crucial
Future Perspectives Recommendations
A) Enhance Nitrogen input from the watershed (potential
source: Peat soil)
B) Reduce Phophorus inputs from the watershed
C) Enhance Water exchange i.e. shorter RT (potential
implementation: Withdraw through an open Dam; input
desalinized water).
D) Renovation of Fishery management: implement fishing
pressure on the most common zooplanctivore fishes, Bleaks,
enhance stocking of known efficient Cyanobacteria consumer,
Silver Carp (not reproduce in Lake Kinneret).
References
1. Fristachi A, Sinclair A, Sherwood Hall, Julie A Hambrook Berkman, Gregory L Boyer, et al. (2008) Chapter 3: Occurance of Cyanobacterial Harmful Algal Blooms Workshop Report 46-103.
2. Givati,A, D Rosenfeld (2007) Possible impacts of anthropogenic aerosols on water resources of the Jordan River and the Sea of Galilee/ Water Resour.Res 43: 1-15.
3. Givati A, Guillaume, D Rosenfeld, D Paz (2019) Climate change impacts on streanflow at the upper Jordan River based on an ensemble of regional climate models. Journal of Hydrology: Regional Studies 21: 92-109.
4. Gophen M (2014) Land-Use, Albedo and Air Temperature Changes in the Hula Valley (Israel) during 1946-2008. Open Journal of Modern Hydrology 4: 101-111.
5. Gophen M, M Meron, V Orlov-Levin, Y Tsipris (2014) Seasonal and spatial distribution of N & P substances in the Hula Valley (Israel) subterranean. Open Journal of Modern Hydrology 4: 121-131.
6. Gophen M (2015a) The Impact of Available Nitrogen Defficiency on Long-Term Changes in the Lake Kinneret Ecosystem. Open Journal of Ecology 5: 147-157.
7. Gophen M (2015b) Experimental study of the Aphanizomenon ovalisporum response to Nitrogen fertilization in the Sub-Tropical Eu–Meso-trophic Lake Kinneret (Israel).Open Journal of Ecology 5: 259-265.
8. Gophen M, M Meron, Y Tsipris, V Orlov-Levine, M Peres (2016) Chemical, Hydrological and Climatological Properties of Lake Agmon, Hula Valley (Israel), (1994-2006). Open Journal of Modern Hydrology 6: 8-18.
9. Gophen M (2016a) The Impact of EL-NIN O/Southern Oscillation (ENSO) on Fishery and Water Quality nin Lake Kinneret (Israel).Open Journal of Modern Hydrology 6: 43-50.
10. Gophen M (2016b) A review on Modeling of Kinneret Salinity with Practical Recommendations. Open Journal of Modern Hydrology 6: 129-139.
11. Gophen M (2016c) Limnological Changes in the Lake Kinneret (Israel) Ecosystem: The Beginning and its significance. Open Journal Of Hydrology 6: 140-150.
12. Gophen M (2017a) The Impact of Nitrogen and Phosphorus Dynamics on the Kinneret Phytoplankton: I: Cyanophytes-Peridinium Alternate. Open Journal of Modern Hydrology 7: 257-273.
13. Gophen M (2017b) The Impact of Nitrogen and Phosphorus Dynamics on the Kinneret Phytoplankton: II: Chlorophyta, Cyanophyta, Diatoms and Peridinium; Open Journal of modern Hydrology 7: 298-313.
14. Gophen M (2018) Ecological Research in the Lake Kinneret and Hula Valley (Israel) Ecosystems.Scientific Research Publishing 335.
15. Gophen M (2019a) Different Kinneret,Glilit Publisher and Migal, 158,p.(in Hebrew).
16. Gophen M (2019b) The Sinergistic Impact of Climate Change and Anthropogenic Management on the Lake Kinneret and Hula Valley Ecosystems. Chapter, in: Frontiers of Global Ecology Intechopen Limited ELSVIER) 1-18.
17. Gophen M (2019c) The Ecological outcome of Climate Change in Lake Kinneret – Thermal Pollution; Open Journal of Modern Hydrology 9: 89-102.
18. Gophen M (2019d) The Replacement of Peridinium by Cyanobacteria in Lake Kinneret (Israel): A Commentary Review, Open Journal Modern Hydrlogy 9: 161-177.
19. Gophen M (2019e) Relation Significance between Hydrological Residence Time and Phytoplankton Dynamics in Lake Kinneret (Israel). Open Journal of Ecology 9: 179-492.
20. Gophen M (2020a) Lake Kinneret (Israel) Dam Open Management dilemma: A commentary Review. Japan Journa Research 1: 1-5.
21. Gophen M (2020b) Climate and Water Balance Changes in the Kinneret Watershed: A review. Open Journal of Modern Hydrlogy 10: 21-29.
22. Gophen M, M. Meron, V Levin-Orlov, Y Tsipris, M Peres (2020) Climate Change, Regional Water Balance and Land Use POlicy, in the Watershed of Lake Kinneret (Israel).Open Journal of Ecology 10: 200-224.
23. Gvirzman H (2002) Israel Water Resources, Chapters in Hydrology and Environmental Sciences, Yad Ben-Zvi Press, Jerusalem 287.
Jou EarSci&ClimChange: JESCC-105 11
Citation: Gophen M (2020) The Impact of Climate Change on the River Jordan-Lake Kinneret (Israel) Ecosystem. Jou EarSci&ClimChange: JESCC-105. DOI: 10.46715/jescc2020.10.1000105
24. Guildford SJ, Hecky RE (2000) Total nitrogen, total phosphorus, and nutrient limitation in lakes and oceans: Is there a common relationship? Limnology and Oceanography 45: 1213-1223.
25. Hadas O, Pinkas R, Malinsky-Rushanski N, Nishri A, Kaplan A, et al. (2012) The invasion of diazotrophic cyanobacteria to Lake Kinneret (Sea of Galilee), Israel; Freshwater Biology, 57: 1214-1227.
26. Hadas O, A Kaplan, A. Sukenik (2015) Long-term changes in Cyanobacteria poipulations in Lake Knneret (Sea of Galilee), Israel,: an eco-physiological outlook. Life 5: 418-431.
27. Izydorczyk K, Jurzcak T, Wojtal-Frankiewicz, Skowron,A, Mankiewicz-Boczek, et al. (2008) Influence of abiotic and biotic factors on microcystin content in Microcystis aeruginos cells in a eutrophic temperate reservoir, Journal of Plankton Research 30: 393-400.
28. Joehnk K D, J Hausman, J Sharples, B Sommeijer, PM Visser, et al. (2008) Summer heat-waves promote blooms of harmful Cyanobacteria . Global Change Biology 14: 495-512.
29. Jensch A, Belerkuhnlein C (2008) Research frontier in climte change: Effects of extreme meteorological events on ecosystenms. Comptes Rendus Geoscience 340: 621-628.
30. Kosten S, Huszar VL M, Bercares E, Costa LS, Van-Donk, et al. (2012) Warmer climate boost cyanobacterial dominance in shallow lakes. Global Change Biology 18: 118-126.
31. LKDB, 1970-2018, Kinneret Limnological Laboratory, IOLR, Annual Reports.
32. McQueen DJ, Lean DR S (1987) Influence of water temperature and nitrogen to phosphorus ration the dominance of blue-green algae in lake St-George, Ontario. Canadian Journal of Fisheries and Aquatic Sciences 44: 598-604.
33. Nishri A (2014) Chapter 19.4.3. Atmospheric Sources: Dry Deposition (Dust), in: Lake Kinneret: Ecology and Management (T. Zohary, A. Sukenik, T. Berman and A. Nishri eds.) pp 341-346.
34. O`Neil JM., Davis TW, Burford MA, Gobler CJ (2012) The rise of harmful cyanobacteri blooms: The potential roles of eutrophication and climate change. Harmful Algae 14: 313-334.
35. Paerl HW, Huisman J (2008) Blooms like it hot. Science 320: 57-58.
36. Reichwaldt ES, Ghadouani A (2012) Effects of rainfall patterns on toxic cyanobacterial blooms in a changing climate: Between simplistic scenarios and complex dynamics. Water Research 46: 1372-14393.
37. Serruya C (1978) Lake Kinneret:Monographiae Biologicae Vol 32 Dr. W. Junk bv Publishers The Hague-Boston-London 501.
38. Serruya C, M Gophen, U Pollingher (1980) Carbon Flow Patterns and Ecosystem Management, Arch.Hydrobiol 88: 265-302.
39. Smith VH (1983) Low nitrogen to phosphorus ratio favor dominance by blue-green algae jn lake phytoplankton. Science 221: 669-671.
40. Tonk I, K Bosch, Visser PM, Huisman J (2007) Salt tolerance of the harmfl cyanobacterium Microcystis aeruginosa. Aquatic Microbial Ecology 46: 117-123.
41. Taranu ZE, Zurawell RW, Pick F, Gregory-Eaves I (2012) Predicting cyanobacteria dynamics in the face of clobal change: the importance of scale and environmental context. Global Change Biology 18: 3477-3490.
42. Toth LG, Padisak J (1986) Meteorological factors affecting the bloom of Anabaenopsis – Raciborskii Woloz (Cyanophyta, Hormogonales) in the shallow Lake Balaton, Hungary, Journal Plankton Research 8: 353-363.
43. Wu S, Wung S, Yang, H, Xie P, Ni L, Xu J (2008) Field studies on the environmental factors in controlling Microcystin production in the subtropical shallow lakes of the Yangtze River. Bulletin of Environmental Contamination and Toxicology 80: 329-334.
44. Gophen, M and I. Gal 1992; Lake Kinneret, Book; Defence Ministry and Kinneret Authority Publisher; 335 p.
Jou EarSci&ClimChange: JESCC-105 12
Copyright: ©2020 Gophen M. This is an open-access article distributed under the terms of the Creative Commons Attribution License,
which permits unrestricted use, distribution, and reproduction in any medium, provided the original author and source are credited.