journal of crystal growth - bunge...
TRANSCRIPT

Journal of Crystal Growth 444 (2016) 28–38
Contents lists available at ScienceDirect
Journal of Crystal Growth
http://d0022-02
n CorrE-m
journal homepage: www.elsevier.com/locate/jcrysgro
Image analysis of palm oil crystallisation as observed by hotstage microscopy
Peter D. Harrison a, Kevin W. Smith b, Krishnadath Bhaggan c, Andrew G.F. Stapley a,n
a Department of Chemical Engineering, Loughborough University, Loughborough, Leicestershire LE11 3TU, UKb Fat Science Consulting Ltd, Bedford, UKc Loders Croklaan B.V., Wormerveer, The Netherlands
a r t i c l e i n f o
Article history:Received 16 July 2015Received in revised form11 March 2016Accepted 12 March 2016
Communicated by: Y. FurukawaThis can be explained by the depletion of crystallisable material in the liquid phase, whereas direct
Available online 18 March 2016
Keywords:A1. Crystal morphologyA1. Growth modelsA1. NucleationA1. Optical microscopyA2. Growth from meltB1. Triacylglycerol
x.doi.org/10.1016/j.jcrysgro.2016.03.02648/& 2016 Elsevier B.V. All rights reserved.
esponding author. Tel.: þ44 1509 222525.ail address: [email protected] (A.G.F. S
a b s t r a c t
An image processing algorithm previously used to analyse the crystallisation of a pure fat (tripalmitin)has been applied to the crystallisation of a multicomponent natural fat (palm oil). In contrast to tri-palmitin, which produced circular crystals with a constant growth rate, palm oil produced speckledcrystals caused by the inclusion of entrapped liquid, and growth rates gradually decreased with time.
impingement of crystals (the basis of the Avrami equation) was less common. A theoretical analysiscombining this depletion with assuming that the growth rate is proportional to the supersaturation of acrystallisable pseudo-component predicted a tanh function variation of radius with time. This wasgenerally able to provide good fits to the growth curves. It was found that growth rate was a relativelymild function of temperature but also varied from crystal to crystal and even between different sides ofthe same crystal, which may be due to variations in composition within the liquid phase. Nucleation rateswere confirmed to vary approximately exponentially with decreasing temperature, resulting in muchgreater numbers of crystals and a smaller final average crystal size at lower temperatures.
& 2016 Elsevier B.V. All rights reserved.
1. Introduction
Palm oil is the world's most exported vegetable oil. It is a keycomponent in products ranging from soaps to margarine and isone of the few vegetable oils with high amounts of saturated fats,hence it is semi-solid at room temperature. It is typically fractio-nated into higher value products for specific applications in foods[1]. It is important to understand how palm oil crystallises withparticular reference to palm oil fractionation and palm oil appli-cations, but also in advancing our understanding of the crystal-lisation of fat systems in general. Previous studies of RBD palm oilcrystallisation have employed a variety of techniques includingDifferential Scanning Calorimetry (DSC) [2–4], light microscopy[5], X-ray Diffractometry (XRD) [6] or a combination of thesemethods, to build up information of polymorphic behaviour andcrystallisation kinetics.
Palm oil is a complex mixture of triacylglycerols (TAGs) whichcan be seen to crystallise into two distinct populations whenslowly cooled in a DSC [3,5,7], typically one in the range 30–20 °C(“high melting”) and the other below 15 °C (“low melting”). In
tapley).
addition to this, palm oil displays multiple polymorphic forms. Thepolymorphism of palm oil is most reliably determined from XRDexperiments, and is now reasonably well understood. Persmarkand co-workers [8], conducting XRD experiments, found theexistence of three polymorphs, which were named α, β1' and β2'.β1' was found when samples were cooled at a slow rate to 22 °C.β2' (which from Persmark's description could actually be a sub- αform) was formed from fast cooling to �15 °C (presumably from“low melting” TAGs), and α and β1′ at intermediate conditions.Another study [9] also found that small amounts of β (affectingonly a small proportion of TAGs) could co-exist with β', and thatboth were stable until melted. Some β forms were also found attemperatures below 0 °C, which were presumed to be due to thelow melting fractions. Isothermal XRD experiments (of particularrelevance to this study) were performed by Chen et al. [10] from287 to 295 K. They found that the α form formed initially forTo20 °C (reported as 293 K) but transformed to β' over time (ofthe order of 30 min). A “two stage” process was also evident fromviscosity vs time experiments. Further experiments using lightmicroscopy showed what appear to be β' spherulites growingaround an α core. As a consequence of this the authors discussedthe possibility that XRD data may not always provide a completepicture of the polymorphic state of a sample if a polymorph at thesurface is covering over a different polymorph underneath.

P.D. Harrison et al. / Journal of Crystal Growth 444 (2016) 28–38 29
The kinetics of palm oil crystallisation have also been studiedby a number of workers. Kawamura [2] performed isothermal DSCexperiments in the range 299–303 K from which Avrami fits tosolid fat content (SFC) vs time data were made. He then used lightmicroscopy to directly determine growth rates at these tempera-tures, and used the growth rate information to back-calculatenucleation rates from the Avrami fit constants. Ng and Oh [4]performed an Avrami fit over a wider range of temperatures butwithout additional growth rate measurements. Induction timedata have also been determined from DSC [5] and fitted toexpressions for nucleation rate although it is questionable to dothis as these represent physically distinct phenomena [11].
Recently, a method of analysing hot stage microscope images ofcrystallisation has been reported [12]. This automates the processby which crystals can be counted and size measurements made sothat data from a series of images containing potentially largenumbers of crystals can be relatively easily extracted and analysed.The method has so far been applied to tripalmitoyl-glycerol (alsoknown as tripalmitin) which is a pure TAG. The aim of this paper isto test whether the computer based method can be successfullyapplied to palm oil, and useful information regarding nucleationand growth extracted that may not be apparent by manualmethods.
2. Materials and methods
2.1. Palm oil
Palm oil was obtained from the Malaysian Palm Oil Board andused without further treatment. The composition as determinedby HPLC is given in Table 1 using the following method.
2.2. Compositional analysis by HPLC
TAG analysis was performed using an HPLC instrumentationsystem equipped with a Hewlett Packard HPLC binary pump sys-tem (model HP 1100 Series, Waldbronn, Germany), a variable loopinjector system, a column oven and an Agilent refractive indexdetector (Agilent 1100 Series, Waldbronn, Germany). TAGs wereseparated on two identical Waters Nova-Pak© C18 (Waters Corp.,Darmstadt, Germany) columns connected in series with columndimensions of 3.9 mm internal diameter by 300 mm length (each)and preloaded with silica with a particle size of 4 μm. Both col-umns were maintained at a temperature of 25 °C. The mobile
Table 1Composition of RBD palm oil as determined byHPLC (where O¼oleic, L¼ linoleic, M¼myristic,P¼palmitic and S¼stearic acids).
Component Area %
Others 5.29OLL 0.39PLL 2.27MLP 0.54OOL 2.00POL 10.54PLP 9.35MPP 0.44OOO 4.25POO 23.87POP 28.26PPP 4.79SOO 2.31POS 4.36PPS 0.87SOS 0.48
phase used was a mixture of HPLC-grade acetone (Fisher Scientific,Loughborough, UK) and HPLC-grade acetonitrile (Fisher Scientific,Loughborough, UK) in a volume-to-volume (v/v%) ratio of63.5:36.5 and the flow-rate was fixed at 1 mL/min. The injectionvolume was set to 10 μL of 5% (w/v) of oil in chloroform.Attenuation was fixed at 500�103 RI units and the refractiveindex detector was maintained at 35 °C. The total runtime for asingle injection was 130 min. Identification of TAGs was madebased on the retention time of TAG standards and by comparisonwith the literature. Peak integrations were carried out using theHPLC ChemStation integration software. Integrated peak areas ofTAGs and other minor components were normalised based on thetotal area of all peaks present in the chromatogram. Other minorcomponents such as MAGs and DAGs were not quantified indivi-dually and their concentrations were collocated together and theirtotal concentration expressed as ‘Others’. HPLC results wereexpressed in weight percentages (wt%) [13].
2.3. Hot stage microscopy
Optical microscopy experiments were carried out using a Lin-kam THMS600 variable temperature stage (Linkam Instruments,Tadworth, UK) with a Leitz (Diaplan) microscope coupled to aPixeLink PL-A662 digital camera (PixeLink, Ottawa, Canada) andLinksys 32 software data capture system (Linkam Instruments,Tadworth, UK).
The palm oil was first heated to 70 °C, and a small sample wasthen weighed on to a circular glass slide which was positioned ona hot plate at approximately 70 °C. Another cover slip was thenplaced concentrically on top of the drop to ensure a uniformthickness of the sample. A photograph was then taken of eachslide which was taken at such an angle as to clearly show all the oilon the slide. From this, the area of the palm oil sample was cal-culated by counting pixels (using image analysis) and using theknown area of the glass cover slip as a reference to convert pixelsto area. Such an approach allowed photographs taken at an obli-que angle to also be used as the angle would affect the view factorsof the cover-slip and the oil equally. The area of the oil combinedwith the mass of oil weighed on to the slide and an assumeddensity of 922 kg m�3 enabled the thickness of the oil sample tobe estimated. The sample was subsequently placed in the tem-perature stage, where it was heated to 70 °C and held for a mini-mum of 3 min. Thereafter the sample was cooled at a rate of30 °C min�1 to an isothermal holding temperature. Fast coolingwas achieved by passing liquid nitrogen through the stage. Images(1280�1024 pixels) were collected during the isothermal holdingperiod, observed via a 10� objective lens and captured auto-matically every 30–60 s (depending on the temperature andholding period) using Linksys software. The images were scaled bytaking an image of a graticule at the same magnification. Thetemperature was held at the isothermal holding temperature untilno further changes were easily discernible. Samples were thenheated at 1 °C min�1 to �70 °C to allow melting or polymorphictransformations to be visualised and held for 3 min before onceagain cooling to another isothermal temperature.
In the case of holding at 35 °C it was found that crystallisationwas possible within approximately 4 h, but that only a few crystalswould have formed over the entirety of the slide. A number ofattempts were made to catch the initial nucleation event but thesewere unsuccessful due to the very low probability of viewing therelevant area of the slide as the nucleation event occurs (only �1/100th of the total slide area is visible under the microscope at anyone time). Therefore, while the morphologies of these crystals canbe reported, the nucleation and growth data are not.

P.D. Harrison et al. / Journal of Crystal Growth 444 (2016) 28–3830
2.4. Image analysis
All image analyses were performed in MATLAB (The Math-works Inc, Natick, MA) using routines from the Image ProcessingToolbox, based on the method employed for tripalmitin crystal-lisation [12]. Some modifications to the method were made inresponse to the different morphologies observed in the crystal-lisation of tripalmitin and palm oil. Analyses were performed forexperiments with isothermal hold temperatures of 23 °C or higher.Temperatures below this were not analysed as crystals startednucleating before isothermal conditions were reached.
In contrast to tripalmitin, palm oil produced crystals with aspeckled appearance which made it more difficult for the algo-rithm to distinguish newly nucleated crystals against the back-ground noise as no one single speck would generally be suffi-ciently large by itself to reliably indicate a new crystal. However, acluster of speckles was usually obvious by eye (see the cluster ine.g. Fig. 1a). Thus a different approach for nucleation detection wasadopted which would be sensitive to the formation of clusters of“specks”. After initial thresholding of the image to produce abinary map, a transform was employed by which the number ofnon-zero pixels within a square (of 21 pixels x 21 pixels) centredon a given pixel was returned for that pixel. This was performedfor each pixel in the image and effectively returns a local “density”map of non-zero pixel counts within the immediate vicinity of apixel (see Fig. 1b). Then when the number of non-zero pixels in the21�21 square exceeds a threshold value (Fig. 1c) this triggers a“nucleation” in the crystalmap which is located at the maximumdensity pixel of the cluster (Fig. 1d). This method was found toprovide a more robust method for nucleation detection.
A second modification arose from finding that the red, greenand blue colours responded differently to the presence of a crystalspeck. Whereas the red and blue components of the images weremade darker by the presence of a crystal, the blue componentappeared brighter. Thus to give greater contrast, grayscale imageswere produced not from adding the red, green and blue compo-nents together but by adding the red and green components andsubtracting the blue.
An example of the running of the algorithm is shown in Fig. 2.Fig. 2a shows the raw image (the contrast of which has beenartificially enhanced for publication purposes). The crystals in theimage are “speckly” in nature (see Fig. 2a) and running the algo-rithm produces a corresponding “speckly” crystalmap (Fig. 2b).The coloured (non-black) regions can be thought of as approxi-mately representing the amount of solid in the crystals. To quan-tify the amount of space occupied by a crystal (including entrainedliquid) the internal cavities within the crystalmap need to be filledin. This can be achieved using the MATLAB dilation/erosion rou-tine, “imclose.m”. In this method each crystal is taken on its ownand grown by a certain number of pixels (in our case we chose 10
Fig. 1. Images showing sequence of events in algorithm to identify newly appeared nuclof non-zero pixels within a square surrounding each pixel position is returned at that pixand position of a new nucleus. The example is taken from a section of an image during
pixels). This would dilate (grow) the outer boundary but also theinternal boundaries which should grow into each other and dis-appear. The expanded boundaries would then be eroded back bythe same amount (10 pixels), which restores the exterior boundaryto its original position with some minor smoothing, but will havefilled in interior holes and exterior cracks. This produces a “filledmap” (see Fig. 2c). This map is used for the majority of subsequentcalculations (such as growth rate and crystal size). It was alsodecided to use the “unfilled” maps (e.g. Fig. 2b) to also estimatethe actual solid fat content by counting only the unfilled pixels.However, the “unfilled” maps generally became corrupted withnoise pixels over the course of adding dozens of images, so a“clean” version of the unfilled map was produced. This wasobtained by subtracting the current image from the very firstimage of the run, thresholding the result to produce a binary mapof current pixels and then using this as a mask over the filled mapto produce the new “clean” version (see Fig. 2d). It can be seen thatthis is a better representation of the crystals in Fig. 2a than Fig. 2b.
A fourth issue relates to the measurement of crystal radii forgrowth rate studies. The method used for tripalmitin [12] took theaverage radial position of all new growth pixels added with eachnew image. This worked well for tripalmitin which displayedapproximately constant growth rates. However, as will be shownlater, palm oil crystals’ growth slows down with time until almostno growth is observed. At this point very few, if any, growth pixelsare observed and the radial average values become more influ-enced by noise pixels. Instead, the radius was evaluated as theaverage radius of the furthermost pixels from the centre, thenumber of which was determined as that which would form abilayer of pixels at the circumference if the crystal were com-pletely circular (a bilayer gave more reliable results than amonolayer). This was performed using the “filled” crystalmaps e.g.Fig. 2c. The resulting radial values are shown graphically in Fig. 2e.It can be seen that, in many cases, the crystals do not form perfectcircles. Overlapping circles are caused by crystals nucleating closeto one another and growing into each other.
3. Results and discussion
3.1. Crystal morphology and polymorphism
Example images from the crystallisation of palm oil at varioustemperatures in the range 20–35 °C are shown in Fig. 3. Very welldefined spherulites are observed at 32 °C and 35 °C, but crystalsare more speckled at lower isothermal temperatures (down to26 °C). The spherulitic/needle morphologies were also observed byKawamura [2] at 30 °C (who tentatively ascribed them to the βpolymorph) and Chen et al. [10] at 28 °C. Chen et al., however,identified such crystals as belonging to the β' polymorph using
ei: (a) map showing “new” pixels, (b) result of transformation whereby the numberel, and (c) results of subsequent thresholding which is used to identify the existencecrystallisation at 30 °C. The image dimensions correspond to 120x120 microns.
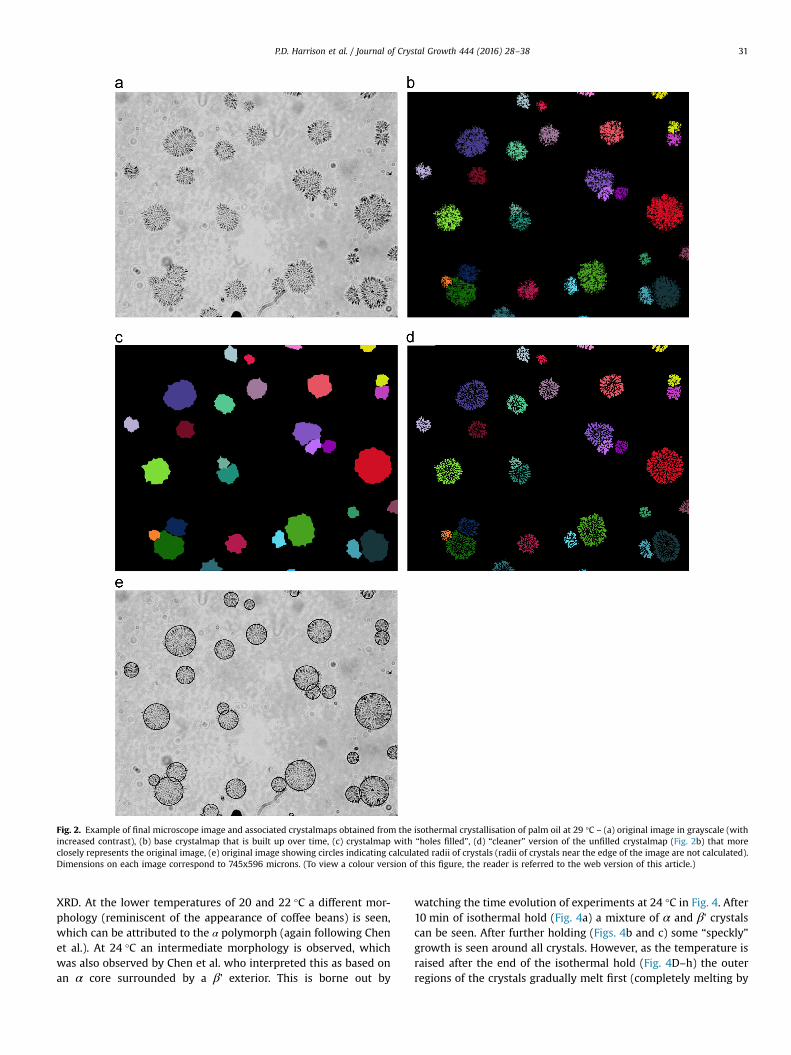
Fig. 2. Example of final microscope image and associated crystalmaps obtained from the isothermal crystallisation of palm oil at 29 °C – (a) original image in grayscale (withincreased contrast), (b) base crystalmap that is built up over time, (c) crystalmap with “holes filled”, (d) “cleaner” version of the unfilled crystalmap (Fig. 2b) that moreclosely represents the original image, (e) original image showing circles indicating calculated radii of crystals (radii of crystals near the edge of the image are not calculated).Dimensions on each image correspond to 745x596 microns. (To view a colour version of this figure, the reader is referred to the web version of this article.)
P.D. Harrison et al. / Journal of Crystal Growth 444 (2016) 28–38 31
XRD. At the lower temperatures of 20 and 22 °C a different mor-phology (reminiscent of the appearance of coffee beans) is seen,which can be attributed to the α polymorph (again following Chenet al.). At 24 °C an intermediate morphology is observed, whichwas also observed by Chen et al. who interpreted this as based onan α core surrounded by a β' exterior. This is borne out by
watching the time evolution of experiments at 24 °C in Fig. 4. After10 min of isothermal hold (Fig. 4a) a mixture of α and β' crystalscan be seen. After further holding (Figs. 4b and c) some “speckly”growth is seen around all crystals. However, as the temperature israised after the end of the isothermal hold (Fig. 4D–h) the outerregions of the crystals gradually melt first (completely melting by

Fig. 3. Images showing crystal morphology after holding at various isothermal hold temperatures: (a) 20 °C, (b) 22 °C, (c) 24 °C, (d) 26 °C, (e) 28 °C, (f) 30 °C, (g) 32 °C,(h) 35 °C. All images represent 120x120 microns.
Fig. 4. Images showing changes in crystal morphology at the following times during isothermal crystallisation at 24 °C: (a) 10 min, (b) 20 min and (c) 30 min; and thenfollowed by warming at 1 °C/min to (d) 36 °C, (e) 39 °C, (f) 42 °C, (g) 45 °C and (h) 47 °C. All images represent 120x120 microns.
P.D. Harrison et al. / Journal of Crystal Growth 444 (2016) 28–3832
42 °C) leaving the cores to melt finally around 45–48 °C (the 35 °Csample finishing melting at 48 °C). These core melting tempera-tures do not correspond to the melting of the α polymorph and sothese crystal cores must have transformed from α to either the β'or β polymorph during holding and/or melting. It is well estab-lished from XRD studies that polymorphic transitions readily occurfrom the α form under such conditions. However, a possibledrawback of XRD is that it may only observe the surface poly-morphism of crystals which may well differ from a core poly-morph hidden below the surface.
When crystals formed at temperatures in the range 26–35 °Cwere gradually warmed, they gradually reduced in size. This mightsuggest that the composition of the crystal changes with radial
position in the crystal (with higher melting TAGs towards thecentre), but it can also be explained by a general increase insolubility with temperature. All crystals were found to finally meltat temperatures above 42 °C (see Table 2), indicating that poly-morphic transformations occurred in all cases.
The speckled nature of all the crystals is in sharp contrast tothat seen during tripalmitin crystallisation, where well formedcircular crystals were formed with no internal cavities [12]. This isa consequence of crystallising from a pure melt. With palm oil atthese temperatures, a significant “low melting” fraction existswhich is unable to crystallise and must diffuse away from theinterface. It is apparent from the morphologies produced thatmuch of this uncrystallisable “solvent” fraction is unable to diffuse
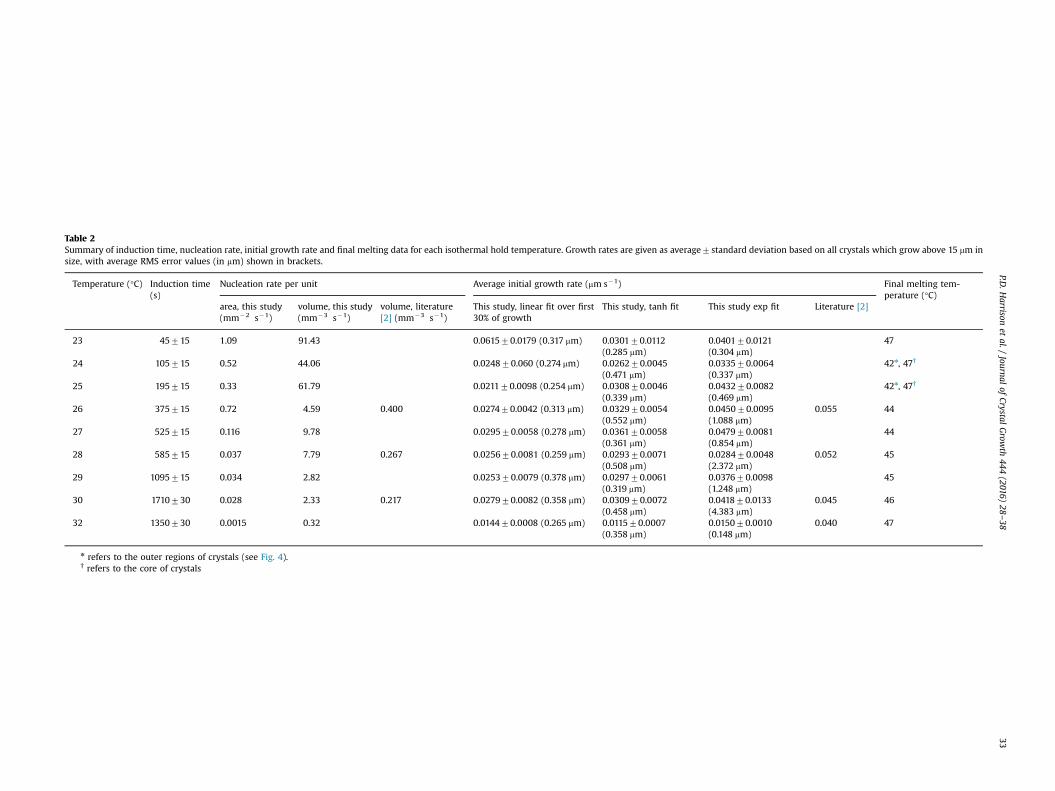
Table 2Summary of induction time, nucleation rate, initial growth rate and final melting data for each isothermal hold temperature. Growth rates are given as average7standard deviation based on all crystals which grow above 15 mm insize, with average RMS error values (in mm) shown in brackets.
Temperature (°C) Induction time(s)
Nucleation rate per unit Average initial growth rate (mm s�1) Final melting tem-perature (°C)
area, this study(mm�2 s�1)
volume, this study(mm�3 s�1)
volume, literature[2] (mm�3 s�1)
This study, linear fit over first30% of growth
This study, tanh fit This study exp fit Literature [2]
23 45715 1.09 91.43 0.061570.0179 (0.317 mm) 0.030170.0112(0.285 mm)
0.040170.0121(0.304 mm)
47
24 105715 0.52 44.06 0.024870.060 (0.274 mm) 0.026270.0045(0.471 mm)
0.033570.0064(0.337 mm)
42n, 47†
25 195715 0.33 61.79 0.021170.0098 (0.254 mm) 0.030870.0046(0.339 mm)
0.043270.0082(0.469 mm)
42n, 47†
26 375715 0.72 4.59 0.400 0.027470.0042 (0.313 mm) 0.032970.0054(0.552 mm)
0.045070.0095(1.088 mm)
0.055 44
27 525715 0.116 9.78 0.029570.0058 (0.278 mm) 0.036170.0058(0.361 mm)
0.047970.0081(0.854 mm)
44
28 585715 0.037 7.79 0.267 0.025670.0081 (0.259 mm) 0.029370.0071(0.508 mm)
0.028470.0048(2.372 mm)
0.052 45
29 1095715 0.034 2.82 0.025370.0079 (0.378 mm) 0.029770.0061(0.319 mm)
0.037670.0098(1.248 mm)
45
30 1710730 0.028 2.33 0.217 0.027970.0082 (0.358 mm) 0.030970.0072(0.458 mm)
0.041870.0133(4.383 mm)
0.045 46
32 1350730 0.0015 0.32 0.014470.0008 (0.265 mm) 0.011570.0007(0.358 mm)
0.015070.0010(0.148 mm)
0.040 47
n refers to the outer regions of crystals (see Fig. 4).† refers to the core of crystals
P.D.H
arrisonet
al./Journal
ofCrystal
Grow
th444
(2016)28
–3833
P.D. Harrison et al. / Journal of Crystal Growth 444 (2016) 28–3834
away fast enough to avoid becoming trapped by crystal growtharound it – giving rise to the speckly morphology. In the micro-scope slide environment there are likely to be few convectioncurrents and so mass transfer would be almost purely by diffusion.The situation, however, is likely to be different in a stirred tank orother flow environment where the “solvent” molecules may havea better chance to be transported away from the crystal surfacebefore becoming entrapped.
The non-circular nature of some crystals (see Fig. 2d) also sug-gests that non-uniformities in composition of the liquid phase arisedue to differences in the extent of crystallisation locally, givingdifferent growth rates in different directions. So the liquid phasecannot be considered to be fully mixed in these experiments.
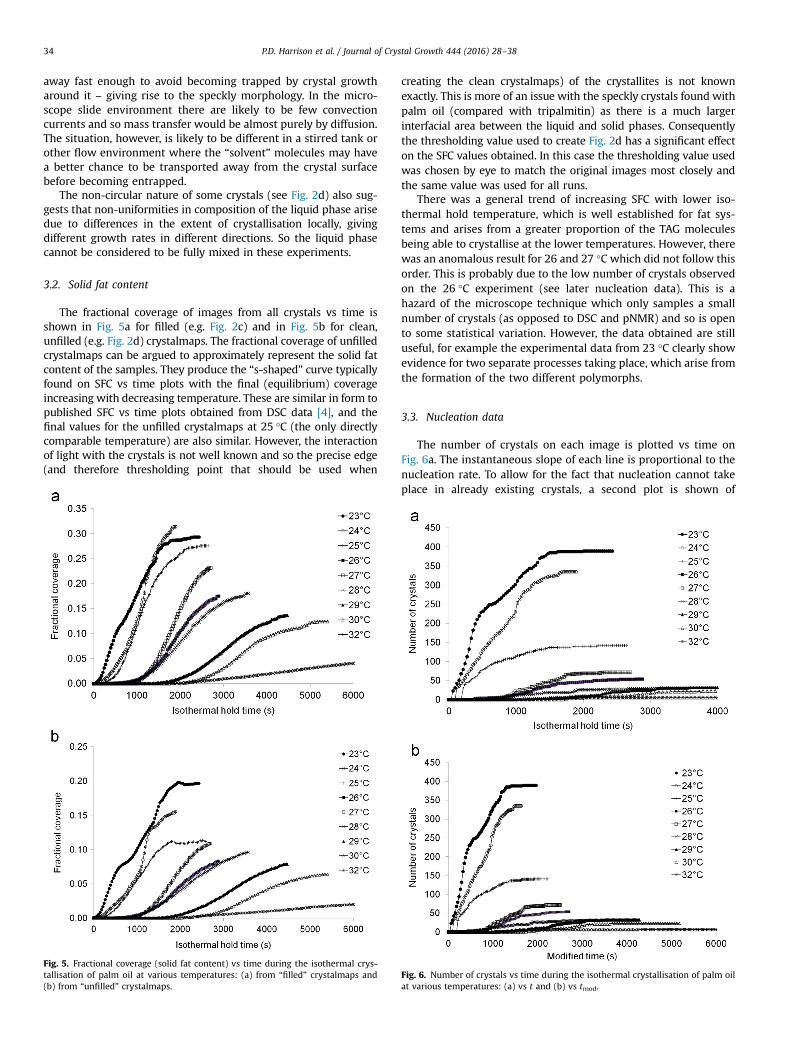
3.2. Solid fat content
The fractional coverage of images from all crystals vs time isshown in Fig. 5a for filled (e.g. Fig. 2c) and in Fig. 5b for clean,unfilled (e.g. Fig. 2d) crystalmaps. The fractional coverage of unfilledcrystalmaps can be argued to approximately represent the solid fatcontent of the samples. They produce the “s-shaped” curve typicallyfound on SFC vs time plots with the final (equilibrium) coverageincreasing with decreasing temperature. These are similar in form topublished SFC vs time plots obtained from DSC data [4], and thefinal values for the unfilled crystalmaps at 25 °C (the only directlycomparable temperature) are also similar. However, the interactionof light with the crystals is not well known and so the precise edge(and therefore thresholding point that should be used when
Fig. 5. Fractional coverage (solid fat content) vs time during the isothermal crys-tallisation of palm oil at various temperatures: (a) from “filled” crystalmaps and(b) from “unfilled” crystalmaps.
creating the clean crystalmaps) of the crystallites is not knownexactly. This is more of an issue with the speckly crystals found withpalm oil (compared with tripalmitin) as there is a much largerinterfacial area between the liquid and solid phases. Consequentlythe thresholding value used to create Fig. 2d has a significant effecton the SFC values obtained. In this case the thresholding value usedwas chosen by eye to match the original images most closely andthe same value was used for all runs.
There was a general trend of increasing SFC with lower iso-thermal hold temperature, which is well established for fat sys-tems and arises from a greater proportion of the TAG moleculesbeing able to crystallise at the lower temperatures. However, therewas an anomalous result for 26 and 27 °C which did not follow thisorder. This is probably due to the low number of crystals observedon the 26 °C experiment (see later nucleation data). This is ahazard of the microscope technique which only samples a smallnumber of crystals (as opposed to DSC and pNMR) and so is opento some statistical variation. However, the data obtained are stilluseful, for example the experimental data from 23 °C clearly showevidence for two separate processes taking place, which arise fromthe formation of the two different polymorphs.
3.3. Nucleation data
The number of crystals on each image is plotted vs time onFig. 6a. The instantaneous slope of each line is proportional to thenucleation rate. To allow for the fact that nucleation cannot takeplace in already existing crystals, a second plot is shown of
Fig. 6. Number of crystals vs time during the isothermal crystallisation of palm oilat various temperatures: (a) vs t and (b) vs tmod.
P.D. Harrison et al. / Journal of Crystal Growth 444 (2016) 28–38 35
number of crystals vs a modified time variable defined:
tmod ¼Z t
tindXL dt ð1Þ
where XL is the fractional liquid coverage. The reader is directed toStapley et al. (2009) for the derivation of this variable. Here, achoice needs to be made between using unfilled or filled crystal-maps for evaluating the fractional liquid coverage. We have chosento use the filled crystalmaps based on the principle that nucleationof a new crystal is impossible within a filled region.
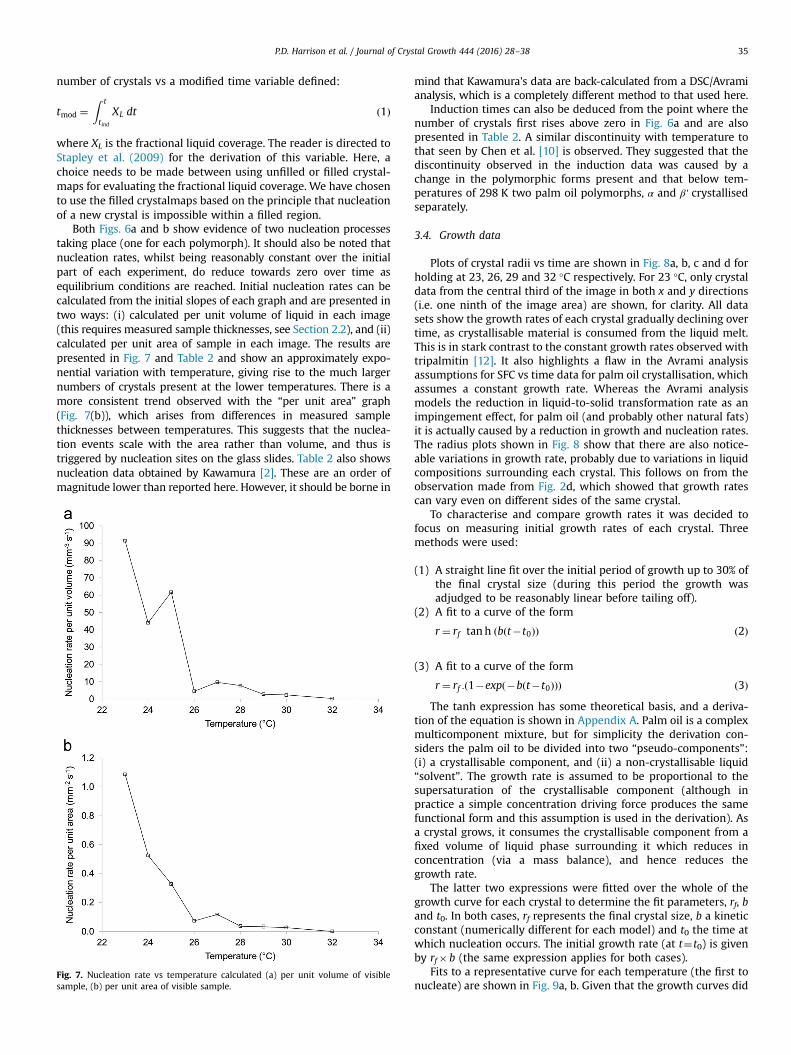
Both Figs. 6a and b show evidence of two nucleation processestaking place (one for each polymorph). It should also be noted thatnucleation rates, whilst being reasonably constant over the initialpart of each experiment, do reduce towards zero over time asequilibrium conditions are reached. Initial nucleation rates can becalculated from the initial slopes of each graph and are presented intwo ways: (i) calculated per unit volume of liquid in each image(this requires measured sample thicknesses, see Section 2.2), and (ii)calculated per unit area of sample in each image. The results arepresented in Fig. 7 and Table 2 and show an approximately expo-nential variation with temperature, giving rise to the much largernumbers of crystals present at the lower temperatures. There is amore consistent trend observed with the “per unit area” graph(Fig. 7(b)), which arises from differences in measured samplethicknesses between temperatures. This suggests that the nuclea-tion events scale with the area rather than volume, and thus istriggered by nucleation sites on the glass slides. Table 2 also showsnucleation data obtained by Kawamura [2]. These are an order ofmagnitude lower than reported here. However, it should be borne in
Fig. 7. Nucleation rate vs temperature calculated (a) per unit volume of visiblesample, (b) per unit area of visible sample.
mind that Kawamura's data are back-calculated from a DSC/Avramianalysis, which is a completely different method to that used here.
Induction times can also be deduced from the point where thenumber of crystals first rises above zero in Fig. 6a and are alsopresented in Table 2. A similar discontinuity with temperature tothat seen by Chen et al. [10] is observed. They suggested that thediscontinuity observed in the induction data was caused by achange in the polymorphic forms present and that below tem-peratures of 298 K two palm oil polymorphs, α and β' crystallisedseparately.
3.4. Growth data
Plots of crystal radii vs time are shown in Fig. 8a, b, c and d forholding at 23, 26, 29 and 32 °C respectively. For 23 °C, only crystaldata from the central third of the image in both x and y directions(i.e. one ninth of the image area) are shown, for clarity. All datasets show the growth rates of each crystal gradually declining overtime, as crystallisable material is consumed from the liquid melt.This is in stark contrast to the constant growth rates observed withtripalmitin [12]. It also highlights a flaw in the Avrami analysisassumptions for SFC vs time data for palm oil crystallisation, whichassumes a constant growth rate. Whereas the Avrami analysismodels the reduction in liquid-to-solid transformation rate as animpingement effect, for palm oil (and probably other natural fats)it is actually caused by a reduction in growth and nucleation rates.The radius plots shown in Fig. 8 show that there are also notice-able variations in growth rate, probably due to variations in liquidcompositions surrounding each crystal. This follows on from theobservation made from Fig. 2d, which showed that growth ratescan vary even on different sides of the same crystal.
To characterise and compare growth rates it was decided tofocus on measuring initial growth rates of each crystal. Threemethods were used:
(1) A straight line fit over the initial period of growth up to 30% ofthe final crystal size (during this period the growth wasadjudged to be reasonably linear before tailing off).
(2) A fit to a curve of the form
r¼ rf tan h b t�t0ð Þð Þ ð2Þ
(3) A fit to a curve of the form
r¼ rf : 1�exp �b t�t0ð Þð Þð Þ ð3ÞThe tanh expression has some theoretical basis, and a deriva-
tion of the equation is shown in Appendix A. Palm oil is a complexmulticomponent mixture, but for simplicity the derivation con-siders the palm oil to be divided into two “pseudo-components”:(i) a crystallisable component, and (ii) a non-crystallisable liquid“solvent”. The growth rate is assumed to be proportional to thesupersaturation of the crystallisable component (although inpractice a simple concentration driving force produces the samefunctional form and this assumption is used in the derivation). Asa crystal grows, it consumes the crystallisable component from afixed volume of liquid phase surrounding it which reduces inconcentration (via a mass balance), and hence reduces thegrowth rate.
The latter two expressions were fitted over the whole of thegrowth curve for each crystal to determine the fit parameters, rf, band t0. In both cases, rf represents the final crystal size, b a kineticconstant (numerically different for each model) and t0 the time atwhich nucleation occurs. The initial growth rate (at t¼t0) is givenby rf� b (the same expression applies for both cases).
Fits to a representative curve for each temperature (the first tonucleate) are shown in Fig. 9a, b. Given that the growth curves did

Fig. 8. Calculated radii vs time for crystal growth at (a) 23 °C, (b) 26 °C, (c) 29 °C, and (d) 32 °C.
P.D. Harrison et al. / Journal of Crystal Growth 444 (2016) 28–3836
show some fluctuations in places, the equations generally fittedthe data well, particularly at the higher temperatures. At lowertemperatures (particularly 23 °C), the curves sometimes did not fitthe earliest data points very well. This is attributed to poly-morphism, as initially the α form grows relatively quickly but thisthen gives way to a slower growing β' form. It is perhaps unrea-listic to expect such a change in kinetics to be captured by thesingle equation, unless it is fitted in a piecewise fashion over singlepolymorph ranges. A later curve from 23 °C is also shown onFig. 9a and clearly shows an initial jump (due to the α polymorphgrowth), which is again not captured by the tanh or exponentialequations. It can be seen that the gradient of this jump is similar tothe gradient of the straight line fit from the earlier curve at 23 °C.
The fitted growth data are shown in Table 2 and Fig. 10. Theseare the average and standard deviations of fits to crystals thatultimately grow larger than 15 mm in radius. Also shown inbrackets are the averages of the RMS error values for each fit type.The following observations can be made:
1. The error bars (standard deviations) are quite large in relation tothe average growth rates, and reflects the inherent variability ofgrowth rates between crystals.
2. The different fit expressions gave different results, with linearfits generally giving the lowest values and exponential fits thehighest values. There is a tendency for linear fits to under-estimate growth rates as they do not represent the very initialgrowth period (i.e. a tangent to the growth curve at nucleation),but rather an average growth rate over a period where therewill be some reduction (if small) of growth rate. On the otherhand, visual inspection showed the tanh and exponentialfunctions to sometimes overestimate initial growth rates onsome occasions.
3. The tanh curves overall tend to give better fits than the expo-nential curves, judging by the lower RMS error values. They alsoyielded smaller standard deviations. The linear fits gave thesmallest RMS values but it should be recognised that these areonly based on a small part of the data and not the whole curve.
4. The variation with temperature appears relatively modest and iswithin the range of the error bars. There are two exceptions:32 °C which gave much smaller growth rates than other tem-peratures, and 23 °C in which the linear fit (α polymorph) gavea much higher value.
5. Growth rates were approximately half those reported byKawamura [2]. There may be two reasons for this. Firstly, amanual method used by Kawamura may have naturally selectedthe fastest growing crystals. Secondly, the palm oil itself may bedifferent in composition. So it is possible that the Kawamurasample may have had, for example, a higher tripalmitin content,which could have led to higher growth rates and nucleation athigher temperatures.
3.5. Crystal size distributions
The automated analysis allows a calculation of crystal sizedistributions which are presented in Fig. 11 for the endpoint ofeach isothermal hold. This clearly shows the general trend ofsmaller average crystal size as temperatures are reduced which is aconsequence of the faster nucleation rates relative to growth rates.
4. Conclusions
This study has successfully demonstrated that it is possible toextract nucleation and growth rate data from a series of lightmicroscope images showing crystallisation of the natural fat palm

Fig. 9. Fits of representative curves at each temperature to linear (over first part ofeach curve, dot-dash line), tanh (solid line) and exponential expressions (dashedline), for (a) 23 °C (example “early” and “late” curves), 24 °C, 25 °C, 26 °C, and(b) 27 °C, 28 °C, 29 °C, 30 °C and 32 °C.
Fig. 10. Growth rates vs temperature obtained from different fit methods. Errorbars show standard deviations based on different crystals analysed.
Fig. 11. Final cumulative crystal size distribution at each temperature. The radialvalues used for each crystal correspond to a circle of the same area of the crystal.
P.D. Harrison et al. / Journal of Crystal Growth 444 (2016) 28–38 37
oil. This used an image processing algorithm adapted from thatused on the pure fat tripalmitin [12]. The amount of potentiallycrystallisable material can be judged from final values of solid fatcontent which can be calculated from “unfilled” crystalmaps,although this is not a precise determination. The speckled natureof the β' crystals suggests that uncrystallisable material is not ableto diffuse away fast enough from the crystal surface to avoidbecoming entrapped within the crystal as it grows around it.
A strength of the microscopy technique is the ability to viewthe morphology of crystals, which in some cases appear to consistof a mixture of polymorphs (e.g. at 23 °C, 24 °C and 25 °C) with anα core and a β' exterior. However, the α core must then transformto a higher polymorph at some point as it melts at similar tem-peratures to other β' crystals. As mentioned by Chen et al. [10], thistype of observation may not be observable by XRD which mostlyprobes the surface regions of crystals.
From growth curves, it can be seen that there are variations ofgrowth rate between crystals at a given time and between differ-ent sides of the same crystal, which may be a consequence ofimperfect mixing within the melt. This is not altogether unsur-prising given that the only mechanism of mixing in this system islikely to be molecular diffusion. It was also observed that thegrowth rate of a crystal slows during crystallisation, which is aconsequence of the depletion of crystallisable matter as timeproceeds. A theoretical analysis of the growth curves was per-formed assuming that growth rates are proportional to thesupersaturation of a crystallisable pseudo-component from a fixedvolume of a well mixed pool of liquid surrounding each crystal.This predicted a tanh function variation of radius with time, whichwas able to provide good fits to most data. The main exceptionswere at lower temperatures (e.g. 23 °C), which showed an initiallyfast period of growth, corresponding to growth of the α poly-morph, followed by slower growth of the β’ polymorph. Apartfrom that, and the very highest temperature (32 °C), it appearedthat growth rates were relatively insensitive to temperature,which was in contrast to nucleation rates which were a strongfunction of temperature.
Acknowledgement
We would like to thank Dr. Bill MacNaughtan, University ofNottingham for use of the microscope and Linkam facilities.
Appendix A
The growth rate is assumed to be proportional to the absolutesupersaturation of crystallisable components (which are lumpedinto a single pseudo-component)
drdt
¼ k c�cf� � ðA:1Þ
where c is concentration of crystallisable components in the liquidphase surrounding a crystal, and cf is the corresponding concentration
P.D. Harrison et al. / Journal of Crystal Growth 444 (2016) 28–3838
at equilibrium (final concentration). The analysis can also be per-formed using a relative supersaturation driving force, i.e.
drdt
¼ k0c�cf� �
cfðA:2Þ
However, for isothermal experiments, cf can be regarded as aconstant and so there is no practical difference between using thetwo expressions (apart from a differently defined kinetic constantk’').
As the crystal forms, the average concentration of crystallisablecomponents in the surrounding liquid phase reduces. This can bequantified via a mass balance. It is assumed here that there is afixed volume of liquid surrounding the crystal that contributes tothe growth of the crystal and no other crystals*. This is assigned aninitial radius R, and so for unit depth the volume of this liquid isπR2. At any given time the total mass (M) of crystallisable com-ponents (liquid and solid) is given by,
M¼ πR2cþπr2cs ðA:3ÞWhere r is the radius of the crystal and cs the overall concentration
of crystallisable components within this radius (including trapped orentrained liquid).
At equilibrium, the equivalent expression is,
M¼ πR2cf þπr2f cs ðA:4ÞWhere rf is the final crystal radius.Equating the two masses (Eqs. (A.3) and (A.4)) gives,
πR2cþπr2cs ¼ πR2cf þπr2f cs ðA:5ÞRearranging gives,
c�cf ¼cs r2f �r2� �
R2 ðA:6Þ
Insert into A.1,
drdt
¼ k c�cf� �¼ kcs r2f �r2
� �R2 ðA:7Þ
Rearrange,
R2
r2f �r2� �dr¼ kcsdt ðA:8Þ
Integrate,Z r
0
R2
r2f �r2� �dr¼ Z t
t0kcs dt ðA:9Þ
R2
rftanh�1 r
rf
� �" #r
0
¼ kcst� t
t0ðA:10Þ
R2
rftanh�1 r
rf
� �¼ kcs t�t0ð Þ ðA:11Þ
Finally,
rrf¼ tanh
rfR2kcs t�t0ð Þ
� �ðA:12Þ
The general fit expression is therefore of the form
r¼ A tanh B t�Cð Þð Þ ðA:13Þ
A¼ rf ; B¼ rfR2kcs; C ¼ t0
The initial growth rate can be calculated via Eq. (A.7) and set-ting r¼0, giving,
drdt
r ¼ 0
¼kcsr2fR2 ¼ AB
ðA:14Þ
Note that it is not possible to calculate the value of k from thefit parameters.
* The assumption of a constant volume of liquid associated withthe growth of a crystal does not represent a true mass balance asthe volume of this liquid will decrease as the crystallisable com-ponents are removed from it. It is possible to perform a “true”mass balance whereby the total system volume (solid crystal plusliquid that feeds it, i.e. πR2þπr2f ) is conserved. A similar derivationmethod to the above yields the following expression:
t ¼ rkcs
þR2�r2f
� �kcsrf
tanh�1 rrf
� �ðA:15Þ
This expression therefore requires the data to be plotted as t vsr. However, it is very difficult to perform fits with this equationdue to the presence of the singularity in the tanh�1 function atr¼rf. For this reason Eq. (A.15) was not used.
References
[1] R.E. Timms, Fractional crystallisation - the fat modification process for the 21stcentury, Eur. J. Lipid Sci. Technol. 107 (2005) 48–57.
[2] K. Kawamura, DSC thermal-analysis of crystallisation behavior in palm oil, J.Am. Oil Chem. Soc. 56 (1979) 753–758.
[3] K. Kawamura, DSC thermal-analysis of crystallisation behavior in palm oil, J.Am. Oil Chem. Soc. 57 (1980) 48–51.
[4] W.L. Ng, C.H. Oh, A kinetic-study on isothermal crystallisation of palm oil bysolid fat-content measurements, J. Am. Oil Chem. Soc. 71 (1994) 1135–1139.
[5] W.L. Ng, A study of the kinetics of nucleation in a palm oil melt, J. Am. OilChem. Soc. 67 (1990) 879–882.
[6] Ü. Riiner, Investigation of the polymorphism of fats and oils by temperatureprogrammed X-ray diffractometry, Lebensm -Technol. 3 (1970) 101–106.
[7] O. Zaliha, C.L. Chong, C.S. Cheow, A.R. Norizzah, M.J. Kellens, Crystallisationproperties of palm oil by dry fractionation, Food Chem. 86 (2004) 245–250.
[8] U. Persmark, K.A. Melin, P.O. Stahl, Palm oil, its polymorphism and solidifica-tion properties, Riv. Ital. Sostanze Grasse 53 (1976) 301–306.
[9] C.L. Chong, Z. Kamarudin, P. Lesieur, A. Marangoni, C. Bourgaux, M. Ollivon,Thermal and structural behaviour of crude palm oil: crystallisation at veryslow cooling rate, Eur. J. Lipid Sci. Technol. 109 (2007) 410–421.
[10] C.W. Chen, O.M. Lai, H.M. Ghazali, C.L. Chong, Isothermal crystallisationkinetics of refined palm oil, J. Am. Oil Chem. Soc. 79 (2002) 403–410.
[11] C. Himawan, V.M. Starov, A.G.F. Stapley, Thermodynamic and kinetic aspects offat crystallisation, Adv. Colloid Interface Sci. 122 (2006) 3–33.
[12] A.G.F. Stapley, C. Himawan, W. MacNaughtan, T.J. Foster, A computationalmethod for extracting crystallisation growth and nucleation rate data from hotstage microscope images, Cryst. Growth Des. 9 (2009) 5061–5068.
[13] W.W. Christie, Chromatographic analysis of lipids: general principles, in: LipidAnalysis: Isolation, Separation, Identification and Structural Analysis of Lipids,The Oily Press, an imprint of PJ Barnes and Associates, Bridgewater, UK, 2003.