journal of american science 2013;9(6) ... · a system dynamics approach to water demand management,...
TRANSCRIPT

Journal of American Science 2013;9(6) http://www.jofamericanscience.org
76 http://www.jofamericanscience.org [email protected]
A System Dynamics Approach to Water Demand Management, Case Study of Tajan Basin
1 Younes Nazari,
2 Hamid Amadeh,
3Mahdi Goldani,
4Mehdi Zamanipor
1. M.S. Student of commerce Management, Allameh Tabatabae'i University
2 Assistant Professor, Faculty of Economics, Allameh Tabatabae'i University 3 Ph.D. Student, Faculty of Economics, Allameh Tabatabae'i University
4 Ph.D. Student, Department of Industrial Engineering, Arizona University
Abstract: Recently Iranian government planned to eliminate subsidies in order to manage consumption and allocation of natural resources. Thus, a cashing subsidy payment system has been applied since end of 2010. In first stage, subsidy removal of different kinds of energy and resources like water were considered. Government's plan was to pay cash subsidies directly to consumers. In this paper, we focused on the consequences of removing water subsidy in Tajan basin, an area in the north of Iran. We modeled different ways of water supply and demand in Tajan basin by system dynamics approach. In fact, we tried to show the effects of subsidy removal policy in municipal demand of water in Tajan and examined two kinds of implementing this policy. In the first strategy, water price is increased smoothly over modeling horizon which is considered to be 24 months. While in the second one, price is increased suddenly in the first month, exactly similar to the way the government has done. We designed third strategy in which no subsidy elimination happens and prices increase according to inflation. A water surplus indicator was considered for comparing these strategies which was calculated by decreasing water supply from its demand. First strategy was shown to be best one. [Younes Nazari, Hamid Amadeh, Mahdi Goldani, Mehdi Zamanipor. A System Dynamics Approach to Water Demand Management, Case Study of Tajan Basin. J Am Sci 2013;9(6):76-87]. (ISSN: 1545-1003). http://www.jofamericanscience.org. 10 Keywords: System Dynamics, Water Resource, Demand Management Introduction
Iran is one of the richest countries in natural resources and one of the few countries that different seasons can be seen in its various geographical regions. Unfortunately Iran water resources are scarce. Mean rainfall in Iran is 255 mm, one third of globe mean. Besides distribution of water resources in Iran is very unequal. Most area in north of Iran have good rainfall and surface water resources. But central and south and east of Iran have limit water resources and most of water supply in these regions gathered from underground water resources. Because of these reasons optimal water usage and allocation is very important in most of regions in Iran. One of most problematic situation is that in Iran most part of government attention and planning is specified to water supply management, although we have some huge problems in water demand management.
Managing these natural resources in order to become useful for people is a time consuming procedure needs a huge amount of capital and a precise planning. Taxes and subsidies are two types of methods help government handle it.
A subsidy (also known as a subvention) is a form of financial assistance paid to a business or a specific economic sector. Many of the goods or services cost much more than its price. This matter as expected isn't a suitable way for preparing a general
welfare for people in a long time because of different reasons such as restricted natural resource and considering needs of future generations. Besides this situation will distort resource prices which non optimal allocation of resources would be one of its consequences.
So, Iran's government decided to remove subsidies and bring back the real price of resources from the beginning of 2011. Good experience in fuel rationing in 2008 and devastating condition after global sanction against Iran were major reasons obliged the government to plan this economical surgery.
As the first stage of this program, different kinds of energy and public needs like water were considered. One of the most important questions that may be asked in this regard is strategy of increasing the price of water to implement the policy. Since these goods have a vital role in the life of people, increasing of their prices should be done carefully. It must be determined that how much increases should be done in a specific period. This is exactly what we are seeking in this paper.
In this paper, we focused on the consequences of removing water subsidy in Tajan, an area in the north of Iran. By modeling different sources of water supplies and demands in Tajan, we design a system dynamics model. The main water source in Tajan is

Journal of American Science 2013;9(6) http://www.jofamericanscience.org
77 http://www.jofamericanscience.org [email protected]
rivers and one of the vital demand sections is municipal demand. We tried to show the effects of cashing subsidy policy in municipal demand of water in Tajan. Three pricing strategies developed. In the first strategy, water price is increased smoothly over modeling periods which is considered to be 24 months. While in the second one, price is increased suddenly in the first month, exactly similar to what the government has done. In the last one, we considered situations in which no elimination happens and the price increases according to its regular inflation. A water surplus indicator was considered for comparing these strategies which was calculated by decreasing water supply from its demand.
According to local observation, as a critical and important assumption, we assumed that the most important demand section that is affected by cashing subsidy policy for water in Tajan, was municipal demand and other sections such as industrial and agricultural demand were not affected very much by implementing this policy.
In the next sections of this paper, first we will mention the main characteristics of the study area and depicted a general view of Tajan basin. Then the problem is explained and a model is developed by the concepts of system dynamics for this problem. We tried to describe our model by using causal diagrams. In the third section, flow diagrams are designed and their features are explained.
Study Area In this paper, we concentrate on supply and
demand of water in a specific area in Iran. Tajan is an area in the North of Iran with about 460000 inhabitants and at list 60 percent of them work on farms. Cashing subsidies policy in this area, certainly effects on people in obviating their daily water needs.
Tajan area is more than 90940 hectare. It is bounded from east to Neka river, west to Siyahrood river, north to Caspian sea and south to Elborz mountains.This system is in 53o 15' to 52o 53' of geographical longitude and 36o 25' to 36o 50' of latitude and is contained of some important cities such as Sari, center of Mazandaran province, Neka, one of the biggest center of electricity generation in Iran and Ghaemshahr, one of the most important commercial city in north of Iran. Its fertile soil and good raining makes a proper situation for growing different crops such as water melon, peach, orange and specially rice. Different industries are also located in this area like milk and meat producers. So, this system is important from several agricultural, industrial and population-based aspects.
A lot of small and some big rivers are flowing in this system, but four of them are more important than others. These rivers are: Tajan, Darabkola, Syahrood and Neka that are shown in Figure 1. In this figure, the boundaries of Tajan are obviously illustrated.
Figure 1. Map of Tajan.
What we tried to show was the effects of cashing water subsidies on surplus supply of water in Tajan system in a planning interval which was 24 months. We divided the planning horizon into months and calculated the surplus supply water indicator for each month by implementing each of three strategies. These strategies are dicussed below.
Journal of American Science 2013;9(6) http://www.jofamericanscience.org
78 http://www.jofamericanscience.org [email protected]
1. Model Description
As we explained in the introduction, we wanted to develop a system dynamics model to simulate surplus supply water according to different sources of water supply and by considering the changes in amount of demand of different sections which have happened because of increasing in water price according to governmental new policy in cashing water subsidy in Tajan.
Subsystems
There are two main subsystems in our model which are supply and demand. Each of them has specific features are explained here. Supply
As we wanted to assess the effect of cashing subsidies in surplus water in municipal demand section, at first we should find the source of water supply in Tajan.
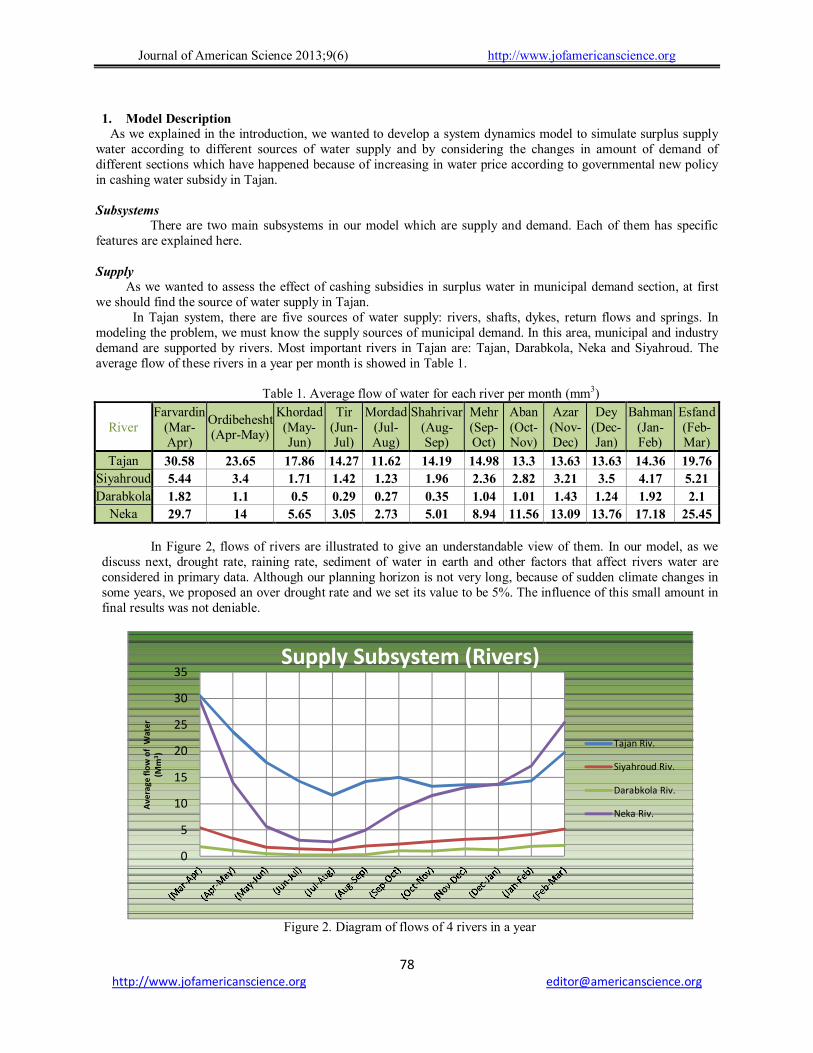
In Tajan system, there are five sources of water supply: rivers, shafts, dykes, return flows and springs. In modeling the problem, we must know the supply sources of municipal demand. In this area, municipal and industry demand are supported by rivers. Most important rivers in Tajan are: Tajan, Darabkola, Neka and Siyahroud. The average flow of these rivers in a year per month is showed in Table 1.
Table 1. Average flow of water for each river per month (mm3)
River Farvardin
(Mar-Apr)
Ordibehesht (Apr-May)
Khordad (May-Jun)
Tir (Jun-Jul)
Mordad (Jul-Aug)
Shahrivar (Aug-Sep)
Mehr (Sep-Oct)
Aban (Oct-Nov)
Azar (Nov-Dec)
Dey (Dec-Jan)
Bahman (Jan-Feb)
Esfand (Feb-Mar)
Tajan 30.58 23.65 17.86 14.27 11.62 14.19 14.98 13.3 13.63 13.63 14.36 19.76
Siyahroud 5.44 3.4 1.71 1.42 1.23 1.96 2.36 2.82 3.21 3.5 4.17 5.21
Darabkola 1.82 1.1 0.5 0.29 0.27 0.35 1.04 1.01 1.43 1.24 1.92 2.1
Neka 29.7 14 5.65 3.05 2.73 5.01 8.94 11.56 13.09 13.76 17.18 25.45
In Figure 2, flows of rivers are illustrated to give an understandable view of them. In our model, as we
discuss next, drought rate, raining rate, sediment of water in earth and other factors that affect rivers water are considered in primary data. Although our planning horizon is not very long, because of sudden climate changes in some years, we proposed an over drought rate and we set its value to be 5%. The influence of this small amount in final results was not deniable.
Figure 2. Diagram of flows of 4 rivers in a year
0
5
10
15
20
25
30
35
Ave
rage
flo
w o
f W
ate
r(M
m3)
Supply Subsystem (Rivers)
Tajan Riv.
Siyahroud Riv.
Darabkola Riv.
Neka Riv.

Journal of American Science 2013;9(6) http://www.jofamericanscience.org
79 http://www.jofamericanscience.org [email protected]
Demand In this system we have considered three kinds of demand: industry, agriculture and municipal. Rivers in Tajan
contribute in situations that can support all kinds of demand. But, they have a key role in municipal and industrial demand sections because these sections don't have any other sources for supplying their needs to water. In this part of the paper, first we tried to find water needs of the agricultural demand section and then municipal demand is explained by considering a classical theorem. At last, industry demand is discussed. We set a fix value for this demand in all periods of modeling horizon. Agriculture Demand:
Farms in Tajan, are irrigated from two kinds of supplies on the bases of their irrigation methods. We named the first kind of irrigation, in-net irrigation or inside modern net which is referred to new and modern methods of irrigation. Traditional irrigation system is the second kind of irrigation in which farms are irrigated by using inefficient methods. Areas of lands that irrigate by in-net and out-net irrigating systems are 34225 and 29575 hectares respectively. Meanwhile, average amount of usable rivers water for irrigating farms of Tajan by using each of these two kinds of irrigation are shown in Table 2. As it is obvious, rivers are used in springs and summers and in the other seasons, raining is enough for irrigation.
Table 2. Average distribution of agricultural demand in month (m3/hec)
Kind of Irrigation Farvardin (Mar-Apr)
Ordibehesht (Apr-May)
Khordad (May-Jun)
Tir (Jun-Jul)
Mordad (Jul-Aug)
Shahrivar (Aug-Sep)
Mehr (Sep-Oct)
Average in Year
Inside modern net 1605 2065 1882 1958 1297 59 0 8866
Outside modern net 1501 1946 1591 2116 1488 53 0 8694
For a better understanding of two different kinds of irrigation during a year, we illustrated their monthly
values in Figure 3.
Figure 3. Diagram of Agricultural Demand
Municipal Demand: We calculate the demand of residents in this system from well-known formula of elasticity:
0
500
1000
1500
2000
2500
Ave
rage
dis
trib
uti
on
of
agri
cult
ura
l d
em
and
in m
on
th (
m3 /
he
c)
Agricultural Demand
Inside modern net
Outside modern net
Journal of American Science 2013;9(6) http://www.jofamericanscience.org
80 http://www.jofamericanscience.org [email protected]
1 1 1
1 1 1 1
11
1
%. .( 1)
%
. 1 .
t t t t t
t t t t t t
t tt t
t
Q Q P P QQE
P P P Q P P Q
P PQ Q E
P
(1)
In which E is elasticity, Qt is the amount of demand in period t and Pt is price of municipal water in period t.
It should be noticed that price of purified water for municipal consumptions differs from price of water in other sections. Also, it must be considered that there is a minimum need for municipal water demand. As we know, usually increasing of price leads to decreasing of demand. In fact, consumption of water for everybody can't come down from a critical limit in a time unit even if its price is very high at that time. Therefore, municipal demand should be calculated as follow.
Demandt = Max { Qt , minimum demand of people in period t } (2) In order to obtain minimum demand of people in period t, we assumed the average of minimum water
consumption of a usual person in Iran is 140 liters per day (surely this parameter is lower than 140 in developed countries). So, minimum municipal demand in a month is calculated as follow.
minimum demand of people in period t = [(POPt ×140) / (1000 ×30)] (m3)
Since we set all of the units of water as cube meter in this paper, we divided the above formulation to 1000.
Also, POPt is amount of population in Tajan region in period t, that can be obtained as the following formula.
POPt = POP0× (1+ rate of growth in a month)t (3)
At lost, municipal demand was calculated as:
Demandt = Max { 11
1
140 1000 30 , . 1 . t tt t
t
P PPOP Q E
P
} (4)
In section 5, changes of municipal water demand in a specific period is compared when designed strategies
will be applied. Industrial Demand:
In horizon of our modeling (that is 24 months and starts from December 2010), it is recommended by experts that industrial equipment and production is nearly fixed. So, we could set the demand of industrial section a fix value, 2.8 Mm3 per month.
Casual Loop Diagrams & Dynamic Hypothesis:
In this section, we depicted causal diagrams of different parts of model in order to develop flow model. The causal diagram of our model is consisted of three major sections that we introduced them here. These sections are agricultural and municipal demand and also supply subsystem.
As explained before, farms in Tajan were irrigated by two kinds of rivers supplies on the bases of their irrigation methods that were modern and classical. Total water needs for irrigating farms in Tajan are calculated by using this diagram. This amount is consisted of two parts as we mentioned before, in-net irrigation and out-net irrigation of farms during a year. In order to obtain each of these two parts, average distribution of agricultural demand which was shown in Table 2, should be multiply to areas of farms that are irrigated by in-net or out-net irrigation in a year. In Tajan, efficiency of the modern irrigation method is %41 while it is 33% for traditional. These values were used to obtain efficient amount of agricultural demand in the model. We considered them as percents affected two types of irrigation.
Journal of American Science 2013;9(6) http://www.jofamericanscience.org
81 http://www.jofamericanscience.org [email protected]
Elasticity(t)
Pop(t)
Price(strict)
+
<Time>
Rate of PopGrowth
+
Inflation
+
Price(0)
+
Final Price
+
+
Price(smooth)+
+ +
+
Demand 1
+
Pop(0)
+
+
Demand 2
Price(beforechange)
++
+
Total MunicipalDemand
++
+
+
<Time>
+++
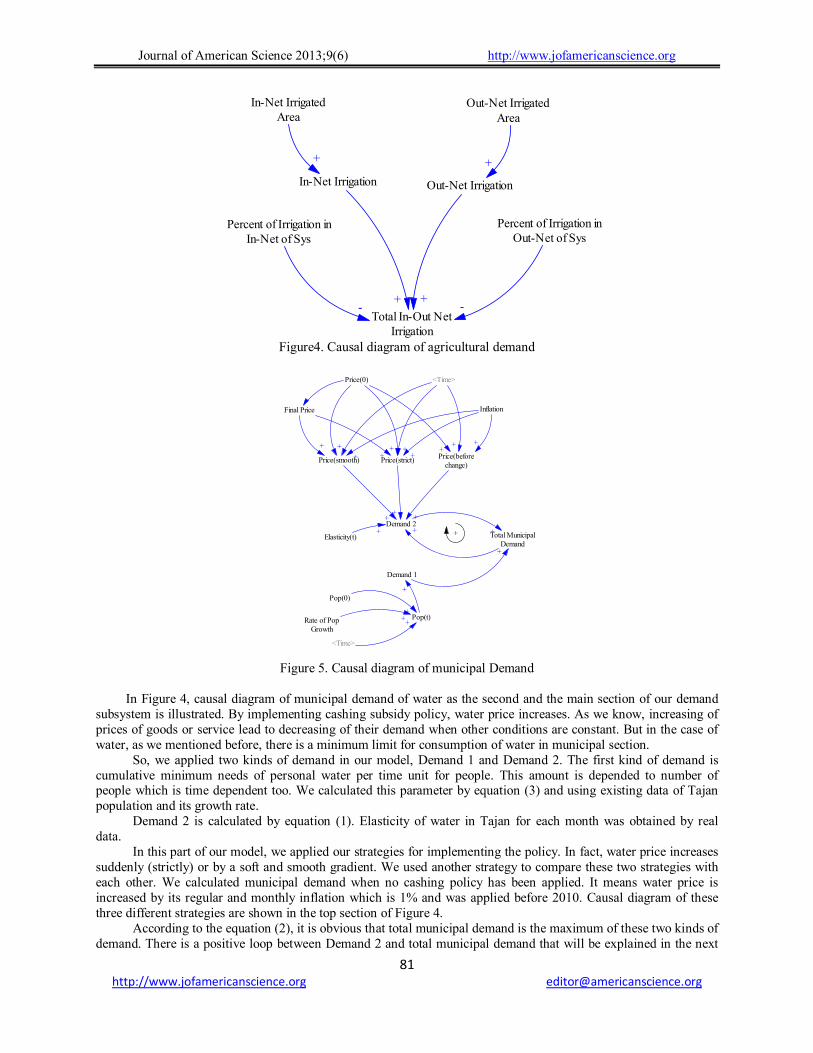
Figure4. Causal diagram of agricultural demand
Figure 5. Causal diagram of municipal Demand
In Figure 4, causal diagram of municipal demand of water as the second and the main section of our demand
subsystem is illustrated. By implementing cashing subsidy policy, water price increases. As we know, increasing of prices of goods or service lead to decreasing of their demand when other conditions are constant. But in the case of water, as we mentioned before, there is a minimum limit for consumption of water in municipal section.
So, we applied two kinds of demand in our model, Demand 1 and Demand 2. The first kind of demand is cumulative minimum needs of personal water per time unit for people. This amount is depended to number of people which is time dependent too. We calculated this parameter by equation (3) and using existing data of Tajan population and its growth rate.
Demand 2 is calculated by equation (1). Elasticity of water in Tajan for each month was obtained by real data.
In this part of our model, we applied our strategies for implementing the policy. In fact, water price increases suddenly (strictly) or by a soft and smooth gradient. We used another strategy to compare these two strategies with each other. We calculated municipal demand when no cashing policy has been applied. It means water price is increased by its regular and monthly inflation which is 1% and was applied before 2010. Causal diagram of these three different strategies are shown in the top section of Figure 4.
According to the equation (2), it is obvious that total municipal demand is the maximum of these two kinds of demand. There is a positive loop between Demand 2 and total municipal demand that will be explained in the next
Out-Net Irrigation
Total In-Out NetIrrigation
+
In-Net Irrigation
+
In-Net IrrigatedArea
Out-Net IrrigatedArea
+
Percent of Irrigation inIn-Net of Sys
Percent of Irrigation inOut-Net of Sys
- -
+

Journal of American Science 2013;9(6) http://www.jofamericanscience.org
82 http://www.jofamericanscience.org [email protected]
Total RiversRate of
OverDrought
Tajan River
Neka River
Siahrood River
Darabkola River
-
++
++
-
-
-
section. Prices in each of three strategies are increased by rising of inflation and also passing time. Meanwhile, it is affected by initial price of water. Final price is considered to be the price of water without any subsidy. Its value has a vital effect on price in our first and second strategy.
Figure 6. Causal diagram of supply subsystem
Total amounts of rivers are calculated by adding four rivers together according to Figure 5 in which causal
diagram of supply is shown. We considered sudden climate changes in our model and called it "Rate of OverDrought" and set its value to be 5%. This variable had negative influences on the amount of rivers which was not a deniable matter. Since it is for years we have faced drought in Iran, a sensitive analysis can be done over this variable. Model Development
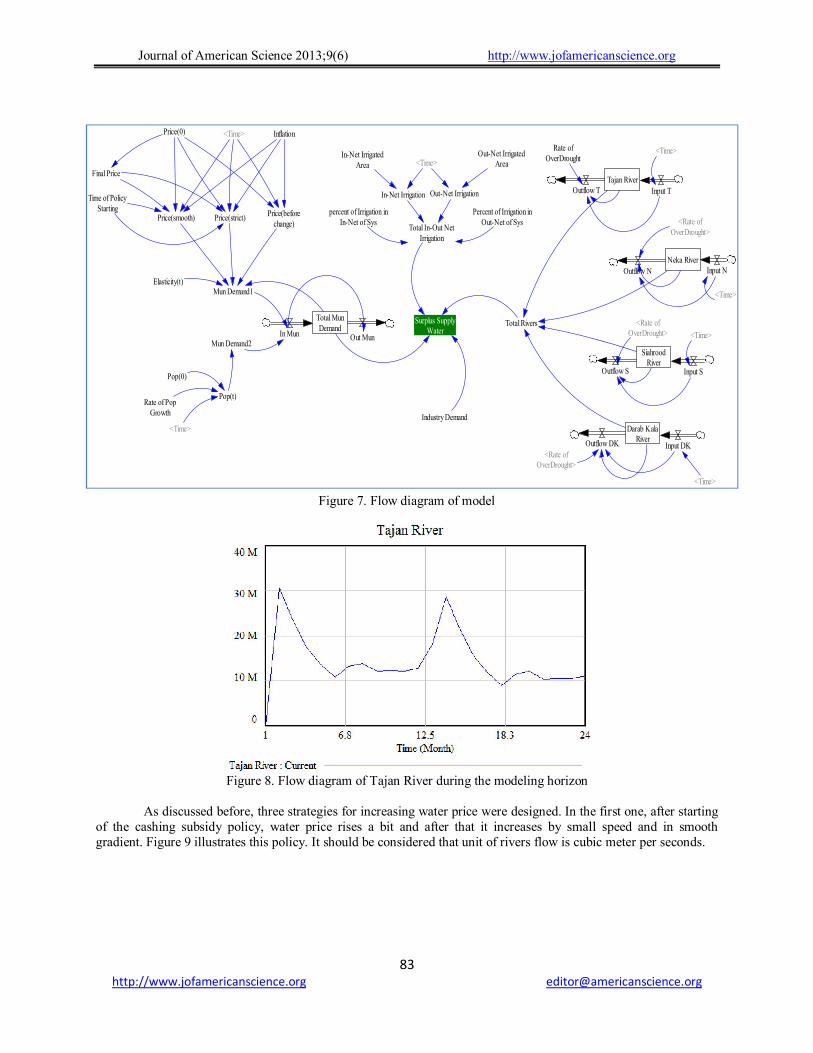
In this section, we developed our model and we tried to explain its characteristics. According to causal diagrams, the flow diagram is consisted of three parts. Left part is municipal demand where strategies are designed, right one is supply subsystem and top section is agricultural demand. The main variable of the model is "Surplus Supply Water" that is a criterion for comparing the effectiveness of the strategies and is calculated by subtracting total amount of rivers from agricultural, municipal and industrial demand of water.
In the flow diagram, there are 5 stock variables. Four of them saved different amount of the four rivers and the other one save municipal demand. In this model, we were dealing with a discrete simulation since our time units were months and the modeling horizon was 24 months. So, we used those stock variables in order to entrap discrete amount of rivers and municipal demand. In fact, output flow for each of these stocks was exactly the input flow in its later period. It means we applied a delay between output and input flow. We must do it to avoid flows from accumulation. For example, the positive loop we were talking about in the previous section is consisted of total municipal demand and "Demand 2" and also municipal demand in its later period. We were obliged to apply this tricky idea since for calculating elasticity in equation (1), the amount of Qt-1 should be obtained first in order to obtain Qt.
In stock variables of rivers, out flow of a specific river is its inflow in later month by considering the influence of the rate of over drought in it.
As you focus on the Vensim file of our model, we did not used look up function for giving average amount of rivers water according to Table 2. Since the rivers data is given per months, we did not have its value between each pair of continuous months. So, we used "IF Then Else" structure for inserting amounts of rivers into the model. Simulation and Results
We used Vensime (Version 5.6b) for running our flow model. Water flows in each of the rivers is given to the model while the rate of over drought affects their flow. As Figure 8 shows, flows of Tajan River decrease in the second year with respect to the first year because it is multiply to the rate of drought. It is obvious that its maximum amount for the second year (month13) is a bit smaller than it value in the first month.
Journal of American Science 2013;9(6) http://www.jofamericanscience.org
83 http://www.jofamericanscience.org [email protected]
Total Rivers
Tajan River
SiahroodRiver
Darab KalaRiver
Outflow T
Outflow S
Outflow DK
Elasticity(t)
Pop(t)
Price(strict)
<Time>
Rate of PopGrowth
Inflation
Out-Net Irrigation
Neka River
Outflow N
Total In-Out NetIrrigation
Price(0)
Final Price
<Time>
Rate ofOverDrought
<Rate ofOverDrought>
<Rate ofOverDrought>
<Rate ofOverDrought>
<Time>
<Time>
<Time>
<Time>
Surplus SupplyWater
<Time>
In-Net Irrigation
Price(smooth)
Time of PolicyStarting
Industry Demand
In-Net IrrigatedArea
Out-Net IrrigatedArea
Mun Demand2
Pop(0)
Mun Demand1
Total MunDemand
In Mun Out Mun
Price(beforechange)
percent of Irrigation inIn-Net of Sys
Percent of Irrigation inOut-Net of Sys
Input DK
Input S
Input N
Input T
Figure 7. Flow diagram of model
Figure 8. Flow diagram of Tajan River during the modeling horizon
As discussed before, three strategies for increasing water price were designed. In the first one, after starting
of the cashing subsidy policy, water price rises a bit and after that it increases by small speed and in smooth gradient. Figure 9 illustrates this policy. It should be considered that unit of rivers flow is cubic meter per seconds.

Journal of American Science 2013;9(6) http://www.jofamericanscience.org
84 http://www.jofamericanscience.org [email protected]
Figure 9. First strategy for water price, price increases smoothly
In the second strategy, water price increases strictly similar to what Iran's government started to do from
December 2010. A big shocked happened in the prices. It can be seen in Figure 10.
Figure 10. Second strategy for water price, price increases strictly
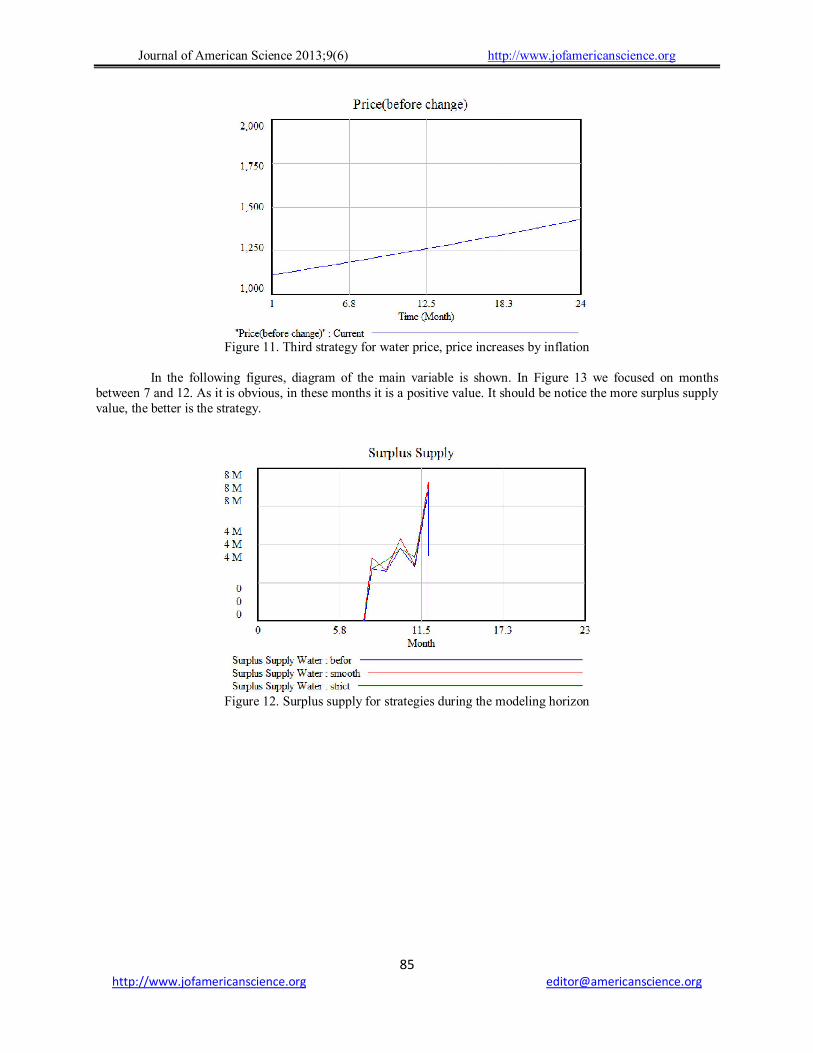
In order to find various effects of these two strategies, we have considered another strategy in which no
cashing subsidy policy happened. Price of water increased according to the rate of inflation which was announced at the beginning of each year by the government. So, price rises linearly similar to Figure 11.
Journal of American Science 2013;9(6) http://www.jofamericanscience.org
85 http://www.jofamericanscience.org [email protected]
Figure 11. Third strategy for water price, price increases by inflation
In the following figures, diagram of the main variable is shown. In Figure 13 we focused on months
between 7 and 12. As it is obvious, in these months it is a positive value. It should be notice the more surplus supply value, the better is the strategy.
Figure 12. Surplus supply for strategies during the modeling horizon
Journal of American Science 2013;9(6) http://www.jofamericanscience.org
86 http://www.jofamericanscience.org [email protected]
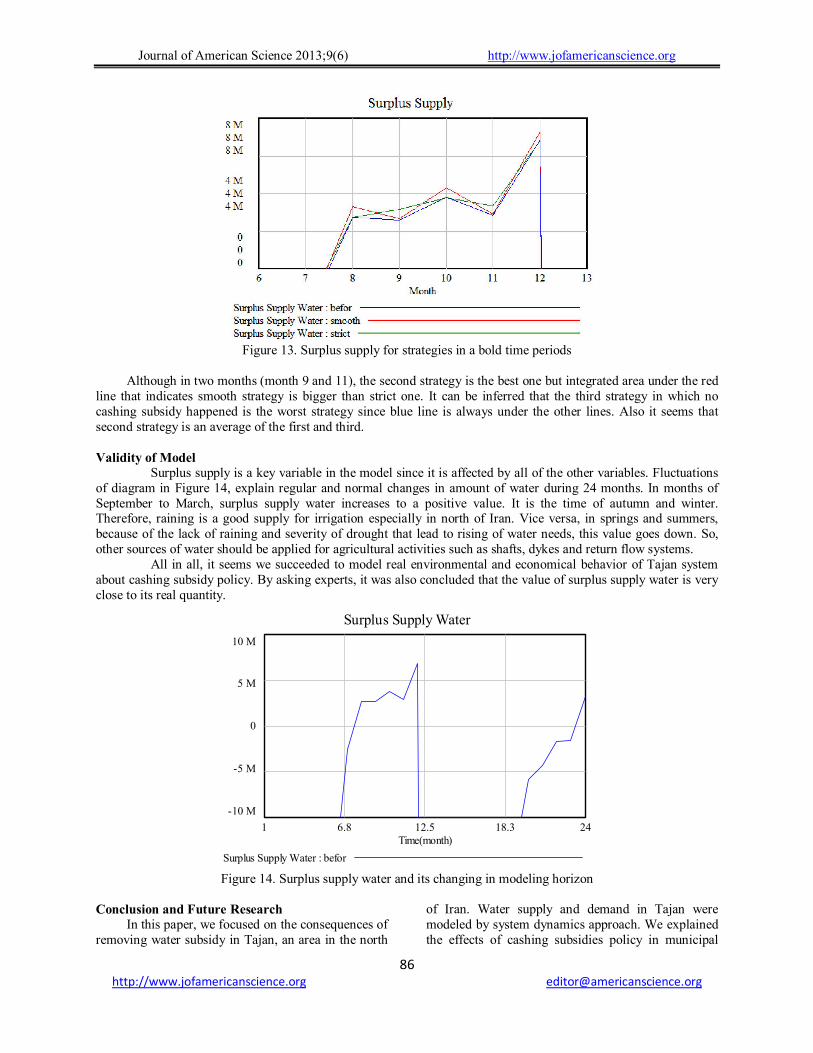
Figure 13. Surplus supply for strategies in a bold time periods
Although in two months (month 9 and 11), the second strategy is the best one but integrated area under the red
line that indicates smooth strategy is bigger than strict one. It can be inferred that the third strategy in which no cashing subsidy happened is the worst strategy since blue line is always under the other lines. Also it seems that second strategy is an average of the first and third. Validity of Model
Surplus supply is a key variable in the model since it is affected by all of the other variables. Fluctuations of diagram in Figure 14, explain regular and normal changes in amount of water during 24 months. In months of September to March, surplus supply water increases to a positive value. It is the time of autumn and winter. Therefore, raining is a good supply for irrigation especially in north of Iran. Vice versa, in springs and summers, because of the lack of raining and severity of drought that lead to rising of water needs, this value goes down. So, other sources of water should be applied for agricultural activities such as shafts, dykes and return flow systems.
All in all, it seems we succeeded to model real environmental and economical behavior of Tajan system about cashing subsidy policy. By asking experts, it was also concluded that the value of surplus supply water is very close to its real quantity.
Figure 14. Surplus supply water and its changing in modeling horizon
Conclusion and Future Research
In this paper, we focused on the consequences of removing water subsidy in Tajan, an area in the north
of Iran. Water supply and demand in Tajan were modeled by system dynamics approach. We explained the effects of cashing subsidies policy in municipal
Surplus Supply Water
10 M
5 M
0
-5 M
-10 M
1 6.8 12.5 18.3 24Time(month)
Surplus Supply Water : befor

Journal of American Science 2013;9(6) http://www.jofamericanscience.org
87 http://www.jofamericanscience.org [email protected]
demand of water in Tajan as the main demand section that was affected by this policy. Three strategies were designed which were different approaches in implementing of the policy. In the first strategy, the price of water increased smoothly over modeling horizon which was considered to be 24 months. While in the second one, price was increased suddenly in the first month, exactly similar to the way Iran's government has done. A third strategy was designed to select the best one from the two strategies in which no subsidy elimination happens and the price increases according to inflation. A water surplus indicator was considered for comparing these strategies which was calculated by decreasing the amount of all of water supply resources from cumulative water in triple demand section for each strategy.
It is concluded that by increasing water price smoothly, the cumulative amount of positive surplus supply is bigger than the others. Although is two months strict strategy has a highest amount of surplus supply. So, despite of government decision in increasing the price strictly, it would be better to raise it slowly with a smooth gradient.
Also it was concluded that surplus supply water is very close to its real data. It means we succeeded to model the problem well and our model has a good validation.
For future researches, we suggest a sensitive analysis to be done for the key variables of the model such as over drought rate or inflation to discover the critical points. Different types of pricing strategy in a longer modeling horizon can also be considered to find the optimum one in a long time planning.
We assumed that the cashing policy has just changed municipal demand. It is recommended to find its influences on the other demand sections such as industry and agriculture in order to make an integrated model that can explain real conditions better. Acknowledgment
We should appreciate Mr. Shaverdi and his research group in Natural Resource Economy in Mahab-Ghods Company for his valuable hints and advices. He helped us with providing real data for
Tajan that made it possible to model our problem in real condition and validate it. References
1. Ewers, M. E., 2005. Combining Hydrology and Economics in a Systems Dynamics Approach: Modeling Water Resources for the San Juan Basin. In the Proceeding of 23rd International Conference of the System Dynamics Society. Boston, pp 69-69.
2. HO, C.-C., YANG, C.-C., CHANG, L.-C., & CHEN, T.-W, 2005. The application of system dynamics modeling to study impact of water resources planning and management in Taiwan. In the Proceeding of 23rd International Conference of the System Dynamics Society. Boston, Pp: 80-80.
3. J., Sterman, 2000. Business Dynamics: System Thinking and Modeling for a Complex. Boston: McGraw-Hill Companies.
4. Winz, I., & Brierley, G, 2007. The Use of System Dynamics Simulation in Integrated Water Resources Management. In the Proceeding of 25th International Conference of the System Dynamics Society. Boston, pp 167-167.
5. Arbues, F., Barberan, R., and Villanua I., 2004. Price Impact on Urban Residential Water Demand: A Dynamic Panel Data Approach. Water Resource Management, 4(1), 323-338.
6. Regional Water and Sewage Company of Mazandaran Provine. A Report of Social, Economical, Agricultural and Bestijal Studies: A Case Study of Tajan System. 2006.
7. Regional BIBLIOGRAPHY Water and Sewage Company of Mazandaran Provine, Ministery of Power, 2010.
8. Sabouhi, M., & Nobakht, M., 2009. Estimating the Water Demand Function of Pardis City. Journal of Water, 10, 69-74.
9. Pajouhan, J., & Hosseini, Sh., 2003. Estimating Municipal Demand Function: A Case Study of Tehran, Journal Economical Investigaation of Iran, 16, 47-67.
4/29/2013