journal nursing - kansas nursing board · volume 4, issue 2 · july 2013 supplement journal...
TRANSCRIPT

Volume 4, Issue 2 · July 2013 supplement
JOURNALoFNURSING REGULATION
T H E O F F I C I A L J O U R N A L O F T H E N AT I O N A L C O U N C I L O F S TAT E B O A R D S O F N U R S I N G
Advancing Nursing Excellence for Public Protection
The national Council of state Boards of nursing and The Forum of state nursing Workforce Centers
2013 national Workforce survey of Registered nurses
Jill S. Budden, PhD; Elizabeth H. Zhong, PhD; Patricia Moulton, PhD; and Jeannie P. Cimiotti, DNSc, RN

Editorial Advisory BoardDavid C. Benton, RGN, RMN, BSc,
MPhil, FFNF, FRCNChief Executive OfficerInternational Council of NursesGeneva, Switzerland
Kathy Bettinardi-Angres, MS, RN, APN, CADC
Director of Family Services Professional’s Program Resurrection Behavioral Health
Chicago, Illinois
Shirley A. Brekken, MS, RN Executive DirectorMinnesota Board of NursingMinneapolis, Minnesota
Nancy J. Brent, MS, JD, RNAttorney At LawWilmette, Illinois
Linda Burnes Bolton, DrPH, RN, FAAN Vice President and Chief Nursing OfficerCedars-Sinai Medical CenterLos Angeles, California
Sean P. Clarke, PhD, RN, FAANProfessor and Susan E. French Chair in
Nursing Research and Innovative PracticeDirector, McGill Nursing Collaborative for
Education and Innovation in Patient and Family Centred Care
Ingram School of Nursing, Faculty of Medicine, McGill University
Montreal, Quebec, Canada
Anne Coghlan, MScN, RNExecutive Director and Chief Executive
OfficerCollege of Nurses of OntarioToronto, Ontario, Canada
Sandra Evans, MA.Ed, RNExecutive DirectorIdaho Board of NursingBoise, Idaho
Suzanne Feetham, PhD, RN, FAANNursing Research ConsultantChildren’s National Medical CenterWashington, DCVisiting ProfessorUniversity of WisconsinMilwaukee, Wisconsin
Karlene Kerfoot, PhD, RN, CNAAVice President and Chief Clinical OfficerAurora Health CareMilwaukee, Wisconsin
Paula R. Meyer, MSN, RN Executive DirectorWashington State Department of Health
Nursing Care Quality Assurance Commission
Olympia, Washington
Barbara Morvant, MN, RN Executive DirectorLouisiana State Board of NursingBaton Rouge, Louisiana
Ann L. O’Sullivan, PhD, CRNP, FAANProfessor of Primary Care NursingDr. Hildegarde Reynolds Endowed Term
Professor of Primary Care NursingUniversity of Pennsylvania Philadelphia, Pennsylvania
Kathy Player, EdD, MS-N, MBA, MS-C, RN
Associate ProvostGrand Canyon UniversityPhoenix, Arizona
Roberta Ramont, EdD, MS, RNConsultant/WriterHealth Curriculum SpecialistsSeal Beach, California
Linda R. Rounds, PhD, RN, FNP, FAANP
Professor/Betty Lee Evans Distinguished Professor of Nursing University of Texas Medical Branch School of Nursing
Galveston, Texas
Dragica S̆imunecPresidentCroatian Chamber of NursesBoard MemberEuropean Council of Nursing Regulators
Diana Swihart, PhD, DMin, MSN, CS, RN-BC
U.S. Department of Veterans AffairsOffice of Clinical Consultation and
ComplianceDenver, Colorado
Pamela Thompson, MS, RN, FAAN Chief Executive OfficerAmerican Organization of Nurse ExecutivesWashington, DC
JOURNALOFNURSINGREGULATION Official publication of the National Council of State Boards of Nursing
Editor-in-ChiefMaryann Alexander, PhD, RN, FAAN Chief Officer, Nursing RegulationNational Council of State Boards of NursingChicago, IllinoisChief Executive OfficerKathy Apple, MS, RN, FAAN
Contributing EditorsNancy Spector, PhD, RNLindsay K. Beaver, JD Susan H. Richmond, MSN, RN
NCSBN Board of DirectorsPresidentMyra Broadway, JD, MS, RN
Vice PresidentShirley Brekken, MS, RN
TreasurerJulia George, MSN, RN, FRE
Area I DirectorDebra Scott, MSN, RN, FRE
Area II DirectorLanette Anderson, JD, MSN, RN
Area III DirectorPamela Autrey, PhD, MBA, MSN, RN
Area IV DirectorAnn O'Sullivan, PhD, FAAN, CRNP
Director-at-LargeBetsy Houchen, MS, RN, JD
Director-at-LargeEmmaline Woodson, DNP, MS, RN, FRE
Director-at-LargeJoe Baker, Jr.
Director-at-LargeGloria Damgaard, MS, RN, FRE
The Journal of Nursing Regulation is a quarterly, peer-reviewed professional journal, supported and published by the National Council of State Boards of Nursing (NCSBN), a not-for-profit organization. NCSBN can be contacted at:
111 East Wacker Drive, Suite 2900Chicago, IL 60601-4277Telephone: 1-312-525-3600Fax: 1-312-279-1032https://www.ncsbn.org
Copyright © 2013. Produced and printed in the USA. All rights reserved. No part of this publication may be reproduced or transmitted in any form, whole or in part, without the permission of the copyright holder, the National Council of State Boards of Nursing.
Project management Editorial and production management provided by CLS Development, Inc., Columbia, Maryland, and MedVantage Publishing, LLC, New Hope, Pennsylvania
DisclaimerThe Journal of Nursing Regulation is a peer-reviewed journal. Statements, views, and opinions are solely those of the authors and persons quoted. Such views do not necessarily reflect those of the National Council of State Boards of Nursing, Inc. The publisher disclaims all responsibility for any errors, or any injuries to persons or properties resulting from the use of information or advertisements contained in the journal.
Subscription, advertising, reprints Go to www.journalofnursingregulation.com or contact Beth Radtke at (312) 525-3655 or at [email protected].
ISSN 2155-8256

Timothy P. Johnson, PhDDirector, Survey Research Laboratory
Professor, Public Administration
University of Illinois at Chicago
Linda K. Owens, PhDAssisttant Director For Sampling & Analysis
Survey Research Lab
University of Illinois
Jennifer Hayden, MSN, RNAssociate, Research
National Council of State Boards of Nursing
Linda L. Olson, PhD, MBA, RN, NEA-BCAssociate, Institute of Regulatory Excellence
National Council of State Boards of Nursing
Supplement
The National Council of State Boards of Nursing and The Forum of State Nursing Workforce Centers
2013 National Workforce Survey of Registered Nurses
Jill S. Budden, PhD Associate, Research
National Council of State Boards of Nursing
Elizabeth H. Zhong, PhD Associate, Research
National Council of State Boards of Nursing
Patricia Moulton, PhD Executive Director
North Dakota Center for Nursing
Jeannie P. Cimiotti, DNSc, RN Associate Professor, Rutgers University College of Nursing
Executive Director, New Jersey Collaborating Center for Nursing
Acknowledgments
S2 Journal of Nursing Regulation
Introduction . . . . . . . . . . . . . . . . . . . . . . . . . . . . . . . . . . . . . . . . . . . . . . . . . . . . . . . . . . . . . . . . . . . . . . . .S4Method . . . . . . . . . . . . . . . . . . . . . . . . . . . . . . . . . . . . . . . . . . . . . . . . . . . . . . . . . . . . . . . . . . . . . . . . . . . . . .S4
Participants . . . . . . . . . . . . . . . . . . . . . . . . . . . . . . . . . . . . . . . . . . . . . . . . . . . . . . . . . . . . . . . . . . . .S4Materials . . . . . . . . . . . . . . . . . . . . . . . . . . . . . . . . . . . . . . . . . . . . . . . . . . . . . . . . . . . . . . . . . . . . . . .S6Procedure . . . . . . . . . . . . . . . . . . . . . . . . . . . . . . . . . . . . . . . . . . . . . . . . . . . . . . . . . . . . . . . . . . . . . .S6Nonresponse Analyses and Sample Weighting . . . . . . . . . . . . . . . . . . . . . . . . . . . . . . . . . . .S6
Preliminary analysis . . . . . . . . . . . . . . . . . . . . . . . . . . . . . . . . . . . . . . . . . . . . . . . . . . . . . . . S6Bivariate analysis . . . . . . . . . . . . . . . . . . . . . . . . . . . . . . . . . . . . . . . . . . . . . . . . . . . . . . . . . S8Multivariate analysis . . . . . . . . . . . . . . . . . . . . . . . . . . . . . . . . . . . . . . . . . . . . . . . . . . . . . S10Weights . . . . . . . . . . . . . . . . . . . . . . . . . . . . . . . . . . . . . . . . . . . . . . . . . . . . . . . . . . . . . . . S13
Results . . . . . . . . . . . . . . . . . . . . . . . . . . . . . . . . . . . . . . . . . . . . . . . . . . . . . . . . . . . . . . . . . . . . . . . . . . . . . S14Gender, Age, and Ethnic Diversity . . . . . . . . . . . . . . . . . . . . . . . . . . . . . . . . . . . . . . . . . . . . S14
Gender . . . . . . . . . . . . . . . . . . . . . . . . . . . . . . . . . . . . . . . . . . . . . . . . . . . . . . . . . . . . . . . . S14Age . . . . . . . . . . . . . . . . . . . . . . . . . . . . . . . . . . . . . . . . . . . . . . . . . . . . . . . . . . . . . . . . . . S15Ethnic diversity . . . . . . . . . . . . . . . . . . . . . . . . . . . . . . . . . . . . . . . . . . . . . . . . . . . . . . . . . S16
Education and Licensing . . . . . . . . . . . . . . . . . . . . . . . . . . . . . . . . . . . . . . . . . . . . . . . . . . . . . . S20Education . . . . . . . . . . . . . . . . . . . . . . . . . . . . . . . . . . . . . . . . . . . . . . . . . . . . . . . . . . . . . . S20Licensing . . . . . . . . . . . . . . . . . . . . . . . . . . . . . . . . . . . . . . . . . . . . . . . . . . . . . . . . . . . . . . S22
Employment . . . . . . . . . . . . . . . . . . . . . . . . . . . . . . . . . . . . . . . . . . . . . . . . . . . . . . . . . . . . . . . . . . S26Employment status . . . . . . . . . . . . . . . . . . . . . . . . . . . . . . . . . . . . . . . . . . . . . . . . . . . . . . S26Position setting . . . . . . . . . . . . . . . . . . . . . . . . . . . . . . . . . . . . . . . . . . . . . . . . . . . . . . . . . S29Position title . . . . . . . . . . . . . . . . . . . . . . . . . . . . . . . . . . . . . . . . . . . . . . . . . . . . . . . . . . . . S33Employment specialty . . . . . . . . . . . . . . . . . . . . . . . . . . . . . . . . . . . . . . . . . . . . . . . . . . . . S35Hours worked . . . . . . . . . . . . . . . . . . . . . . . . . . . . . . . . . . . . . . . . . . . . . . . . . . . . . . . . . . S38Nurses not employed in nursing . . . . . . . . . . . . . . . . . . . . . . . . . . . . . . . . . . . . . . . . . . . . S41
Nurse Faculty . . . . . . . . . . . . . . . . . . . . . . . . . . . . . . . . . . . . . . . . . . . . . . . . . . . . . . . . . . . . . . . . S41Advanced Practice Registered Nurses . . . . . . . . . . . . . . . . . . . . . . . . . . . . . . . . . . . . . . . . . . S43
Nurse practitioners . . . . . . . . . . . . . . . . . . . . . . . . . . . . . . . . . . . . . . . . . . . . . . . . . . . . . . S44Certified nurse midwives . . . . . . . . . . . . . . . . . . . . . . . . . . . . . . . . . . . . . . . . . . . . . . . . . . S46Certified registered nurse anesthetists . . . . . . . . . . . . . . . . . . . . . . . . . . . . . . . . . . . . . . . . S48Clinical nurse specialists . . . . . . . . . . . . . . . . . . . . . . . . . . . . . . . . . . . . . . . . . . . . . . . . . . S48
Foreign-Educated Nurses . . . . . . . . . . . . . . . . . . . . . . . . . . . . . . . . . . . . . . . . . . . . . . . . . . . . . . S50Newly Licensed Nurses . . . . . . . . . . . . . . . . . . . . . . . . . . . . . . . . . . . . . . . . . . . . . . . . . . . . . . . S52Registered Nurses Nearing Retirement . . . . . . . . . . . . . . . . . . . . . . . . . . . . . . . . . . . . . . . . S57Nurse Licensure Compact . . . . . . . . . . . . . . . . . . . . . . . . . . . . . . . . . . . . . . . . . . . . . . . . . . . . S60Tele-health . . . . . . . . . . . . . . . . . . . . . . . . . . . . . . . . . . . . . . . . . . . . . . . . . . . . . . . . . . . . . . . . . . . S61
Summary of Results . . . . . . . . . . . . . . . . . . . . . . . . . . . . . . . . . . . . . . . . . . . . . . . . . . . . . . . . . . . . . S62Gender . . . . . . . . . . . . . . . . . . . . . . . . . . . . . . . . . . . . . . . . . . . . . . . . . . . . . . . . . . . . . . . . S62Age . . . . . . . . . . . . . . . . . . . . . . . . . . . . . . . . . . . . . . . . . . . . . . . . . . . . . . . . . . . . . . . . . . S62Racial/ethnic diversity . . . . . . . . . . . . . . . . . . . . . . . . . . . . . . . . . . . . . . . . . . . . . . . . . . . . S63Education . . . . . . . . . . . . . . . . . . . . . . . . . . . . . . . . . . . . . . . . . . . . . . . . . . . . . . . . . . . . . . S63Licensing . . . . . . . . . . . . . . . . . . . . . . . . . . . . . . . . . . . . . . . . . . . . . . . . . . . . . . . . . . . . . . S63Employment status . . . . . . . . . . . . . . . . . . . . . . . . . . . . . . . . . . . . . . . . . . . . . . . . . . . . . . S64Position setting . . . . . . . . . . . . . . . . . . . . . . . . . . . . . . . . . . . . . . . . . . . . . . . . . . . . . . . . . S64Position title . . . . . . . . . . . . . . . . . . . . . . . . . . . . . . . . . . . . . . . . . . . . . . . . . . . . . . . . . . . . S64Employment specialty . . . . . . . . . . . . . . . . . . . . . . . . . . . . . . . . . . . . . . . . . . . . . . . . . . . . S64Nurse Licensure Compact . . . . . . . . . . . . . . . . . . . . . . . . . . . . . . . . . . . . . . . . . . . . . . . . . S64Tele-health . . . . . . . . . . . . . . . . . . . . . . . . . . . . . . . . . . . . . . . . . . . . . . . . . . . . . . . . . . . . . S65
Discussion . . . . . . . . . . . . . . . . . . . . . . . . . . . . . . . . . . . . . . . . . . . . . . . . . . . . . . . . . . . . . . . . . . . . . . . . S65References . . . . . . . . . . . . . . . . . . . . . . . . . . . . . . . . . . . . . . . . . . . . . . . . . . . . . . . . . . . . . . . . . . . . . . . . . S65Appendix A – Survey questionnaire . . . . . . . . . . . . . . . . . . . . . . . . . . . . . . . . . . . . . . . . . . . S66Appendix B – Listing of tables . . . . . . . . . . . . . . . . . . . . . . . . . . . . . . . . . . . . . . . . . . . . . . . . . S70
CONTENTSJuly 2013 • Volume 4 • Issue 2 Supplement
Advancing nursing excellence for public protection
Mission The Journal of Nursing Regulation provides a worldwide forum for sharing research, evidence-based practice, and innovative strategies and solutions related to nursing regulation, with the ultimate goal of safeguarding the public . The journal maintains and promotes National Council of State Boards of Nursing’s (NCSBN’s) values of integrity, accountability, quality, vision, and collaboration in meeting readers’ knowledge needs .
Manuscript Information The Journal of Nursing Regulation accepts timely articles that may advance the science of nursing regulation, promote the mission and vision of NCSBN, and enhance com-munication and collaboration among nurse regulators, educators, practitioners, and the scientific community . Manuscripts must be original and must not have been nor will be submitted elsewhere for publication . See www .journalofnursingregulaton .com for author guidelines and manuscript submis-sion information .Letters to the EditorSend to Maryann Alexander at malexander@ncsbn .org

www .journalofnursingregulation .com S3Volume 4/Issue 2 Supplement July 2013
The National Council of State Boards of Nursing (NCSBN) is invested in the collection of nursing workforce data primarily because an adequate number of nurses and a competently prepared workforce lay the foundation of public protection in health care . We are proud to present the 2013 National Nursing Workforce Survey of Registered Nurses, a collaborative
effort between NCSBN and the Forum of State Nursing Workforce Centers (FSNWCs) . A team of scientists from both organiza-tions developed the study and analyzed the data .
The study was conducted from January 2013 to March 2013, and a total of 42,294 registered nurses (RNs) participated in the survey . A random sample of RNs, stratified by state was drawn from all licensed RNs in the United States and territories . The majority of the sample was taken from Nursys®, NCSBN’s licensure database . The remaining six jurisdictions provided state lists of licensees . All licensure information from boards of nursing is updated on a daily basis and is highly accurate . The results provide a comprehensive description of the nursing workforce that constitutes the U .S . health care system today .
National workforce data were traditionally collected by the Health Resources and Services Administration (HRSA), which conducted the National Sample Survey of Registered Nurses every 4 years . In 2010, HRSA released its most recent study, The 2008 National Sample Survey of Registered Nurses . Because an RN survey has not been performed since that time, NCSBN and FSNWCs designed their 2013 study to collect these much-needed data . Efforts have been made in this study to compare the 2013 findings with those of the 2008 HRSA survey, but the reader should be mindful that different survey instruments were used . This study is the first to use the Minimum Dataset (MDS) . FSNWCs developed the MDS through a consensus-building process to help meet the need for one data set that could be used nationally to consistently collect the same data .
In addition to providing a portrait of the current state of the nursing workforce, the data from this study will also: ⦁ allow for an examination of trends by comparison with past HRSA and other nurse workforce data and serve as a baseline for
future data collected using the MDS⦁ allow for state analysis . Each board of nursing and state workforce center will be provided with their state data, and they are free
to conduct their own analysis of their state workforce ⦁ provide workforce statistics and lay the groundwork for future research .
The National Workforce Study is an example of NCSBN’s commitment to generating new knowledge through research . As it commemorates 35 years of service to boards of nursing, NCSBN remains dedicated to advancing the science of nursing regulation and contributing to the body of knowledge that will enhance public protection and make health care safer and more accessible for all .
The 2013 National Nursing Workforce Survey of Registered Nurses
S4 Journal of Nursing Regulation
Introduction
Having an adequate supply of registered nurses (RNs) in the United States workforce is critical to ensuring a safe and effective health care system . Over time, there has been a substantial body of evidence to suggest a potential shortfall of nurses that could have a major impact on health care delivery . The factors contributing to this RN shortage include the
aging of the U .S . population, the aging of the RN workforce, the Patient Protection and Affordable Care Act, which predicts that 30 million more U .S . residents will become insured and seek medical care in the years ahead . Data on the RN workforce can be used to predict possible shortages and assist in the allocation of resources, program development, and recruitment efforts in both the health care system and education sectors .
Over the past 3 decades, the Health Resources and Services Administration (HRSA) has reported on the supply of RNs through the National Sample Survey of Registered Nurses (NSSRN) . Data collection from the most recent, and final, NSSRN was completed in 2008; hence, there are no current data on the nationwide supply of RNs . This current project was conducted by the National Council of State Boards of Nursing (NCSBN) and the Forum of State Nursing Workforce Centers to fill this ongoing need .
A variety of methods to collect workforce data about the U .S . nursing population was examined; the most comprehensive, valid, and cost-effective method was chosen for this study .
Method
Participants
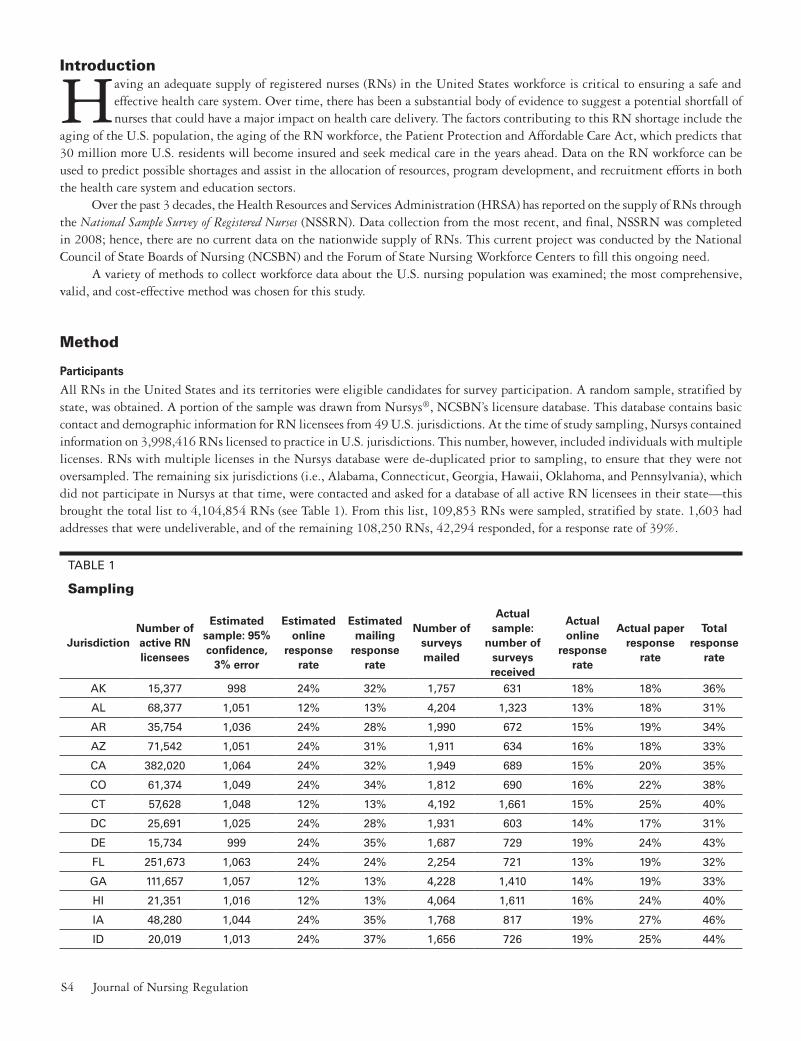
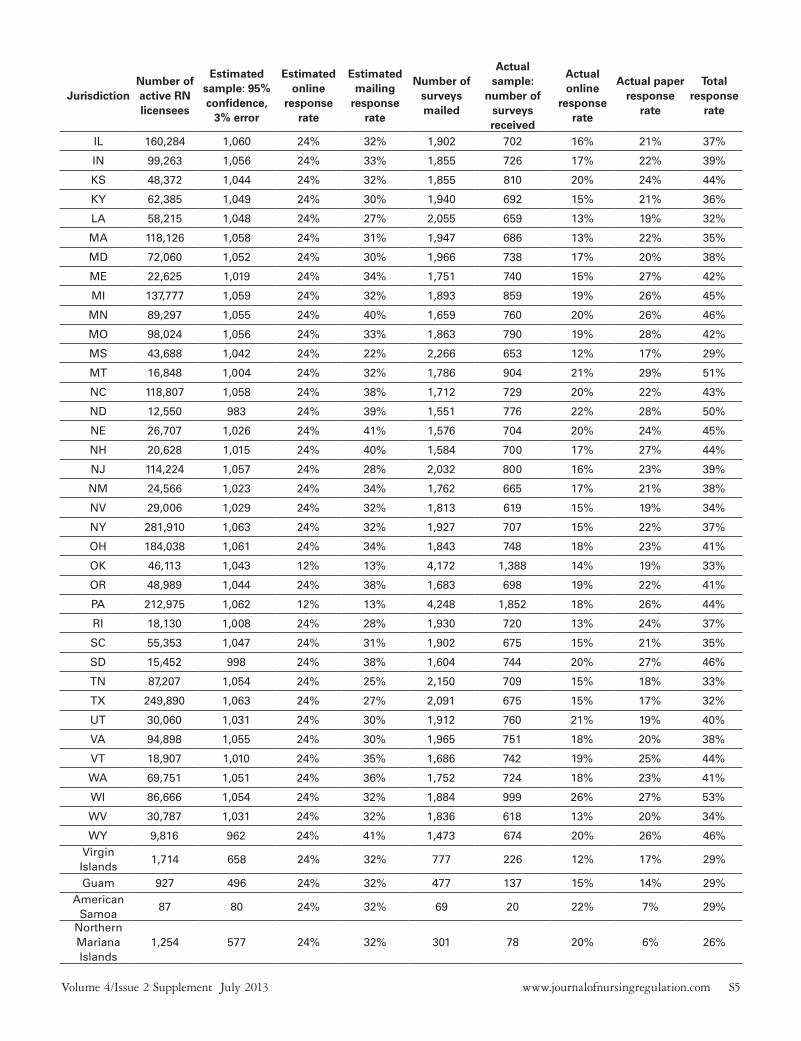
All RNs in the United States and its territories were eligible candidates for survey participation . A random sample, stratified by state, was obtained . A portion of the sample was drawn from Nursys®, NCSBN’s licensure database . This database contains basic contact and demographic information for RN licensees from 49 U .S . jurisdictions . At the time of study sampling, Nursys contained information on 3,998,416 RNs licensed to practice in U .S . jurisdictions . This number, however, included individuals with multiple licenses . RNs with multiple licenses in the Nursys database were de-duplicated prior to sampling, to ensure that they were not oversampled . The remaining six jurisdictions (i .e ., Alabama, Connecticut, Georgia, Hawaii, Oklahoma, and Pennsylvania), which did not participate in Nursys at that time, were contacted and asked for a database of all active RN licensees in their state—this brought the total list to 4,104,854 RNs (see Table 1) . From this list, 109,853 RNs were sampled, stratified by state . 1,603 had addresses that were undeliverable, and of the remaining 108,250 RNs, 42,294 responded, for a response rate of 39% .
TAble 1
Sampling
JurisdictionNumber of active RN licensees
Estimated sample: 95% confidence,
3% error
Estimated online
response rate
Estimated mailing
response rate
Number of surveys mailed
Actual sample:
number of surveys received
Actual online
response rate
Actual paper response
rate
Total response
rate
AK 15,377 998 24% 32% 1,757 631 18% 18% 36%
Al 68,377 1,051 12% 13% 4,204 1,323 13% 18% 31%
AR 35,754 1,036 24% 28% 1,990 672 15% 19% 34%
AZ 71,542 1,051 24% 31% 1,911 634 16% 18% 33%
CA 382,020 1,064 24% 32% 1,949 689 15% 20% 35%
CO 61,374 1,049 24% 34% 1,812 690 16% 22% 38%
CT 57,628 1,048 12% 13% 4,192 1,661 15% 25% 40%
DC 25,691 1,025 24% 28% 1,931 603 14% 17% 31%
De 15,734 999 24% 35% 1,687 729 19% 24% 43%
Fl 251,673 1,063 24% 24% 2,254 721 13% 19% 32%
GA 111,657 1,057 12% 13% 4,228 1,410 14% 19% 33%
HI 21,351 1,016 12% 13% 4,064 1,611 16% 24% 40%
IA 48,280 1,044 24% 35% 1,768 817 19% 27% 46%
ID 20,019 1,013 24% 37% 1,656 726 19% 25% 44%
www .journalofnursingregulation .com S5Volume 4/Issue 2 Supplement July 2013
JurisdictionNumber of active RN licensees
Estimated sample: 95% confidence,
3% error
Estimated online
response rate
Estimated mailing
response rate
Number of surveys mailed
Actual sample:
number of surveys received
Actual online
response rate
Actual paper response
rate
Total response
rate
Il 160,284 1,060 24% 32% 1,902 702 16% 21% 37%
IN 99,263 1,056 24% 33% 1,855 726 17% 22% 39%
KS 48,372 1,044 24% 32% 1,855 810 20% 24% 44%
KY 62,385 1,049 24% 30% 1,940 692 15% 21% 36%
lA 58,215 1,048 24% 27% 2,055 659 13% 19% 32%
MA 118,126 1,058 24% 31% 1,947 686 13% 22% 35%
MD 72,060 1,052 24% 30% 1,966 738 17% 20% 38%
Me 22,625 1,019 24% 34% 1,751 740 15% 27% 42%
MI 137,777 1,059 24% 32% 1,893 859 19% 26% 45%
MN 89,297 1,055 24% 40% 1,659 760 20% 26% 46%
MO 98,024 1,056 24% 33% 1,863 790 19% 28% 42%
MS 43,688 1,042 24% 22% 2,266 653 12% 17% 29%
MT 16,848 1,004 24% 32% 1,786 904 21% 29% 51%
NC 118,807 1,058 24% 38% 1,712 729 20% 22% 43%
ND 12,550 983 24% 39% 1,551 776 22% 28% 50%
Ne 26,707 1,026 24% 41% 1,576 704 20% 24% 45%
NH 20,628 1,015 24% 40% 1,584 700 17% 27% 44%
NJ 114,224 1,057 24% 28% 2,032 800 16% 23% 39%
NM 24,566 1,023 24% 34% 1,762 665 17% 21% 38%
NV 29,006 1,029 24% 32% 1,813 619 15% 19% 34%
NY 281,910 1,063 24% 32% 1,927 707 15% 22% 37%
OH 184,038 1,061 24% 34% 1,843 748 18% 23% 41%
OK 46,113 1,043 12% 13% 4,172 1,388 14% 19% 33%
OR 48,989 1,044 24% 38% 1,683 698 19% 22% 41%
PA 212,975 1,062 12% 13% 4,248 1,852 18% 26% 44%
RI 18,130 1,008 24% 28% 1,930 720 13% 24% 37%
SC 55,353 1,047 24% 31% 1,902 675 15% 21% 35%
SD 15,452 998 24% 38% 1,604 744 20% 27% 46%
TN 87,207 1,054 24% 25% 2,150 709 15% 18% 33%
TX 249,890 1,063 24% 27% 2,091 675 15% 17% 32%
UT 30,060 1,031 24% 30% 1,912 760 21% 19% 40%
VA 94,898 1,055 24% 30% 1,965 751 18% 20% 38%
VT 18,907 1,010 24% 35% 1,686 742 19% 25% 44%
WA 69,751 1,051 24% 36% 1,752 724 18% 23% 41%
WI 86,666 1,054 24% 32% 1,884 999 26% 27% 53%
WV 30,787 1,031 24% 32% 1,836 618 13% 20% 34%
WY 9,816 962 24% 41% 1,473 674 20% 26% 46%Virgin Islands
1,714 658 24% 32% 777 226 12% 17% 29%
Guam 927 496 24% 32% 477 137 15% 14% 29%American
Samoa87 80 24% 32% 69 20 22% 7% 29%
Northern Mariana Islands
1,254 577 24% 32% 301 78 20% 6% 26%

S6 Journal of Nursing Regulation
JurisdictionNumber of active RN licensees
Estimated sample: 95% confidence,
3% error
Estimated online
response rate
Estimated mailing
response rate
Number of surveys mailed
Actual sample:
number of surveys received
Actual online
response rate
Actual paper response
rate
Total response
rate
TOTAl 4,104,853 54,755 23% 30% 109,853 42,294 17% 22% 39%
Note. Alabama, Connecticut, Georgia, Hawaii, Oklahoma, and Pennsylvania were non-Nursys participating boards . These states had larger sample sizes
because it was estimated, based on past response rates, that they would have a lower response rate . estimates for first mailing response rate were
from NCSbN’s Commitment to Ongoing Regulatory excellence (CORe) project; lists from Nursys-participating boards averaged a 32% response rate,
while non-Nursys lists averaged a 13% response rate . HRSA’s (2010) overall paper survey response rate was 27% and overall online response rate was
24% . Nursys-participating states had their RN licensee lists compiled in October 2012 .
Materials
The Forum of State Nursing Workforce Centers minimum dataset (MDS) was utilized for the primary questions on the survey . This instrument was created through a process of consensus-building . Forum workgroups (participating states included Alabama, Colorado, Florida, Hawaii, Illinois, Indiana, Iowa, Massachusetts, New Jersey, North Dakota, Oklahoma, Tennessee, Vermont, and West Virginia) drafted the dataset . Following a public comment period, which allowed input from national organizations, the Forum voted and approved the datasets in September 2009 . NCSBN and the National Forum of State Nursing Workforce Centers currently use the MDS questionnaire to collect data on the nursing workforce at the state-level and believe that the dataset enhances the ability to plan for the future . More information about the development and current status of implementation can be found in Moulton et al . (2013) and Nooney et al . (2010) . Additional questions pertaining to the Nurse Licensure Compact and tele-health were added as a supplement to the MDS by NCSBN (see Appendix A) .
Procedure
Survey distribution opened January 2013 and closed March 2013 using a modified Dillman approach (Dillman, Smyth, & Christian, 2009), which included the following steps:1 . Week 1: RNs in the initial sample received a telephone announcement that they should expect a survey in the mail . The telephone
announcement stated the purpose and importance of completing the survey . The day after the telephone announcement, a letter inviting RNs to participate in the survey was mailed and included a $1 incentive . The letter, which explained the voluntary nature of the survey and the due date for the following week, contained a link for online survey participation . The letter was sent first class to allow the return of invalid addresses .
2 . Week 3: A hardcopy of the survey was sent to nonresponders, and included an online option . Participants were instructed to complete the survey within the following 2 weeks .
3 . Week 5: A telephone announcement was sent to remind nonresponders to complete the survey, and to thank those who had already participated .
4 . Week 7: A hardcopy of the survey was sent to nonresponders, and included an online option . Participants were instructed to complete the survey within the following 2 weeks .
5 . Week 9: Deadline for surveys and closure of the online option .
Nonresponse Analyses and Sample Weighting
A formal nonresponse bias analysis was conducted following the close of the survey . Although response rates are a valuable indica-tor of survey quality, response rates do not give an indication of response biases . An analysi of basic demographic data (i .e ., gender, age, race/ethnicity, number of years since graduation, number of years since first licensed) for all RN licensees sampled from the Nursys database was used to compare the survey respondents, and nonrespondents, to determine the representativeness of the survey participants .
The complete data file, or sample, included 109,853 RNs . Variables on the data file came from either the Nursys database (i .e ., the frame data) or responses to the survey (i .e ., survey data) . The variables used in the nonresponse analysis were from the frame and include state, date of birth, gender, ethnicity, original license date, and graduation date . The dependent variable in the analysis was whether or not the sampled RN completed the questionnaire .
Preliminary analysis . Of the 109,853 RNs in the sample frame, 1,603 had addresses that were undeliverable . Of the re-maining 108,250 RNs, 42,294 responded, for a response rate of 39%1 (see Table 2) . Tables 3 and 4 show the frequencies for the
1 This response rate corresponds to the American Association of Public Opinion’s Response Rate 1, in which the numerator is the number of completed questionnaires and the denominator is the total sample size . Retrieved from www .aapor .org/AM/Template .cfm?Section=Standard_Definitions2&Template=/CM/ContentDisplay .cfm&ContentID=3156

www .journalofnursingregulation .com S7Volume 4/Issue 2 Supplement July 2013
categorical variables . Table 5 shows the descriptive statistics for the continuous variables, while Table 6 shows the number of re-spondents who had complete data on gender, race, age, years since graduation, and years since initial licensure . These 30,187 RNs were the basis of the nonresponse analysis .
TAble 2
Response Bias—Response Rate
(n = 109,853) Percentage
No 67,559 62%
Yes 42,294 39%
TAble 3
Response Bias—Gender
Frequency Percentage Valid percent
Valid Male 5,401 5% 8%
Female 64,250 59% 92%
Total 69,651 63% 100%
Missing Restricted/unknown 13,342 12%
System missing 26,860 25%
TAble 4
Response Bias—Race/Ethnicity
(n = 109,853) Percentage Valid percent
Valid White 25,551 23% 80%
black/African American 2,142 2% 7%
Asian 1,264 1% 4%
Hispanic 1,082 1% 3%
Native American 207 .2% .6%
Pacific Islander 10 .0% .0%
Other 1,754 2% 6%
Total 32,010 29% 100%
Missing Restricted 3,910 4%
Incomplete data 47,073 4%
State not in Nursys database 26,860 25%
Total 77,843 71%

S8 Journal of Nursing Regulation
TAble 5
Response Bias—Descriptive Statistics for Continuous Measures
n M SD Min Max
Age in years 77,279 47 .7 13 .1 20 .1 94 .5
Number of years since graduation 72,062 18 .5 13 .4 .6 73 .9
Number of years since original licensure 82,599 15 .9 12 .6 .5 73 .5
Valid N (listwise) 68,875
TAble 6
Response Bias—Case Had Complete Data for Nonresponse Analysis
Frequency Percentage Valid percent
Valid No 78,382 71% 72%
Yes 30,187 28% 28%
Total 108,569 99% 100%
Missing System 1,284 1%
Total 109,853 100%
Bivariate analysis. Tables 7 and 8 show the bivariate relationships between the demographic variables from the sample frame and whether or not the respondent completed the survey . There were far fewer men in the database (5,401 compared to 64,250 women) and they were less likely to complete the survey (32% compared to 40% among women) .
TAble 7
Response Bias—Survey Completion Rate by Gender
Complete survey?
n No Yes
Male 5,401 68% 32%
Female 64,250 60% 40%
Total 69,651 61% 39%
Note. c2 (1, N = 69,651) = 135 .4, p = .000 .
From Table 8, nurses who identified as White or as a race classified as “Other” were most likely to respond, with response rates of 39% and 41%, respectively . African American and Hispanic nurses were least likely to respond (28% and 30%, respectively) .

www .journalofnursingregulation .com S9Volume 4/Issue 2 Supplement July 2013
TAble 8
Response Bias—Survey Completion Rate by Race/Ethnicity
Complete survey?
Race/ethnicity n No Yes
White 25,551 61% 39%
African American 2,142 72% 28%
Asian 1,264 68% 32%
Hispanic 1,082 70% 30%
Native American 207 67% 32%
Other 1,764 60% 41%
Total 32,010 62% 38%
Note . c2 (5, N = 32,010) = 168 .8, p = .000 .
Table 9 displays the mean age of RNs, mean number of years since graduation, and mean number of years since original licensure by completion status . Those who completed the survey were older than nonrespondents; graduated, on average, 5 years earlier than nonrespondents; and obtained their original license 4 years earlier, on average . All relationships were statistically significant .
TAble 9
Response Bias—Differences in Mean Age, Years Since Graduation, and Years Since Licensure, by Survey Completion
Complete survey? Age in yearsNumber of years since
graduationNumber of years since
original licensure
No n 47,348 44,354 50,460
M 45 .5 16 .6 14 .3
SD 12 .6 12 .4 11 .6
Yes n 29,931 27,708 32,139
M 50 .4 21 .6 18 .5
SD 13 .3 14 .5 13 .6
Total n 77,279 72,062 82,599
M 47 .4 18 .5 15 .9
SD 13 .1 13 .4 12 .6
Note. In all three analyses, F statistics show that the relationships were significant at the .000 level .
Table 10 shows that having complete data on all demographic variables was not related to completing the survey . While demographic characteristics themselves were related to response propensity, the lack of information about these characteristics was not .
Missing data on demographic characteristics were largely a function of the jurisdiction in which the respondent worked . Data on gender were completely missing in three jurisdictions and largely missing (greater than 84% of RNs) in two . Data on race/ethnicity were completely missing in 32 jurisdictions and largely missing (67% of RNs or greater) in six . Date of birth was completely missing in three jurisdictions . In addition, response rates differed significantly by jurisdiction (see Table 1) . The response

S10 Journal of Nursing Regulation
rates ranged from a low of 26% in the Northern Mariana Islands to a high of 53% in Wisconsin (c2(54, N = 109,853) = 1441 .8, p = .000) .
TAble 10
Response Bias—Survey Completion Rate
Complete survey?
Status of data n No Yes
Incomplete 78,382 61% 39%
Complete 30,187 62% 38%
Total 108,569 62% 39%
Note . c2 (1, N = 108,569) = 2 .6, p = .106 .
Multivariate analysis. The final step of the nonresponse analysis was to analyze the effect on response propensity of all five demographic variables simultaneously, via a logistic regression model in which the dependent variable was the dichotomous variable measuring whether or not the RN responded to the questionnaire . The demographic variables were gender, race, age, years since graduation, and years since original licensure . The multivariate analysis demonstrates which demographic characteristics affect the likelihood of responding, while holding constant the others in the model .
In the first model, all variables were coded as categorical, with one category indicating that data on that variable were missing . For example, gender was coded 0 if the data were missing, 1 if the RN was female and 2 if the RN was male . With categorical variables, one category of the variable was omitted from the model and all other categories were compared to the omitted one . For example, with gender, the omitted category was the one indicating gender was missing . Thus, the analysis showed the odds of women responding to the survey compared with those whose gender was not reported . Likewise, it compared men to those with missing data . The analysis did not compare men to women . The continuous variables (i .e ., age, years since graduation, and years since initial licensure) were recoded into five categories based on quintile cutoffs .
In each variable in Model 1, the omitted category was the category indicating missing data . In Table 11, the last two columns are of primary interest . The last column shows the odds of respondents in each category of a variable responding to the survey relative to those in this missing category . If the value in the last column is greater than 1, respondents in that category were more likely to respond . If the value is less than 1, they were less likely to respond . Respondents with missing data do not have a value because they were the reference category . The column labeled “p” shows the significance level of the B coefficient and the odds—the odds ratio is e raised to the power of the B coefficient; hence, the significance test applies to both .
While not every category of every variable was significant, Table 11 does show a pattern of effects . Women were 1 .2 times more likely to complete the survey versus those respondents whose gender was missing from the data file . While men were slightly less likely (odds ratio = .942), the results were not statistically significant .
With respect to race/ethnicity, only the odds for Whites, African Americans, and Hispanics were significant . Whites were slightly more likely to respond than respondents with missing data, while both African Americans and Hispanics were less likely to respond .
All but one category of age was significant . In all but the oldest age category, respondents were less likely to respond than those with missing data; however, the odds ratios increased with each increasing category of age . In the oldest age-group (i .e ., 60 .1 or older), respondents were more likely to complete the survey than those with missing data . A similar pattern was evident in years since graduation—only those with the greatest number of years since graduation (i .e ., 32 .1 or more) were more likely to respond, compared to those with missing data . Respondents in all other categories were less likely . However, in two of the categories, the results were not significant . Respondents in every category of years since licensure were more likely to respond than those with missing data, with the odds ratio increasing with time since licensure, except in category 4 .1 thru 9, which was not statistically significant .
The multivariate model basically confirms the results of the bivariate results . Even when controlling for other variables, women, Whites, older respondents, and those with the greatest number of years since graduation and licensure were more likely to participate in the survey than other respondents .
One other aspect of this model worth noting is the predictive power of the overall model . The first step of the Logistic procedure is to predict the distribution of the outcome variable, without reference to any of the independent variables . In this case, it simply

www .journalofnursingregulation .com S11Volume 4/Issue 2 Supplement July 2013
predicted that none of the respondents would complete the survey . It was correct in 62% of the RNs . After the addition of the five predictor variables, the predictive power of the model increases to only 63% . In addition, the Nagelkerke R2 for the full model was .042 . This suggests that while the five explanatory variables do have some effect on nonresponse, they were not good predictors of it .
TAble 11
Model 1 Logistic Regression with Missing Values Coded as Category
Category B SE B Wald’s c2 df p Odds Ratio
Gender
Missing (reference) 105 .867 2 .000
Female .179 .024 55 .096 1 .000 1 .196
Male - .059 .038 2 .484 1 .115 .942
Race/ethnicity
Missing (reference) 96 .678 6 .000
White .036 .017 4 .543 1 .033 1 .037
black/African American - .411 .050 67 .390 1 .000 .663
Asian - .087 .062 1 .941 1 .164 .917
Hispanic - .251 .068 13 .498 1 .000 .778
Native American - .195 .151 1 .668 1 .197 .823
Other .048 .051 .895 1 .344 1 .049
Age
Missing (reference) 595 .777 5 .000
20 thru 34 - .431 .039 121 .443 1 .000 .650
34 .1 thru 43 - .486 .037 172 .008 1 .000 .615
43 .1 thru 52 - .311 .036 75 .967 1 .000 .733
52 .1 thru 60 - .033 .035 .866 1 .352 .968
60 .1 or older .211 .036 33 .449 1 .000 1 .234
Years since graduation
Missing (reference) 98 .111 5 .000
0 .6 thru 5 - .068 .038 3 .141 1 .076 .934
5 .1 thru 12 - .074 .033 5 .023 1 .025 .929
12 .1 thru 20 - .115 .030 14 .855 1 .000 .892
20 .1 thru 32 - .004 .028 .026 1 .871 .996
32 .1 or more .202 .029 47 .508 1 .000 1 .224

S12 Journal of Nursing Regulation
Category B SE B Wald’s c2 df p Odds Ratio
Years since initial licensure
Missing (reference) 122 .804 5 .000
1 .5 thru 4 .076 .038 3 .994 1 .046 1 .079
4 .1 thru 9 .038 .036 1 .167 1 .280 1 .039
9 .1 thru 17 .092 .034 7 .313 1 .007 1 .097
17 thru 28 .119 .033 13 .207 1 .000 1 .127
28 .1 or more .319 .034 89 .462 1 .000 1 .375
Constant - .520 .012 1760 .262 1 0 .000 .594
The second model, presented in Table 12, was similar to Model 1, with two major exceptions: 1) RNs with missing values were eliminated from analysis . 2) The reference category for gender was male, while for race it was White, Age, years since graduation, and years since initial licensure were continuous variables, rather than categorical .
From Table 12, women were 1 .3 times more likely to complete the questionnaire than men . African American and Hispanic respondents were less likely to respond than white respondents . The coefficients for Native American and Other respondents were not significant . The relationships between age and completion, and years since graduation and completion, were both positive and significant, albeit small . This indicates that older respondents and those who graduated longer ago were more likely to respond . Unlike Model 1, the relationship between years since licensure and completion was not significant .
TAble 12
Model 2 Logistic Regression with Missing Values Coded as Category
Category B SE B Wald’s c2 df p Odds Ratio
Gender
Male (reference)
Female .265 .046 32 .830 1 .000 1 .304
Race/ethnicity
White (reference)
black/African American - .476 .052 82 .656 1 .000 .621
Asian - .350 .087 16 .375 1 .000 .704
Hispanic - .319 .070 20 .515 1 .000 .727
Native American - .245 .151 2 .637 1 .104 .783
Other .007 .052 .020 1 .889 1 .007
Age (continuous) .017 .002 106 .329 1 .000 1 .017
Years since graduation (continuous) .015 .002 47 .404 1 .000 1 .015
Years since initial licensure (continuous)
- .002 .002 .828 1 .363 .998
Constant -1 .715 .073 550 .903 1 .000 .180

www .journalofnursingregulation .com S13Volume 4/Issue 2 Supplement July 2013
The predictive power of Model 2 is similar to Model 1 . In the null model, 62% of the RNs were predicted accurately . In the full model, that percentage increases to 63 .9 . Nagelkerke R2 = .053, suggesting Model 2 was a slightly better fit than Model 1 .
While the analysis provides some insight into the relationship between demographic characteristics and nonresponse, this information cannot be used to make nonresponse adjustments because of the high degree of missing data in the sample frame .
Weights. Post-stratification weights were constructed at the state level, to adjust for differing sampling rates across states . For example, while California accounts for 9% of all RN licenses in the country, it accounts for only about 2% of the sample frame and 2% of the completed interviews . In contrast, Alaska accounts for less than one-half of 1% of the licensees but for 2% of the frame and 2% of the completed surveys . Analysis of the raw data, without accounting for the sample design, would lead to the overall results being too heavily influenced by states with fewer licensees .
Four separate weights were calculated . The descriptive statistics for these weights are presented in Tables 13 and 14 . The weights labeled count_wgtF and count_wgtC were both based on the number of RNs in each jurisdiction in the sample frame (see Table 1) . Count_wgtF is the ratio of the state total in Table 1 to the state total in the sample frame of 109,853 . It weights each case in the frame so it represents all nonsampled RNs in the state as well . As Table 14 illustrates, the sum of count_wgtF is equal to the total number of licenses in the United States given in Table 1 . Count_wgtC was constructed to weight only the completed responses . Applying that weight to the entire frame would result in a weighted sample size that is far greater than the number of licenses in the United States . As Table 14 shows, when applied only to the completed responses, count_wgtC sums to the total population of licenses .
The weight pct_wgtF is the ratio of the population percentage in each state to the frame percentage in each state . Similarly, pct_wgtC is the ratio of the population percent in each state to the percentage of completed responses in each state . These weights sum to the actual n in the data file . When applied to the entire frame, pct_wgtF sums to the frame size of 109,853 . When applied to only the complete responses, pct_wgtC sums to the number of completed responses (i .e ., 42,294) . The weights based on the counts adjust for both the distribution of RNs across states as well as the actual number of responses and can be used when the intent is to estimate population numbers . The weights based on the percents simply adjust the distribution across states, but sum to the actual number of RNs in either the frame or the subset of completed responses . They can be applied when analyzing relationships between variables without the effect of artificially increasing the degrees of freedom and thereby affecting significance tests .
TAble 13
Response Bias—Descriptive Statistics of Weights, Total Frame
n Min Max Sum Mean
count_wgtF 109,853 1 .261 196 .008 4,104,853 .00 37 .367
count_wgtC 109,853 4 .350 554 .456 10,982,919 .86 99 .978
pct_wgtF 109,853 0 .034 5 .246 109,853 .00 1 .000
pct_wgtC 109,853 0 .045 5 .713 113,161 .57 1 .030
TAble 14
Response Bias—Descriptive Statistics of Weights, Complete Responses Only
n Min Max Sum Mean
count_wgtF 42,294 1 .261 196 .008 1,559,834 .27 36 .881
count_wgtC 42,294 4 .350 554 .456 4,104,853 .00 97 .055
pct_wgtF 42,294 0 .034 5 .246 41,743 .88 0 .987
pct_wgtC 42,294 0 .045 5 .713 42,294 .00 1 .000

S14 Journal of Nursing Regulation
ResultsDescriptive statistics were used to analyze survey data . In some cases, the current study’s results were compared to HRSA (2010) results, which were RN workforce data from 2008, and HRSA (2013), which were data from 2008–2010 . Importantly, when comparing the current study’s results to HRSA (2013), it should be noted the data were from individuals who reported their current occupation as nursing and who currently had or were seeking a job . These data were obtained from the U .S . Census Bureau’s American Community Survey . The current study is a survey of a sample of all RN licensees, which included individuals who were not actively employed in nursing . In the current study, 82% of the respondents were actively employed in nursing . Also, when comparing the current study’s results with HRSA (2010), it is important to note that HRSA (2010)’s survey was longer and more detailed; hence, some grouping of the data could not be performed in a similar manner . Data comparisons should be interpreted with caution .
A weighting strategy was used with analyses; as a result, in some cases results may indicate < 1 person in a cell . Also, in some tables, percentages may not sum to exactly 100% because of rounding errors . Throughout the results section the following acronyms are used:⦁ Associate Degree Nursing (ADN)⦁ Baccalaureate Degree Nursing (BSN)⦁ Master of Science Degree Nursing (MSN)⦁ Doctorate of Nursing Practice (DNP)⦁ Doctor of Philosophy (PhD)
Gender, Age, and Ethnic Diversity
Gender. The current study indicated that male RNs (7%) were underrepresented in the nursing workforce (see Table 15) . This percentage is the same as HRSA (2010), while HRSA (2013) found that 9% of the workforce was male .
TAble 15
Gender
(n = 40,365) Percentage
Male 2,679 7%
Female 37,686 93%
Examining highest education of RNs by gender, HRSA (2010) found that half of the RN population had a bachelor’s or higher degree in nursing or a nursing-related field . HRSA (2013) found that 55% of the RN workforce held a bachelor’s or higher degree . Importantly, in HRSA (2010), if a respondent indicated that a non-nursing degree was related to his or her career in nursing, the degree was described as a “nursing-related” degree . Nursing-related degrees included public health, health administration, social work, education, and other fields . The current study did not exclude non-nursing-related degrees from analyses . The current data showed 71% of the male respondents and 62% of female respondents working in nursing held bachelor and higher degrees in nursing and any non-nursing field (see Table 16) .
TAble 16
Highest Education of Registered Nurses Working in Nursing, by Gender
nPercent with bachelor’s or higher degree in nursing
Percent with bachelor’s or higher degree in nursing or any non-nursing field
Men 2,248 1,075 (48%) 1,598 (71%)
Women 29,767 14,900 (50%) 18,369 (62%)
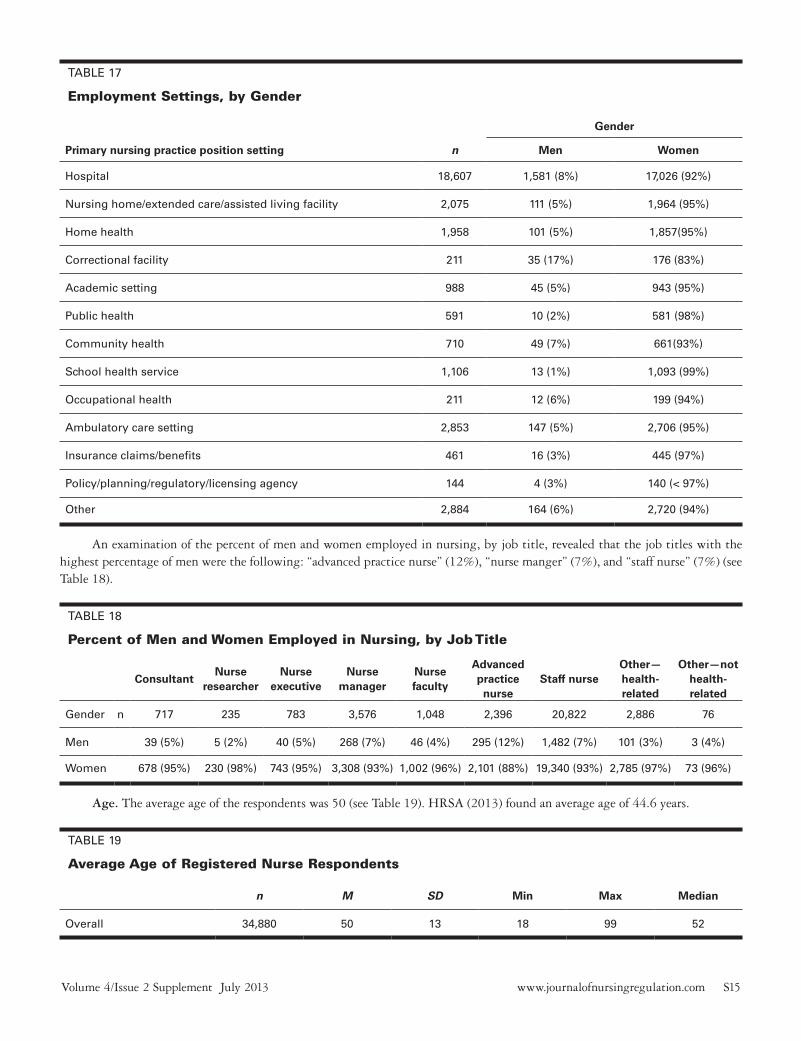
Examining employment settings by gender revealed that the highest percentage of men worked in correctional facilities (17%), while the highest percentage of women worked in school health service (see Table 17) .
www .journalofnursingregulation .com S15Volume 4/Issue 2 Supplement July 2013
TAble 17
Employment Settings, by Gender
Gender
Primary nursing practice position setting n Men Women
Hospital 18,607 1,581 (8%) 17,026 (92%)
Nursing home/extended care/assisted living facility 2,075 111 (5%) 1,964 (95%)
Home health 1,958 101 (5%) 1,857(95%)
Correctional facility 211 35 (17%) 176 (83%)
Academic setting 988 45 (5%) 943 (95%)
Public health 591 10 (2%) 581 (98%)
Community health 710 49 (7%) 661(93%)
School health service 1,106 13 (1%) 1,093 (99%)
Occupational health 211 12 (6%) 199 (94%)
Ambulatory care setting 2,853 147 (5%) 2,706 (95%)
Insurance claims/benefits 461 16 (3%) 445 (97%)
Policy/planning/regulatory/licensing agency 144 4 (3%) 140 (< 97%)
Other 2,884 164 (6%) 2,720 (94%)
An examination of the percent of men and women employed in nursing, by job title, revealed that the job titles with the highest percentage of men were the following: “advanced practice nurse” (12%), “nurse manger” (7%), and “staff nurse” (7%) (see Table 18) .
TAble 18
Percent of Men and Women Employed in Nursing, by Job Title
ConsultantNurse
researcherNurse
executiveNurse
managerNurse faculty
Advanced practice nurse
Staff nurseOther—health-related
Other—not health-related
Gender n 717 235 783 3,576 1,048 2,396 20,822 2,886 76
Men 39 (5%) 5 (2%) 40 (5%) 268 (7%) 46 (4%) 295 (12%) 1,482 (7%) 101 (3%) 3 (4%)
Women 678 (95%) 230 (98%) 743 (95%) 3,308 (93%) 1,002 (96%) 2,101 (88%) 19,340 (93%) 2,785 (97%) 73 (96%)
Age. The average age of the respondents was 50 (see Table 19) . HRSA (2013) found an average age of 44 .6 years .
TAble 19
Average Age of Registered Nurse Respondents
n M SD Min Max Median
Overall 34,880 50 13 18 99 52

S16 Journal of Nursing Regulation
HRSA (2010) found that half of the RNs working in nursing in 2008 were age 46 or older . The current study found that more than half (53%) of the respondents working in nursing were age 50 or older (see Table 20) .
TAble 20
Age Distribution of Registered Nurses Working in Nursing
Younger than 30
30-34 35-39 40-44 45-49 50-54 55-59 60-6465 and older
2,808 (10%) 2,415 (8%) 2,558 (9%) 2,822 (10%) 3,060 (11%) 4,194 (15%) 5,099 (18%) 3,405 (12%) 2,257 (8%)
Ethnic diversity. According to the U .S . Census Bureau (2013), individuals from ethnic and racial minority groups accounted for 37% of the U .S . population in 2012 . The current study found that 19% of responding RNs were minorities (see Table 21) . This percentage is a slight increase from HRSA (2010), which found that 17% were minorities . Additionally, the current study found that 83% of the respondents were White/Caucasian . This was followed by 6% Asian and 6% Black/African American . HRSA (2013) found that 75% of the RN population was White/Caucasian . HRSA (2010) reported that 83% of the RN population was White/Caucasian .
TAble 21
Registered Nurses by Race/Ethnicity
(n = 41,880) Percentage
American Indian or Alaska Native 453 1%
Asian 2,561 6%
black/African American 2,632 6%
Native Hawaiian or Other Pacific Islander 237 1%
White/Caucasian 34,838 83%
Hispanic/latino 1,407 3%
Other 506 1%
An examination of age of RNs working in nursing by race/ethnicity found that Asians were, on average, the youngest (M = 45 .93, SD = 12 .78), while American Indian or Alaska Native were the oldest (M = 51 .45, SD = 11 .23) (see Table 22) .
TAble 22
Mean Current Age of Registered Nurses Working in Nursing, by Race/Ethnicity
n Mean age
American Indian or Alaska Native 482 51 .45 (11 .23)
Asian 1,813 45 .93 (12 .78)
black/African American 1,728 48 .94 (14 .62)
Native Hawaiian or Other Pacific Islander 283 46 .39 (9 .71)
White/Caucasian 29,943 50 .85 (13 .01)
Hispanic/latino 806 43 .96 (14 .80)
Other 280 46 .36 (14 .54)
Note. Standard Deviations are in parentheses .
www .journalofnursingregulation .com S17Volume 4/Issue 2 Supplement July 2013
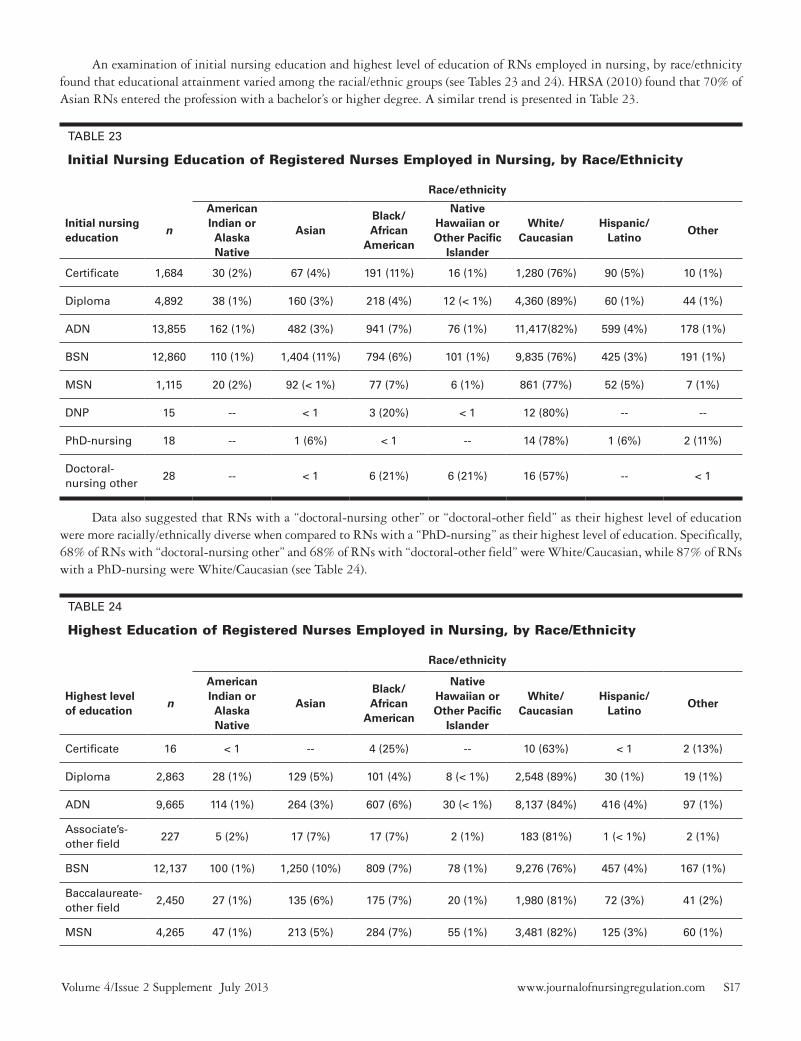
An examination of initial nursing education and highest level of education of RNs employed in nursing, by race/ethnicity found that educational attainment varied among the racial/ethnic groups (see Tables 23 and 24) . HRSA (2010) found that 70% of Asian RNs entered the profession with a bachelor’s or higher degree . A similar trend is presented in Table 23 .
TAble 23
Initial Nursing Education of Registered Nurses Employed in Nursing, by Race/Ethnicity
Race/ethnicity
Initial nursing education
n
American Indian or Alaska Native
AsianBlack/African
American
Native Hawaiian or Other Pacific
Islander
White/Caucasian
Hispanic/Latino
Other
Certificate 1,684 30 (2%) 67 (4%) 191 (11%) 16 (1%) 1,280 (76%) 90 (5%) 10 (1%)
Diploma 4,892 38 (1%) 160 (3%) 218 (4%) 12 (< 1%) 4,360 (89%) 60 (1%) 44 (1%)
ADN 13,855 162 (1%) 482 (3%) 941 (7%) 76 (1%) 11,417(82%) 599 (4%) 178 (1%)
bSN 12,860 110 (1%) 1,404 (11%) 794 (6%) 101 (1%) 9,835 (76%) 425 (3%) 191 (1%)
MSN 1,115 20 (2%) 92 (< 1%) 77 (7%) 6 (1%) 861 (77%) 52 (5%) 7 (1%)
DNP 15 -- < 1 3 (20%) < 1 12 (80%) -- --
PhD-nursing 18 -- 1 (6%) < 1 -- 14 (78%) 1 (6%) 2 (11%)
Doctoral-nursing other
28 -- < 1 6 (21%) 6 (21%) 16 (57%) -- < 1
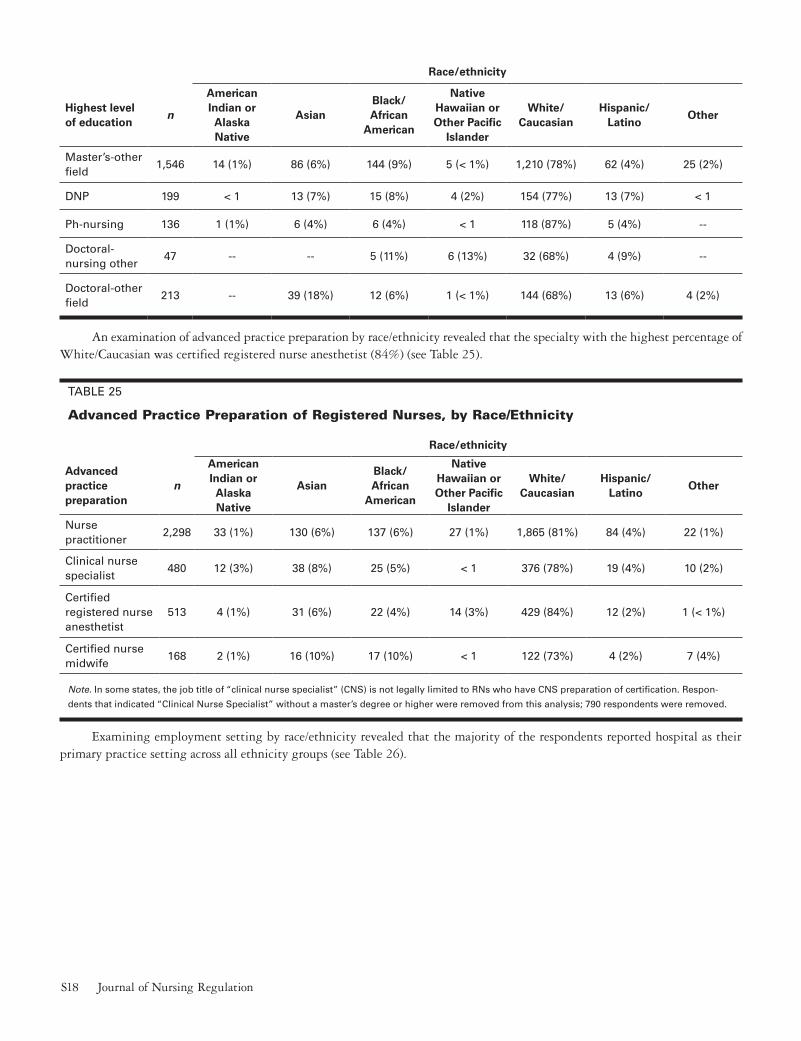
Data also suggested that RNs with a “doctoral-nursing other” or “doctoral-other field” as their highest level of education were more racially/ethnically diverse when compared to RNs with a “PhD-nursing” as their highest level of education . Specifically, 68% of RNs with “doctoral-nursing other” and 68% of RNs with “doctoral-other field” were White/Caucasian, while 87% of RNs with a PhD-nursing were White/Caucasian (see Table 24) .
TAble 24
Highest Education of Registered Nurses Employed in Nursing, by Race/Ethnicity
Race/ethnicity
Highest level of education
n
American Indian or Alaska Native
AsianBlack/African
American
Native Hawaiian or Other Pacific
Islander
White/Caucasian
Hispanic/Latino
Other
Certificate 16 < 1 -- 4 (25%) -- 10 (63%) < 1 2 (13%)
Diploma 2,863 28 (1%) 129 (5%) 101 (4%) 8 (< 1%) 2,548 (89%) 30 (1%) 19 (1%)
ADN 9,665 114 (1%) 264 (3%) 607 (6%) 30 (< 1%) 8,137 (84%) 416 (4%) 97 (1%)
Associate’s-other field
227 5 (2%) 17 (7%) 17 (7%) 2 (1%) 183 (81%) 1 (< 1%) 2 (1%)
bSN 12,137 100 (1%) 1,250 (10%) 809 (7%) 78 (1%) 9,276 (76%) 457 (4%) 167 (1%)
baccalaureate-other field
2,450 27 (1%) 135 (6%) 175 (7%) 20 (1%) 1,980 (81%) 72 (3%) 41 (2%)
MSN 4,265 47 (1%) 213 (5%) 284 (7%) 55 (1%) 3,481 (82%) 125 (3%) 60 (1%)
S18 Journal of Nursing Regulation
Race/ethnicity
Highest level of education
n
American Indian or Alaska Native
AsianBlack/African
American
Native Hawaiian or Other Pacific
Islander
White/Caucasian
Hispanic/Latino
Other
Master’s-other field
1,546 14 (1%) 86 (6%) 144 (9%) 5 (< 1%) 1,210 (78%) 62 (4%) 25 (2%)
DNP 199 < 1 13 (7%) 15 (8%) 4 (2%) 154 (77%) 13 (7%) < 1
Ph-nursing 136 1 (1%) 6 (4%) 6 (4%) < 1 118 (87%) 5 (4%) --
Doctoral-nursing other
47 -- -- 5 (11%) 6 (13%) 32 (68%) 4 (9%) --
Doctoral-other field
213 -- 39 (18%) 12 (6%) 1 (< 1%) 144 (68%) 13 (6%) 4 (2%)
An examination of advanced practice preparation by race/ethnicity revealed that the specialty with the highest percentage of White/Caucasian was certified registered nurse anesthetist (84%) (see Table 25) .
TAble 25
Advanced Practice Preparation of Registered Nurses, by Race/Ethnicity
Race/ethnicity
Advanced practice preparation
n
American Indian or Alaska Native
AsianBlack/African
American
Native Hawaiian or Other Pacific
Islander
White/Caucasian
Hispanic/Latino
Other
Nurse practitioner
2,298 33 (1%) 130 (6%) 137 (6%) 27 (1%) 1,865 (81%) 84 (4%) 22 (1%)
Clinical nurse specialist
480 12 (3%) 38 (8%) 25 (5%) < 1 376 (78%) 19 (4%) 10 (2%)
Certified registered nurse anesthetist
513 4 (1%) 31 (6%) 22 (4%) 14 (3%) 429 (84%) 12 (2%) 1 (< 1%)
Certified nurse midwife
168 2 (1%) 16 (10%) 17 (10%) < 1 122 (73%) 4 (2%) 7 (4%)
Note. In some states, the job title of “clinical nurse specialist” (CNS) is not legally limited to RNs who have CNS preparation of certification . Respon-
dents that indicated “Clinical Nurse Specialist” without a master’s degree or higher were removed from this analysis; 790 respondents were removed .
Examining employment setting by race/ethnicity revealed that the majority of the respondents reported hospital as their primary practice setting across all ethnicity groups (see Table 26) .

www .journalofnursingregulation .com S19Volume 4/Issue 2 Supplement July 2013
TAble 26
Employment Setting of Registered Nurses, by Race/Ethnicity
Race/ethnicity
Primary nursing practice position setting
n
American Indian or Alaska Native
AsianBlack/African
American
Native Hawaiian or
Other Pacific
Islander
White/Caucasian
Hispanic/Latino
Other
Hospital 19,587 193 (1%) 1,456 (7%) 1,274 (7%) 129 (1%)15,521 (79%)
737 (4%) 277 (1%)
Nursing home/extended care/assisted living facility
2,226 21 (1%) 270 (12%) 194 (9%) 20 (1%) 1,637 (74%) 55 (2%) 29 (1%)
Home health 2,076 25 (1%) 80 (4%) 136 (7%) 11 (1%)1,720(83%)
80(4%)
24(1%)
Correctional facility
226 5 (2%) 14 (6%) 14 (6%) < 1 183 (81%) 5 (2%) 5 (2%)
Academic setting
1,007 5 (< 1%) 19 (2%) 70 (7%) 7 (1%) 875 (87%) 16 (2%) 15 (1%)
Public health 613 5 (1%) 50 (8%) 59 (10%) 1 (< 1%) 465 (76%) 19 (3%) 14 (2%)
Community health
764 8 (1%) 33 (4%) 56 (7%) 11 (1%) 607 (79%) 48 (6%) 1 (< 1%)
School health service
1,148 9 (1%) 13 (1%) 60 (5%) < 1 1,026 (89%) 28 (2%) 12 (1%)
Occupational Health
227 3 (1%) 2 (1%) 11 (5%) < 1 194 (85%) 10 (4%) 7 (3%)
Ambulatory care setting
3,028 36 (1%) 119 (4%) 113 (4%) 16 (1%)2,594(86%)
124 (4%) 26 (1%)
Insurance claims/benefits
480 8 (2%) 17 (4%) 57 (12%) 3 (1%) 380 (79%) 13 (3%) 2 (< 1%)
Policy/planning/regulatory/licensing agency
151 < 1 12 (8%) 4 (3%) -- 133 (88%) 1 (1%) 1 (1%)
Other 3,063 36 (1%) 97 (3%) 155 (5%) 7 (< 1%) 2,659 (87%) 85 (3%) 24 (1%)
An examination of RN job titles by race/ethnicity found that “nurse faculty” and “nurse executive” had the least diversity (87% and 86% White/Caucasian), while “staff nurse” had the most diversity (79% White/Caucasian) (see Table 27) .
TAble 27
Job Titles of Registered Nurses, by Race/Ethnicity
Race/ethnicity
Job title of principal nursing position
n
American Indian or Alaska Native
AsianBlack/African
American
Native Hawaiian or Other Pacific
Islander
White/Caucasian
Hispanic/Latino
Other
Consultant 787 10 (1%) 30 (4%) 55 (7%) 12 (2%) 649 (82%) 18 (2%) 13 (2%)
Nurse researcher
248 1 (< 1%) 13 (5%) 7 (3%) -- 199 (80%) 17 (7%) 11 (4%)

S20 Journal of Nursing Regulation
Race/ethnicity
Job title of principal nursing position
n
American Indian or Alaska Native
AsianBlack/African
American
Native Hawaiian or Other Pacific
Islander
White/Caucasian
Hispanic/Latino
Other
Nurse executive
831 10 (1%) 16 (2%) 58 (7%) 6 (1%) 713 (86%) 21 (3%) 7 (1%)
Nurse manager 3,834 45 (1%) 205 (5%) 266 (7%) 27 (1%) 3,129 (82%) 121 (3%) 41 (1%)
Nurse faculty 1,104 10 (1%) 19 (2%) 71 (6%) 7 (1%) 958 (87%) 25 (2%) 14 (1%)
Advanced practice nurse
2,569 29 (1%) 113 (4%) 111 (4%) 25 (1%) 2,170 (84%) 89 (3%) 32 (1%)
Staff nurse 22,252 312 (1%) 1,721 (8%) 1,464 (7%) 126 (1%) 17,511 (79%) 852 (4%) 266 (1%)
Other—health-related
2,997 40 (1%) 85 (3%) 191 (6%) 12 (< 1%) 2,630 (88%) -- 39 (1%)
Other—not health-related
100 < 1 2 (2%) 4 (4%) 1 (1%) 88 (88%) 5 (5%) < 1
Education and Licensing
Education. The current study found an increase in the percentage of respondents with a BSN (36%) as their initial nursing educa-tion, as compared to previous studies (see Table 28) . A little over 39% of RNs held either a BSN (36%) or graduate degree (3%) as their initial credential . This trend toward an increase in the percentage of respondents with an initial BSN degree is in alignment with HRSA (2013) results, which found an increase in BSN-prepared first-time NCLEX-RN® test takers, at 135% growth from 2001 to 2011 . HRSA (2010) found an increase in percentage of baccalaureate- prepared RNs from 18% in 1980 to 34% in 2008 .
TAble 28
Type of Nursing Degree/Credential That Qualified Respondents for First U.S. Nursing License
(n = 41,823) Percentage
Vocational/practical certificate-nursing 1,994 5%
Diploma-nursing 7,365 18%
Associate degree-nursing 16,152 39%
baccalaureate degree-nursing 15,019 36%
Master’s degree-nursing 1,218 3%
Doctoral degree-nursing (DNP) 18 < 1%
Doctoral degree-nursing (PhD) 26 < 1%
Doctoral degree-nursing other 30 < 1%
When asked to indicate highest level of education, 61% of respondents in the current study indicated that they had obtained a baccalaureate or higher degree (see Table 29) . HRSA (2013) found that 55% of RNs reported their highest degree as a baccalaureate or higher . This was an incremental increase from 2000 Census data that indicated 50% of RNs obtained a baccalaureate or higher degree (HRSA, 2013) . HRSA (2010) found an increase in the percentage of RNs with a baccalaureate or higher degree from 28% in 1980 to 50% in 2008; however, this includes baccalaureate or higher degrees in nursing or nursing-related fields .

www .journalofnursingregulation .com S21Volume 4/Issue 2 Supplement July 2013
TAble 29
Highest Level of Education
(n = 41,018) Percentage
Vocational/practical certificate-nursing 25 < 1%
Diploma-nursing 4,319 11%
Associate’s degree-nursing 11,332 28%
Associate’s degree-other field 286 1%
baccalaureate degree-nursing 14,097 34%
baccalaureate degree-other field 3,091 8%
Master’s degree-nursing 4,846 12%
Master’s degree-other field 2,203 5%
Doctoral degree-nursing practice (DNP) 143 < 1%
Doctoral degree-nursing (PhD) 217 1%
Doctoral degree-nursing other 63 < 1%
Doctoral degree-other field 396 1%
Nursing has multiple educational pathways leading to an entry-level license to practice . At the current time, nursing students are able to pursue four different educational pathways to become an RN: MSN, BSN, ADN, and diploma . More recently, an accelerated, second-degree bachelor’s program for students who possess a baccalaureate degree in another field also has become a popular option .
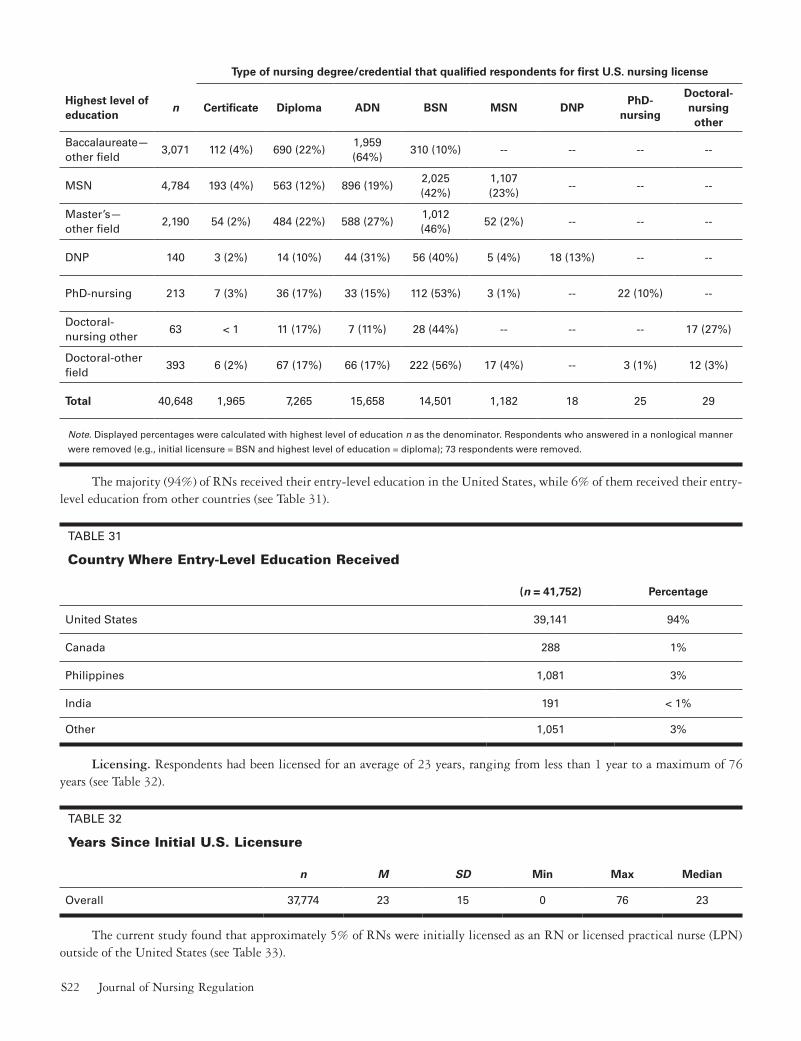
Many RNs pursue additional degrees after initial licensure . HRSA (2010) found that of the RNs whose initial nursing education was diploma, 32% obtained additional degrees after licensure . The degree most commonly obtained was a BSN (13%) . The current study found that of those whose initial nursing education was diploma, 42% obtained additional degrees after licensure; the most common highest level of education inevitably obtained was a BSN (13%) (see Table 30) . In addition to those whose initial nursing education was BSN, 24% obtained higher-level degrees after licensure .
TAble 30
Highest Education of Registered Nurses, by Initial Nursing Education
Type of nursing degree/credential that qualified respondents for first U.S. nursing license
Highest level of education
n Certificate Diploma ADN BSN MSN DNPPhD-
nursing
Doctoral-nursing other
Certificate 15 15 (100%) -- -- -- -- -- -- --
Diploma 4,248 44 (1%)4,204 (99%)
-- -- -- -- -- --
ADN 11,250 997 (9%) 133 (1%)10,120 (90%)
-- -- -- -- --
Associate’s—other field
279 11 (4%)132
(47%)136 (49%) -- -- -- -- --
bSN 13,998 522 (4%) 932 (7%)1,809 (13%)
10,735 (77%)
-- -- -- --
S22 Journal of Nursing Regulation
Type of nursing degree/credential that qualified respondents for first U.S. nursing license
Highest level of education
n Certificate Diploma ADN BSN MSN DNPPhD-
nursing
Doctoral-nursing other
baccalaureate—other field
3,071 112 (4%) 690 (22%)1,959 (64%)
310 (10%) -- -- -- --
MSN 4,784 193 (4%) 563 (12%) 896 (19%)2,025 (42%)
1,107 (23%)
-- -- --
Master’s—other field
2,190 54 (2%) 484 (22%) 588 (27%)1,012 (46%)
52 (2%) -- -- --
DNP 140 3 (2%) 14 (10%) 44 (31%) 56 (40%) 5 (4%) 18 (13%) -- --
PhD-nursing 213 7 (3%) 36 (17%) 33 (15%) 112 (53%) 3 (1%) -- 22 (10%) --
Doctoral-nursing other
63 < 1 11 (17%) 7 (11%) 28 (44%) -- -- -- 17 (27%)
Doctoral-other field
393 6 (2%) 67 (17%) 66 (17%) 222 (56%) 17 (4%) -- 3 (1%) 12 (3%)
Total 40,648 1,965 7,265 15,658 14,501 1,182 18 25 29
Note . Displayed percentages were calculated with highest level of education n as the denominator . Respondents who answered in a nonlogical manner
were removed (e .g ., initial licensure = bSN and highest level of education = diploma); 73 respondents were removed .
The majority (94%) of RNs received their entry-level education in the United States, while 6% of them received their entry-level education from other countries (see Table 31) .
TAble 31
Country Where Entry-Level Education Received
(n = 41,752) Percentage
United States 39,141 94%
Canada 288 1%
Philippines 1,081 3%
India 191 < 1%
Other 1,051 3%
Licensing. Respondents had been licensed for an average of 23 years, ranging from less than 1 year to a maximum of 76 years (see Table 32) .
TAble 32
Years Since Initial U.S. Licensure
n M SD Min Max Median
Overall 37,774 23 15 0 76 23
The current study found that approximately 5% of RNs were initially licensed as an RN or licensed practical nurse (LPN) outside of the United States (see Table 33) .

www .journalofnursingregulation .com S23Volume 4/Issue 2 Supplement July 2013
TAble 33
Country Where Initially Licensed as an RN or LPN
(n = 40,393) Percentage
United States 38,365 95%
Canada 271 1%
Philippines 925 2%
India 123 < 1%
Other 708 2%
An examination of the type of license currently held revealed 7% (see Table 34) to 8% (see Table 35) were licensed as an advanced practice RN (see Tables 34 and 35) .
TAble 34
Type of License Currently Held
(n = 41,658) Percentage
RN 39,522 95%
lPN 216 1%
Advanced practice RN license (include all advanced license statuses in your state) 3,046 7%
TAble 35
Currently Licensed/Certified as an Advanced Practice Registered Nurse (APRN)
(n = 39,278) Overall percentage Percentage of APRNs
Nurse practitioner 2,266 6% 67%
Clinical nurse specialist 469 1% 14%
Certified registered nurse anesthetist 509 1% 15%
Certified nurse midwife 159 < 1% 5%
Not licensed/certified as any of the above 35,875 91% --
Note. In some states, the job title “clinical nurse specialist” is not legally limited to RNs who have CNS preparation of certification . Respondents who
indicated “clinical nurse specialist” without a master’s degree or higher were removed from this analysis; 774 respondents were removed .
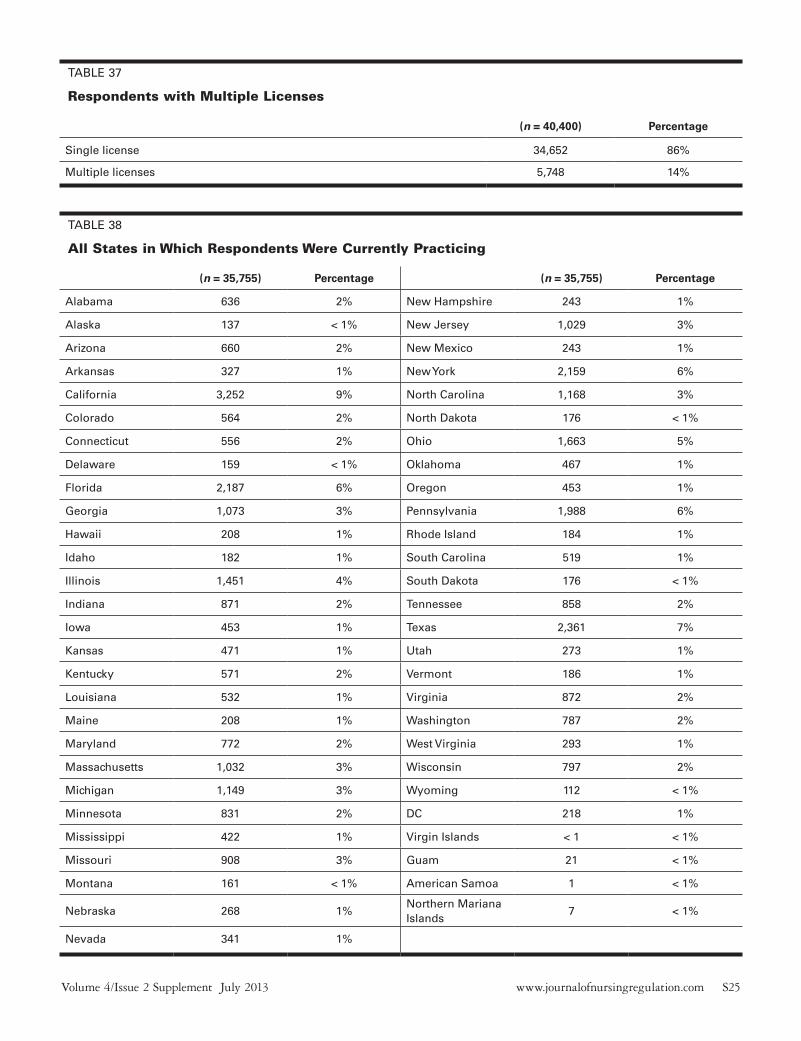
Table 36 shows the percentage of licensees by state . These data illustrate which states have the largest (or smallest) numbers of licensees . In addition, simply because a respondent indicated they have a license in a particular state does not mean they actually practice, or have practiced, in that state—this information is presented in Table 38 . Results indicated that 11% of respondents had a California license, followed by New York (8%), Texas (7%), Florida (7%), and Pennsylvania (7%); 14% of respondents held multiple licenses (see Table 37) .
Table 38 shows percentage of practicing licensees by state . These data illustrate which states have the largest (or smallest) numbers of licensees practicing in their state . Results indicated that 9% of respondents were practicing in California, followed by Texas (7%), Pennsylvania (7%), Florida (6%), and New York (6%); 2% of respondents practiced in multiple states (see Table 39) .

S24 Journal of Nursing Regulation
TAble 36
All States in Which Respondents Had an Active License to Practice as an RN
(n = 40,400) Percentage (n = 40,400) Percentage
Alabama 810 2% New Hampshire 360 1%
Alaska 194 < 1% New Jersey 1,392 3%
Arizona 916 2% New Mexico 366 1%
Arkansas 480 1% New York 3,218 8%
California 4,309 11% North Carolina 1,448 4%
Colorado 793 2% North Dakota 249 1%
Connecticut 767 2% Ohio 2,059 5%
Delaware 263 1% Oklahoma 602 1%
Florida 2,927 7% Oregon 586 1%
Georgia 1,448 4% Pennsylvania 2,706 7%
Hawaii 315 1% Rhode Island 320 1%
Idaho 288 1% South Carolina 709 2%
Illinois 1,883 5% South Dakota 249 1%
Indiana 1,160 3% Tennessee 1,029 3%
Iowa 617 2% Texas 2,855 7%
Kansas 630 2% Utah 386 1%
Kentucky 778 2% Vermont 247 1%
louisiana 665 2% Virginia 1,183 3%
Maine 327 1% Washington 981 2%
Maryland 966 2% West Virginia 376 1%
Massachusetts 1,367 3% Wisconsin 1,036 3%
Michigan 1,530 4% Wyoming 139 < 1%
Minnesota 1,056 3% DC 328 1%
Mississippi 550 1% Virgin Islands 11 < 1%
Missouri 1,231 3% Guam 19 < 1%
Montana 213 1% American Samoa 1 < 1%
Nebraska 339 1%Northern Mariana Islands
9 < 1%
Nevada 423 1%
www .journalofnursingregulation .com S25Volume 4/Issue 2 Supplement July 2013
TAble 37
Respondents with Multiple Licenses
(n = 40,400) Percentage
Single license 34,652 86%
Multiple licenses 5,748 14%
TAble 38
All States in Which Respondents Were Currently Practicing
(n = 35,755) Percentage (n = 35,755) Percentage
Alabama 636 2% New Hampshire 243 1%
Alaska 137 < 1% New Jersey 1,029 3%
Arizona 660 2% New Mexico 243 1%
Arkansas 327 1% New York 2,159 6%
California 3,252 9% North Carolina 1,168 3%
Colorado 564 2% North Dakota 176 < 1%
Connecticut 556 2% Ohio 1,663 5%
Delaware 159 < 1% Oklahoma 467 1%
Florida 2,187 6% Oregon 453 1%
Georgia 1,073 3% Pennsylvania 1,988 6%
Hawaii 208 1% Rhode Island 184 1%
Idaho 182 1% South Carolina 519 1%
Illinois 1,451 4% South Dakota 176 < 1%
Indiana 871 2% Tennessee 858 2%
Iowa 453 1% Texas 2,361 7%
Kansas 471 1% Utah 273 1%
Kentucky 571 2% Vermont 186 1%
louisiana 532 1% Virginia 872 2%
Maine 208 1% Washington 787 2%
Maryland 772 2% West Virginia 293 1%
Massachusetts 1,032 3% Wisconsin 797 2%
Michigan 1,149 3% Wyoming 112 < 1%
Minnesota 831 2% DC 218 1%
Mississippi 422 1% Virgin Islands < 1 < 1%
Missouri 908 3% Guam 21 < 1%
Montana 161 < 1% American Samoa 1 < 1%
Nebraska 268 1%Northern Mariana Islands
7 < 1%
Nevada 341 1%

S26 Journal of Nursing Regulation
TAble 39
Respondents Practicing in Multiple States
(n = 35,755) Percentage
Practice in single state 34,901 98%
Practice in multiple states 854 2%
Employment
In the employment section of the survey, participants were asked about primary and secondary positions . Respondents were given the following definitions:⦁ Primary position: The position at which you work the most hours during your regular work year .⦁ Secondary position: The position at which you work the second greatest number of hours during your regular work year .⦁ Per diem: An arrangement wherein a nurse is employed directly on an as-needed basis and usually has no benefits .
Employment status. HRSA (2010) estimated that 2,596,399 RNs were employed in nursing, representing 85% of licensed RNs . This was the highest rate of nursing employment since HRSA’s first workforce survey in 1977 . Additionally, in 2004 HRSA found full-time employment of 58%; this increased to 63% in 2008 (HRSA, 2010) . The current study’s results revealed a slight decrease from 2008; specifically, 82% of licensees were actively employed in nursing and 60% of licensees were employed full time . Of note, results indicated 7% were unemployed; however, only 3% were actively seeking work as a nurse (see Table 40) .
TAble 40
Employment Status
(n = 42,146) Percentage
Actively employed in nursing 34,399 82%
Full time 25,447 60%
Part time 6,276 15%
Per diem 3,069 7%
Actively employed in a field other than nursing 3,429 8%
Full time 1,713 4%
Part time 1,169 3%
Per diem 513 1%
Working in nursing only as a volunteer 811 2%
Unemployed 2,997 7%
Seeking work as a nurse 1,144 3%
Not seeking work as a nurse 1,463 3%
Retired 4,755 11%
Note. Respondents were asked to mark all that applied . Percentages are calculated off of responding sample .
Of respondents who indicated they were unemployed, approximately half (51%) indicated the reason was because of taking care of home and family . Only 27% of those who gave a reason for unemployment indicated difficulty in finding a nursing position (see Table 41) .

www .journalofnursingregulation .com S27Volume 4/Issue 2 Supplement July 2013
TAble 41
Reasons for Being Unemployed
(n = 2,549) Percentage
Taking care of home and family 1,296 51%
Disabled 504 20%
Inadequate salary 61 2%
School 196 8%
Difficulty in finding a nursing position 683 27%
Other, please specify 1,627 64%
Note. Respondents were asked to mark all that applied .
HRSA (2010) found that RNs were less likely to work in nursing positions as they aged . Among RNs younger than age 50, 90% or more were employed in nursing . HRSA found that the percentages of RNs working in nursing dropped in each age-group older than age 50, decreasing from 88% of RNs age 50 to 54 to 85% of RNs age 55 to 59 and to less than half of RNs older than age 65 . Also, HRSA found that more than 70% of RNs younger than age 30 worked full time . The percentage of RNs age 30 to 59, and working full time, ranged between 65% and 70% . The percent of RNs who worked full time dropped rapidly after age 60, although more than 30% of RNs older than age 70 continued to work in nursing in either full-time or part-time positions . The current study found similar trends; however, employment rates tended to be slightly higher (see Table 42) .
TAble 42
Employment of Registered Nurses, by Age-Group
Age of nurses
EmploymentYounger than 30
30-34 35-39 40-44 45-49 50-54 55-59 60-6465 and older
n 2,985 2,615 2,781 3,077 3,375 4,646 5,888 4,566 4,804
Actively employed in nursing
2,808 (94%)
2,415 (92%)
2,558 (92%)
2,822 (92%)
3,059 (91%)
4,194 (90%)
5,099 (87%)
3,405 (75%)
2,256 (47%)
employed in nursing full time
2,356 (79%)
1,891 (72%)
1,913 (69%)
2,169 (70%)
2,424 (72%)
3,307 (71%)
3,880 (66%)
2,415 (53%)
909 (19%)
employed in nursing part time
321 (11%)
353 (13%)
420 (15%)
486 (16%)
480 (14%)
657 (14%)
917 (16%)
747 (16%)
766 (16%)
employed in other field*
165 (6%)
141 (5%)
213 (8%)
208 (7%)
296 (9%)
429 (9%)
541 (9%)
425 (9%)
308 (6%)
Note . Columns do not sum to age n’s and percentages do not sum to 100% because the employment status question had additional response options
and respondents could select multiple options (see Table 40) . Some respondents may have selected “actively employed in nursing”; however, they may
not have specified full time or part time . Hence, those numbers will not sum to “actively employed in nursing” totals .
*Some respondents may have been both employed in another field and actively employed in nursing .
Employment rates of RNs vary by initial and highest education . HRSA (2010) found that more than 87% of RNs whose initial RN education was an ADN, BSN, or MSN reported that they were employed in nursing positions . This is compared to less than 75% of those whose initial education was a nursing diploma . The current study found that 85% to 90% of RNs whose initial
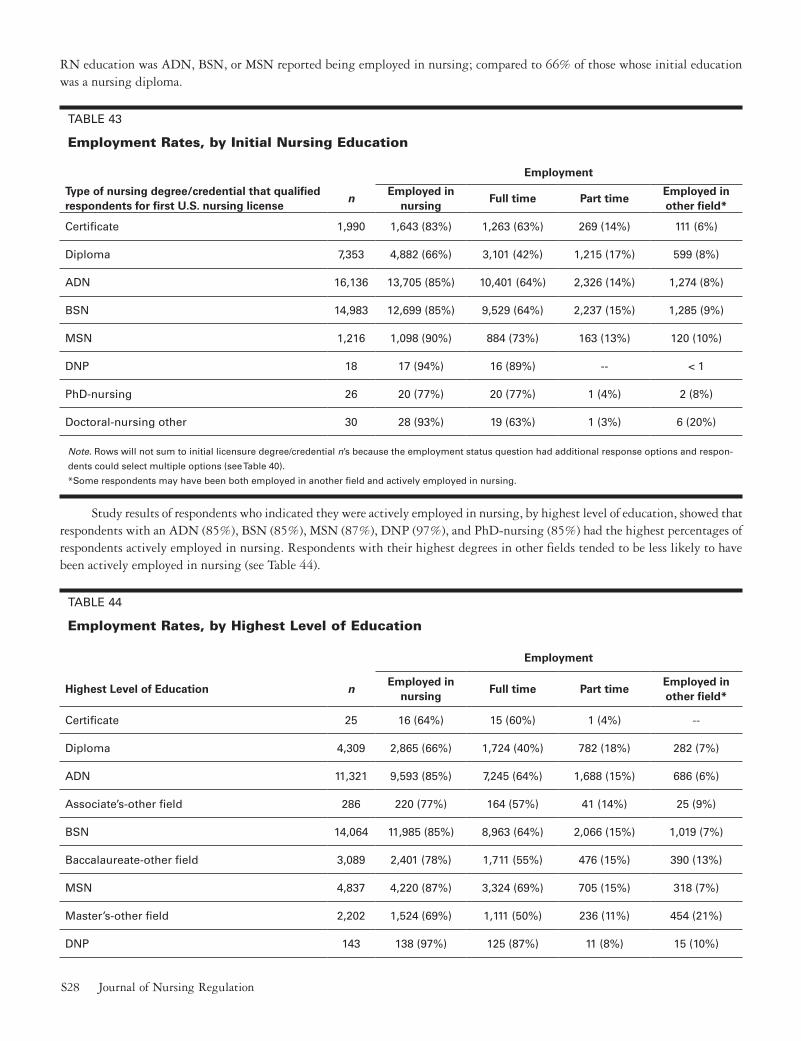
S28 Journal of Nursing Regulation
RN education was ADN, BSN, or MSN reported being employed in nursing; compared to 66% of those whose initial education was a nursing diploma .
TAble 43
Employment Rates, by Initial Nursing Education
Employment
Type of nursing degree/credential that qualified respondents for first U.S. nursing license
nEmployed in
nursingFull time Part time
Employed in other field*
Certificate 1,990 1,643 (83%) 1,263 (63%) 269 (14%) 111 (6%)
Diploma 7,353 4,882 (66%) 3,101 (42%) 1,215 (17%) 599 (8%)
ADN 16,136 13,705 (85%) 10,401 (64%) 2,326 (14%) 1,274 (8%)
bSN 14,983 12,699 (85%) 9,529 (64%) 2,237 (15%) 1,285 (9%)
MSN 1,216 1,098 (90%) 884 (73%) 163 (13%) 120 (10%)
DNP 18 17 (94%) 16 (89%) -- < 1
PhD-nursing 26 20 (77%) 20 (77%) 1 (4%) 2 (8%)
Doctoral-nursing other 30 28 (93%) 19 (63%) 1 (3%) 6 (20%)
Note . Rows will not sum to initial licensure degree/credential n’s because the employment status question had additional response options and respon-
dents could select multiple options (see Table 40) .
*Some respondents may have been both employed in another field and actively employed in nursing .
Study results of respondents who indicated they were actively employed in nursing, by highest level of education, showed that respondents with an ADN (85%), BSN (85%), MSN (87%), DNP (97%), and PhD-nursing (85%) had the highest percentages of respondents actively employed in nursing . Respondents with their highest degrees in other fields tended to be less likely to have been actively employed in nursing (see Table 44) .
TAble 44
Employment Rates, by Highest Level of Education
Employment
Highest Level of Education nEmployed in
nursingFull time Part time
Employed in other field*
Certificate 25 16 (64%) 15 (60%) 1 (4%) --
Diploma 4,309 2,865 (66%) 1,724 (40%) 782 (18%) 282 (7%)
ADN 11,321 9,593 (85%) 7,245 (64%) 1,688 (15%) 686 (6%)
Associate’s-other field 286 220 (77%) 164 (57%) 41 (14%) 25 (9%)
bSN 14,064 11,985 (85%) 8,963 (64%) 2,066 (15%) 1,019 (7%)
baccalaureate-other field 3,089 2,401 (78%) 1,711 (55%) 476 (15%) 390 (13%)
MSN 4,837 4,220 (87%) 3,324 (69%) 705 (15%) 318 (7%)
Master’s-other field 2,202 1,524 (69%) 1,111 (50%) 236 (11%) 454 (21%)
DNP 143 138 (97%) 125 (87%) 11 (8%) 15 (10%)

www .journalofnursingregulation .com S29Volume 4/Issue 2 Supplement July 2013
Employment
Highest Level of Education nEmployed in
nursingFull time Part time
Employed in other field*
PhD-nursing 217 184 (85%) 157 (72%) 17 (8%) 23 (11%)
Doctoral-nursing other 63 47 (75%) 37 (59%) 3 (5%) 11 (17%)
Doctoral-other field 395 214 (54%) 149 (38%) 43 (11%) 97 (25%)
Note . Columns will not sum to highest level of education n’s because the employment status question had additional response options and respon-
dents could select multiple options (see Table 40) .
*Some respondents may have been both employed in another field and actively employed in nursing .
An examination of the number of positions respondents were currently employed in as an RN revealed that approximately 15% of employed licensees held more than one nursing position (see Table 45) .
TAble 45
Number of Positions Respondents Were Currently Employed in as a Nurse
(n = 33,264) Percentage
1 28,069 84%
2 4,435 13%
3 or more 761 2%
Note. Survey participants were asked to answer this question only if they were actively employed in nursing .
HRSA (2010) found that more than 12% of RNs who had full-time principal nursing positions reported at least one other nursing job, and 14% of those with part-time positions reported more than one nursing job . The current study found similar results (see Table 46) .
TAble 46
Registered Nurses Holding Multiple Positions, by Primary Employment Status
Full time in principal position(n = 24,755)
Part time in principal position(n = 5,999)
No additional nursing position 21,035 (85%) 4,973 (83%)
Holds 2 nursing positions 3,191 (13%) 859 (14%)
Holds 3 or more nursing positions 528 (2%) 166 (3%)
Position setting. In 2004, HRSA found that 57% of respondents’ primary employment setting was a hospital; this increased to 62% in 2008 (HRSA, 2010) . The current study’s results indicated a return to 2004 levels at 57% (see Table 47), followed by 9% of RNs in ambulatory care, 6% in home health, and 6% in nursing homes . These findings were similar to those reported by HRSA (2010) .

S30 Journal of Nursing Regulation
TAble 47
Primary Nursing Practice Position Setting
(n = 34,238) Percentage
Hospital 19,343 56%
Nursing home/extended care/assisted living facility 2,211 6%
Home health 2,058 6%
Correctional facility 229 1%
Academic setting 1,012 3%
Public health 609 2%
Community health 740 2%
School health service 1,146 3%
Occupational health 224 1%
Ambulatory care setting 2,994 9%
Insurance claims/benefits 477 1%
Policy/planning/regulatory/licensing agency 152 < 1%
Other 3,042 9%
Note . Survey participants were asked to answer this question only if they were actively employed in nursing .
In the current study, 26% of RNs reported a secondary nursing position, the same percent reported by HRSA in 2010 . The largest percent of secondary positions was reported in hospitals; 25% of RNs reported working in this setting . This is much lower than the 43% reported by HRSA (2010) and is most likely explained by the 15% of RNs who reported “other” as their secondary practice setting in the current study . Nursing home/extended care (12%), home health (12%), ambulatory care (11%) were similar to previous reports, as are community and public health, occupational health, school services, and insurance claims (see Table 48) .
TAble 48
Secondary Nursing Practice Position Setting
(n = 7,524) Percentage
Hospital 1,868 25%
Nursing home/extended care/assisted living facility 892 12%
Home health 899 12%
Correctional facility 98 1%
Academic setting 621 8%
Public health 177 2%
Community health 334 4%
School health service 357 5%
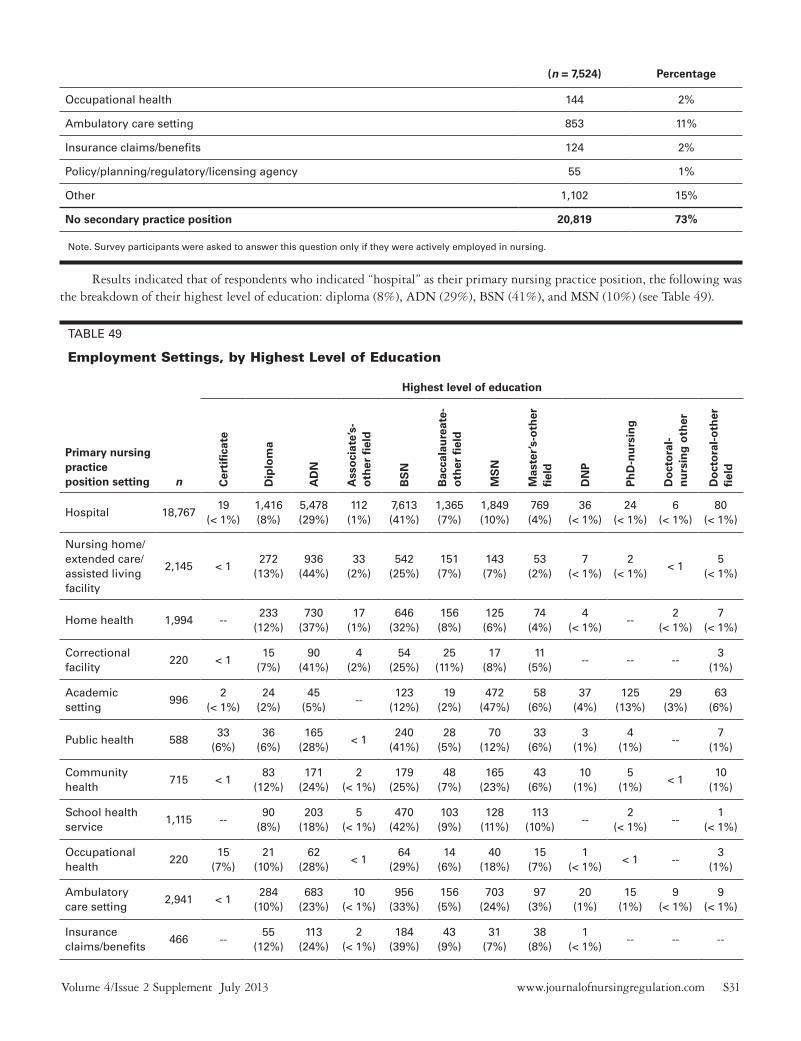
www .journalofnursingregulation .com S31Volume 4/Issue 2 Supplement July 2013
(n = 7,524) Percentage
Occupational health 144 2%
Ambulatory care setting 853 11%
Insurance claims/benefits 124 2%
Policy/planning/regulatory/licensing agency 55 1%
Other 1,102 15%
No secondary practice position 20,819 73%
Note . Survey participants were asked to answer this question only if they were actively employed in nursing .
Results indicated that of respondents who indicated “hospital” as their primary nursing practice position, the following was the breakdown of their highest level of education: diploma (8%), ADN (29%), BSN (41%), and MSN (10%) (see Table 49) .
TAble 49
Employment Settings, by Highest Level of Education
Highest level of education
Primary nursing practice position setting n C
erti
fica
te
Dip
lom
a
AD
N
Ass
oci
ate’
s-o
ther
fie
ld
BS
N
Bac
cala
ure
ate-
oth
er f
ield
MS
N
Mas
ter’
s-o
ther
fi
eld
DN
P
Ph
D-n
urs
ing
Do
cto
ral-
nu
rsin
g o
ther
Do
cto
ral-
oth
er
fiel
d
Hospital 18,76719
(< 1%)1,416 (8%)
5,478 (29%)
112 (1%)
7,613 (41%)
1,365 (7%)
1,849 (10%)
769 (4%)
36 (< 1%)
24 (< 1%)
6 (< 1%)
80 (< 1%)
Nursing home/extended care/assisted living facility
2,145 < 1272
(13%)936
(44%)33
(2%)542
(25%)151 (7%)
143 (7%)
53 (2%)
7 (< 1%)
2 (< 1%)
< 15
(< 1%)
Home health 1,994 --233
(12%)730
(37%)17
(1%)646
(32%)156 (8%)
125 (6%)
74 (4%)
4 (< 1%)
--2
(< 1%)7
(< 1%)
Correctional facility
220 < 115
(7%)90
(41%)4
(2%)54
(25%)25
(11%)17
(8%)11
(5%)-- -- --
3 (1%)
Academic setting
9962
(< 1%)24
(2%)45
(5%)--
123 (12%)
19 (2%)
472 (47%)
58 (6%)
37 (4%)
125 (13%)
29 (3%)
63 (6%)
Public health 58833
(6%)36
(6%)165
(28%)< 1
240 (41%)
28 (5%)
70 (12%)
33 (6%)
3 (1%)
4 (1%)
--7
(1%)
Community health
715 < 183
(12%)171
(24%)2
(< 1%)179
(25%)48
(7%)165
(23%)43
(6%)10
(1%)5
(1%)< 1
10 (1%)
School health service
1,115 --90
(8%)203
(18%)5
(< 1%)470
(42%)103 (9%)
128 (11%)
113 (10%)
--2
(< 1%)--
1 (< 1%)
Occupational health
22015
(7%)21
(10%)62
(28%)< 1
64 (29%)
14 (6%)
40 (18%)
15 (7%)
1 (< 1%)
< 1 --3
(1%)
Ambulatory care setting
2,941 < 1284
(10%)683
(23%)10
(< 1%)956
(33%)156 (5%)
703 (24%)
97 (3%)
20 (1%)
15 (1%)
9 (< 1%)
9 (< 1%)
Insurance claims/benefits
466 --55
(12%)113
(24%)2
(< 1%)184
(39%)43
(9%)31
(7%)38
(8%)1
(< 1%)-- -- --

S32 Journal of Nursing Regulation
Highest level of education
Primary nursing practice position setting n C
erti
fica
te
Dip
lom
a
AD
N
Ass
oci
ate’
s-o
ther
fie
ld
BS
N
Bac
cala
ure
ate-
oth
er f
ield
MS
N
Mas
ter’
s-o
ther
fi
eld
DN
P
Ph
D-n
urs
ing
Do
cto
ral-
nu
rsin
g o
ther
Do
cto
ral-
oth
er
fiel
d
Policy/planning/regulatory/licensing agency
152 --5
(3%)32
(21%)2
(1%)32
(21%)33
(22%)21
(14%)17
(11%)-- < 1 --
10 (7%)
Other 2,958 --352
(12%)837
(28%)39
(1%)803
(27%)232 (8%)
435 (15%)
213 (7%)
15 (1%)
8 (< 1%)
< 125
(1%)
Total 33,278 22 2,885 9,545 224 11,907 2,373 4,200 1,532 136 185 47 223
Note . Percentages were calculated with primary nursing practice position setting’s n as the denominator .
Employment settings may change with age . HRSA (2010) found that 85% of RNs younger than age 30 worked in hospitals; however, this percentage declined with age, where 50% of RNs age 55 and older worked in hospitals . HRSA explained this as hospitals offer a good initial career development opportunity for a new RN because new RNs can gain hands-on experience with patients with many different needs while having the support of other experienced clinicians . Nonhospital settings (e .g ., home health, public and community health, nursing homes, and academic education) were employment settings for a larger percentages of older RN age-groups . The current study found that 79% of RNs younger than age 30 worked in hospitals; this percentage declined with age, where 46% of RNs age 55 and older worked in hospitals (see Table 50) .
TAble 50
Employment Settings, by Age-Group
Age-group
Younger than 30
30-34 35-39 40-44 45-49 50-54 55-59 60-6465 and over
Primary nursing practice position setting
n 2,815 2,398 2,548 2,801 3,034 4,169 5,053 3,389 2,295
Hospital2,220 (79%)
1,692 (71%)
1,615 (63%)
1,693 (60%)
1,846 (61%)
2,289 (55%)
2,595 (51%)
1,553 (46%)
812 (35%)
Nursing home/extended care/assisted living facility
164 (6%) 143 (6%) 143 (6%) 183 (7%) 160 (5%) 240 (6%) 286 (6%) 242 (7%) 245 (11%)
Home health 76 (3%) 85 (4%) 156 (6%) 172 (6%) 180 (6%) 249 (6%) 315 (6%) 227 (7%) 228 (10%)
Correctional facility
6 (< 1%) 9 (< 1%) 12 (< 1%) 13 (< 1%) 32 (1%) 31 (1%) 31 (1%) 20 (1%) 25 (1%)
Academic setting 8 (< 1%) 27 (1%) 42 (2%) 55 (2%) 52 (2%) 139 (3%) 191 (4%) 187 (6%) 112 (5%)
Public health 34 (1%) 28 (1%) 36 (1%) 38 (1%) 37 (1%) 73 (2%) 115 (2%) 94 (3%) 38 (2%)
Community health
39 (1%) 50 (2%) 57 (2%) 79 (3%) 54 (2%) 70 (2%) 83 (2%) 85 (3%) 85 (4%)
School health service
53 (2%) 40 (2%) 68 (3%) 81 (3%) 111 (4%) 161 (4%) 184 (4%) 148 (4%) 111 (5%)

www .journalofnursingregulation .com S33Volume 4/Issue 2 Supplement July 2013
Age-group
Younger than 30
30-34 35-39 40-44 45-49 50-54 55-59 60-6465 and over
Primary nursing practice position setting
n 2,815 2,398 2,548 2,801 3,034 4,169 5,053 3,389 2,295
Occupational health
4 (< 1%) 3 (< 1%) 8 (< 1%) 21 (1%) 26 (1%) 20 (< 1%) 41 (1%) 24 (1%) 38 (2%)
Ambulatory care setting
107 (4%) 160 (7%) 224 (9%) 232 (8%) 254 (8%) 426 (10%) 530 (10%) 359 (11%) 205 (9%)
Insurance claims/benefits
9 (< 1%) 17 (1%) 30 (1%) 52 (2%) 43 (1%) 58 (1%) 93 (2%) 63 (2%) 22 (1%)
Policy/planning/regulatory/licensing agency
-- 2 (< 1%) 9 (< 1%) 3 (< 1%) 5 (< 1%) 23 (1%) 43 (1%) 14 (< 1%) 23 (1%)
Other 94 (3%) 142 (6%) 150 (6%) 177 (6%) 234 (8%) 389 (9%) 546 (11%) 372 (11%) 352 (15%)
Position title. In 2004, HRSA found that 64% of respondents’ primary job title was “staff nurse”; this increased to 66% in 2008 (HRSA, 2010) . The current study’s results indicated a return to 2004 levels at 64% (see Table 51) . This is followed by 13% of RNs in management positions and 3% nurse faculty, the same percent reported by HRSA (2010) . The 7% of RNs identified as advanced practice was an increase over the 5% reported by HRSA (2010) .
TAble 51
Primary Nursing Practice Position Title
(n = 34,357) Percentage
Consultant 772 2%
Nurse researcher 251 1%
Nurse executive 834 2%
Nurse manager 3,792 11%
Nurse faculty 1,105 3%
Advanced practice nurse 2,531 7%
Staff nurse 21,902 64%
Other–health-related 3,069 9%
Other–not health-related 99 < 1%
Note. Survey participants were asked to answer this question only if they were actively employed in nursing .
The largest number of secondary position titles was “staff nurse” (55%), followed by 12% of RNs reporting a secondary position in “other–health-related” position . These findings were not surprising based on the secondary practice setting reported in Table 48 . Nine percent of RNs reported a secondary position in management and another 9% reported a secondary position as an advanced practice nurse . A secondary position as nurse faculty and consultant was reported by 8% and 5% of RNs with a secondary position, respectively . Only 1% of RNs reported a secondary position in research (see Table 52) .

S34 Journal of Nursing Regulation
TAble 52
Secondary Nursing Practice Position Title
(n = 8,301) Percentage
Consultant 386 5%
Nurse researcher 69 1%
Nurse executive 158 2%
Nurse manager 586 7%
Nurse faculty 629 8%
Advanced practice nurse 780 9%
Staff nurse 4,558 55%
Other–health-related 1,011 12%
Other–not health-related 124 1%
No secondary practice position 21,134 72%
Note . Survey participants were asked to answer this question only if they were actively employed in nursing .
An examination of job titles by highest level of education revealed that of respondents who indicated “staff nurse” as their primary nursing practice position title, 41% had BSN as highest level of education, while only 4% indicated MSN as highest level of education . In terms of nurse faculty, these respondents’ highest level of education was as follows: MSN (43%), DNP (3%), PhD-nursing (10%), doctoral-nursing other (2%), doctoral-other field (5%) (see Table 53) .
TAble 53
Job Titles, by Highest Level of Education
Primary nursing practice position title
ConsultantNurse
researcherNurse
executiveNurse
managerNurse faculty
Advanced practice nurse
Staff nurseOther–health-related
Other–not health-related
Highest level of education
n 759 238 804 3,699 1,080 2,466 21,236 2,996 98
Diploma 68 (9%) 19 (8%) 33 (4%) 349 (9%) 25 (2%) 44 (2%) 1,979 (9%) 330 (11%) 20 (20%)
ADN 133 (18%) 29 (12%) 158 (20%) 1,056 (29%) 127 (12%) 72 (3%) 7,288 (34%) 699 (23%) 23 (23%)
bSN 137 (18%) 82 (34%) 157 (20%) 1,281 (35%) 164 (15%) 137 (6%) 8,760 (41%) 1,088 (36%) 33 (34%)
MSN 133 (18%) 47 (20%) 194 (24%) 432 (12%) 463 (43%) 1,886 (76%) 767 (4%) 303 (10%) 4 (4%)
DNP 5 (1%) 1 (< 1%) 19 (2%) 7 (< 1%) 27 (3%) 71 (3%) 3 (< 1%) 5 (< 1%) --
PhD-nursing 5 (1%) 7 (3%) 19 (2%) 6 (< 1%) 112 (10%) 29 (1%) 1 (< 1%) 7 (< 1%) 1 (1%)
Doctoral-nursing other
< 1 -- 6 (1%) < 1 26 (2%) 12 (< 1%) 2 (< 1%) -- --
Doctoral-other field
26 (3%) 10 (4%) 13 (2%) 12 (< 1%) 56 (5%) 26 (1%) 62 (< 1%) 12 (< 1%) 1 (1%)
Note. Highest level of education does not sum to 100% because not all response options are displayed .

www .journalofnursingregulation .com S35Volume 4/Issue 2 Supplement July 2013
Employment specialty. In the current study 17% of RNs reported their primary practice specialty as acute care/critical care followed by 13% who reported a medical-surgical specialty . RNs reported specializing in population-specific care for example, 6% reported a geriatric specialty and 6% reported a pediatric specialty . Five percent of RNs reported maternal-child health as a specialty; all other specialty positions were reported to be less than 5% . Rehabilitation and women’s health both were identified as a specialty by 2% of RNs, a finding similar to that reported by HRSA (2010) where rehabilitation specialty was 3% and women’s health 4% . Twenty percent of RNs reported their specialty in the “other” category (see Table 54) .
TAble 54
Primary Nursing Practice Position Employment Specialty
(n = 33,516) Percentage
Acute care/critical care 5,789 17%
Adult health/family health 872 3%
Anesthesia 654 2%
Community 335 1%
Geriatric/gerontology 1,989 6%
Home health 1,515 5%
Maternal-child health 1,662 5%
Medical-surgical 4,249 13%
Occupational health 333 1%
Oncology 953 3%
Palliative care 499 1%
Pediatrics/neonatal 1,996 6%
Primary care 857 3%
Psychiatric/mental health/substance abuse 1,341 4%
Public health 511 2%
Rehabilitation 691 2%
School health 1,097 3%
Tele-health 388 1%
Trauma 566 2%
Women’s health 651 2%
Other 6,568 20%
Note. Survey participants were asked to answer this question only if they were actively employed in nursing .
The data showed that 13% of RNs reported secondary specialty in acute care/critical care and 10% in medical-surgical; 21% reported “other” as a specialty, which explains the lower percent reported in acute-care areas . Geriatrics and home health were reported as a secondary specialty by 8% and 7% of RNs, respectively . Pediatrics was reported as a secondary specialty by 5% of RNs; 4% or less of RN participants reported all other specialties (see Table 55) .

S36 Journal of Nursing Regulation
TAble 55
Secondary Nursing Practice Position Employment Specialty
(n = 7,879) Percentage
Acute care/critical care 1,010 13%
Adult health/family health 262 3%
Anesthesia 197 3%
Community 179 2%
Geriatric/gerontology 627 8%
Home health 539 7%
Maternal-child health 311 4%
Medical-surgical 758 10%
Occupational health 127 2%
Oncology 145 2%
Palliative care 142 2%
Pediatrics/neonatal 374 5%
Primary care 226 3%
Psychiatric/mental health/substance abuse 354 4%
Public health 152 2%
Rehabilitation 189 2%
School health 285 4%
Tele-health 85 1%
Trauma 151 2%
Women’s health 127 2%
Other 1,639 21%
No secondary practice position 21,252 73%
Note. Survey participants were asked to answer this question only if they were actively employed in nursing .
The most prevalent primary clinical specialties in respondents’ principal nursing position in hospital settings were “acute care/critical care” (29%) followed by “medical-surgical” (19%) . In nonhospital settings the most prevalent primary clinical specialties were “geriatric/gerontology” (14%) and home health (11%) . Although in both hospital and nonhospital settings large percentages selected “other” (17%, 24%) (see Table 56) . Primary clinical specialty in principal nursing position, by highest level of education results are presented in Table 57 .

www .journalofnursingregulation .com S37Volume 4/Issue 2 Supplement July 2013
TAble 56
Primary Clinical Specialty in Principal Nursing Position for Hospital and Nonhospital Settings
Work setting
Primary nursing practice position employment specialtyHospital setting
(n = 18,716)Nonhospital setting
(n = 13,361)
Acute care/critical care 5,475 (29%) 291 (2%)
Adult health/family health 93 (< 1%) 757 (6%)
Anesthesia 516 (3%) 129 (1%)
Community 20 (< 1%) 304 (2%)
Geriatric/gerontology 53 (< 1%) 1,910 (14%)
Home health 8 (< 1%) 1,489 (11%)
Maternal-child health 1,441 (8%) 209 (2%)
Medical-surgical 3,621 (19%) 597 (4%)
Occupational health 50 (< 1%) 269 (2%)
Oncology 537 (3%) 407 (3%)
Palliative care 54 (< 1%) 438 (3%)
Pediatrics/neonatal 1,383 (7%) 562 (4%)
Primary care 114 (1%) 722 (5%)
Psychiatric/mental health/substance abuse 707 (4%) 605 (5%)
Public health 11 (< 1%) 488 (4%)
Rehabilitation 396 (2%) 284 (2%)
School health -- 46 (< 1%)
Tele-health 176 (1%) 211 (2%)
Trauma 525 (3%) 32 (< 1%)
Women’s health 291 (2%) 347 (3%)
Other 3,243 (17%) 3,264 (24%)
TAble 57
Primary Clinical Specialty in Principal Nursing Position, by Highest Level of Education
Highest level of education
Primary nursing practice position employment specialty
n Diploma ADN BSN MSN DNPPhD-
nursing
Acute care/critical care 5,617 330 (6%) 1,583 (28%) 2,385 (42%) 588 (10%) 15 (< 1%) 31 (1%)
Adult health/family health 851 57 (7%) 153 (18%) 188 (22%) 326 (38%) 13 (2%) 13 (2%)
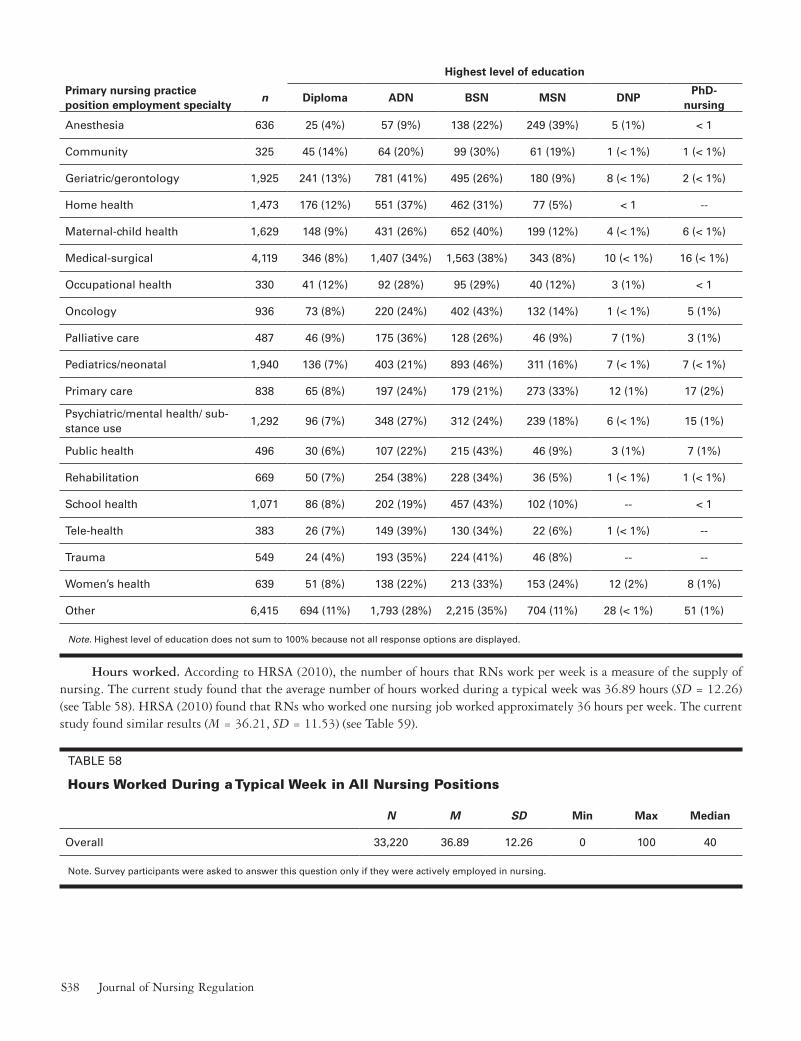
S38 Journal of Nursing Regulation
Highest level of education
Primary nursing practice position employment specialty
n Diploma ADN BSN MSN DNPPhD-
nursing
Anesthesia 636 25 (4%) 57 (9%) 138 (22%) 249 (39%) 5 (1%) < 1
Community 325 45 (14%) 64 (20%) 99 (30%) 61 (19%) 1 (< 1%) 1 (< 1%)
Geriatric/gerontology 1,925 241 (13%) 781 (41%) 495 (26%) 180 (9%) 8 (< 1%) 2 (< 1%)
Home health 1,473 176 (12%) 551 (37%) 462 (31%) 77 (5%) < 1 --
Maternal-child health 1,629 148 (9%) 431 (26%) 652 (40%) 199 (12%) 4 (< 1%) 6 (< 1%)
Medical-surgical 4,119 346 (8%) 1,407 (34%) 1,563 (38%) 343 (8%) 10 (< 1%) 16 (< 1%)
Occupational health 330 41 (12%) 92 (28%) 95 (29%) 40 (12%) 3 (1%) < 1
Oncology 936 73 (8%) 220 (24%) 402 (43%) 132 (14%) 1 (< 1%) 5 (1%)
Palliative care 487 46 (9%) 175 (36%) 128 (26%) 46 (9%) 7 (1%) 3 (1%)
Pediatrics/neonatal 1,940 136 (7%) 403 (21%) 893 (46%) 311 (16%) 7 (< 1%) 7 (< 1%)
Primary care 838 65 (8%) 197 (24%) 179 (21%) 273 (33%) 12 (1%) 17 (2%)
Psychiatric/mental health/ sub-stance use
1,292 96 (7%) 348 (27%) 312 (24%) 239 (18%) 6 (< 1%) 15 (1%)
Public health 496 30 (6%) 107 (22%) 215 (43%) 46 (9%) 3 (1%) 7 (1%)
Rehabilitation 669 50 (7%) 254 (38%) 228 (34%) 36 (5%) 1 (< 1%) 1 (< 1%)
School health 1,071 86 (8%) 202 (19%) 457 (43%) 102 (10%) -- < 1
Tele-health 383 26 (7%) 149 (39%) 130 (34%) 22 (6%) 1 (< 1%) --
Trauma 549 24 (4%) 193 (35%) 224 (41%) 46 (8%) -- --
Women’s health 639 51 (8%) 138 (22%) 213 (33%) 153 (24%) 12 (2%) 8 (1%)
Other 6,415 694 (11%) 1,793 (28%) 2,215 (35%) 704 (11%) 28 (< 1%) 51 (1%)
Note. Highest level of education does not sum to 100% because not all response options are displayed .
Hours worked. According to HRSA (2010), the number of hours that RNs work per week is a measure of the supply of nursing . The current study found that the average number of hours worked during a typical week was 36 .89 hours (SD = 12 .26) (see Table 58) . HRSA (2010) found that RNs who worked one nursing job worked approximately 36 hours per week . The current study found similar results (M = 36 .21, SD = 11 .53) (see Table 59) .
TAble 58
Hours Worked During a Typical Week in All Nursing Positions
N M SD Min Max Median
Overall 33,220 36 .89 12 .26 0 100 40
Note . Survey participants were asked to answer this question only if they were actively employed in nursing .

www .journalofnursingregulation .com S39Volume 4/Issue 2 Supplement July 2013
TAble 59
Average Hours Worked per Week in All Nursing Jobs, by Number of Nursing Jobs
Number of positions respondents were currently employed in as a nurse
n M SD Min Max Median
1 27,223 36 .21 11 .53 0 100 40
2 4,285 41 .49 13 .62 0 100 40
3 or more 739 41 .86 14 .07 0 100 40
The average hours worked per week in all nursing positions, by age-group, is presented in Table 60 . Results revealed that respondents age 40 to 59 tended to work the most hours per week . With the exception of respondents age 65 and older, there were very small differences in average hours worked per week .
TAble 60
Average Hours Worked per Week in All Nursing Positions, by Age-Group
Age-group n M SD Min Max Median
Younger than 30 2,931 37 .19 8 .47 0 90 36
30-34 2,602 36 .61 10 .02 0 96 37
35-39 2,551 36 .66 11 .53 0 95 39
40-44 2,697 38 .10 11 .85 0 100 40
45-49 2,924 38 .78 11 .44 0 96 40
50-54 3,936 38 .79 11 .46 0 100 40
55-59 4,893 38 .15 11 .68 0 100 40
60-64 3,339 36 .51 12 .56 0 90 40
65 and older 2,004 26 .89 16 .60 0 100 24
In terms of average hours worked per week, by highest level of education, DNPs, on average, worked the most (M = 47 .12, SD = 11 .94), followed by PhD-nursing (M = 44 .97, SD = 17 .33), noting that PhD-nursing had higher median number of hours . Respondents with a diploma in nursing worked the fewest (M = 33 .36, SD = 14 .27) (see Table 61) . This mirrors the fact that those with diplomas tend to be older, and older RNs work less hours . These results are similar to HRSA’s (2010) findings .
TAble 61
Average Hours Worked per Week in All Nursing Positions, by Highest Level of Education
Highest level of education n M SD Min Max Median
Certificate 14 41 .64 12 .30 24 80 40
Diploma 2,682 33 .36 14 .27 0 99 36
ADN 9,171 37 .07 11 .38 0 100 40
Associate’s-other field 215 37 .20 12 .64 0 74 40
bSN 11,992 36 .36 11 .40 0 100 38
baccalaureate-other field 2,278 36 .11 12 .00 0 96 38

S40 Journal of Nursing Regulation
Highest level of education n M SD Min Max Median
MSN 3,993 39 .97 12 .84 0 100 40
Master’s-other field 1,455 37 .38 14 .19 0 90 40
DNP 130 47 .12 11 .94 4 90 48
PhD-nursing 164 44 .97 17 .33 0 80 50
Doctoral-nursing other 37 41 .22 13 .16 8 70 40
Doctoral-other field 220 35 .97 16 .43 0 95 40
An examination of average hours worked per week in respondents’ principal nursing position revealed that respondents who worked in academic settings (M = 45 .74, SD = 8 .67) and home health tended to work the most (M = 44 .12, SD = 9 .11) . Respondents who worked in school health service tended to work the least (M = 40 .04, SD = 6 .50) (see Table 62) . HRSA (2010) showed similar results .
TAble 62
Average Hours per Week in Principal Nursing Position, by Full-Time/Part-Time Status and Employment Setting
Full-time/part-time status
Primary nursing practice position setting Mean hours/week full time Mean hours/week part time
Hospital 41 .01 (8 .36) 26 .38 (8 .08)
Nursing home/extended care/assisted living facility 43 .51 (8 .89) 22 .22 (9 .67)
Home health 44 .12 (9 .11) 22 .65 (10 .34)
Correctional facility 42 .20 (6 .33) 30 .20 (14 .75)
Academic setting 45 .74 (8 .67) 20 .16 (10 .33)
Public health 40 .78 (6 .72) 23 .23 (9 .56)
Community health 41 .88 (7 .71) 22 .51 (8 .95)
School health service 40 .04 (6 .50) 22 .57 (12 .37)
Occupational health 42 .55 (7 .02) 20 .54 (8 .44)
Ambulatory care setting 41 .74 (7 .47) 25 .14 (8 .34)
Insurance claims/benefits 42 .94 (7 .65) 25 .31 (7 .47)
Policy/planning/regulatory/licensing agency 42 .06 (9 .66) 19 .59 (11 .83)
Other 42 .64 (8 .02) 22 .41 (9 .92)
Note. Standard deviations are in parentheses .
The number of hours worked can also be associated with job title . Respondents with the job title “nurse executive” worked the most (M = 48 .42, SD = 9 .04), while those with the job title “staff nurse” worked the fewest (M = 40 .17, SD = 7 .74) (see Table 63) .

www .journalofnursingregulation .com S41Volume 4/Issue 2 Supplement July 2013
TAble 63
Average Hours per Week in Principal Nursing Position, by Full-time/Part-time Status and Job Title
Full-time/part-time status
Primary Nursing Practice Position Setting Mean hours/week full time Mean hours/week part time
Consultant 42 .86 (8 .19) 20 .62 (10 .22)
Nurse researcher 42 .79 (6 .89) 21 .79 (7 .32)
Nurse executive 48 .42 (9 .04) 26 .13 (16 .84)
Nurse manager 44 .86 (8 .77) 26 .23 (10 .29)
Nurse faculty 44 .91 (8 .86) 20 .47 (10 .56)
Advanced practice nurse 43 .19 (9 .21) 25 .56 (9 .48)
Staff nurse 40 .17 (7 .74) 25 .25 (8 .74)
Other–health-related 42 .46 (7 .28) 22 .46 (9 .51)
Other–not health-related 43 .28 (6 .76) 20 .97 (9 .28)
Note. Standard deviations are in parentheses .
Nurses not employed in nursing. Findings from HRSA (2010) estimated that 29% of RNs not working in nursing were age 65 or older . The current study’s results indicated that of RNs not employed in nursing, 19% were between ages 60 and 64 and 42% were age 65 or older; 3% of RNs not employed in nursing were younger than age 30 (see Table 64) . In the current study, “nurses not employed in nursing” included those respondents who indicated they were actively employed in a field other than nursing, unemployed RNs, and retired RNs . Differences in grouping may explain the differences between HRSA’s (2010) results and the current study’s results .
TAble 64
Age Distribution of Nurses Who Were Not Employed in Nursing
Younger than 30
30-34 35-39 40-44 45-49 50-54 55-59 60-6465 and older
177 (3%) 200 (3%) 222 (4%) 255 (4%) 315 (5%) 452 (7%) 788 (13%) 1,160 (19%) 2,548 (42%)
Respondents who were seeking employment in nursing, by age, indicated that 12% were younger than age 30, 16% were between ages 55 and 59, and 16% were between ages 60 and 64 . Respondents between the ages of 30 and 39 had the lowest employment-seeking percentages (7%) (see Table 65) .
TAble 65
Percent of Registered Nurses Seeking Nursing Employment by Age
Younger than 30
30-34 35-39 40-44 45-49 50-54 55-59 60-6465 and older
115 (12%) 67 (7%) 66 (7%) 80 (9%) 80 (9%) 94 (10%) 152 (16%) 150 (16%) 136 (14%)
Nurse Faculty
As a result of shortages of qualified faculty, especially of doctorally prepared nursing faculty, the capacity for accepting qualified applicants into prelicensure nursing education programs is limited . This is occurring at a time when the need and demand for RNs continue to grow (American Association of Colleges of Nursing, 2012) . The ability of a nursing program to expand its capacity to

S42 Journal of Nursing Regulation
admit additional students is directly dependent on the numbers of qualified faculty . In the current study only 10% of nurse faculty reported having a PhD in nursing and an additional 3% reported having a DNP . The minimum educational qualification for a nurse faculty position is an MSN, of which 43% of nurse faculty held (see Table 53) .
In addition to the 1,105 (3%) respondents who reported their primary nursing position as faculty in an academic nursing program, there were 615 RNs who were employed as faculty in their secondary nursing position (see Table 66) . Those RNs employed in part-time positions as faculty usually focus on clinical education of nursing students in clinical settings, or teach one or two didactic courses a year . Of the 615 RNs employed as faculty in a secondary nursing position, 37% reported their principal nursing position as a staff nurse, 27% reported their primary nursing position as nurse manager/executive or advanced practice nurse, and 26% reported their principal nursing position as nurse faculty . These part-time nurse faculty serve an important role in enabling nursing education programs to more cost-effectively and efficiently implement their curriculum and provide supervision and instruction for students in clinical settings, as well as to expand their capacity to admit larger numbers of nursing students .
TAble 66
Registered Nurses Employed as Faculty in Their Secondary Nursing Position(s), by Job Title of Principal Nursing Position
Faculty in secondary nursing position
Job title of principal nursing position n = 615 Percentage
Consultant 18 3%
Nurse researcher 8 1%
Nurse executive 25 4%
Nurse manager 70 11%
Nurse faculty 162 26%
Advanced practice nurse 72 12%
Staff nurse 225 37%
Other–health-related 34 6%
Other–not health-related -- --
In the current study, 72% of respondents who held a principal position as full-time faculty were age 50 and older, indicating the potential and emerging shortage of nurse faculty in the future . Only 14% were younger than age 40, indicating that younger RNs are not choosing to work as full-time faculty . Of those with a secondary faculty position, 63% were age 50 and older, and 17% were younger than age 40 . These data are comparable to those of HRSA (2010), which found that almost 60% of nursing faculty were older than age 50, and only 15% were younger than age 40 . It continues to be evident that younger RNs are not choosing to work as faculty in academic nursing education programs (see Table 67) .
TAble 67
Age Distribution of Registered Nurses Who Work as Faculty
Faculty position
AgePrincipal position
(n = 889)Secondary position
(n = 480)
Younger than 30 34 (4%) 23 (5%)
30-34 33 (4%) 20 (4%)
35-39 53 (6%) 38 (8%)
40-44 55 (6%) 46 (10%)

www .journalofnursingregulation .com S43Volume 4/Issue 2 Supplement July 2013
Faculty position
AgePrincipal position
(n = 889)Secondary position
(n = 480)
45-49 76 (9%) 53 (11%)
50-54 147 (17%) 72 (15%)
55-59 171 (19%) 110 (23%)
60-64 195 (22%) 70 (15%)
65 and older 126 (14%) 48 (10%)
In response to the item on hours worked per week by RNs who were faculty in their principal nursing position, 41% reported working 40 to 47 hours per week, with an additional 30% reporting they work 48 to over 56 hours per week . These results are comparable to those of HRSA (2010), where 37% of faculty reported they worked 40 to 47 hours per week, and 33% reported they worked 48 or more hours per week (see Table 68) .
TAble 68
Hours Worked per Week, by Registered Nurses Who Were Faculty in Their Principal Nursing Position
Faculty in principal nursing position
Hours worked per week n = 1,048 Percentage
1-15 93 9%
16-23 67 6%
24-31 65 6%
32-39 89 8%
40-47 433 41%
48-55 207 20%
56 or more 95 9%
Advanced Practice Registered Nurses
Advanced practice registered nurses (APRNs) are a vital part of the health system of the United States . APRNs consist of nurse practitioners (NPs), certified nurse midwives (CNMs), certified registered nurse anesthetists (CRNAs), and clinical nurse specialists (CNSs) . They are RNs educated at master’s or post-master’s/doctoral level and in a specific role and patient population . They have advanced education, knowledge, and skills to care for a specific population of patients, including adults, families, children, and neonates . APRNs can also provide gender-specific health care (such as women’s health) or psychiatric/mental health services . They are educationally prepared to assess, diagnose, and manage patient problems, including ordering tests and prescribing medications . APRNs work in a variety of settings, including hospitals, clinics, and private offices . They can provide care in places where there is a shortage of physicians and health care is badly needed (AcademyHealth, 2007; NCSBN, 2013) .
In the current study, 3,046 RNs reported also being licensed/certified as an APRN . This represents 7% of the total responding sample . Of those indicating recognition as an APRN, 54% identified themselves as NPs, 30% as CNSs, 12% as CRNAs, and 4% as CNMs . These proportions are somewhat different than the known proportions of APRNs (Phillips, 2009, 2013) . The current study’s sample was representative of CNMs and NPs, while CNSs were overrepresented, and CRNAs were somewhat underrepresented .
Over the last 4 years, the number of APRNs has increased 29% . According to an annual survey of boards of nursing, the increase has occurred in all APRN categories (Phillips, 2009, 2013) . The number of NPs increased from 108,787 in 2008 to 144,249 in 2012—a 33% increase . CRNAs had the most substantial increase, up 46% since 2008 and CNSs and CNMs increased 19% and 26%, respectively .

S44 Journal of Nursing Regulation
Nurse practitioners. The current survey found that 40% of NPs were age 55 or older, compared to 30% found in HRSA (2013) . Eleven percent of working NPs were age 65 or older, compared to 6% of NPs just 5 years earlier . The percent of NPs younger than age 40 has remained unchanged at 25% since the last HRSA survey (see Table 69) .
TAble 69
Age Distribution of Registered Nurses Prepared as Nurse Practitioners
Age of nurse practitioner
Younger than 30
30-34 35-39 40-44 45-49 50-54 55-59 60-6465 and older
70 (4%) 192 (11%) 174 (10%) 214 (12%) 200 (11%) 242 (13%) 325 (18%) 204 (11%) 196 (11%)
In terms of NPs’ highest level of education, 89% of NPs had a master’s degree or higher . This was essentially unchanged from HRSA (2010) results . However, the proportion of NPs who were doctorally prepared has increased from 4% to 9% (see Table 70) .
TAble 70
Nurse Practitioner Preparation, by Highest Level of Education
Highest level of education
Diploma ADNADN-other field
BSNBaccalaure-ate/other
fieldMSN
Master’s-other field
PhD-nursing
DNPDoctoral-nursing other
Doctoral-other field
54 (2%) 33(1%) 9 (<1%)129 (6%)
24 (1%) 1,698 (77%) 47 (2%) 47 (2%) 86 (4%) 18 (< 1%) 63 (3%)
In terms of job titles, 81% of NPs reported having a job title of “advanced practice nurse (APN) .” This demonstrates a shift to more NPs working with the APN title . HRSA (2010) found that 70% of NPs reported having “nurse practitioner” as their job title . This increase in the use of the APN title coincides with a decrease in all the other job title categories (see Table 71) .
TAble 71
Job Titles of Nurse Practitioners
Job Titles
ConsultantNurse
researcherNurse
executiveNurse
managerNurse faculty
Advanced practice nurse
Staff nurseOther–health-related
Other–not health-related
16 (< 1%) 13 (< 1%) 27 (1%) 41 (2%) 99 (5%) 1,648 (81%) 171 (8%) 29 (1%) 1 (< 1%)
In terms of clinical specialties, 15% of NPs in this survey reported primary care as their principal clinical specialty area . Other settings where NPs were working included 16% in adult/family health, 10% in pediatrics/neonatal settings, and 5% in geriatric/gerontological settings (see Table 72) . While an “advanced practice nurse” title was the most common job title for NPs working in primary care, NPs with other job titles reported working in primary care settings as well (see Table 73) .
TAble 72
Primary Clinical Specialties of Employed Nurse Practitioners With Job Title of Nurse Practitioner
Nurse practitioners
Primary clinical specialties of nurse practitioners (n = 2,023) Percentage
Acute care/critical care 204 10%
Adult health/family health 326 16%

www .journalofnursingregulation .com S45Volume 4/Issue 2 Supplement July 2013
Nurse practitioners
Primary clinical specialties of nurse practitioners (n = 2,023) Percentage
Anesthesia 15 1%
Community 16 1%
Geriatric/gerontology 92 5%
Home health 5 < 1%
Maternal-child health 39 2%
Medical-surgical 62 3%
Occupational health 38 2%
Oncology 55 3%
Palliative care 18 < 1%
Pediatrics/neonatal 206 10%
Primary care 295 15%
Psychiatric/mental health/substance abuse 145 7%
Public health 16 < 1%
Rehabilitation 12 < 1%
School health 35 2%
Tele-health 6 < 1%
Trauma 16 < 1%
Women’s health 138 7%
Other 284 14%
TAble 73
Employed Nurse Practitioners in Primary Care, by Job Title
Nurse practitioners in primary care
Job title (n = 294) Percentage
Consultant 1 < 1%
Nurse researcher -- --
Nurse executive 1 < 1%
Nurse manager 11 4%
Nurse faculty 12 4%
Advanced practice nurse 266 90%
Staff nurse 5 2%
NPs provide care in a variety of work environments: Hospital settings accounted for 28% of the practice settings, 48% of NPs worked in ambulatory care and other community-based settings, and 6% worked in academic settings . Adding to the diversity of

S46 Journal of Nursing Regulation
work environments, when compared to HRSA (2010) results, there was a large increase in the “Other” category, up to 14% from 2% (see Table 74) .
TAble 74
Employment Settings in Which Nurse Practitioners Work
(n = 2,012)
Hospital 561 (28%)
Nursing home/extended care/assisted living facility 94 (5%)
Home health 50 (3%)
Correctional facility 8 (< 1%)
Academic setting 127 (6%)
Public health 51 (3%)
Community health 156 (8%)
School health service 59 (3%)
Occupational health 31 (2%)
Ambulatory care setting 590 (29%)
Insurance claims/benefits 9 (< 1%)
Policy/planning/regulatory/licensing agency 4 (< 1%)
Other 272 (14%)
For NPs who selected primary care as their employment speciality, 44% worked in ambulatory care settings, 19% worked in public/community health settings, 7% worked in hospitals, and 5% worked in educational settings (see Table 75) .
TAble 75
Employment Setting of Nurse Practitioners in Primary Care
HospitalAcademic educa-
tionPublic/community
healthSchool health Ambulatory care Other
22 (7%) 14 (5%) 58 (19%) 8 (3%) 129 (44%) 54 (18%)
Certified nurse midwives. In 2012 there were 7,777 nurse midwives, up from 6,173 in 2008, a 26% increase in the total number of CNMs (Phillips, 2009, 2013) . There is a trend towards the aging of the nurse midwife workforce, more so than any other group of APRNs . The current study found fewer younger CNMs: 20% were younger than age 40, compared to HRSA’s (2013) 23% . Similarly, there were increased numbers of CNMs in the older age categories: 63% were age 50 or older compared to HRSA’s (2010) 55% . A striking 31% of CNMs in the current study were age 65 or older, a 20% jump from HRSA (2010) results (see Table 76) .
TAble 76
Age Distribution of Registered Nurses Prepared as Nurse Midwives
Younger than 30
30-34 35-39 40-44 45-49 50-54 55-59 60-6465 and older
2 (2%) 14 (11%) 10 (7%) 12 (9%) 11 (8%) 13 (10%) 30 (22%) 11 (8%) 30 (23%)
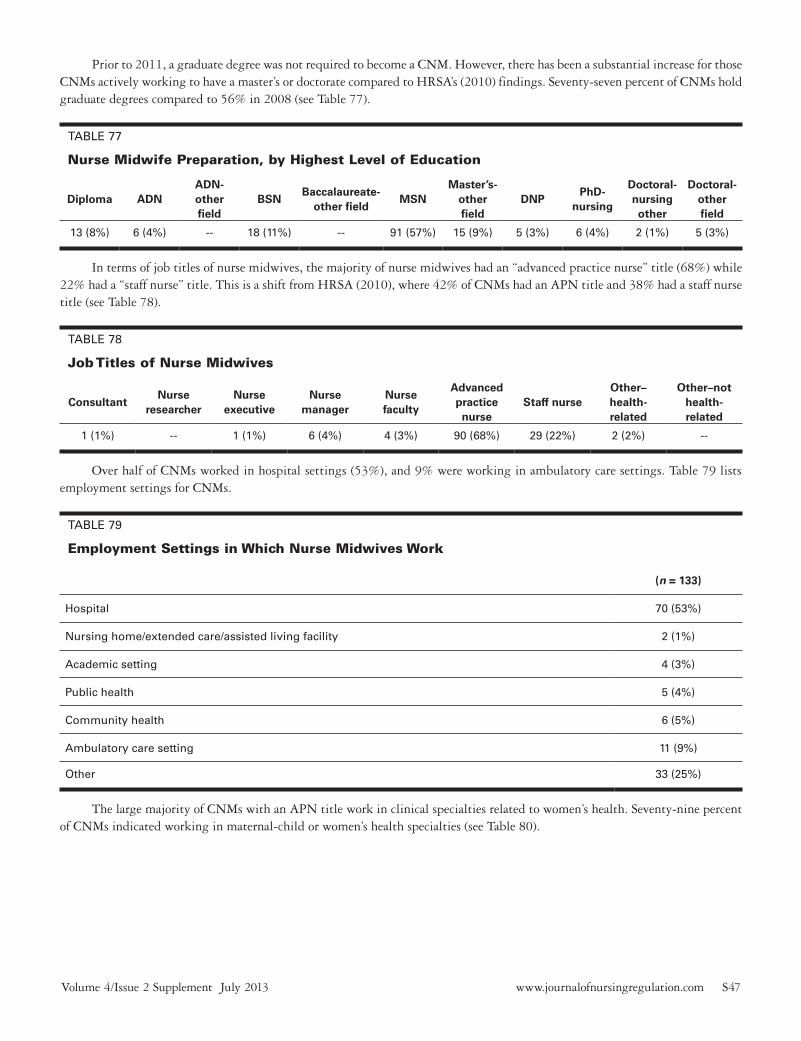
www .journalofnursingregulation .com S47Volume 4/Issue 2 Supplement July 2013
Prior to 2011, a graduate degree was not required to become a CNM . However, there has been a substantial increase for those CNMs actively working to have a master’s or doctorate compared to HRSA’s (2010) findings . Seventy-seven percent of CNMs hold graduate degrees compared to 56% in 2008 (see Table 77) .
TAble 77
Nurse Midwife Preparation, by Highest Level of Education
Diploma ADNADN-other field
BSNBaccalaureate-
other fieldMSN
Master’s-other field
DNPPhD-
nursing
Doctoral-nursing other
Doctoral-other field
13 (8%) 6 (4%) -- 18 (11%) -- 91 (57%) 15 (9%) 5 (3%) 6 (4%) 2 (1%) 5 (3%)
In terms of job titles of nurse midwives, the majority of nurse midwives had an “advanced practice nurse” title (68%) while 22% had a “staff nurse” title . This is a shift from HRSA (2010), where 42% of CNMs had an APN title and 38% had a staff nurse title (see Table 78) .
TAble 78
Job Titles of Nurse Midwives
ConsultantNurse
researcherNurse
executiveNurse
managerNurse faculty
Advanced practice nurse
Staff nurseOther–health-related
Other–not health-related
1 (1%) -- 1 (1%) 6 (4%) 4 (3%) 90 (68%) 29 (22%) 2 (2%) --
Over half of CNMs worked in hospital settings (53%), and 9% were working in ambulatory care settings . Table 79 lists employment settings for CNMs .
TAble 79
Employment Settings in Which Nurse Midwives Work
(n = 133)
Hospital 70 (53%)
Nursing home/extended care/assisted living facility 2 (1%)
Academic setting 4 (3%)
Public health 5 (4%)
Community health 6 (5%)
Ambulatory care setting 11 (9%)
Other 33 (25%)
The large majority of CNMs with an APN title work in clinical specialties related to women’s health . Seventy-nine percent of CNMs indicated working in maternal-child or women’s health specialties (see Table 80) .

S48 Journal of Nursing Regulation
TAble 80
Employment Specialties of Registered Nurses Prepared as Nurse Midwives, for Selected Job Titles in the Hospital Setting
Primary clinical specialties of nurse midwives (n = 70)
Acute care/critical care 1 (1%)
Maternal-child health 39 (56%)
Medical-surgical 9 (13%)
Oncology 1 (1%)
Pediatrics/neonatal 2 (3%)
Psychiatric/mental health/substance abuse 1 (1%)
Women’s health 16 (23%)
Certified registered nurse anesthetists. The number of CRNAs has increased more than any other group of APRNs . In 2012 there were 45,059 CRNAs compared to 30,825 in 2008; this reflects a 46 .2% increase (Phillips, 2009, 2013) . Compared to other APRN groups, CRNAs tend to be younger than their colleagues . Twenty-six percent were younger than age 40, while 36% were age 55 or older . While these were the youngest of the APRNs, these percentages still indicate a trend toward increasing age in the APRN workforce . The percentage of CRNAs younger than age 40 has decreased from 2008 (HRSA, 2010), and the percentage older than age 55 is higher . Nine percent of CRNAs age 65 or older continue to work, which is the same as the percentage found in 2008 (HRSA, 2010) (see Table 81) .
TAble 81
Age Distribution of Registered Nurses Prepared as Certified Nurse Anesthetists
Younger than 30
30-34 35-39 40-44 45-49 50-54 55-59 60-6465 and older
12 (3%) 29 (7%) 68 (16%) 63 (15%) 41 (10%) 57 (14%) 52 (12%) 61 (15%) 35 (9%)
The number of CRNAs with graduate-level preparation is increasing . Seventy-five percent of CRNAs in this sample reported having a master’s or doctoral degree compared to 65% reported by HRSA (2010) . Prior to 2008, CRNAs were not required to have graduate-level education . This requirement is reflected in the current increase in master’s-prepared and doctorally prepared CRNAs (see Table 82) .
TAble 82
Nurse Anesthetist Preparation, by Highest Level of Education
Diploma ADNADN-other field
BSNBaccalaureate-
other fieldMSN
Master’s-other field
DNPPhD-
nursing
Doctoral-nursing other
Doctoral-other field
20 (4%) 23 (5%) 8 (2%) 50 (10%) 32 (6%) 252 (52%) 98 (20%) 5 (1%) -- 6 (1%) 4 (1%)
Clinical nurse specialists. As with other APRNs, the number of CNSs increased in the 4-year period of 2008 through 2012 . A 19% increase is seen in the CNS group, with 13,742 currently recognized by boards of nursing, while 11,560 were recognized in 2008 (Phillips, 2009, 2013) . Also, as with their other APRN colleagues, CNSs show a trend toward an aging workforce . In the current study, only 9% were younger than age 40, while 61% were age 55 or older, and 25% were age 65 or older (see Table 83) . HRSA (2010) found that 10% were younger than age 40, and only 8% were age 65 or older .

www .journalofnursingregulation .com S49Volume 4/Issue 2 Supplement July 2013
TAble 83
Age Distribution of Registered Nurses Prepared as Clinical Nurse Specialists
Younger than 30
30-34 35-39 40-44 45-49 50-54 55-59 60-6465 and older
4 (1%) 10 (3%) 18 (5%) 14 (4%) 27 (7%) 78 (20%) 66 (17%) 72 (19%) 96 (25%)
Note . In some states, the job title of “clinical nurse specialist” is not legally limited to RNs who have CNS preparation of certification . Respondents who
indicated “clinical nurse specialist” without a master’s degree or higher were removed from this analysis .
Graduate-level education has always been required for recognition as a CNS . There has been a shift towards more CNSs having doctoral degrees . Nineteen percent of CNSs reported having a doctoral degree (see Table 84) compared to 7% found by HRSA (2010) .
TAble 84
Clinical Nurse Specialist Preparation, by Highest Level of Education
MSN DNP PhD - nursingDoctoral - nursing
otherDoctoral - other field
343 (82%) 7 (2%) 40 (10%) 8 (2%) 20 (5%)
Note. In some states, the job title of “clinical nurse specialist” is not legally limited to RNs who have CNS preparation of certification . Respondents that
indicated “clinical nurse specialist” without a master’s degree or higher were removed from this analysis .
There has been an increase in the use of the “advanced practice nurse” and “staff nurse” job titles for CNSs . According to HRSA (2010), 35% of CNSs had the job title of “advanced practice nurse,” and the current study found that 38% reported having that title . HRSA (2010) found that 16% of CNSs reported having a “staff nurse” job title, while 20% indicated this job title in the current study . These data indicate a shift from management and faculty titles, which made up 39% of CNSs in 2008 (HRSA, 2010), towards patient-care titles (see Table 85) .
TAble 85
Job Titles of Employed Nurses Prepared as Clinical Nurse Specialists
ConsultantNurse
researcherNurse
executiveNurse
managerNurse faculty
Advanced practice nurse
Staff nurseOther–health-related
Other–not health-related
26 (7%) 8 (2%) 11 (2%) 18 (4%) 70 (18%) 152 (38%) 78 (20%) 31 (8%) 3 (< 1%)
Note . In some states, the job title of “clinical nurse specialist” is not legally limited to RNs who have CNS preparation of certification . Respondents that
indicated “clinical nurse specialist” without a master’s degree or higher were removed from this analysis
CNSs work in diverse practice settings . Almost half of the CNSs (48%) worked in hospital settings, while 18% reported working in academic settings, and 12% worked in ambulatory care environments . These categories represent the most commonly reported work settings, but CNSs also reported working in nursing homes, home health, public and community health, schools, and policy/regulatory agencies (see Table 86) .
TAble 86
Employment Settings in Which Clinical Nurse Specialists Work
(n = 393)
Hospital 189 (48%)
Nursing home/extended care/assisted living facility 15 (4%)

S50 Journal of Nursing Regulation
(n = 393)
Home health 14 (4%)
Correctional facility --
Academic setting 73 (18%)
Public health 4 (1%)
Community health 14 (4%)
School health service 4 (1%)
Occupational health --
Ambulatory care setting 49 (12%)
Insurance claims/benefits --
Policy/planning/regulatory/licensing agency 5 (1%)
Other 26 (7%)
Note . In some states, the job title of “clinical nurse specialist” is not legally limited to RNs who have CNS preparation of certification . Respondents who
indicated “clinical nurses specialist” without a master’s degree or higher were removed from this analysis
Foreign-Educated Nurses
Foreign-educated nurses (FENs) are another pipeline for the U .S . RN workforce, especially in times of shortage in domestic supply (HRSA, 2013) . HRSA (2010) showed that 5% of the RNs licensed prior to 2004 were FENs, and 8% since then . The current study showed 6% of the respondents were foreign-educated . The average age of these nurses was 49 . Tables 87 to 92 reveal similar demographic and practice characteristics between U .S .-educated and foreign-educated respondents .
There was not a substantial age difference between the U .S .-educated and FENs . HRSA (2010) showed similar results (see Table 87) .
TAble 87
Median Current Age of Registered Nurses Employed in Nursing, by Foreign-Education Status
U.S.-educated Foreign-educated
Current age 48 .22 (12 .43) 48 .96 (12 .83)
Note . Standard Deviations are in parentheses .
In an examination of RNs working full time, by location of education and year of licensure—where “newly licensed” was defined as RNs licensed in 2010 and after—only 1% were newly licensed and foreign-educated; 11% were newly licensed and U .S .-educated (see Table 88) .
TAble 88
Registered Nurses Working Full Time, by Location of Education and Year of Licensure
U.S.-educated Foreign-educated
licensed prior to 2010 18,220 (81%) 1,571 (7%)
licensed 2010-2013 2,550 (11%) 133 (1%)
Results revealed no substantial differences in the average number of hours worked per week between U .S .-educated and FENs (see Table 89) .
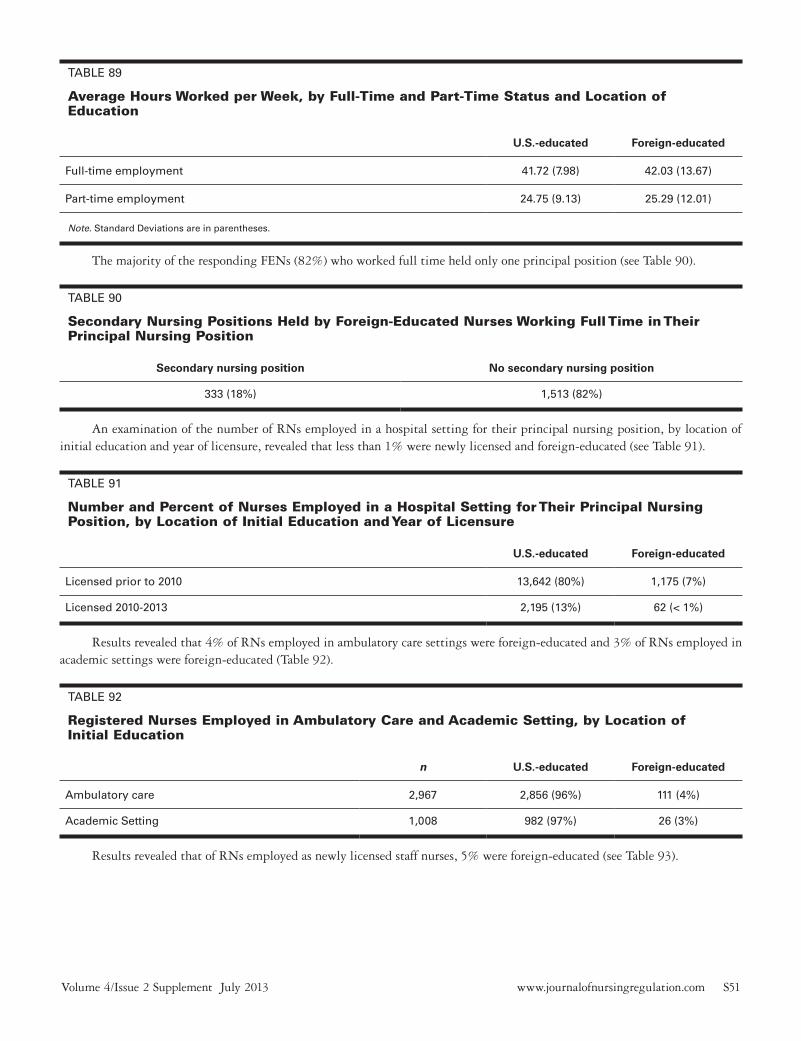
www .journalofnursingregulation .com S51Volume 4/Issue 2 Supplement July 2013
TAble 89
Average Hours Worked per Week, by Full-Time and Part-Time Status and Location of Education
U.S.-educated Foreign-educated
Full-time employment 41 .72 (7 .98) 42 .03 (13 .67)
Part-time employment 24 .75 (9 .13) 25 .29 (12 .01)
Note . Standard Deviations are in parentheses .
The majority of the responding FENs (82%) who worked full time held only one principal position (see Table 90) .
TAble 90
Secondary Nursing Positions Held by Foreign-Educated Nurses Working Full Time in Their Principal Nursing Position
Secondary nursing position No secondary nursing position
333 (18%) 1,513 (82%)
An examination of the number of RNs employed in a hospital setting for their principal nursing position, by location of initial education and year of licensure, revealed that less than 1% were newly licensed and foreign-educated (see Table 91) .
TAble 91
Number and Percent of Nurses Employed in a Hospital Setting for Their Principal Nursing Position, by Location of Initial Education and Year of Licensure
U.S.-educated Foreign-educated
licensed prior to 2010 13,642 (80%) 1,175 (7%)
licensed 2010-2013 2,195 (13%) 62 (< 1%)
Results revealed that 4% of RNs employed in ambulatory care settings were foreign-educated and 3% of RNs employed in academic settings were foreign-educated (Table 92) .
TAble 92
Registered Nurses Employed in Ambulatory Care and Academic Setting, by Location of Initial Education
n U.S.-educated Foreign-educated
Ambulatory care 2,967 2,856 (96%) 111 (4%)
Academic Setting 1,008 982 (97%) 26 (3%)
Results revealed that of RNs employed as newly licensed staff nurses, 5% were foreign-educated (see Table 93) .

S52 Journal of Nursing Regulation
TAble 93
Registered Nurses Employed as Staff Nurses, by Location of Initial Education and Year of Licensure
n U.S.-educated Foreign-educated
licensed prior to 2010 33,783 31,661 (94%) 2,122 (6%)
licensed 2010-2013 3,482 3,292 (95%) 190 (5%)
Newly Licensed Nurses
In the current study, newly licensed nurses were defined as RNs who received their license in 2010 or after . An examination of initial education of RNs by year licensed cohort revealed that RNs licensed between 2000 and 2013 were more likely to have obtained a BSN as their initial education (42%–44%) versus RNs licensed prior to 2000 (33%) . However, the data did not show that newly licensed nurses were more likely to have a BSN degree as their initial entry into the field (see Table 94) .
TAble 94
Initial Education of Registered Nurses, by Year Licensed Cohort
Licensed cohort
Type of nursing degree/credential that qualified respondents for first U.S. nursing license
Licensed prior to 2000
Licensed2000-2004
Licensed2005-2009
Licensed2010-2013
n 25,635 3,301 4,873 3,606
Vocational/practical certificate-nursing 1,365 (5%) 153 (5%) 186 (4%) 73 (2%)
Diploma-nursing 6,220 (24%) 115 (3%) 174 (4%) 74 (2%)
Associate’s degree-nursing 8,961 (35%) 1,525 (46%) 2,210 (45%) 1,809 (50%)
baccalaureate degree-nursing 8,361 (33%) 1,376 (42%) 2,150 (44%) 1,549 (43%)
Master’s degree-nursing 694 (3%) 129 (4%) 151 (3%) 80 (2%)
Doctoral degree-nursing (DNP) 14 (<1%) 1 (<1%) 1 (<1%) --
Doctoral degree-nursing (PhD) -- -- -- 21 (<1%)
Doctoral degree-nursing other 20 (<1%) 2 (<1%) 1 (<1%) --
Examining the location of initial education, by year licensed cohort revealed the following percentages of foreign-educated RNs: licensed prior to 2000 (5%), licensed 2000–2004 (11%), licensed 2005–2009 (10%), and licensed 2010–2013 (5%) (see Table 95) . HRSA (2013), when examining NCLEX-RN data, found wide variation in the number of foreign-educated nurses from 2001 through 2011, with the greatest number in 2007 (HRSA, 2013) . In 2008, foreign graduates that were licensed prior to 2004 were 5% of the RN workforce . Additionally, foreign graduates who were licensed between 2004 and 2008 composed 5% of the RN workforce (HRSA, 2010) .
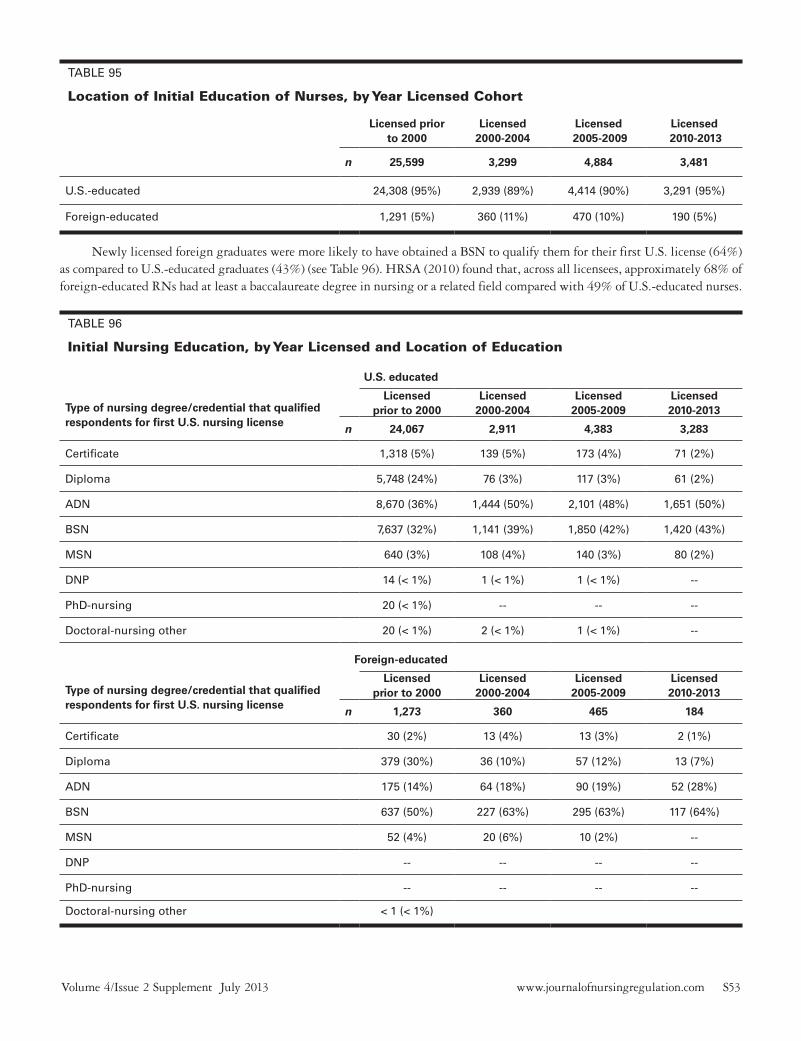
www .journalofnursingregulation .com S53Volume 4/Issue 2 Supplement July 2013
TAble 95
Location of Initial Education of Nurses, by Year Licensed Cohort
Licensed prior to 2000
Licensed 2000-2004
Licensed 2005-2009
Licensed 2010-2013
n 25,599 3,299 4,884 3,481
U .S .-educated 24,308 (95%) 2,939 (89%) 4,414 (90%) 3,291 (95%)
Foreign-educated 1,291 (5%) 360 (11%) 470 (10%) 190 (5%)
Newly licensed foreign graduates were more likely to have obtained a BSN to qualify them for their first U .S . license (64%) as compared to U .S .-educated graduates (43%) (see Table 96) . HRSA (2010) found that, across all licensees, approximately 68% of foreign-educated RNs had at least a baccalaureate degree in nursing or a related field compared with 49% of U .S .-educated nurses .
TAble 96
Initial Nursing Education, by Year Licensed and Location of Education
U.S. educated
Type of nursing degree/credential that qualified respondents for first U.S. nursing license
Licensedprior to 2000
Licensed2000-2004
Licensed2005-2009
Licensed2010-2013
n 24,067 2,911 4,383 3,283
Certificate 1,318 (5%) 139 (5%) 173 (4%) 71 (2%)
Diploma 5,748 (24%) 76 (3%) 117 (3%) 61 (2%)
ADN 8,670 (36%) 1,444 (50%) 2,101 (48%) 1,651 (50%)
bSN 7,637 (32%) 1,141 (39%) 1,850 (42%) 1,420 (43%)
MSN 640 (3%) 108 (4%) 140 (3%) 80 (2%)
DNP 14 (< 1%) 1 (< 1%) 1 (< 1%) --
PhD-nursing 20 (< 1%) -- -- --
Doctoral-nursing other 20 (< 1%) 2 (< 1%) 1 (< 1%) --
Foreign-educated
Type of nursing degree/credential that qualified respondents for first U.S. nursing license
Licensedprior to 2000
Licensed2000-2004
Licensed2005-2009
Licensed2010-2013
n 1,273 360 465 184
Certificate 30 (2%) 13 (4%) 13 (3%) 2 (1%)
Diploma 379 (30%) 36 (10%) 57 (12%) 13 (7%)
ADN 175 (14%) 64 (18%) 90 (19%) 52 (28%)
bSN 637 (50%) 227 (63%) 295 (63%) 117 (64%)
MSN 52 (4%) 20 (6%) 10 (2%) --
DNP -- -- -- --
PhD-nursing -- -- -- --
Doctoral-nursing other < 1 (< 1%)
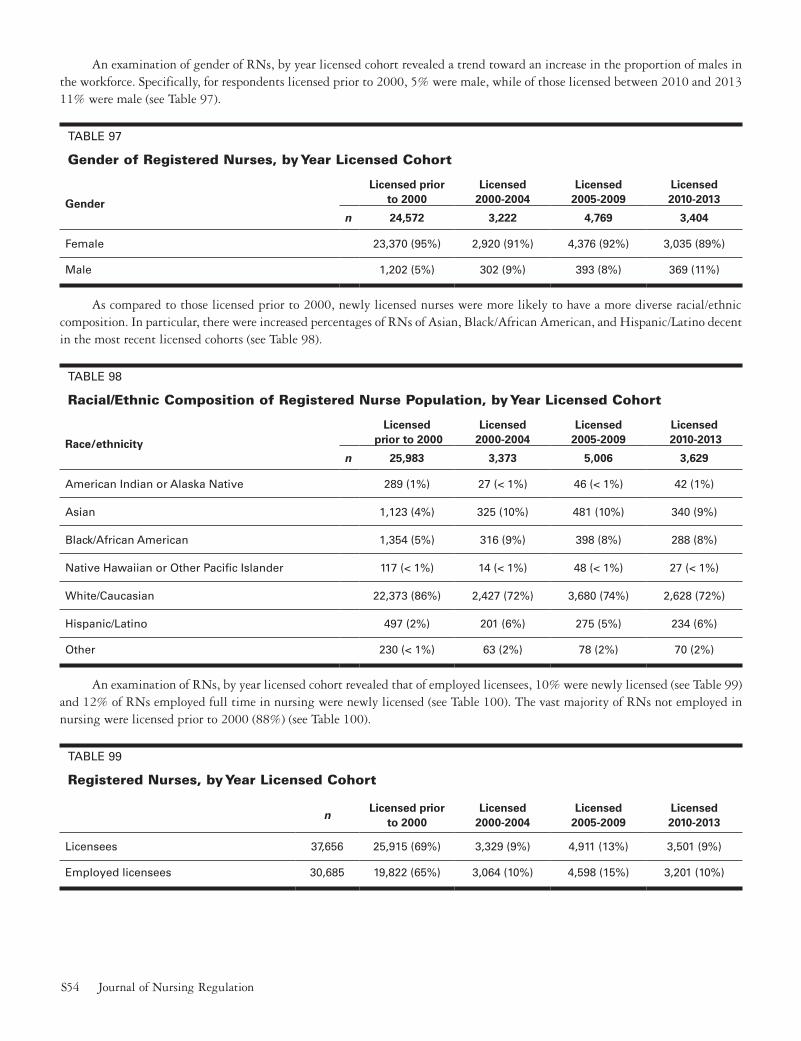
S54 Journal of Nursing Regulation
An examination of gender of RNs, by year licensed cohort revealed a trend toward an increase in the proportion of males in the workforce . Specifically, for respondents licensed prior to 2000, 5% were male, while of those licensed between 2010 and 2013 11% were male (see Table 97) .
TAble 97
Gender of Registered Nurses, by Year Licensed Cohort
Gender
Licensed prior to 2000
Licensed 2000-2004
Licensed 2005-2009
Licensed2010-2013
n 24,572 3,222 4,769 3,404
Female 23,370 (95%) 2,920 (91%) 4,376 (92%) 3,035 (89%)
Male 1,202 (5%) 302 (9%) 393 (8%) 369 (11%)
As compared to those licensed prior to 2000, newly licensed nurses were more likely to have a more diverse racial/ethnic composition . In particular, there were increased percentages of RNs of Asian, Black/African American, and Hispanic/Latino decent in the most recent licensed cohorts (see Table 98) .
TAble 98
Racial/Ethnic Composition of Registered Nurse Population, by Year Licensed Cohort
Race/ethnicity
Licensed prior to 2000
Licensed2000-2004
Licensed2005-2009
Licensed 2010-2013
n 25,983 3,373 5,006 3,629
American Indian or Alaska Native 289 (1%) 27 (< 1%) 46 (< 1%) 42 (1%)
Asian 1,123 (4%) 325 (10%) 481 (10%) 340 (9%)
black/African American 1,354 (5%) 316 (9%) 398 (8%) 288 (8%)
Native Hawaiian or Other Pacific Islander 117 (< 1%) 14 (< 1%) 48 (< 1%) 27 (< 1%)
White/Caucasian 22,373 (86%) 2,427 (72%) 3,680 (74%) 2,628 (72%)
Hispanic/latino 497 (2%) 201 (6%) 275 (5%) 234 (6%)
Other 230 (< 1%) 63 (2%) 78 (2%) 70 (2%)
An examination of RNs, by year licensed cohort revealed that of employed licensees, 10% were newly licensed (see Table 99) and 12% of RNs employed full time in nursing were newly licensed (see Table 100) . The vast majority of RNs not employed in nursing were licensed prior to 2000 (88%) (see Table 100) .
TAble 99
Registered Nurses, by Year Licensed Cohort
nLicensed prior
to 2000Licensed
2000-2004Licensed
2005-2009Licensed2010-2013
licensees 37,656 25,915 (69%) 3,329 (9%) 4,911 (13%) 3,501 (9%)
employed licensees 30,685 19,822 (65%) 3,064 (10%) 4,598 (15%) 3,201 (10%)

www .journalofnursingregulation .com S55Volume 4/Issue 2 Supplement July 2013
TAble 100
Employment of Registered Nurses, by Year Licensed Cohort
nLicensed
prior to 2000Licensed
2000-2004Licensed
2005-2009Licensed2010-2013
employed full time in nursing 22,676 13,866 (61%) 2,403 (11%) 3,706 (16%) 2,700 (12%)
employed part time in nursing 5,641 4,236 (75%) 470 (8%) 574 (10%) 362 (6%)
Not employed in nursing 6,909 6,060 (88%) 261 (4%) 308 (4%) 281 (4%)
The current results indicated that newly licensed RNs were the cohort most likely to work in a hospital setting (71%), compared to 50% of RNs licensed prior to 2000 (see Table 101) . HRSA (2013) found that the greatest percentage of RNs were employed in hospitals (63%), followed by nursing care facilities (7%) . This was a slight decrease from 2000 Census information of 63% employed in hospitals and 8% in nursing care facilities . HRSA (2010) found a slight decrease in the percentage of RNs employed in hospitals, with 66% in 1980 and 62% in 2008 . The next greatest setting was ambulatory care, with 11% in 2008, followed by public/community health, with 8% in 2008 .
TAble 101
Employment Setting of Principal Nursing Position, by Year Licensed Cohort
Primary nursing practice position setting
Licensedprior to 2000
Licensed2000-2004
Licensed2005-2009
Licensed2010-2013
n 19,745 3,019 4,570 3,189
Hospital 9,836 (50%) 1,986 (66%) 3,142 (69%) 2,271 (71%)
Nursing home/extended care/assisted living facility 1,205 (6%) 139 (5%) 276 (6%) 338 (11%)
Home health 1,300 (7%) 153 (5%) 245 (5%) 141 (4%)
Correctional facility 125 (1%) 26 (1%) 33 (1%) 14 (< 1%)
Academic setting 817 (4%) 43 (1%) 32 (1%) 8 (< 1%)
Public health 409 (2%) 43 (1%) 69 (2%) 31 (1%)
Community health 447 (2%) 72 (2%) 92 (2%) 65 (2%)
School health service 848 (4%) 54 (2%) 78 (2%) 53 (2%)
Occupational health 156 (1%) 16 (1%) 14 (< 1%) 4 (< 1%)
Ambulatory care setting 2,113 (11%) 223 (7%) 234 (5%) 120 (4%)
Insurance claims/benefits 346 (2%) 28 (1%) 46 (1%) 12 (<1%)
Policy/planning/regulatory/licensing agency 118 (1%) 11 (< 1%) 2 (< 1%) < 1
Other 2,025 (10%) 225 (7%) 307 (7%) 132 (4%)
An examination of secondary nursing positions, by year licensed cohort revealed that newly licensed nurses were more likely to be employed in nursing home/extended care/assisted living facilities (27%) compared to the other year licensed cohorts (9%–14%) (see Table 102) .
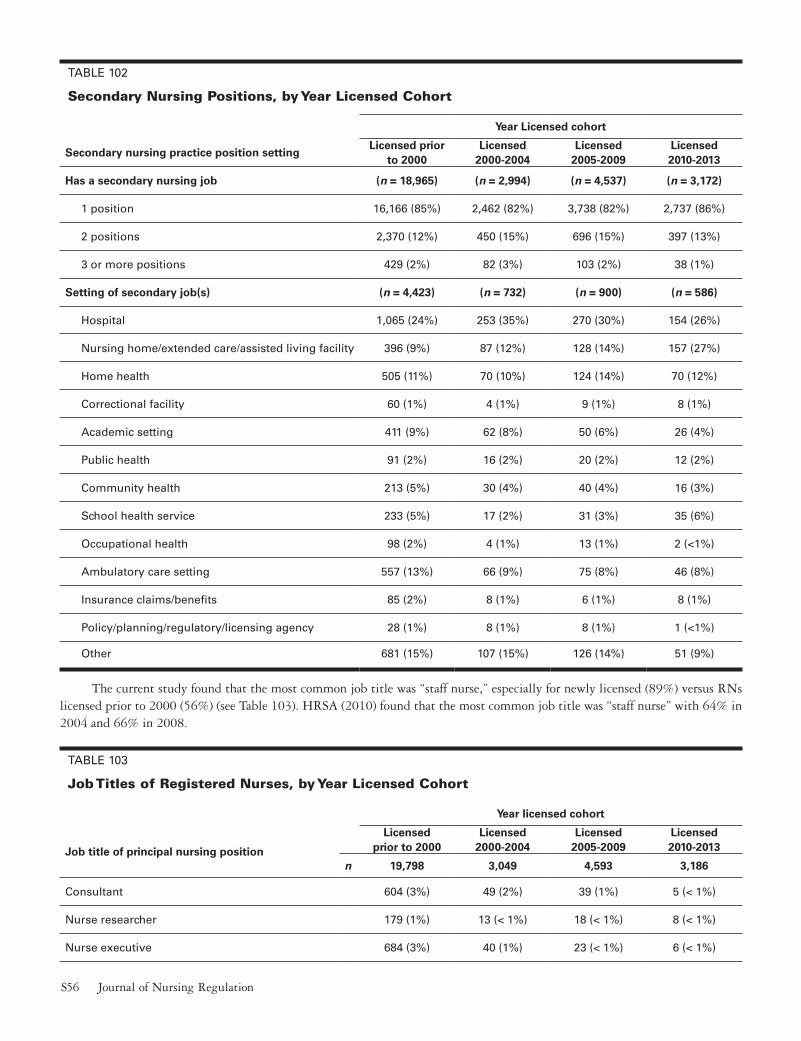
S56 Journal of Nursing Regulation
TAble 102
Secondary Nursing Positions, by Year Licensed Cohort
Year Licensed cohort
Secondary nursing practice position settingLicensed prior
to 2000Licensed
2000-2004Licensed
2005-2009Licensed2010-2013
Has a secondary nursing job (n = 18,965) (n = 2,994) (n = 4,537) (n = 3,172)
1 position 16,166 (85%) 2,462 (82%) 3,738 (82%) 2,737 (86%)
2 positions 2,370 (12%) 450 (15%) 696 (15%) 397 (13%)
3 or more positions 429 (2%) 82 (3%) 103 (2%) 38 (1%)
Setting of secondary job(s) (n = 4,423) (n = 732) (n = 900) (n = 586)
Hospital 1,065 (24%) 253 (35%) 270 (30%) 154 (26%)
Nursing home/extended care/assisted living facility 396 (9%) 87 (12%) 128 (14%) 157 (27%)
Home health 505 (11%) 70 (10%) 124 (14%) 70 (12%)
Correctional facility 60 (1%) 4 (1%) 9 (1%) 8 (1%)
Academic setting 411 (9%) 62 (8%) 50 (6%) 26 (4%)
Public health 91 (2%) 16 (2%) 20 (2%) 12 (2%)
Community health 213 (5%) 30 (4%) 40 (4%) 16 (3%)
School health service 233 (5%) 17 (2%) 31 (3%) 35 (6%)
Occupational health 98 (2%) 4 (1%) 13 (1%) 2 (<1%)
Ambulatory care setting 557 (13%) 66 (9%) 75 (8%) 46 (8%)
Insurance claims/benefits 85 (2%) 8 (1%) 6 (1%) 8 (1%)
Policy/planning/regulatory/licensing agency 28 (1%) 8 (1%) 8 (1%) 1 (<1%)
Other 681 (15%) 107 (15%) 126 (14%) 51 (9%)
The current study found that the most common job title was “staff nurse,” especially for newly licensed (89%) versus RNs licensed prior to 2000 (56%) (see Table 103) . HRSA (2010) found that the most common job title was “staff nurse” with 64% in 2004 and 66% in 2008 .
TAble 103
Job Titles of Registered Nurses, by Year Licensed Cohort
Year licensed cohort
Job title of principal nursing position
Licensedprior to 2000
Licensed2000-2004
Licensed2005-2009
Licensed2010-2013
n 19,798 3,049 4,593 3,186
Consultant 604 (3%) 49 (2%) 39 (1%) 5 (< 1%)
Nurse researcher 179 (1%) 13 (< 1%) 18 (< 1%) 8 (< 1%)
Nurse executive 684 (3%) 40 (1%) 23 (< 1%) 6 (< 1%)

www .journalofnursingregulation .com S57Volume 4/Issue 2 Supplement July 2013
Year licensed cohort
Job title of principal nursing position
Licensedprior to 2000
Licensed2000-2004
Licensed2005-2009
Licensed2010-2013
n 19,798 3,049 4,593 3,186
Nurse manager 2,523 (13%) 276 (9%) 355 (8%) 129 (4%)
Nurse faculty 812 (4%) 56 (2%) 58 (1%) 55 (2%)
Advanced practice nurse 1,704 (9%) 289 (9%) 270 (6%) 64 (2%)
Staff nurse 11,000(56%) 2,107 (69%) 3,601 (78%) 2,847 (89%)
Other–health-related 2,214 (11%) 213 (7%) 224 (5%) 72 (2%)
Other–not health-related 78 (< 1%) 6 (< 1%) 5 (< 1%) < 1
In terms of average hours worked per week, newly licensed nurses work the fewest hours in full-time positions (M = 39 .94, SD = 7 .44), while they work the most in part-time positions (M = 27 .70, SD = 10 .34) as compared to other year licensed cohorts (see Table 104) .
TAble 104
Average Hours Worked per Week by Registered Nurses, by Full-Time/Part-Time Status and Year Licensed Cohort
Licensedprior to 2000
Licensed2000-2004
Licensed2005-2009
Licensed2010-2013
employed full time 42 .30 (8 .57) 41 .84 (9 .18) 41 .10 (7 .68) 39 .94 (7 .44)
employed part time 24 .18 (9 .30) 25 .87 (8 .50) 26 .43 (8 .69) 27 .70 (10 .34)
Note . Standard Deviations are in parentheses .
Registered Nurses Nearing Retirement
Examining the demographic and education characteristics of RNs by age, more specifically respondents younger and older than age 50, can illustrate trends in the nursing workforce .
The current study indicated RNs were slightly more ethnically diverse than reported by HRSA (2010) . Recent findings suggest that 23% of RNs younger than age 50 and 14% of RNs age 50 and older were Hispanic . HRSA (2010) reported 20% and 13% of RNs were Hispanic in the younger than age 50 and 50 and older age-groups, respectively . There were no differences noted in the percentage of RNs who were women younger than age 50 (92%) and age 50 or older (94%) when comparing the current study to previous work .
The current study suggested that a smaller number of RNs had diploma education as their initial nursing education that led to licensure for those younger than age 50 (5%) compared to respondents age 50 or older (20%) . Additionally, a higher percentage of those younger than age 50 indicated BSN as their initial nursing education (47%) versus those age 50 or older (31%) (see Table 105) .
TAble 105
Demographic and Educational Characteristics of Registered Nurses, by Age
Younger than age 50 Age 50 or older
Race/ethnicity n 14,808 14,983
White, non-Hispanic 11,435 (77%) 12,926 (86%)
Non-white or Hispanic 3,373 (23%) 2,057 (14%)

S58 Journal of Nursing Regulation
Younger than age 50 Age 50 or older
Gender n 14,506 14,396
Male 1,213 (8%) 823 (6%)
Female 13,293 (92%) 13,573 (94%)
Initial nursing education n 14,768 14,985
Certificate 585 (4%) 856 (6%)
Diploma 729 (5%) 2,956 (20%)
ADN 6,107 (41%) 6,072 (41%)
bSN 6,880 (47%) 4,684 (31%)
MSN 453 (3%) 395 (3%)
DNP 5 (< 1%) 5 (< 1%)
PhD-nursing 1 (< 1%) 12 (< 1%)
Doctoral-nursing other 8 (< 1%) 5 (< 1%)
The majority of RNs employed full time and part time in nursing were in the 50 or older age-group, with 49% and 61% of RNs working full time and part time, respectively . At 18%, the largest number of nurses employed full time and part time were in the 55 to 59 age-group . The current study found that 20% of RNs were employed in nursing part time, which is similar to HRSA’s (2010) findings, which indicated that 21% of RNs were employed in nursing part time (see Table 106) .
TAble 106
Percent of Employed Registered Nurses Working Full Time and Part Time, by Age-Group
nYounger than 30
30-34 35-39 40-44 45-49 50-54 55-59 60-6465 and older
Full time 21,2642,356(11%)
1,891(9%)
1,913(9%)
2,169(10%)
2,424(11%)
3,307(16%)
3,880(18%)
2,415(11%)
909(4%)
Part time 5,146321(6%)
352(7%)
420(8%)
486(9%)
480(9%)
657(13%)
917(18%)
747(15%)
766(15%)
Findings from the current study suggest that the largest percentage of RNs with a principal position title of “nurse executive” (31%), “nurse manager” (21%), “advanced practice nurse” (18%), “staff nurse” (16%), and other health (16%) and non-health-related (23%) was in the 55 to 59 age-group . The largest number (22%) of nurse researchers were age 50 to 54, 22% of nurse faculty were age 60 to 64, and 24% of nurse consultants were age 65 and older (see Table 107) .
TAble 107
Job Titles of Registered Nurses in Their Principal Nursing Position, by Age-Group
Age of nurses
Job title of principal nursing position
nYounger than 30
30-34 35-39 40-44 45-49 50-54 55-59 60-6465 and older
Consultant 6203
(< 1%)13
(2%)27
(4%)27
(4%)72
(12%)112
(18%)130
(21%)90
(15%)146
(24%)
Nurse researcher 1862
(1%)13
(7%)9
(5%)7
(4%)21
(11%)40
(22%)33
(18%)36
(19%)25
(13%)

www .journalofnursingregulation .com S59Volume 4/Issue 2 Supplement July 2013
Age of nurses
Job title of principal nursing position
nYounger than 30
30-34 35-39 40-44 45-49 50-54 55-59 60-6465 and older
Nurse executive 6695
(1%)14
(2%)34
(5%)48
(7%)73
(11%)120
(18%)208
(31%)100
(15%)67
(10%)
Nurse manager 3,13494
(3%)169(5%)
250(8%)
308(10%)
371(12%)
574(18%)
648(21%)
470(15%)
250(8%)
Nurse faculty 89034
(4%)33
(4%)53
(6%)55
(6%)76
(9%)147
(17%)171
(19%)195
(22%)126
(14%)
Advanced practice nurse
2,07272
(3%)225
(11%)213
(10%)260
(13%)239
(12%)304
(15%)383
(18%)230
(11%)146(7%)
Staff nurse 18,3872,504(14%)
1,858(10%)
1,786(10%)
1,869(10%)
1,926(10%)
2,539(14%)
2,895(16%)
1,846(10%)
1,164(6%)
Other–health-related 2,55795
(4%)86
(3%)179(7%)
222(9%)
255(10%)
357(14%)
587(23%)
409(16%)
367(14%)
Other–not health- related
831
(1%)< 1
(1%)3
(4%)7
(9%)15
(18%)11
(13%)26
(32%)11
(13%)8
(10%)
On average, full-time and part-time RNs in this study worked 41 .6 and 25 .1 hours per week, respectively . Other than part-time nurses age 65 and older, the current study showed that the number of weekly hours worked by full-time and part-time RNs was consistent across all age-groups (see Table 108) . These findings were similar to those reported by HRSA (2010) .
TAble 108
Average Hours Worked per Week by Registered Nurses in Their Principal Nursing Position, by Age
Age of nurses
Younger than 30
30-34 35-39 40-44 45-49 50-54 55-59 60-6465 and older
Average hours worked, full-time nurses
39 .33 (5 .87)
40 .20 (6 .65)
41 .34 (7 .83)
42 .21 (8 .96)
42 .52 (8 .60)
42 .28 (9 .03)
42 .39 (8 .30)
42 .13 (8 .10)
41 .84 (9 .92)
Average hours worked, part-time nurses
27 .92 (9 .37)
25 .12 (25 .12)
24 .58 (24 .58)
25 .78 (25 .78)
26 .11 (8 .39)
26 .33 (7 .32)
26 .29 (9 .29)
25 .36 (9 .24)
18 .35 (9 .19)
Note. Standard Deviations are in parentheses .
HRSA (2010) reported that 12% of RNs working full time and 14% of RNs working part time held a secondary position in nursing . The current study suggests the smallest number of RNs working a secondary position in nursing were younger than age 35, or age 60 and older . At 17%, RNs in the 55 to 59 age-group represented the largest number of RNs with a secondary nursing position (see Table 109) .
TAble 109
Percent of Employed Registered Nurses With Secondary Nursing Positions, by Age
Age of nurses
nYounger than 30
30-34 35-39 40-44 45-49 50-54 55-59 60-6465 and older
4,315 352 (8%) 401 (9%) 468 (11%) 522 (12%) 575 (13%) 623 (14%) 722 (17%) 391 (9%) 260 (6%)

S60 Journal of Nursing Regulation
Results revealed that of RNs who indicated they worked outside of nursing, older nurses (i .e ., age 45 to 64) were more likely to work outside of nursing versus younger nurses (i .e ., younger than age 30 to 34) (see Table 110) .
TAble 110
Percent of Registered Nurses Employed in Other Field, by Age-Group
Age of nurses
nYounger than 30
30-34 35-39 40-44 45-49 50-54 55-59 60-6465 and older
Percent working outside nursing
1,169 39 (3%)40
(3%)66
(6%)75
(6%)116
(10%)201
(17%)256
(22%)224
(19%)152
(13%)
Nurse Licensure Compact
The Nurse Licensure Compact (NLC) enables multistate licensure for nurses . In 2000, NCSBN launched a new initiative to expand the mobility of nurses as part of our nation’s health care delivery system . The NLC allows nurses to have one multistate license, with the ability to practice in both their home state and other party states . The following states were members of the NLC at the time of survey data collection: Arkansas, Arizona, Colorado, Delaware, Iowa, Idaho, Kentucky, Maine, Maryland, Missouri, Mississippi, North Carolina, North Dakota, Nebraska, New Hampshire, New Mexico, Rhode Island, South Carolina, South Dakota, Tennessee, Texas, Utah, Virginia, Wisconsin .
Table 111 shows the percentage of respondents who indicated their primary state of residence was part of the NLC (37%) . Results indicated that 13% of respondents with a compact license indicated Texas as their primary state of residence .
TAble 111
Is Primary State of Residence Part of the Nurse Licensure Compact?
(n = 39,008) Percentage
No 24,545 63%
Yes 14,463 37%
Primary state of residence
(n = 13,263) PercentagePrimary state of residence
(n = 13,263) Percentage
Arizona 735 3% New Hampshire 235 2%
Arkansas 362 3% New Mexico 256 2%
Colorado 640 5% North Carolina 1,253 9%
Delaware 159 1% North Dakota 142 1%
Idaho 199 2% Rhode Island 123 1%
Iowa 479 4% South Carolina 378 3%
Kentucky 636 5% South Dakota 352 3%
Maine 244 2% Tennessee 544 4%
Maryland 817 6% Texas 1,741 13%
Mississippi 452 3% Utah 1,351 10%
Missouri 942 7% Virginia 519 4%
Nebraska 266 2% Wisconsin 438 3%
Table 112 shows the percentage of licensees who had physically or electronically/telephonically practiced in other compact states . In general, this information helps illustrate how compact licenses have been utilized . Of the respondents who indicated their
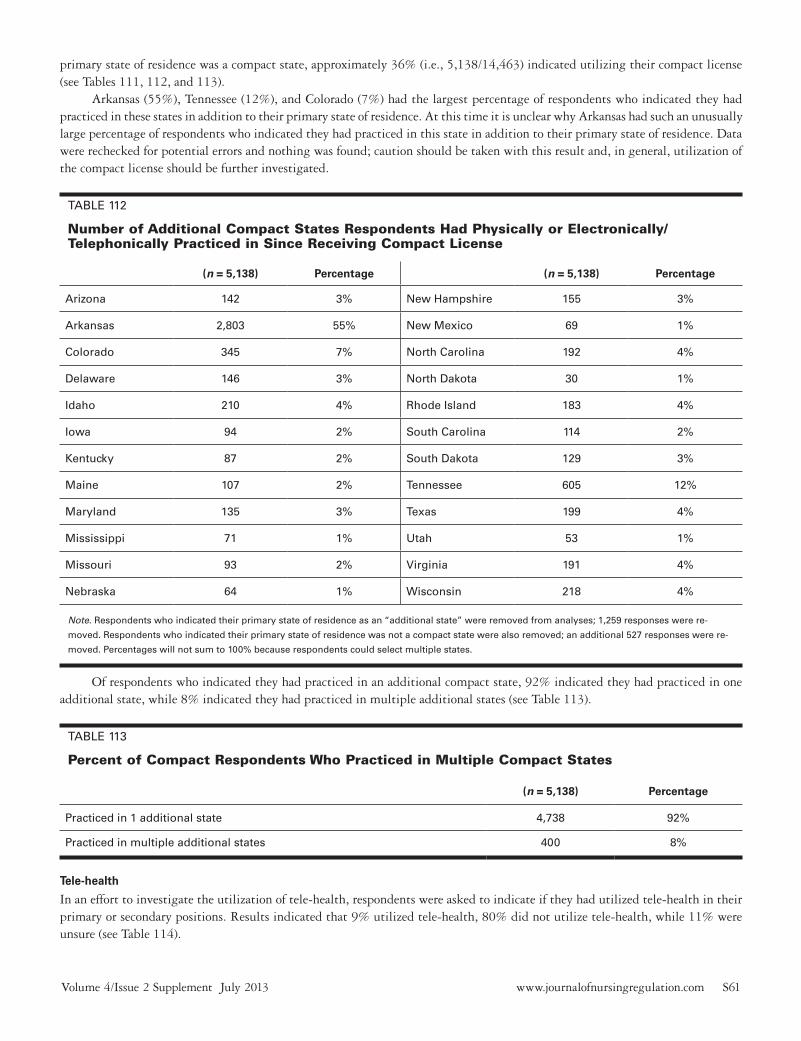
www .journalofnursingregulation .com S61Volume 4/Issue 2 Supplement July 2013
primary state of residence was a compact state, approximately 36% (i .e ., 5,138/14,463) indicated utilizing their compact license (see Tables 111, 112, and 113) .
Arkansas (55%), Tennessee (12%), and Colorado (7%) had the largest percentage of respondents who indicated they had practiced in these states in addition to their primary state of residence . At this time it is unclear why Arkansas had such an unusually large percentage of respondents who indicated they had practiced in this state in addition to their primary state of residence . Data were rechecked for potential errors and nothing was found; caution should be taken with this result and, in general, utilization of the compact license should be further investigated .
TAble 112
Number of Additional Compact States Respondents Had Physically or Electronically/Telephonically Practiced in Since Receiving Compact License
(n = 5,138) Percentage (n = 5,138) Percentage
Arizona 142 3% New Hampshire 155 3%
Arkansas 2,803 55% New Mexico 69 1%
Colorado 345 7% North Carolina 192 4%
Delaware 146 3% North Dakota 30 1%
Idaho 210 4% Rhode Island 183 4%
Iowa 94 2% South Carolina 114 2%
Kentucky 87 2% South Dakota 129 3%
Maine 107 2% Tennessee 605 12%
Maryland 135 3% Texas 199 4%
Mississippi 71 1% Utah 53 1%
Missouri 93 2% Virginia 191 4%
Nebraska 64 1% Wisconsin 218 4%
Note . Respondents who indicated their primary state of residence as an “additional state” were removed from analyses; 1,259 responses were re-
moved . Respondents who indicated their primary state of residence was not a compact state were also removed; an additional 527 responses were re-
moved . Percentages will not sum to 100% because respondents could select multiple states .
Of respondents who indicated they had practiced in an additional compact state, 92% indicated they had practiced in one additional state, while 8% indicated they had practiced in multiple additional states (see Table 113) .
TAble 113
Percent of Compact Respondents Who Practiced in Multiple Compact States
(n = 5,138) Percentage
Practiced in 1 additional state 4,738 92%
Practiced in multiple additional states 400 8%
Tele-health
In an effort to investigate the utilization of tele-health, respondents were asked to indicate if they had utilized tele-health in their primary or secondary positions . Results indicated that 9% utilized tele-health, 80% did not utilize tele-health, while 11% were unsure (see Table 114) .
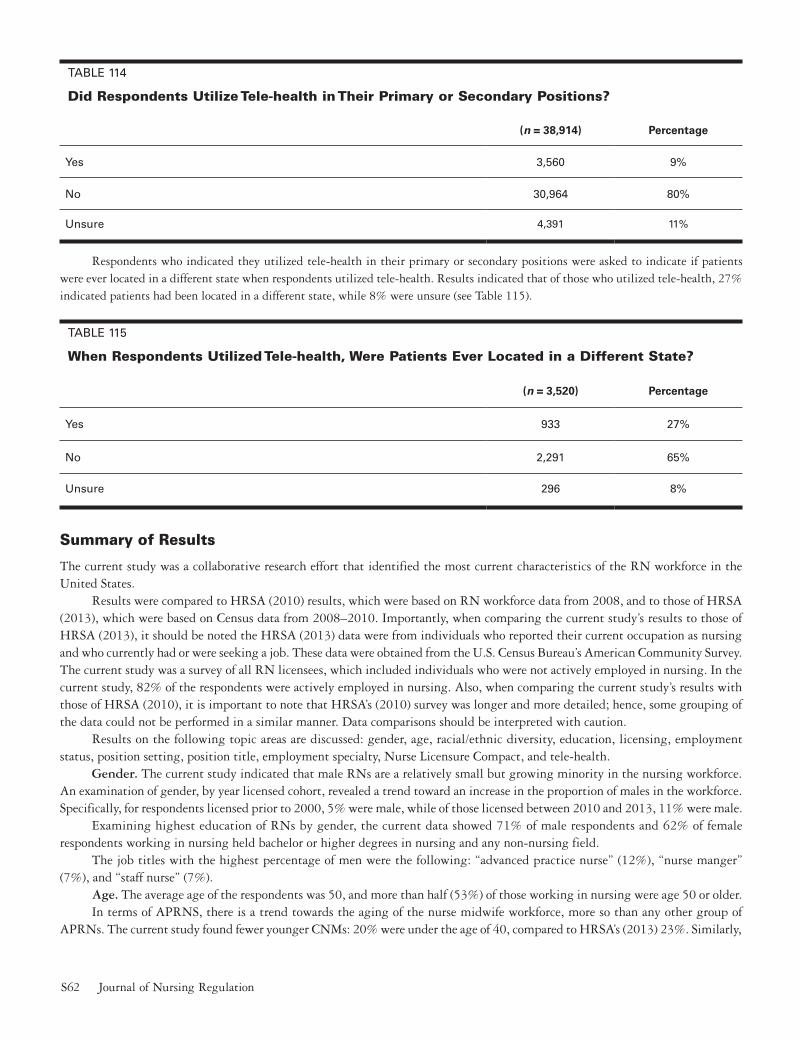
S62 Journal of Nursing Regulation
TAble 114
Did Respondents Utilize Tele-health in Their Primary or Secondary Positions?
(n = 38,914) Percentage
Yes 3,560 9%
No 30,964 80%
Unsure 4,391 11%
Respondents who indicated they utilized tele-health in their primary or secondary positions were asked to indicate if patients were ever located in a different state when respondents utilized tele-health . Results indicated that of those who utilized tele-health, 27% indicated patients had been located in a different state, while 8% were unsure (see Table 115) .
TAble 115
When Respondents Utilized Tele-health, Were Patients Ever Located in a Different State?
(n = 3,520) Percentage
Yes 933 27%
No 2,291 65%
Unsure 296 8%
Summary of Results
The current study was a collaborative research effort that identified the most current characteristics of the RN workforce in the United States .
Results were compared to HRSA (2010) results, which were based on RN workforce data from 2008, and to those of HRSA (2013), which were based on Census data from 2008–2010 . Importantly, when comparing the current study’s results to those of HRSA (2013), it should be noted the HRSA (2013) data were from individuals who reported their current occupation as nursing and who currently had or were seeking a job . These data were obtained from the U .S . Census Bureau’s American Community Survey . The current study was a survey of all RN licensees, which included individuals who were not actively employed in nursing . In the current study, 82% of the respondents were actively employed in nursing . Also, when comparing the current study’s results with those of HRSA (2010), it is important to note that HRSA’s (2010) survey was longer and more detailed; hence, some grouping of the data could not be performed in a similar manner . Data comparisons should be interpreted with caution .
Results on the following topic areas are discussed: gender, age, racial/ethnic diversity, education, licensing, employment status, position setting, position title, employment specialty, Nurse Licensure Compact, and tele-health .
Gender. The current study indicated that male RNs are a relatively small but growing minority in the nursing workforce . An examination of gender, by year licensed cohort, revealed a trend toward an increase in the proportion of males in the workforce . Specifically, for respondents licensed prior to 2000, 5% were male, while of those licensed between 2010 and 2013, 11% were male .
Examining highest education of RNs by gender, the current data showed 71% of male respondents and 62% of female respondents working in nursing held bachelor or higher degrees in nursing and any non-nursing field .
The job titles with the highest percentage of men were the following: “advanced practice nurse” (12%), “nurse manger” (7%), and “staff nurse” (7%) .
Age. The average age of the respondents was 50, and more than half (53%) of those working in nursing were age 50 or older .In terms of APRNS, there is a trend towards the aging of the nurse midwife workforce, more so than any other group of
APRNs . The current study found fewer younger CNMs: 20% were under the age of 40, compared to HRSA’s (2013) 23% . Similarly,

www .journalofnursingregulation .com S63Volume 4/Issue 2 Supplement July 2013
there were increased numbers of CNMs in the over 40 categories: 63% were age 50 or older compared to HRSA’s (2010) 55% . A striking 31% of CNMs in the current study were age 65 or older, a 20% jump from HRSA (2010) results .
In terms of nurse faculty, 72% of respondents who held a principal position as full-time faculty were age 50 and older, indicating the potential and emerging shortage of nursing faculty in the future . Only 14% were younger than age 40, indicating that younger RNs are not choosing to work as full-time faculty . Of those with a secondary faculty position, 63% were age 50 or older, and 17% were younger than 40 . These data are comparable to those of HRSA (2010), which found that almost 60% of nursing faculty were older than age 50, and only 15% were younger than age 40 . It continues to be evident that younger RNs are not choosing to work as faculty in academic nursing education programs .
Racial/ethnic diversity. According to the U . S . Census Bureau (2013), individuals from ethnic and racial minority groups accounted for 37% of the U .S . population in 2012 . The current study found that 19% of responding RNs from a minority population . This percentage is a slight increase from HRSA (2010), which found that 17% were from a minority population . As compared to those licensed prior to 2000, newly licensed nurses were more likely to have a more diverse racial/ethnic composition . In particular, there were increased percentages of RNs of Asian, Black/African American, and Hispanic/Latino descent in the most recent licensed cohorts .
An examination of RN job titles, by race/ethnicity found that “nurse faculty” and “nurse executive” had the least diversity (87% and 86% White/Caucasian, respectively), while “staff nurse” had the most diversity (79% White/Caucasian) .
Education. The current study found an increase in the percentage of respondents with a BSN (36%) as their initial education, as compared to previous HRSA studies . A little over 39% of RNs held either a BSN (36%) or graduate degree (3%) as their initial credential . The increase in the percentage of respondents with a BSN as their initial education aligns with HRSA’s (2013) results, which found an increase in baccalaureate-prepared first-time NCLEX-RN test takers, at 135% growth from 2001 to 2011 .
When asked to indicate highest level of education, 61% of respondents in the current study indicated that they had obtained a baccalaureate or higher degree . Using 2008–2010 data, HRSA (2013) found that 55% of RNs reported their highest degree as a baccalaureate or higher . This was an incremental increase from 2000 Census data that indicated 50% of RNs obtained a baccalaureate or higher degree . HRSA (2010) found an increase in the percentage of RNs with a baccalaureate or higher degree from 28% in 1980 to 50% in 2008; however, this includes only baccalaureate or higher degrees in nursing or nursing-related fields .
An examination of initial education of RNs, by year licensed cohort revealed that RNs licensed between 2000 and 2013 were more likely to have obtained a BSN as their initial education (42%–44%) versus RNs licensed prior to 2000 (33%) . However, the data did not show that newly licensed nurses were more likely to have a BSN as their initial entry into the field .
Foreign-educated nurses (FENs) are another important resource for the U .S . RN workforce, especially in times of shortage in domestic supply (HRSA, 2013) . HRSA (2010) revealed that 5% of the RNs licensed prior to 2004 were FENs, and 8% since then . Results from the current study indicated that the majority of responding RNs (94%) received their entry-level education in the United States, while 6% were foreign-educated . Additionally, of RNs working full time, only 1% were newly licensed and foreign-educated; 11% were newly licensed and U .S .-educated . Also, 64% of newly licensed foreign-educated graduates were likely to have obtained a BSN to qualify them for their first US license as compared to 43% of US educated graduates . An examination of initial education, by year licensed cohort revealed the following percentages of foreign-educated RNs: licensed prior to 2000 (5%), licensed from 2000 to 2004 (11%), licensed from 2005 to 2009 (10%), and licensed from 2010 to 2013 (5%) . HRSA (2013) showed similar results; NCLEX-RN data were examined and wide variations in the number of foreign-educated nurses from 2001 through 2011 were found, with the greatest number in 2007 .
Licensing. Respondents had been licensed for an average of 23 years, 14% of respondents held multiple licenses, and 2% of respondents practiced in multiple states . Results indicated 11% of respondents had a California license, followed by New York (8%), Texas (7%), Florida (7%), and Pennsylvania (7%) . In terms of practicing in a state, 9% of respondents were practicing in California, followed by Texas (7%), Pennsylvania (7%), Florida (6%), and New York (6%) .
An examination of RNs, by year licensed cohort revealed that of employed licensees, 10% were newly licensed and 12% of RNs employed full time in nursing were newly licensed (i .e ., licensed in 2010 or after) .
An examination of the type of license currently held revealed approximately 7% were licensed as APRNs . Of those indicating recognition as an APRN, 54% identified themselves as NPs, 30% as CNSs, 12% as CRNAs, and 4% as CNMs . These proportions are somewhat different than the known proportions of APRNs (Phillips, 2009, 2013) . The current study’s sample was representative of CNMs and NPs, while CNSs were overrepresented and CRNAs were somewhat underrepresented . Over the last 4 years, the numbers of APRNs has increased 29% . According to an annual survey of boards of nursing, the increase has occurred in all APRN categories (Phillips, 2009, 2013) . The number of NPs increased from 108,787 in 2008 to 144,249 in 2012—a 33% increase . CRNAs had the most substantial increase, up 46% since 2008 and CNSs and CNMs increased 19% and 26%, respectively .

S64 Journal of Nursing Regulation
Employment status. In 2008, HRSA estimated that 2,596,399 RNs were employed in nursing, representing 85% of licensed RNs (HRSA, 2010) . This was the highest rate of nursing employment since HRSA’s first workforce survey in 1977 . Additionally, in 2004 HRSA found full-time employment of 58%; this increased to 63% in 2008 (HRSA, 2010) . The current study’s results revealed a slight decrease from 2008 numbers; specifically, in the current study, 82% of licensees were actively employed in nursing and 60% of licensees were employed full time .
An examination of RNs by year licensed cohort revealed that of full-time employed licensees, 12% were newly licensed . The vast majority of RNs not employed in nursing were licensed prior to 2000 .
Study results of respondents who indicated they were actively employed in nursing, by highest level of education, showed that respondents with an ADN (85%), BSN (85%), MSN (87%), DNP (97%), and PhD-nursing (85%) had the highest percentages of respondents actively employed in nursing, while respondents with their highest degrees in other fields tended to be less likely to have been actively employed in nursing .
The average number of hours worked during a typical week was 36 .89 hours . In terms of average hours worked per week, by highest level of education, DNPs, on average, worked the most (M = 47 .12, SD = 11 .94), followed by PhD-nursing (M = 44 .97, SD = 17 .33), noting that PhD-nursing had higher median number of hours . Respondents with a diploma in nursing worked the fewest (M = 33 .36, SD = 14 .27) . This mirrors the fact that those with diplomas tended to be older, and older RNs work fewer hours . An examination of average hours worked per week in respondents’ principal nursing position revealed that respondents who worked in academic settings (M = 45 .74, SD = 8 .67) and home health tended to work the most (M = 44 .12, SD = 9 .11) . Respondents who worked in school health service tended to work the least (M = 40 .04, SD = 6 .50) (see Table 62) . HRSA (2010) showed similar findings .
Results on unemployment indicated 7% of respondents were unemployed; however, only 3% were actively seeking work as a nurse . Of respondents who indicated they were unemployed, approximately half (51%) indicated the reason was because of taking care of home and family . Only 27% of those who gave a reason for unemployment indicated difficulty in finding a nursing position .
Position setting. In 2004, HRSA found that 57% of respondents’ primary employment setting was a hospital; this increased to 62% in 2008 (HRSA, 2010) . The current study’s results indicated a return to 2004 levels, at 57% (see Table 47), followed by 9% of RNs in ambulatory care, 6% in home health, and 6% in nursing homes . Also, 26% of RNs reported a secondary nursing position . These findings are similar to those reported by HRSA (2010) .
Of respondents who indicated “hospital” as their primary nursing practice position, the following was the breakdown of their highest level of education: diploma (8%), ADN (29%), BSN (41%), and MSN (10%) .
Additionally, the current study found that 79% of RNs younger than age 30 worked in hospitals . This percentage declined with age, with 46% of RNs age 55 and older working in hospitals .
Position title. In 2004, HRSA found that 64% of respondents’ primary job title was “staff nurse”; this increased to 66% in 2008 (HRSA, 2010) . The current study’s results indicated a return to 2004 levels, at 64% (see Table 51) . This is followed by 13% of RNs in management positions and 3% in nurse faculty positions—the same percentage reported by HRSA . The 7% of RNs identified as advanced practice was an increase over the 5% reported by HRSA (2010) .
An examination of job titles, by highest level of education revealed that of respondents who indicated “staff nurse” as their primary nursing practice position title, 41% had BSN as highest level of education, while only 4% indicated MSN as highest level of education . In terms of nurse faculty, these respondents’ highest level of education was as follows: MSN (43%), DNP (3%), PhD-nursing (10%), doctoral-nursing other (2%), and doctoral-other field (5%) .
Employment specialty. In the current study, 17% of RNs reported their primary practice specialty as acute care/critical care, followed by 13% who reported a medical-surgical specialty . Respondent RNs reported specializing in population-specific care, where 6% reported a geriatric specialty and 6% reported a pediatric specialty . Five percent of RNs reported maternal-child health as a specialty; all other specialty positions were reported to be less than 5% . Rehabilitation and women’s health both were identified as a specialty by 2% of RNs, a finding similar to that reported by HRSA (2010), where rehabilitation specialty was 3% and women’s health, 4% . Twenty percent of RNs reported their specialty in the “Other” category .
Nurse Licensure Compact. The Nurse Licensure Compact (NLC) enables multistate licensure for nurses . In 2000, NCSBN launched a new initiative to expand the mobility of nurses as part of our nation’s health care delivery system . The NLC allows nurses to have one multistate license, with the ability to practice in both their home state and other party states . The following states were members of the NLC at the time of survey data collection: Arkansas, Arizona, Colorado, Delaware, Iowa, Idaho, Kentucky, Maine, Maryland, Missouri, Mississippi, North Carolina, North Dakota, Nebraska, New Hampshire, Virginia, Wisconsin .
Results indicated that of the respondents who indicated their primary state of residence was a compact state, approximately 36% indicated utilizing their compact license; specifically, 92% indicated they had practiced in one additional state, while 8% indicated they practiced in multiple additional states . Further study on the utilization of the compact license is needed .
www .journalofnursingregulation .com S65Volume 4/Issue 2 Supplement July 2013
Tele-health. In an effort to investigate the utilization of tele-health, respondents were asked to indicate if they utilized tele-health in their primary or secondary positions . Results indicated that 9% utilized tele-health, 80% did not utilize tele-health, while 11% were unsure .
Respondents who indicated they utilized tele-health in their primary or secondary positions were asked to indicate if patients were ever located in a different state when respondents used tele-health . Results indicated that of those who utilized tele-health, 27% indicated patients had been located in a different state, while 8% were unsure .
DiscussionThe current study had a few limitations . First, the current study’s response rate was 39%, lower than anticipated . Although response rates are a valuable indicator of survey quality, they may not be a good measure of response bias . A formal nonresponse bias analysis was conducted following the close of the survey . An analysis of basic demographic data (i .e ., gender, age, race/ethnicity, number of years since graduation, number of years since first licensed) for all RN licensees sampled from the Nursys database was used to compare the survey respondents and nonrespondents, to determine the representativeness of the survey participants . Results revealed that the following groups of nurses may have been slightly overrepresented: White/Caucasian, female, age 60 or older . While the analysis provided some insight into the relationship between demographic characteristics and nonresponse, this information was not used to make nonresponse adjustments because of the high degree of missing data in the sample frame . Because of this, the only weighting that was utilized was constructed at the state level, to adjust for differing sampling rates across states .
Second, data were missing in the current study . The problem of missing data in certain variables caused inconsistent statis-tics in certain categories . To help the readers get an accurate and comprehensive view of the statistics drawn from the sample, the number of actual valid answers to each question was reported . The large sample size of the study has partially compensated for this stated problem .
Finally, this national survey of RNs represents one point in time . The RN workforce is constantly changing and needs ongo-ing monitoring and evaluation .
ReferencesAcademyHealth . (2007) . U.S.-based international nurse recruitment: Structure and practices of a burgeoning industry. Retrieved from www .
intlnursemigration .org/assets/pdfs/Report-on-Year-I .pdf
American Association of Colleges of Nursing . (2012) . Nursing faculty shortage fact sheet. Retrieved from www .aacn .nche .edu/media-relations/FacultyShortageFS .pdf
Dillman, D . A ., Smyth, J . D ., & Christian, L . M . (2009) . Internet, mail, and mixed-mode surveys: The tailored design method (3rd ed .) . Wiley .
Health Resources and Services Administration . (2010) . The registered nurse population: Findings from the 2008 national sample survey of registered nurses. Retrieved from http://bhpr .hrsa .gov/healthworkforce/rnsurvey2008 .html
Health Resources and Services Administration . (2013) . The U.S. nursing workforce: Trends in supply and education. Retrieved from http://bhpr .hrsa .gov/healthworkforce/reports/nursingworkforce/
Institute og Medicine . (2011) . The future of nursing: Focus on education. Retrieved from www .iom .edu/Reports/2010/The-Future-of-Nursing-Leading-Change-Advancing-Health/Report-Brief-Education .aspx
Moulton, P . L ., Wiebusch, P . L ., Cleary, B . L ., Brunell, M . L ., Napier, D . F ., Bienemy, C ., LeVasseur, S . A ., & Cimiotti, J . P . (2013) . Toward standardization (part 2): National nursing minimum data sets consensus building and implementation status . Policy, Politics and Nursing Practice, 13, 162–169 .
National Council of State Boards of Nursing . (2013) . APRNs in the U.S. Retrieved from www .ncsbn .org/aprn .htm
Nooney, J ., Cleary, B ., Moulton, P ., Wiebusch, P ., Murray, J ., Yore, M ., & Brunell, M . (2010) . Towards standardization (part 1): Assessment of state and national nursing workforce data sources . Policy, Politics and Nursing Practice, 11, 173–183 .
Phillips, S . J . (2009) . Legislative update 2009: Despite legal issues, APNs are still standing strong . Nurse Practitioner, 34, 19–41 . doi:10 .1097/01 .NPR .0000343752 .83969 .c0
Phillips, S . J . (2013) . 25th annual legislative update: Evidence-based practice reforms improve access to APRN care . Nurse Practitioner, 38, 18–42 .
U .S . Census Bureau . (2013) . State & County QuickFacts. Retrieved from http://quickfacts .census .go

S66 Journal of Nursing Regulation
Appendix A – Survey questionnaire

www .journalofnursingregulation .com S67Volume 4/Issue 2 Supplement July 2013

S68 Journal of Nursing Regulation
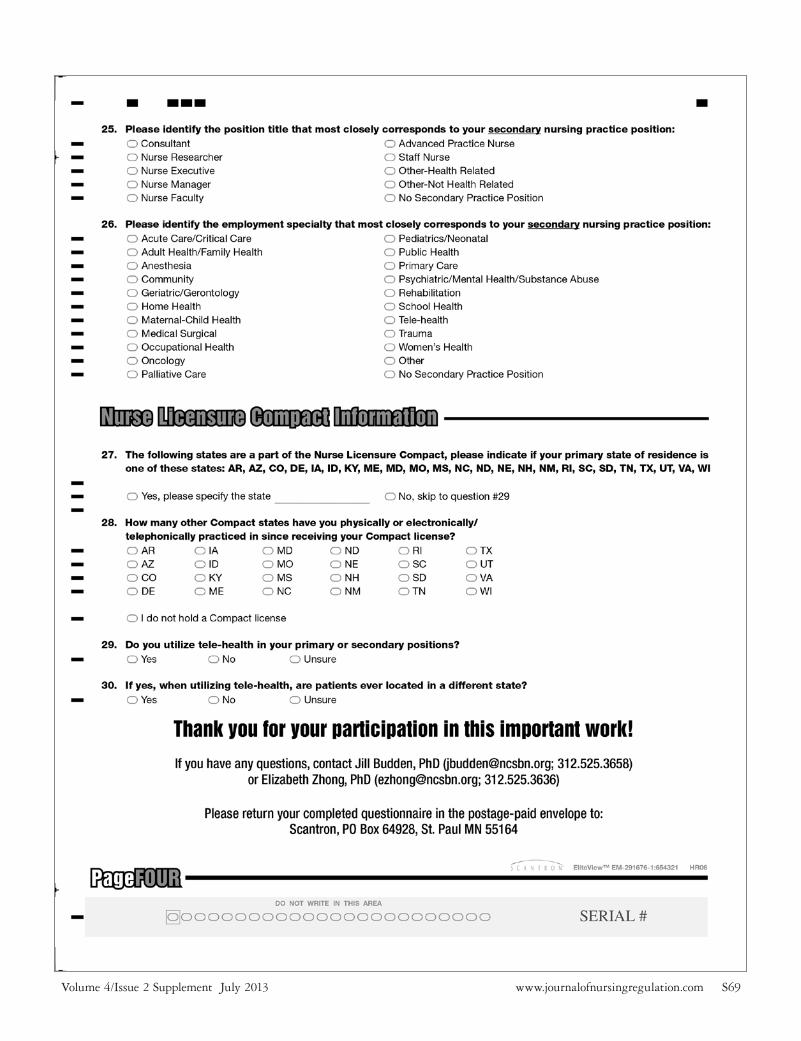
www .journalofnursingregulation .com S69Volume 4/Issue 2 Supplement July 2013

S70 Journal of Nursing Regulation
Appendix BTable 1 Sampling . . . . . . . . . . . . . . . . . . . . . . . . . . . . . . . . . . . . . . . . . . . . . . . . . . . . . . . . . . . . . . . . . . . . . . . . . . . . S4Table 2 Response Bias—Response Rate . . . . . . . . . . . . . . . . . . . . . . . . . . . . . . . . . . . . . . . . . . . . . . . . . . . . . . . . . . . S7Table 3 Response Bias—Gender . . . . . . . . . . . . . . . . . . . . . . . . . . . . . . . . . . . . . . . . . . . . . . . . . . . . . . . . . . . . . . . . S7Table 4 Response Bias—Race/Ethnicity . . . . . . . . . . . . . . . . . . . . . . . . . . . . . . . . . . . . . . . . . . . . . . . . . . . . . . . . . . . S7Table 5 Response Bias—Descriptive Statistics for Continuous Measures . . . . . . . . . . . . . . . . . . . . . . . . . . . . . . . . . . S8Table 6 Response Bias—Case Had Complete Data for Nonresponse Analysis . . . . . . . . . . . . . . . . . . . . . . . . . . . . . . S8Table 7 Response Bias—Survey Completion Rate by Gender . . . . . . . . . . . . . . . . . . . . . . . . . . . . . . . . . . . . . . . . . . . S8Table 8 Response Bias—Survey Completion Rate by Race/Ethnicity . . . . . . . . . . . . . . . . . . . . . . . . . . . . . . . . . . . . . S9Table 9 Response Bias—Differences in Mean Age, Years Since Graduation, and Years Since Licensure, by Survey
Completion . . . . . . . . . . . . . . . . . . . . . . . . . . . . . . . . . . . . . . . . . . . . . . . . . . . . . . . . . . . . . . . . . . . . . . . . . . S9Table 10 Response Bias—Survey Completion Rate . . . . . . . . . . . . . . . . . . . . . . . . . . . . . . . . . . . . . . . . . . . . . . . . . . S10Table 11 Model 1 Logistic Regression with Missing Values Coded as Category . . . . . . . . . . . . . . . . . . . . . . . . . . . . . S11Table 12 Model 2 Logistic Regression with Missing Values Coded as Category . . . . . . . . . . . . . . . . . . . . . . . . . . . . . S12Table 13 Response Bias—Descriptive Statistics of Weights, Total Frame . . . . . . . . . . . . . . . . . . . . . . . . . . . . . . . . . S13Table 14 Response Bias—Descriptive Statistics of Weights, Complete Responses Only . . . . . . . . . . . . . . . . . . . . . . S13Table 15 Gender . . . . . . . . . . . . . . . . . . . . . . . . . . . . . . . . . . . . . . . . . . . . . . . . . . . . . . . . . . . . . . . . . . . . . . . . . . . . S14Table 16 Highest Education of Registered Nurses Working in Nursing, by Gender . . . . . . . . . . . . . . . . . . . . . . . . . S14Table 17 Employment Settings, by Gender . . . . . . . . . . . . . . . . . . . . . . . . . . . . . . . . . . . . . . . . . . . . . . . . . . . . . . . . S15Table 18 Percent of Men and Women Employed in Nursing, by Job Title . . . . . . . . . . . . . . . . . . . . . . . . . . . . . . . . . S15Table 19 Average Age of Registered Nurse Respondents . . . . . . . . . . . . . . . . . . . . . . . . . . . . . . . . . . . . . . . . . . . . . . S15Table 20 Age Distribution of Registered Nurses Working in Nursing . . . . . . . . . . . . . . . . . . . . . . . . . . . . . . . . . . . S16Table 21 Registered Nurses by Race/Ethnicity . . . . . . . . . . . . . . . . . . . . . . . . . . . . . . . . . . . . . . . . . . . . . . . . . . . . . S16Table 22 Mean Current Age of Registered Nurses Working in Nursing, by Race/Ethnicity . . . . . . . . . . . . . . . . . . . S16Table 23 Initial Nursing Education of Registered Nurses Employed in Nursing, by Race/Ethnicity . . . . . . . . . . . . . S17Table 24 Highest Education of Registered Nurses Employed in Nursing, by Race/Ethnicity . . . . . . . . . . . . . . . . . . S17Table 25 Advanced Practice Preparation of Registered Nurses, by Race/Ethnicity . . . . . . . . . . . . . . . . . . . . . . . . . . . S18Table 26 Employment Setting of Registered Nurses, by Race/Ethnicity . . . . . . . . . . . . . . . . . . . . . . . . . . . . . . . . . . S19Table 27 Job Titles of Registered Nurses, by Race/Ethnicity . . . . . . . . . . . . . . . . . . . . . . . . . . . . . . . . . . . . . . . . . . . S19Table 28 Type of Nursing Degree/Credential That Qualified Respondents for First U .S . Nursing License . . . . . . . . . S20Table 29 Highest Level of Education . . . . . . . . . . . . . . . . . . . . . . . . . . . . . . . . . . . . . . . . . . . . . . . . . . . . . . . . . . . . . S21Table 30 Highest Education of Registered Nurses, by Initial Nursing Education . . . . . . . . . . . . . . . . . . . . . . . . . . . S21Table 31 Country Where Entry-Level Education Received . . . . . . . . . . . . . . . . . . . . . . . . . . . . . . . . . . . . . . . . . . . . S22Table 32 Years Since Initial U .S . Licensure . . . . . . . . . . . . . . . . . . . . . . . . . . . . . . . . . . . . . . . . . . . . . . . . . . . . . . . . S22Table 33 Country Where Initially Licensed as an RN or LPN . . . . . . . . . . . . . . . . . . . . . . . . . . . . . . . . . . . . . . . . . . S23Table 34 Type of License Currently Held . . . . . . . . . . . . . . . . . . . . . . . . . . . . . . . . . . . . . . . . . . . . . . . . . . . . . . . . . . S23Table 35 Currently Licensed/Certified as an Advanced Practice Registered Nurse (APRN) . . . . . . . . . . . . . . . . . . . . S23Table 36 All States in Which Respondents Had an Active License to Practice as an RN . . . . . . . . . . . . . . . . . . . . . . S24Table 37 Respondents with Multiple Licenses . . . . . . . . . . . . . . . . . . . . . . . . . . . . . . . . . . . . . . . . . . . . . . . . . . . . . . S25Table 38 All States in Which Respondents Were Currently Practicing . . . . . . . . . . . . . . . . . . . . . . . . . . . . . . . . . . . S25Table 39 Respondents Practicing in Multiple States . . . . . . . . . . . . . . . . . . . . . . . . . . . . . . . . . . . . . . . . . . . . . . . . . S26Table 40 Employment Status . . . . . . . . . . . . . . . . . . . . . . . . . . . . . . . . . . . . . . . . . . . . . . . . . . . . . . . . . . . . . . . . . . . S26Table 41 Reasons for Being Unemployed . . . . . . . . . . . . . . . . . . . . . . . . . . . . . . . . . . . . . . . . . . . . . . . . . . . . . . . . . . S27Table 42 Employment of Registered Nurses, by Age-Group . . . . . . . . . . . . . . . . . . . . . . . . . . . . . . . . . . . . . . . . . . . S27Table 43 Employment Rates, by Initial Nursing Education . . . . . . . . . . . . . . . . . . . . . . . . . . . . . . . . . . . . . . . . . . . . S28Table 44 Employment Rates, by Highest Level of Education . . . . . . . . . . . . . . . . . . . . . . . . . . . . . . . . . . . . . . . . . . . S28Table 45 Number of Positions Respondents Were Currently Employed in as a Nurse . . . . . . . . . . . . . . . . . . . . . . . . S29Table 46 Registered Nurses Holding Multiple Positions, by Primary Employment Status . . . . . . . . . . . . . . . . . . . . S29Table 47 Primary Nursing Practice Position Setting . . . . . . . . . . . . . . . . . . . . . . . . . . . . . . . . . . . . . . . . . . . . . . . . . S30Table 48 Secondary Nursing Practice Position Setting . . . . . . . . . . . . . . . . . . . . . . . . . . . . . . . . . . . . . . . . . . . . . . . . S30Table 49 Employment Settings, by Highest Level of Education . . . . . . . . . . . . . . . . . . . . . . . . . . . . . . . . . . . . . . . . . S31Table 50 Employment Settings, by Age-Group . . . . . . . . . . . . . . . . . . . . . . . . . . . . . . . . . . . . . . . . . . . . . . . . . . . . . S32

www .journalofnursingregulation .com S71Volume 4/Issue 2 Supplement July 2013
Table 51 Primary Nursing Practice Position Title . . . . . . . . . . . . . . . . . . . . . . . . . . . . . . . . . . . . . . . . . . . . . . . . . . . S33Table 52 Secondary Nursing Practice Position Title . . . . . . . . . . . . . . . . . . . . . . . . . . . . . . . . . . . . . . . . . . . . . . . . . . S34Table 53 Job Titles, by Highest Level of Education . . . . . . . . . . . . . . . . . . . . . . . . . . . . . . . . . . . . . . . . . . . . . . . . . . S34Table 54 Primary Nursing Practice Position Employment Specialty . . . . . . . . . . . . . . . . . . . . . . . . . . . . . . . . . . . . . S35Table 55 Secondary Nursing Practice Position Employment Specialty . . . . . . . . . . . . . . . . . . . . . . . . . . . . . . . . . . . . S36Table 56 Primary Clinical Specialty in Principal Nursing Position for Hospital and Nonhospital Settings . . . . . . . . S37Table 57 Primary Clinical Specialty in Principal Nursing Position, by Highest Level of Education . . . . . . . . . . . . . . S37Table 58 Hours Worked During a Typical Week in All Nursing Positions . . . . . . . . . . . . . . . . . . . . . . . . . . . . . . . . S38Table 59 Average Hours Worked per Week in All Nursing Jobs, by Number of Nursing Jobs . . . . . . . . . . . . . . . . . S39Table 60 Average Hours Worked per Week in All Nursing Positions, by Age-Group . . . . . . . . . . . . . . . . . . . . . . . . S39Table 61 Average Hours Worked per Week in All Nursing Positions, by Highest Level of Education . . . . . . . . . . . . S39Table 62 Average Hours per Week in Principal Nursing Position, by Full-Time/Part-Time Status and Employment
Setting . . . . . . . . . . . . . . . . . . . . . . . . . . . . . . . . . . . . . . . . . . . . . . . . . . . . . . . . . . . . . . . . . . . . . . . . . . . . S40Table 63 Average Hours per Week in Principal Nursing Position, by Full-time/Part-time Status and Job Title . . . . S41Table 64 Age Distribution of Nurses Who Were Not Employed in Nursing . . . . . . . . . . . . . . . . . . . . . . . . . . . . . . . S41Table 65 Percent of Registered Nurses Seeking Nursing Employment by Age . . . . . . . . . . . . . . . . . . . . . . . . . . . . . S41Table 66 Registered Nurses Employed as Faculty in Their Secondary Nursing Position(s), by Job Title of Principal
Nursing Position . . . . . . . . . . . . . . . . . . . . . . . . . . . . . . . . . . . . . . . . . . . . . . . . . . . . . . . . . . . . . . . . . . . . . S42Table 67 Age Distribution of Registered Nurses Who Work as Faculty . . . . . . . . . . . . . . . . . . . . . . . . . . . . . . . . . . S42Table 68 Hours Worked per Week, by Registered Nurses Who Were Faculty in Their Principal Nursing Position . S43Table 69 Age Distribution of Registered Nurses Prepared as Nurse Practitioners . . . . . . . . . . . . . . . . . . . . . . . . . . . S44Table 70 Nurse Practitioner Preparation, by Highest Level of Education . . . . . . . . . . . . . . . . . . . . . . . . . . . . . . . . . . S44Table 71 Job Titles of Nurse Practitioners . . . . . . . . . . . . . . . . . . . . . . . . . . . . . . . . . . . . . . . . . . . . . . . . . . . . . . . . . S44Table 72 Primary Clinical Specialties of Employed Nurse Practitioners With Job Title of Nurse Practitioner . . . . . . S44Table 73 Employed Nurse Practitioners in Primary Care, by Job Title . . . . . . . . . . . . . . . . . . . . . . . . . . . . . . . . . . . . S45Table 74 Employment Settings in Which Nurse Practitioners Work . . . . . . . . . . . . . . . . . . . . . . . . . . . . . . . . . . . . . S46Table 75 Employment Setting of Nurse Practitioners in Primary Care . . . . . . . . . . . . . . . . . . . . . . . . . . . . . . . . . . . . S46Table 76 Age Distribution of Registered Nurses Prepared as Nurse Midwives . . . . . . . . . . . . . . . . . . . . . . . . . . . . . . S46Table 77 Nurse Midwife Preparation, by Highest Level of Education . . . . . . . . . . . . . . . . . . . . . . . . . . . . . . . . . . . . S47Table 78 Job Titles of Nurse Midwives . . . . . . . . . . . . . . . . . . . . . . . . . . . . . . . . . . . . . . . . . . . . . . . . . . . . . . . . . . . S47Table 79 Employment Settings in Which Nurse Midwives Work . . . . . . . . . . . . . . . . . . . . . . . . . . . . . . . . . . . . . . . S47Table 80 Employment Specialties of Registered Nurses Prepared as Nurse Midwives, for Selected Job Titles in the
Hospital Setting . . . . . . . . . . . . . . . . . . . . . . . . . . . . . . . . . . . . . . . . . . . . . . . . . . . . . . . . . . . . . . . . . . . . . S48Table 81 Age Distribution of Registered Nurses Prepared as Certified Nurse Anesthetists . . . . . . . . . . . . . . . . . . . . S48Table 82 Nurse Anesthetist Preparation, by Highest Level of Education . . . . . . . . . . . . . . . . . . . . . . . . . . . . . . . . . . S48Table 83 Age Distribution of Registered Nurses Prepared as Clinical Nurse Specialists . . . . . . . . . . . . . . . . . . . . . . . S49Table 84 Clinical Nurse Specialist Preparation, by Highest Level of Education . . . . . . . . . . . . . . . . . . . . . . . . . . . . . S49Table 85 Job Titles of Employed Nurses Prepared as Clinical Nurse Specialists . . . . . . . . . . . . . . . . . . . . . . . . . . . . . S49Table 86 Employment Settings in Which Clinical Nurse Specialists Work . . . . . . . . . . . . . . . . . . . . . . . . . . . . . . . . S49Table 87 Median Current Age of Registered Nurses Employed in Nursing, by Foreign-Education Status . . . . . . . . . S50Table 88 Registered Nurses Working Full Time, by Location of Education and Year of Licensure . . . . . . . . . . . . . . . S50Table 89 Average Hours Worked per Week, by Full-Time and Part-Time Status and Location of Education . . . . . . . S51Table 90 Secondary Nursing Positions Held by Foreign-Educated Nurses Working Full Time in Their Principal
Nursing Position . . . . . . . . . . . . . . . . . . . . . . . . . . . . . . . . . . . . . . . . . . . . . . . . . . . . . . . . . . . . . . . . . . . . . S51Table 91 Number and Percent of Nurses Employed in a Hospital Setting for Their Principal Nursing Position,
by Location of Initial Education and Year of Licensure . . . . . . . . . . . . . . . . . . . . . . . . . . . . . . . . . . . . . . . . S51Table 92 Registered Nurses Employed in Ambulatory Care and Academic Setting, by Location of Initial Education S51Table 93 Registered Nurses Employed as Staff Nurses, by Location of Initial Education and Year of Licensure . . . . . S52Table 94 Initial Education of Registered Nurses, by Year Licensed Cohort . . . . . . . . . . . . . . . . . . . . . . . . . . . . . . . . S52Table 95 Location of Initial Education of Nurses, by Year Licensed Cohort . . . . . . . . . . . . . . . . . . . . . . . . . . . . . . . . S53Table 96 Initial Nursing Education, by Year Licensed and Location of Education . . . . . . . . . . . . . . . . . . . . . . . . . . . S53Table 97 Gender of Registered Nurses, by Year Licensed Cohort . . . . . . . . . . . . . . . . . . . . . . . . . . . . . . . . . . . . . . . . S54

S72 Journal of Nursing Regulation
Table 98 Racial/Ethnic Composition of Registered Nurse Population, by Year Licensed Cohort . . . . . . . . . . . . . . . . S54Table 99 Registered Nurses, by Year Licensed Cohort . . . . . . . . . . . . . . . . . . . . . . . . . . . . . . . . . . . . . . . . . . . . . . . . S54Table 100 Employment of Registered Nurses, by Year Licensed Cohort . . . . . . . . . . . . . . . . . . . . . . . . . . . . . . . . . . . . S55Table 101 Employment Setting of Principal Nursing Position, by Year Licensed Cohort . . . . . . . . . . . . . . . . . . . . . . . S55Table 102 Secondary Nursing Positions, by Year Licensed Cohort . . . . . . . . . . . . . . . . . . . . . . . . . . . . . . . . . . . . . . . . S56Table 103 Job Titles of Registered Nurses, by Year Licensed Cohort . . . . . . . . . . . . . . . . . . . . . . . . . . . . . . . . . . . . . . S56Table 104 Average Hours Worked per Week by Registered Nurses, by Full-Time/Part-Time Status and Year
Licensed Cohort . . . . . . . . . . . . . . . . . . . . . . . . . . . . . . . . . . . . . . . . . . . . . . . . . . . . . . . . . . . . . . . . . . . . . . S57Table 105 Demographic and Educational Characteristics of Registered Nurses, by Age . . . . . . . . . . . . . . . . . . . . . . . . S57Table 106 Percent of Employed Registered Nurses Working Full Time and Part Time, by Age-Group . . . . . . . . . . . . S58Table 107 Job Titles of Registered Nurses in Their Principal Nursing Position, by Age-Group . . . . . . . . . . . . . . . . . S58Table 108 Average Hours Worked per Week by Registered Nurses in Their Principal Nursing Position, by Age . . . . S59Table 109 Percent of Employed Registered Nurses With Secondary Nursing Positions, by Age . . . . . . . . . . . . . . . . . S59Table 110 Percent of Registered Nurses Employed in Other Field, by Age-Group . . . . . . . . . . . . . . . . . . . . . . . . . . . S60Table 111 Is Primary State of Residence Part of the Nurse Licensure Compact? . . . . . . . . . . . . . . . . . . . . . . . . . . . . . . S60Table 112 Number of Additional Compact States Respondents Had Physically or Electronically/Telephonically
Practiced in Since Receiving Compact License . . . . . . . . . . . . . . . . . . . . . . . . . . . . . . . . . . . . . . . . . . . . . . S61Table 113 Percent of Compact Respondents Who Practiced in Multiple Compact States . . . . . . . . . . . . . . . . . . . . . . S61Table 114 Did Respondents Utilize Tele-health in Their Primary or Secondary Positions? . . . . . . . . . . . . . . . . . . . . . S62Table 115 When Respondents Utilized Tele-health, Were Patients Ever Located in a Different State? . . . . . . . . . . . . . S62