journal: journal of analytical atomic spectrometry
TRANSCRIPT

The investigation of ancient metal artefacts by portable X-
ray fluorescence devices
Journal: Journal of Analytical Atomic Spectrometry
Manuscript ID: JA-TRV-03-2014-000107.R1
Article Type: Tutorial Review
Date Submitted by the Author: 03-Jul-2014
Complete List of Authors: Ferretti, Marco; Institute for Technologies Applied to Cultural Heritage,
Journal of Analytical Atomic Spectrometry
The investigation of ancient metal artefacts by portable X-ray fluorescence devices
Marco Ferretti
CNR – Istituto per le Tecnologie Applicate ai Beni Culturali
Via Salaria km 29.300, 00015 Montelibretti (Rome), Italy
Email: [email protected]
Abstract
X-ray fluorescence (XRF) analysis by portable spectrometers has long been applied to
the study of ancient metal artefacts. Its effectiveness depends, on the one hand, on the
capability of providing answers to archaeological, historical and technological
questions. On the other, the artistic and monetary value of the artefacts is such that
respecting the physical integrity of the objects is in most cases mandatory. These two
conditions – i.e. being non-destructive and, at the same time, capable of significant
results – affect the design of the spectrometer, with special regard to the balance
between portability and analytical performance, as well as the measurement strategy.
This paper presents a critical discussion concerning the use of portable XRF devices in
the investigation of ancient metal artefacts, including the advantages and limitations of
different technical solutions and measurement strategies.
Measuring the absolute composition of the objects often requires the removal of patina,
which is seldom permitted for ancient artefacts. Hence, emphasis is given to alternative
methods, more respectful of artefact integrity and capable to make the most of non-
destructivity and measurement speed, which are the real mainstays of portable XRF.
Other uses of this technique, such as the analysis of multilayered materials and the study
of surface compositional changes are also discussed.
Page 1 of 50 Journal of Analytical Atomic Spectrometry
123456789101112131415161718192021222324252627282930313233343536373839404142434445464748495051525354555657585960

Introduction
This paper discusses different aspects of the application of portable X-ray fluorescence
(XRF) to the investigation of ancient metal artefacts (Fig. 1). The focus is on the
relationships between research questions, analysed materials, measurement strategies
and instrumentation, which are considered as parts of a single ‘knowledge-producing
system’. Hardware components and quantification algorithms are considered as far as
relevant to the user or the assembler of the equipment, but detailed technical
specifications are beyond the scope of this paper.
For over fifty years, X-ray fluorescence (XRF) has been one of the most successful
techniques used for the elemental analysis of cultural materials. The first case studies
were published in the late 1950s1 and the 1960s, when small metal objects
2-4, glass
5,
jade6 and pigments
7-11 were analysed by means of so-called wavelength-dispersive
spectrometers, huge pieces of equipment that could not be moved from the laboratory.
For the study of cultural materials the non-destructive nature of XRF was a much
appreciated feature. However it could only be used on objects that were sufficiently
small to fit in the measurement chamber and that could be brought to the laboratory.
Bringing the XRF equipment to the object became possible in the early 1970’s when the
so-called energy-dispersive spectrometers, at that time equipped with detectors that had
to be cooled by liquid nitrogen, came into widespread use. Thanks to the compact and
open architecture of energy-dispersive systems, XRF spectrometers not only became
portable and therefore suitable for in situ investigation12,13
, but it was also possible to
extend their use to the analysis of objects of any shape and size.
Twenty years later, in situ usability of XRF spectrometers was further improved by the
introduction of the so-called Si-PIN and Si-Drift detectors14,15
. These detectors have
Page 2 of 50Journal of Analytical Atomic Spectrometry
123456789101112131415161718192021222324252627282930313233343536373839404142434445464748495051525354555657585960

energy resolution similar to that attainable by liquid nitrogen cooling, but do not need
liquid nitrogen. Together with low-power X-ray tubes, they made the construction of
hand-held devices possible16
. Such devices, built in a readily understood gun-like form
are contributing much to the spread of portable systems and, at least in part, to the
misperception that XRF is as easy as ‘taking aim and shooting’. Since the early 70’s, the
size of the equipment has radically decreased, which means that the adjective ‘portable’
was originally used for equipment that today seems cumbersome. In this paper,
‘portable’ refers to any kind of spectrometer that can be used in situ and moved around
the object.
The latest innovation in XRF equipment that has been significant for the analysis of
cultural materials concerns poly-capillary optics17,18
. These optics focus the excitation
beam to some tens of µm and considerably improve the spatial resolution of the
analysis, that is, the capability of analysing very small details with no interference from
the surrounding materials. Should surface abrasion (discussed further below) be
necessary for XRF analysis, a smaller abraded area is required, thus reducing the impact
on the object.
The combination of non-destructivity and suitability for in situ use makes the XRF
technique extremely effective in archaeometry and conservation science. It has provided
significant results on a wide range of materials, even if the detection of the low atomic
number component of these materials is difficult. Metal artefacts are ideal for applying
XRF because all their major elements can be detected, with results that are often crucial
in historical and technological research.
Physical principles and limitations of X-ray fluorescence
Page 3 of 50 Journal of Analytical Atomic Spectrometry
123456789101112131415161718192021222324252627282930313233343536373839404142434445464748495051525354555657585960

The physical principles of XRF are well known: if a sample is irradiated with
electromagnetic radiation of suitable energy, electronic transitions can be induced in the
inner shells of its atoms. Such transitions result in the emission of X-rays whose energy
is characteristic of the element affected by the transitions, whereas the intensity of
emission is related to its abundance in the sample.
As far as cultural materials are concerned, XRF has two important limitations. One is
that the detection of low atomic number elements (Z<20) is difficult, due to their low
photoelectric absorption coefficient, to the higher degree of internal conversion (Auger
effect) and to the low energy of the characteristic radiation. The second limitation is
that, due to the absorption of X-rays in the sample, only a relatively thin layer below the
surface is analysed. A quantitative idea of where the analytical information comes from
is given in Fig. 2. It plots the percentage of the overall fluorescent signal provided by
the first d micrometres below the sample surface. The curves refer to an infinitely thick
bronze alloy (85% Cu, 10% Sn, 5% Pb) and to the Cu-K, Sn-K and Pb-L fluorescent
lines. Almost the entire analytical information of Cu and Pb and almost half of the Sn
information comes from the first 20µm. If one considers that the corrosion products
covering metal artefacts may easily reach several tens of µm in thickness, it is easy to
understand how strongly corrosion limits the accuracy of XRF measurements.
A more general discussion of the interactions between the fluorescent radiation and the
sample requires introducing matrix effect, which is the combination of absorption and
enhancement (fluorescence excited in the analysed element by the fluorescent radiation
of other elements in the sample). Given the scope of this paper, it is sufficient to say that
matrix effect depends on the sample composition and that this dependence considerably
complicates the relationship between the fluorescent intensity and the concentration of
the analysed element.
Page 4 of 50Journal of Analytical Atomic Spectrometry
123456789101112131415161718192021222324252627282930313233343536373839404142434445464748495051525354555657585960

Depending on the energy of the exciting radiation, different shells can be excited in the
same element. Fig. 3 shows the spectrum of a bronze sample with 94.12% Cu, 2.3% Sn,
3.4% Pb, 0.03% Ag and 0.15% Sb, in which both the L- and the K-shells of Ag, Sn and
Sb are excited. The energy span between the K-lines is much higher, which makes them
more free from mutual interference and more suitable for quantification than the L-
lines. In this spectrum, for example, the Sb Kα line can be easily distinguished from the
adjacent Sn Kα, although the latter is 15 times more intense.
Elemental composition for understanding ancient metals
This section discusses how elemental analysis – and in particular portable XRF analysis
– can contribute to the understanding of ancient metal artefacts, what metals can be
investigated, with what results, to answer what questions.
For thousands of years – copper metallurgy began 8500 years ago in the Near East and
6500 years ago in Europe19
– metals have played an important role in material cultures.
Produced for the most diverse purposes, metal artefacts are extremely varied in shape,
size and composition. Different combinations of casting, mechanical working and
soldering produce objects with excellent mechanical properties, complex shapes and
attractive appearance.
Whereas elemental composition is important in addressing archaeological, historical and
technological issues, it must be considered that XRF is not equally effective for all
metals. Characterization of iron alloys, for example, requires the analysis of low atomic
number elements. They are present in such small amounts to be practically invisible to a
portable XRF spectrometer20
. In contrast, significant results have been obtained on
copper, gold, silver and their alloys, as discussed below.
Page 5 of 50 Journal of Analytical Atomic Spectrometry
123456789101112131415161718192021222324252627282930313233343536373839404142434445464748495051525354555657585960

Copper-based artefacts are probably the most numerous class of ancient metal objects as
they are relatively resistant to corrosion and common in everyday life. Depending on
whether the main element alloyed with copper is tin or zinc, they are roughly classified
as bronzes or brasses. Several minor elements occur in the composition of copper
alloys, in sufficiently high amounts to be detectable by portable XRF. From the
analyst’s point of view, this is an advantage, not only because he/she has more variables
to play with, but also because minor elements have larger variation ranges and are more
effective discriminators than the major ones. A comprehensive overview on the
composition of copper alloys, considering different types of objects, geographical
contexts and historical periods, is provided by Craddock21
. Though not decisive in
determining the original context of an artefact – for example tin bronzes have similar
compositions all over the Old World – elemental composition can be an indicator of the
technical history of the object.
An example of the relationship between fabrication process and composition is given by
composite artefacts in which some parts are cast and others are cold-worked, such as the
handles and the basin in a vessel. The fabrication of a basin, as well as of any sheet of
bronze, is done by hammering alternated with annealing, i.e. heating the piece to allow
for relaxation of the stresses caused by hammering. Annealing is essential to restore the
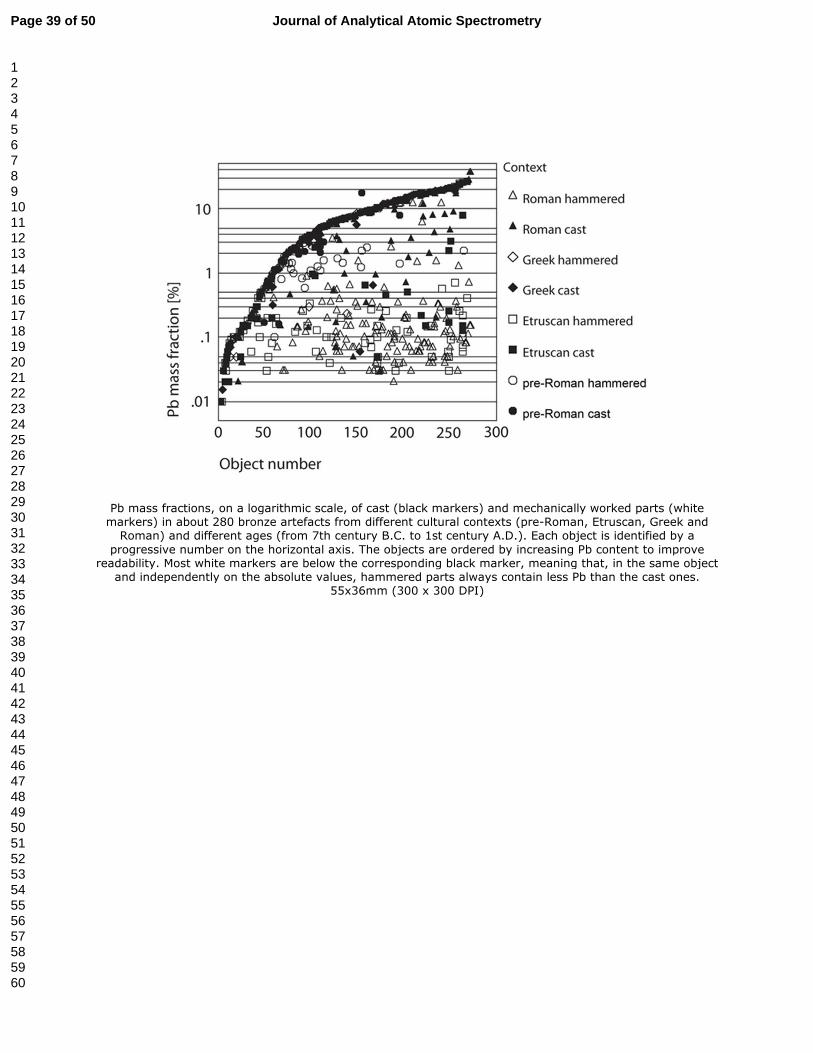
malleability of bronze, otherwise it would break before reaching its final shape. Fig. 4
plots analytical data from selected literature21-28
concerning the Pb mass fraction in 280
artefacts, mostly vessels, from different cultural contexts (pre-Roman, Etruscan, Greek
and Roman) and periods (7th century B.C. to 1st century A.D.). For each artefact,
identified by a progressive number on the horizontal axis, black markers represent the
cast parts and white markers the hammered ones. Most white markers are below the
Page 6 of 50Journal of Analytical Atomic Spectrometry
123456789101112131415161718192021222324252627282930313233343536373839404142434445464748495051525354555657585960

corresponding black marker, meaning that, in the same object and independently on the
absolute values, hammered parts always contain less Pb than the cast ones.
Whereas most authors assume that such a difference is intentional, Ferretti et al.29
observed that the cycles of hammering and annealing may produce a spontaneous and
qualitatively similar effect. Fig. 5 is a scanning electron microscope (SEM) back-
scattered electron (BSE) image of a cross-section and shows the effect of annealing on a
leaded bronze. At temperatures of 600-700°C, Pb is liquid in a solid Cu-Sn matrix and
tends to migrate towards the surface. There, it is absorbed by the spongy cupric oxide
(CuO, tenorite) formed at high temperature and oxidized. This process, repeated many
times during the fabrication, may cause – at least in part – the low Pb content observed
in hammered pieces. Observations of Van Langh et al.30
, describing the effect of heating
on the XRF analysis of Pb in Cu alloys, can be related to this phenomenon.
Copper-based alloys are frequently covered by layers of corrosion products, commonly
called patina (a corrosion layer which retains the form of the original surface of the
object), reaching several tens or hundreds of µm in thickness. Robbiola et al.31
show
that, in burial contexts where water is present, corrosion takes place by selective
dissolution of Cu from the alloy. Copper corrosion products tend to leave the surface of
the object, as they are more soluble than those of Sn and Pb. According to whether the
original surface is preserved or not, Robbiola et al. identify a type I corrosion,
characterised by low corrosion rates and a Sn content similar to that of the bulk alloy,
and a type II corrosion, characterised by a generalized corrosive attack and Sn content
higher than in the bulk alloy.
Residual stress may affect corrosion as well. For example, Ferretti et al.32
observed that
cold-worked pieces have their own corrosion pattern. This is characterised by a
compact, protective layer of tin oxide (SnO2, cassiterite) produced by the anodic
Page 7 of 50 Journal of Analytical Atomic Spectrometry
123456789101112131415161718192021222324252627282930313233343536373839404142434445464748495051525354555657585960

behaviour of the areas affected by residual stress. Similarly to type II corrosion, the Sn
content is higher than that of the bulk alloy but, in contrast to it, the corrosion layer
retains the morphology of the original surface.
High fluorescent intensities (or apparent concentrations) of Sn can be used as indicators
of deep corrosion. This will be further discussed in the next section.
Gold alloys can disclose important information through elemental analysis33
. For
example, Pt and Pd can be used to distinguish gold ores and detect changes in gold
supplies; native gold can be recognised from composition; the Ag-Pb correlation
indicates intentional alloying of gold and silver; different soldering techniques can be
distinguished through Cu and Ag contents.
Elemental analysis of silver alloys is less informative, as purification processes may
remove ore-characteristic trace elements from the metal.
Both gold and silver are used in the manufacturing of “coated” artefacts and, once
again, elemental analysis is important to address technological questions. The presence
of Hg, for example, is characteristic of the fire gilding technique, whereas variable
Hg/Au ratios on the same object may indicate different phases in the application of the
amalgam or even different craftsmen.
Corrosion does not occur in gold artefacts, which makes them ideal, as to measurement
accuracy, for XRF applications. This is not the case of Ag alloys, in which the presence
of corrosion products, mainly acanthite (Ag2S) and chlorargyrite (AgCl), interferes with
the measurements and causes problems similar to those of Cu alloys.
Measurement strategies for using portable XRF devices
Analytical approaches aimed at quantification of chemical elements were the first and,
probably, the most practised applications of XRF analysis in study of ancient metal
Page 8 of 50Journal of Analytical Atomic Spectrometry
123456789101112131415161718192021222324252627282930313233343536373839404142434445464748495051525354555657585960

artefacts. They consist in measuring the absolute composition of the alloy with the best
possible accuracy and precision. As accuracy is worsened by the presence of corrosion
products on the object surface, these have to be removed prior to XRF analysis to
expose the uncorroded metal (which is not always feasible given the cultural and
monetary value of the artefacts). An example of quantification performed by portable
XRF on gold, silver and copper alloys is provided by Karydas34
.
One of the main advantages of quantification-aimed approaches is that they allow for
comparing and pooling data generated by different laboratories, provided the
measurements are reproducible. The results of an inter-laboratory comparison carried
out by Heginbotham et al.35
show that, in fact, they are not or, at least, not yet
reproducible. The comparison established that reproducibility of portable XRF
measurements on copper alloys is higher than 50% relative for all elements, except Cu,
Zn, and Sn. This is hardly satisfactory, at least from the point of view of a
quantification-oriented analyst, but is inherent in portable equipment. Moreover the
comparison was carried out on polished samples, whereas real life objects are corroded,
which further increases the overall uncertainty. One has to wonder if accurate and
precise analyses on ancient metal objects are a realistic goal.
Aside from that, a crucial question is if quantification is really needed. Will knowing
the ‘true’ concentration of a given element actually affect the archaeological, historical
and technological conclusions? It has been shown that this occurs with gold alloys, but
the concentration ranges of the most significant elements are below the detection limits
of portable XRF, so that this technique is not (yet) applicable33
.
The case of copper alloys is even more complicated: given the compositional spread
reported by Craddock21
, it seems unlikely that quantification can be decisive in solving
historical problems. It is true that composition is related to the technical history of the
Page 9 of 50 Journal of Analytical Atomic Spectrometry
123456789101112131415161718192021222324252627282930313233343536373839404142434445464748495051525354555657585960

object, but such relationship is in most cases qualitative. For example, Fig. 4 shows that,
in the same object, hammered parts contain less lead than cast parts, but there is no
threshold below which a piece can only be hammered and above which it can only be
cast. Moreover, copper alloys are not so prone to quantification, as the accuracy is
strongly affected by surface corrosion. For many years36
, the removal of patina is a
common means of reaching the uncorroded metal, thus avoiding the problem. This
practice, however, is not advisable because: a) patina may retain morphological details
of the original surface; b) it may be protective and prevent further corrosion and c) it
may be difficult to know when to stop abrading, as a shiny aspect does not guarantee
that uncorroded metal has been reached. Besides being of uncertain success, the
removal of patina is always an irreversible alteration of the integrity of an object.
It can be concluded that measuring the absolute composition of a metal artefact is not
the most profitable use of portable XRF. The real mainstay of this technique is a
combination of non-destructivity and measurement speed. A different, alternative
approach making the most of these capabilities is possible and will be discussed below.
Such an approach assumes that the measurement is carried out on the unaltered surface,
that is to say, no patina is removed by the analyst. The discussion that follows is for
copper alloys, because they provide the most adverse measurement conditions. The
principle, however, can be applied to other types of alloys as well.
One of the advantages of a non-destructive method is that the number of measurements
can be high – virtually infinite – with no consequences for the object and short
measuring times make multiple measurements feasible. In the highly variable conditions
typical of ancient metal artefacts, working with clusters, instead of single data points,
has the obvious advantage of allowing identification of average behaviours and outliers.
It is worth remarking that this is opposite to a quantification-aimed approach, in which
Page 10 of 50Journal of Analytical Atomic Spectrometry
123456789101112131415161718192021222324252627282930313233343536373839404142434445464748495051525354555657585960

the damage caused by surface abrasion necessarily restricts the number of
measurements.
Fig. 6 shows a simulation obtained by the fundamental parameters (see next section)
software PyMCA37
. It represents the fluorescent behaviour of a bronze substrate (88%
Cu, 10% Sn, 2% Pb) covered by two different types of corrosion layers of variable
thickness, corresponding to Robbiola’s type I and type II corrosion31
. The relative
variations in the fluorescent intensities are plotted versus the thickness of these layers.
In more detail, the relative intensity is defined as RI(t)=Ii,j(t)/Ii,0, where t is the coating
thickness, Ii,j(t) is the fluorescent intensity from the substrate and the corrosion layer,
and Ii,0 is the fluorescent intensity from the substrate alone, the index i accounting for
Cu-Kα, Sn-Kα or Pb-Lα, and the index j accounting for type I or type II corrosion.
These are simulated through a homogeneous mixture of corrosion products, whose
composition is calculated according to reference 31 and given in Tab. 1. The model
shows two aspects that are observed in real cases. One is that the corrosion layer causes
an inverse relationship between the fluorescent intensity of Cu and those of Sn and Pb.
The second relevant aspect is that the concentration of Sn (and Pb) observed on the
corroded surface may be several times higher than in the bulk. It increases as the
corrosion layer gets thicker and the corrosion pattern moves towards the more
destructive type II.
As the presence of corrosion interferes with the measurement, it is essential to choose
measurement areas with the thinnest possible patina. Besides visual recognition, which
is a skill that the analyst learns by working together with other professionals such as
conservator-restorers, an important indicator is the apparent concentrations of Sn: the
lower, the better. Thus XRF can inform condition assessment.
Page 11 of 50 Journal of Analytical Atomic Spectrometry
123456789101112131415161718192021222324252627282930313233343536373839404142434445464748495051525354555657585960

Measurements on the corroded surface are made on the assumption that it retains at least
part of the compositional information from the bulk metal. To understand if and to what
extent this is true, it is useful to look at the results obtained by repeating the
measurement in different areas of the same piece. Fig. 7 plots the Sn versus Sb K-lines
intensities measured on an actual artefact made of five separate pieces, identified as
alloys A, B, C, D and E. For each of them, the intensities vary by a factor of 2-3 and are
therefore unusable for quantification. Within the same piece, however, the data points
show a clear correlation. If one assumes that the variations in the fluorescent intensities
are mainly due to the variations in the thickness of the corrosion layer, then the two
elements must have undergone similar enrichment or depletion effects in the corrosion
process. One can therefore conclude that the Sb/Sn ratio, as measured on the corroded
surface, is not too far from that of the uncorroded metal. Here, it can be used to
distinguish three different compositional groups: one is made by alloys A, B and C, one
by alloy D and one by alloy E.
One can check how general these conclusions are on a database of about 2500 XRF
measurements concerning objects from Greek and Italian geographical contexts, dating
from the 11th century B.C to the 17th century A.D. Inter-element correlations are
calculated within the group of measurements performed on each of the approximately
100 different alloys, identified in the database.
It is important to note that the measurements are biased. One reason is that all the
artefacts were analysed after restoration, that is, loose corrosion products had been
removed and only the stable ones had been left. The second reason is that selection of
the measurement points is not random: as mentioned above, areas with the thinnest
possible corrosion layer were selected, compatible with the need of representing all the
constituent alloys of the artefact.
Page 12 of 50Journal of Analytical Atomic Spectrometry
123456789101112131415161718192021222324252627282930313233343536373839404142434445464748495051525354555657585960

Fig. 8 shows the histograms of the inter-element correlation coefficients. The K-lines
are considered for Cu, As, Ag, Sn, Sb and the L-lines for Pb. The fact that the analytical
volume changes with the energy of the fluorescent radiation contributes to worsen the
correlation. Not surprisingly, the Sn-Sb histogram is the clearest one: the fluorescent
energies of these elements are similar, which involves the same attenuation and the
same analytical volume. The histogram shows that the Sn-Sb correlation is in most
cases positive and high, that is, the conclusions of the case study in Fig. 7 can be
generalised. A similar, though less sharp, behaviour is shown by Ag and, to some
extent, by As, although the latter suffers from the spectral interference – and positive
correlation – with Pb. The frequent negative Cu-Sn and Cu-Pb correlations are
consistent with Robbiola et al.31
: the concentration of Sn and Pb increase as Cu is
dissolved and removed from the surface.
The general conclusion is that at least three elements, i.e. Sn, Sb and Ag, have similar
behaviours in the corrosion process, that is, the mutual ratios in the corrosion layer
remain reasonably similar to those of the uncorroded metal and can be used to
fingerprint the alloy. As Sb and Ag are usually present in minor amounts, good
detection limits for medium atomic number elements are required.
It is clear that the approach so far discussed, often called ‘pattern-recognition’, is
suitable to highlight differences, but not to measure absolute compositions. This
application of XRF analysis was first used to confirm the hypothesis that three legs of
the Capitoline Horse had been replaced in ancient times38
. As it was the first case study,
there was no means of comparing the Sn-Sb correlation with that of other case studies.
Nevertheless, if one considered the distances between the clusters and the homogeneous
patina having a reasonably systematic effect all over the dataset, it was clear that the
differences observed in the fluorescent intensities could not be simply ascribed to the
Page 13 of 50 Journal of Analytical Atomic Spectrometry
123456789101112131415161718192021222324252627282930313233343536373839404142434445464748495051525354555657585960

effect of corrosion. Fig. 9 represents the results: the fluorescent intensities of Sn and Sb
alone are sufficient to show that some parts of the sculpture, namely three of the legs,
the brow and the tail, are not of the same alloy as the body and, possibly, not original.
The correlation between Sn and Sb is clear, as well as the fact that minor elements have
more discriminating power than the major ones, mainly due to higher variation ranges.
Here the Sb fluorescent intensity varies by a factor of 20 between the original and the
non-original parts. The outliers, here marked with a grey circle, can be easily identified.
These results are consistent with Craddock’s analyses (ref. 21, tab. 33 of the attached
microfiches), noted in Tab. 2. The difference between the analytical approaches is
outstanding: Craddock was focused on the alloys’ composition, but – possibly due to
restrictions in sampling – he had not a complete compositional picture of the object and
only recognised one among several non-original parts (i.e. the hoof as part of the front
right leg). Conversely, Ferretti et al. could not provide the composition of the alloys, but
‘sniffed’ the whole surface of the sculpture and identified all the parts differing in
composition from the original alloy. This case study also shows that XRF analytical
information can be quantitative without necessarily aiming at element
quantification.This approach has also been used to ascribe loose parts or fragments to a
given artefact39-41
, to study the recycling of parts from pre-existing objects42,43
, to
highlight casting sequences in the fabrication of complex artefacts41,44,45
, and to study
the use of different alloys to obtain chromatic effects46
.
Other applications of portable XRF concern the analysis of bi-layered structures (a
substrate and a coating), which are relatively common in ancient metal artefacts.
Though not comparable with the examination of a cross-section as to the amount of
information achieved, XRF methods are non-destructive and may be the only viable
option for valuable artefacts in some cases. The principle is based on the relationship
Page 14 of 50Journal of Analytical Atomic Spectrometry
123456789101112131415161718192021222324252627282930313233343536373839404142434445464748495051525354555657585960

existing between the coating thickness and the fluorescent intensity of a suitable
element in the substrate. Cesareo et al.47
discuss the theoretical background and the
application to Giotto's halos in the Scrovegni Chapel in Padua (Italy) and to gilded
copper objects from both the Royal Tombs of Sipán and the Museum of Sicán in Peru.
Starting from the same background, Ferretti et al.48
propose a method based on
fundamental parameters' calculations solely, with no need for thickness calibration. It is
ad hoc developed for gilded and enamelled silver artefacts and relies on the relationship
existing between the coating thickness and the ratio Kα/Kβ of the substrate silver. The
excitation efficiency of Ag is maximised by the X-ray tube working at 60kV.
The method has been applied to the four processional crosses of Borbona, Sant’Elpidio,
Rosciolo and Forcella – Abruzzi area (Italy), first half of the XIVth century A.D. –
made of gilded and embossed silver sheets and decorated with enamelled silver plates.
Fire gilding was immediately recognised due to the presence of Hg, as well as ancient
restorations due to the higher Cu content. More unexpected was the variability in the
Au/Hg ratio observed in one of the crosses. It led to the supposition that different parts
of the artefact were gilded by different executors, which is consistent with the historical
hypothesis that, within the workshop, the master made the main characters, whereas the
pupils attended to less important parts. The enamels were investigated by the same
method, except that, due to the difficulty in detecting low atomic number elements, only
colourants and opacifiers could be analysed. Particularly significant is the composition
of the blue enamels, characterised by Co with minor amounts of Zn, Pb and In. The
presence of such impurities is typical of blue glasses from the 12th to 14th century A.D.
and is related to the source of Co minerals.
The sensitivity of XRF to near-surface composition, which is usually considered a
drawback, proves useful to monitor the changes caused, for example, by thermal
Page 15 of 50 Journal of Analytical Atomic Spectrometry
123456789101112131415161718192021222324252627282930313233343536373839404142434445464748495051525354555657585960

treatments. Ferretti et al.49
investigated the mechanisms of surface silver enrichment
observed in nummi, a type of late Roman coin made of bronze with 2-6% Sn, 1-6% Pb
and 1-4% Ag. Part of the fabrication sequence was reproduced on ad hoc prepared
specimens simulating (in composition) the alloys of the original nummi. The idea was to
verify the hypothesis – already formulated by Cope50
– that heating the blank (to
facilitate striking) causes Pb to melt and carry the Ag contained in the alloy towards the
surface. The mechanism is similar to that of Pb migration described in a previous part of
this paper. The specimens contained the same amount of Sn (5%) and Ag (3%) but
different amounts of Pb (1-10%) to highlight the role of this element in the process.
They were heated at 700°C, then cooled and pickled in acetic acid.
Fig. 10 shows (from top to bottom) the SEM-BSE image, the Ag map and the Pb map of
a specimen after heating, no pickling having been done yet. It is observed that, at
reaching the surface, Pb takes the outer position, while Ag keeps closer to the bulk
metal.
Whereas the image qualitatively confirms the hypothesis, it is difficult to extract any
global quantitative information. It was therefore decided to use portable XRF to obtain
average figures significant of the whole specimen. Fig. 11 shows the scatterplots of the
areas of Pb Lα (top) and Ag L (bottom) lines versus the different Pb content of the
alloys, for untreated, heated and pickled specimens, respectively. It is observed that
surface Pb content increases after heating and decreases after pickling (which proves
that Pb is in the oxidised state and is effectively removed by acetic acid). Conversely
Ag fluorescent radiation, which is shielded by the overlaying Pb, increases in intensity
when the latter is removed. It is also observed that Ag fluorescent intensity is an
increasing function of the Pb content in the alloy, that is, the higher the Pb content, the
more efficient the transport of Ag. Once again, this example shows that there are
Page 16 of 50Journal of Analytical Atomic Spectrometry
123456789101112131415161718192021222324252627282930313233343536373839404142434445464748495051525354555657585960

quantitative ways of using XRF analytical information other than measuring the
absolute composition.
Instrumentation and quantification algorithms
This section discusses the hardware components with a focus on the key features that
need to be considered when purchasing (or assembling) a portable XRF device. Besides
weight and size, which are key features of portability, these are measuring time and
detection limits. A general discussion of quantification algorithms is presented,
although the author does not consider quantitative analysis the best use one can make of
portable XRF.
A typical energy-dispersive XRF experimental setup is shown in Fig. 12: the main
components are the excitation source, the detector, the systems for pulse processing and
spectrum acquisition and the computing system for spectrum processing and
quantification.
The source provides the exciting, or primary, radiation. Good detection limits and short
measuring times require the highest possible radiation output, compatible with the need
to avoid detector saturation. Though in principle both radioactive sources and X-ray
tubes can be used, the higher radiation output leads, in most cases, to opt for the latter.
X-ray fluorescence is a threshold phenomenon, that is, a given element can be analysed
only if the energy of the exciting radiation is higher than that of the absorption edge of
the element itself. The energy distribution of the primary radiation becomes therefore
crucial. Depending on the anode material (Cu, Mo, Pd, Rh, Ag, Ta, W, Au anodes are
commonly used) and on the voltage at which the tube is operated, it may either be
peaked on the anode fluorescent energies or have a broad (bremsstrahlung) spectrum.
The former option provides a lower background, but is unsuitable to excite the K-shells
Page 17 of 50 Journal of Analytical Atomic Spectrometry
123456789101112131415161718192021222324252627282930313233343536373839404142434445464748495051525354555657585960

of medium atomic number elements (see Fig. 3). Conversely, the latter can be excited
with good efficiency if the X-ray tube has a W anode and is operated at 50-60kV. In
such conditions the primary radiation has a broad spectrum with a relatively intense
component above 30-35keV. Sheets of metal can be placed on the beam path to absorb
the low energy component and optimise the background in the region of interest.
The detector is the device in which the energy of the fluorescent radiation is absorbed
and converted into electrical pulses. The absorbing medium is a semiconductor in all
detectors used for portable XRF. Three main types are discussed here: a) silicon and
germanium detectors requiring liquid nitrogen cooling, b) silicon diodes (Si-PIN) and c)
silicon drift (Si-Drift) detectors. Type a) and b) detectors are smaller in size and do not
require liquid nitrogen cooling. They are now used in all portable systems. In order to
compare their performance, it is useful to consider three key parameters, that is,
efficiency, energy resolution and count-rate capability.
Efficiency accounts for how much of the fluoresced radiation is actually detected and
consists of two components. One, called geometric efficiency, is related to the solid
angle subtended by the detector and increases with the area. It is almost irrelevant for
the overall performance because a large detector has to stay further away, whereas a
small detector can get closer to the sample. In the end, the subtended solid angle is more
or less the same. The second, and far more important, component is the so-called energy
(or intrinsic) efficiency. It accounts for the capability to stop the fluorescent radiation
within the active volume of the detector and depends on its material and thickness. For
example, nitrogen-cooled Si(Li) detectors have a thickness of several mm. This
provides an energy efficiency not far from 100% at the energies of practical interest in
the analysis of ancient metal artefacts (25-30keV). Conversely, the thickness of Si-PIN
Page 18 of 50Journal of Analytical Atomic Spectrometry
123456789101112131415161718192021222324252627282930313233343536373839404142434445464748495051525354555657585960

and Si-Drift detectors is about 500µm and the energy efficiency at 25-30keV is about
20%.
Noise is a major problem in radiation detectors because it affects energy resolution, that
is, the capability of distinguishing between lines of similar energy. It depends on a
complex combination of parameters. One is the active volume: the higher the volume,
the higher the noise from thermal excitation. This explains why large-sized detectors
need to be cooled by liquid nitrogen at -200°C, whereas small Si-PIN and Si-Drift
detectors obtain approximately the same resolution at -20°C by thermo-electrical
cooling.
A parameter that can be optimised to some extent to reduce noise is the time constant of
the amplifier, or shaping time. At high shaping times, the amplifier acts as a low-pass
filter and cuts the high-frequency noise, thus improving the energy resolution.
Unfortunately, it also increases the pulse duration and the pile-up of successive pulses,
thus worsening the count-rate capability. For each type of detector, one has therefore to
find a balance between the opposite requirements of reducing noise and increasing
speed.
Energy resolution is by convention measured as the full width at half maximum
(FWHM) of the Mn Kα-line (5.9keV). Although it is often used by the manufacturers as
‘the’ figure of merit for the detector performance, the user should be aware that energy
resolution cannot be considered separately from count-rate capability, as no
improvement of the former can be obtained without detriment to the latter. Moreover,
there is no need for extreme performances, as 160-180eV are more than enough for the
analysis of ancient metal artefacts and for many other applications. Tab. 3 shows typical
figures for nitrogen-cooled Si(Li), Si-PIN and Si-Drift detectors51-56
. It can be observed
that Si-Drift detectors achieve the same energy resolution as nitrogen-cooled Si(Li) and
Page 19 of 50 Journal of Analytical Atomic Spectrometry
123456789101112131415161718192021222324252627282930313233343536373839404142434445464748495051525354555657585960

Si-PIN detectors with considerably shorter shaping times. This is due to a unique
electrode structure that provides lower noise, more effective charge collection and
ensures a count-rate capability 10 to 100 times higher.
This feature makes Si-Drift detector most suited to work with high intensity sources.
Among the other advantages, high count-rates balance the low energy efficiency at 25-
30keV and provide good statistics also for the K-lines of medium atomic number
elements.
Several spectral artefacts are observed in Si-PIN and Si-Drift detectors. To reduce
interactions at the edges of the active volume, both are equipped with built-in
collimators, whose fluorescent radiation interferes with the sample spectrum57
. At the
higher count-rates achievable with a Si-Drift detector, further artefacts are due to the
sum peaks, that is, two photons are detected at the same time and seen as a single
photon with energy equal to the sum of the energies. Fig. 13 shows the spectrum of pure
Cu, taken with a 30mm2 Si-Drift detector with Mo collimator and digital pulse
processing. Besides the sample fluorescent lines (i.e. the K-lines of Cu), the spectrum is
contaminated by the K-lines of the Mo collimator and by the sum peaks of Cu.
Combining the right source with the right detector is crucial for the performance of a
portable XRF device. When portability is a priority, small-sized, low power (and low
photon output) tubes are the best option. Here the count-rate capability is irrelevant,
which allows the use of Si-PIN detectors. Conversely, if the priority is analytical
performance, a tube with high photon output is required, with consequently increased
needs for cooling and shielding. Also, the count-rate capability of the detector has to be
consistent with the high excitation rate, which leads to Si-Drift detectors as the only
possible choice.
Page 20 of 50Journal of Analytical Atomic Spectrometry
123456789101112131415161718192021222324252627282930313233343536373839404142434445464748495051525354555657585960

In order to compare the analytical performance of a different combination of
components, a survey on detection limits – assumed indicative of the performance itself
– was carried out among portable XRF users in Spain and Italy58
. A 50 eurocents coin
(Cu 89%, Al 5%, Zn 5%, Sn 1%) was used as reference material, in order to reveal the
analytical performance for elements in both Z≈30 and Z≈50 ranges. Fig. 14 compares,
on a logarithmic scale, the detection limits of the participant systems. The X-ray tube
working parameters and the type of detector are synthetically reported on the horizontal
axis. The ranges are 50-300µg/g for Zn and 20-1500µg/g for Sn, for a measuring time
of 300s. As expected, using X-ray tubes working at 50-60kV is beneficial for detection
limits, in particular for Sn. However, they increase the weight of the equipment,
reducing its portability.
When purchasing a portable XRF device and considering different options, it is
advisable to use a reference material (for example the coin mentioned above) to
compare the count-rates of Sn: the higher the better, at least as far as analytical
performance is concerned. This is a means of assessing suitable excitation of the K-lines
of medium atomic number elements, so important in the investigation of ancient metal
artefacts.
Pulse processing is performed by an amplifier (also called shaper) and consists in
shaping and optimizing for counting the electric pulses generated in the detector. Most
of what the user has to know about pulse processing has already been discussed when
dealing with energy resolution. Afterwards, a multichannel analyser classifies the pulses
according to their amplitude and builds the spectrum. Pulse processing can be either
analogue or digital. In the former case, the shaping time and the energy range of the
spectrum are fixed by the manufacturer. Conversely, digital pulse processing offers the
Page 21 of 50 Journal of Analytical Atomic Spectrometry
123456789101112131415161718192021222324252627282930313233343536373839404142434445464748495051525354555657585960

possibility to adjust both parameters and enables the user to establish his/her own
balance between energy resolution and count-rate capability.
The last important piece of hardware that has to be considered is the stand, i.e. the
device used to keep the spectrometer in the measuring position. It is not part of the
spectrometer, but it determines what parts of the artefact can be reached and analysed
(see Fig. 1). A mechanically stable and easily adjustable stand can be bulky and pose
more problems of portability than the spectrometer itself.
Spectrum processing and quantification – i.e. deriving the analyte concentration from
the fluorescent intensity – are performed by a computing system. Different methods are
used for quantification59
. Depending on the way of dealing with matrix effect, they can
be broadly divided into two types: a) empirical methods – also called influence
coefficients methods – based on experimental curves obtained with calibration
standards; and, b) theoretical methods – also called fundamental parameters (FP)
methods – based on mathematical models. Combinations of the two approaches are also
possible.
Empirical methods are potentially capable of the highest accuracies. They are grounded
on the assumption that the standards are in every way similar to the unknowns, which
on one hand limits their validity to the concentration ranges covered by the standards
and, on the other, is clearly difficult to achieve with such unpredictable materials as
ancient metal artefacts. A further drawback is that empirical methods cannot deal with
multilayered structures.
Theoretical methods perform quantification by comparing the experimental spectrum
with a theoretical one, obtained from the mathematical description of the sample-
spectrometer system. As they rely on mathematical models, these methods retain their
validity over a wide range of concentrations and are therefore more flexible. Accuracy
Page 22 of 50Journal of Analytical Atomic Spectrometry
123456789101112131415161718192021222324252627282930313233343536373839404142434445464748495051525354555657585960

depends on the uncertainty with which the parameters that describe the sample-
spectrometer system are known. An important feature of theoretical methods, at least as
far as ancient metal artefacts are concerned, is that they can deal with multilayered
materials.
In principle, these methods can be calibrated by means of a single standard, which
allows accounting for the intensity of the primary radiation and the geometry factors.
All the other parameters are supposedly known. In real cases, however, the inevitable
inaccuracies in describing the primary spectrum and the energy efficiency of the
detector make the use of several standards advisable.
Both FP and empirical methods depend on calibration standards to correct for the
physical effects caused by the surface conditions of the sample. In fact, the difficulty in
making the standards similar to the unknowns leads to a paradoxical reverse approach,
that is, making ancient metal objects similar to the standards by abrading their surface.
A variant of the FP methods, virtually able to overcome the difficulties presented by
inhomogeneous and irregularly shaped materials, are the Monte Carlo methods59,60
.
They seem therefore promising to solve some important problems related to the analysis
of ancient metal artefacts. Based on a statistical description of the interactions rather
than on deterministic equations, they are potentially able to account for all the physical
phenomena, provided the corresponding probability density functions are known.
Accuracy, however, depends on the number of histories considered. With the present
computer technology, they require long computing times and are therefore unsuitable to
process large datasets.
Conclusions
Page 23 of 50 Journal of Analytical Atomic Spectrometry
123456789101112131415161718192021222324252627282930313233343536373839404142434445464748495051525354555657585960

This paper has considered different aspects related to the use of portable XRF devices
for the investigation of ancient metal artefacts; these are summarised in Fig. 15. It has
been shown that these aspects are connected with the context that provides the objects
and the research questions (i.e. the world of conservation, archaeology and the history
of art), and with the conditions in which the investigation takes place. As a source of
questions, archaeology is inevitably connected with the conservation of artefacts, which
puts further conditions – for example respecting the physical integrity of the objects –
but also contributes with the conservators' knowledge, deriving from extended visual
and physical contact with the artefact.
The measurement strategy has to be consistent with the nature and the context of the
investigated materials. Accurate quantification often requires abrading part of the
surface to access the bulk metal and therefore conflicts with the conservation ethos of
non-destructivity, which is mandatory in most cases. Hence, the need for approaches,
alternative to the quantification-oriented ones, that do not require abrasion.
In every day life, most analytical questions require establishing differences, rather than
measuring absolute compositions. To do so, this paper has discussed approaches in
which compositional comparisons are performed by considering the relative position of
clusters of data points in the space of the count-rates. It has been shown that this is
possible for copper-based artefacts because Sn, Sb and Ag have similar corrosion
histories. Therefore, the mutual ratios that they have in the corrosion layer are
reasonably similar to those of the uncorroded metal and can be used to distinguish
alloys from one another. The method has proved effective to identify non-original parts,
to ascribe loose parts or fragments, to study recycling practices, and to follow casting
sequences.
Page 24 of 50Journal of Analytical Atomic Spectrometry
123456789101112131415161718192021222324252627282930313233343536373839404142434445464748495051525354555657585960

Portable XRF spectrometers are also used to analyse multilayered materials and derive
both the composition and the thickness of the layers. The attenuation of the Ag K-lines
from the substrate, for example, can be used to measure the gilding or the enamel
thickness in gilded and enamelled silver artefacts. Finally it has been shown that the
sensitivity of XRF to near-surface inhomogeneities proves effective to study surface
compositional changes due, for example, to thermal treatments.
The design of a portable XRF spectrometer also has to be compatible with the nature
and the context of the investigated materials. Portability is only one of the features that
influence the effectiveness and usability of an instrument. Analytical performance is
equally important. As they conflict with each other, the designer has to achieve a
balance that is largely arbitrary. The author’s preference is clearly in favour of
analytical performance: the method for compositional comparison proposed in this
paper is possible only thanks to good detection limits.
Acknowlegements
I am grateful to Giuseppe Guida (ISCR, Roma), Susanne Plattner (Dept. of Chemistry,
University “Sapienza”, Roma), Francesco Paolo Romano (CNR-IBAM, Catania) for the
technical discussions on corrosion and radiation detectors, and to Claudia Polese
(INFN-LNF, Frascati) for the calculations in XRF models.
I am also grateful to Dinah Eastop (Conservation Consultant, London), José Luiz
Pedersoli Júnior (Scientia pro Cultura, Belo Horizonte), and Katriina Similä (ICCROM,
Roma) for reading and commenting the paper and for revising the English.
References
1 E.T. Hall, Year Book of the Physical Society, 1958, 22-34.
Page 25 of 50 Journal of Analytical Atomic Spectrometry
123456789101112131415161718192021222324252627282930313233343536373839404142434445464748495051525354555657585960

2 C.M. Kraay, Archaeometry, 1958, 1, 21-23.
3 C.H.V. Sutherland and M.R. Harold, Archaeometry, 1961, 4, 56-61.
4 E.T. Hall and G. Roberts, Archaeometry, 1962, 5, 28-32.
5 M. Banks, N. Elphinstone and E.T. Hall, Archaeometry, 1963, 6, 26-30.
6 E.T. Hall, M.S. Banks and J.M. Stern, Archaeometry, 1964, 7, 84-89.
7 R.J. Gettens and E. West Fitzhugh, Stud Conserv, 1966, 11, 54-61.
8 J. Plesters, Stud Conserv, 1966, 11, 62.
9 R.J. Gettens, H. Kuhn and W.T. Chase, Stud Conserv, 1967, 12, 125-139.
10 H. Kühn, Stud Conserv, 1968, 13, 7-33.
11 B. Mühlethaler and J. Thissen, Stud Conserv, 1969, 14, 47-61.
12 R. Cesareo, F.V. Frazzoli, C. Mancini, S. Sciuti, M. Marabelli, P. Mora, P.
Rotondi and G. Urbani, Archaeometry, 1972, 14, 65-78.
13 E.T. Hall, F. Schweizer and P.A. Toller, Archaeometry, 1973, 15, 53-78.
14 A.C. Huber, J.A. Pantazis and V.T. Jordanov, Nucl Instrum Meth B, 1995, 99,
665-668.
15 P. Lechner, S. Eckbauer, R. Hartmann, S. Krisch, D. Hauff, R. Richter, H. Soltau,
L. Strüder, C. Fiorini, E. Gatti, A. Longoni and M. Sampietro, Nucl Instrum Meth
A, 1996, 377, 346-351.
16 S. Tohyama and S. Piorek, in Encyclopedia of Analytical Chemistry, John Wiley
& Sons, 2014, pp. 1-24.
17 M.A. Kumakhov, X-Ray Spectrom, 2000, 29, 343-348.
18 A. Rindby and K.H.A. Janssens, in Handbook of X-Ray Spectrometry, ed. R.E.
Van Grieken and A.A. Markowicz, Marcel Dekker, New York, 2nd edn., 2002,
643-729.
Page 26 of 50Journal of Analytical Atomic Spectrometry
123456789101112131415161718192021222324252627282930313233343536373839404142434445464748495051525354555657585960

19 R.F. Tylecote The early history of metallurgy in Europe, Longman, London,
1987, 3-11.
20 Ch. Degrigny, A.G. Karydas, S. Golfomistsou, V. Kantarelou, C. Zarkadas and D.
Vella, Proceedings of Metal 07, Amsterdam, 2007.
21 P.T. Craddock, Proceedings of Application of Science in Examination of Works
of Art, Boston, 1985, attached microfiches.
22 J. Riederer, in Proceedings of 6th Tagung uber antike Bronzen, Berlin, 1980.
23 J. Riederer, in Die Alamannenbeute aus dem Rhein bei Neupotz, ed. E. Künzl,
Mainz, 1993, pp. 407-46.
24 J. Riederer, in The Bronze vessel 2. Description of the Provincial Museum G. M.
Kam at Nijmegen, ed. A. Koster, 1997, vol. XIII, pp. 95-106.
25 J. Riederer, Rathgen-Laborbericth, 1998, 19.
26 J. Riederer, in I grandi bronzi antichi: le fonderie e le tecniche di lavorazione
dall'età arcaica al Rinascimento: atti dei seminari di studi ed esperimenti, ed. E.
Formigli, Nuova immagine, Siena, 1999, pp. 271-274.
27 J. Riederer in Proceedings of XV Congresso Internazionale sui Bronzi Antichi,
Monique Mergoil, Montagnac, 2002, vol. 21, 284-91.
28 C. Iaia, Produzioni toreutiche della prima età del ferro in Italia Centro-
Settentrionale. Stili decorativi, circolazione, significato, Istituti Editoriali e
Poligrafici Internazionali, Pisa-Roma, 2005, vol. 40.
29 M. Ferretti, G. Guida, A. Manda and F. Milazzo, unpublished work.
30 R. van Langh, A. Pappot, S. Creange, L. Megens and I. Joosten, Proceedings of
Metal 2010, Charleston, 2010.
31 L. Robbiola, J.-M. Blengino and C. Fiaud, Corros Sci, 1998, 40, 2083-2111.
32 M. Ferretti, G. Guida and F. Volpi, unpublished work.
Page 27 of 50 Journal of Analytical Atomic Spectrometry
123456789101112131415161718192021222324252627282930313233343536373839404142434445464748495051525354555657585960

33 M.F. Guerra, in Radiation in Art and Archaeometry, ed. D.C. Creagh and D.A.
Bradley, Elsevier, Amsterdam, 2000, pp. 378-416.
34 A.G. Karydas, Ann Chim-Rome, 2007, 97, 419-432.
35 A. Heginbotham, A. Bezur, M. Bouchard, J.M. Davis, K. Eremin, J.H. Frantz, L.
Glinsman, L-A. Hayek, D. Hook, V. Kantarelou, A.G. Karydas, L. Lee, J. Mass,
C. Matsen, B. McCarthy, M. McGath, A. Shugar, J. Sirois, D. Smith and R.J.
Speakman, Proceedings of Metal 2010, Charleston, 2010.
36 G.F. Carter, Archaeometry, 1964, 7, 106-113.
37 V.A. Solé, E. Papillon, M. Cotte, Ph. Walter and J. Susini, Spectrochim Acta B,
2007, 62, 63-68.
38 M. Ferretti, L. Miazzo and P. Moioli, Stud Conserv, 1997, 42, 241-246.
39 M. Ferretti, E. Formigli, L. Lepore, F. Lo Schiavo, E. Macnamara, M. Miccio,
A.M. Palmieri, R. Pecchioli, A. Romualdi and B.B. Shefton, Proceedings of 4th
Symposium of the Hellenic Society for Archaeometry, Athens, 2003.
40 M. Ferretti, G. Cristoforetti, S. Legnaioli, V. Palleschi, A. Salvetti, E. Tognoni, E.
Console and P. Palaia, Spectrochim Acta B, 2007, 62, 1512-1518.
41 M. Ferretti, A. Gorghinian, S. Legnaioli, G. Lorenzetti and V. Palleschi, Bollettino
di Archeologia On Line II, 2013, 2011/4, 65-72.
42 P. Binaghi, O. Colacicchi Alessandri, A. De Santis and M. Ferretti, Proceedings
of Art’05, 8th
International Conference on Non-Destructive Investigations and
Microanalysis for the Diagnostics and Conservation of the Cultural and
Environmental Heritage, Lecce, 2005.
43 M. Ferretti, G. Guida, N. Lucentini and F. Milazzo, Proceedings of 2nd
International Conference on Archaeometallurgy in Europe, Aquileia, 2007.
44 M. Ferretti and S. Siano, Appl Phys A-Mater, 2008, 90, 97-100.
Page 28 of 50Journal of Analytical Atomic Spectrometry
123456789101112131415161718192021222324252627282930313233343536373839404142434445464748495051525354555657585960

45 S. Siano, J. Agresti, M. Ferretti, S. Mugnaini and M. Miccio, in Donatello – Il
David restaurato, ed. B.P. Strozzi, Giunti, Firenze, 2008, pp. 168-183.
46 O. Colacicchi Alessandri, M. Ferretti and E. Formigli, in Colore e luce nella
statuaria antica in bronzo, ed. E. Formigli, L’Erma di Bretschneider, Roma, 2013,
pp. 25-31.
47 R. Cesareo, A. Brunetti and S. Ridolfi, X-Ray Spectrom, 2008, 37, 309-316.
48 M. Ferretti, C. Polese and C. Roldán García, Spectrochim Acta B, 2013, 83-84,
21-27.
49 M. Ferretti, G. Guida, N. Laschera and A. Manda, in Proceedings of the
Conference Il tesoro di Misurata (Libia). Produzione e circolazione monetaria
nell’età di Costantino il Grande, in press.
50 L.H. Cope, in Methods of Chemical and Metallurgical Investigation of Ancient
Coinage, ed. E. T. Hall and D. M. Metcalf, RNS Special Publication 8. London,
1972, pp. 261-278.
51 D. Creagh, in Physical techniques in the study of art, archaeology and cultural
heritage, ed. D. Creagh and D. Bradley, Elsevier, Amsterdam, 2007, vol.2, p. 42.
52 K. Janssens, in Handbook of Spectroscopy, ed. G. Gauglitz and T. Vo-Dinh,
Whiley-VHC, Weinheim, 2003, vol. 1, p. 389.
53 K. Janssens, in Non-destructive Micro Analysis of Cultural Heritage Materials,
ed. K. Janssens and R. Van Grieken, Elsevier, Amsterdam, 2004, p. 163.
54 G. Gilmore, Practical Gamma-ray Spectroscopy, John Wiley & Sons, 2nd edn.,
2008, prgr. 4.4.4.
55 XR-100CR Si-PIN specification, http://www.amptek.com/pdf/xr100cr.pdf,
(accessed March 2014).
Page 29 of 50 Journal of Analytical Atomic Spectrometry
123456789101112131415161718192021222324252627282930313233343536373839404142434445464748495051525354555657585960

56 A. Longoni and C. Fiorini, in Handbook of Practical X-Ray Fluorescence
Analysis, ed. B. Beckhoff, B. Kanngießer, N. Langhoff, R. Wedell and H. Wolff,
Springer-Verlag, Berlin, 2006, p. 221.
57 M. Ferretti, Nucl Instrum Meth B, 2004, 226, 453-460.
58 R. Cesareo, M. Ferretti, G.E. Gigante, G. Guida, P. Moioli, S. Ridolfi and C.
Roldán Garcia, X-Ray Spectrom, 2007, 36, 167-172.
59 M. Mantler, in Handbook of Practical X-Ray Fluorescence Analysis, ed. B.
Beckhoff, B. Kanngießer, N. Langhoff, R. Wedell and H. Wolff, Springer-Verlag,
Berlin, 2006, 309-410.
60 T. Schoonjans, V.A. Solé, L. Vincze, M. Sanchez del Rio, K. Appel, C. Ferrero,
Spectrochim Acta B, 2013, 82, 36-41.
Page 30 of 50Journal of Analytical Atomic Spectrometry
123456789101112131415161718192021222324252627282930313233343536373839404142434445464748495051525354555657585960

CAPTIONS TO FIGURES
Fig. 1
XRF investigation of a large bronze sculpture.
Fig. 2
Fraction of the overall fluorescent signal provided by a layer of depth d below the
surface. The sample is a bronze alloy (85% Cu, 10% Sn, 5% Pb). The fluorescent lines
considered are Cu-K, Sn-K and Pb-L. Almost the entire analytical information of Cu
and Pb and almost half of the Sn information comes from the first 20µm.
Fig. 3
XRF spectrum of a bronze alloy containing 2.3% Sn, 3.4% Pb, 0.03% Ag and 0.15%
Sb. Both the L- and the K-shells of Ag, Sn and Sb are excited, but the K-lines are more
free from mutual interference than the L-lines.
Fig. 4
Pb mass fractions, on a logarithmic scale, of cast (black markers) and mechanically
worked parts (white markers) in about 280 bronze artefacts from different cultural
contexts (pre-Roman, Etruscan, Greek and Roman) and different ages (from 7th century
B.C. to 1st century A.D.). Each object is identified by a progressive number on the
horizontal axis. The objects are ordered by increasing Pb content to improve readability.
Most white markers are below the corresponding black marker, meaning that, in the
same object and independently on the absolute values, hammered parts always contain
less Pb than the cast ones.
Page 31 of 50 Journal of Analytical Atomic Spectrometry
123456789101112131415161718192021222324252627282930313233343536373839404142434445464748495051525354555657585960

Fig. 5
SEM-BSE image of a cross-section. The grey level is related to the local mean atomic
number. Pb has the highest atomic number and is represented with the lightest grey. The
image shows the effect of annealing on a leaded bronze. At 600-700°C, Pb is liquid and
tends to migrate towards the surface, where it is absorbed in the spongy layer of cupric
oxide (CuO, tenorite).
Fig. 6
Model of the count-rates variations expected in a bronze substrate (88% Cu, 10% Sn,
2% Pb) covered by corrosion layers of irregular thickness, whose composition is given
in Tab.1. The relative intensity is calculated as RI(t)=Ii,j(t)/Ii,0, where t is the coating
thickness, Ii,j(t) is the fluorescent intensity from the substrate and the corrosion layer,
and Ii,0 is the fluorescent intensity from the substrate alone, the index i accounting for
Cu-Kα, Sn-Kα or Pb-Lα, and the index j accounting for type I or type II corrosion. The
model shows: a) an inverse relationship between the fluorescent intensity of Cu and
those of Sn and Pb and b) surface concentrations of Sn (and Pb) several times higher
than in the bulk.
Fig. 7
Scatterplot of the Sn versus Sb K-lines intensities measured on an artefact made of five
separate pieces. The different alloys are identified as A, B, C, D and E. Three different
compositional groups are distinguished: 1) alloys A, B and C, 2) alloy D and 3) alloy E.
Page 32 of 50Journal of Analytical Atomic Spectrometry
123456789101112131415161718192021222324252627282930313233343536373839404142434445464748495051525354555657585960

Fig. 8
Histograms of the correlation coefficients between the count-rates of the main
fluorescent lines. From top to bottom and from left to right the correlations are: Cu-Sn,
Cu-Pb, As-Sn, Ag-Sn, Ag-Sb, Sn-Sb and Sn-Pb. The results refer to about 2500 XRF
measurements carried out on the corroded surface of about 100 different alloys. The
correlations among Ag, Sn and Sb are positive and high in most cases, whereas the
correlations Cu-Sn and Cu-Pb are frequently negative.
Fig. 9
XRF analysis of the Capitoline Horse: scatterplot of the count-rates Sn vs. Sb. Only the
left hind leg is in the cluster of the original alloy, whereas the other three legs, the brow
and the tail form separated clusters. The outliers are marked with a grey circle.
Fig. 10
From top to bottom: SEM-BSE image, Ag map and Pb map of a specimen simulating a
nummus alloy (Cu 88%, Sn 5%, Ag 3%, Pb 4%) after heating, before pickling. During
heating a liquid phase of Pb and Ag migrates towards the surface, where Pb is oxidezed
and takes the outer position, while Ag keeps closer to the bulk metal.
Fig. 11
Scatterplots of the areas of Pb Lα (top) and Ag L (bottom) lines versus Pb mass-fraction
in the alloy the for specimens simulating nummi of different composition at each stage
of the treatment. Surface Pb increases after heating and decreases after pickling. Ag is
hidden by the overlaying Pb until the latter is removed. After the treatment, the surface
amount of Ag is an increasing function of the Pb content in the alloy.
Page 33 of 50 Journal of Analytical Atomic Spectrometry
123456789101112131415161718192021222324252627282930313233343536373839404142434445464748495051525354555657585960

Fig. 12
Main components of an energy-dispersive XRF system.
Fig. 13
XRF spectrum of Cu at high count-rates: besides the Mo K-lines from the collimator,
sum peaks can be observed at the energies: E(CuKα)+E(CuKα)=16.1keV,
E(CuKα)+E(CuKβ)=16.95keV and E(CuKβ)+E(CuKβ)=17.8keV.
Fig. 14
Comparison on a logarithmic scale of the detection limits for Zn (red) and Sn (blue) for
portable XRF systems having different X-ray tubes and detectors. The characteristics of
each system are reported on the horizontal axis with the format:
TubeHighVoltage_TubeCurrent_DetectorType. The acronyms SiPIN, SDD and HPGe
refer to a SiPIN, a Si-Drift and a high-purity planar germanium detector, respectively.
Fig. 15
Absolute measurements versus compositional comparison in portable XRF investigation
of ancient metal artefacts: the analytical approaches, the key aspects, the required
features and the technical solutions that each option involves.
Page 34 of 50Journal of Analytical Atomic Spectrometry
123456789101112131415161718192021222324252627282930313233343536373839404142434445464748495051525354555657585960

TABLES
Corrosion
type cuprite
(Cu2O) [%] malachite
(Cu2(CO3)(OH)2) [%] cassiterite (SnO2) [%]
cerussite (PbCO3) [%]
I 11 18 59 12
II - - 83 17
Tab. 1 Composition of the corrosion layers considered in the model, to simulate type I
and type II corrosion patterns.
Cu % Sn % Pb % Zn % Fe % Ni % Ag % Sb % As % Bi % Co %
Horse (front right hoof) Capitol 1064 82.5 5.7 13.2 0.005 0.02 0.018 0.02 0.15 0.02 0.006 bdl
Horse (brazing) Capitol 1064 73.5 7.5 17.8 0.005 0.01 0.02 0.018 0.05 0.025 0.003 0.07
Horse (right shoulder) Capitol 1064 87 9.3 3.1 bdl 0.09 0.04 0.02 0.02 0.06 0.004 0.015
Horse (head) Capitol 1064 86 8.8 3.5 bdl 0.37 0.05 0.02 0.02 0.06 0.015 0.02
Horse (left side) Capitol 1064 88 8.7 2.7 bdl 0.95 0.05 0.025 0.02 0.17 0.002 bdl
Horse (brazing) Capitol 1064 82 9.2 7.7 0.23 0.6 0.03 0.06 0.07 0.4 0.004 0.01
Horse (brazing) Capitol 1064 85 9.8 4.5 bdl 0.03 0.04 0.035 0.02 0.1 0.004 bdl
Tab. 2 Composition of the alloys of the Capitoline Horse as given in ref. 21, tab. 33 of
the attached microfiches (bdl stands for ‘below detection limits’)
Detector type Thickness
[mm] FWHM at
5.9keV [eV] Shaping
time [µs]
Count-rate capability [s
-1]
Nitrogen-cooled Si(Li) 5 165 4-10 104
Si-PIN 0.5 155-185 12-20 104
Si-Drift 0.45 150 1-2 105-10
6
Tab. 3 Typical figures of merit for nitrogen-cooled Si(Li), Si-PIN and Si-Drift detectors.
Page 35 of 50 Journal of Analytical Atomic Spectrometry
123456789101112131415161718192021222324252627282930313233343536373839404142434445464748495051525354555657585960

XRF investigation of a large bronze sculpture. 62x46mm (300 x 300 DPI)
Page 36 of 50Journal of Analytical Atomic Spectrometry
123456789101112131415161718192021222324252627282930313233343536373839404142434445464748495051525354555657585960

Fraction of the overall fluorescent signal provided by a layer of depth d below the surface. The sample is a bronze alloy (85% Cu, 10% Sn, 5% Pb). The fluorescent lines considered are Cu-K, Sn-K and Pb-L. Almost the entire analytical information of Cu and Pb and almost half of the Sn information comes from the first
20µm. 54x35mm (300 x 300 DPI)
Page 37 of 50 Journal of Analytical Atomic Spectrometry
123456789101112131415161718192021222324252627282930313233343536373839404142434445464748495051525354555657585960

XRF spectrum of a bronze alloy containing 2.3% Sn, 3.4% Pb, 0.03% Ag and 0.15% Sb. Both the L- and the K-shells of Ag, Sn and Sb are excited, but the K-lines are more free from mutual interference than the L-
lines. 52x33mm (300 x 300 DPI)
Page 38 of 50Journal of Analytical Atomic Spectrometry
123456789101112131415161718192021222324252627282930313233343536373839404142434445464748495051525354555657585960
Pb mass fractions, on a logarithmic scale, of cast (black markers) and mechanically worked parts (white markers) in about 280 bronze artefacts from different cultural contexts (pre-Roman, Etruscan, Greek and
Roman) and different ages (from 7th century B.C. to 1st century A.D.). Each object is identified by a
progressive number on the horizontal axis. The objects are ordered by increasing Pb content to improve readability. Most white markers are below the corresponding black marker, meaning that, in the same object
and independently on the absolute values, hammered parts always contain less Pb than the cast ones. 55x36mm (300 x 300 DPI)
Page 39 of 50 Journal of Analytical Atomic Spectrometry
123456789101112131415161718192021222324252627282930313233343536373839404142434445464748495051525354555657585960

SEM-BSE image of a cross-section. The grey level is related to the local mean atomic number. Pb has the highest atomic number and is represented with the lightest grey. The image shows the effect of annealing
on a leaded bronze. At 600-700°C, Pb is liquid and tends to migrate towards the surface, where it is
absorbed in the spongy layer of cupric oxide (CuO, tenorite). 90x67mm (300 x 300 DPI)
Page 40 of 50Journal of Analytical Atomic Spectrometry
123456789101112131415161718192021222324252627282930313233343536373839404142434445464748495051525354555657585960

Model of the count-rates variations expected in a bronze substrate (88% Cu, 10% Sn, 2% Pb) covered by corrosion layers of irregular thickness, whose composition is given in Tab.1. The relative intensity is
calculated as RI(t)=Ii,j(t)/Ii,0, where t is the coating thickness, Ii,j(t) is the fluorescent intensity from the substrate and the corrosion layer, and Ii,0 is the fluorescent intensity from the substrate alone, the index i
accounting for Cu-Kα, Sn-Kα or Pb-Lα, and the index j accounting for type I or type II corrosion. The model shows: a) an inverse relationship between the fluorescent intensity of Cu and those of Sn and Pb and b)
surface concentrations of Sn (and Pb) several times higher than in the bulk. 54x35mm (300 x 300 DPI)
Page 41 of 50 Journal of Analytical Atomic Spectrometry
123456789101112131415161718192021222324252627282930313233343536373839404142434445464748495051525354555657585960

Scatterplot of the Sn versus Sb K-lines intensities measured on an artefact made of five separate pieces. The different alloys are identified as A, B, C, D and E. Three different compositional groups are
distinguished: 1) alloys A, B and C, 2) alloy D and 3) alloy E.
56x38mm (300 x 300 DPI)
Page 42 of 50Journal of Analytical Atomic Spectrometry
123456789101112131415161718192021222324252627282930313233343536373839404142434445464748495051525354555657585960

Histograms of the correlation coefficients between the count-rates of the main fluorescent lines. From top to bottom and from left to right the correlations are: Cu-Sn, Cu-Pb, As-Sn, Ag-Sn, Ag-Sb, Sn-Sb and Sn-Pb. The results refer to about 2500 XRF measurements carried out on the corroded surface of about 100
different alloys. The correlations among Ag, Sn and Sb are positive and high in most cases, whereas the correlations Cu-Sn and Cu-Pb are frequently negative.
121x85mm (300 x 300 DPI)
Page 43 of 50 Journal of Analytical Atomic Spectrometry
123456789101112131415161718192021222324252627282930313233343536373839404142434445464748495051525354555657585960

XRF analysis of the Capitoline Horse: scatterplot of the count-rates Sn vs. Sb. Only the left hind leg is in the cluster of the original alloy, whereas the other three legs, the brow and the tail form separated clusters. The
outliers are marked with a grey circle. 55x37mm (300 x 300 DPI)
Page 44 of 50Journal of Analytical Atomic Spectrometry
123456789101112131415161718192021222324252627282930313233343536373839404142434445464748495051525354555657585960

From top to bottom: SEM-BSE image, Ag map and Pb map of a specimen simulating a nummus alloy (Cu 88%, Sn 5%, Ag 3%, Pb 4%) after heating, before pickling. During heating a liquid phase of Pb and Ag migrates towards the surface, where Pb is oxidezed and takes the outer position, while Ag keeps closer to
the bulk metal. 84x205mm (300 x 300 DPI)
Page 45 of 50 Journal of Analytical Atomic Spectrometry
123456789101112131415161718192021222324252627282930313233343536373839404142434445464748495051525354555657585960

Scatterplots of the areas of Pb Lα (top) and Ag L (bottom) lines versus Pb mass-fraction in the alloy the for specimens simulating nummi of different composition at each stage of the treatment. Surface Pb increases
after heating and decreases after pickling. Ag is hidden by the overlaying Pb until the latter is removed.
After the treatment, the surface amount of Ag is an increasing function of the Pb content in the alloy. 137x227mm (300 x 300 DPI)
Page 46 of 50Journal of Analytical Atomic Spectrometry
123456789101112131415161718192021222324252627282930313233343536373839404142434445464748495051525354555657585960

Main components of an energy-dispersive XRF system. 73x64mm (300 x 300 DPI)
Page 47 of 50 Journal of Analytical Atomic Spectrometry
123456789101112131415161718192021222324252627282930313233343536373839404142434445464748495051525354555657585960

XRF spectrum of Cu at high count-rates: besides the Mo K-lines from the collimator, sum peaks can be observed at the energies: E(CuKα)+E(CuKα)=16.1keV, E(CuKα)+E(CuKβ)=16.95keV and
E(CuKβ)+E(CuKβ)=17.8keV.
56x38mm (300 x 300 DPI)
Page 48 of 50Journal of Analytical Atomic Spectrometry
123456789101112131415161718192021222324252627282930313233343536373839404142434445464748495051525354555657585960

Comparison on a logarithmic scale of the detection limits for Zn (red) and Sn (blue) for portable XRF systems having different X-ray tubes and detectors. The characteristics of each system are reported on the horizontal axis with the format: TubeHighVoltage_TubeCurrent_DetectorType. The acronyms SiPIN, SDD
and HPGe refer to a SiPIN, a Si-Drift and a high-purity planar germanium detector, respectively. 60x43mm (300 x 300 DPI)
Page 49 of 50 Journal of Analytical Atomic Spectrometry
123456789101112131415161718192021222324252627282930313233343536373839404142434445464748495051525354555657585960

Absolute measurements versus compositional comparison in portable XRF investigation of ancient metal artefacts: the analytical approaches, the key aspects, the required features and the technical solutions that
each option involves. 107x67mm (300 x 300 DPI)
Page 50 of 50Journal of Analytical Atomic Spectrometry
123456789101112131415161718192021222324252627282930313233343536373839404142434445464748495051525354555657585960