joseph c. cappelleri, ph.d., m.p.h. pfizer inc 50 pequot ... designs_3rd...joseph c. cappelleri,...
TRANSCRIPT

CUTOFF DESIGNS
Joseph C. Cappelleri, Ph.D., M.P.H.
William M.K. Trochim, Ph.D. Authors’ Affiliations and Addresses: Dr. Joseph C. Cappelleri Pfizer Inc 50 Pequot Ave (MS 6025-A4225) New London, Connecticut 06320 Prof. William M.K. Trochim Department of Policy Analysis and Management 249 MVR Hall Cornell University Ithaca, NY 14853 This entry is drawn largely from JC Cappelleri. Embedding the regression-discontinuity design within the randomized design. Proceedings of the Biopharmaceutical Session of the American Statistical Association, 1997. ©Joseph C. Cappelleri.
Address for correspondence and reprints:
Joseph C. Cappelleri, Pfizer Inc, 50 Pequot Ave (MS 6025-A4225), New London, CT
06320; telephone: (860) 732-8668; fax: (860) 715-7160;
e-mail: [email protected]

2
1. INTRODUCTION
The randomized design is the preferred method for assessing the efficacy of treatments.
Randomization of all subjects should be employed whenever possible. Randomization, in
principle, serves at least three important purposes: (1) it avoids known and unknown
biases on average; (2) it helps convince others that the trial was conducted properly; and
3) it is the basis for the statistical theory that underlies hypothesis tests and confidence
intervals (1).
Randomization of all subjects has been criticized, however, because it may raise ethical
concerns or practical limitations in certain situations. Ethical tensions may arise, for
example, when strong a priori (though inconclusive) information favors the experimental
treatment, when the disease is potentially life-threatening, and when randomization does
not explicitly incorporate subjects’ baseline clinical need or their willingness to incur risk
(2,3). Examples that have stirred considerable debate about the ethics of the randomized
design include the controversies about the release of drugs for AIDS (4), the availability
of drugs for cancer treatment (5), and the use of extracorporeal membrane oxygenation
(ECMO) for neonatal intensive care (6,7).
A second potential drawback of the randomized design occurs in instances when
randomization is not feasible or practical. Such situations may arise in health services or
outcomes research where, for example, a health education program is to be targeted only
to people who need it (8). An evaluation and comparison between managed care and
3
usual care could be made feasible if high users of health-care utilization receive managed
care only and low users of health-care utilization receive usual care only. A study
concerned with the effect of a letter as an intervention to control health-care costs could
be made practical if the letter is sent only to physicians with high billed charges per
subscriber, while those with lower billed charges per subscriber don’t receive a letter (9).
In these contexts, economic constraints and logistical barriers may dictate that an
experimental intervention is neither practical nor efficient for those who don’t need it or
who are not the targeted candidates. Moreover, treatment allocation that reflects actual
practice allows for testing the effectiveness of the intervention -- its benefit in a real-life
setting, as opposed to its benefit in a controlled setting.
This entry discusses alternative design strategies that are intended to address ethical or
practical concerns when it is deemed unethical or infeasible to randomize all subjects to
study interventions. These design strategies may be called cutoff designs because they
involve, at least in part, the assignment of subjects to treatments based on a cutoff score
on a quantitative baseline variable that measures clinical need, severity of illness, or some
other relevant measure. What follows is an overview of cutoff designs.
II. DESCRIPTION OF THE REGRESSION-DISCONTINUITY DESIGN
The most basic of cutoff designs is the regression-discontinuity design (8,10-13) in which
a baseline indicator, for example severity of illness, can be used to assign subjects to an
intervention. All subjects below a cutoff point on the baseline indicator receive one
4
treatment, while all subjects above it receive another treatment. The history of the
regression-discontinuity (RD) design is found in the social sciences, specifically in
program evaluation. It has been employed to evaluate the effects of compensatory
education, being on the Dean’s list, a criminal justice program, a health education
program on serum cholesterol, accelerated math training, and the NIH Career
Development Award (14). In these scenarios randomization of subjects was not a viable
alternative. A comprehensive history of the regression-discontinuity design in three
academic disciples – psychology, statistics, economics – has been published (15).
The traditional RD design is a single-cutoff quasi-experimental design that involves no
random assignment. The RD design received its name from the “jump,” or discontinuity,
at the cutoff in the regression line of baseline and outcome (follow-up) scores that occurs
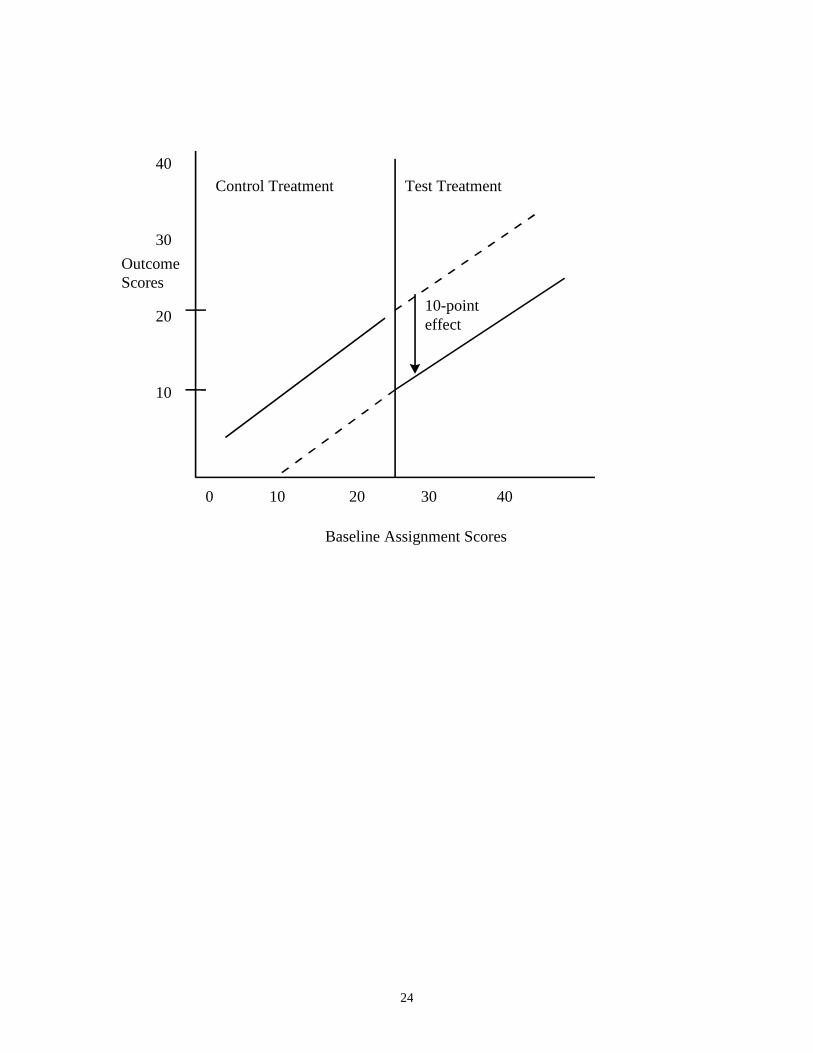
when there a treatment effect. Figure 1 depicts a RD design with a hypothetical 10-point
treatment effect (reduction). All subjects with scores above 20 on the baseline assignment
indicator are most in the need of the intervention and hence are automatically assigned to
the test (experimental) treatment, while those with scores of 20 or less (those less in need)
are automatically assigned to control treatment.
As Figure 1 illustrates, the outcome scores of the test treatment group (those scoring
above the cutoff) are lowered by an average of 10 points from where they would be
expected in the absence of a treatment effect. The solid lines show the predicted
regression lines for a 10-point effect, and the dashed lines show the expected regression
lines for patients in a treatment group if they were given the other intervention instead.

5
___________________
Figure 1 about here
___________________
The baseline assignment covariate should be measured on at least an ordinal scale; it is
more desirable, though, to have a continuous (ratio-level or interval-level) baseline
assignment variable. Baseline and outcome may be the same or different, the cutoff can
be placed anywhere along the baseline measure (as long as there are sufficient numbers in
the control group), the direction of improvement can be positive or negative for either
variable, the treatment groups could have more than two levels, and the response variable
can be discrete or continuous.
III.VALIDITY OF THE REGRESSION-DISCONTINUITY DESIGN
Under the assumption that the outcome-baseline functional form is correctly specified,
the RD design results in an unbiased estimate of treatment effect. An unbiased estimate of
treatment effect is obtained because the assignment process is known perfectly and
controlled for in the analysis (10). Formal statistical derivations proofing this
unbiasedness are found elsewhere (14-18). Like the randomized experimental (RE)
design, the RD design gives a known probability of assignment to treatments. It is
imperative, though, that the cutoff assignment rule be followed strictly. If subjects are
misclassified, then the treatment effect is likely to be biased.

6
It can also be demonstrated that the estimate of treatment effect in the RD design, like the
RE design, remains unbiased when random measurement error in the observed, fallibly
measured baseline covariate is considered (14-18). The reason for this is, once the fallibly
measured observed baseline scores are known, treatment assignment is completely
determined and hence independent of anything else, including the perfectly measured true
baseline scores, in the RD design. Similarly, in the RE design, treatment assignment is
completely determined by a randomization scheme and hence independent of anything
else.
______________________
Figure 2 about here
______________________
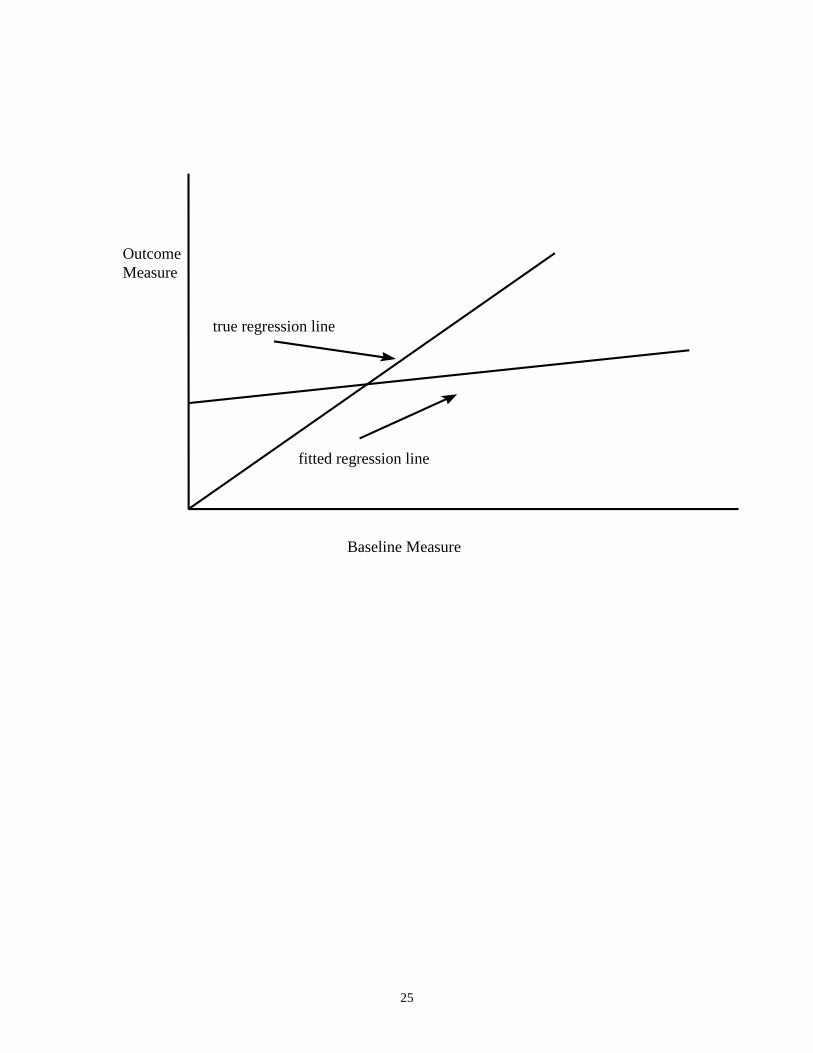
Regression to the mean, which naturally emanates from random measurement error in the
observed baseline covariate, does not therefore affect the estimate of treatment effect in
both the RD design and the RE design. Figure 2 graphically shows the impact of
regression to the mean, or, equivalently, random measurement error in the observed
covariate, in the case of no treatment effect when the same variable is measured at
baseline and follow-up. In the absence of a treatment effect, and with no other effects that
may change a subject’s score at follow-up, the true regression line should be a 45-degree
line beginning at the origin. Regression to the mean causes the fitted regression line to be
attenuated by an amount proportional to the reliability coefficient of the baseline
7
covariate; therefore, the sample regression coefficient of the baseline covariate on the
outcome measure is biased, but the sample regression coefficient of the treatment effect is
not (14,16).
The RE design is robust in giving unbiased estimates of treatment effect when the true
functional form between the baseline covariate and the outcome measure is not correctly
specified. On the other hand, the RD design is not robust here. The most critical step in
obtaining an unbiased estimate of effect in the RD design lies in modeling this true
functional form correctly. The true functional form, however, is not known in the RD
design because of missing data. As shown in Figure 1, which assumes a linear functional
form, the extrapolated regression line of the control group (dashed line, right) if this
group’s subjects were given test treatment instead is assumed to continue in the same
linear way as its fitted line (solid line, left). The extrapolated regression line of the test-
treated group (dashed line, left) if this group’s subjects were given control treatment is
assumed to continue in the same way as its fitted line (solid line, right). There is no way
to know prospectively whether the form or the slope of the lines in the region of missing
data will be the same as that in the region of observed data.
IV. SPECIFYING THE FUNCTIONAL FORM
One suggestion for helping to arrive at the correct functional form is to use a polynomial
backward elimination regression approach (19). Another suggestion uses empirical
Bayesian methods to overcome situations when the outcome and baseline relationship

8
may not be linear, as when true baseline scores are not normally distributed (20, 21). A
third approach, which can be used with either of the other two approaches, is to fit a
regression line over a wider range of the baseline-outcome distribution, resulting in less
extrapolation and hence a more valid fit. This last approach can be achieved by
combining the RD design with the RE design, resulting in a cutoff design with
randomization.
V. COMBINING REGRESSION-DISCONTINUITY AND RANDOMIZED
EXPERIMENTAL DESIGNS
A regression-discontinuity design can be described as a cutoff design without
randomization. This design can also be coupled with a randomized design. For instance,
patients who score within the middle range of scores on a baseline severity-of-illness
indicator (e.g., those moderately ill) are randomized to either one of two treatments, while
patients who score below a given cutoff value on this indicator (e.g., those most ill) are
automatically assigned to the novel treatment and patients who score above another,
higher cutoff value (e.g., those least ill) are assigned to the control treatment. Another
type of cutoff design, for instance, would have subjects below the single cutoff point
(e.g., the most ill) randomized to either treatment, while those above it (e.g., the least ill)
are automatically assigned to control treatment. These are only two possible design
variations that can combine cutoff assignment and random assignment. Other variations
are mentioned elsewhere (22,23).
9
Combining the RE design and the RD design may give advantages over either design
alone (22-24). Relative to the RE design, this hybrid design may be better suited to
address ethical or practical concerns, may result in a larger eligible and diverse sample,
and may better address the effectiveness (as opposed to the efficacy) of interventions in
particular circumstances. Compared with the RD design, RD-RE design has enhanced
validity and improved statistical power.
VI. ILLUSTRATION: COCAINE PROJECT
To illustrate the combined design, we describe a cocaine project, conducted by Havassy
and colleagues at the University of California at San Francisco, that applied the RD-RE
design instead of the completely randomized design, which was considered neither ethical
nor feasible. The study included about 500 patients with cocaine addiction. The objective
of the study was whether inpatient (intensive) rehabilitation showed better improvement,
and by how much, over outpatient rehabilitation. The baseline assignment covariate was
based on a weighted composite of 4 scales: 1) employment and legal status, 2) family
relationship and recovery, 3) alcohol and drug history, and 4) psychological status. Higher

10
scores indicated more clinical need for the more intensive (inpatient) rehabilitation. The
primary outcome variable was the same variable measured at follow-up.
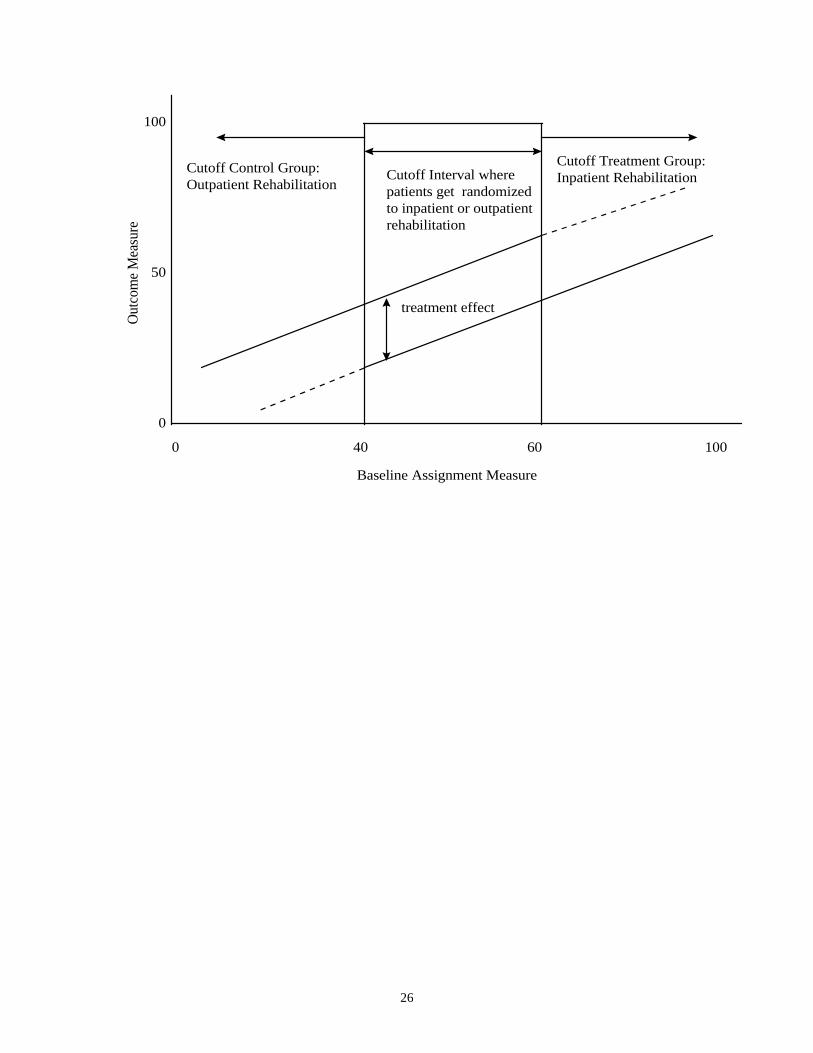
Figure 3 portrays how patients may be allocated into inpatient or outpatient rehabilitation
in this setting. All patients who score above 60 -- those most severely ill or most in
need -- are automatically assigned to inpatient rehabilitation; all patients who score below
40 -- those least ill or least in need -- are automatically assigned to outpatient
rehabilitation; and patients who score in between 40 and 60, inclusive -- those moderately
ill or in need -- are randomized to either inpatient rehabilitation or outpatient
rehabilitation. Note that it is this cutoff interval of randomization that distinguishes the
RD-RE design from the RD design, which instead has a cutoff point(s) with no
randomization.
__________________
Figure 3 about here
__________________
Like Figure 1, Figure 3 has solid lines representing the predicted regression lines and
dash lines representing the extrapolated regression lines, showing a constant
improvement from inpatient rehabilitation over outpatient rehabilitation. An analysis of
covariance model, with the baseline assignment measure and the treatment group variable
as predictors, would be a correct model to fit the fitted lines in Figures 1 and 3. An
analysis of variance model, which excludes the baseline assignment variable, should not
11
be fit as it would result in a biased estimate of treatment effect. While linear relations are
highlighted in these two figures, cutoff designs are not restricted to a linear baseline-
outcome relationship; higher-order terms (e.g., quadratic or cubic terms), transformations
on baseline or outcome variables, and interaction terms may also be fitted.
In a simulation study, several RD-RE design variations, of which the basic design in
Figure 3 is the simplest one, were evaluated and compared among themselves, along with
the traditional RD design and the traditional RE design (22,23). An unbiased main
treatment effect was found for all these designs.
_________________
Figure 4 about here
_________________
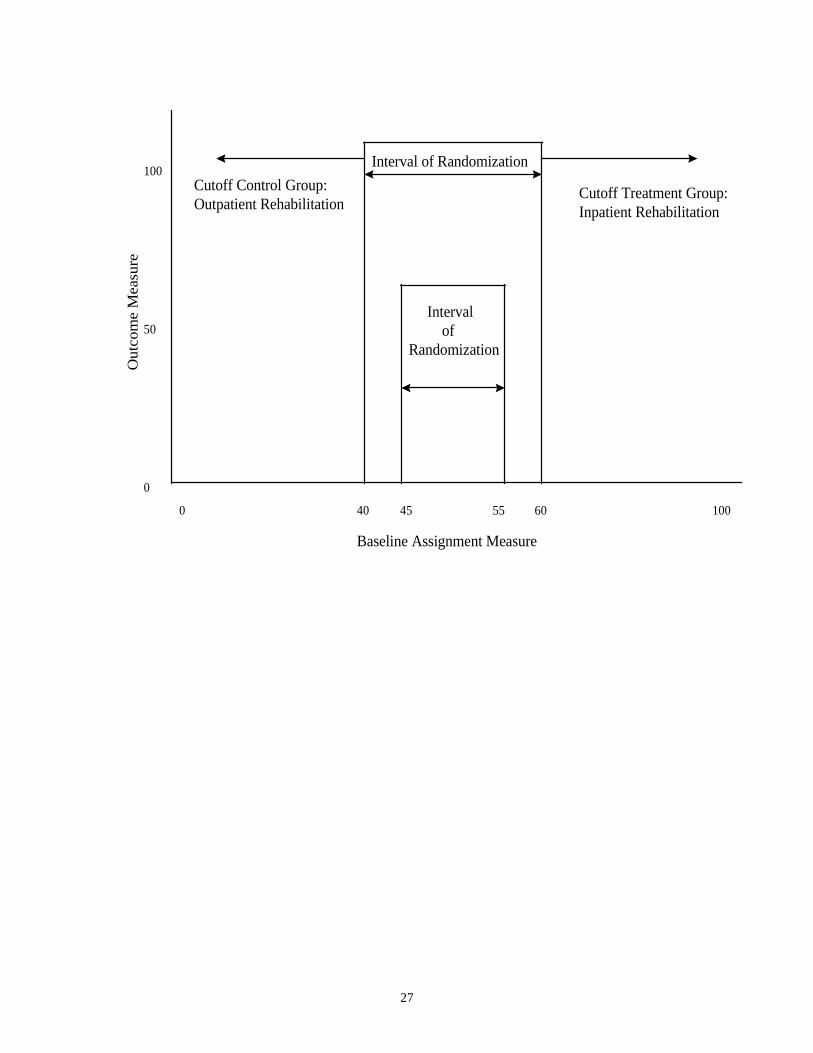
Figure 4 shows one of the more advanced RD-RE designs that may be useful for
accommodating varying amounts of resources. One cutoff interval has its bounds at 45
and 55; the other cutoff interval has its bounds at 40 and 60. Both intervals are symmetric
around 50. Because the two intervals have different widths, they include different
numbers of randomized patients, with the wider interval containing more randomized
subjects. As subjects accrue into a study, investigators of a clinical site may favor one
interval of randomization over the other in order to address the cost implications of
having a shortage or surplus of hospital beds for inpatient rehabilitation. Or one interval

12
may be preferred because it is more commensurate with a hospital’s level of resources
and expertise with respect to a given treatment.
VII. MODELING AND ANALYZING CUTOFF DESIGNS
The RD-RE combination can be modeled and analyzed with the polynomial backward
elimination approach mentioned in Section IV for the RD design. Specifically, the initial
model equation is
y = bint + (btrt)*z + (bxcut)*xcut + (bxcut2)*(xcut)2 + (bxcut3)* (xcut)3
+ (blinint)*(z*xcut) + (blinquad)*(z*xcut2)+ (blincub)*(z*xcut3) + error
where
y = outcome measure
xcut = baseline assignment covariate minus a baseline value at which to
measure the treatment effect (e.g., the middle value in a cutoff
interval in a RD-RE design or the cutoff value itself in a RD
design)
z = binary treatment group variable
bint = intercept estimator
btrt = treatment effect estimator
bxcut = linear slope estimator
blincut = linear interaction estimator
error = sample regression error term.

13
The other regression coefficients are the coefficients for powers of “xcut” higher than 1
and for their corresponding higher-order interactions. The same set of assumptions that
apply to linear regression (for continuous responses) and to logistic regression (for
discrete responses) also applies here.
The modeling strategy first tests the significance of each regression coefficient separately
beginning with the higher-order interaction terms (i.e., the cubic interaction is tested first,
followed by the quadratic interaction, and then linear interaction); interaction terms are
tested before main effect terms. All significant terms and their lower-order counterparts
are retained. The baseline covariate term and the treatment group variable are always kept
in the final model.
VIII. RELATIVE SAMPLE SIZES NEEDED IN CUTOFF DESIGNS
The simulation study mentioned in Section VI also showed that, everything else the same,
more randomization resulted in lower standard errors of the treatment effect estimate and
therefore increased precision. It can be shown that the amount of this precision is
completely determined by the multicollinearity or correlation (R) between the baseline
assignment covariate and the treatment group variable as expressed by the Variance
Inflation Factor (16):
VIF = 1 / (1 - R2) .

14
Suppose that there is a binary treatment group variable and a normally distributed
baseline covariate. Table 1 provides the correlation between these two variables (R) and
the accompanying variance inflation factor (VIF) in symmetric cutoff designs with
varying amounts of randomization and with 50% of the subjects within the interval
assigned randomly to either treatment. The VIF can be interpreted as the design effect of
how many more subjects are need in a given cutoff design relative to the completely
randomized design in order to achieve the same level of statistical power, everything else
the same.
_________________
Table 1 about here
__________________
Table 1 shows that, to achieve the same level of statistical power as the RE design, 2.75
times more subjects are needed in a RD design; 2.48 times more subjects are needed in a
RD-RE design with 20% of all subjects randomized (i.e., 20% randomization); 1.96 times
more subjects are needed in a RD-RE design with 40% randomization; 1.46 times more
subjects are needed in a RD-RE design with 60% randomization; and 1.14 times more
subjects are needed in a RD-RE design with 80% randomization. Derivations for the
efficiency of such a cutoff design using an analogous approach, which gives essentially
the same results, are published elsewhere (25).
15
IX. SOME ADDITIONAL RESEARCH
Cutoff designs are certainly not without limitations. As mentioned earlier, an unbiased
estimate of treatment effect requires that the functional relationship between outcome and
baseline covariate be correctly modeled. Finklestein et al. (20,21) proposed a
mathematical and statistical foundation, illustrated with examples, for how to analyze the
RD design and to draw valid statistical conclusions about treatment efficacy. The authors
discussed and illustrated their empirical Bayes methodology, which they mention can be
used in a variety of circumstances, as a way to overcome restrictive assumptions about
the functional form between outcome and baseline covariate. In other research, Hahn et
al. (26) proposed a way of nonparametrically estimating treatment effects and offered an
interpretation of the Wald estimator as an estimator of effect.
Another reservation with cutoff designs is that they preclude any serious attempt at
complete blinding of treatment, making them similar to nonrandomized designs in this
regard. A further drawback of cutoff designs is they are less efficient (precise) than
completely randomized designs in terms of their estimates of treatment effects. According
to Senn (27), the considerable excess of patients treated on the inferior treatment in cutoff
designs (especially the RD design) relative to the RE design is likely to undermine the
ethical argument that favors cutoff designs. Although it is also true that more patients will
receive the superior treatment in cutoff designs, regardless of which treatment it is,
researchers are urged to consider Senn’s position (27) before abandoning randomization
as a perceived ethical problem in a clinical trial.
16
Another variation of the RD design is the clustered RD design where groups (rather than
individuals) are assigned to an intervention. The clustered RD design was the primary
design to evaluate the federal education program prescribed in the No Child Left Behind
Act of 2001. Schochet (28) examined statistical power under clustered RD designs
(without randomization) using techniques from the causal inference and hierarchical
linear modeling literature. The main conclusion is that three to four times larger samples
are typically required under the clustered RD design than the clustered RE design to
achieve estimates of effect with the same level of precision.
Published studies using the RD design have focused primarily on linear regression
applied to a categorical indicator and an interval-level response. Berk and de Leeuw (29)
formalized a generalization of the usual RD design to a wider range of situations. They
focused on the use of a categorical treatment and response variables, but considered the
more general case of any regression relationship. In addition, a resampling sensitivity
analysis was shown as a way to address the credibility of the assumed assignment
process. The broader formulation is applied to an evaluation of California’s innate
classification system, which is used to allocate prisoners to different kinds of
confinement.

17
X. CONCLUSIONS
Randomization should be employed whenever possible. Cutoff designs should not replace
the completely randomized design in the majority of circumstances, usually involving a
drug intervention, when no appreciable logistical barriers preclude all subjects from being
randomized to interventions. Cutoff designs are an alternative design when circumstances
in health services research or outcomes research warrant that randomization of all
subjects cannot be undertaken, for whatever reason. Cutoff designs are much more likely
to be relevant and appropriate in studies on program evaluation that involve educational
or behavioral interventions, such as in disease management programs where
randomization is not feasible ethically or logistically for the entire sample (30), than in
traditional Phase III studies on drug interventions, but cutoff designs may have some
potential in phase II therapeutic trials as well. When compared with nonrandomized
designs, the regression-discontinuity design (a cutoff design with no randomization) is an
attractive alternative. When some subjects can be randomized, coupling the regression-
discontinuity design with the randomized design is even a more attractive alternative than
the RD design.
18
REFERENCES
1. Green, S. Patient heterogeneity and the need for randomized clinical trials. Controlled
Clinical Trials 1982, 3, 189-198.
2. Beecher, H. Ethics and clinical research. New England Journal of Medicine 1966,
274, 1354-1360.
3. Parker, L.S.; Arnold, R.M.; Meisel, A.; Siminoff, L.A.; Roth, L.H. Ethical factors in
the allocation of experimental medical therapies. Clinical Research 1990, 3, 537-544.
4. Marshall, E. Quick release of AIDS drugs. Science 1989, 245, 346-7.
5. Marx, J.L. Drug availability is an issue for cancer patients, too. Science 1989, 245,
345-346.
6. Ware, J.H. Investigating therapies of potentially great benefit: ECMO (with
discussion). Statistical Science 1989, 4, 298-340.
7. Truog, R.D. Randomized controlled trials: Lessons from ECMO. Clinical Research
1992, 38, 537-544.
8. Trochim, W.M.K. The regression-discontinuity design. In Research Methodology:
Strengthening Causal Interpretations of Nonexperimental Data; Sechrest, L., Perrin,
P., Bunker, J., Eds.; Agency for Health Care Policy and Research, U.S. Public Health
Service: Rockville, MD, 1990; 119-130.
9. Williams, S.V. Regression-discontinuity design in health evaluation. In Research
Methodology: Strengthening Causal Interpretations of Nonexperimental Data;
Sechrest, L., Perrin, P., Bunker, J., Eds.; Agency for Health Care Policy and Research,
U.S. Public Health Service: Rockville, MD, 1990; 145-149.

19
10. Shadish, W.R.; Cook, T.D.; Campbell, D.T. Experimental and quasi-experimental
designs for generalized causal inference; Houghton Mifflin Company: Boston, MA,
2002; 207-245.
11. Trochim, W.M.K. Research Design for Program Evaluation; Sage Publications;
Beverly Hills, CA, 1984.
12. Panel on the Evaluation of AIDS Interventions. In Evaluating AIDS Prevention
Programs, Expanded Ed.; Coyle, S.L., Boruch, R.F., Turner, C.F., Eds.; National
Academy Press: Washington, D.C., 1991; 144-159.
13. Mohr, L.B. The regression-discontinuity design. Impact Analysis for Program
Evaluation, 2nd Ed.; Sage Publications: Newbury Park, CA, 1995; 133-155.
14. Cappelleri, J.C.; Trochim, W.M.K.; Stanley, T.D.; Reichardt, C.S. Random
measurement error does not bias the treatment effect estimate in the regression-
discontinuity design: I. The case of no interaction. Evaluation Review 1991, 15, 395-
419.
15. Cook, T.D. Waiting for life to arrive: A history of the regression-discontinuity design
in psychology, statistics, and economics. Journal of Econometrics 2008, 142, 636-
654.
16. Goldberger, A.S. Selection Bias in Evaluating Treatment Effects: Some Formal
Illustrations. Institute for Research on Poverty: Madison, WI, 1972; Discussion Paper
#123.
17. Rubin, D.B. Assignment to treatment groups on the basis of a covariate. Journal of
Educational Statistics 1977, 2, 1-26.
20
18. Reichardt, C.S.; Trochim, W.M.K.; Cappelleri, J.C. Reports of the death of
regression-discontinuity analysis are greatly exaggerated. Evaluation Review 1995,
19, 39-63.
19. Cappelleri, J.C.; Trochim, J.C. An illustrative statistical analysis of cutoff-based
randomized clinical trials. Journal of Clinical Epidemiology 1994, 47, 261-270.
20. Finkelstein, M.O.; Levin, B.; Robbins, H. Clinical and prophylactic trials with assured
new treatment for those at greater risk: I. A design proposal. American Journal of
Public Health 1996, 86, 691-695.
21. Finkelstein, M.O.; Levin, B.; Robbins, H. Clinical and prophylactic trials with assured
new treatment for those at greater risk: II. Examples. American Journal of Public
Health 1996, 86, 696-705.
22. Trochim, W.M.K.; Cappelleri, J.C. Cutoff assignment strategies for enhancing
randomized clinical trials. Controlled Clinical Trials 1992, 13, 190-212.
23. Cappelleri, J.C.; Trochim, W.M.K. Ethical and scientific features of cutoff-based
designs of clinical trials: A simulation study. Medical Decision Making 1995, 15,
387-394.
24. Boruch, R.F. Coupling randomized experiments and approximations to experiments
in social program evaluation. Sociological Methods and Research 1995, 4, 31-53.
25. Senn, S.J. Statistical Issues in Drug Development, 2nd Ed.; John Wiley & Sons:
Chichester, UK, 2007; 88-93.
26. Hahn, J.; Todd, P.; Van Der Klaauw, W. Identification and estimation of treatment
effects with a regression-discontinuity design. Econometrica 2001, 69, 201-209.
21
27. Senn, S.J. A personal view of some controversies in allocating treatment to patients in
clinical trials. Statistics in Medicine 1995, 14, 2661-2674.
28. Schochet, P.Z. Statistical power of regression discontinuity designs in education
evaluations. Journal of Educational and Behavioral Statistics 2009, 34, 238-266.
29. Berk, R.A.; de Leeuw, J. An evaluation of California’s innate classification system
using a generalized regression discontinuity design. Journal of the American
Statistical Association 1999, 94, 1045-1052.
30. Linden, A.; Adams, J.L.; Roberts, N. Evaluating disease management programme
effectiveness: an introduction to the regression discontinuity design. Journal of
Evaluation in Clinical Practice 2006, 12, 124-131.

22
Table 1. Correlations and variance inflation factors of designs with varying amounts of
randomization
Percentage of All Subjects within Correlation Variance Inflation
the Interval of Randomization Coefficient* Factor
________________________________________________________________________
0 (Regression-Discontinuity Design) 0.79 2.75
20 0.77 2.48
40 0.70 1.96
60 0.56 1.46
80 0.35 1.14
100 (Randomized Design) 0.00 1.00
*Expected correlation between a binary treatment variable and normally distributed baseline
covariate.

23
FIGURE LEGENDS Figure 1. Regression-Discontinuity design with a 10-point treatment effect Figure 2. Regression to the mean: randomized and regression-discontinuity designs Figure 3. Illustration of a combined randomized and regression-discontinuity design Figure 4. Randomized and regression-discontinuity design with two cutoff intervals
24
0 10 20 30 40
10-pointeffect
Control Treatment Test Treatment40
30
20
10
Baseline Assignment Scores
OutcomeScores
25
true regression line
fitted regression line
Baseline Measure
OutcomeMeasure
26
0 40 60 100
100
50
0
Cutoff Interval where patients get randomizedto inpatient or outpatientrehabilitation
Cutoff Control Group:Outpatient Rehabilitation
Cutoff Treatment Group:Inpatient Rehabilitation
Baseline Assignment Measure
Out
com
e Mea
sure
treatment effect
27
0 40 45 55 60 100
100
50
0
Cutoff Control Group:Outpatient Rehabilitation
Cutoff Treatment Group:Inpatient Rehabilitation
Baseline Assignment Measure
Out
com
e M
easu
re
Interval of Randomization
Interval ofRandomization