josé antonio ocampo and camilo e tovar - united nations · 1 external and domestic financing in...
TRANSCRIPT

Workshop on Debt, Finance and Emerging
Issues in Financial Integration
Financing for Development Office (FFD), DESA
8 and 9 April 2008
External and domestic financing in Latin
America: developments, sustainability and financial
stability implications
José Antonio Ocampo and Camilo E Tovar

1
External and domestic financing in Latin America: developments, sustainability and financial stability
implications1
José Antonio Ocampo and Camilo E Tovar2
1. Introduction
The financing of Latin American economies has experienced major transformations over the past 10 to 15 years. Two of the most remarkable aspects of this process has been the shift from cross-border towards domestic financing and, domestically, from bank to bond financing. As a result, domestic capital markets have expanded, deepened and diversified much further than anyone would had expected a decade ago, rising as a promising and sustainable financing alternative, and partly overcoming what in the literature is known as the “original sin”. Its development helps mitigate risks and sources of vulnerability by reducing balance sheet exposures and systemic instability associated with currency mismatches and by providing an alternative source of financing when banking sectors are weakened. There is little doubt that these markets have strengthened the stability of local financial systems. However, their rapid development is also a potential source of risk, which should not be underestimated. Changes in currency composition and its implications for the maturity structure of debt, illiquid markets, narrow domestic investor bases and the lack of a proper infrastructure and regulatory framework are all potential sources of instability that need to be assessed.
This paper provides an overview of financing patterns in Latin America over the past 10 to 15 years, and analyses the sustainability of the process and its implications for financial stability. It begins with an overview of the macroeconomic environment under which such financing shifts have taken place. It next provides an overview of the shifts in financing patterns in the region. This is followed by a characterisation of the evolution and state of domestic bond markets in Latin America and a discussion of the factors supporting their development. The paper then discusses some sustainability and financial stability implications. Finally, the paper ends with some concluding remarks.
2. The macroeconomic environment
In recent years, Latin America has at last returned to the high rates of economic growth that characterised it in the late 1960s and through the 1970s. Since the rate of population expansion has fallen sharply since then, per capita growth from 2003 to 2007, at 4.1% per year, actually exceeds the previous historical peak, 1967-1974, when it grew at 3.9% per cent. Furthermore, given that the two largest Latin American economies (Brazil and Mexico)
1 Paper prepared for the United Nations workshop on “Debt finance and emerging issues in financial
integration”, New York April 8-9, 2008. The views expressed are those of the authors and do not necessarily reflect those of the BIS. We thank Rodrigo Mora for his research assistance. Comments welcome.
2 Professor, Columbia University ([email protected]) and Economist at the Bank for International Settlements ([email protected]), respectively.

2
have performed less well now than they did then, the comparison would look even better if used simple averages of GDP per capita growth.
The explanation for this is mainly the exceptional conditions prevailing in the international economy over the past few years. In particular, the current boom is basically due to the conjunction of two favourable factors not seen together since the 1970s: strong commodity prices –more of mineral than agricultural good— and exceptional external financing conditions. The economic history of Latin America shows that this combination leads infallibly to rapid economic growth. In the current circumstances, however, the transmission mechanisms for external financing have been somewhat different mainly because governments have been far more circumspect in their use of such financing (see discussion below). An additional third factor that has contributed to the boom in the region is the large remittances by Latin American migrants to their home countries, which reflect growing movements of labour (both regular and irregular) from Latin America to the industrialized countries, partly due to very limited job creation in the region during the period of slow growth that followed the Asian and Russian crises. Remittances have had a large effect on the economies closest geographically to the United States, to some extent compensating the deterioration of the terms of trade that several small countries in the region have experienced in recent years due to high oil prices.
The external situation is exceptional in another way: this is the first period in global economic history when per capita GDP has grown much faster in the developing countries than in the industrialized world, i.e. the first reversal of the tendency in global economic history for development levels in the two sets of countries to diverge (United Nations, 2006). However, it is still too soon to speak of true long-term convergence in these levels, except in the case of some Asian economies. Moreover, the current boom has encompassed every region of the developing world and, among them, Latin America has been in fact the weakest performer (United Nations, 2008).
The factors that have given rise to such exceptional external environment are well known. High raw material prices are mainly due to the heavy dependence of the Chinese economy on commodity imports. Exceptional financing conditions reflect, in turn, a wide array of factors: (i) the tolerance of the monetary authorities in the world’s leading economies for low interest rates, owing (at least until recently) to the low inflation levels; (ii) major financial innovations in a context that is now generally recognized as characterized by a regulatory deficit; this factor, combined with the search for higher returns, multiplied the demand for and liquidity of riskier financial instruments; (iii) the consequent large reduction in the risk premiums of such securities, and (iv) the large build-up of developing countries’ international reserves, owing to the saving of exceptional foreign exchange surpluses and the demand for “self-insurance” that arose after the Asian crisis, when it became clear that there was no international mechanism for dealing with crises caused by sudden stops in external financing. Some of these conditions, particularly the second and third, are rapidly changing in the face of the US financial crisis.
Growth and current account surpluses The most striking new feature of the current situation is the region’s ability to grow quickly while at the same time generating a current account surplus, and thus a net transfer of resources abroad. This combination, characteristic of the dynamic economies of East Asia, is unprecedented in the region’s history.3 Among the factors helping Latin America’s current
3 The closest parallel is with the situation of the 1950s and 1960s, when Latin America combined growth with
small current account surpluses (or small deficits, if Venezuela is excluded). In the 1970s, the region kept on growing rapidly but became dependent on net transfers of resources from abroad. The same happened when economic growth resumed, though at a slower rate, in 1990-1997. As is well known, the great volatility of

3
account balance over recent years, the dominant one has been the improvement in its terms of trade, amounting to the equivalent of 3.7% of gross domestic product (GDP) for the region as a whole between 2003 and 2007 (Table 1). Some of these gains were automatically taken out in the form of profit remittances by foreign firms active in mining sectors. However, while this effect has been large in some countries, for the region as a whole the factor income balance trend has improved marginally as the net production factor payments and the cost of foreign debt have fallen relative to GDP. Meanwhile, migrants’ remittances, which improved the balance of payments by 0.9% of GDP between 2000 and 2003, have not made a major additional contribution in recent years, although they are still a major income of some of the region’s smaller economies.
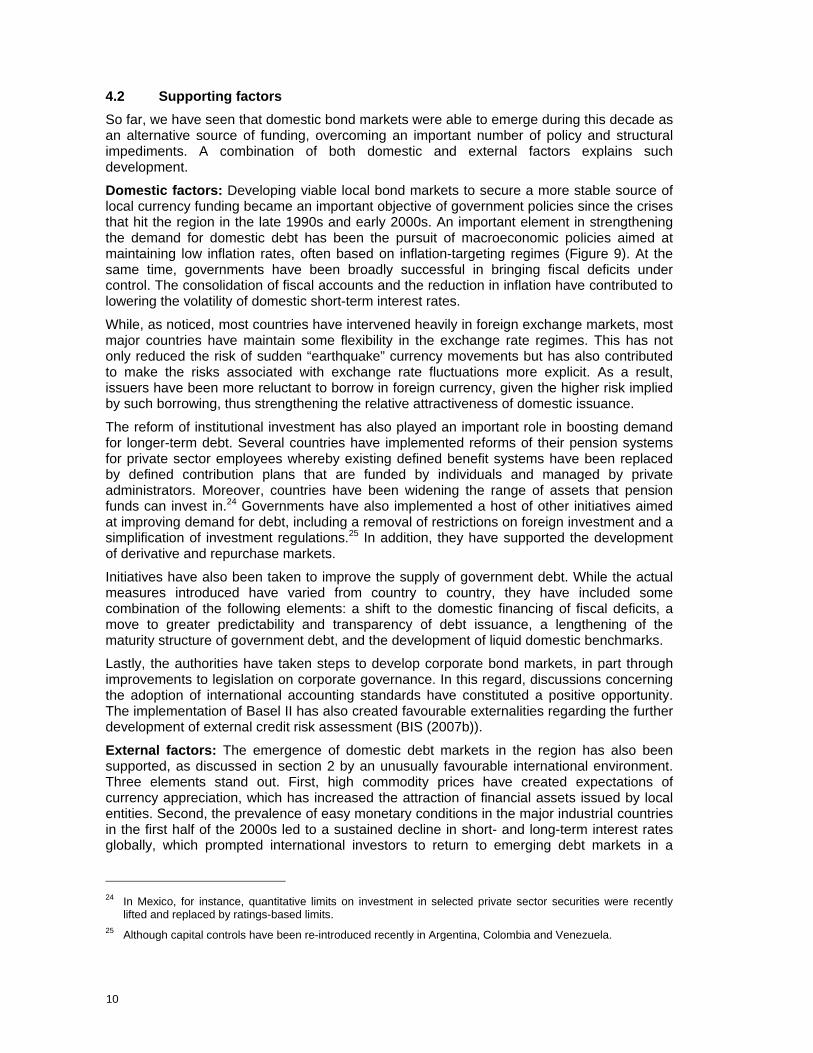
Current account surplus has two features that undermine its positive effect. First, it is largely confined to just six countries, five of them oil or mineral producers (Bolivia, Chile, Ecuador, Peru and Venezuela) and Argentina. Brazil also ran a current account surplus during recent years but has gone back to a deficit since the last quarter of 2007. Second, when adjusted for the improvement in the terms of trade, the current account has been in deficit since 2005 and is deteriorating rapidly, leading in 2007 to deficits similar to those of 1998 (Figure 1). The conjunction of these two factors indicates that the current account surplus is heavily dependent on the commodity price boom. Therefore, the improvement in the current account should be viewed with the caution recommended by Calvo and Talvi (2007)4 and Ocampo (2007) rather than with the optimism that is common among other observers.
The above analysis indicates that the situation of rapid growth with large current account surpluses is unlikely to continue in future. Although it is not impossible that a situation characterized by high hydrocarbon and mineral prices may persist if the Chinese economy continues its rapid expansion, the lesson from the region’s economic history is that it is risky to assume that high commodity prices will be permanent. Again, the severe turmoil in international financial markets that began in the late summer of 2007 reminds us that this other source of the current boom – exceptional external financing conditions – may also weaken as time goes on. This is compounded, of course, by the uncertainty surrounding economic growth around the world, and especially in the United States, as a result of these events.
Foreign exchange market intervention and the accumulation of international reserves A major new policy development in the region is the frequency and scale of official intervention in currency markets, reflected in the build-up of external assets by central banks and, in the case of Chile, by the government in fiscal stabilization funds. This means that several of the leading Latin American economies operate a “dirty” float. Thus, the countries have usually opted for “intermediate” managed exchange-rate regimes, running counter to the orthodox recommendation of adopting one of the two extremes: either a free float or a hard peg (1990s Argentine-style convertibility or dollarization). As is known, a policy of this type requires that the build-up of international reserves during upturns be matched by measures to sterilize their monetary impact. Sterilization of this type is easier when there is a fiscal surplus. Otherwise (and as an additional measure in any event) it will be necessary to sterilize via a mix of traditional open market operations, sales of central bank-issued bonds in the market, and/or higher reserve requirements. The major exceptions to the dominance of dirty floats are Mexico, which runs a fairly clean float, and Venezuela, which went back to a fixed exchange rate in 2005. The Chilean central bank also runs a fairly clean cut, but the
financial flows meant that depending on external resources for growth ultimately proved counterproductive in both occasions. See Ocampo (2007).
4 Indeed, the calculations of these authors, as well as those of ECLAC (2006, pp. 20-21), are much more unfavourable than those shown in Figure 1.

4
government intervenes heavily in the market through the fiscal stabilization funds (to be precise, avoids a large magnitude of external revenues from increasing the supply of funds in the foreign exchange market).
The extent of central bank intervention can be proxied by a measure of central bank resistance to exchange rate market pressures (EMP) which captures whether excess demand for domestic currency (i.e., appreciation pressure) is met through exchange rate changes or reserve accumulation.5 In particular, a resistance index is calculated, in which a higher value indicates greater resistance to EMP via reserve accumulation (Figure 2, left hand panel). The resistance to EMPs in Latin America has increased. These have been so significant that the index has reached levels similar to those displayed in the Caribbean, where pegged regimes are dominant. Of course, this is an indicative sign of “fear of floating”. Overall, this measure of integration suggests that there has been heavy intervention in foreign exchange markets. At a country level, intervention in the foreign exchange rate market has been common in recent years in Argentina, Brazil, Colombia, and Peru (see Jara and Tovar (2008) and Ocampo (2007) for a more detailed discussion).
The result of increased intervention in foreign exchange markets has been the significant accumulation of international reserves. Table 2 displays the scale of such accumulation up to June 2007. Quite notorious are the magnitudes of reserve accumulation in Argentina, Brazil, Peru and Colombia, as well as the accumulation of external assets by the Chilean government through its stabilization funds. Interventions were particularly massive during the period of external capital market “exuberance” that lasted from mid 2006 to mid 2007, when the accumulation of official foreign exchange assets was equivalent to 7 to 9% of GDP in Argentina, Brazil, Chile and Peru, and over 5% in Colombia (Ocampo, 2007). In all cases, official foreign asset accumulation far exceeded the current account surplus in recent years (Colombia is the only of these countries to have a current account deficit), indicating that it also absorbed surpluses from private-sector capital flows. Of the region’s seven largest countries, Mexico is the only one where official intervention in the currency market has been limited. An important implication is that reserves holdings in the region now exceed most rule-of-thumb measures, possibly reflecting the increased importance given to self-insurance as motive for reserve accumulation.
Despite its apparent positive effects, it is important to recall that holding reserves are not free of costs, as reflected for instance by their carry cost. Carry cost can be captured by a simple measure: the spread between domestic and US Treasury bill rates times the total outstanding stock of foreign reserves in domestic currency. A positive value implies that the central bank experiences a loss if they give up high yielding domestic securities (or borrow in domestic markets) to finance the acquisition of low yielding US Treasury securities (this last measure does no t account for changes on the value of foreign reserves in the central bank balance sheet, which can be significant). The evidence reported in Figure 3, indicates that the carry costs of reserves across the region have decline between 2004 and 2007 (with the main exception of Argentina) mainly as a result of narrower interest rate spreads.
The immediate effect of foreign exchange market intervention is the creation of domestic liquidity (an increase in base money). Central banks have sought to “sterilise” these monetary effects of foreign exchange intervention through offsetting sales of government or central bank securities. To assess the extent of sterilisation, the monthly change of central banks’ net domestic assets is regressed on its net foreign assets (see a more detailed
5 Excess demand can be met through several (not mutually exclusive) channels, mainly by allowing fluctuations
in the exchange rate or adjustments in the international reserves. The exchange rate market pressure index is equal to the weighted sum of the nominal exchange rate change and the change in international reserves. The weights are equal to the inverse of the standard deviation of monthly changes (see Eichengreen et al (1996)). Due to data limitations interest rates are not considered.

5
discussion in Jara and Tovar (2008)).6 The estimated coefficient measures the extent to which a central bank is able to sterilise by contracting domestic credit to offset the expansion of the monetary base associated with the accumulation of foreign reserves. A value of the coefficient equal to (or above) unity implies full sterilization, whereas a value of zero (or a negative value) represents no sterilization. The sterilisation coefficient is reported for the three subregions in LAC in Figure 2 (right- hand side panel). It shows that in Latin America the sterilization coefficient has increased, possibly reflecting greater pressures associated with exchange rate appreciations and the need to maintain some room of manoeuvre for monetary policy to deal with domestic demand conditions. It also shows that sterilised intervention is uncommon in the Caribbean, where sterilisation is found only in some of the larger islands (as it would be expected of a region where pegged regimes are more widespread).7
3. Shifts in financing patterns
Against the background of rapid economic growth with current account surpluses and reserve accumulation, the region has experienced a shift in its financing needs. Obviously, capital flows are suddenly no longer needed to finance current account deficits, and the excess funding available to the region has found new uses. As to the new dynamics of capital flows several new elements now dominate the scene. This can be captured by the new dynamics in terms of gross flows and international investment positions. In particular, the new features are:8 i) large gross foreign direct investment and portfolio inflows, both in terms of dollars and as a percentage of GDP (with some FDI containing also flows than could be classified more correctly as portfolio inflows); ii) incipient but growing gross capital outflows in some countries, some of which is official in character (accumulation abroad of stabilization funds by the Chilean government, or assets of PDVSA in the case of Venezuela) but also involves private flows (e.g., investment abroad by emerging Brazilian and Mexican multinationals); iii) a reduced reliance on external financing in net terms; iv) a reduction of external liabilities positions; and, finally v) improved external balance sheets.
Indeed, gross inflows to Latin American economies grew by 350% since 2003 reaching $160 billion in 2007, of which $78 billion were foreign direct investment (Figure 4). Debt flows by contrast have been less relevant in recent years than in the 1990s, although there has been a significant recent expansion. Equally important is that in just a few years the region went from having almost no gross outflows to about $85 billion in 2007. As a result of such trends net flows to the region now reach $75 billion in the region, about 2.4% of GDP (almost half the levels reached at the peak of the 1990s cycle).
The increasing international financial integration together with the dynamics of capital flows has meant that the composition of cross-border holdings has changed. As a result exchange
6 Formally, the sterilisation index is calculated by taking the estimated coefficient, ti ,β of the following
regression: mtimtititimti uNFANDA ,,,,,,,, +Δ+=Δ βα , where NDAΔ is the monthly change in the central
banks’ net domestic assets and NFAΔ is the monthly change in the central banks´ net foreign assets between in year t.
7 Of course, the distinction between open market operations associated with the normal management of liquidity and that aiming at sterilising the intervention in foreign exchange markets is blurred.
8 See Jara and Tovar (2008) for a more in-depth and a broader regional analysis.

6
rate and asset fluctuations now lead to important relocations of wealth across and within countries.9
The nature of recent financial flows can be better appreciated from the balance sheet given in Table 3. This table, which covers the seven largest Latin American economies, reveals two striking changes. The first is the increase in assets, particularly international reserves but also direct and portfolio investments abroad, which in all cases grew by even more than these seven economies’ GDP in current dollars (which itself rose by 65% between 2003 and 2006).10 The second is the large shift in the composition of liabilities, essentially driven by the reduction in borrowing and the rise of securities portfolio liabilities. The latter include investments in both the share and bond markets of the region’s countries by international investment funds. The counterpart to this shift in assets and liabilities, therefore, has been the boom in both domestic bond markets (see the discussion in the following section) and stock markets.
There are two further features of this balance sheet that are worth highlighting. First, net liabilities abroad have fallen greatly: by some 10 percentage points of GDP between 2003 and 2006, mostly in the financial position. This is true, furthermore, for six of the seven largest Latin American economies (the exception is Mexico). Three of them (Argentina, Chile and Venezuela) now have a positive net financial position. Again, the reserves build-up looks extremely sound when compared with debt liabilities, but much less so if the comparison is with all portfolio liabilities. One way of looking at it, and this will become much clearer later, is that the build-up of reserves has been matched by a rise in portfolio liabilities. Indeed, reserves in the region’s two largest countries only cover a fairly small proportion of portfolio liabilities, while in three countries (especially Mexico, but also Chile and Peru, albeit from a much sounder position), reserves have increased by less than these liabilities.
4. The development of local currency bond markets11
The discussion of the previous section shows a major shift in the pattern of financing which has changed the balance sheet of the region. An element that was highlighted was that an important counterpart of the shift in assets and liabilities was the expansion of domestic bond markets. Indeed, domestic financing has expanded vis-à-vis external financing (Figure 5). Nonetheless, such trend is not exclusively a Latin American phenomenon, but rather a broader trend observed across emerging markets, partly reflecting the relevance of the benign external environment.
Only a few years ago economists doubted that emerging market economies, including those of Latin America, could borrow in their own currencies, a phenomenon that became known in the literature as “original sin”.12 Although such literature emphasised factors associated with imperfections in the international financial markets, it is possible to argue that the underdeveloped of domestic bond markets were mainly the result of a number of policy and structural impediments.
9 See Lane and Milessi-Ferreti (2007) for a detailed discussion of international investment positions. 10 For a complementary discussion see Jara and Tovar (2008). 11 See a more extensive discussion in Jeanneau and Tovar (2008a). 12 See Eichengreen and Hausmann (2005) and Goldstein and Turner (2004).

7
First, high levels of inflation deterred governments or other borrowers from introducing standard long-term debt securities in the domestic market.13 Entrenched inflationary expectations meant that lenders were willing to lend in domestic currency only at very short maturities or with returns indexed to inflation, short-term interest rates or foreign currencies. Second, the absence of a broad and diversified investor base hindered the development of deep bond markets. Until the late 1990s, institutional investment played a limited role in most emerging market countries, with the notable exception of Chile, as illustrated by the much smaller stock of assets managed by institutional investors than in the industrial world (as a share of GDP).14 Even where institutional investment was sufficiently developed, restrictions on asset holdings, particularly on lower-rated or private-sector securities, narrowed investment opportunities.
Third, primary markets have been hindered by inefficiencies that increased the implicit cost of local issuance, such as lengthy registration procedures and uncompetitive underwriting arrangements.
Fourth, various policies or regulatory restrictions impeded the development of liquidity in secondary markets.15 In fact, active trading was constrained by the lack of a proper infrastructure for trading in government bonds, particularly a system of primary dealers obliged to provide two-way quotes and the availability of repurchase agreements and interest rate derivatives, and possibly by transaction and withholding taxes, as well as interest rate controls and investment regulations.
Lastly, the lack of an adequate infrastructure constrained the development of private sector debt securities. Constraining factors included the lack of long-term government benchmarks used in the pricing of corporate liabilities, weak accounting standards and poor corporate governance. In addition, the limited penetration of credit rating agencies has constrained the analysis of corporate credit risk.
4.1 Main features of bond markets in Latin America Despite the constraints, the issuance of domestic securities in the region has been able to expand rapidly over the past decade (Figure 5).16 The amount of such securities issued by central governments and non-financial corporate entities from the seven largest countries in the region rose by 337% between the end of 1995 and the end of 2005, to $895 billion, equivalent to about 40% of those countries’ combined GDP. By comparison, the total stock of
13 Burger and Warnock (2003) find that high and variable inflation rates are a significant impediment to the
development of domestic bond markets in emerging economies. Borensztein et al (2006b) try to identify factors associated with the underdevelopment of Latin America’s bond markets. They find that a limited number of observable policy variables and country characteristics explain 70% of the bond market capitalisation difference between Latin America and the industrial countries. Policy variables such as macroeconomic stability (measured by the volatility of the exchange rate), openness, investor protection and the cost of enforcing a contract can explain a quarter of the difference in bond market capitalisation between both regions. However, they fail to find a significant economic relationship for policy variables such as the exchange rate regime, presence or lack of capital controls, the level of public debt, bank concentration or banking spreads. See also the study by the IADB (2006).
14 In Chile, assets held by pension funds rose gradually from the early 1970s to reach about 70% of GDP in 2004. However, similar holdings in other countries are much lower, ranging from 6% of GDP in Mexico to 14% of GDP in Argentina (Crabbe (2005)).
15 Mohanty (2002) provides a comprehensive overview. 16 Fully consistent cross-country data sets covering Latin American domestic debt markets were not available
when this paper was drafted. Therefore, we assembled comparable data for the central government and non-financial corporate sectors of Argentina, Brazil, Chile, Colombia, Mexico, Peru and Venezuela. Domestic issuance comprises the securities issued on local markets in local or foreign currency. Issuance by financial entities was excluded from the analysis owing to the limited coverage of available data.

8
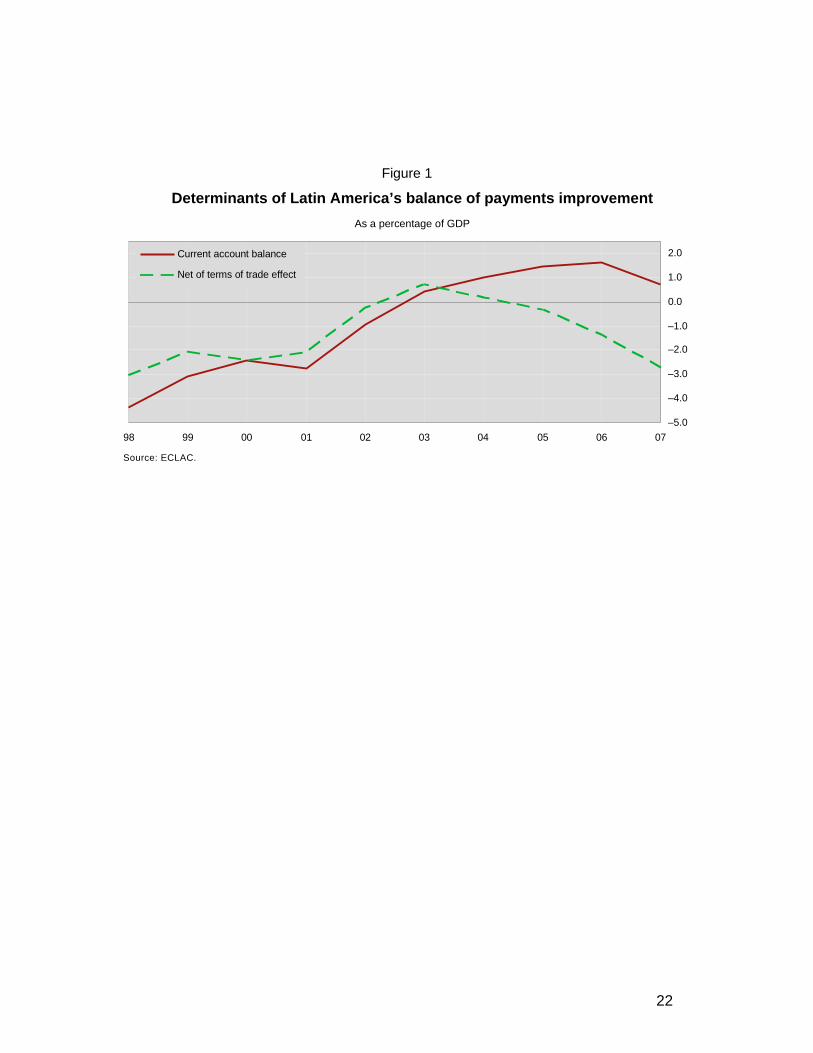
securities issued by such borrowers in international debt markets expanded by 65% over the same period, to $264 billion. As a result of this growth, local fixed income markets have become the dominant source of funding for the public and private sectors. The resulting current configuration of domestic debt markets in Latin America can be characterised by six main features: i) highly heterogeneous domestic markets sizes; ii) markets dominated by the public sector; iii) structures still dominated by short-term, floating and inflation-indexed securities, although local-currency fixed-rate instruments are slowly expanding; iv) a maturity structure that is still concentrated in the short-term despite the recent expansion; v) relatively illiquid markets; and, finally, vi) inexistent or incipient derivatives markets. Domestic debt markets vary widely in size (Table 4). Brazil has by far the largest market, with an outstanding stock of securities of $583 billion at the end of 2005 (equivalent to 74% of its GDP). Mexico’s is the second largest in absolute terms, with $159 billion in outstanding securities, but it is substantially smaller than Brazil’s in terms of GDP (21%). The debt markets of other countries are much smaller in absolute terms, although some of those markets are reasonably large relative to GDP. Public sector issuers dominate domestic securities markets (Table 4). The central governments of the seven largest countries had issued marketable liabilities amounting to $808 billion at the end of 2005. By comparison, corporate bond markets are much less developed. Although corporate markets may reach up to 40–50% of the respective government bond markets in some countries (e.g., Chile and Peru), they only add up to $87 billion for the region as a whole. Moreover, even in countries where corporate markets are more developed, activity is restricted to top-tier companies. There has nevertheless been some progress in developing non-government bond markets, as illustrated by the expansion of securitisation in the region (Scatigna and Tovar (2007)).17 Short-term, floating-rate and inflation-indexed securities dominate the market. In fact such instruments account for a large share of the outstanding stock of domestic government securities. However, there has been a shift in the composition of government debt. As Figure 6 shows, currency-linked debt has lost prominence. The main exceptions to such trend are Argentina and Venezuela.18 In addition, the relative share of fixed rate debt has increased in most countries. Progress has been particularly notable in Mexico, where the share of fixed rate securities amounted to about 40% at the end of 2005, versus less than 5% in 2000. Brazil and Peru have also made significant advances.
The maturity structure in local currency, although expanding, is still concentrated in the short-term. Figure 7 shows the progress made by governments in lengthening the maturity of their fixed rate debt in local currency. Since 2006 Mexico and Peru have been able to issue 30-year bonds, a significant development in the latter case given the country’s high degree of dollarisation. Brazil has also made important advances over the last years as reflected by its 20-year global bond issues. Colombia, where it was common to issue 10-year debt, now issues at 15 and 20 years. Chile has issued securities up to 10 years as part of a process of reducing the degree of indexation of its government debt market and has recently announced the possibility of issuing nominal debt with a 30-year maturity. Longer-term issuance has also developed in Venezuela, owing in part to excess domestic liquidity resulting from capital controls. Overall, the wider availability of longer-dated bonds is beginning to provide a useful representation of the term structure of interest rates (Figure 8).
17 See Ananchotikul and Eichengreen (2008) for a complementary discussion on factor holding back the
development of domestic corporate bond markets in Latin America. 18 In Argentina, which Figure 6 does not show, foreign currency denominated debt has been used to regain
market access since the country’s 2001 default.

9
Notwithstanding this progress, the amount of fixed rate securities issued at longer tenors remains in most cases limited, as reflected in the relative stability of the weighted average maturity of new issues (Figure 10). The average maturity of new central government debt in the two largest markets, Brazil and Mexico, stood at 56 months and 31 months, respectively, at the end of 2006.
Markets remain relatively illiquid. Although secondary market trading in domestic bonds, a common measure of liquidity, has expanded in recent years it remains low relative to mature markets (Table 5). According to the Emerging Markets Trading Association (EMTA), yearly trading by its member banks in the domestic instruments of the region’s seven largest countries amounted to $1.3 trillion in 2005, or 1.6 times the outstanding stock of government securities. This is a lower volume of activity than in the more mature markets. Although the data are not entirely comparable, trading in US Treasury securities amounted to about $139 trillion in the same year, or 22 times the relevant stock of securities. Within Latin America, moreover, there is considerable variation in secondary market activity. While annual turnover in Mexican securities is five times the outstanding stock, that in Peruvian and Venezuelan securities is less than the outstanding stock.
Market liquidity has other important dimensions, such as the tightness of the market, ie the efficiency with which market participants can trade.19 Local markets for fixed rate government securities in the region do not appear to be very tight relative to the US market (Table 5). Indeed, bid-ask spreads, which provide an idea of the costs incurred by market participants in executing transactions, are significantly higher in Latin America than in the United States.20 Furthermore there are major differences within the region, while bid-ask spreads are narrow in Colombia and Mexico, they remain wide in Argentina, Peru and Venezuela.
Finally, derivatives markets are inexistent or incipient. There are currently no actively traded derivatives contracts on government bond benchmarks in the region, but trading in short-term interest rate or swap contracts is developing rapidly in the major countries. In Brazil, position-taking in fixed income markets is conducted largely through overnight futures and swaps rather than cash market assets.21 This accounts for the sharp expansion in exchange-traded turnover observed in recent years, with activity reaching $8.8 trillion in 2006 against $2.6 trillion in 2000.22 In Mexico, where exchange-traded activity on fixed income assets does not extend beyond interbank rates, business amounted to $1 trillion in 2005 relative to almost nothing in 2000. However, over-the-counter (OTC) currency forwards and swaps are reported to be increasingly popular in that country. Such instruments are helping foreign investors and issuers hedge their currency and interest rate exposures to local currency bonds, thus facilitating their entry into the market for such securities.23
19 Resilience --i.e., the market’s ability to absorb a shock— is equally important. However, it is difficult to assess
it without longer time series. See BIS (2007a). 20 As a reference, bid-ask spreads in government bond markets in Asia range from 1 to 2 basis points in India,
Korea and Singapore, and to 7 basis points in Indonesia. See Jiang and McCauley (2004). 21 See Amante et al (2007) for a discussion of the role of derivatives in the Brazilian market. 22 By comparison, turnover on US exchanges reached about $750 trillion in 2005. 23 Local currency debt markets have stimulated derivatives markets in Mexico. Taking advantage of the demand
for highly rated peso paper, foreign financial institutions have issued a number of international peso-denominated bonds. Since such issuers tend to swap the proceeds of their issues into other currencies, they have provided a natural counterpart to foreign investors wishing to hedge peso paper. The Mexican peso is now one of the few emerging market currencies in which there are active OTC derivatives trading (BIS (2005)).
10
4.2 Supporting factors So far, we have seen that domestic bond markets were able to emerge during this decade as an alternative source of funding, overcoming an important number of policy and structural impediments. A combination of both domestic and external factors explains such development.
Domestic factors: Developing viable local bond markets to secure a more stable source of local currency funding became an important objective of government policies since the crises that hit the region in the late 1990s and early 2000s. An important element in strengthening the demand for domestic debt has been the pursuit of macroeconomic policies aimed at maintaining low inflation rates, often based on inflation-targeting regimes (Figure 9). At the same time, governments have been broadly successful in bringing fiscal deficits under control. The consolidation of fiscal accounts and the reduction in inflation have contributed to lowering the volatility of domestic short-term interest rates.
While, as noticed, most countries have intervened heavily in foreign exchange markets, most major countries have maintain some flexibility in the exchange rate regimes. This has not only reduced the risk of sudden “earthquake” currency movements but has also contributed to make the risks associated with exchange rate fluctuations more explicit. As a result, issuers have been more reluctant to borrow in foreign currency, given the higher risk implied by such borrowing, thus strengthening the relative attractiveness of domestic issuance.
The reform of institutional investment has also played an important role in boosting demand for longer-term debt. Several countries have implemented reforms of their pension systems for private sector employees whereby existing defined benefit systems have been replaced by defined contribution plans that are funded by individuals and managed by private administrators. Moreover, countries have been widening the range of assets that pension funds can invest in.24 Governments have also implemented a host of other initiatives aimed at improving demand for debt, including a removal of restrictions on foreign investment and a simplification of investment regulations.25 In addition, they have supported the development of derivative and repurchase markets.
Initiatives have also been taken to improve the supply of government debt. While the actual measures introduced have varied from country to country, they have included some combination of the following elements: a shift to the domestic financing of fiscal deficits, a move to greater predictability and transparency of debt issuance, a lengthening of the maturity structure of government debt, and the development of liquid domestic benchmarks.
Lastly, the authorities have taken steps to develop corporate bond markets, in part through improvements to legislation on corporate governance. In this regard, discussions concerning the adoption of international accounting standards have constituted a positive opportunity. The implementation of Basel II has also created favourable externalities regarding the further development of external credit risk assessment (BIS (2007b)).
External factors: The emergence of domestic debt markets in the region has also been supported, as discussed in section 2 by an unusually favourable international environment. Three elements stand out. First, high commodity prices have created expectations of currency appreciation, which has increased the attraction of financial assets issued by local entities. Second, the prevalence of easy monetary conditions in the major industrial countries in the first half of the 2000s led to a sustained decline in short- and long-term interest rates globally, which prompted international investors to return to emerging debt markets in a
24 In Mexico, for instance, quantitative limits on investment in selected private sector securities were recently
lifted and replaced by ratings-based limits. 25 Although capital controls have been re-introduced recently in Argentina, Colombia and Venezuela.

11
search for higher yields.26 In turn, the search for yield eased financing conditions along the maturity spectrum. This favourable climate encouraged investors to purchase local securities and thus facilitated primary market issuance. Third, those favourable cyclical factors have been reinforced by a more secular process of integration between mature and emerging economies (Wooldridge et al (2003)). This process includes the growing availability of low-cost and real-time information about the performance of countries and firms. This has significantly weakened the information asymmetries between financial market participants that traditionally created a home bias in investment. At the same time, the development of electronic trading technologies has greatly reduced transaction costs and processing times, further broadening market participation. Lastly, the entry of foreign financial institutions in domestic markets has provided a new channel for investment in the region.
5. Sustainability and financial stability considerations
Questions arise as to whether this investment process in domestic markets is temporary or permanent. There are good reasons to believe that several of the factors supporting the development of bond markets in Latin America may be of a permanent nature. Notwithstanding, the expansion of local bond markets depends in part on the sustainability of the global process of portfolio diversification. The reduction in nominal interest rate differentials observed in recent years would have been expected to weaken the search for yields but capital continued to flow strongly to the region. However, the extent to which domestic bond markets will constitute a dependable source of funding for the region remains to be tested under less auspicious market conditions.
Table 6 presents more general evidence concerning the diversification benefits offered by Latin American domestic bond markets relative to other asset classes in global portfolios, at least from the point of view of US dollar-based investors. Such benefits have been evident given the relatively low return correlations since January 2003 of Latin American local currency bonds with: (a) Asian and European emerging market local currency bonds (0.49 and 0.31, respectively); (b) the foreign currency EMBI index (0.53); and (c) 10-year US Treasury notes (0.12). This last set of correlations has been lower for Latin American local currency bonds than the corresponding sets for Asian and European local currency instruments (0.26 and 0.29, respectively) or the EMBI Global Diversified index (0.61). The final row of Table 6 indicates that these diversification benefits did not come at the cost of lower returns over the sample period. From 2003, cumulative returns on local Latin American fixed income securities exceeded those of other emerging markets as local nominal yields declined and currencies appreciated. Complementary evidence is reported in Table 7. The Sharpe ratio shows that local currency bond markets in Latin America offered during the past few years higher excess returns in dollars per unit of risk than investing in other markets such as Asia or Europe (0.33 versus 0.14 or 0.29). However, in 2006 the attractiveness of Latin American markets declined on average, due in part to the sharp market adjustment observed in Colombia. The region has not recovered since.
Overall, diversification benefits depend in part on whether yield correlations with other fixed income instruments remain low during periods of stress. There is some supportive empirical evidence that this may be the case (Bayliss (2004)). But there are not enough data to test the
26 Although there are no comprehensive data on non-resident investor holdings of domestic bonds, the sustained
increase in the share of domestic bonds in the total volume of trading by international financial intermediaries reported by the Emerging Markets Trading Association (EMTA) suggests that foreigners have become more involved in domestic bond markets in the region (see Figure 1, right-hand panel).

12
stability of correlations over more than a limited time span. An extended episode of significantly less favourable market conditions would be required to arrive at more definite conclusions.
The development of domestic bond markets can have, nonetheless, implications for the stability and vulnerability of the economies in the region.27 There are reasons to believe that these markets may help in reducing the sources of vulnerability of these economies to external shocks, particularly by eliminating currency mismatches. Nevertheless, at the same time, these markets may have generated new sources of instability due to the still dominant short term bias, the problems of liquidity that characterise at least some of them –a problem that may become more acute during a strong market downswing— and the limited development of some market agents and large and deep markets for corporate debt. This is compounded by other problems, some of which are common to industrial countries (e.g., those associated to securitisation).
Furthermore, a major issue of financial liberalization has been the limited and, indeed, the loss of room of manoeuvre that authorities of developing countries have to manage a counter-cyclical macroeconomic policies (Ocampo and Vos, 2008). In this regard, we still don’t know how the market would behave a period of expectations of exchange rate depreciation associated a deepening external crisis. In fact, as the previous analysis indicates, the rapid expansion of domestic bond markets may be seen as the joint product of a policy decision (reduce macroeconomic vulnerabilities) and external conditions that generated a bias towards exchange rate appreciation that attracted external and domestic resourses to the booming local markets. In what follows we discuss some of the implications of the financial stability implications of developing domestic bond markets.
Currency mismatches From a general perspective, currency and maturity mismatches matter because they have the potential to exacerbate the impact of exogenous shocks, increase the severity of crises, and slow the post-crisis adjustment process (Goldstein and Turner (2004)). They also complicate monetary policy as they limit the degree of exchange rate movements that central banks are willing to permit (ie the “fear of floating” hypothesis), thus forcing them to intervene to prevent such movements. Furthermore, fiscal deficits may become a major drag for the economy if currency depreciations increase the cost of foreign denominated debt. Finally, they can affect the level of sovereign ratings.
The notion of currency mismatch refers to the impact of a change in the exchange rate on the present discounted value of future income and expenditure flows (see Goldstein and Turner (2004)). Such a notion has two direct implications. The first is that all assets and liabilities must enter the calculation – not just cross border assets and liabilities. The denomination of contracts between residents in foreign currencies matters because a sharp change in the exchange rate can disrupt such contracts, which can have real economic effects. Foreign currency debts between residents may “cancel out” in normal times but do not do so in a crisis. The second implication is that the currency denomination of income flows is as important as the currency denomination of balance sheet variables: foreign currency borrowing to finance the production of tradables is one thing, to finance non-tradables quite another.
There are at least three dimensions to the measurement of currency mismatches: aggregate, sectoral and microeconomic. However available evidence is scarce as to provide an
27 This topic has been examined by a Committee of the Global Financial System’s (CGFS) Working Group on
“Financial stability and local currency bond markets” (BIS(2007a)). See also Jeanneau and Tovar (2008b).

13
exhaustive evaluation of currency mismatches. In what follows some evidence is reported based on available data.
A key indicator of currency mismatch is the ratio between the currency denomination of debt and the share of traded goods in GDP. Simply stated, countries with high export/GDP ratios can sustain a higher share of foreign currency in total debt. If this ratio is greater than one – more foreign currency debt than foreign currency earnings to finance – then the country is experiencing a mismatch. How large a problem this is depends on a country’s net foreign currency position; a large net liability position compounds the difficulty. Figure 10 plots the basic components behind the measure of currency mismatch just described. In 1997, the mismatch ratio was well over one in all the largest countries in the region except Chile. This is clearly captured by the average position for Latin American countries, which stands over the 45º line in Figure 10. By 2006, most countries in the region had clearly moved away from such a vulnerable situation as reflected by their positions below the 45º line. In fact, Brazil, Chile, Colombia and Mexico (the countries with the most developed local currency bond markets) are now, according to this indicator, in a balanced currency position. At the same time, net liability positions in foreign currency have fallen as foreign exchange reserves have been built up, thus lowering aggregate mismatches.
Assessing the extent of currency mismatches at the sectoral level is important because it may reveal vulnerabilities that are submerged within the country aggregates.28 Data for the government sector are generally good. These show that governments in the region have made much progress in reducing their exposure to external debt. For instance, the Mexican government has made an explicit effort to reduce the country’s external debt exposure by shifting the financing of its deficits to the domestic market. In fact, since 2001 the entire fiscal deficit has been financed domestically. The Mexican government has also conducted a number of buyback operations in the international market and repaid debt to the Inter-American Development Bank (IDB) and World Bank. As a result, the domestic component of its narrow public sector debt rose to 65% in 2004, compared with 30% at the end of 1995 (Jeanneau and Perez Verdia (2005)). In Brazil, the government has endeavoured to phase out dollar-linked debt (see Amante et al (2007)).
Moreover, across the region such efforts are reflected by explicit actions: Argentina repaid its debt to the IMF; Brazil and Venezuela bought back their Brady bonds; Colombia bought back several external issues; and Peru reduced its debt with the Paris Club and has issued domestic debt to replace external debt. As a result, the share of international debt in total government liabilities has declined across the region.
Complementary evidence on the progress made at the public sector level is reported by Acevedo, Alberola and Broto (2008). They ask how changes in the currency composition of public debt have affected the nature of financial risk in a number of EMEs, including Brazil, Colombia and Uruguay. They find that, given the exchange rate appreciation observed in recent years, debt ratios would have been smaller had there been no changes in the composition of public debt structures. This is illustrative of how governments in the region (and broadly speaking in EMEs) have taken advantage of the benign international environment to transform debt structures even at the expense of such short-term costs. The authors also perform counterfactual exercises for financial turbulence scenarios (similar to those seen in recent crisis episodes) finding reductions in the debt vulnerability of these economies, even once the short-term costs associated to the transformation of debt
28 See Rosenberg et al (2005) and Goldstein and Turner (2004) for an analysis of currency mismatches at the
sectoral level. In particular, the second study incorporates an estimate of foreign currency denomination of all debt. At the country level, Lima et al (2006) carry out a detailed analysis of sectoral balance sheet mismatches and vulnerabilities for the Colombian economy. Rosenberg et al (2005) also have applications for Argentina and Brazil.

14
structures are taken into account. However, such reductions are not uniform: while gains are notorious for Brazil, where debt structures were biased toward foreign currency denominated debt, they are less so for Colombia or Uruguay. Overall they highlight that changing the currency composition of debt requires balancing possible short-term costs with long-term gains arising from a structure less dependant on foreign currency debt.
Data on the currency denomination of banking system assets and liabilities are also generally readily available – at least for the supervisory authorities. Table 8 reports the ratio of assets minus liabilities in foreign currency to total assets provides a measure of the banking system’s direct exposure to currency risk. Evidence reported shows a decline in this indicator for all countries in the region since 2003. Of course a caveat is that indirect exposures (eg currency risk faced by bank’s borrowers) are not captured by this indicator and need to be considered (Jara and Tovar (2008)).
Maturity mismatches Another important source of vulnerability is that associated with maturity mismatches and rollover risks. As indicated above, one of the features of the market is that, although the maturity structure of local bond markets has expandid, it is still concentrated in the short term. One of the difficulties in assessing such vulnerability is, however, that there is not much information on the maturity structure of domestic debt.
In the case of the external liabilities, a crude way of assessing this risk is through the use of short-term external debt, in particular the ratio of short-term external debt to international reserves and the level of short term external debt to total debt. As is well known, such ratios are considered good predictors of financial crises. Figure 11 displays the evolution of these ratios since 1995. The ratio of short-term debt to international reserves shows a marked improvement over the period, notwithstanding a deterioration in some cases between 1995 and early 2000s. Also, in most cases it is possible to see a consistent decline in the share of short-term debt as a percentage of total external debt. However, the ratio remains high for Peru.
Maturity mismatches also need to be assessed at the sectoral level. As discussed earlier the region has made substantial efforts to reduce the extent of maturity mismatches at the public sector level by issuing debt at longer maturities. As an illustration, the Brazilian government’s debt management policy has explicitly aimed to reduce refinancing risk by reducing the share of federal debt maturing within 12 months (Amante el al (2007)).
Liquidity Market liquidity is essential for the smooth functioning of modern financial systems. The existence of deeper and more liquid bond markets should make it easier for financial institutions to adjust their portfolios of cash market securities and related derivatives in a cost-effective way. The low level of secondary market trading in the region is a concern since active markets are an essential prerequisite for the cost-effective taking or unwinding of positions. Poor liquidity or a liquidity breakdown under stress can induce large changes in market prices and volatility.29 In extreme situations, it can temporarily convert tradable assets into non-marketable loans, which can lead to substantial losses for market participants who rely on their ability to turn over positions quickly and at favourable prices. Liquid financial markets are also necessary for the functioning of modern risk-management systems, which
29 In fact, several countries in the region have already shown some vulnerability during periods of stress. Good
examples are Brazil in 2001 and 2002 and Colombia in 2002, when financial turmoil led to a drying-up of market liquidity in government paper.

15
rely on the derivation of accurate benchmark rates for the pricing of portfolios and the smooth functioning of markets for the frequent rebalancing of positions. Until there is genuine progress on that front, financial market participants will find it difficult to hedge their positions at an acceptable price and will therefore be exposed to a fair degree of price risk.
Market liquidity can be related to a number of factors. The size of a bond market and its individual issues is usually seen as a determinant of its depth, liquidity and resilience. In the region, only Brazil and Mexico can be considered to have large enough markets. However, as shown by the bid-offer spreads (see Table 5), smaller countries should also be able to develop liquid markets.
What is more, the type of securities traded in a market can have a bearing on market liquidity. In general, indexed securities tend to be held until maturity and are therefore less actively traded and liquid than money market instruments or straight fixed-rate bonds. This is illustrated by the wider bid-ask spread for inflation-linked securities. The availability of a wide array of instruments can also prevent the build-up of a sufficiently large stock of homogeneous securities for active trading. In Brazil, for example, there have been various types of inflation-indexed securities (see Amante et al (2007)), while in Mexico fixed-rate securities used to be issued by a number of public sector borrowers. A consolidation in the offering of government securities, in terms of either the instruments themselves or their issuing entities, would probably do much to improve liquidity.30 In particular, a policy of consolidation by the government or the central bank – ie buying back illiquid issues and selling popular ones – could make the yield curve much smoother and thus provide a better benchmark.
Equally important is the breadth of the investor base. The shift to privately funded pension systems in the region has boosted institutional demand for local securities, but the investor base remains narrow. Except in Brazil, the mutual fund industry is underdeveloped, insurance companies tend to be small, and the local hedge fund industry is practically non-existent. In some countries, such as Chile, pension funds have created a virtual monopsony in securities markets.
Foreign investors still have a limited presence in most domestic markets owing to the prevalence of capital controls, which remain in place in Argentina, Brazil, Colombia and Venezuela. Trading is also limited by various regulatory restrictions or taxes on interest rate payments, capital gains or transactions.31 The strong international demand for global issues in local currencies launched by Brazil and Colombia clearly captured the preference of investors for securities that are not affected by such impediments (Tovar (2005)). In Mexico, the dynamism of domestic markets has been partly related to the access by foreign investors to the domestic bond market.
Improvements in liquidity should help the markets become more resilient (i.e., better able to cope with shocks). However, assessing their resilience is a difficult task. One way to approach this issue is to track the volatility of local currency bond returns. According to Figure 12, there is no broad evidence of regional improvement, although there does appear
30 Turner (2003) also argues that defining issues in a common maturity date (eg 30 June 2008) is preferable
than in terms of a common maturity period (eg 5-year paper with the maturity defined as five years from the issuance date). Such a strategy allows paper with an identical date of maturity to be issued for prolonged periods, thus simplifying pricing enormously.
31 In Brazil, foreign investors must register their purchases of securities with the Brazilian securities regulator and the central bank and nominate a legal representative who is required to monitor the fiscal status of their transactions. In addition, they are subject to at least two transaction taxes (an additional 15% withholding tax on capital gains was removed in February 2006). In Colombia, foreign investors can only purchase domestic securities through an investment trust, and a withholding tax varying with the maturity of the securities is levied.

16
to be some progress in Mexico and, until the first half of 2007 in Chile. Moreover, recent episodes offer conflicting evidence. While the May-June 2006 and the adjustments seen in the summer of 2007 reminds us that these economies are vulnerable to sudden shifts in market sentiment, the February 2007 episode had minor effects. In fact, during this episode trading volumes in Brazil and Mexico reached record highs without major changes in prices. Overall, this evidence needs to be taken with caution. However, the increasing volatility of local currency returns seen in Chile suggest that much of the resilience seen in these markets in previous years were apparently more the result of the favourable global and local conditions.
Overall, improving the liquidity in domestic securities markets remains a major challenge for the region. In this respect, it appears that sensible policy measures should aim at consolidating public sector debt under the same obligor, creating a limited number of benchmarks, allowing short-selling,32 developing repo markets, removing regulatory restrictions and tax provisions inhibiting active trading, standardising legal frameworks and settlement systems and, finally, broadening the investor base. In this last case, a different option would be to issue global bonds in local currency, to encourage entry of foreign investors or possibly to develop a regional bond fund.
Other considerations The wider availability of financial structures and their different risk profiles is making the intermediation process more complex. This situation can potentially lead to new risks, both for financial market participants and the financial system as a whole. In particular, the issuance and holding of different debt instruments and the manner in which agents operating in the market, either issuing entities or investors, can affect financial stability.
The progress made in controlling inflation has allowed governments in the region to gradually develop their markets for fixed-rate debt. The growing issuance of fixed-rate securities has reduced domestic refinancing risks, at least as far as the yield curve extends, and has helped in reducing currency mismatches. It has also provided countries with insurance against negative supply shocks that are combined with a rise in inflation (Holand and Mulder (2005)).33 However, fixed-rate debt is not free of problems. The obvious drawback is that the issuer foregoes the ability to benefit rapidly from lower market rates should they eventually decline. This is less of a problem nowadays because debt managers have a variety of means at their disposal to reverse their exposures, such as call options and interest rate swaps. One potential danger for the financial system is that the availability of longer-duration liabilities leaves market participants exposed to greater price risk in the event of a sharp change in interest rates.
The market risks associated with the holding of corporate debt are identical to those for risk-free securities but credit risk is an additional concern. Credit risk, which is reflected in a spread over risk-free securities, can be highly volatile, particularly when unexpected corporate events occur. The development of corporate debt markets requires an adequate infrastructure to deal with asymmetric information problems and other capital market imperfections. The lack of appropriate corporate governance, transparency and economy-
32 The ability to short-sell and borrow a security promotes market liquidity. In this respect an important advantage
is that it reduces settlement failures and increases arbitrage opportunities. The favourable impact on liquidity is what led many developed economies to relax its restrictions on securities lending during the 1990s. Nevertheless, it is common in emerging markets to argue that short-selling increases market volatility. See CGFS (2000).
33 These are shocks that force a joint decline in output and government revenues. It should be noted that fixed-rate debt would be superior to inflation-indexed debt in such a case since the government could inflate away the real cost of debt servicing.

17
wide credit assessment capabilities may hide balance sheet weaknesses, potentially leaving investors exposed to corporate distress with systemic implications.
In addition to these more “traditional instruments”, the region is now starting to rely on new structures, such as asset-backed securities (ABS). The creation of such securities involves the packaging of a pool of illiquid assets into marketable securities that are more liquid and diversified in terms of microeconomic risk. A key requirement for the development of securitisation is that, in the event of a default by the original lenders, the securitised assets are protected from the creditors of the defaulting parties. This scenario of course requires appropriate legal frameworks.
As argued, the development of ABS has helped improve the efficiency and completeness of financial markets in some of the largest industrial countries, and is now rapidly expanding in Latin America (See Scatigna and Tovar (2007) and Gyntelberg et al (2007)). The diversified nature of underlying portfolios and the use of a variety of techniques to mitigate credit risk, such as over-collateralisation and third-party credit enhancements, have resulted in the creation of a new class of highly rated securities. However, such securities create important challenges as has now become evident from the US subprime mortgage market crisis. In fact, they may actually enhance the major failure of financial markets, asymmetric information, among other reasons for the lack of incentives by issuers of such securities to evaluate deeply the risk of the underlying debt, a problem that can be enhanced by the lack of transparency and the limited availability of good historical data for household finance products. All this may lead to greater uncertainty about the credit risk that investors are really holding. In fact, the capacity of forecasting agents to pay may be particularly difficult in a rapidly evolving macroeconomic environment, which is often characteristic of the Latin American economies. Not surprisingly, developed markets have already been exposed to the difficulties of assessing credit exposures appropriately.
Another important concern is the reliance on domestic credit rating agencies in the structured finance markets. Aside from major issues that have been analysed in the past (e.g., pro-cyclicality of ratings, unclear incentives associated to the way these agencies are financed and lack of regulation of their activities), the conflict of interest associated to the rating of complex structured products has been noticeable even in industrial countries markets.
Finally, an important issue to highlight is that the process of reserve accumulation may have important implications for debt sustainability. In particular, if reserve accumulation has to be financed by issuing domestic debt (say due to sterilisation), then it can leave net debt constant. This implies that any assessment of the duration of local currency debt needs to take into account the duration of assets because there will be offsetting interest rate exposures. Furthermore, the issuance of local currency liabilities to finance foreign currency assets creates a currency mismatch that is opposite to the traditional “short-dollar” mismatch, particularly in the balance sheets of central banks (Turner (2006) and Mohanty and Turner (2006)). As a result, an appreciation of the exchange rate would induce a deterioration of the net foreign asset position, also implying that the balance sheet implication of the nature of domestic debt depends on whether there are corresponding financial assets or not.
6. Conclusions
Latin America has witnessed an unprecedented cycle of growth, which has come along with major changes in its financing patterns. Favourable external conditions have led to unprecedented current account surpluses. This together with sustained capital flows, mainly based on foreign direct investment, have also led to a significant improvement of the region’s international investment position and to a rapid process of reserve accumulation, which has partly responded to an explicit self-insurance purpose. Such developments have been

18
complemented by the development of domestic bond markets, which have expanded at a pace that no one would had expected a decade ago.
Despite the progress made so far, it is an open question whether the surfacing of financing alternatives in domestic markets and the reduced reliance on external financing is permanent or not. It was argued that much of the progress made in the region was associated to the favourable external conditions. As some of the pillars of such environment have begun to erode, these new markets will have to prove their resilience. In this respect, progress in terms of eliminating currency mismatches seems to support favourably the prospects of region.
Nonetheless, their still dominant short term bias, the problems of liquidity that characterise at least some of them and which may become more acute during a strong market downswing, and the limited development of some market agents are some sources of risk. Nonetheless, it remains to be seen whether the progress made so far was enough as to allow the region to whether a more prolonged turmoil in global financial markets and to provide truly new room of manoeuvre for counter-cyclical macroeconomic policies in an environment where the bias towards exchange rate appreciation that attracted external and domestic resourses to the booming local bond markets would be absent.
On a more structural basis, the development of large and deep markets for corporate debt remains still an unfulfilled promised in most countries of the region. This is, therefore, an area where structural policies would have to be implemented in the region in the future. It may also posed problems for the management of cyclical swings, which in liberalised developing economies of today are more associated with swings in “twin” private/external deficits (or surpluses) rather than the “twin” external/public deficits that were characteristic of the past.
References
Acevedo, P, C Broto y E Alberola (2007): “Local debt expansion and vulnerability reduction: an assessment for six crisis-prone countries”, in BIS Papers 36, February 2008. BIS and FRB Atlanta, http://www.bis.org/publ/bppdf/bispap36f.pdf.
Amante, A, M Araujo and S Jeanneau (2007): “The search for liquidity in the Brazilian domestic government bond market”, BIS Quarterly Review, June, pp 69–82.
Ananchotikul, S and B Eichengreen (2008): “Plumbing for Latin American capital markets”, in BIS Papers 36, February 2008. BIS and FRB Atlanta, http://www.bis.org/publ/bppdf/bispap36g.pdf.
Bank for International Settlements (BIS) (2007a): Financial stability and local currency bond markets, CGFS Paper no. 28.
——— (2007b): Evolving banking systems in Latin America and the Caribbean: challenges and implications for monetary policy and financial stability, BIS Papers, no. 33.
——— (2005): Foreign exchange market intervention in emerging markets: motives, techniques and implications, BIS papers 24, May.
Bayliss, J (2004): “Emerging markets external debt as an asset class”, JP Morgan Emerging Markets Research.
Borensztein, E, B Eichengreen, and U Pannizza (2006): “Building bond markets in Latin America”, University of California-Berkeley, mimeo.
Burger, J and F Warnock (2003): “Diversification, original sin and international bond portfolios”, International Finance Discussion Papers, no 755, Federal Reserve Board, April.

19
Calvo, G and E Talvi (2007): “Current account surplus in Latin America: recipe against capital market crises”, in RGE, Latin America Monitor.
Committee on the Global Financial System (CGFS) (2000): Market liquidity: research findings and selected policy implications, March, Basel.
De la Torre, A and S Schmuckler (2007): Emerging capital markets and globalization: the Latin American experience. The World Bank and Standford University Press.
Economic Commission for Latin America and the Caribbean (ECLAC) (2006): Economic survey of Latin America and the Caribbean, 2005-2006, Santiago.
Eichengreen, B and Hausmann, R (2005): Other people’s money: debt denomination and financial instability in emerging market economies, Chicago University Press.
Eichengreen, B, A Rose and C Wyplosz (1996): “Contagious currency crises”; in Scandinavian Journal of Economics Vol. 98.
Goldstein, M and P Turner (2004): Controlling currency mismatches in emerging markets, Washington DC: Institute for International Economics.
Gyntelberg, J, E Remolona and C Tovar (2007): “Securitisation in Asia and Latin America compared”, in L Rob de Vries and P Ali (eds), Expansion and diversification in Securitization yearbook 2007, International Banking and Finance Law Series, Kluwer Law International.
Holand, A and C Mulder (2005): “Can indexed debt absolve original sin? Going indexed or is self-flagellation needed?”, presentation at the IMF-BCRP Conference, “The policy implications of de-facto dollarisation”, Lima, Peru, April.
Inter-American Development Bank (IADB) (2006): Living with debt: how to limit the risks of sovereign finance, Economic and Social Progress Report.
Jara, A and C Tovar (2008): “Monetary and financial stability implications of capital flows in Latin America and the Caribbean”, paper prepared for the BIS Open Economies Meeting. March 13-14 Punta del Este – Uruguay. Forthcoming as BIS Papers.
Jiang, G and R McCauley (2004): “Asian local currency bond markets”, BIS Quarterly Review, June, pp 67–79.
Jeanneau, S and C Pérez Verdia (2005): “Reducing financial vulnerability: the development of the domestic government bond market in Mexico”, BIS Quarterly Review, November, pp 61–71.
Jeanneau, S and C Tovar (2008a): “Latin America´s local currency bond market: an overview”, in BIS Papers 36, February 2008. BIS and FRB Atlanta, http://www.bis.org/publ/bppdf/bispap36d.pdf.
Jeanneau, S and C Tovar (2008b): “Financial stability implications of local currency bond markets: an overview of the risks”, in BIS Papers 36, February 2008. BIS and FRB Atlanta, http://www.bis.org/publ/bppdf/bispap36e.pdf.
Lane, P and M Ferretti (2007): “The External Wealth of Nationas Mark II: Revised and Extended Estimates of Foreign Assets and Liabilities, 1970–2004”, Journal of International Economics, Vol. 73, pp 223-250.
Lima, J, E Montes, C Varela and W Johannes (2006): “Sectoral balance sheet mismatches and macroeconomic vulnerabilities in Colombia, 1996–2003”, IMF Working Paper WP/06/5, revised 1/23/06, International Monetary Fund, Washington, DC.
Mohanty, M (2002): “Improving liquidity in government bond markets: what can be done?”, in BIS Papers, no. 11, The development of bond markets in emerging economies, Bank for International Settlements, Basel.

20
Mohanty, M and P Turner (2006): “Foreign exchange reserve accumulation in emerging markets: what are the domestic implications?”, in BIS Quarterly Review, September.
Ocampo, J A (2007): “La macroeconomia de la bonanza economica latinoamericana”, Revista de la CEPAL 93, pp 7-29.
——— and R Vos (2008): “Policy space and the changing paradigm in conducting macroeconomic policies in developing countries” in New Financing Trends in Latin America: A Bumpy Road towards Stability, BIS Papers, No. 36, February 2008, BIS and FRB Atlanta, http://www.bis.org/publ/bppdf/bispap36c.pdf.
Rosenberg, C, I Halikias, B House, C Keller and J Nystedt (2005): “Debt-related vulnerabilities and financial crises”, IMF Occasional Paper No. 240, International Monetary Fund, Washington.
Scatigna, M and C Tovar (2007): “Securitisation in Latin America”, BIS Quarterly Review, pp 71-82, September.
Tovar, C (2005): “International government debt denominated in local currency: recent developments in Latin America”, BIS Quarterly Review, pp 109–118, December.
Turner, P (2006): “Local currency bonds in emerging markets: what are the links with financial stability?”, paper prepared for the BIS sponsored session in the 2006 LACEA annual meeting “The development of domestic bond markets: achievements challenges and implications for financial stability”.
Turner, P (2003): “Bond market development: what are the policy issues?”, in R. E. Litan, M. Pormerleano, M and V Sundararajan (eds), The future of domestic capital markets in developing countries, Washington DC: Brookings Institution Press.
United Nations (2006): World Economic and Social Survey 2006: Diverging Growth and Development, New York. United Nations.
__________ (2008): World Economic Situation and Prospects 2008, New York: United Nations.
Wooldridge, P, D Domanski and A Cobau (2003): “Changing links between mature and emerging financial markets”, BIS Quarterly Review, December, pp 45–54.

20
Tables and Figures

21
Table 1
Determinants of Latin America’s balance of payments improvement Percentage of GDP
1998 1999 2000 2001 2002 2003 2004 2005 2006 2007 2000 vs
1998
2003 vs
2000
2007 vs
2003 Latin America and the Caribbean (LAC)
Current account balance -4.4 -3.0 -2.4 -2.8 -1.0 0.4 1.0 1.5 1.6 0.7 2.0 2.8 0.3
Terms of trade effect -1.3 -1.0 0.0 -0.7 -0.7 -0.3 0.8 1.8 3.0 3.4 1.3 -0.3 3.7
Net of terms of trade effect -3.0 -2.1 -2.4 -2.1 -0.2 0.7 0.2 -0.3 -1.4 -2.7 0.6 3.1 -3.4
Foreign direct investment 3.0 4.4 3.6 3.4 2.7 2.1 2.3 1.9 0.9 2.3 0.5 -1.5 0.2
Financial Capital 0.4 -2.1 -0.4 -1.5 -3.2 -1.9 -2.6 -1.2 -0.5 0.5 -0.8 -1.5 2.4
Global Balance -0.9 -0.7 0.8 -0.8 -1.5 0.6 0.7 2.2 2.0 3.5 1.7 -0.2 2.9
Sources: ECLAC.
22
Figure 1
Determinants of Latin America’s balance of payments improvement As a percentage of GDP
–5.0
–4.0
–3.0
–2.0
–1.0
0.0
1.0
2.0
98 99 00 01 02 03 04 05 06 07
Current account balance Net of terms of trade effect
Source: ECLAC.

23
Figure 2
Resistance to exchange market pressures and sterilization coefficient1 Index of resistance to exchange market pressures2
Sterilization coefficient3
0.00
0.25
0.50
0.75
1.00
1.25
1.50
91 93 95 97 99 01 03 05 07
Caribbean Central AmericaLatin America
0.00
0.25
0.50
0.75
1.00
1.25
1.50
91 93 95 97 99 01 03 05 071 For a list of countries for the regions see Annex to section 2. 2 Unweighted averages of country-specific indices. The index of resistance to exchange market pressures is a ratio measuring the proportion of exchange market pressures that are resistedthrough intervention. For each country the index is obtained dividing the changes in foreign reserves by EMP index. This ratio is then standardized to create an index of the degree of resistance to changes in exchange rates with values between 0 and 1,where values closer to 1 imply a greater degree of resistance to exchange rate fluctuations. 3 Unweighted averages of country-specific indices. The sterilization coefficient captures the extent to which the monetary authorities are able to insulatedomestic liquidity from foreign exchange market intervention. Specifically, it measures the degree to which the monetaryauthorities contracted domestic credit to offset the expansion of the monetary base associated with the accumulation of foreignreserves. A value of the coefficient equal to (or above) unity implies full sterilization, whereas a value of zero (or a negativevalue) represents no sterilization.
Sources: Jara and Tovar (2008) based on Datastream; IMF, International Financial Statistics; BIS staff calculations.

24
Table 2 Measures of reserves adequacy and interest rate differential1
Foreign exchange reserves as a percentage of: 3 Foreing exchange reserves2 Short-term
external debt4 Broad money5 Imports
Nominal interest rate differential6
2004 Jun 2007
2004 Jun 2007
2004 Jun 2007
2004 2007 2004 2007
Latin America 197.0 350.9 163.5 259.4 30.9 32.6 70.1 82.0
Argentina 18.0 41.5 27.7 278.8 38.7 57.2 84.5 101.6 5.4 6.1
Brazil 52.5 146.4 133.8 279.5 14.7 19.3 83.5 127.6 15.8 6.7
Chile 15.5 17.7 148.7 109.5 30.4 21.7 67.5 43.1 2.0 1.4
Colombia 12.8 19.2 364.3 185.0 51.7 42.5 80.4 59.6 6.8 4.0
Mexico 62.8 77.0 195.7 279.3 33.1 31.3 31.9 26.3 5.4 2.7
Peru 12.2 21.0 177.2 255.9 61.8 75.6 124.0 116.6 2.1 0.6
Venezuela 17.9 16.3 350.0 283.8 76.1 28.6 105.0 36.9 11.6 4.5 1 End of period. 2 In billions of US dollars. 3 Regional aggregates are the weighted average based on 2000 GDP and PPP exchange rates of the listed countries. 4 Defined as liabilities to BIS reporting banks and international bonds with maturity of less than one year; regional aggregates exclude Bolivia and Suriname. 5 Defined as M2. 6 In percentage points, latest data available in the IMF IFS, defined as the difference between the local and the US treasury bill rate (line 60c IMF IFS); average yield at issue for Argentina (Lebac, twelve months), Chile (BCP, two years), Colombia (TES, 182 days), Peru (Government bonds, secondary market), and Venezuela (LT, up to 91 days).
Sources: IMF; national data.

25
Figure 3
Carry cost of international reserves1
2004 2007
–0.5
0.0
0.5
1.0
1.5
2.0
2.5
AR BO BR CL CO MX PE UY VE–0.5
0.0
0.5
1.0
1.5
2.0
2.5
AR BO BR CL CO MX PE UY VE
AR = Argentina, BO = Bolivia, BR = Brazil, CL = Chile, CO = Colombia, MX = Mexico, PE = Peru, UY = Uruguay,VE = Venezuela. 1 Defined as the difference in local currency returns of the foreign exchange reserves between the local and the US treasurybill rate (line 60c, IMF IFS); as a percentage of GDP. The local rates for Argentina are the rates at issue of the Lebac notes with a maturity of one year, for Chile, Central Bank issues with a maturity of two years, for Colombia, TES with a maturity of182 days, for Peru, Government bonds, secondary market, for Venezuela LT, with a maturity up to 91 days.
Sources: IMF; national data.

26
Figure 4
Latin America: capital flows1 As a percentage of regional GDP
Inflows Outflows Net flows2
–4.0 –2.0 0.0 2.0 4.0 6.0 8.0 10.0
90 94 98 02 06
Portfolio investment Other investmentDirect investment
–4.0
–2.0
0.0
2.0
4.0
6.0
8.0
10.0
90 94 98 02 06
Reserve assetsPortfolio assetsOther assetsDirect investment abroad
–5.0
–2.5
0.0
2.5
5.0
7.5
10.0
12.5
90 94 98 02 06
Portfolio investment, netOther investment, netDirect investment, netPrivate capital flows, netTotal net flows
1 Latin America includes Argentina, Bolivia, Brazil, Chile, Colombia, Ecuador, Mexico, Paraguay, Peru, Suriname, Uruguayand Venezuela. 2 A positive figure indicates a positive capital inflow to the region. Total net flows are the sum of the netfigures of direct investment, portfolio investment and other investment.
Source: IMF, World Economic Outlook.

27
Table 3
Regional International Investment Positions Percentage of GDP at current prices
2001 2002 2003 2004 2005 2006
Assets 27.6 31.1 33.4 33.1 32.8 34.3 FDI abroad 6.0 7.3 7.3 7.5 7.3 8.0 Portfolio 2.2 2.5 3.3 3.4 3.6 4.2 Derivatives 0.0 0.0 0.0 0.1 0.0 0.0 Other investments 12.6 13.9 14.0 13.2 11.9 11.5 International reserves 6.8 7.5 8.7 8.9 9.9 10.6 Liabilities 64.9 68.5 73.6 69.6 64.1 63.8 FDI 22.5 26.7 29.9 29.4 27.9 27.1 Portfolio 20.6 21.0 24.2 24.0 23.7 25.2
Equity 5.7 5.1 7.5 8.8 10.9 13.7 Debt 14.8 15.9 16.6 15.2 12.8 11.5
Derivatives 0.0 0.0 0.0 0.1 0.1 0.2 Other investments 18.8 20.7 19.5 16.1 12.4 11.3 Assets - Liabilities -37.3 -37.4 -40.2 -36.6 -31.4 -29.6 FDI -19.5 -19.4 -22.6 -21.9 -20.6 -19.1 Financial -17.8 -17.9 -17.6 -14.7 -10.8 -10.5 Reserves as a % of debt 20.3 20.4 24.0 28.3 39.1 46.5 Reserves as a % of portfolio liabilitites
33.1 35.5 35.9 37.0 41.6 42.1
Assets – Liabilities Argentina -0.3 19.8 20.1 22.0 29.5 26.2 Brasil -34.9 -36.4 -35.2 -31.0 -24.1 -24.3 Chile -3.2 -1.5 3.9 13.5 17.2 27.7 Colombia -15.6 -15.6 -16.8 -11.8 -6.1 -3.7 Mexico -19.3 -18.3 -20.4 -20.4 -21.3 -23.8 Peru -29.4 -27.7 -26.4 -21.3 -14.4 -7.5 Venezuela 23.9 35.9 48.7 44.6 49.5 51.6 International reserves as % of portfolio liabilities
Argentina 2.2 -14.2 1.7 19.6 67.6 72.8 Brasil 18.1 13.1 13.6 15.7 23.1 28.6 Chile 142.4 145.8 108.3 98.9 93.3 98.3 Colombia 78.8 88.1 84.2 91.8 102.7 96.8 Mexico 30.8 41.6 42.7 39.0 35.8 30.0 Peru 131.1 125.4 105.2 114.4 91.7 98.2 Venezuela 113.5 93.8 111.4 109.4 123.9 161.7
Note: Liabilities with the IMF are not included. 1 Argentina, Brazil, Chile, Colombia, Mexico, Peru and Venezuela 2 Liabilities with the IMF are not included.
Source: Ocampo (2007) based on IMF, ECLAC.

28
Figure 5 Emerging market debt securities outstanding
In billions of US dollars
Domestic debt securities International debt securities
0
500
1,000
1,500
2,000
2,500
3,000
3,500
94 95 96 97 98 99 00 01 02 03 04 05 06 07
Asia1
Latin America2
Central Europe3
Other developing markets4
0
500
1,000
1,500
2,000
2,500
3,000
3,500
94 95 96 97 98 99 00 01 02 03 04 05 06 07
1 China, India, Indonesia, Korea, Malaysia, the Philippines, Taiwan (China), and Thailand. 2 Argentina, Brazil, Chile, Colombia, Mexico, Peru and Venezuela. 3 The Czech Republic, Hungary, Poland and Russia. 4 South Africa and Turkey.
Source: BIS

29
Table 4 Size of local fixed income markets in Latin America, 2005
Of which: Stock of fixed income
securities Government short-term
Government long-term
Non-financial corporate long-
term
USD billions % of GDP USD billions USD billions USD billions
Argentina 59.7 33 5.1 43.8 10.8 Brazil 583.4 74 226.7 318.2 38.5 Chile 39.8 35 9.2 17.3 13.3 Colombia 38.7 32 0.9 33.2 4.6 Mexico 158.5 21 52.0 89.1 17.4 Peru 7.9 10 1.4 4.3 2.2 Venezuela 7.2 5 3.4 3.7 0.1 Total 895.2 41 298.7 509.6 86.9
Memo:
United States 9,043.5 72 1,474.5 4,873.3 2,695.7
Note: Securities issued by financial institutions are not included in non-financial corporate fixed income securities.
Sources: Fedesarrollo; national authorities; BIS.
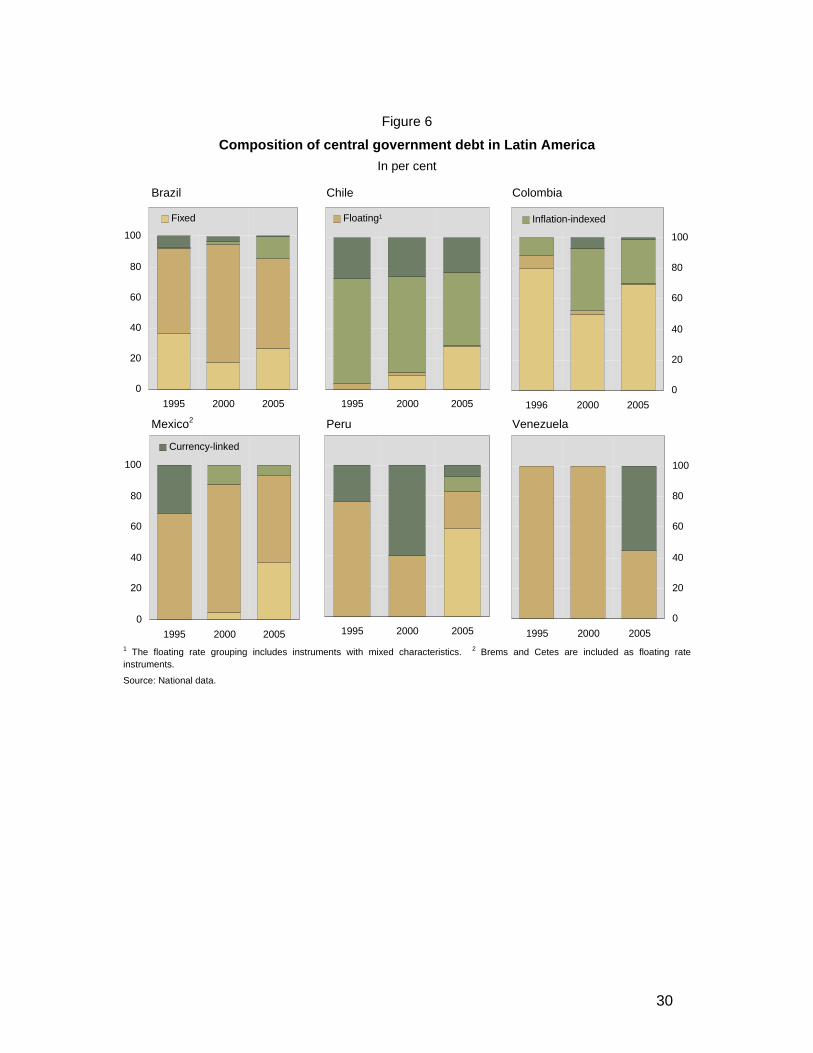
30
Figure 6
Composition of central government debt in Latin America In per cent
Brazil Chile Colombia
0
20
40
60
80
100
1995 2000 2005
Fixed
1995 2000 2005
Floating¹
0
20
40
60
80
100
1996 2000 2005
Inflation-indexed
Mexico2 Peru Venezuela
0
20
40
60
80
100
1995 2000 2005
Currency-linked
1995 2000 20050
20
40
60
80
100
1995 2000 2005 1 The floating rate grouping includes instruments with mixed characteristics. 2 Brems and Cetes are included as floating rate instruments.
Source: National data.

31
Figure 7
Maturities of domestic fixed rate local currency government bonds In years
Argentina1 Brazil4 Chile5 Colombia6
0
10
20
30
01 02 03 04 05 06 07
Average² Maximum³
0
0
0
0
01 02 03 04 05 06 07
Global issues
0
0
0
0
01 02 03 04 05 06 070
10
20
30
01 02 03 04 05 06 07
Mexico7 Peru8 Venezuela9
0
10
20
30
01 02 03 04 05 06 070
0
0
0
01 02 03 04 05 06 070
10
20
30
01 02 03 04 05 06 07
1 Treasury bills, Lebac and Nobac; excluding the treasury bill issued on 14 February 2002. 2 Weighted average of new issues; weighted by the amounts issued (excluding global issues). 3 Remaining time to expiration at the end of the year (for 2007, 4 August 2007) of the issue with the longest outstanding maturity (excluding global issues); only bonds issued in 2001 or later. 4 LTN, NTN-F and global issues. 5 Central bank issues. 6 TES and global issues; only national government issues are included. 7 Cetes and government bonds. 8 Certificates of deposit, treasury bills and government bonds; excluding government bonds issued on 13 October2004 and 31 January 2005. 9 Treasury bills and government bonds.
Sources: Bloomberg; national data.

32
Figure 8
Yield curves of domestic fixed rate local currency government bonds1 In per cent
Argentina2 Brazil3 Chile4 Colombia5
0
5
10
15
20
25
30
0 5 10 15 20 25 30
May 03 Oct 05May 06 Jul 07
0
5
10
15
20
25
30
0 5 10 15 20 25 30
Jun 03Feb 05May 06Jun 07
0
5
1
1
2
2
3
0 5 10 15 20 25 30
May 03Feb 05Mar 06Jul 07
0
5
10
15
20
25
30
0 5 10 15 20 25 30
May 03May 05Mar 06 Apr 07
Mexico6 Peru7 Venezuela8
0
5
10
15
20
25
30
0 5 10 15 20 25 30
Oct 03Feb 05Feb 06Jul 07
0
5
10
15
20
25
30
0 5 10 15 20 25 30
Dec 04Mar 05May 06May 07
0
5
10
15
20
25
30
0 5 10 15 20 25 30
Jan 04Dec 04May 06 Nov 06 Aug 07
1 Remaining maturities in years. 2 Lebac. 3 Swap rates; long-term; government bonds (NTN-F). 4 Central bank issues. 5 Zero coupon yield curve. 6 Cetes and government bonds. 7 Government bonds, secondary market. 8 Government bonds (Vebonos and TIF), last auction in the month.
Source: National data.

33
Figure 9
Economic indicators for Latin America1
Inflation and fiscal balance External debt2
0
3
6
9
12
1995 1997 1999 2001 2003 2005 2007–4
–3
–2
–1
0
Fiscal balance (lhs)²Inflation (rhs)
0
12
24
36
48
1995 1997 1999 2001 2003 2005 2007
Short-term interest rate3 Exchange rate against USD5
0
8
16
24
32
1995 1997 1999 2001 2003 2005 20070
3
6
9
Level (rhs)Volatility (lhs)4
50
80
110
140
170
1995 1997 1999 2001 2003 2005 20070
4
8
12
16
Level (rhs)Volatility (lhs)4
1 Weighted average of Argentina, Brazil, Chile, Colombia, Mexico, Peru and Venezuela based on 2000 GDP and PPPexchange rates. 2 As a percentage of GDP. 3 Three-month; in per cent. 4 Twelve-month rolling standard deviation. 5 1995–2003 = 100; an increase indicates an appreciation.
Sources: IMF; Economic Commission for Latin America and the Caribbean; JP Morgan; Latin Focus; national data.

34
Table 5
Indicators of secondary market liquidity in local government securities markets in 2005
Annual turnover
Billions of US dollars
Percentage of outstanding securities
Bid-ask spread Average size of
transaction related to bid-ask
spread
Argentina 91.5 187 10–50 bp on fixed rate and inflation-indexed bonds
USD 1m
Brazil 433.0 79 5 bp on fixed rate bonds BRL 10–50m
Chile 26.0 98 5 bp on fixed rate bonds 5–10 bp on inflation-indexed bonds
CLP 100m UF 100,000
Colombia 45.0 132 3–5 bp on fixed rate bonds COP 2billion
Mexico 696.7 494 3–5 bp on fixed rate bonds 5–15 bp on inflation-indexed bonds
MXN 50–100m MXN 5–10m
Peru 2.6 46 10–20 bp on fixed rate bonds
USD 1m
Venezuela 2.8 39 50–100 bp on floating rate bonds
VEB 2.4billion
Total 1,297.6 160 ... ...
Memo: United States 138,756.0 2,186 0.8–1.6 bp on fixed rate
bonds USD 25m
Note: Annual turnover data for Latin American countries correspond to secondary market transactions reported by major dealers and money management firms to Emerging Markets Trading Association (EMTA). Annual turnover for the United States is based on daily inter-dealer transactions in US Treasury securities as reported in the Statistical Supplement to the Federal Reserve Bulletin.
Sources: Sack and Elsasser (2004); Federal Reserve Board; IMF; Citigroup; EMTA; JPMorgan Chase; BIS.

35
Table 6
Domestic bond market correlations and returns January 2003 – February 2008
GBI-EM1 Correlations
Brazil3 Chile Colombia Mexico Lat Am Asia Europe EMBI2
10-yr US Treasury
bond Brazil3 1.00
Chile 0.37 1.00
Colombia 0.50 0.28 1.00
Mexico 0.60 0.52 0.42 1.00
Lat Am 0.85 0.51 0.68 0.86 1.00
Asia 0.43 0.29 0.44 0.34 0.49 1.00
GBI-EM1
Europe 0.26 0.33 0.30 0.26 0.31 0.47 1.00
EMBI2 0.49 0.34 0.40 0.51 0.53 0.42 0.44 1.00
Ten-year US Treasurybond 0.04 0.13 0.07 0.19 0.12 0.26 0.29 0.61 1.00
Returns
2003 21.70 27.67 19.46 7.12 16.45 7.91 14.19 22.31 1.23
2004 20.86 11.89 43.45 3.10 12.92 3.09 27.70 11.30 4.84
2005 37.63 18.18 23.01 23.05 23.58 5.17 4.95 10.80 2.23
2006 31.71 3.16 8.01 10.91 18.89 12.49 14.91 9.77 1.47
2007 32.14 16.56 14.30 3.19 16.77 11.10 23.28 6.30 9.64
Cumulative 313.40 119.71 165.87 62.33 133.26 51.39 121.01 77.20 25.391 GBI-EM Broad Diversified. 2 EMBI Global Diversified. 3 Sample starting in May 2003.
Source: Authors’ calculations based on JPMorgan Chase data.

36
Table 7
Domestic bond market Sharpe ratios1 January 2003 – February 2008
GBI-EM2 Sharpe ratios Brazil4 Chile Colombia Mexico Lat Am Asia Europe
EMBI3
2003 0.70 0.30 0.26 0.13 0.30 0.23 0.13 0.84
2004 0.24 0.27 0.68 0.03 0.28 -0.12 0.53 0.50
2005 0.76 0.32 0.76 0.60 0.84 0.04 0.00 0.41
2006 0.26 0.20 0.01 0.23 0.26 0.43 0.33 0.38
2007 0.39 0.12 0.11 0.00 0.23 0.07 0.40 -0.08
2003-2007 0.43 0.29 0.27 0.17 0.33 0.14 0.29 0.331 US 10-yr treasury bond as a benchmark. 2 GBI-EM Broad Diversified. 3 EMBI Global Diversified. 4 Sample starting in April 2003.
Source: Authors’ calculations based on JPMorgan Chase data.
37
Figure 10
Currency mismatches
1998 2002 20074
EU² AS³
VEPE
MX CO
CL BR
AR
LA¹
0
0
0
0
0.0 0.2 0.4 0.6
EU²
AS³
VE
PE
MX
COCL
BR
AR
LA¹
0.
0.
0.
0.
0.0 0.2 0.4 0.6
EU²
AS³VE
PE
MX CO CL
BR
AR
LA¹
0.0
0.2
0.4
0.6
0.0 0.2 0.4 0.6
Fore
ign
curre
ncy
debt
/Tot
al d
ebt
Exports/GDP
1 For Latin America, weighted average of Argentina, Brazil, Chile, Colombia, Mexico, Peru and Venezuela based on 2000GDP and PPP exchange rates. 2 For emerging Europe, weighted average of Czech Republic, Hungary, Russia andTurkey based on 2000 GDP and PPP exchange rates. 3 For emerging Asia, weighted average of China, India, Indonesia, Korea, Malaysia, Philippines and Thailand based on 2000 GDP and PPP exchange rates. 4 Debt data up to September.
Source: BIS calculations.

38
Table 8
External positions of banks As a percentage of total assets
1990-97 1998-2003 2004 2005 2006 2007
Latin America1 –10.5 –5.03 –2.84 –2.03 –2.15 –2.03Argentina –8.78 –9.01 –7.09 –4.26 –3.05 –1.68Bolivia –7.38 3.2 8.5 11.5 11.4 8.7Brazil –6.32 –6.67 –3.41 –2.07 –1.67 –2.17Chile –9.6 –0.43 –3.51 –3.22 –1.57 –1.23Colombia –11.82 –7.03 1.0 –0.18 1.0 0.4Ecuador –10.54 5.4 18.7 18.3 17.4 17.6Mexico –22.39 –3.87 –5.08 –4.58 –7.08 –3.78Paraguay 4.4 11.7 13.9 10.6 7.8 6.2Peru 4.4 –2.65 0.6 0.2 2.6 2.7Uruguay 2.2 0.8 16.8 16.3 16.6 19.0Venezuela 4.4 4.3 5.8 3.6 3.7 3.8
Memo: Emerging markets2
–1.35 1.0 1.7 2.0 2.0 2.0Asia3
–0.2 2.6 2.7 3.7 4.1 3.4Central Europe4
4.2 2.4 4.3 4.7 4.7 4.7Middle East5
13.0 6.5 9.2 8.2 10.1 10.1Other emerging6
3.6 2.1 –0.17 –2.23 –3.99 –4.74Canada
–3.57 –0.82 0.3 0.3 0.4 0.4United States
–1.29 –0.89 –4.39 –3.65 –4.18 –3.51 Weighted average based on 2000 GDP and PPP exchange rates of the countries shown. 2 Includes Asia, Caribbean, Central America, Central Europe, Latin America, Middle East, Other emerging. 3 Includes China, Hong Kong SAR, Indonesia, Korea, Malaysia, Philippines, Taiwan (China) and Thailand. 4 Czech Republic, Hungary and Poland. 5 Includes Bahrain, Egypt, Iran, Jordan, Kuwait, Lebanon, Libya, Oman, Qatar, Saudi Arabia, Syria, United Arab Emirates. 6 Includes Russia, South Africa and Turkey.
Source: Jara and Tovar (2008) based on IMF IFS.

39
Figure 11
Short-term external debt1
As a percentage of FX reserves As a percentage of total debt
0
75
150
225
300
95 97 99 01 03 05 07
ArgentinaBrazilChileMexicoLA²
0
10
20
30
40
95 97 99 01 03 05 07
As a percentage of FX reserves As a percentage of total debt
0
40
80
120
160
95 97 99 01 03 05 07
ColombiaPeruVenezuelaLA²
0
10
20
30
40
95 97 99 01 03 05 071 Short-term liabilities (with maturity of less than one year) to BIS reporting banks. 2 Weighted average of Argentina, Brazil, Chile, Colombia, Mexico, Peru and Venezuela based on 2000 GDP and PPP exchange rates.
Sources: IMF; BIS.

40
Figure 12
Volatility of local currency bond returns1
0
5
10
15
20
02 03 04 05 06 07 08
United States Emerging Asia²
0
5
1
1
2
02 03 04 05 06 07 08
Latin America³
0
5
10
15
20
02 03 04 05 06 07 08
Emerging Europe4
0
10
20
30
40
02 03 04 05 06 07 08
LatinAmerica³Brazil
0
1
2
3
4
02 03 04 05 06 07 08
Chile
0
10
20
30
40
02 03 04 05 06 07 08
Colombia
0
10
20
30
40
02 03 04 05 06 07 08
Mexico
Shaded areas represent periods of market unrest: May-Jun 2006; Feb-Mar 2007; 25 Jun 2007 onwards. 1 Calculated as the standard deviation of daily percentage changes in the return index, with a 30-day moving window, annualised. Data refer to unhedged returns in US dollars of JPMorgan's traded index. 2 China, India, Indonesia, Malaysia and Thailand. 3 Brazil, Chile, Colombia, Mexico and Peru. 4 The Czech Republic, Hungary, Poland, Russia, Slovakia and Turkey.
Source: JPMorgan Chase.