jordanian insurance sector ranking & market share as of december 31, 2015
TRANSCRIPT

Tariq Al-Basha MARKET RESEARCHER | AMMAN - JORDAN
Jordanian Insurance Sector Ranking & Market Share as of December 31, 2015 FIRST VERSION: DECEMBER 2, 2016
Tariq Al-Basha – [email protected] – 00962 7 9767 7418
Page 1 of 27
Contents Executive Summary ....................................................................................................................................... 2
MIDDLE EAST INSURANCE ............................................................................................................................. 3
AL-NISR AL-ARABI INSURANCE ...................................................................................................................... 4
JORDAN INSURANCE ..................................................................................................................................... 5
ARABIA INSURANCE COMPANY – JORDAN ................................................................................................... 6
DELTA INSURANCE ........................................................................................................................................ 7
JERUSALEM INSURANCE ............................................................................................................................... 8
THE UNITED INSURANCE ............................................................................................................................... 9
JORDAN FRENCH INSURANCE ..................................................................................................................... 10
THE HOLY LAND INSURANCE....................................................................................................................... 11
AL-MANARA INSURANCE PLC.CO. ............................................................................................................... 12
ARAB ORIENT INSURANCE COMPANY ........................................................................................................ 13
JORDAN EMIRATES INSURANCE COMPANY P.S.C ....................................................................................... 14
ARAB LIFE & ACCIDENT INSURANCE ........................................................................................................... 15
PHILADELPHIA INSURANCE ......................................................................................................................... 16
ARAB UNION INTERNATIONAL INSURANCE ................................................................................................ 17
NATIONAL INSURANCE ............................................................................................................................... 18
JORDAN INTERNATIONAL INSURANCE ....................................................................................................... 19
EURO ARAB INSURANCE GROUP ................................................................................................................ 20
THE ISLAMIC INSURANCE ............................................................................................................................ 21
THE ARAB ASSURERS INSURANCE COMPANY ............................................................................................. 22
ARAB JORDANIAN INSURANCE GROUP ...................................................................................................... 23
THE MEDITERRANEAN & GULF INSURANCE COMPANY-JORDAN P.L.C ...................................................... 24
FIRST INSURANCE ........................................................................................................................................ 25
About the Author: Tariq Al-Basha ............................................................................................................... 26
Tariq Al-Basha – [email protected] – 00962 7 9767 7418
Page 2 of 27
Executive Summary
The aim of this market research is to study the Jordanian Insurance Companies in terms of their
ranking and market share of the selected items researched.
Each insurance company has 4 sections, the first section shows the symbol of the insurance
company in Amman Stock Exchange, the year of establishment, listing date and the operating
and public shareholding years of experience.
The second section lists selected items of the balance sheet and income statement for three fiscal
years (2013-2015) where it shows the total amount of these items, provides its 3-year average,
and analyzes the growth and decline percentages between 2014 & 2013 and 2015 & 2014.
The third section lists the ranking of the insurance company in terms of the selected items and
provides an indicator to facilitate the reading of the user in which such indicator shows if the
company moved up, moved down, or kept its ranking in the concerned operating year.
The last and fourth section presents the market share of each item selected in the Jordanian
Market where it also provides an indicator to show whether the company won or lost its market
share.
Finally, it is worth noting that Jordan has 23 listed insurance companies where this market
research study has included all of them.
Tariq Al-Basha – [email protected] – 00962 7 9767 7418
Page 3 of 27
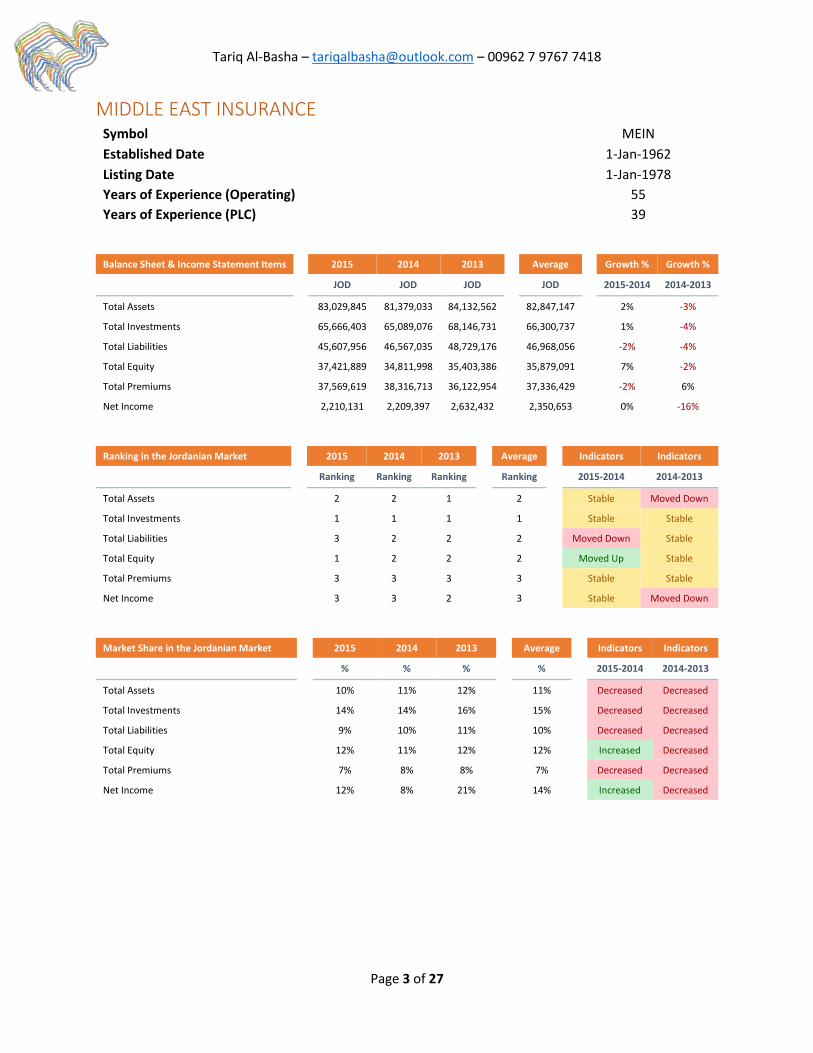
MIDDLE EAST INSURANCE Symbol MEIN
Established Date 1-Jan-1962
Listing Date 1-Jan-1978
Years of Experience (Operating) 55
Years of Experience (PLC) 39
Balance Sheet & Income Statement Items 2015 2014 2013 Average Growth % Growth %
JOD JOD JOD JOD 2015-2014 2014-2013
Total Assets 83,029,845 81,379,033 84,132,562 82,847,147 2% -3%
Total Investments 65,666,403 65,089,076 68,146,731 66,300,737 1% -4%
Total Liabilities 45,607,956 46,567,035 48,729,176 46,968,056 -2% -4%
Total Equity 37,421,889 34,811,998 35,403,386 35,879,091 7% -2%
Total Premiums 37,569,619 38,316,713 36,122,954 37,336,429 -2% 6%
Net Income 2,210,131 2,209,397 2,632,432 2,350,653 0% -16%
Ranking in the Jordanian Market 2015 2014 2013 Average Indicators Indicators
Ranking Ranking Ranking Ranking 2015-2014 2014-2013
Total Assets 2 2 1 2 Stable Moved Down
Total Investments 1 1 1 1 Stable Stable
Total Liabilities 3 2 2 2 Moved Down Stable
Total Equity 1 2 2 2 Moved Up Stable
Total Premiums 3 3 3 3 Stable Stable
Net Income 3 3 2 3 Stable Moved Down
Market Share in the Jordanian Market 2015 2014 2013 Average Indicators Indicators
% % % % 2015-2014 2014-2013
Total Assets 10% 11% 12% 11% Decreased Decreased
Total Investments 14% 14% 16% 15% Decreased Decreased
Total Liabilities 9% 10% 11% 10% Decreased Decreased
Total Equity 12% 11% 12% 12% Increased Decreased
Total Premiums 7% 8% 8% 7% Decreased Decreased
Net Income 12% 8% 21% 14% Increased Decreased

Tariq Al-Basha – [email protected] – 00962 7 9767 7418
Page 4 of 27
AL-NISR AL-ARABI INSURANCE Symbol AAIN
Established Date 1-Jan-1979
Listing Date 1-Jan-1989
Years of Experience (Operating) 38
Years of Experience (PLC) 28
Balance Sheet & Income Statement Items 2015 2014 2013 Average Growth % Growth %
JOD JOD JOD JOD 2015-2014 2014-2013
Total Assets 66,958,008 58,006,902 51,442,475 58,802,462 15% 13%
Total Investments 52,337,782 43,481,732 38,018,078 44,612,531 20% 14%
Total Liabilities 45,676,929 36,989,187 30,841,932 37,836,016 23% 20%
Total Equity 21,281,079 21,017,715 20,600,543 20,966,446 1% 2%
Total Premiums 29,892,791 25,786,184 22,197,394 25,958,790 16% 16%
Net Income 2,438,730 1,978,906 1,433,699 1,950,445 23% 38%
Ranking in the Jordanian Market 2015 2014 2013 Average Indicators Indicators
Ranking Ranking Ranking Ranking 2015-2014 2014-2013
Total Assets 4 4 4 4 Stable Stable
Total Investments 2 3 3 3 Moved Up Stable
Total Liabilities 2 3 4 3 Moved Up Moved Up
Total Equity 6 6 6 6 Stable Stable
Total Premiums 4 5 5 5 Moved Up Stable
Net Income 2 4 3 3 Moved Up Moved Down
Market Share in the Jordanian Market 2015 2014 2013 Average Indicators Indicators
% % % % 2015-2014 2014-2013
Total Assets 8% 8% 7% 8% Increased Increased
Total Investments 11% 9% 9% 10% Increased Increased
Total Liabilities 9% 8% 7% 8% Increased Increased
Total Equity 7% 7% 7% 7% Decreased Decreased
Total Premiums 6% 5% 5% 5% Increased Increased
Net Income 13% 7% 11% 11% Increased Decreased
Tariq Al-Basha – [email protected] – 00962 7 9767 7418
Page 5 of 27
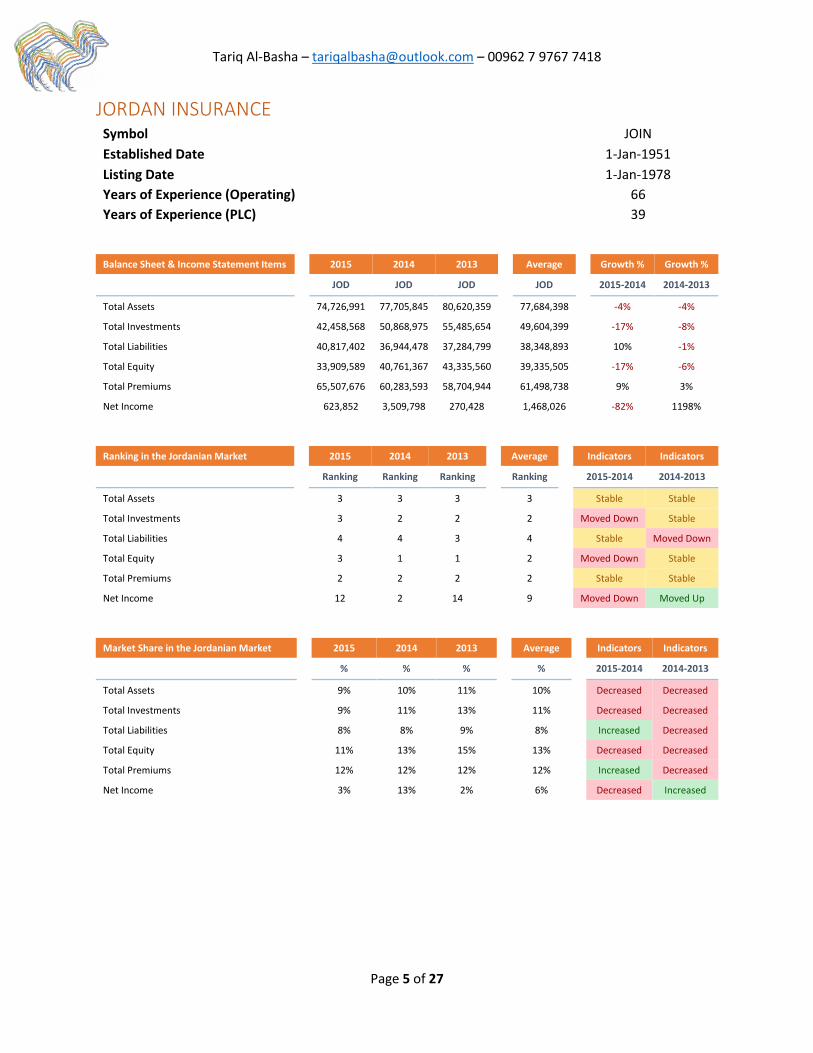
JORDAN INSURANCE Symbol JOIN
Established Date 1-Jan-1951
Listing Date 1-Jan-1978
Years of Experience (Operating) 66
Years of Experience (PLC) 39
Balance Sheet & Income Statement Items 2015 2014 2013 Average Growth % Growth %
JOD JOD JOD JOD 2015-2014 2014-2013
Total Assets 74,726,991 77,705,845 80,620,359 77,684,398 -4% -4%
Total Investments 42,458,568 50,868,975 55,485,654 49,604,399 -17% -8%
Total Liabilities 40,817,402 36,944,478 37,284,799 38,348,893 10% -1%
Total Equity 33,909,589 40,761,367 43,335,560 39,335,505 -17% -6%
Total Premiums 65,507,676 60,283,593 58,704,944 61,498,738 9% 3%
Net Income 623,852 3,509,798 270,428 1,468,026 -82% 1198%
Ranking in the Jordanian Market 2015 2014 2013 Average Indicators Indicators
Ranking Ranking Ranking Ranking 2015-2014 2014-2013
Total Assets 3 3 3 3 Stable Stable
Total Investments 3 2 2 2 Moved Down Stable
Total Liabilities 4 4 3 4 Stable Moved Down
Total Equity 3 1 1 2 Moved Down Stable
Total Premiums 2 2 2 2 Stable Stable
Net Income 12 2 14 9 Moved Down Moved Up
Market Share in the Jordanian Market 2015 2014 2013 Average Indicators Indicators
% % % % 2015-2014 2014-2013
Total Assets 9% 10% 11% 10% Decreased Decreased
Total Investments 9% 11% 13% 11% Decreased Decreased
Total Liabilities 8% 8% 9% 8% Increased Decreased
Total Equity 11% 13% 15% 13% Decreased Decreased
Total Premiums 12% 12% 12% 12% Increased Decreased
Net Income 3% 13% 2% 6% Decreased Increased
Tariq Al-Basha – [email protected] – 00962 7 9767 7418
Page 6 of 27
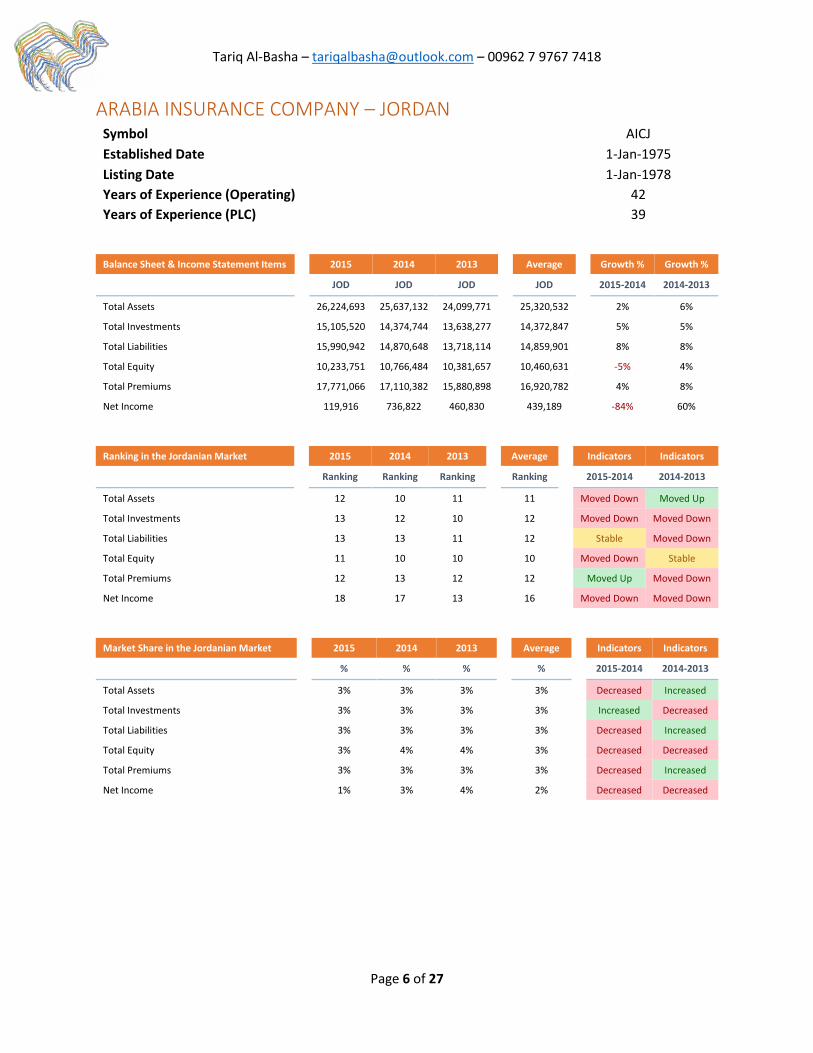
ARABIA INSURANCE COMPANY – JORDAN Symbol AICJ
Established Date 1-Jan-1975
Listing Date 1-Jan-1978
Years of Experience (Operating) 42
Years of Experience (PLC) 39
Balance Sheet & Income Statement Items 2015 2014 2013 Average Growth % Growth %
JOD JOD JOD JOD 2015-2014 2014-2013
Total Assets 26,224,693 25,637,132 24,099,771 25,320,532 2% 6%
Total Investments 15,105,520 14,374,744 13,638,277 14,372,847 5% 5%
Total Liabilities 15,990,942 14,870,648 13,718,114 14,859,901 8% 8%
Total Equity 10,233,751 10,766,484 10,381,657 10,460,631 -5% 4%
Total Premiums 17,771,066 17,110,382 15,880,898 16,920,782 4% 8%
Net Income 119,916 736,822 460,830 439,189 -84% 60%
Ranking in the Jordanian Market 2015 2014 2013 Average Indicators Indicators
Ranking Ranking Ranking Ranking 2015-2014 2014-2013
Total Assets 12 10 11 11 Moved Down Moved Up
Total Investments 13 12 10 12 Moved Down Moved Down
Total Liabilities 13 13 11 12 Stable Moved Down
Total Equity 11 10 10 10 Moved Down Stable
Total Premiums 12 13 12 12 Moved Up Moved Down
Net Income 18 17 13 16 Moved Down Moved Down
Market Share in the Jordanian Market 2015 2014 2013 Average Indicators Indicators
% % % % 2015-2014 2014-2013
Total Assets 3% 3% 3% 3% Decreased Increased
Total Investments 3% 3% 3% 3% Increased Decreased
Total Liabilities 3% 3% 3% 3% Decreased Increased
Total Equity 3% 4% 4% 3% Decreased Decreased
Total Premiums 3% 3% 3% 3% Decreased Increased
Net Income 1% 3% 4% 2% Decreased Decreased
Tariq Al-Basha – [email protected] – 00962 7 9767 7418
Page 7 of 27
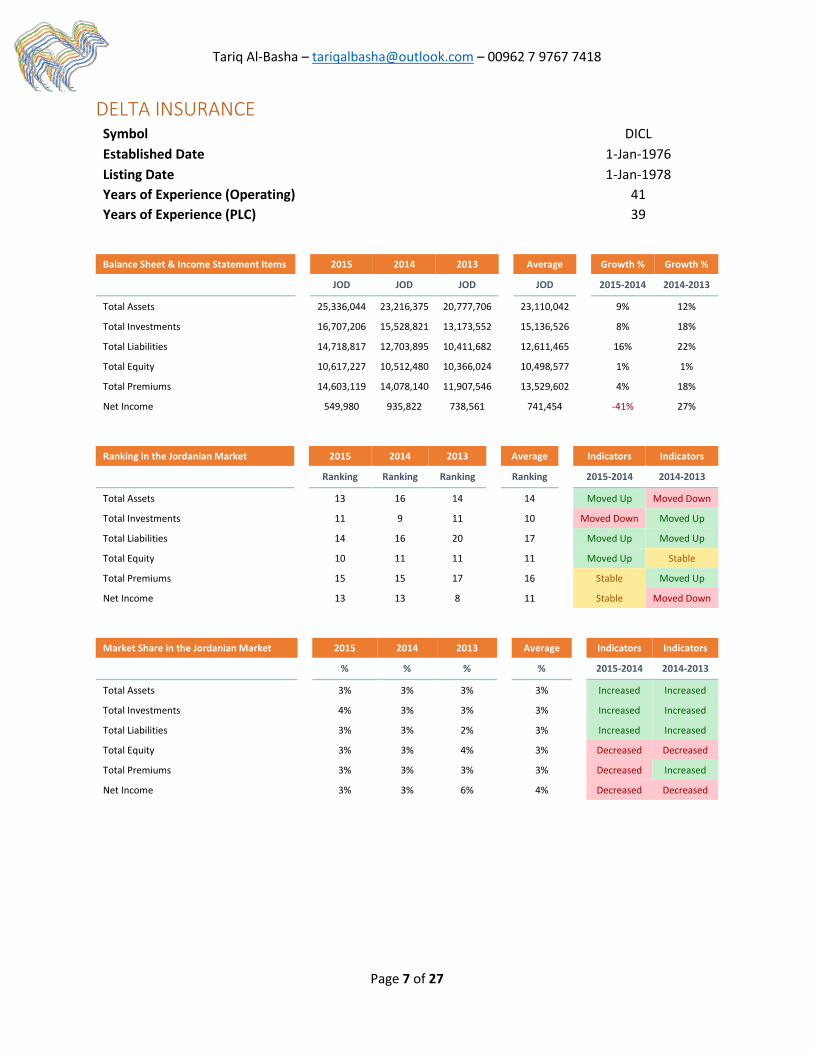
DELTA INSURANCE Symbol DICL
Established Date 1-Jan-1976
Listing Date 1-Jan-1978
Years of Experience (Operating) 41
Years of Experience (PLC) 39
Balance Sheet & Income Statement Items 2015 2014 2013 Average Growth % Growth %
JOD JOD JOD JOD 2015-2014 2014-2013
Total Assets 25,336,044 23,216,375 20,777,706 23,110,042 9% 12%
Total Investments 16,707,206 15,528,821 13,173,552 15,136,526 8% 18%
Total Liabilities 14,718,817 12,703,895 10,411,682 12,611,465 16% 22%
Total Equity 10,617,227 10,512,480 10,366,024 10,498,577 1% 1%
Total Premiums 14,603,119 14,078,140 11,907,546 13,529,602 4% 18%
Net Income 549,980 935,822 738,561 741,454 -41% 27%
Ranking in the Jordanian Market 2015 2014 2013 Average Indicators Indicators
Ranking Ranking Ranking Ranking 2015-2014 2014-2013
Total Assets 13 16 14 14 Moved Up Moved Down
Total Investments 11 9 11 10 Moved Down Moved Up
Total Liabilities 14 16 20 17 Moved Up Moved Up
Total Equity 10 11 11 11 Moved Up Stable
Total Premiums 15 15 17 16 Stable Moved Up
Net Income 13 13 8 11 Stable Moved Down
Market Share in the Jordanian Market 2015 2014 2013 Average Indicators Indicators
% % % % 2015-2014 2014-2013
Total Assets 3% 3% 3% 3% Increased Increased
Total Investments 4% 3% 3% 3% Increased Increased
Total Liabilities 3% 3% 2% 3% Increased Increased
Total Equity 3% 3% 4% 3% Decreased Decreased
Total Premiums 3% 3% 3% 3% Decreased Increased
Net Income 3% 3% 6% 4% Decreased Decreased

Tariq Al-Basha – [email protected] – 00962 7 9767 7418
Page 8 of 27
JERUSALEM INSURANCE Symbol JERY
Established Date 2-Jan-1975
Listing Date 1-Jan-1978
Years of Experience (Operating) 42
Years of Experience (PLC) 39
Balance Sheet & Income Statement Items 2015 2014 2013 Average Growth % Growth %
JOD JOD JOD JOD 2015-2014 2014-2013
Total Assets 32,860,641 31,472,910 28,116,222 30,816,591 4% 12%
Total Investments 26,366,208 24,618,876 20,812,467 23,932,517 7% 18%
Total Liabilities 19,077,120 17,846,745 15,347,801 17,423,889 7% 16%
Total Equity 13,783,521 13,626,165 12,768,421 13,392,702 1% 7%
Total Premiums 16,093,290 16,599,730 15,447,574 16,046,865 -3% 7%
Net Income 1,037,356 1,657,817 1,329,867 1,341,680 -37% 25%
Ranking in the Jordanian Market 2015 2014 2013 Average Indicators Indicators
Ranking Ranking Ranking Ranking 2015-2014 2014-2013
Total Assets 9 9 9 9 Stable Stable
Total Investments 7 8 8 8 Moved Up Stable
Total Liabilities 9 9 9 9 Stable Stable
Total Equity 8 8 8 8 Stable Stable
Total Premiums 14 14 14 14 Stable Stable
Net Income 10 5 4 6 Moved Down Moved Down
Market Share in the Jordanian Market 2015 2014 2013 Average Indicators Indicators
% % % % 2015-2014 2014-2013
Total Assets 4% 4% 4% 4% Decreased Increased
Total Investments 6% 5% 5% 5% Increased Increased
Total Liabilities 4% 4% 4% 4% Decreased Increased
Total Equity 4% 4% 4% 4% Decreased Increased
Total Premiums 3% 3% 3% 3% Decreased Increased
Net Income 6% 6% 10% 7% Decreased Decreased
Tariq Al-Basha – [email protected] – 00962 7 9767 7418
Page 9 of 27
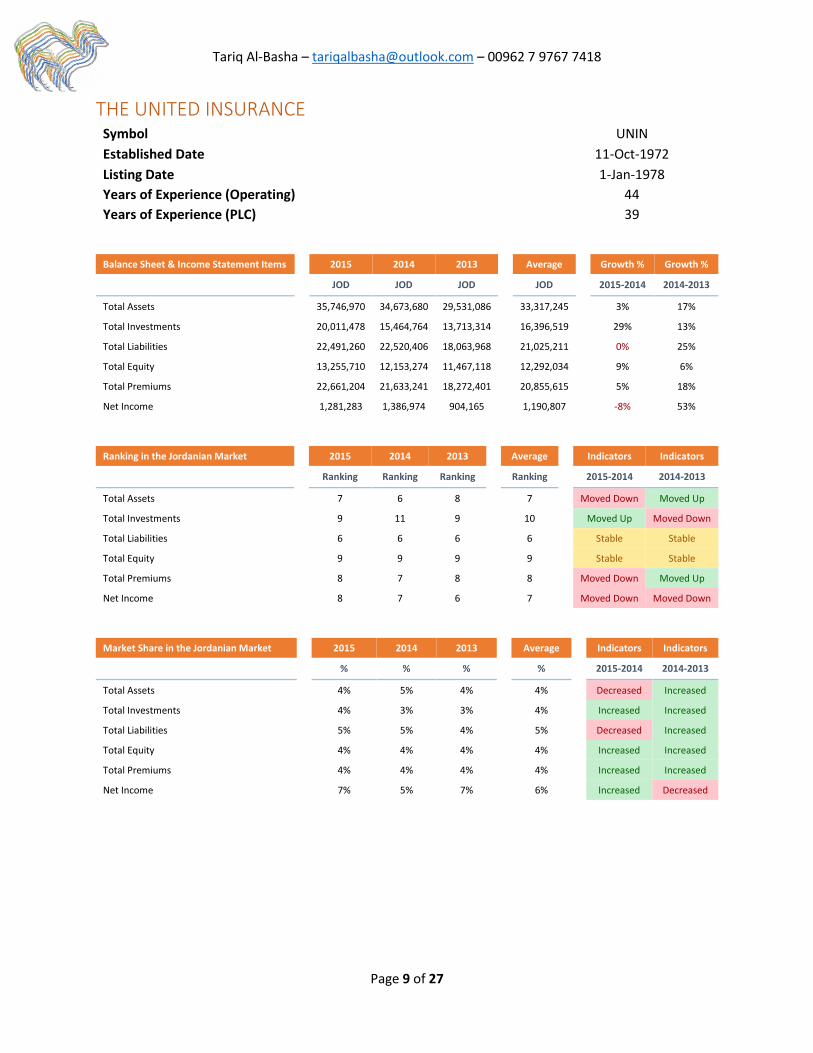
THE UNITED INSURANCE Symbol UNIN
Established Date 11-Oct-1972
Listing Date 1-Jan-1978
Years of Experience (Operating) 44
Years of Experience (PLC) 39
Balance Sheet & Income Statement Items 2015 2014 2013 Average Growth % Growth %
JOD JOD JOD JOD 2015-2014 2014-2013
Total Assets 35,746,970 34,673,680 29,531,086 33,317,245 3% 17%
Total Investments 20,011,478 15,464,764 13,713,314 16,396,519 29% 13%
Total Liabilities 22,491,260 22,520,406 18,063,968 21,025,211 0% 25%
Total Equity 13,255,710 12,153,274 11,467,118 12,292,034 9% 6%
Total Premiums 22,661,204 21,633,241 18,272,401 20,855,615 5% 18%
Net Income 1,281,283 1,386,974 904,165 1,190,807 -8% 53%
Ranking in the Jordanian Market 2015 2014 2013 Average Indicators Indicators
Ranking Ranking Ranking Ranking 2015-2014 2014-2013
Total Assets 7 6 8 7 Moved Down Moved Up
Total Investments 9 11 9 10 Moved Up Moved Down
Total Liabilities 6 6 6 6 Stable Stable
Total Equity 9 9 9 9 Stable Stable
Total Premiums 8 7 8 8 Moved Down Moved Up
Net Income 8 7 6 7 Moved Down Moved Down
Market Share in the Jordanian Market 2015 2014 2013 Average Indicators Indicators
% % % % 2015-2014 2014-2013
Total Assets 4% 5% 4% 4% Decreased Increased
Total Investments 4% 3% 3% 4% Increased Increased
Total Liabilities 5% 5% 4% 5% Decreased Increased
Total Equity 4% 4% 4% 4% Increased Increased
Total Premiums 4% 4% 4% 4% Increased Increased
Net Income 7% 5% 7% 6% Increased Decreased
Tariq Al-Basha – [email protected] – 00962 7 9767 7418
Page 10 of 27
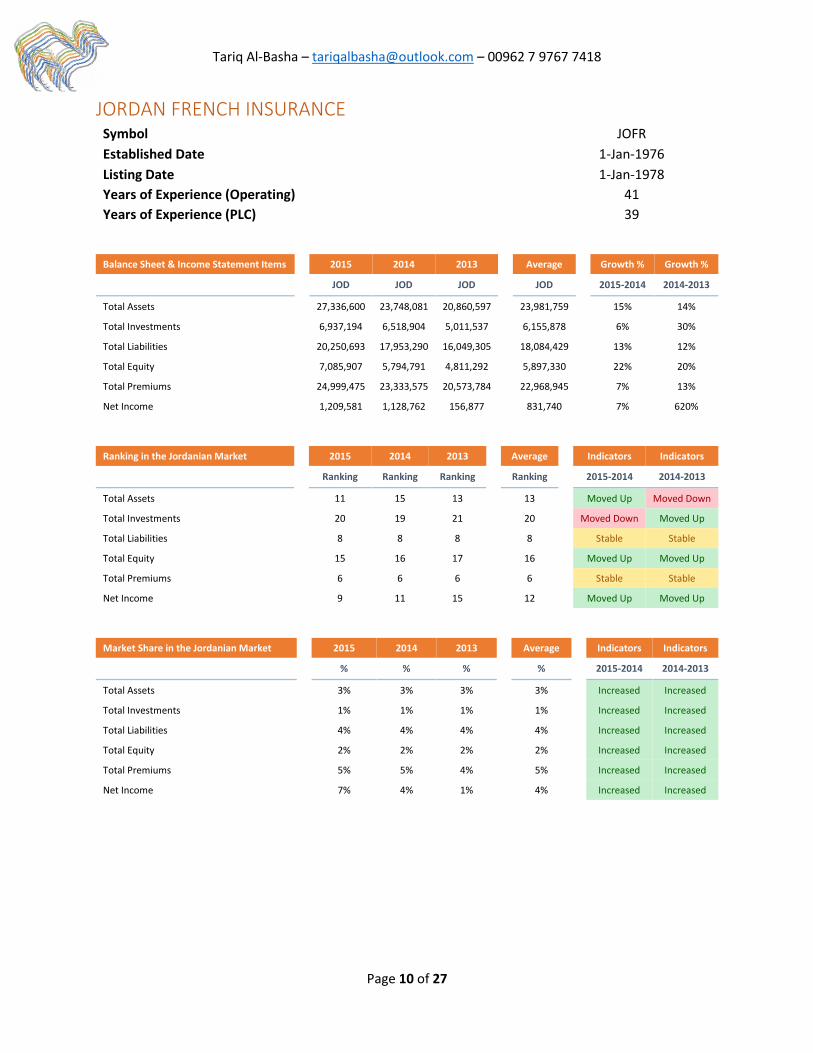
JORDAN FRENCH INSURANCE Symbol JOFR
Established Date 1-Jan-1976
Listing Date 1-Jan-1978
Years of Experience (Operating) 41
Years of Experience (PLC) 39
Balance Sheet & Income Statement Items 2015 2014 2013 Average Growth % Growth %
JOD JOD JOD JOD 2015-2014 2014-2013
Total Assets 27,336,600 23,748,081 20,860,597 23,981,759 15% 14%
Total Investments 6,937,194 6,518,904 5,011,537 6,155,878 6% 30%
Total Liabilities 20,250,693 17,953,290 16,049,305 18,084,429 13% 12%
Total Equity 7,085,907 5,794,791 4,811,292 5,897,330 22% 20%
Total Premiums 24,999,475 23,333,575 20,573,784 22,968,945 7% 13%
Net Income 1,209,581 1,128,762 156,877 831,740 7% 620%
Ranking in the Jordanian Market 2015 2014 2013 Average Indicators Indicators
Ranking Ranking Ranking Ranking 2015-2014 2014-2013
Total Assets 11 15 13 13 Moved Up Moved Down
Total Investments 20 19 21 20 Moved Down Moved Up
Total Liabilities 8 8 8 8 Stable Stable
Total Equity 15 16 17 16 Moved Up Moved Up
Total Premiums 6 6 6 6 Stable Stable
Net Income 9 11 15 12 Moved Up Moved Up
Market Share in the Jordanian Market 2015 2014 2013 Average Indicators Indicators
% % % % 2015-2014 2014-2013
Total Assets 3% 3% 3% 3% Increased Increased
Total Investments 1% 1% 1% 1% Increased Increased
Total Liabilities 4% 4% 4% 4% Increased Increased
Total Equity 2% 2% 2% 2% Increased Increased
Total Premiums 5% 5% 4% 5% Increased Increased
Net Income 7% 4% 1% 4% Increased Increased
Tariq Al-Basha – [email protected] – 00962 7 9767 7418
Page 11 of 27
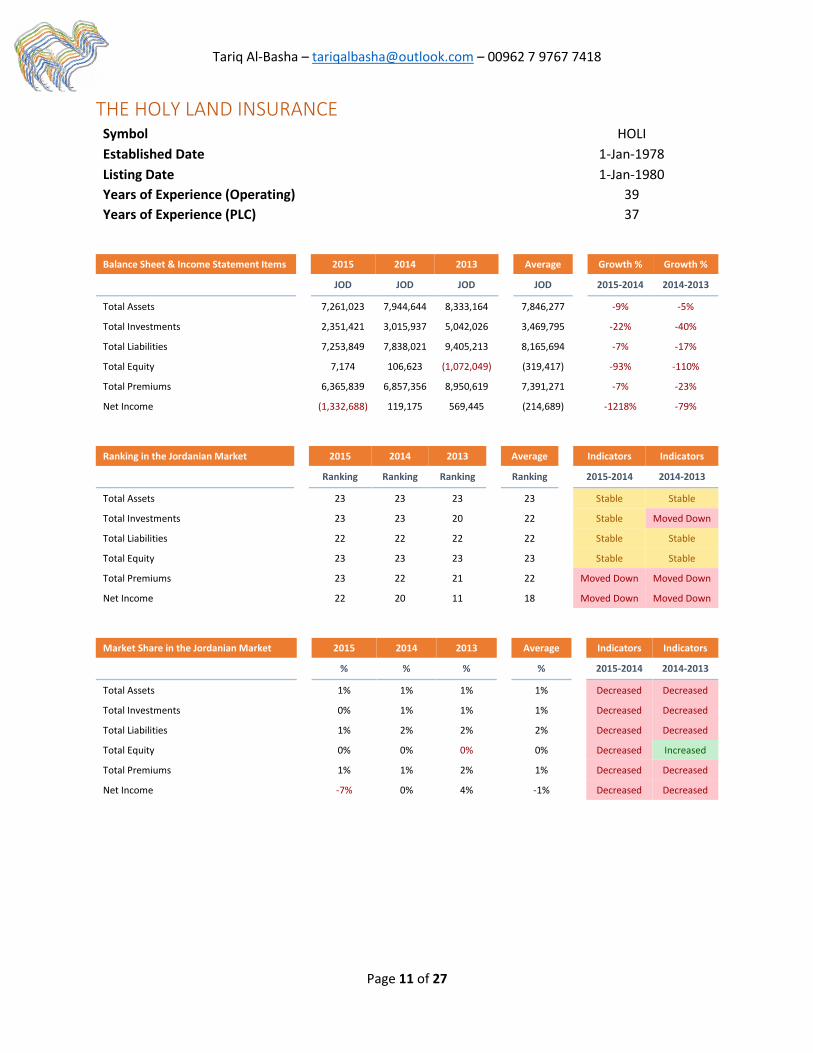
THE HOLY LAND INSURANCE Symbol HOLI
Established Date 1-Jan-1978
Listing Date 1-Jan-1980
Years of Experience (Operating) 39
Years of Experience (PLC) 37
Balance Sheet & Income Statement Items 2015 2014 2013 Average Growth % Growth %
JOD JOD JOD JOD 2015-2014 2014-2013
Total Assets 7,261,023 7,944,644 8,333,164 7,846,277 -9% -5%
Total Investments 2,351,421 3,015,937 5,042,026 3,469,795 -22% -40%
Total Liabilities 7,253,849 7,838,021 9,405,213 8,165,694 -7% -17%
Total Equity 7,174 106,623 (1,072,049) (319,417) -93% -110%
Total Premiums 6,365,839 6,857,356 8,950,619 7,391,271 -7% -23%
Net Income (1,332,688) 119,175 569,445 (214,689) -1218% -79%
Ranking in the Jordanian Market 2015 2014 2013 Average Indicators Indicators
Ranking Ranking Ranking Ranking 2015-2014 2014-2013
Total Assets 23 23 23 23 Stable Stable
Total Investments 23 23 20 22 Stable Moved Down
Total Liabilities 22 22 22 22 Stable Stable
Total Equity 23 23 23 23 Stable Stable
Total Premiums 23 22 21 22 Moved Down Moved Down
Net Income 22 20 11 18 Moved Down Moved Down
Market Share in the Jordanian Market 2015 2014 2013 Average Indicators Indicators
% % % % 2015-2014 2014-2013
Total Assets 1% 1% 1% 1% Decreased Decreased
Total Investments 0% 1% 1% 1% Decreased Decreased
Total Liabilities 1% 2% 2% 2% Decreased Decreased
Total Equity 0% 0% 0% 0% Decreased Increased
Total Premiums 1% 1% 2% 1% Decreased Decreased
Net Income -7% 0% 4% -1% Decreased Decreased

Tariq Al-Basha – [email protected] – 00962 7 9767 7418
Page 12 of 27
AL-MANARA INSURANCE PLC.CO. Symbol ARSI
Established Date 3-Feb-1974
Listing Date 1-Jan-1978
Years of Experience (Operating) 43
Years of Experience (PLC) 39
Balance Sheet & Income Statement Items 2015 2014 2013 Average Growth % Growth %
JOD JOD JOD JOD 2015-2014 2014-2013
Total Assets 17,681,022 20,115,135 18,109,566 18,635,241 -12% 11%
Total Investments 11,701,480 12,744,114 11,104,797 11,850,130 -8% 15%
Total Liabilities 12,656,149 14,854,438 12,436,711 13,315,766 -15% 19%
Total Equity 5,024,873 5,260,697 5,672,855 5,319,475 -4% -7%
Total Premiums 8,338,423 11,506,613 10,112,458 9,985,831 -28% 14%
Net Income (214,895) (511,805) (314,553) (347,084) -58% 63%
Ranking in the Jordanian Market 2015 2014 2013 Average Indicators Indicators
Ranking Ranking Ranking Ranking 2015-2014 2014-2013
Total Assets 17 17 17 17 Stable Stable
Total Investments 15 15 14 15 Stable Moved Down
Total Liabilities 17 14 15 15 Moved Down Moved Up
Total Equity 18 17 16 17 Moved Down Moved Down
Total Premiums 21 16 20 19 Moved Down Moved Up
Net Income 20 22 19 20 Moved Up Moved Down
Market Share in the Jordanian Market 2015 2014 2013 Average Indicators Indicators
% % % % 2015-2014 2014-2013
Total Assets 2% 3% 3% 2% Decreased Increased
Total Investments 2% 3% 3% 3% Decreased Increased
Total Liabilities 3% 3% 3% 3% Decreased Increased
Total Equity 2% 2% 2% 2% Decreased Decreased
Total Premiums 2% 2% 2% 2% Decreased Increased
Net Income -1% -2% -2% -2% Increased Increased
Tariq Al-Basha – [email protected] – 00962 7 9767 7418
Page 13 of 27
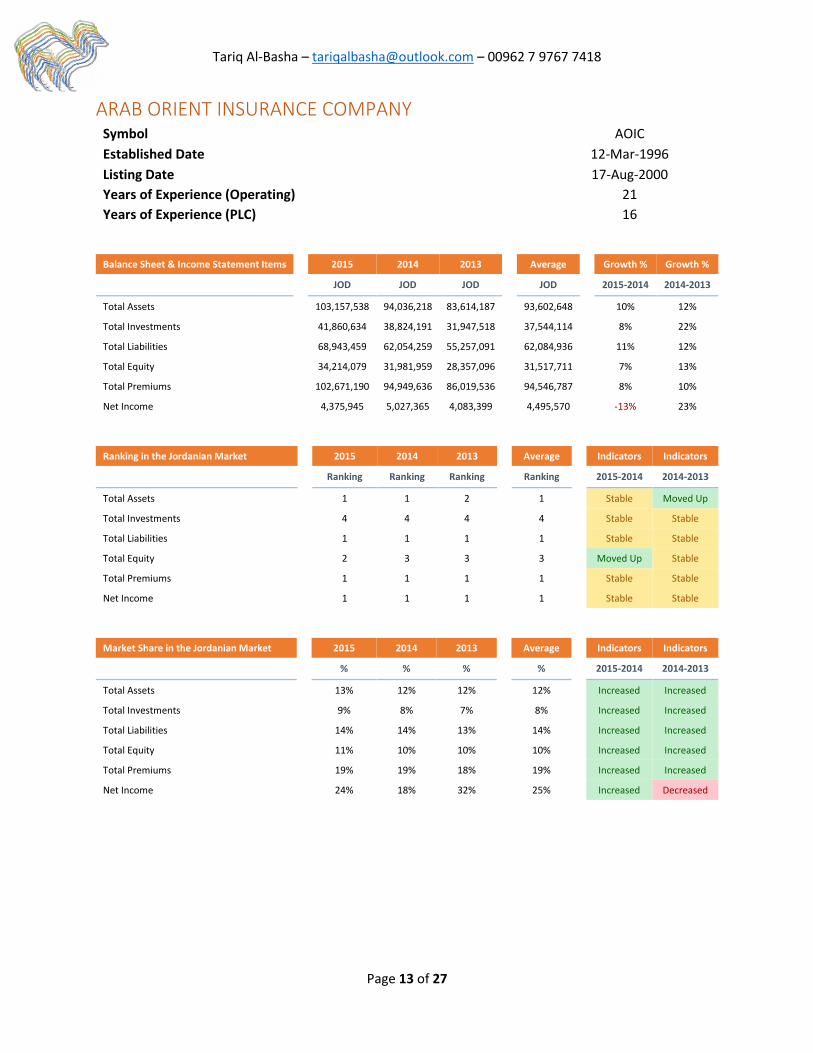
ARAB ORIENT INSURANCE COMPANY Symbol AOIC
Established Date 12-Mar-1996
Listing Date 17-Aug-2000
Years of Experience (Operating) 21
Years of Experience (PLC) 16
Balance Sheet & Income Statement Items 2015 2014 2013 Average Growth % Growth %
JOD JOD JOD JOD 2015-2014 2014-2013
Total Assets 103,157,538 94,036,218 83,614,187 93,602,648 10% 12%
Total Investments 41,860,634 38,824,191 31,947,518 37,544,114 8% 22%
Total Liabilities 68,943,459 62,054,259 55,257,091 62,084,936 11% 12%
Total Equity 34,214,079 31,981,959 28,357,096 31,517,711 7% 13%
Total Premiums 102,671,190 94,949,636 86,019,536 94,546,787 8% 10%
Net Income 4,375,945 5,027,365 4,083,399 4,495,570 -13% 23%
Ranking in the Jordanian Market 2015 2014 2013 Average Indicators Indicators
Ranking Ranking Ranking Ranking 2015-2014 2014-2013
Total Assets 1 1 2 1 Stable Moved Up
Total Investments 4 4 4 4 Stable Stable
Total Liabilities 1 1 1 1 Stable Stable
Total Equity 2 3 3 3 Moved Up Stable
Total Premiums 1 1 1 1 Stable Stable
Net Income 1 1 1 1 Stable Stable
Market Share in the Jordanian Market 2015 2014 2013 Average Indicators Indicators
% % % % 2015-2014 2014-2013
Total Assets 13% 12% 12% 12% Increased Increased
Total Investments 9% 8% 7% 8% Increased Increased
Total Liabilities 14% 14% 13% 14% Increased Increased
Total Equity 11% 10% 10% 10% Increased Increased
Total Premiums 19% 19% 18% 19% Increased Increased
Net Income 24% 18% 32% 25% Increased Decreased
Tariq Al-Basha – [email protected] – 00962 7 9767 7418
Page 14 of 27
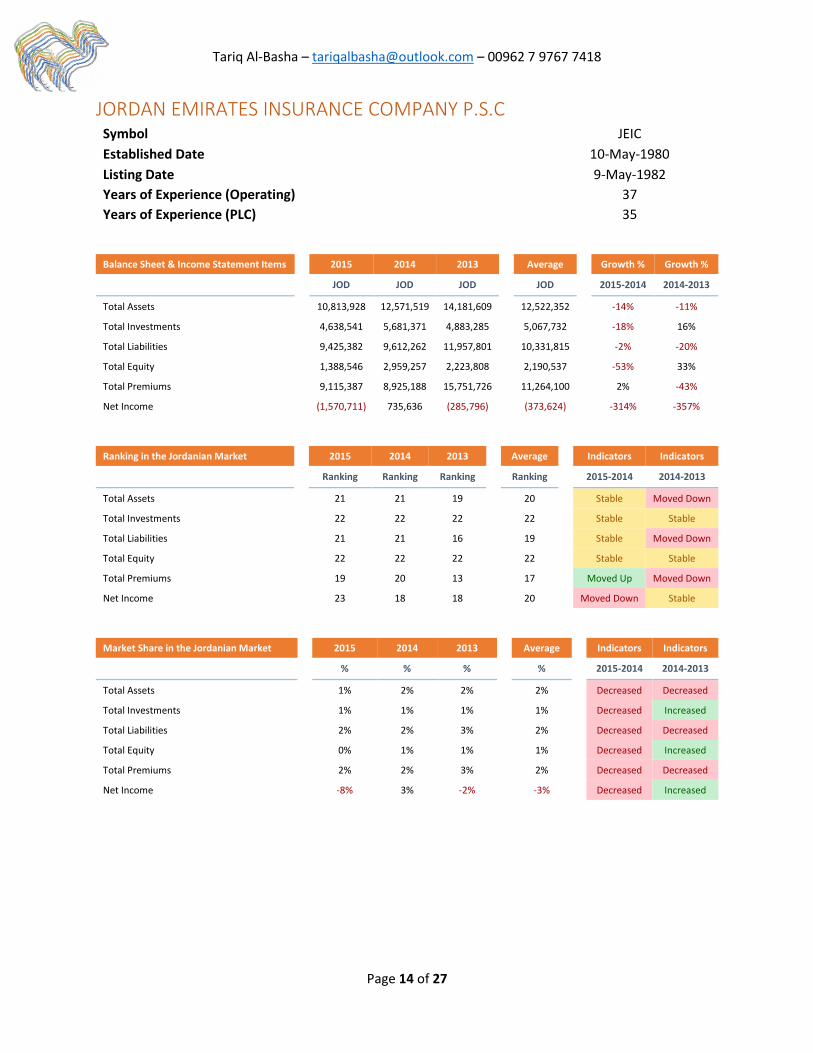
JORDAN EMIRATES INSURANCE COMPANY P.S.C Symbol JEIC
Established Date 10-May-1980
Listing Date 9-May-1982
Years of Experience (Operating) 37
Years of Experience (PLC) 35
Balance Sheet & Income Statement Items 2015 2014 2013 Average Growth % Growth %
JOD JOD JOD JOD 2015-2014 2014-2013
Total Assets 10,813,928 12,571,519 14,181,609 12,522,352 -14% -11%
Total Investments 4,638,541 5,681,371 4,883,285 5,067,732 -18% 16%
Total Liabilities 9,425,382 9,612,262 11,957,801 10,331,815 -2% -20%
Total Equity 1,388,546 2,959,257 2,223,808 2,190,537 -53% 33%
Total Premiums 9,115,387 8,925,188 15,751,726 11,264,100 2% -43%
Net Income (1,570,711) 735,636 (285,796) (373,624) -314% -357%
Ranking in the Jordanian Market 2015 2014 2013 Average Indicators Indicators
Ranking Ranking Ranking Ranking 2015-2014 2014-2013
Total Assets 21 21 19 20 Stable Moved Down
Total Investments 22 22 22 22 Stable Stable
Total Liabilities 21 21 16 19 Stable Moved Down
Total Equity 22 22 22 22 Stable Stable
Total Premiums 19 20 13 17 Moved Up Moved Down
Net Income 23 18 18 20 Moved Down Stable
Market Share in the Jordanian Market 2015 2014 2013 Average Indicators Indicators
% % % % 2015-2014 2014-2013
Total Assets 1% 2% 2% 2% Decreased Decreased
Total Investments 1% 1% 1% 1% Decreased Increased
Total Liabilities 2% 2% 3% 2% Decreased Decreased
Total Equity 0% 1% 1% 1% Decreased Increased
Total Premiums 2% 2% 3% 2% Decreased Decreased
Net Income -8% 3% -2% -3% Decreased Increased

Tariq Al-Basha – [email protected] – 00962 7 9767 7418
Page 15 of 27
ARAB LIFE & ACCIDENT INSURANCE Symbol ARIN
Established Date 1-Jan-1980
Listing Date 31-May-1983
Years of Experience (Operating) 37
Years of Experience (PLC) 34
Balance Sheet & Income Statement Items 2015 2014 2013 Average Growth % Growth %
JOD JOD JOD JOD 2015-2014 2014-2013
Total Assets 22,752,888 24,895,263 22,949,297 23,532,483 -9% 8%
Total Investments 12,250,256 13,964,126 13,050,378 13,088,253 -12% 7%
Total Liabilities 14,001,347 16,097,730 14,917,294 15,005,457 -13% 8%
Total Equity 8,751,541 8,797,533 8,032,003 8,527,026 -1% 10%
Total Premiums 17,817,558 19,924,904 16,509,167 18,083,876 -11% 21%
Net Income 445,561 846,547 (488,247) 267,954 -47% -273%
Ranking in the Jordanian Market 2015 2014 2013 Average Indicators Indicators
Ranking Ranking Ranking Ranking 2015-2014 2014-2013
Total Assets 16 12 12 13 Moved Down Stable
Total Investments 14 14 12 13 Stable Moved Down
Total Liabilities 15 10 10 12 Moved Down Stable
Total Equity 14 13 12 13 Moved Down Moved Down
Total Premiums 11 10 11 11 Moved Down Moved Up
Net Income 16 14 21 17 Moved Down Moved Up
Market Share in the Jordanian Market 2015 2014 2013 Average Indicators Indicators
% % % % 2015-2014 2014-2013
Total Assets 3% 3% 3% 3% Decreased Increased
Total Investments 3% 3% 3% 3% Decreased Decreased
Total Liabilities 3% 4% 4% 3% Decreased Increased
Total Equity 3% 3% 3% 3% Decreased Increased
Total Premiums 3% 4% 3% 4% Decreased Increased
Net Income 2% 3% -4% 1% Decreased Increased

Tariq Al-Basha – [email protected] – 00962 7 9767 7418
Page 16 of 27
PHILADELPHIA INSURANCE Symbol PHIN
Established Date 1-Jan-1980
Listing Date 31-May-1983
Years of Experience (Operating) 37
Years of Experience (PLC) 34
Balance Sheet & Income Statement Items 2015 2014 2013 Average Growth % Growth %
JOD JOD JOD JOD 2015-2014 2014-2013
Total Assets 10,764,944 11,555,015 12,089,107 11,469,689 -7% -4%
Total Investments 7,891,037 8,771,460 9,389,967 8,684,155 -10% -7%
Total Liabilities 6,614,073 7,745,173 9,042,964 7,800,737 -15% -14%
Total Equity 4,150,871 3,809,842 3,046,143 3,668,952 9% 25%
Total Premiums 6,514,167 6,900,976 6,879,835 6,764,993 -6% 0%
Net Income 315,996 811,264 (591,419) 178,614 -61% -237%
Ranking in the Jordanian Market 2015 2014 2013 Average Indicators Indicators
Ranking Ranking Ranking Ranking 2015-2014 2014-2013
Total Assets 22 22 22 22 Stable Stable
Total Investments 18 18 17 18 Stable Moved Down
Total Liabilities 23 23 23 23 Stable Stable
Total Equity 19 20 20 20 Moved Up Stable
Total Premiums 22 21 23 22 Moved Down Moved Up
Net Income 17 16 22 18 Moved Down Moved Up
Market Share in the Jordanian Market 2015 2014 2013 Average Indicators Indicators
% % % % 2015-2014 2014-2013
Total Assets 1% 2% 2% 2% Decreased Decreased
Total Investments 2% 2% 2% 2% Decreased Decreased
Total Liabilities 1% 2% 2% 2% Decreased Decreased
Total Equity 1% 1% 1% 1% Increased Increased
Total Premiums 1% 1% 1% 1% Decreased Decreased
Net Income 2% 3% -5% 0% Decreased Increased

Tariq Al-Basha – [email protected] – 00962 7 9767 7418
Page 17 of 27
ARAB UNION INTERNATIONAL INSURANCE Symbol AIUI
Established Date 1-Jan-1976
Listing Date 1-Jan-1979
Years of Experience (Operating) 41
Years of Experience (PLC) 38
Balance Sheet & Income Statement Items 2015 2014 2013 Average Growth % Growth %
JOD JOD JOD JOD 2015-2014 2014-2013
Total Assets 17,356,429 16,123,919 17,164,457 16,881,602 8% -6%
Total Investments 8,984,320 9,395,009 10,083,338 9,487,556 -4% -7%
Total Liabilities 13,432,023 11,485,302 13,341,282 12,752,869 17% -14%
Total Equity 3,924,406 4,638,617 3,823,175 4,128,733 -15% 21%
Total Premiums 8,741,962 6,533,128 8,054,187 7,776,426 34% -19%
Net Income (720,931) 814,592 (1,435,306) (447,215) -189% -157%
Ranking in the Jordanian Market 2015 2014 2013 Average Indicators Indicators
Ranking Ranking Ranking Ranking 2015-2014 2014-2013
Total Assets 18 18 18 18 Stable Stable
Total Investments 17 16 16 16 Moved Down Stable
Total Liabilities 16 17 12 15 Moved Up Moved Down
Total Equity 21 19 18 19 Moved Down Moved Down
Total Premiums 20 23 22 22 Moved Up Moved Down
Net Income 21 15 23 20 Moved Down Moved Up
Market Share in the Jordanian Market 2015 2014 2013 Average Indicators Indicators
% % % % 2015-2014 2014-2013
Total Assets 2% 2% 2% 2% Increased Decreased
Total Investments 2% 2% 2% 2% Decreased Decreased
Total Liabilities 3% 3% 3% 3% Increased Decreased
Total Equity 1% 2% 1% 1% Decreased Increased
Total Premiums 2% 1% 2% 2% Increased Decreased
Net Income -4% 3% -11% -4% Decreased Increased
Tariq Al-Basha – [email protected] – 00962 7 9767 7418
Page 18 of 27
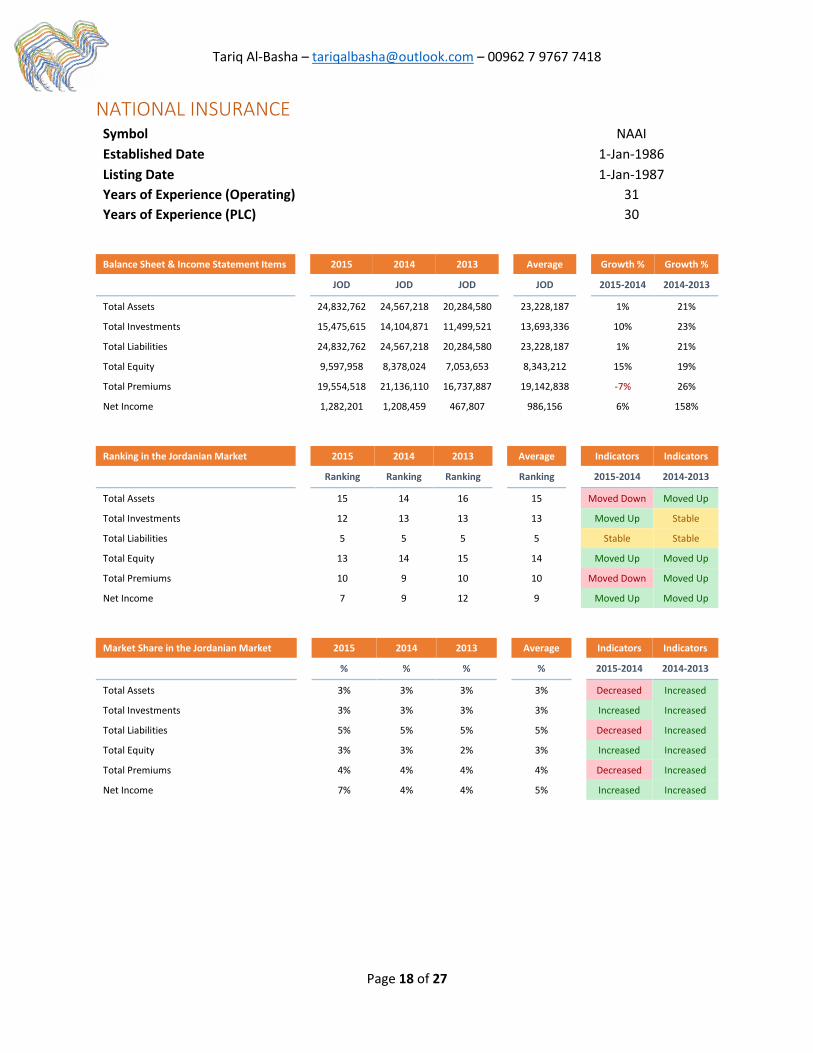
NATIONAL INSURANCE Symbol NAAI
Established Date 1-Jan-1986
Listing Date 1-Jan-1987
Years of Experience (Operating) 31
Years of Experience (PLC) 30
Balance Sheet & Income Statement Items 2015 2014 2013 Average Growth % Growth %
JOD JOD JOD JOD 2015-2014 2014-2013
Total Assets 24,832,762 24,567,218 20,284,580 23,228,187 1% 21%
Total Investments 15,475,615 14,104,871 11,499,521 13,693,336 10% 23%
Total Liabilities 24,832,762 24,567,218 20,284,580 23,228,187 1% 21%
Total Equity 9,597,958 8,378,024 7,053,653 8,343,212 15% 19%
Total Premiums 19,554,518 21,136,110 16,737,887 19,142,838 -7% 26%
Net Income 1,282,201 1,208,459 467,807 986,156 6% 158%
Ranking in the Jordanian Market 2015 2014 2013 Average Indicators Indicators
Ranking Ranking Ranking Ranking 2015-2014 2014-2013
Total Assets 15 14 16 15 Moved Down Moved Up
Total Investments 12 13 13 13 Moved Up Stable
Total Liabilities 5 5 5 5 Stable Stable
Total Equity 13 14 15 14 Moved Up Moved Up
Total Premiums 10 9 10 10 Moved Down Moved Up
Net Income 7 9 12 9 Moved Up Moved Up
Market Share in the Jordanian Market 2015 2014 2013 Average Indicators Indicators
% % % % 2015-2014 2014-2013
Total Assets 3% 3% 3% 3% Decreased Increased
Total Investments 3% 3% 3% 3% Increased Increased
Total Liabilities 5% 5% 5% 5% Decreased Increased
Total Equity 3% 3% 2% 3% Increased Increased
Total Premiums 4% 4% 4% 4% Decreased Increased
Net Income 7% 4% 4% 5% Increased Increased
Tariq Al-Basha – [email protected] – 00962 7 9767 7418
Page 19 of 27
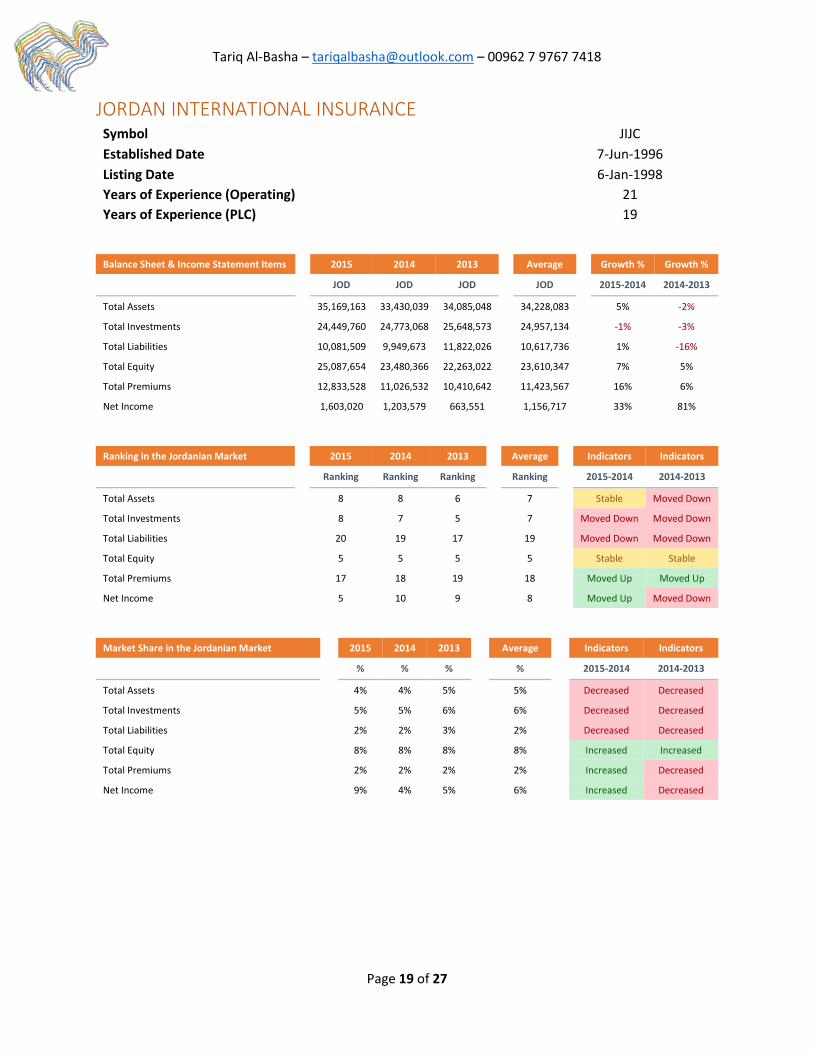
JORDAN INTERNATIONAL INSURANCE Symbol JIJC
Established Date 7-Jun-1996
Listing Date 6-Jan-1998
Years of Experience (Operating) 21
Years of Experience (PLC) 19
Balance Sheet & Income Statement Items 2015 2014 2013 Average Growth % Growth %
JOD JOD JOD JOD 2015-2014 2014-2013
Total Assets 35,169,163 33,430,039 34,085,048 34,228,083 5% -2%
Total Investments 24,449,760 24,773,068 25,648,573 24,957,134 -1% -3%
Total Liabilities 10,081,509 9,949,673 11,822,026 10,617,736 1% -16%
Total Equity 25,087,654 23,480,366 22,263,022 23,610,347 7% 5%
Total Premiums 12,833,528 11,026,532 10,410,642 11,423,567 16% 6%
Net Income 1,603,020 1,203,579 663,551 1,156,717 33% 81%
Ranking in the Jordanian Market 2015 2014 2013 Average Indicators Indicators
Ranking Ranking Ranking Ranking 2015-2014 2014-2013
Total Assets 8 8 6 7 Stable Moved Down
Total Investments 8 7 5 7 Moved Down Moved Down
Total Liabilities 20 19 17 19 Moved Down Moved Down
Total Equity 5 5 5 5 Stable Stable
Total Premiums 17 18 19 18 Moved Up Moved Up
Net Income 5 10 9 8 Moved Up Moved Down
Market Share in the Jordanian Market 2015 2014 2013 Average Indicators Indicators
% % % % 2015-2014 2014-2013
Total Assets 4% 4% 5% 5% Decreased Decreased
Total Investments 5% 5% 6% 6% Decreased Decreased
Total Liabilities 2% 2% 3% 2% Decreased Decreased
Total Equity 8% 8% 8% 8% Increased Increased
Total Premiums 2% 2% 2% 2% Increased Decreased
Net Income 9% 4% 5% 6% Increased Decreased
Tariq Al-Basha – [email protected] – 00962 7 9767 7418
Page 20 of 27
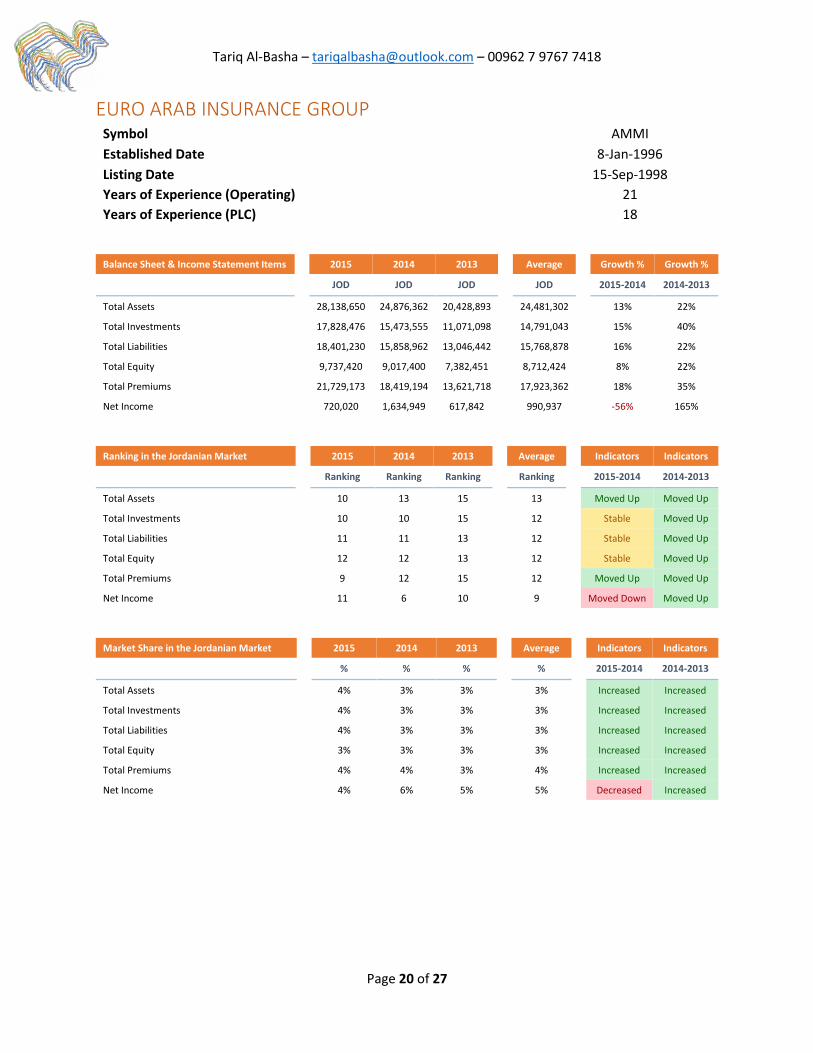
EURO ARAB INSURANCE GROUP Symbol AMMI
Established Date 8-Jan-1996
Listing Date 15-Sep-1998
Years of Experience (Operating) 21
Years of Experience (PLC) 18
Balance Sheet & Income Statement Items 2015 2014 2013 Average Growth % Growth %
JOD JOD JOD JOD 2015-2014 2014-2013
Total Assets 28,138,650 24,876,362 20,428,893 24,481,302 13% 22%
Total Investments 17,828,476 15,473,555 11,071,098 14,791,043 15% 40%
Total Liabilities 18,401,230 15,858,962 13,046,442 15,768,878 16% 22%
Total Equity 9,737,420 9,017,400 7,382,451 8,712,424 8% 22%
Total Premiums 21,729,173 18,419,194 13,621,718 17,923,362 18% 35%
Net Income 720,020 1,634,949 617,842 990,937 -56% 165%
Ranking in the Jordanian Market 2015 2014 2013 Average Indicators Indicators
Ranking Ranking Ranking Ranking 2015-2014 2014-2013
Total Assets 10 13 15 13 Moved Up Moved Up
Total Investments 10 10 15 12 Stable Moved Up
Total Liabilities 11 11 13 12 Stable Moved Up
Total Equity 12 12 13 12 Stable Moved Up
Total Premiums 9 12 15 12 Moved Up Moved Up
Net Income 11 6 10 9 Moved Down Moved Up
Market Share in the Jordanian Market 2015 2014 2013 Average Indicators Indicators
% % % % 2015-2014 2014-2013
Total Assets 4% 3% 3% 3% Increased Increased
Total Investments 4% 3% 3% 3% Increased Increased
Total Liabilities 4% 3% 3% 3% Increased Increased
Total Equity 3% 3% 3% 3% Increased Increased
Total Premiums 4% 4% 3% 4% Increased Increased
Net Income 4% 6% 5% 5% Decreased Increased
Tariq Al-Basha – [email protected] – 00962 7 9767 7418
Page 21 of 27
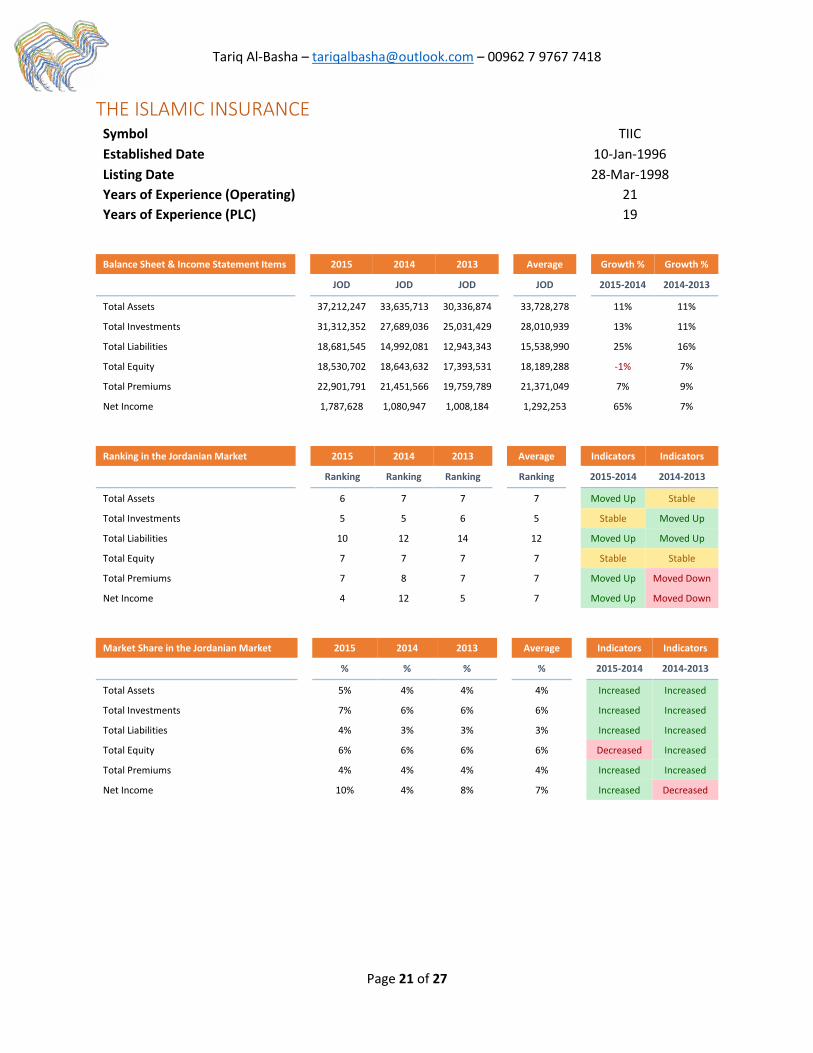
THE ISLAMIC INSURANCE Symbol TIIC
Established Date 10-Jan-1996
Listing Date 28-Mar-1998
Years of Experience (Operating) 21
Years of Experience (PLC) 19
Balance Sheet & Income Statement Items 2015 2014 2013 Average Growth % Growth %
JOD JOD JOD JOD 2015-2014 2014-2013
Total Assets 37,212,247 33,635,713 30,336,874 33,728,278 11% 11%
Total Investments 31,312,352 27,689,036 25,031,429 28,010,939 13% 11%
Total Liabilities 18,681,545 14,992,081 12,943,343 15,538,990 25% 16%
Total Equity 18,530,702 18,643,632 17,393,531 18,189,288 -1% 7%
Total Premiums 22,901,791 21,451,566 19,759,789 21,371,049 7% 9%
Net Income 1,787,628 1,080,947 1,008,184 1,292,253 65% 7%
Ranking in the Jordanian Market 2015 2014 2013 Average Indicators Indicators
Ranking Ranking Ranking Ranking 2015-2014 2014-2013
Total Assets 6 7 7 7 Moved Up Stable
Total Investments 5 5 6 5 Stable Moved Up
Total Liabilities 10 12 14 12 Moved Up Moved Up
Total Equity 7 7 7 7 Stable Stable
Total Premiums 7 8 7 7 Moved Up Moved Down
Net Income 4 12 5 7 Moved Up Moved Down
Market Share in the Jordanian Market 2015 2014 2013 Average Indicators Indicators
% % % % 2015-2014 2014-2013
Total Assets 5% 4% 4% 4% Increased Increased
Total Investments 7% 6% 6% 6% Increased Increased
Total Liabilities 4% 3% 3% 3% Increased Increased
Total Equity 6% 6% 6% 6% Decreased Increased
Total Premiums 4% 4% 4% 4% Increased Increased
Net Income 10% 4% 8% 7% Increased Decreased

Tariq Al-Basha – [email protected] – 00962 7 9767 7418
Page 22 of 27
THE ARAB ASSURERS INSURANCE COMPANY Symbol ARAS
Established Date 6-Jan-1996
Listing Date 19-Sep-1999
Years of Experience (Operating) 21
Years of Experience (PLC) 17
Balance Sheet & Income Statement Items 2015 2014 2013 Average Growth % Growth %
JOD JOD JOD JOD 2015-2014 2014-2013
Total Assets 14,601,399 12,823,985 13,653,511 13,692,965 14% -6%
Total Investments 7,600,610 6,003,920 6,288,358 6,630,963 27% -5%
Total Liabilities 10,662,766 9,729,702 10,620,302 10,337,590 10% -8%
Total Equity 3,938,633 3,094,283 3,033,209 3,355,375 27% 2%
Total Premiums 10,770,024 9,328,187 12,483,942 10,860,718 15% -25%
Net Income 454,077 (43,664) (71,520) 112,964 -1140% -39%
Ranking in the Jordanian Market 2015 2014 2013 Average Indicators Indicators
Ranking Ranking Ranking Ranking 2015-2014 2014-2013
Total Assets 20 20 21 20 Stable Moved Up
Total Investments 19 21 19 20 Moved Up Moved Down
Total Liabilities 19 20 19 19 Moved Up Moved Down
Total Equity 20 21 21 21 Moved Up Stable
Total Premiums 18 19 16 18 Moved Up Moved Down
Net Income 15 21 17 18 Moved Up Moved Down
Market Share in the Jordanian Market 2015 2014 2013 Average Indicators Indicators
% % % % 2015-2014 2014-2013
Total Assets 2% 2% 2% 2% Increased Decreased
Total Investments 2% 1% 1% 1% Increased Decreased
Total Liabilities 2% 2% 3% 2% Increased Decreased
Total Equity 1% 1% 1% 1% Increased Decreased
Total Premiums 2% 2% 3% 2% Increased Decreased
Net Income 2% 0% -1% 1% Increased Increased

Tariq Al-Basha – [email protected] – 00962 7 9767 7418
Page 23 of 27
ARAB JORDANIAN INSURANCE GROUP Symbol ARGR
Established Date 15-Oct-1996
Listing Date 3-Jan-2000
Years of Experience (Operating) 20
Years of Experience (PLC) 17
Balance Sheet & Income Statement Items 2015 2014 2013 Average Growth % Growth %
JOD JOD JOD JOD 2015-2014 2014-2013
Total Assets 17,103,846 15,536,731 13,730,083 15,456,887 10% 13%
Total Investments 6,647,468 6,028,140 4,440,494 5,705,367 10% 36%
Total Liabilities 11,749,297 10,746,918 9,999,380 10,831,865 9% 7%
Total Equity 5,354,549 4,789,813 3,730,703 4,625,022 12% 28%
Total Premiums 13,372,125 11,162,041 10,476,295 11,670,154 20% 7%
Net Income 503,489 520,357 (336,716) 229,043 -3% -255%
Ranking in the Jordanian Market 2015 2014 2013 Average Indicators Indicators
Ranking Ranking Ranking Ranking 2015-2014 2014-2013
Total Assets 19 19 20 19 Stable Moved Up
Total Investments 21 20 23 21 Moved Down Moved Up
Total Liabilities 18 18 21 19 Stable Moved Up
Total Equity 17 18 19 18 Moved Up Moved Up
Total Premiums 16 17 18 17 Moved Up Moved Up
Net Income 14 19 20 18 Moved Up Moved Up
Market Share in the Jordanian Market 2015 2014 2013 Average Indicators Indicators
% % % % 2015-2014 2014-2013
Total Assets 2% 2% 2% 2% Increased Increased
Total Investments 1% 1% 1% 1% Increased Increased
Total Liabilities 2% 2% 2% 2% Increased Increased
Total Equity 2% 2% 1% 2% Increased Increased
Total Premiums 3% 2% 2% 2% Increased Decreased
Net Income 3% 2% -3% 1% Increased Increased
Tariq Al-Basha – [email protected] – 00962 7 9767 7418
Page 24 of 27
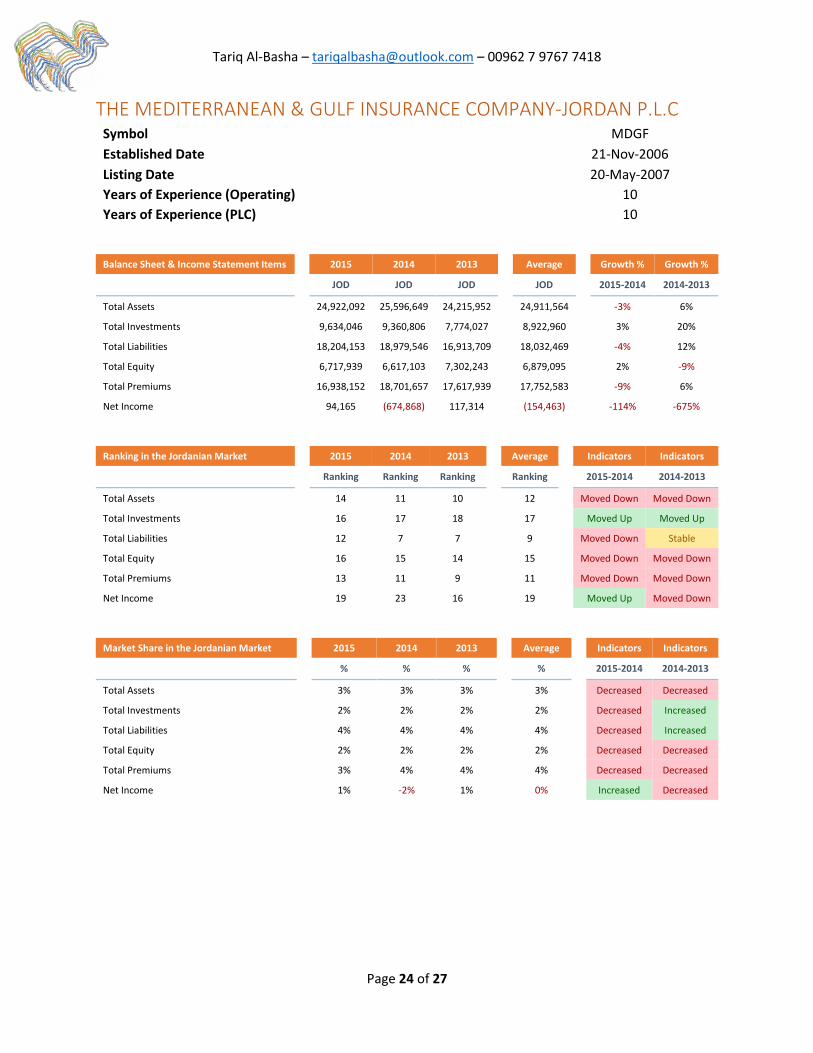
THE MEDITERRANEAN & GULF INSURANCE COMPANY-JORDAN P.L.C Symbol MDGF
Established Date 21-Nov-2006
Listing Date 20-May-2007
Years of Experience (Operating) 10
Years of Experience (PLC) 10
Balance Sheet & Income Statement Items 2015 2014 2013 Average Growth % Growth %
JOD JOD JOD JOD 2015-2014 2014-2013
Total Assets 24,922,092 25,596,649 24,215,952 24,911,564 -3% 6%
Total Investments 9,634,046 9,360,806 7,774,027 8,922,960 3% 20%
Total Liabilities 18,204,153 18,979,546 16,913,709 18,032,469 -4% 12%
Total Equity 6,717,939 6,617,103 7,302,243 6,879,095 2% -9%
Total Premiums 16,938,152 18,701,657 17,617,939 17,752,583 -9% 6%
Net Income 94,165 (674,868) 117,314 (154,463) -114% -675%
Ranking in the Jordanian Market 2015 2014 2013 Average Indicators Indicators
Ranking Ranking Ranking Ranking 2015-2014 2014-2013
Total Assets 14 11 10 12 Moved Down Moved Down
Total Investments 16 17 18 17 Moved Up Moved Up
Total Liabilities 12 7 7 9 Moved Down Stable
Total Equity 16 15 14 15 Moved Down Moved Down
Total Premiums 13 11 9 11 Moved Down Moved Down
Net Income 19 23 16 19 Moved Up Moved Down
Market Share in the Jordanian Market 2015 2014 2013 Average Indicators Indicators
% % % % 2015-2014 2014-2013
Total Assets 3% 3% 3% 3% Decreased Decreased
Total Investments 2% 2% 2% 2% Decreased Increased
Total Liabilities 4% 4% 4% 4% Decreased Increased
Total Equity 2% 2% 2% 2% Decreased Decreased
Total Premiums 3% 4% 4% 4% Decreased Decreased
Net Income 1% -2% 1% 0% Increased Decreased

Tariq Al-Basha – [email protected] – 00962 7 9767 7418
Page 25 of 27
FIRST INSURANCE Symbol FINS
Established Date 28-Dec-2006
Listing Date 27-Aug-2007
Years of Experience (Operating) 10
Years of Experience (PLC) 9
Balance Sheet & Income Statement Items 2015 2014 2013 Average Growth % Growth %
JOD JOD JOD JOD 2015-2014 2014-2013
Total Assets 51,412,349 40,957,561 37,521,138 43,297,016 26% 9%
Total Investments 26,812,665 27,144,494 23,413,369 25,790,176 -1% 16%
Total Liabilities 21,323,509 14,556,545 11,661,577 15,847,210 46% 25%
Total Equity 30,088,840 26,401,016 25,859,561 27,449,806 14% 2%
Total Premiums 26,326,693 25,867,086 22,397,313 24,863,697 2% 15%
Net Income 1,318,641 1,355,685 843,721 1,172,682 -3% 61%
Ranking in the Jordanian Market 2015 2014 2013 Average Indicators Indicators
Ranking Ranking Ranking Ranking 2015-2014 2014-2013
Total Assets 5 5 5 5 Stable Stable
Total Investments 6 6 7 6 Stable Moved Up
Total Liabilities 7 15 18 13 Moved Up Moved Up
Total Equity 4 4 4 4 Stable Stable
Total Premiums 5 4 4 4 Moved Down Stable
Net Income 6 8 7 7 Moved Up Moved Down
Market Share in the Jordanian Market 2015 2014 2013 Average Indicators Indicators
% % % % 2015-2014 2014-2013
Total Assets 6% 5% 5% 6% Increased Increased
Total Investments 6% 6% 5% 6% Decreased Increased
Total Liabilities 4% 3% 3% 3% Increased Increased
Total Equity 10% 9% 9% 9% Increased Decreased
Total Premiums 5% 5% 5% 5% Decreased Increased
Net Income 7% 5% 7% 6% Increased Decreased
Tariq Al-Basha – [email protected] – 00962 7 9767 7418
Page 26 of 27
About the Author: Tariq Al-Basha Tariq started his career with a multi-industry group, that the International
Group for Constructions, in which he was a key player in a major
infrastructure project in one of Iraq’s high risk areas, which is Kirkuk-Baiji
gas pipeline project, where he was participated in forming a consortium with
Korea’s gas giant KOGAS and then he was responsible of the project
financing and financial modeling affairs.
In the same time, Tariq delivered more than 7 financial and feasibility studies
for a major mega project in several governorates in Iraq to attract equity
investors in which his former employer successfully attracted funds.
Later, Tariq joined one of Jordan’s first class engineering firms, that is
Mostaqbal Engineering and Environmental Consultants, where he participated in the World Bank
funded project, which is Emergency Services and Social Resilience Project, and was responsible
in designing financial models and pushing disbursements for nine municipalities hosting Syria
refugees in order to tackle solid waste crisis and other pressing issues in the north of Jordan.
Soon after, Tariq started his journey with Shirlaws by designing a financial model for an UAE
based insurance company that wants to expand its products mix in the Qatari market. He studied
the company’s capacity and built a self-financing financial model with two scenarios.
Lastly, Tariq has a strong experience in the Jordanian real estate market where he demonstrated
his financial planning skills in reviving dead assets and generating profit out of these assets;
especially in the residential market.
In addition, Tariq is preparing for his CMA exams and holds a first-class bachelor degree in
Business Management from the University of Greenwich, London – United Kingdom.

Tariq Al-Basha – [email protected] – 00962 7 9767 7418
Page 27 of 27
General Info Date/Place of Birth: 18th March, 1988 – Kuwait Marital Status/Nationality: Single – Jordanian
Key Objectives 1. Long-term consulting project.
2. Continue my education in the financial field by
obtaining the CMA designation.
Consultancy Experience 1. Investment & Financial Modelling Consultant @ PanBuck Jordan PSC [14th December 2015 – Present]
2. Financial Modelling Consultant @ International House [14th November 2015 – Present]
3. Financial Modelling Consultant @ Shirlaws Middle East [31st May 2015 – 31st December 2015]
Corporate Experience 1. Marketing & Business Development Officer @ Mostaqbal [15th April 2015 – 14th July 2015]
2. Project Finance Officer @ Integrated Technical Solutions [1st June 2013 – 26th February 2015]
Education 1. Awarded 1st Class Honours in Bachelor of Arts (Honours) Business Management from The University of
Greenwich [2009 - 2012]
2. Awarded 2nd Class Honours in International Foundation Diploma from The University of Greenwich [2008 - 2009]
3. Awarded 75.1% in Tawjihi - Scientific Stream from Amman Baptist School [1999-2006]
4. Primary School from Amman International School [1992-1999]
Accounting & Finance Courses 1. Certified Management Accountant Course @ Majody for
Auditing – 6th November 2014 – 29th July 2015].
Test Score 1. International English Language Testing System
(IELTS) – 26th July 2008 [Score: 6.0 out of 9.0].
Key Financial Models 2016
1. Converting a holding company business model in which this holding company owns insurance companies in 7 Arab
countries. It wants to present a 3-year forecast to its board of directors where it wants to integrate new products
& services, implement new retrocession strategy, and outsource non-core operating activities.
2. Meeting the Central Bank of Bahrain’s requirement to register & establish a Captive Reinsurance Company in
Bahrain.
3. Submitting an investment proposal to raise equity/debt to finance the construction of a 16-storey tower in Dubai.
4. Submitting an investment proposal to raise equity/debt to finance the construction a mixed-use development in
Dubai.
5. Submitting an investment proposal to raise equity to expand a service company franchise in Palestine and Saudi
Arabia.
6. Budgeting & forecasting the revenue and expenses of several investments in real estate, textile, hospitality, and
services for an Emirati Businessman.
2015
1. Developing a real estate agency business model for an Australian real estate group.
2. Developing an expansion model of an UAE based insurance company that wants to expand its products mix in the
Qatari market.
3. Developing a pricing model for a cosmetic distribution company based in UAE.
4. Developing financial models for the use of disbursements funded by the World Bank for nine municipalities hosting
Syria refugees to tackle solid waste crisis and other pressing issues in the north of Jordan.
5. Developing a model to unify inventory and raw materials codes for a Saudi aluminum manufacturing company
acquired another Saudi aluminum manufacturing company.
Other models
1. Developing financial models to study the market share and financial analysis of the banking, insurance & real estate
sectors.
2. Developing financial models for feasibility study to raise equity/debt to finance the construction of hospitals,
hotels, car parking, residential buildings, commercial complexes, and malls.
3. Developing financial models for SMEs including recruitment & marketing agencies, care hire companies,
restaurants, and cafes.