jomase vol.9 2014 - isomase.orgisomase.org/jomase/vol.9 jul 2014/vol-9.pdf · teknik mesin fakultas...
TRANSCRIPT
ISSN 2354-7065Vol.9, July.2014
Journal of Ocean, Mechanical and Aerospace -Science and Engineering-
Vol.9: July 2014
ISOMAse
International Society of Ocean, Mechanical and Aerospace -Scientists and Engineers-
Contents
About JOMAse
Scope of JOMAse
Editors
Title and Authors PagesExperimental Study of Gap Distance between Floating Structures in Tandem Arrangement
Jaswar Koto and C.L Siow
1 - 8
Experimental Investigation of Motion and Wave Induced Forced on Semi-Submersible in Regular Wave
N.M Khairuddin and Mohamad Pauzi
9 - 16
A Preliminary Study on Use of Candlenut Shell as a Renewable Source of Energy, Min Indonesia
B H.Tambunan, H.Saptoadi and M.Syamsiro
17 – 20
Lumber Drying Model in Traditional Shipbuilding Bayo-Philip Patrick, Jaswar Koto and C.L Siow
21 - 26
Call for Papers on Ocean, Mechanical and Aerospace “Scientists and Engineers” (OMAse) 2014: http://isomase.org/OMAse_2014.php

Journal of Ocean, Mechanical and Aerospace -Science and Engineering-
Vol.9: July 2014
ISOMAse
International Society of Ocean, Mechanical and Aerospace -Scientists and Engineers-
About JOMAse
The Journal of Ocean, Mechanical and Aerospace -science and engineering- (JOMAse,
ISSN: 2354-7065) is an online professional journal which is published by the International
Society of Ocean, Mechanical and Aerospace -scientists and engineers- (ISOMAse), Insya Allah,
twelve volumes in a year. The mission of the JOMAse is to foster free and extremely rapid scientific
communication across the world wide community. The JOMAse is an original and peer review article
that advance the understanding of both science and engineering and its application to the solution
of challenges and complex problems in naval architecture, offshore and subsea, machines and
control system, aeronautics, satellite and aerospace. The JOMAse is particularly concerned with the
demonstration of applied science and innovative engineering solutions to solve specific industrial
problems. Original contributions providing insight into the use of computational fluid dynamic, heat
transfer, thermodynamics, experimental and analytical, application of finite element, structural and
impact mechanics, stress and strain localization and globalization, metal forming, behaviour and
application of advanced materials in ocean and aerospace engineering, robotics and control,
tribology, materials processing and corrosion generally from the core of the journal contents are
encouraged. Articles preferably should focus on the following aspects: new methods or theory or
philosophy innovative practices, critical survey or analysis of a subject or topic, new or latest
research findings and critical review or evaluation of new discoveries. The authors are required to
confirm that their paper has not been submitted to any other journal in English or any other
language.

Journal of Ocean, Mechanical and Aerospace -Science and Engineering-
Vol.9: July 2014
ISOMAse
International Society of Ocean, Mechanical and Aerospace -Scientists and Engineers-
Scope of JOMAse
The JOMAse welcomes manuscript submissions from academicians, scholars, and practitioners for
possible publication from all over the world that meets the general criteria of significance and
educational excellence. The scope of the journal is as follows:
• Environment and Safety
• Renewable Energy
• Naval Architecture and Offshore Engineering
• Computational and Experimental Mechanics
• Hydrodynamic and Aerodynamics
• Noise and Vibration
• Aeronautics and Satellite
• Engineering Materials and Corrosion
• Fluids Mechanics Engineering
• Stress and Structural Modeling
• Manufacturing and Industrial Engineering
• Robotics and Control
• Heat Transfer and Thermal
• Power Plant Engineering
• Risk and Reliability
• Case studies and Critical reviews
The International Society of Ocean, Mechanical and Aerospace –science and engineering is inviting
you to submit your manuscript(s) to [email protected] for publication. Our objective is to
inform authors of the decision on their manuscript(s) within 2 weeks of submission. Following
acceptance, a paper will normally be published in the next online issue.

Journal of Ocean, Mechanical and Aerospace -Science and Engineering-
Vol.9: June 2014
ISOMAse
International Society of Ocean, Mechanical and Aerospace -Scientists and Engineers-
Editors
Chief-in-Editor
Jaswar Koto (Ocean and Aerospace Research Institute, Indonesia
Universiti Teknologi Malaysia, Malaysia)
Associate Editors
Adhy Prayitno (Universitas Riau, Indonesia)
Adi Maimun (Universiti Teknologi Malaysia, Malaysia)
Agoes Priyanto (Universiti Teknologi Malaysia, Malaysia)
Ahmad Fitriadhy (Universiti Malaysia Terengganu, Malaysia)
Ahmad Zubaydi (Institut Teknologi Sepuluh Nopember, Indonesia)
Buana Ma’ruf (Badan Pengkajian dan Penerapan Teknologi, Indonesia)
Carlos Guedes Soares (Centre for Marine Technology and Engineering (CENTEC),
University of Lisbon, Portugal)
Dani Harmanto (University of Derby, UK)
Iis Sopyan (International Islamic University Malaysia, Malaysia)
Jamasri (Universitas Gadjah Mada, Indonesia)
Mazlan Abdul Wahid (Universiti Teknologi Malaysia, Malaysia)
Mohamed Kotb (Alexandria University, Egypt)
Priyono Sutikno (Institut Teknologi Bandung, Indonesia)
Sergey Antonenko (Far Eastern Federal University, Russia)
Sunaryo (Universitas Indonesia, Indonesia)
Tay Cho Jui (National University of Singapore, Singapore)
Published in Indonesia.
JOMAse
ISOMAse, Jalan Sisingamangaraja No.89 Pekanbaru-Riau Indonesia http://www.isomase.org/
Printed in Indonesia.
Teknik Mesin Fakultas Teknik Universitas Riau, Indonesia http://ft.unri.ac.id/
Journal of Ocean, Mechanical and Aerospace-Science and Engineering-, Vol.9
July 20, 2014
1 Published by International Society of Ocean, Mechanical and Aerospace Scientists and Engineers
Experimental Study of Gap Distance between Floating Structures in Tandem Arrangement
Jaswar Koto,a, b* and C.L Siow,b
a)Ocean and Aerospace Research Institute, Indonesia. b)Department of Aeronautics, Automotive and Ocean Engineering, Mechanical Engineering, Universiti Teknologi Malaysia *Corresponding author: [email protected] and [email protected]
Paper History Received: 6-July-2014 Received in revised form: 16-July-2014 Accepted: 19-July-2014 ABSTRACT This research is proposed to study the effect of wave condition to the distance between floating structures which arranged in tandem arrangement. The evaluation on the gap distance between floating structures is an important study for offshore liquefied natural gas, LNG offloading system because small gap distance between floating structures is needed to guarantee the effectiveness of LNG transfer from FPSO to ship but collision between floating structures should be avoided. Therefore, the gap distance between floating structures becomes a main factor to ensure the safety of the arrangement and effectiveness of the offloading system. Model experiment in regular wave condition was carried out to analyze the motion of floating structures and the effect of wave on changing of gap distance between structures. The time domain motion data are measured by Qualisys Camera and then Fourier Transformation method is applied to transform the data to frequency domain for further analysis. The frequency domain data is utilized in this research to find the tendency of gap distance between floating structures due to the effect of structures response and wave condition. From the study, an empirical equation to simulate the minimum gap distance between floating structures is introduced. KEY WORDS: Gap Distance, Floating Structures, Motion.
NOMENCLATURE LNG Liquefied Natural Gas FPSO Floating Production Storage Offloading HOBEM Higher-Order Boundary Element Method FLNG Floating Liquefied Natural Gas DOF Degree of Freedom TLP Tension Leg Platform 1.0 INTRODUCTION The number of offshore exploration activity in deep water area is increasing now day due to reduce of natural source in land or near shore area. In deep water area, floating structures are only alternative to apply for the oil and gas exploration process. However, the motion of floating structure is easily influence by wave and this arise a safety issue especially in multiple floating structure system. During LNG offloading process, the FPSO and ship is required to arrange in small distance to ensure the effectiveness of the offloading process. Hence, the study of the gap distance in multiple floating structures becomes important to ascertain the safety of the structures arrangement and avoid of accident to occur.
Response of structures to environment at open water is an important criterion required to evaluate to ensure the system operates safely. The comparison between single floating structures with multiple structures made by Siow et al. showed that the hydrodynamic interaction effect may cause the floating structures to experience larger motion amplitude in all six types of motion [13]. This phenomenon can cause accidents on floating structures such as crash between structures. Therefore, multi structures operation should give more attention during design and it requires more accurate analysis of hydrodynamic interactions between closely moored structures [6].
To avoid collision occur in multiple floating structures system, the proper arrangement of the floating structures is required. One

Journal of Ocean, Mechanical and Aerospace-Science and Engineering-, Vol.9
July 20, 2014
2 Published by International Society of Ocean, Mechanical and Aerospace Scientists and Engineers
of the factors must evaluate in structures arrangement is the distance between floating structures. The ocean wave is one of the energy sources to generate the motion of floating structures. The gap distance between floating structures is changed depend on the motion of both floating structures from time to time. This causes the study of the influence of structures motion to reduce of the distance between structures respect to the original distance become significant important to avoid accident occur.
To understand changing distance between floating structures due to the motion induced by wave, Siow et al studied theoretical concept on the effect of structure motions to the reduce of gap distance between floating structure and conduced an experimental study [24, 25]. In this research, the analysis of influence of wave to the minimum distance between structures is focused. The mentioned minimum gap distance in this paper mean minimum distance between two floating structures achieved due to surge motions induced by wave. To study this, the semi-submersible and TLP models are selected and arranged in tandem arrangement. The model experimental is conducted from wavelength around 2 meters to 9 meters. The analysis is made to obtain the relationship between minimum gap distance between both the selected structures to the effect of structures’ motion response and wave condition. 2.0 LITERATURE REVIEW Matos et.al commented that the vertical plane motions induced by heave, roll and pitch should be kept adequately low to guarantee the safety of the floating structure, risers and umbilical pipes and other important facilities use in oil production [22]. The operability and safety of floating bodies operation are greatly determined by the relative motions between them. So, the accurate motion prediction of two bodies included all the hydrodynamic interaction is greatly important [10].
Motions of floating structures can be analysed by applying strip theory and potential theory. A number of notable studies were carried out to study hydrodynamic interaction phenomena such as Ohkusu[12] and Kodan[9].
Hess and Smith [5], Van Oortmerssen[17] and Loken[11] studied on non-lifting potential flow calculation about arbitrary 3D objects. They utilized a source density distribution along the structure surface and solved for distribution necessary to lake the normal component of the fluid velocity zero on the boundary. Also, Wu etal.studied the motion of a moored semi-submersible in regular waves numerically and experimentally. In their mathematical formulation, the moored semi-submersible was modeled as an externally constrained floating body in waves, and derived the linearized equation of motion [18].
Yilmaz and Incecik analysed the excessive motion of moored semi-submersible. They developed two different time domain techniques due to mooring stiffness, viscous drag forces and damping; the mathematic models are strong nonlinearities in the system. In the first technique, first-order wave forces acting on a structure which considered as a solitary excitation force and evaluated by using the Morison equation. In the second technique, mean drift forces were used to calculate slow varying wave forces and simulate slow varying and steady motions [19]. Söylemez developed a technique to predict damaged semi-submersible motion under wind, current and wave. An approaching equation
of motion based on Newton’s second law was used in the research to develop a nonlinear numerical technique for both intact and damaged condition in time domain [14].
Besides, the hydrodynamic interaction effect was studied by Kashiwagi. He introduced a hierarchical interaction theory in the framework of linear potential theory used to study hydrodynamic interactions between a large numbers of columns supporting flexible structure. He also furthers the research to investigate wave drift force and moment on two side by side arranged ships by using Higher-Order Boundary Element Method (HOBEM). His research obtained that the hydrodynamic interaction force is more predominant in the motion equation in the shorter wavelength region due to resonant phenomena. Kashiwagi was also concluded that the intensity of the interaction force is dependent upon the ratio of the wavelength to the separation distance between two adjacent cylinders. After that, Kashiwagi was also investigated the applicability of wave interaction theory apply to simulate the small gap length condition. The study obtained that the wave interaction theory able to predict the motion accurately if the separation between the structures is satisfied with the addition theorem of Bessel functions [8].
Besides, Choi and Hong were also applied HOBEM to analysis hydrodynamic interactions of multi-body system [3]. Clauss et al. analyzed the sea-keeping behavior of a semi-submersible in rough waves in the North Sea by numerical and experimental method. They used panel method TiMIT (Time-domain investigations, developed at the Massachusetts Institute of Technology) for wave-structure interactions in time domain. The theory behind TiMIT is strictly linear and thus applicable to moderate sea condition only [4].
On the other hand, Spyros was also purposed a design oriented semi-analytical method to solve the radiation problem and evaluate the hydrodynamic and interaction coefficients [15]. An analytical solution to solve hydrodynamic diffraction problem of arrays of elliptical cylinders were also introduced by Ioannis and Spyros [7]. In the research, he obtained that the variation of hydrodynamic loading on the interaction cases is in relative to the wave heading angle. Besides, the effect of structures numbers affects to hydrodynamic interaction was also covered by Tajali et al. [16]. Their research results indicated that by increase the number of pontoons can cause the peak frequency and peak amplitude for all motion increase.
A numerical method also employed by Zhu et.al to study the effect of gap in multiple box shape structures system. In that study, the potential for incident wave and scattering wave were ignored, the motion of the structures is assumed only affected by radiated wave [21]. The gap distance was ranged from 1% of breadth to 50% of breadth. The simulation showed that the hydrodynamic interaction between floating structures can caused by the surge, sway and heave motion; however, only sway motion shows a strong interaction at certain resonance wave number. And then, Zhu et al. also conducted a research on hydrodynamic resonance phenomena of three dimensional multiple floating structures by applying linear potential theory in time domain. The gap was limited to 1% compared to the breadth. The research found that peak force response on floating bodies at resonance frequency is same between frequency domain technique and time domain technique. This proved that the time domain technique can be an alternative to investigate hydrodynamic interaction phenomena between floating bodies in small gap [21].

Journal of Ocean, Mechanical and Aerospace-Science and Engineering-, Vol.9
July 20, 2014
3 Published by International Society of Ocean, Mechanical and Aerospace Scientists and Engineers
Zhao etal. was carried out a study of hydrodynamic interaction between FLNG vessel and LNG carrier which arranged in side by side arrangement. They were observed that the hydrodynamic interactions give more influence to the surge, sway and yaw motions. In addition, they also discovered that the interaction between structures able to affect the load on the structures connection systems [20].
In addition, few experimental tests were carried out to obtain the motion response of structures. A model test related to interaction between semi-submersible and TLP was carried out by Hassan Abyn et al [1]. In continue Hassan Abyn et.al also tried to simulate the motion of semi-submersible by using HydroSTAR and then analyze the effect of meshing number to the accuracy of execution result and execution time [2]. Besides that, K.U. Tiau was simulating the motion of mobile floating harbor which have similar hull form as semi-submersible by using Morison Equation [23]. To investigate the interaction effect to structures motions, C. L. Siow et.al were made a comparison on the motion of semi-submersible when it alone to interaction condition by using experimental result [13].
To evaluate the effect of the motion to the change of distance between floating structures, the conceptual study was carried out by Siow et.al [24]. This study obtained that the wavelength and the initial distance between floating structures are the main factors influence the minimum distance possible to achieve by the floating structure. The experimental study of minimum gap distance between floating structures also conducted by Siow et al. to propose an empirical equation which can use to define the minimum achievable distance between floating structures when the motion is induced by wave [25].
From the series of reviews, it obtain that a lot of effort was made by many researchers to study the hydrodynamic interaction phenomena. The literature review also shown that the previous research on this area are preferred to study on the effect of hydrodynamic interaction to wave forces acting of structures, change of hydrodynamic coefficient and structures motion in response to wave. To improve the safety of the multiple floating structures system which arranged in small gap distances, this research is proposed to evaluate the change of the gap distance due to the motion of floating structures which induced by wave. 3.0 MODEL EXPERIMENTAL In this study, model experiment was conducted to study the minimum gap length of the floating structures arranged in small gap. The experiment was made at UTM’s towing tank. The long, wide and deep for this towing tank are 120m, 4m and 2.5m. In addition, gravity wave can be generated by this tank has the range of wave period from 0.5 to 2.5 sec with maximum wave heights 0.44m. The experiments were conducted for the conditions where the semi-submersible arranged behind the TLP structure. The distance between both structures in model scale is 310 mm in this experiment tests. 3.1 Models particulars In this experiment, the semi-submersible model was constructed based on GVA 4000 type model. Both the semi-submersible and TLP model were scaled down with ratio 1:70.
Upon the model completely constructed, inclining test, swing frame test, oscillating test, decay test and bifilar test were carried out to identify the hydrostatic particular for both the semi-submersible and TLP. Results collected from there tests were summarized as in table 1.
Table 1: Principal particular of Models Character TLP Semi Unit Length 57.75 66.78 m Width 57.75 58.45 m Draft 21 16.73 m
Displacement 23941 14921 m3 Water Plan Area 715 529.6 m2
Number of Columns 4 4 Pontoon length 31 66.78 m Pontoon depth 7.28 6.3 m Pontoon width 9.73 13.3 m Pontoons centerline separation
- 45.15 m
Columns longitudinal spacing (centre)
- 45.58 m
Column diameter - 10.59 m GMT 7.77 2.87 m GML 7.63 4.06 m
KXX 26.11 31.64 m KYY 26.46 26.95 m KZZ 30.8 35 m
CGZ -6.37 -0.28 m 3.2Motion tests The floating structures were assumed to experience six degrees of freedom. The six DOF motions of the models were moored on springs and measured by optical tracking system (Qualisys Camera).
Water-proof load cells are attached to the springs at the model fairlead locations to measure applied tension force on the model from the mooring springs directly. The purpose of this setup is to avoid any losses in force. Lightweight ring gauge load cells used here are sufficiently sensitive to provide a good signal for small mooring line tensions. The measured mooring line tensions are recorded by Dewetron Data Acquisition System (DAQ).
Due to the limitation of this tank, the tendons, risers and moorings are not actually presented in the model tests. Therefore, this model setup was expected had less damping and caused larger motion amplitude at model scale compared to the prototype.
Soft lateral springs were attached to the TLP and Semi-submersible to give horizontal restoring force to prototype TLP tendons and Semi-submersible moorings. One Side of the soft lateral spring was clamped to the mooring posts attached to the carriage and other side of the ends was connected to load cells at model side to measure the spring tension forces at the model. Anchor locations for the springs were proper selected to ensure mooring lines of the model make 45 degree angle with respect to the fairlead attachment points on the model. The spring pretension and spring stiffness applied in the test was same as horizontal stiffness required for the system to match the natural periods of the horizontal motion (surge, sway) for the TLP and Semi-submersible. Due to limitation of water deep, almost
Journal of Ocean, Mechanical and Aerospace-Science and Engineering-, Vol.9
July 20, 2014
4 Published by International Society of Ocean, Mechanical and Aerospace Scientists and Engineers
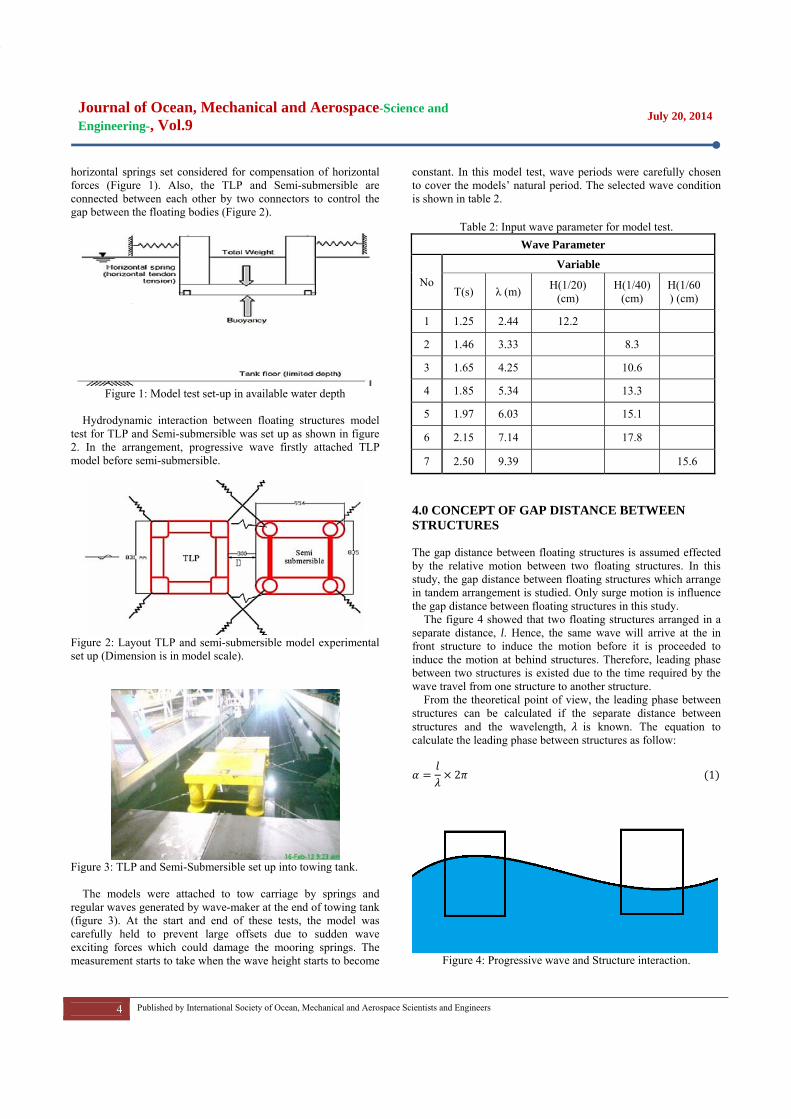
horizontal springs set considered for compensation of horizontal forces (Figure 1). Also, the TLP and Semi-submersible are connected between each other by two connectors to control the gap between the floating bodies (Figure 2).
Figure 1: Model test set-up in available water depth
Hydrodynamic interaction between floating structures model
test for TLP and Semi-submersible was set up as shown in figure 2. In the arrangement, progressive wave firstly attached TLP model before semi-submersible.
Figure 2: Layout TLP and semi-submersible model experimental set up (Dimension is in model scale).
Figure 3: TLP and Semi-Submersible set up into towing tank.
The models were attached to tow carriage by springs and regular waves generated by wave-maker at the end of towing tank (figure 3). At the start and end of these tests, the model was carefully held to prevent large offsets due to sudden wave exciting forces which could damage the mooring springs. The measurement starts to take when the wave height starts to become
constant. In this model test, wave periods were carefully chosen to cover the models’ natural period. The selected wave condition is shown in table 2.
Table 2: Input wave parameter for model test. Wave Parameter
No Variable
T(s) λ (m) H(1/20) (cm)
H(1/40) (cm)
H(1/60) (cm)
1 1.25 2.44 12.2 2 1.46 3.33 8.3
3 1.65 4.25 10.6
4 1.85 5.34 13.3
5 1.97 6.03 15.1
6 2.15 7.14 17.8
7 2.50 9.39 15.6
4.0 CONCEPT OF GAP DISTANCE BETWEEN STRUCTURES
The gap distance between floating structures is assumed effected by the relative motion between two floating structures. In this study, the gap distance between floating structures which arrange in tandem arrangement is studied. Only surge motion is influence the gap distance between floating structures in this study.
The figure 4 showed that two floating structures arranged in a separate distance, l. Hence, the same wave will arrive at the in front structure to induce the motion before it is proceeded to induce the motion at behind structures. Therefore, leading phase between two structures is existed due to the time required by the wave travel from one structure to another structure.
From the theoretical point of view, the leading phase between structures can be calculated if the separate distance between structures and the wavelength, is known. The equation to calculate the leading phase between structures as follow:
2 1
Figure 4: Progressive wave and Structure interaction.
Leading phase between structures, α
Separate Distance, l
(A) (B) Initial Gap Distance, GD

Journal of Ocean, Mechanical and Aerospace-Science and Engineering-, Vol.9
July 20, 2014
5 Published by International Society of Ocean, Mechanical and Aerospace Scientists and Engineers
The equation (1) shown that the leading phase between structures, is in the ratio of structures separation distance, to the wave length, .
Due to the arrangement of structure, it is obtained that wave arrived on structure (B) always leading by a phase, respect to structure (A). Therefore, the motion on the structure (B) will always have a leading phase of compare to structure (A). In this case, the surge motion of the floating structures can be represented as following equation.
sin 2
sin 3
Where and is the surge motion for structure (A)
and structure (B), and is the surge amplitude for structure (A) and structure (B), and is the leading phase between wave to structure motion for structure (A) and structure (B), is the leading phase between structures, is the wave speed in rad/seconds and is the time in seconds.
Next, the change of gap distance between two floating structures can be calculated based on the relative motion of the floating structures. The gap distance between two floating structures, in tandem arrangement can be calculated by considered the original gap distance, , surge motion of both structures. The simplified equation as follows,
4
sin
sin 5
From the equation (4), it is obtained that the individual surge motion of the floating structures will contribute to the change of gap distance between floating structures when the wave progress pass through the floating structures.
Based on the equation (5), it is obtained that the gap distance is changed according to time. The minimum gap distance in the specific wave condition will depend on the response of the structures’ motion response, wavelength and original gap distance. The function of the minimum gap distance between two floating structures possible to achieve can be represented in following function.
, , , 6
Where is the nearest gap distance between two floating
structure achieved due to surge motion, and is the surge motion of structures 1 and structures 2 and is the initial structures distance before the wave arrive. 5.0 EXPERIMENTAL DATA ANALYSIS
The experiment in this research is interested to find the possible minimum gap distance between two floating structures when the motion is induced by wave. The Qualisys Camera is used in the experiment to record the time domain position coordinate of the floating structures in wave tank. The changing of distance between two floating structure in time domain was calculated by
considering the changing of position in the tank for both the TLP and semi-submersible respective to its original position. The equation to calculate the distance between two floating structures,
in the function of time, t, initial gap length, and the amount of gap, ) decrease in time as follow:
7 where the amount of gap decrease in time is calculated as follows:
8 where, Is the position of in front structure which is TLP and Is the position of behind structure which is Semi-Submersible in this experiment. Zero position is located at the structures’ individual initial position before advance by incident wave.
To obtain the minimum gap distance possible to achieve by the motion of both structures, the time domain gap distance data,
is converted to frequency domain, to obtain the amplitude of the minimum gap length [25]. The relationship between the minimum gap distance with the structures’ motion and wave condition is defining using the experimental data which converted to frequency domain.
6.0 MODEL EXPERIMENT RESULT The regular wave experiment was conducted in head sea condition and the floating structures arranged in tandem arrangement. From the data recorded, the gap distance between floating structures was calculated by equation (8).From the conceptual study, it is obtained that the minimum achieved gap distance between floating structures is in the function
, , , . Due to the experiment is only conducted in same initial gap distance, hence only the relationship between minimum achieved gap length with structures motion and wavelength is focused and discussed here.
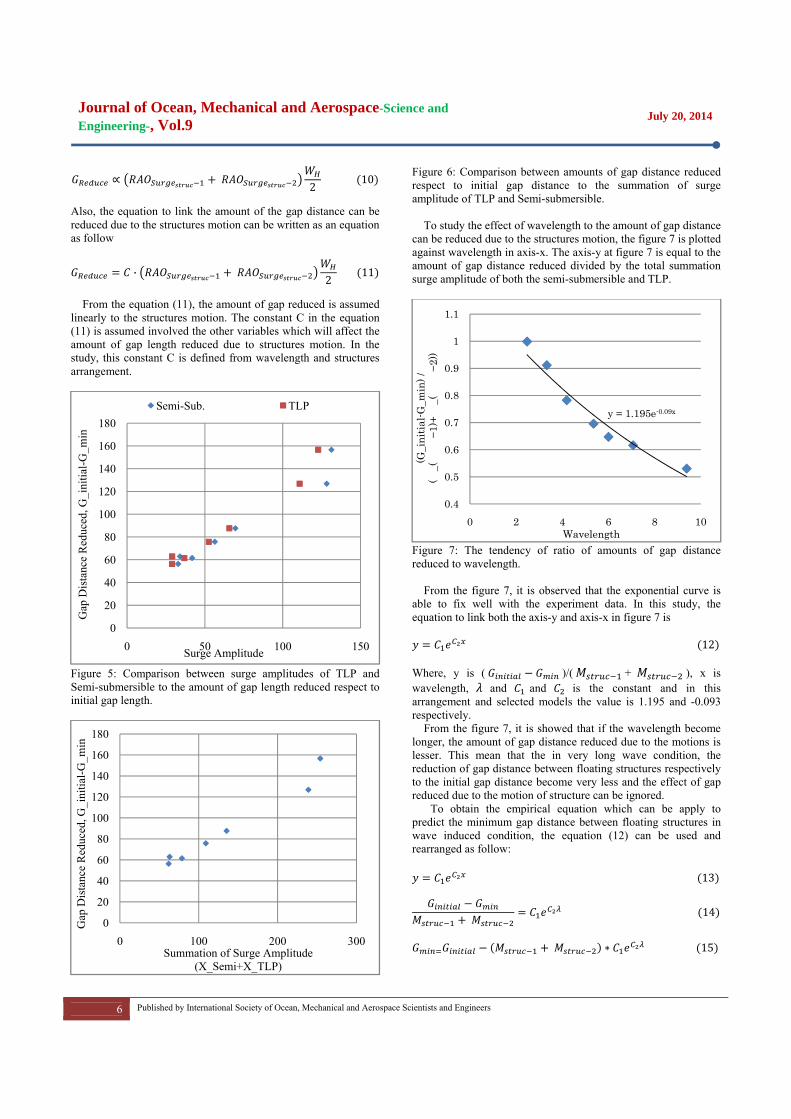
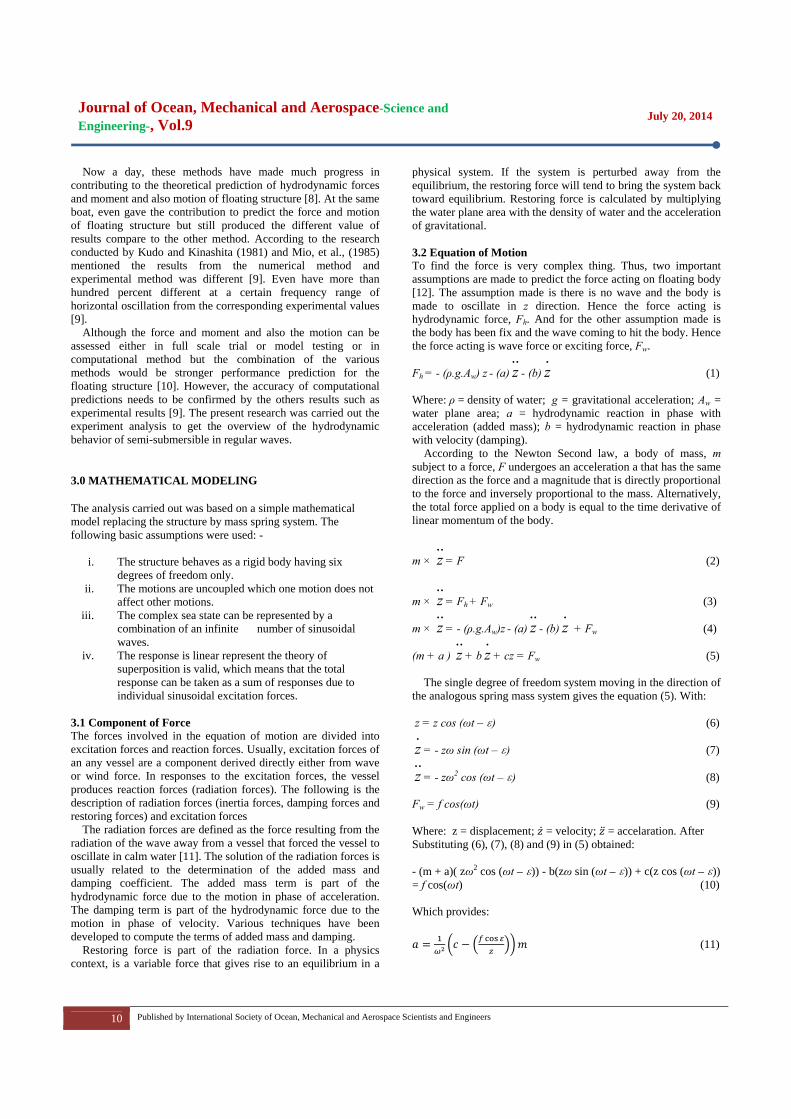
The figure 5 and 6 showed the distribution of amount of gap length reduced verses the structure motion and summation of structures motion. From both the figure, it is obtained that the gap length between floating structures is reduced in the linear relationship to the individual structure motion and the summation of structures motion. From both the figures, it is clearly obtained that the larger structures motion will lead to closer distance between floating structures. This observation shown that the better mooring systems which can reduce the structure horizontal motions and help to reduce the possibility of clashing between floating structures.
From the finding, it can be represented the relationship between amount of gap distance decrease compare to initial gap distance is in the linear function to the structures motion where
9
Since the structures motion in wave condition is often represent
by the response amplitude operator, hence the above function can be written in the following format
Journal of Ocean, Mechanical and Aerospace-Science and Engineering-, Vol.9
July 20, 2014
6 Published by International Society of Ocean, Mechanical and Aerospace Scientists and Engineers
2 10 Also, the equation to link the amount of the gap distance can be reduced due to the structures motion can be written as an equation as follow
· 2 11
From the equation (11), the amount of gap reduced is assumed linearly to the structures motion. The constant C in the equation (11) is assumed involved the other variables which will affect the amount of gap length reduced due to structures motion. In the study, this constant C is defined from wavelength and structures arrangement.
Figure 5: Comparison between surge amplitudes of TLP and Semi-submersible to the amount of gap length reduced respect to initial gap length.
Figure 6: Comparison between amounts of gap distance reduced respect to initial gap distance to the summation of surge amplitude of TLP and Semi-submersible.
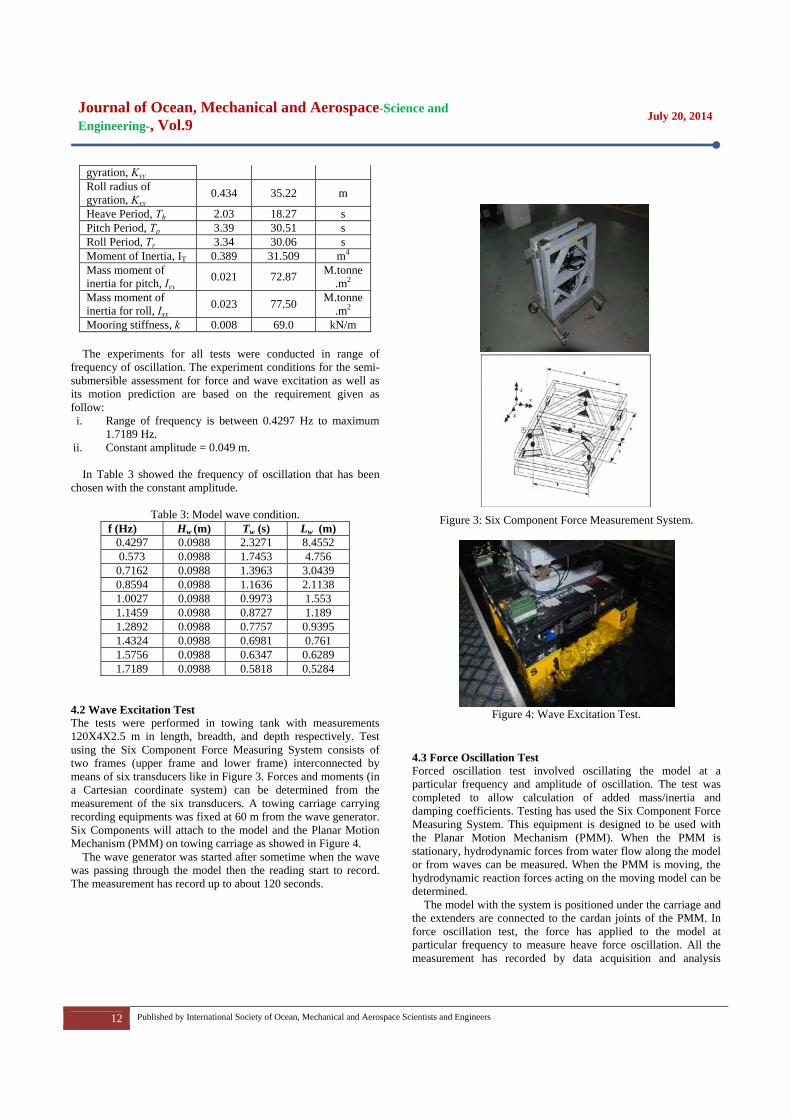
To study the effect of wavelength to the amount of gap distance can be reduced due to the structures motion, the figure 7 is plotted against wavelength in axis-x. The axis-y at figure 7 is equal to the amount of gap distance reduced divided by the total summation surge amplitude of both the semi-submersible and TLP.
Figure 7: The tendency of ratio of amounts of gap distance reduced to wavelength.
From the figure 7, it is observed that the exponential curve is
able to fix well with the experiment data. In this study, the equation to link both the axis-y and axis-x in figure 7 is
12
Where, y is ( )/( + ), x is wavelength, and and is the constant and in this arrangement and selected models the value is 1.195 and -0.093 respectively.
From the figure 7, it is showed that if the wavelength become longer, the amount of gap distance reduced due to the motions is lesser. This mean that the in very long wave condition, the reduction of gap distance between floating structures respectively to the initial gap distance become very less and the effect of gap reduced due to the motion of structure can be ignored.
To obtain the empirical equation which can be apply to predict the minimum gap distance between floating structures in wave induced condition, the equation (12) can be used and rearranged as follow:
13
14
15
0
20
40
60
80
100
120
140
160
180
0 50 100 150
Gap
Dis
tanc
e R
educ
ed, G
_ini
tial-G
_min
Surge Amplitude
Semi-Sub. TLP
0
20
40
60
80
100
120
140
160
180
0 100 200 300
Gap
Dis
tanc
e R
educ
ed, G
_ini
tial-G
_min
Summation of Surge Amplitude (X_Semi+X_TLP)
y = 1.195e-0.09x
0.4
0.5
0.6
0.7
0.8
0.9
1
1.1
0 2 4 6 8 10
(G_i
nitia
l-G_m
in) /
(_(
−1)+
_(
−2))
Wavelength

Journal of Ocean, Mechanical and Aerospace-Science and Engineering-, Vol.9
July 20, 2014
7 Published by International Society of Ocean, Mechanical and Aerospace Scientists and Engineers
Also, from equation (11), we can rewrite the equation to include the structure response amplitude operator as follow
2
16
7.0 DISCUSSION
From the Figure 8, the empirical equation showed well agreed with experiment’s result. The comparison in Table 3 shown the percentage of difference between the result obtained by empirical equation and experiment is relatively small. The trend of change for the minimum gap to wavelength between both methods is similar as shown in the figure 8. The minimum observed gap length in this study is occurring at wavelength around 7.07meters. This is because both the floating structures experienced the largest surge motion in this wavelength.
In the comparison between experimental result and the empirical equation, it is observed that the introduced empirical equation (equation 16)can be fixed will with the experimental result directly measured from experiment. Based on the Table 3, the largest different between these two results is around 4.11%. This shown that the introduced empirical equation is fixed with the experimental result for this selected experiment model. However, to ensure the accuracy of the calculated result from the empirical equation, the RAO of the structures must be executed correctly. This is because the empirical equation is very sensitive with the RAO of both the structures.
The weakness in this empirical equation is the effect of the arrangement or initial distance between floating structures is no take into the consideration. This is because the experiment is only conducted for same initial gap distance. It is predicted that if the initial gap distance is changed, the constant, and in the equation (16) will change. Therefore, the accuracy of this empirical equation for other models is required to recheck.
Figure 8: Predicted minimum gap distance between floating structures based on experimental data and empirical calculation.
In this study, the relationship between the amount gap distance
reduced due to the structures motion and the wavelength is studied. From the experimental result, it can be observed the strong relationship is existed between the reduced gap distance with the structures motions and wavelength. To reduce the possibility of crash between structures, the structures horizontal plane motions should be properly control and analysis. Because the better control of structures motion is the initial step to avoid large change on the distance between floating structures.
Table 3: Comparison minimum gap distance predicted by empirical calculation to experimental data. Wavelength,
m Percentage different between empirical and
experimental result, % 2.48 1.27 3.33 0.85 4.20 0.83 5.35 1.41 6.00 2.20 7.07 0.46 9.39 4.11
8.0 CONCLUSION In conclusion, this study has obtained that the gap distance reduced is strongly influence by the structures motion and wavelength. In this two floating structures system, the behavior of both the structures is required to consider when designing the structures arrangement. The strong relationship between the minimum achieved gap distance with the structures motion shows that the floating structures motion should be minimized especially in multiple floating structures system when both the structures are required to place close to each other such as during the LNG offloading operation. This target can be achieved by designed a more stiffness mooring system or avoided to operate the system in unfavour sea condition where the structures will experience the largest motions due to the progressive wave. The empirical equation introduced in this paper agrees with the experimental result. However, it is required to further study to involve the effect of different arrangement and structures models. ACKNOWLEDGEMENT The authors are very grateful to the Marine Technology Centre staff in UTM Malaysia and Department of Aeronautics, Automotive and Ocean Engineering, Universiti Teknologi Malaysia (UTM) for support this research.
REFERENCE 1. Abyn, H., Maimun, A., Jaswar, Rafiqul Islam, M., Magee,
A., Bodagi, B., Pauzi, M. (2012).Model Test of Hydrodynamic Interactions of Floating Structures in Regular Waves.Proc. of The 6th Asia-Pacific Workshop on Marine Hydrodynamics (APHydro2012).UTM, Malaysia.
0
50
100
150
200
250
300
0 2 4 6 8 10
Min
imum
Gap
Dis
tanc
e
Wavelength
Experimental Data Empirical Cal.

Journal of Ocean, Mechanical and Aerospace-Science and Engineering-, Vol.9
July 20, 2014
8 Published by International Society of Ocean, Mechanical and Aerospace Scientists and Engineers
2. Abyn, H., Maimun, A., Jaswar, Rafiqul Islam, M., Magee, A., Bodagi, B., Pauzi, M. (2012). Effect of Mesh Number on Accuracy of Semi-Submersible Motion Prediction.Proc. of the 6th Asia-Pacific Workshop on Marine Hydrodynamics (APHydro2012).UTM, Malaysia (2012).
3. Choi, Y. R., Hong, S. Y. (2002). An analysis of hydrodynamic interaction of floating multi-body using higher-order boundary element method.Proc. of 12th ISOPE.Kita-Kyushu.
4. Clauss, G. F., Schmittner, C., Stutz, K. (2002). Time-Domain Investigation of a Semi-Submersible in Rogue Waves. Proc. of the 21st International Conference on Offshore Mechanics and Arctic Engineering (OMAE2002).
5. Hess, J. L., Smith, A. M. O. (1964). Calculation of Nonlifting Potential Flow About Arbitrary 3D Bodies. Journal of Ship Research.
6. Hong, S. Y., Kim, J. H., Cho, S. K., Choi, Y. R., Kim, Y. S. (2005). Numerical and experimental study on hydrodynamic interaction of side-by-side moored multiple vessels. Ocean Engineering, 32(7), 783-801.
7. Ioannis, K. C. (2011). Three dimensional wave scattering by arrays of elliptical and circular cylinders.Ocean Engineering, Vol. 38(13), pp. 1480-1494.
8. Kashiwagi, M. and Q.-q.Shi. (2010). Pressure distribution computed by wave-interaction theory for adjacent multiple bodies. Journal of Hydrodynamics, Ser. B, 22(5, Supplement 1): p. 526-531.
9. Kodan, N. (1984). The motions of adjacent floating structures in oblique waves. Proc. of Third Offshore Mechanics and Arctic Engineering OMAE, New Orleans.
10. Koo, B. J., Kim, M. H. (2005). Hydrodynamic interactions and relative motions of two floating platforms with mooring lines in side-by-side offloading operation.Applied Ocean Research, 27(6), 292-310.
11. Loken, A. E. (1981). Hydrodynamic interaction between several floating bodies of arbitrary form in Waves.Proc. of International Symposium on Hydrodynamics in Ocean Engineering, NIT, Trondheim.
12. Ohkusu, M., (1974). Ship motions in vicinity of a structure. Proc. of International Conference on Behavior of Offshore Structure.NIT, Trondheim.
13. Siow, C.L., Jaswar, Afrizal, E., Abyn, H., Adi, M., Pauzi, M. (2013). Comparative of Hydrodynamic Effect between Double Bodies to Single Body in Tank.The 8th International Conference On Numerical Analysis In Engineering.Pekanbaru, Indonesia
14. Söylemez, M. (1995). Motion tests of a twin-hulled semi-submersible. Ocean Engineering, 22(6), 643-660.
15. Spyros A. M. (2004). Hydrodynamic coefficients in heave of two concentric surface-piercing truncated circular cylinders.Applied Ocean Research, Vol. 26 (3-4), pp. 84-97.
16. Tajali, Z. and Shafieefar, M. (2011).Hydrodynamic analysis of multi-body floating piers under wave action. Ocean Engineering, 38(17–18): p. 1925-1933.
17. Van Oortmerssen, G. (1979). Hydrodynamic interaction between two structures of floating in waves. Proc. of BOSS ‘79. Second International Conference on Behavior of Offshore Structures, London.
18. Wu, S., Murray, J. J., Virk, G. S. (1997). The motions and internal forces of a moored semi-submersible in regular waves.Ocean Engineering, 24(7), 593-603.
19. Yilmaz, O., Incecik, A. (1996). Extreme motion response analysis of moored semi-submersibles.Ocean Engineering, 23(6), 497-517.
20. Zhao, W.H,Yang, J.M, andHu, Z.Q. (2012).Hydrodynamic interaction between FLNG vessel and LNG carrier in side by side configuration. Journal of Hydrodynamics.Ser. B, Vol. 24, Issue 5, Pages 648-657.
21. Zhu, H.-r., Zhu, R.-c., Miao,G.-p. (2008). A Time Domain Investigation on the Hydrodynamic Resonance Phenomena of 3-D Multiple Floating Structures. Journal of Hydrodynamics.Ser. B, 20(5): p. 611-616.
22. Matos, V. L. F., Simos, A. N., and Sphaier, S. H. (2011). Second-order resonant heave, roll and pitch motions of a deep-draft semi-submersible: Theoretical and experimental results. Ocean Engineering. 38(17–18), 2227-2243.
23. Tiau, K.U., Jaswar, Abyn, H. and Siow, C.L. (2012). Study On Mobile Floating Harbor Concept.Proc. of the 6th Asia-Pacific Workshop on Marine Hydrodynamics (APHydro2012). UTM, Malaysia.
24. Jaswar and Siow, C. L. (2013). Concept of Gap Distance in Motion Interaction between Multiple Floating Bodies. Journal of Ocean, Mechanical and Aerospace Science and Engineering. Vol.2, 13-19.
25. Siow, C.L., Koto, J., Abyn, H. &Maimum, A. (2013). Gap distance analysis of floating structures in tandem arrangement. Developments in Maritime Transportation and Exploitation of Sea Resources. Taylor & Francis Group, London. P. 255-263.
26. C.L Sow, Jaswar Koto and Hassan Abyn. (2014). Semi-Submersible Heave Response Study Using Diffraction Potential Theory with Viscous Damping Correction. Journal of Ocean, Mechanical and Aerospace Science and Engineering. Vol.5, 23-29.
27. Siow, C. L, Jaswar Koto, Hassan Abyn, N.M Khairuddin. (2014). Linearized Morison Drag for Improvement Heave Response of Semi-Submersible by Diffraction Potential. Journal of Ocean, Mechanical and Aerospace Science and Engineering. Vol.6, 8-16.
28. Muhammad Farid Abdul Halim and Jaswar Koto (2014). Hydrodynamic Interaction of Three Floating Structures. Journal of Ocean, Mechanical and Aerospace Science and Engineering. Vol.8, 1-11.

Journal of Ocean, Mechanical and Aerospace-Science and Engineering-, Vol.9
July 20, 2014
9 Published by International Society of Ocean, Mechanical and Aerospace Scientists and Engineers
Experimental Investigation of Motion and Wave Induced Forced on Semi-Submersible in Regular Wave
N.M Khairuddina * and Mohamad Pauzib
a)Departement of Aeronautics, Automotive and Ocean Engineering, Universiti Teknologi Malaysia 81310 Johor Bahru, Malaysia b)Marin Technology Center, Universiti Technologi Malaysia, 81310 UTM Johor Bahru, Johor, Malaysia *Corresponding author: [email protected]
Paper History Received: 15-April-2014 Received in revised form: 14-July-2014 Accepted: 18-July-2014 ABSTRACT For the design of safe and economic offshore structure the knowledge of the wave environment and related wave-structure interactions is required. In general, frequency domain analysis has been regarded as an adequate tool for the assessment of motion and loads which are needed to derive the stress and hydrodynamics forces as well as operational limitations. For investigating the behavior of response to specific sea conditions, this research analyzes the behavior of the response due to motion and wave forces as well as hydrodynamics with focus on a type square column. The frequency domain investigation has used to provide the response behaviors on the wetted body of the semi-submersible in regular waves. For investigation,, the selected sea condition for regular wave is generated in a physical wave tank, and the behavior of the response on the semi-submersible is evaluated at model scale. Equation of motion was formulated to evaluate the added mass, damping and stiffness at every frequency step. In frequency domain analysis, the hydrodynamics responses were obtained. KEY WORDS: Experimental Investigation; Wave Induced Force; Semi-submersible 1.0 INTRODUCTION
Offshore production platforms have been installed predominantly as fixed steel template jacket or concrete gravity structures for operations in water depth up to 300 m. Manufacturing, installation and maintenance costs of fixed platforms rise rapidly as water depth increase [1]. Relatively small increases in manufacturing and installation costs with increased water depth make the semisubmersible platforms an attractive alternative for deep water oil operations. About 40 % of floating structures available worldwide are semi-submersibles serving primarily as drilling and production systems. Semi-submersibles are multi-legged floating structures with a large deck [2].
Following a few catastrophic accidents involving mobile offshore drilling platforms, various studies were carried out to investigate the adequacy of stability criteria applied to offshore mobile platforms which followed an empirical basis considering service experience accumulated for ships over many years [3]. Sea keeping performance is of significant importance in vessel design due to the stationary nature of drilling and production platforms. For the purpose of the sea keeping design, its response assessment to environmental forces is evaluated using either physical experiments or computational simulations.
2.0 LITERATURE REVIEW When designing an offshore structure, one of the first and most critical steps is to choose an appropriate method of computing the exciting force on the structure as well as the motion of structure [4]. There have some standard method to predict response on the floating structure for examples are model experimental method, full scale measurement method and the numerical method. For the computational, the wave diffraction theory as well as the empirical Morison theory is the popular method to determine the response on offshore structure. These methods has been discovered by the some researchers [4,5,6,7] and was showed the applicable results to analysis the response of floating structure.
Journal of Ocean, Mechanical and Aerospace-Science and Engineering-, Vol.9
July 20, 2014
10 Published by International Society of Ocean, Mechanical and Aerospace Scientists and Engineers
Now a day, these methods have made much progress in contributing to the theoretical prediction of hydrodynamic forces and moment and also motion of floating structure [8]. At the same boat, even gave the contribution to predict the force and motion of floating structure but still produced the different value of results compare to the other method. According to the research conducted by Kudo and Kinashita (1981) and Mio, et al., (1985) mentioned the results from the numerical method and experimental method was different [9]. Even have more than hundred percent different at a certain frequency range of horizontal oscillation from the corresponding experimental values [9].
Although the force and moment and also the motion can be assessed either in full scale trial or model testing or in computational method but the combination of the various methods would be stronger performance prediction for the floating structure [10]. However, the accuracy of computational predictions needs to be confirmed by the others results such as experimental results [9]. The present research was carried out the experiment analysis to get the overview of the hydrodynamic behavior of semi-submersible in regular waves. 3.0 MATHEMATICAL MODELING The analysis carried out was based on a simple mathematical model replacing the structure by mass spring system. The following basic assumptions were used: -
i. The structure behaves as a rigid body having six degrees of freedom only.
ii. The motions are uncoupled which one motion does not affect other motions.
iii. The complex sea state can be represented by a combination of an infinite number of sinusoidal waves.
iv. The response is linear represent the theory of superposition is valid, which means that the total response can be taken as a sum of responses due to individual sinusoidal excitation forces.
3.1 Component of Force The forces involved in the equation of motion are divided into excitation forces and reaction forces. Usually, excitation forces of an any vessel are a component derived directly either from wave or wind force. In responses to the excitation forces, the vessel produces reaction forces (radiation forces). The following is the description of radiation forces (inertia forces, damping forces and restoring forces) and excitation forces
The radiation forces are defined as the force resulting from the radiation of the wave away from a vessel that forced the vessel to oscillate in calm water [11]. The solution of the radiation forces is usually related to the determination of the added mass and damping coefficient. The added mass term is part of the hydrodynamic force due to the motion in phase of acceleration. The damping term is part of the hydrodynamic force due to the motion in phase of velocity. Various techniques have been developed to compute the terms of added mass and damping.
Restoring force is part of the radiation force. In a physics context, is a variable force that gives rise to an equilibrium in a
physical system. If the system is perturbed away from the equilibrium, the restoring force will tend to bring the system back toward equilibrium. Restoring force is calculated by multiplying the water plane area with the density of water and the acceleration of gravitational. 3.2 Equation of Motion To find the force is very complex thing. Thus, two important assumptions are made to predict the force acting on floating body [12]. The assumption made is there is no wave and the body is made to oscillate in z direction. Hence the force acting is hydrodynamic force, Fh. And for the other assumption made is the body has been fix and the wave coming to hit the body. Hence the force acting is wave force or exciting force, Fw.
Fh = - (ρ.g.Aw) z - (a)..z - (b)
.z (1)
Where: ρ = density of water; g = gravitational acceleration; Aw = water plane area; a = hydrodynamic reaction in phase with acceleration (added mass); b = hydrodynamic reaction in phase with velocity (damping).
According to the Newton Second law, a body of mass, m subject to a force, F undergoes an acceleration a that has the same direction as the force and a magnitude that is directly proportional to the force and inversely proportional to the mass. Alternatively, the total force applied on a body is equal to the time derivative of linear momentum of the body.
m × ..z = F (2)
m × ..z = Fh + Fw (3)
m × ..z = - (ρ.g.Aw)z - (a)
..z - (b)
.z + Fw (4)
(m + a ) ..z + b
.z + cz = Fw (5)
The single degree of freedom system moving in the direction of
the analogous spring mass system gives the equation (5). With: z = z cos (ωt – ɛ) (6) .z = - zω sin (ωt – ɛ) (7) ..z = - zω2 cos (ωt – ɛ) (8) Fw = f cos(ωt) (9) Where: z = displacement; = velocity; = accelaration. After Substituting (6), (7), (8) and (9) in (5) obtained: - (m + a)( zω2 cos (ωt – ɛ)) - b(zω sin (ωt – ɛ)) + c(z cos (ωt – ɛ)) = f cos(ωt) (10) Which provides:
(11)

Journal of Ocean, Mechanical and Aerospace-Science and Engineering-, Vol.9
July 20, 2014
11 Published by International Society of Ocean, Mechanical and Aerospace Scientists and Engineers
sin (12)
c = ρ.g.Aw (13) 4.0 EXPERIMENTAL APPROACH There are four main part of experiment, which will be described in this chapter. The first part will be described on model preparation. Model preparation consists of inclining test, swing table, decay test and spring calibration. It is performed to determine the natural period, vertical centre of gravity of the model (KG), metacentric (GM), radius of gyration for pitch and roll as well stiffness of the soft spring. The inclining test and decay test was conducted in the calm water condition. The second and third part will be described on the experiment to determine the wave excitation and force oscillation test on the structure by using the Six Component measurement system. The last part will be described on the experiment to determine the RAO of the structure using the optical tracking system. All experiments ware conduct in regular waves frequencies.
For the experiment, a scaled model of a semi-submersible has a square pontoon. The length of 1:81 scale model is 1.073 m and weight 107.84 kg. Details of technical specification of the semi-submersible and the model are given in Figure 1and Figure 2.
Figure 1: Main dimension of semi-submersible.
Figure 2: 3-dimension (3D) view of model.
Before experiments were conducted, the model was properly ballasted to the appropriate loading conditions. The model was first ballasted to the required displacement and balanced in water to the appropriate draught. However, the final adjustment of weight was done by considering the four draft marks at each column. The centre of gravity and the metacentric of the model was obtained using inclining test. The detail of the procedures is given in the following sections as well as the decay test, swing test and spring calibration.
4.1 Model Preparation Analysis From the experiment, the analysis of result is done by measuring the parameter using the formula and particular value which are obtained from the test. Table 2 shows the summary of results of model preparation test conducted.
Table 1: Semi-submersible particulars. Designation Unit Full scale Model
Column Centreline Spacing m 67.460 0.832 Column Width m 19.460 0.240 Column Corner Radius m 2.200 0.027 Pontoon Width m 14.260 0.176 Pontoon Height / Level 1 Flat m 8.820 0.108 Level 2 Flat Elevation m 27.200 0.335 Level 3 Flat Elevation m 37.000 0.456 Overall Length, L m 86.920 1.073 Overall Breadth, B m 86.920 1.073 Overall Draft,d m 22.000 0.271
Table 2: Semi-submersible particulars.
Description Model Prototype Unit Mass displacement, ∆ 0.112 58748 M.tonne Overall draft, d 0.271 22 m Center of gravity above base, KG 0.387 31.347 m
Center of buoyancy above base, KB 0.1 8.1 m
Metacentric height above base, KM 0.489 39.609 m
Metacentric, GM 0.0896 7.268 m Metacentric above center of buoyancy, BM
0.389 31.509 m
Pitch radius of 0.448 36.32 m
Journal of Ocean, Mechanical and Aerospace-Science and Engineering-, Vol.9
July 20, 2014
12 Published by International Society of Ocean, Mechanical and Aerospace Scientists and Engineers
gyration, Kyy Roll radius of gyration, Kxx
0.434 35.22 m
Heave Period, Th 2.03 18.27 s Pitch Period, Tp 3.39 30.51 s Roll Period, Tr 3.34 30.06 s Moment of Inertia, IT 0.389 31.509 m4
Mass moment of inertia for pitch, Iyy
0.021 72.87 M.tonne.m2
Mass moment of inertia for roll, Ixx
0.023 77.50 M.tonne.m2
Mooring stiffness, k 0.008 69.0 kN/m
The experiments for all tests were conducted in range of frequency of oscillation. The experiment conditions for the semi-submersible assessment for force and wave excitation as well as its motion prediction are based on the requirement given as follow: i. Range of frequency is between 0.4297 Hz to maximum
1.7189 Hz. ii. Constant amplitude = 0.049 m.
In Table 3 showed the frequency of oscillation that has been chosen with the constant amplitude.
Table 3: Model wave condition.
f (Hz) Hw (m) Tw (s) Lw (m) 0.4297 0.0988 2.3271 8.4552 0.573 0.0988 1.7453 4.756 0.7162 0.0988 1.3963 3.0439 0.8594 0.0988 1.1636 2.1138 1.0027 0.0988 0.9973 1.553 1.1459 0.0988 0.8727 1.189 1.2892 0.0988 0.7757 0.9395 1.4324 0.0988 0.6981 0.761 1.5756 0.0988 0.6347 0.6289 1.7189 0.0988 0.5818 0.5284
4.2 Wave Excitation Test The tests were performed in towing tank with measurements 120X4X2.5 m in length, breadth, and depth respectively. Test using the Six Component Force Measuring System consists of two frames (upper frame and lower frame) interconnected by means of six transducers like in Figure 3. Forces and moments (in a Cartesian coordinate system) can be determined from the measurement of the six transducers. A towing carriage carrying recording equipments was fixed at 60 m from the wave generator. Six Components will attach to the model and the Planar Motion Mechanism (PMM) on towing carriage as showed in Figure 4.
The wave generator was started after sometime when the wave was passing through the model then the reading start to record. The measurement has record up to about 120 seconds.
Figure 3: Six Component Force Measurement System.
Figure 4: Wave Excitation Test.
4.3 Force Oscillation Test Forced oscillation test involved oscillating the model at a particular frequency and amplitude of oscillation. The test was completed to allow calculation of added mass/inertia and damping coefficients. Testing has used the Six Component Force Measuring System. This equipment is designed to be used with the Planar Motion Mechanism (PMM). When the PMM is stationary, hydrodynamic forces from water flow along the model or from waves can be measured. When the PMM is moving, the hydrodynamic reaction forces acting on the moving model can be determined.
The model with the system is positioned under the carriage and the extenders are connected to the cardan joints of the PMM. In force oscillation test, the force has applied to the model at particular frequency to measure heave force oscillation. All the measurement has recorded by data acquisition and analysis

Journal of Ocean, Mechanical and Aerospace-Science and Engineering-, Vol.9
July 20, 2014
13 Published by International Society of Ocean, Mechanical and Aerospace Scientists and Engineers
system (DAAS). 4.4 Motion Test The motion measurement may be accomplished by a light mechanical system having linear and angular potential transducers for direct measurement of responses [13]. A non-contacting method, such as an optical tracking system with the associated software is a better alternative for small structures or components. Unlike the mechanical systems, it requires no adjustment in the ballast in the model.
There are two types of force motions tests. Test in the regular wave and experiment in the irregular wave. But in this research, test has conducted only in regular wave. The motion test was conducted in the similar wave condition that has been used in force oscillation test .The test set-up of the model is showed in Figure 5 and Figure 6. Soft spring used in this test as mooring lines and the optic tracker was used to capture the motion of model in regular waves. Optic tracker has used is Qualysis which is the high speed camera to capture the motion from the ball maker that has been fix on the model. Model of semi –submersible has a mooring system arranged in four lines with springs in such a way that the overall horizontal spring stiffness which is 0.26 N/cm corresponds to the prototype value of 171kN/m.
Before the test, the mooring line will attach to axial riser force and column. Mooring lines was calibrate so that the stiffness become 0.26 N/m by attached the ring gauge at the end of the spring at column side. The ring gauge will measured the force acting on the mooring line. The wave generator was started after sometime when the wave was passing through the model then the capture start to record. The measurement has record up to about 120 seconds. Qualysis Track Manager has been used to analysis the motion of the model. The motion captured by the optic tracker was directly analysis by this software to the value of six degree of freedom (heave, surge, sway, roll, pitch and yaw).
Figure 5: Test setup of model in head sea
Figure 6: Motion test.
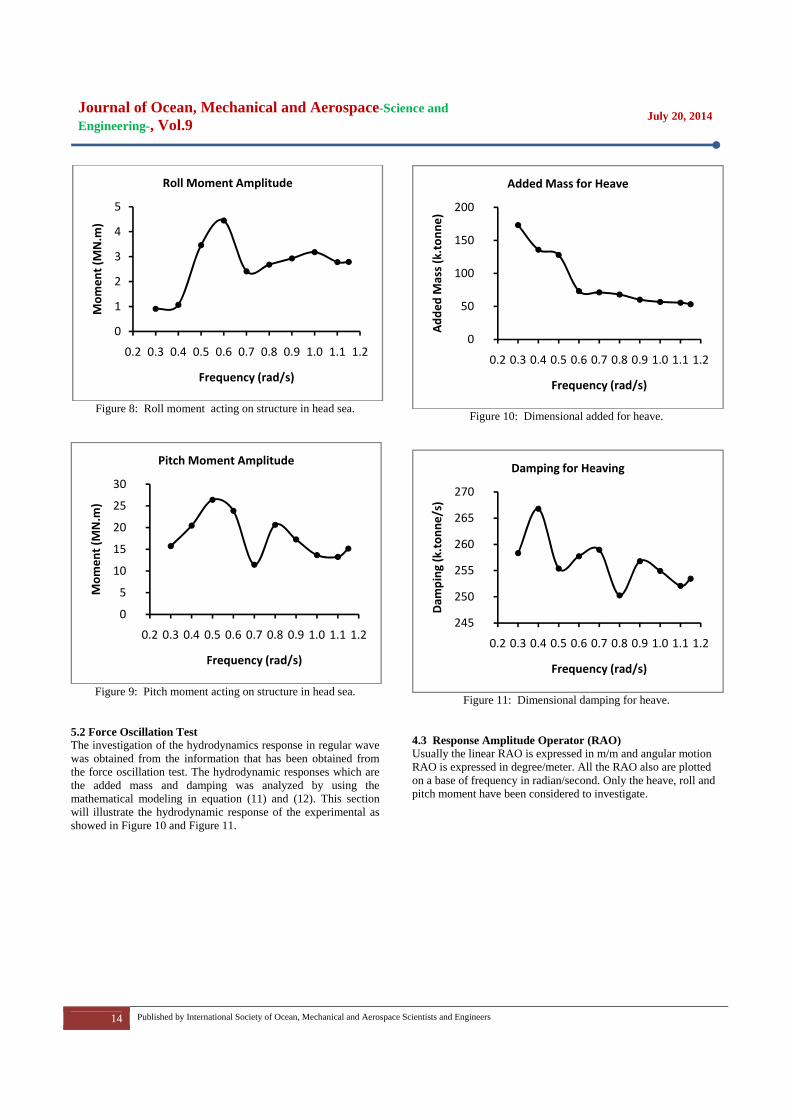
5.0 ANALYSIS OF THE OUTPUT This section put emphasis on the analysis of the exciting force and wave as well as the hydrodynamic force of the semi-submersible that obtained from the experimental. Then it concentrates on the motion response in term of RAO from experimental approach. 5.1 Wave Excitation Test The exciting wave has been obtained from the experiment by using the six component measurement system provides all the force and moment acting on structure. But in this research only the heave, roll and pitch moment has been considered to investigate. The result from the experimental illustrated the response of wave excitation at particular frequency. All the forces and moment is plotted on a base of frequency in radian/second as showed in Figures 7 - 9.
Figure 7: Heave forcet acting on structure in head sea.
0
5
10
15
20
25
30
0.2 0.3 0.4 0.5 0.6 0.7 0.8 0.9 1.0 1.1 1.2
Force (M
N)
Frequency (rad/s)
Heave Force Amplitude
Journal of Ocean, Mechanical and Aerospace-Science and Engineering-, Vol.9
July 20, 2014
14 Published by International Society of Ocean, Mechanical and Aerospace Scientists and Engineers
Figure 8: Roll moment acting on structure in head sea.
Figure 9: Pitch moment acting on structure in head sea.
5.2 Force Oscillation Test The investigation of the hydrodynamics response in regular wave was obtained from the information that has been obtained from the force oscillation test. The hydrodynamic responses which are the added mass and damping was analyzed by using the mathematical modeling in equation (11) and (12). This section will illustrate the hydrodynamic response of the experimental as showed in Figure 10 and Figure 11.
Figure 10: Dimensional added for heave.
Figure 11: Dimensional damping for heave.
4.3 Response Amplitude Operator (RAO) Usually the linear RAO is expressed in m/m and angular motion RAO is expressed in degree/meter. All the RAO also are plotted on a base of frequency in radian/second. Only the heave, roll and pitch moment have been considered to investigate.
0
1
2
3
4
5
0.2 0.3 0.4 0.5 0.6 0.7 0.8 0.9 1.0 1.1 1.2
Mom
ent (MN.m
)
Frequency (rad/s)
Roll Moment Amplitude
0
5
10
15
20
25
30
0.2 0.3 0.4 0.5 0.6 0.7 0.8 0.9 1.0 1.1 1.2
Mom
ent (MN.m
)
Frequency (rad/s)
Pitch Moment Amplitude
0
50
100
150
200
0.2 0.3 0.4 0.5 0.6 0.7 0.8 0.9 1.0 1.1 1.2
Add
ed M
ass (k.ton
ne)
Frequency (rad/s)
Added Mass for Heave
245
250
255
260
265
270
0.2 0.3 0.4 0.5 0.6 0.7 0.8 0.9 1.0 1.1 1.2
Dam
ping
(k.ton
ne/s)
Frequency (rad/s)
Damping for Heaving

Journal of Ocean, Mechanical and Aerospace-Science and Engineering-, Vol.9
July 20, 2014
15 Published by International Society of Ocean, Mechanical and Aerospace Scientists and Engineers
Figure 12: Heave RAO in head sea.
Figure 13: Roll RAO in head sea.
Figure 14: Pitch RAO in head sea.
6.0 DISCUSSION The maximum heave forces, roll and pitch moments were found to be prominent at range frequency 0.5-0.6 rad/s, which are 24.20 MN, 3.46 MN.m and 27.2 MN.m respectively. Wave excitation test showed that in wave heading the roll moment is much lower compared to pitch moment. Almost along the frequencies she behaves with similar trend.
Roughly, trend of heave added mass decrease gradually with increasing frequency. The added mass showed at the lower frequency the value of added mass for heave is higher. It is because, for lower frequency the value of heave added mass is balanced by the increasing exciting force. Peak value of heave added mass at frequency 0.3 rad/s were 173.23 k.tonne. Heave damping showed the trend of the curve is not uniform. Peak value of experimental heave damping occurred at wave frequency 0.4 rad/s of 266.81 k.tonne/s. While at frequency 0.8 rad/s the damping showed the dip value, heave damping at this wave frequency is 250.26 k.tonne/s.
Heave and roll RAO have peak value at initial frequenncy with 1.23 m/m and 0.30 deg/m respectively. While the peak value RAO of pitch accour at frequency 0.5 rad/s which is 0.88 deg/m. Due to trend curve there is quite similar between roll and pitch. The roll RAO decreased from the maximum RAO of 0.30 deg/m to almost nil at frequency 1.0 rad/s. Maximum pitch RAO was 0.88 deg/m at the frequency 0.5 rad/s. The response then gradually decreased to minimum RAO at frequency 1.1 rad/s.
The most important things to consider about the experiment are their setup. An improperly ballasted model can cause wrong results. In the force oscillation test and motion test of semi-submersible the regular wave was generated to find the hydrodynamic and the RAO respectively at particular frequency. Although the aims of the experiment are to find the hydrodynamic and motion response in regular wave but practically was not happened in higher frequency. The wave form regular only at the beginning of experiment, when wave start to hit the column the reflection of the wave make the wave become irregular along the experiment. Model experiment cannot cover the real situation fully, however it gives us valuable information about the real situation, that was causes difference in comparing results.
7.0 CONCLUSION The prediction of exciting force and moment as well as the motion response of semi-submersible is considered to be a complex matter as compared to the others vessel. Calculation of exciting force and moment are important to see the overview of the added mass and damping for semi-submersible. In addition to that, the motion responses are important in assessing the performance of the semi-submersible.
Even though the investigation of the response of floating structure had been carried out widely but more validation studies remain necessary to improve the computational methods and to establish the range of their applicability [15].
For more quality of the result the experimental should consider the various type of wave response. To maintain similarity the full-
00.20.40.60.81
1.21.4
0.2 0.3 0.4 0.5 0.6 0.7 0.8 0.9 1.0 1.1 1.2
RAO (m
/m)
Frequency (rad/s)
Heave RAO
0.00
0.05
0.10
0.15
0.20
0.25
0.30
0.35
0.2 0.3 0.4 0.5 0.6 0.7 0.8 0.9 1.0 1.1 1.2
RAO (d
eg/m
)
Frequency (rad/s)
Roll RAO
0
0.2
0.4
0.6
0.8
1
0.2 0.3 0.4 0.5 0.6 0.7 0.8 0.9 1.0 1.1 1.2
RAO (d
eg/m
)
Frequency (rad/s)
Pitch RAO

Journal of Ocean, Mechanical and Aerospace-Science and Engineering-, Vol.9
July 20, 2014
16 Published by International Society of Ocean, Mechanical and Aerospace Scientists and Engineers
scale condition the model should cover the several of wave heading because in real sea state semi-submersible is operating in numerous wave heading.
The present study successfully described the methods of investigate the hydrodynamic response and assessing motion response performance of a semi-submersible in sea state.The exciting force and moment obtained from this research can be used to predict the exciting force and moment of semi-submersible same type dimension which operating in same range of frequency with this experiment.
ACKNOWLEDGEMENT The authors are very grateful to the Marine Technology Centre staff in UTM Malaysia and Department of Aeronautics, Automotive and Ocean Engineering, Universiti Teknologi Malaysia (UTM), Malaysia which is well equipped for semi-submersible model tests. REFERENCE 1. Malaeb, DA.,1982. Dynamic analysis of Tension Leg
Platforms, PhD thesis, A & M University, College station, Texas, USA.
2. Chakrabarti, SK., 2005. Handbook of offshore Engineering, Vol. 1, Elsevier the Boulevard Pub., Langford Lane, Kidlington, UK.
3. Soylemez, M., 1995. Motion tests of a twin-hulled Semisubmersible, Journal of Ocean Engineering, Vol.22, No. 6, pp. 643-660.
4. Subrata Chakrabarti, Jeffrey Barnett, Harish Kanchi, Anshu Mehta, Jinsuk Yim., 2007. Design Analysis of A Truss Pontoon Semi-Submersible Concept in Deep Water. Journal of Ocean Engineering, 34, 621-629.
5. C.Y. Ng, V.J. Kurian , Muhammad M.A.W., 2010. Experimental and Analytical Investigation for the Responses of Semi-Submersible Platform. The Asia-Pacific Offshore Conference, Kuala Lumpur.
6. V. J. Kurian, M.A.Yassir, I.S.Harahap., 2010. Nonlinear Coupled Dynamic Response of a Semi-submersible Platform. Proceedings of the Twentieth International Offshore and Polar Engineering Conference, China, 492-499.
7. V.J. Kurian, C.Y. Ng, M.A.Yassir,. 2010. Response of Semi-Submersible Platform By Morison Equation And Diffraction Theory. World Engineering Congress, Malaysia, 7-12.
8. Jong Chien Lok., 2007. Response Analysis Of A Semi-Submersible Design, BEng Thesis, Universiti Teknologi Malaysia, Skudai.
9. Jin S. Chung,.1994. Added Mass and Damping on an Oscillating Surface-Piercing Circular Column. Journal of Offshore and Polar Engineering, 4, 1053-5381.
10. Md. Abu Hena Mostofa Kamal., 2007. Seakeeping Analysis of Malaysian Fishing Vessel. MEng Thesis, Universiti Teknologi Malaysia, Skudai.
11. Lewis, E.V., 1988. Principle of Naval Architecture. Volume-3: Motion in Waves and Controllability. Society of Naval Architecture and Marine Engineers (SNAME). New York.
12. J.M.J Journee and W.W. Massie., 2001. Offshore Hydromechanics. First edition. Delft University of Technology.
13. Subrata Chakrabarti (1998). Physical Model Testing of Floating Offshore Structures. Dynamic Positioning Conference, Houston, 1-32.
14. Rameswar Bhattacharya., 1972. Dynamis of Marine Vehicles. John Wiley & Sons, New York.
15. S.G. Tan., 1992. Motion Prediction of Semi-submersible in Early Design Stage. Maritime Research Institute Netherlands (MARIN).
16. Siow, C. L, Jaswar Koto, Hassan Abyn and N.M Khairuddin. (2014). Linearized Morison Drag for Improvement Heave Response of Semi-Submersible by Diffraction Potential. Journal of Ocean, Mechanical and Aerospace Science and Engineering. Vol.6, 8-16.
Journal of Ocean, Mechanical and Aerospace -Science and Engineering-, Vol.9
July 20, 2014
17 Published by International Society of Ocean, Mechanical and Aerospace Scientists and Engineers
A Preliminary Study on Use of Candlenut Shell as a Renewable Source of Energy, Min Indonesia
B H. Tambunan,a,*, H. Saptoadi,b and M. Syamsiro,c
a) Department of Mechanical Engineering, Medan State University, Medan 20221, Indonesia b) Department of Mechanical and Industrial Engineering, Gadjah Mada University, Yogyakarta 55281, Indonesia c) Department of Mechanical Engineering, Janabadra University, Yogyakarta 55231, Indonesia *Corresponding author: [email protected] Paper History Received: 26-June-2014 Received in revised form: 13-July-2014 Accepted: 19-July-2014 ABSTRACT The decreased world fossil energy reserve, in general, and specifically in Indonesia requires us to find alternative energy resources. Biomass is one of alternative energies with great potential in Indonesia. One of it is Candlenuts Shell (CNS) as the waste of candlenuts fruit, with the production 89,155 tons/year will produce 207,958 tons shell/year. Candlenut shells are made into briquette with particle size < 1 mm, and then burnt in combustion test instrument with variations raw material composition of biomass and biomass charcoal. Mass reduction of each variable is measured using digital scale include RS232 that is connected to computer, burning gas temperature by using thermocouple. In terms of burning rate, generated energy and gas temperature the best raw material composition is 75% of biomass raw material and 25% of biomass charcoal. The abstract should be consisting summary for the paper. Total number of words in summary should be around 150 words. KEY WORDS: Candlenut Shell; Renewable Energy Resource. 1.0 INTRODUCTION Indonesian fossil energy potential has been greatly depleted, for example, the type of oil reserves and 9.1 billion barrels of
production of 387 million barrels / year, will last only 23 years old, 185.8 TSCF gas reserves and production of 2.95 TSCF, will only survive 62 years and coal 146 years (Priyanto, 2007).
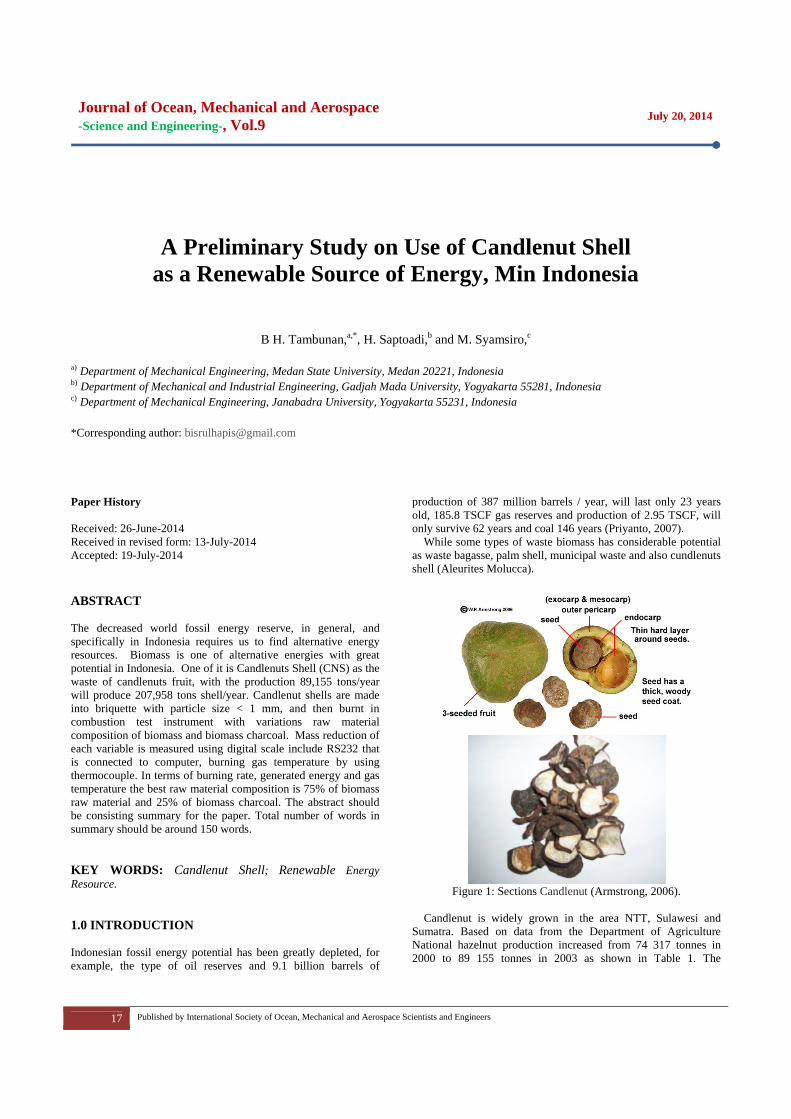
While some types of waste biomass has considerable potential as waste bagasse, palm shell, municipal waste and also cundlenuts shell (Aleurites Molucca).
Figure 1: Sections Candlenut (Armstrong, 2006).
Candlenut is widely grown in the area NTT, Sulawesi and
Sumatra. Based on data from the Department of Agriculture National hazelnut production increased from 74 317 tonnes in 2000 to 89 155 tonnes in 2003 as shown in Table 1. The
Journal of Ocean, Mechanical and Aerospace -Science and Engineering-, Vol.9
July 20, 2014
18 Published by International Society of Ocean, Mechanical and Aerospace Scientists and Engineers
candlenuts have two layers of the skin and rind shells, each kilogram of seed will produce 30% hazelnut core and 70% shell. Table 1: Area and Smallholder Production in Indonesia (Ministry of Agriculture, 2003), Crops Production (tons).
Types of Plants
Production (tones) 2000 2001 2002 2003
Kakao 363628 476924 511379 512251
Areca nut 1680 2196 2730 2372
Candle Nut 74317 77373 88481 89155 2.0 REVIEW OF LITERATURE Some previous researchers concluded that some parameters have an influence on the rate of combustion of biomass and coal briquettes. (Syamsiro at al, 2011) Utilization of Cocoa Pod Husk (CPH) as a renewable source of energy has been experimentally investigated. The result shows that CPH has higher heating value of 17MJ/kg and relatively high ash content as compared with bagasse and EFB. The air flow rate and fuel composition significantly affect the burning time and CO emission factor. The shortest burning time occurs at an air flow rate of 0.2 m/s. The increase of carbonized CPH portion in the fuel increases the burning time of the pellet as carbonized CPH has higher fixed carbon content. Increase of air flow rate and carbonized CPH portion also increases the emission factor of CO due to higher fixed carbon content requiring more oxygen for completing the combustion process. A lower level of oxygen causes CO formation since the fixed carbon cannot completely react to form CO2.
Dujambi (1999) have examined the influence of coal particle size, air preheat temperature, the furnace wall temperature, and air flow rate. The results showed that the firing rate will decrease with the increase in particle size, otherwise the firing rate will increase along with the increase of air flow rate, air preheat temperature, and the temperature of the furnace wall.
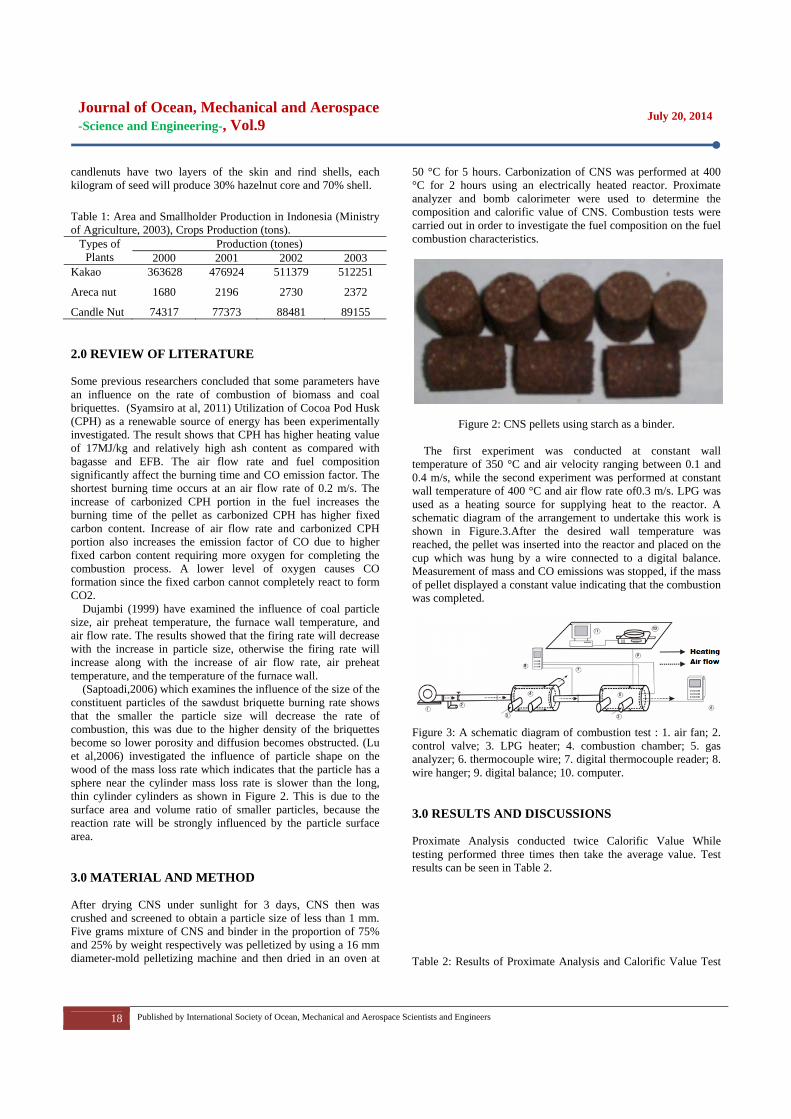
(Saptoadi,2006) which examines the influence of the size of the constituent particles of the sawdust briquette burning rate shows that the smaller the particle size will decrease the rate of combustion, this was due to the higher density of the briquettes become so lower porosity and diffusion becomes obstructed. (Lu et al,2006) investigated the influence of particle shape on the wood of the mass loss rate which indicates that the particle has a sphere near the cylinder mass loss rate is slower than the long, thin cylinder cylinders as shown in Figure 2. This is due to the surface area and volume ratio of smaller particles, because the reaction rate will be strongly influenced by the particle surface area. 3.0 MATERIAL AND METHOD After drying CNS under sunlight for 3 days, CNS then was crushed and screened to obtain a particle size of less than 1 mm. Five grams mixture of CNS and binder in the proportion of 75% and 25% by weight respectively was pelletized by using a 16 mm diameter-mold pelletizing machine and then dried in an oven at
50 °C for 5 hours. Carbonization of CNS was performed at 400 °C for 2 hours using an electrically heated reactor. Proximate analyzer and bomb calorimeter were used to determine the composition and calorific value of CNS. Combustion tests were carried out in order to investigate the fuel composition on the fuel combustion characteristics.
Figure 2: CNS pellets using starch as a binder.
The first experiment was conducted at constant wall temperature of 350 °C and air velocity ranging between 0.1 and 0.4 m/s, while the second experiment was performed at constant wall temperature of 400 °C and air flow rate of0.3 m/s. LPG was used as a heating source for supplying heat to the reactor. A schematic diagram of the arrangement to undertake this work is shown in Figure.3.After the desired wall temperature was reached, the pellet was inserted into the reactor and placed on the cup which was hung by a wire connected to a digital balance. Measurement of mass and CO emissions was stopped, if the mass of pellet displayed a constant value indicating that the combustion was completed.
Figure 3: A schematic diagram of combustion test : 1. air fan; 2. control valve; 3. LPG heater; 4. combustion chamber; 5. gas analyzer; 6. thermocouple wire; 7. digital thermocouple reader; 8. wire hanger; 9. digital balance; 10. computer. 3.0 RESULTS AND DISCUSSIONS Proximate Analysis conducted twice Calorific Value While testing performed three times then take the average value. Test results can be seen in Table 2. Table 2: Results of Proximate Analysis and Calorific Value Test
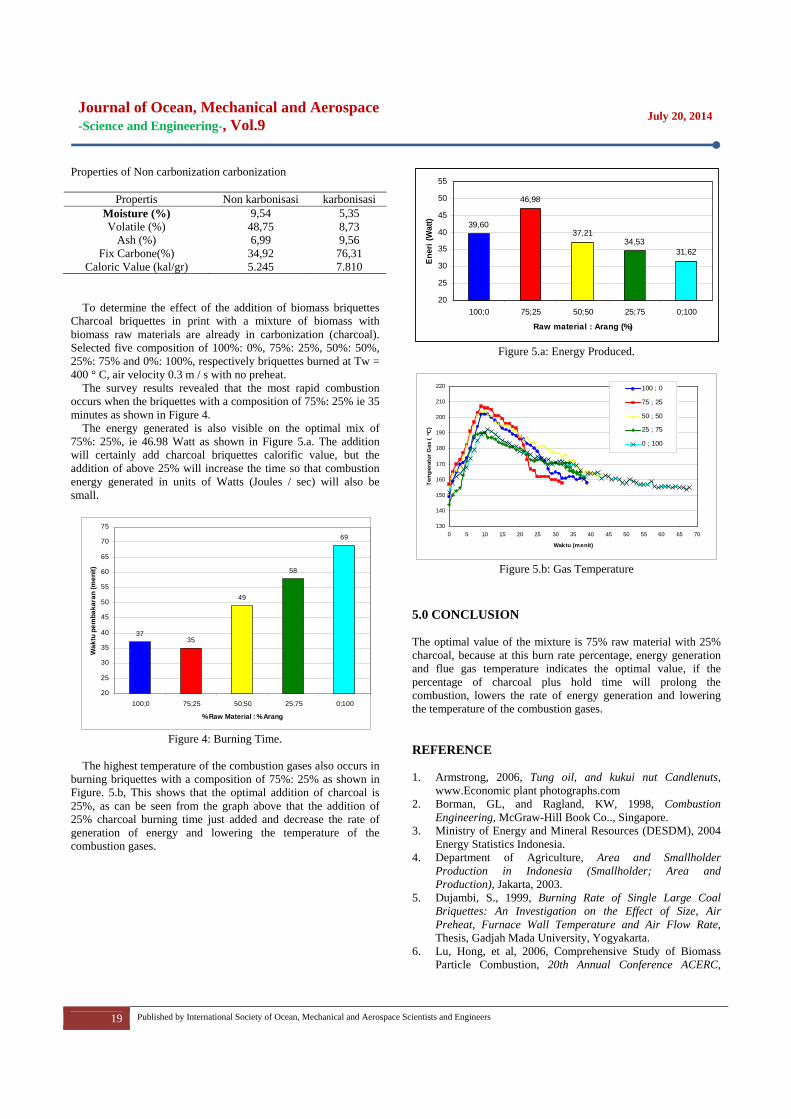
Journal of Ocean, Mechanical and Aerospace -Science and Engineering-, Vol.9
July 20, 2014
19 Published by International Society of Ocean, Mechanical and Aerospace Scientists and Engineers
Properties of Non carbonization carbonization
Propertis Non karbonisasi karbonisasi Moisture (%) 9,54 5,35 Volatile (%) 48,75 8,73
Ash (%) 6,99 9,56 Fix Carbone(%) 34,92 76,31
Caloric Value (kal/gr) 5.245 7.810
To determine the effect of the addition of biomass briquettes
Charcoal briquettes in print with a mixture of biomass with biomass raw materials are already in carbonization (charcoal). Selected five composition of 100%: 0%, 75%: 25%, 50%: 50%, 25%: 75% and 0%: 100%, respectively briquettes burned at Tw = 400 ° C, air velocity 0.3 m / s with no preheat.
The survey results revealed that the most rapid combustion occurs when the briquettes with a composition of 75%: 25% ie 35 minutes as shown in Figure 4.
The energy generated is also visible on the optimal mix of 75%: 25%, ie 46.98 Watt as shown in Figure 5.a. The addition will certainly add charcoal briquettes calorific value, but the addition of above 25% will increase the time so that combustion energy generated in units of Watts (Joules / sec) will also be small.
Figure 4: Burning Time.
The highest temperature of the combustion gases also occurs in
burning briquettes with a composition of 75%: 25% as shown in Figure. 5.b, This shows that the optimal addition of charcoal is 25%, as can be seen from the graph above that the addition of 25% charcoal burning time just added and decrease the rate of generation of energy and lowering the temperature of the combustion gases.
Figure 5.a: Energy Produced.
Figure 5.b: Gas Temperature
5.0 CONCLUSION The optimal value of the mixture is 75% raw material with 25% charcoal, because at this burn rate percentage, energy generation and flue gas temperature indicates the optimal value, if the percentage of charcoal plus hold time will prolong the combustion, lowers the rate of energy generation and lowering the temperature of the combustion gases. REFERENCE 1. Armstrong, 2006, Tung oil, and kukui nut Candlenuts,
www.Economic plant photographs.com 2. Borman, GL, and Ragland, KW, 1998, Combustion
Engineering, McGraw-Hill Book Co.., Singapore. 3. Ministry of Energy and Mineral Resources (DESDM), 2004
Energy Statistics Indonesia. 4. Department of Agriculture, Area and Smallholder
Production in Indonesia (Smallholder; Area and Production), Jakarta, 2003.
5. Dujambi, S., 1999, Burning Rate of Single Large Coal Briquettes: An Investigation on the Effect of Size, Air Preheat, Furnace Wall Temperature and Air Flow Rate, Thesis, Gadjah Mada University, Yogyakarta.
6. Lu, Hong, et al, 2006, Comprehensive Study of Biomass Particle Combustion, 20th Annual Conference ACERC,
3735
49
58
69
20
25
30
35
40
45
50
55
60
65
70
75
100;0 75;25 50;50 25;75 0;100
% Raw Material : % Arang
Wak
tu p
emba
kara
n (m
enit)
39,60
46,98
37,2134,53
31,62
20
25
30
35
40
45
50
55
100;0 75;25 50;50 25;75 0;100
Raw material : Arang (%)
Ener
i (W
att)
130
140
150
160
170
180
190
200
210
220
0 5 10 15 20 25 30 35 40 45 50 55 60 65 70
Waktu (menit)
Tem
pera
tur G
as (
o C)
100 ; 0
75 ; 25
50 ; 50
25 ; 75
0 ; 100

Journal of Ocean, Mechanical and Aerospace -Science and Engineering-, Vol.9
July 20, 2014
20 Published by International Society of Ocean, Mechanical and Aerospace Scientists and Engineers
February 22. 7. Priyanto, U, 2007, Utilization of Bio Fuel For Alternative
Fuels, National Seminar, Addressing Energy Crisis and Alternative Energy Development in Indonesia, HMTG Gadjah Mada University, Yogyakarta.
8. Saptoadi, H., 2006, The Best Biobriquette Dimension and its Particle Size, The 2nd Joint International Conference on "Sustainable Energy and Environment (SEE 2006)", November 21 to 23, Bangkok, Thailand.
Journal of Ocean, Mechanical and Aerospace -Science and Engineering-, Vol.9
July 20, 2014
21 Published by International Society of Ocean, Mechanical and Aerospace Scientists and Engineers
Lumber Drying Model in Traditional Shipbuilding
Bayo-Philip Patrick,a, Jaswar Koto,a,b,* and C.L Siow,a
a) Department Aeronautics, Automotive and Ocean Engineering, Mechanical Engineering, Universiti Teknologi Malaysia b)Ocean and Aerospace Engineering Research Institute, Indonesia *Corresponding author: [email protected] and [email protected] Paper History Received: 9-July-2014 Received in revised form: 15-July-2014 Accepted: 19-July-2014 ABSTRACT Indonesian traditional ship is a product of an indigenous technology developed long before the advent of western culture along the Coast of Sulawesi Island. The ships are built traditionally in both method and equipment without any sketches or calculations. Advancement in science and technology, and abundant information available on the World Wide Web has caused unprecedented changes in many areas of human Endeavour. However, Indonesian traditional ship builders have not taken full advantage of available technology and information particularly in the preparation of lumber which remains one of the critical and most unpredictable stages in construction. This study addressed the issue of delays which is always one of the critical issues confronting the construction of traditional ship in Kepulauan Riau. A low cost air drying model was proposed. The model was tested by comparing the air drying time of lumber in two specific conditions. Four different samples of lumber were used to test the efficiency of both the air drying model and the natural air drying technique. In conclusion, the proposed model having applied and compared with the traditional method clearly show a better method. KEY WORDS: Lumber Drying Process; Traditional Ship Production; Kepulauan Riau-Indonesia. NOMENCLATURE EMC Equilibrium Moisture Content
1.0 INTRODUCTION Indonesian traditional ship is a product of an indigenous technology developed long before the advent of western culture along the Coast of Sulawesi Island. The ships are built traditionally in both method and equipment without any sketches or calculations. The building expertise is passed down from generation to generation, a knowledge that is further honed through daily practice with the help of each builder’s instincts and natural gift. Still built by hand in the traditional manner, these majestic sailing ships are a living spirit from the golden age of sail, which ended in the West in the early twentieth century, but still thrives in the waters of Indonesia.
The beauty and efficiency is not a product of technical science, they are a product of the spiritual nature of these people and their culture. They are at one with their environment and they follow a path of least resistance in their lives and in their work. This philosophy contributes to the beauty and efficiency of their ship designs, and it comes from a basic and simple understanding of the world in which they live. This philosophy based nature and balance allowed the peoples of the Indonesian islands to produce solutions to practical challenges long before the societies of Europe were able to.
In as much as one would like to appreciate the people and their philosophy, it is also good to mention that a mix of local craft and beliefs plus modern and scientific ways of doing things will go a long way in transforming the practice of ship building in Indonesia. Advancement in science and technology, and abundant information available on the World Wide Web has caused unprecedented changes in many areas of human endeavour. However, Indonesian traditional ship builders have not taken full advantage of available technology and information particularly in the preparation of lumber which remains one of the critical and most unpredictable stages in construction. They have failed to explore outside the ancient method of wood preparation other possible ways of making lumber ready for use in shipyards. Nofrizal et al, 2012 has raised the drying lumber issue in traditional shipbuilding in Kepulauan Riau, Indonesia as shown in

Journal o-Science an
22 P
Figure.1.
Figure.1: DryiKepulauan Ria
It is in the lito identify fromuse in traditionmay help in imIndonesia posit 2.0 LITERA The demand fincrease, this islocal fishermesurvived manylocally trainedrequired skilapprenticeship men with minlimited exposu(Risandi et al, 2
Wood remaitraditional shipWhen wood isizes, the sawnused in the connot usually conin open air andmakes the dunpredictable.
Literature identified somconstruction ishipbuilding iNofrizal et.al (ship productiopass through iand also identiet al, 2012, lamwell as calculastudy stated th
of Ocean, Mnd Engineerin
Published by Interna
ing lumber issuau, Indonesia.
ight of the abovm literature difnal shipyards a
mpacting the prtively.
ATURE REVI
for traditional ws evident from ten. The ship by centuries abd builders. Mll through schemes. Henc
nimal educationure to the outsi2012). ins the major mpbuilding in Ins fallen down
n lumbers are usnstruction of shntrolled. The drd as such is expdrying proces
reviewed reveme of the specif
in Indonesia. in Kepulauan (2012). His reseon process and n order to conify the major pmented the lackations on perforhat the tradition
Mechanical ng-, Vol.9
ational Society of O
ue in traditiona
ve statement thfferent ways of and proposed aractice of tradit
IEW
wooden ship inthe high patronbuilding industbly supported any of the bbiological dece, it a commonnal ability, naride world in sh
material and thendonesia cannot
and sawn intosually allowed hip. However, rying process mposed to elemes and the d
ealed that sefic issues centr
Production Riau, Indone
earch is proposredraw the w
struct the a traroblems exists
k of blue print rmance during
nal ship designs
and Aeros
Ocean, Mechanical a
al ship product
hat this study wf preparing lumba low cost modional ship build
n Indonesia is nage especially try in Indonesby the activituilders acquireescent or thn phenomenon rrow world viehip building in
e role of woodt be overempho various shapto dry before ththe drying pro
most times takesents of weather drying time
everal studies ral to traditionaissue of trad
esia was studised to collect d
work flow requiaditional woode
in the process.or formal sketcthe design stag
s are derived fro
space
and Aerospace Scie
tion in
will like ber for
del that ding in
on the among
sia has ties of ed the hrough to find
ew and ndustry
d in the asized. es and hey are
ocess is s place which highly
have al ship ditional ied by data for ired to en ship . Mufti ches as ge. The om the
refrc
cTmhjoap
potowwhinspd
idbshpaaoo
thkptaredq
dorethacbp
entists and Engineer
eplication of anrom informal client.
In another stontrol issues in
The study menmeasure in the heavily on theirob experience
approach to qua
Figure.2: Q
Moreover, A.perspectives ofobserved that ato take necessa
workers to fatalworkers are nothelmet, boot, hnjuries. Furtherpecified safety
down by governIt is importa
dentified delivebuilding proceshipbuilding pr
procedure whicanother generatiadopted by theobserved flaws or completion da
One of the mhe refusal of
knowledge in preparation and ake place in oemains depend
difficult to estimquantity of wood
Modern techdrying to be caoutside under thesults as the prhat, it can also h
also encourageonstruction stag
be an advantageprocess.
The focus of
rs
n existing ship conversation b
tudy, E. Prayetn traditional sh
ntioned that thechoice of mate
r senses specifiacquired over lity control.
Quality issues i
Deah et al 201f occupational t the constructioary precautionsl injuries and jet provided the hand gloves tharmore, the studregulations at
nment appointedant to mentionery as one of ths. Surhan et arocess followsch been handeion. The study
e builders was make it almostate for a given p
major flaws citedthe builders modern day
processing of wopen air. Conent on prevailin
mate or project td needed to bui
hnology nowadarried out in dihe sun. This marocess can be phelp in the proj
e the applicatge. Application
e in the optimiza
f this study is
that is servingbetween the sh
tno et al, 2012hipbuilding as ere is no standerials. The mascally visual assthe years. Th
in traditional sh
12, addressed ssafety and p
on stage most os to arrest issueopardize their required safetyat can protect dy highlighted the point of s
d regulatory agen that some he critical issuel 2012, mentio a certain un
ed down from posited that thoften fraught
t impossible to project. d by Surhan et to take advascience and
wood for constnsequently, woong weather conthe time requirild a specific shdays however, iverse ways insakes room for bpartly or fully cjection of air wtion of schedun of schedulingation of the ove
to discuss and
July 20, 20
g its purpose whip builders an
2, dwelt on qushown in Figu
dard quality coster builders desessment and ohere is no scie
hip production.
safety issue frompolicies. The of the builders fues that can exhealth. For ins
y wares that suthem from agnon complian
ship building asencies. other studies
es in traditionaloned that traditnique procedu
one generatiohe unique proc
with flaws. Tgive a definite
al 2012, centreantage of avaid technology. truction till dateod air drying
nditions. Henceed to air dry a
hip size. does allow w
stead of just dbetter and conscontrolled. Not
wood drying timuling tools at
g tools in returnerall ship produ
d address lumbe
014
well or d the
uality ure.2. ontrol epend on the entific
m the study failed xpose stance uch as gainst nce to s laid
have l ship tional
ure, a on to edure These e start
ed on ilable
The e still time
e, it is given
wood drying istent t only
me and t the
n may uction
er air

Journal of Ocean, Mechanical and Aerospace -Science and Engineering-, Vol.9
July 20, 2014
23 Published by International Society of Ocean, Mechanical and Aerospace Scientists and Engineers
drying time, and also develop a model that can be used in air drying time calculation. The ultimate goal is to propose a low cost air drying model which may be used to predict the time required to prepare a specific needed quantity of lumber for a given size of ship. This study believes that the proposed model with the ability to predict time for air drying of lumber will eliminate non standardization of time which has been a familial and perennial problem and hence the optimization of the overall production process through the application of scheduling tools. 3.0 LOW COST LUMBER DRYING MODEL Lumber used in shipbuilding must be seasoned, which means that the moisture from the green wood has to be removed in order to improve its serviceability. Air drying and kiln drying are the two methods used for lumber seasoning, and generally speaking, the air dried process is the best for shipbuilding woods. Most of the lumber available in advanced countries in the west is kiln dried but air drying method is still very rife in Indonesia which is equally acceptable if done properly. Lumber drying process has to be done with great care. If the process is either rushed (leaving too much moisture in the wood), or the lumber is "cooked" too long or at too high a temperature, (thereby removing too much of the moisture and making the wood brittle), the lumber will not be suitable for ship building.
For most ship building lumber, the ideal moisture content ratio to lumber weight after drying (regardless of the process) is approximately 15%, with a range of from 12% to 16% being acceptable (W. Simpson, 2004). When the wood is seasoned, it shrinks to some degree, and if during drying, too much moisture is removed, the wood will later absorb moisture and swell excessively once in use in the ship. On the other hand, if the wood is "green" or contains too much moisture after seasoning, the wood will tend to shrink and split while the ship is being built.
The moisture content of wood below the fiber saturation point is a function of both relative humidity and temperature of surrounding air. The EMC is the moisture content at which the wood is neither gaining nor losing moisture; this however, is a dynamic equilibrium and changes with relative humidity and temperature.
The Hailwood-Horrobin equation for two hydrates is often used to approximate the relationship between EMC, temperature ( ), and relative humidity ( ) (R. Baronas, 2001):
(1) where;
330 0.452 0.00415
0.791 4.63 10 8.44 10
6.34 7.75 10 9.35 10
1.09 2.84 10 9.04 10
If the wood is placed in an environment at a particular temperature and relative humidity, its moisture content will
generally begin to change in time, until it is finally in equilibrium with its surroundings, and the moisture content no longer changes in time. This moisture content is the EMC of the wood for that temperature and relative humidity.
The moisture content of wood is calculated by the following formula::
(2)
where, is the green mass of the wood, is its oven-dry mass. The equation can also be expressed as a fraction of the mass of the water and the mass of the oven-dry wood rather than a percentage. For example, 0.59 kg/kg (oven dry basis) expresses the same moisture content as 59% (oven dry basis). 3.1 Construction of the Air Drying Model The model was constructing by using an aluminum rectangular frame with 69 cm of length, 65 cm of with and 42 cm of height and a polythene sheet as shown in Figure.3. The polythene sheet was spread over the frame and held firmly to the frame by tape and screws. The purpose of the polythene is to serve as shed for some of the samples.
Figure.3: Constructing the Air Drying model.
Using the model, experiment was conducted for 7 days with
detail as follows: Day 1 • The low cost air drying model was constructed using a
rectangular frame and a polythene sheet. • The length of each of the Samples A, B, C, D, 1 and 2 of
lumber pieces were recorded • The initial weights of the samples were also recorded. • The samples A, B, C, D, 1 and 2 were immersed in water • The samples A, B, C, D, 1 and 2 were removed from water
for about two and a half hours. The weights of the samples were recorded again.
• Samples A, B and 1 were placed inside the model. • Samples C, D and 2 were placed outside the model in the
open air (that is they were exposed to elements of weather condition).
• The following parameters time, temperature and relative humidity were recorded.
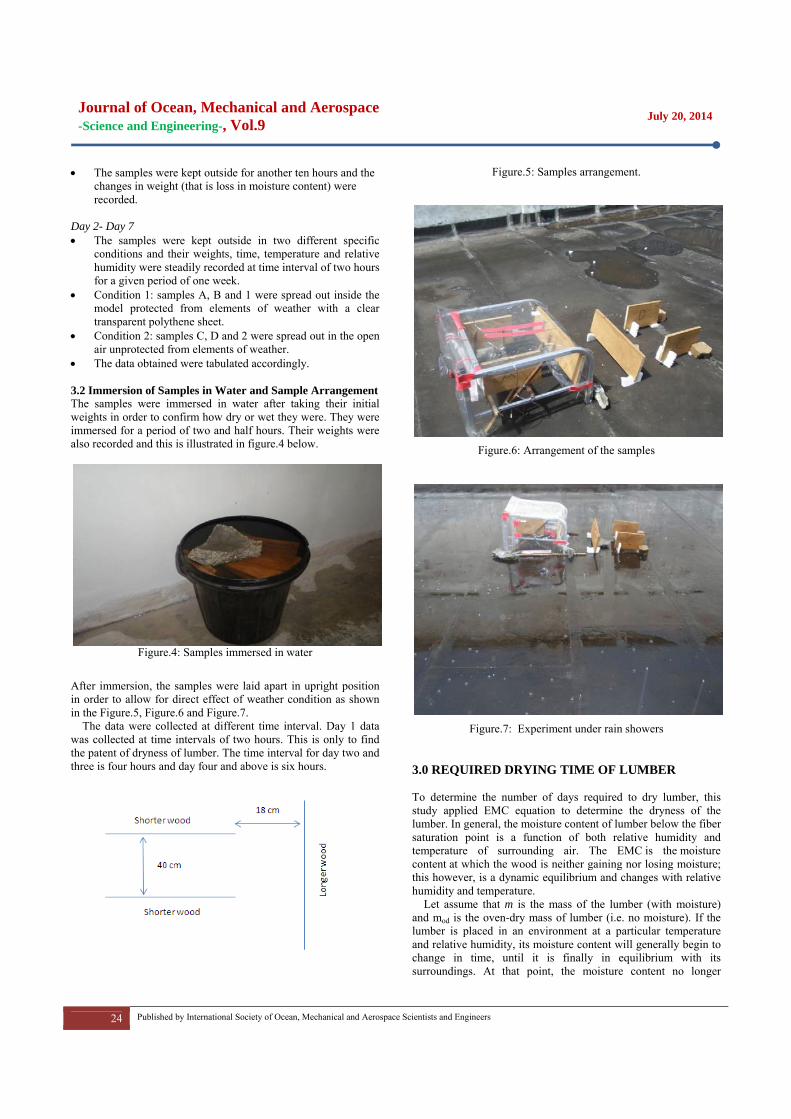
Journal of Ocean, Mechanical and Aerospace -Science and Engineering-, Vol.9
July 20, 2014
24 Published by International Society of Ocean, Mechanical and Aerospace Scientists and Engineers
• The samples were kept outside for another ten hours and the changes in weight (that is loss in moisture content) were recorded.
Day 2- Day 7 • The samples were kept outside in two different specific
conditions and their weights, time, temperature and relative humidity were steadily recorded at time interval of two hours for a given period of one week.
• Condition 1: samples A, B and 1 were spread out inside the model protected from elements of weather with a clear transparent polythene sheet.
• Condition 2: samples C, D and 2 were spread out in the open air unprotected from elements of weather.
• The data obtained were tabulated accordingly. 3.2 Immersion of Samples in Water and Sample Arrangement The samples were immersed in water after taking their initial weights in order to confirm how dry or wet they were. They were immersed for a period of two and half hours. Their weights were also recorded and this is illustrated in figure.4 below.
Figure.4: Samples immersed in water
After immersion, the samples were laid apart in upright position in order to allow for direct effect of weather condition as shown in the Figure.5, Figure.6 and Figure.7.
The data were collected at different time interval. Day 1 data was collected at time intervals of two hours. This is only to find the patent of dryness of lumber. The time interval for day two and three is four hours and day four and above is six hours.
Figure.5: Samples arrangement.
Figure.6: Arrangement of the samples
Figure.7: Experiment under rain showers
3.0 REQUIRED DRYING TIME OF LUMBER To determine the number of days required to dry lumber, this study applied EMC equation to determine the dryness of the lumber. In general, the moisture content of lumber below the fiber saturation point is a function of both relative humidity and temperature of surrounding air. The EMC is the moisture content at which the wood is neither gaining nor losing moisture; this however, is a dynamic equilibrium and changes with relative humidity and temperature.
Let assume that m is the mass of the lumber (with moisture) and mod is the oven-dry mass of lumber (i.e. no moisture). If the lumber is placed in an environment at a particular temperature and relative humidity, its moisture content will generally begin to change in time, until it is finally in equilibrium with its surroundings. At that point, the moisture content no longer

Journal of Ocean, Mechanical and Aerospace -Science and Engineering-, Vol.9
July 20, 2014
25 Published by International Society of Ocean, Mechanical and Aerospace Scientists and Engineers
changes. This moisture content is the EMC of the lumber for that temperature and relative humidity. To estimate the EMC, Hailwood-Horrobin equation for two hydrates is often used to approximate the relationship between EMC, temperature (T), and relative humidity (h). The example below shows the application the Hailwood-Horrobin equation to calculate the EMC of sample A and sample C. The initial data obtained during the experiment for sample A is highlighted in the Table.1 below:
Table.1: The initial data for sample A after immersion.
Particular Recorded Data
Initial Weight, m (Weight remove from water) 0.972 kg
Average Temperature, T 30.85 0C (87.53 F)
Fractional, H (Average Humidity) 83.16% (0.8)
From the calculation above, the drying weight for the sample A (inside the model) and sample C (outside the model) is 0.841 kg and 0.742 kg respectively. In the calculation, the Moisture Content is 15 percent (My Life: Kayu). By plotting the graph of sample A and sample C using the data from the experiment against recorded time. The total time required for the lumber to air dry from fully wet condition can be determined. The Comparison between the required times to air dry the samples (A and C) with both the proposed technique and traditional technique is showed in the figure.8.
Figure.8: The air drying time of lumber in two specific conditions i.e drying time between proposed technique and traditional lumber drying technique.
According to figure 8, it is evident that the proposed technique proves to be more successful, drying the lumber in less than one day (20 hour). While the traditional method shows delay that is it takes almost two day (40 hour). The delay caused by the traditional technique as observed from the graph is because of rainfall the second day after the drying process started.
According to the rainfall data from Department of Irrigation and Drainage Malaysia, the amount of cumulative rainfall in Johor Bahru area on initial data collection day which is 7th July 2013 is as high as 10mm. The cumulative rainfall data provided by the Department of Irrigation and Drainage Malaysia is shown
in figure.9.
Figure.9: The cumulative rainfall for the month of June, 2013 by Department of Irrigation and Drainage Malaysia.
By comparing the cumulative rainfall data to the amount of the drying time, it can be assumed that for every 10 mm of rainfall, the air drying time of the lumber is elongated using traditional drying method. In other words, if there no rainfall the following day, the lumber air drying time by traditional technique can also be predicted to dry in one day. 3.1 Comparison between the Use of the Proposed Model and Traditional Method From the experiment conducted, the lumber placed outside the model is exposed to rainfall therefore becomes wet when it rained and also difficult to work on because of the wet surface as shown in Figure.10. The wet surface would invariable translate to delay in the overall production process because it required more time to dry.
Figure 10: Effect of rainfall on drying of lumber using the proposed technique and traditional technique. 3.2 Effect of Air Drying on the Size of the Lumber Also from the experiment, it is deduced that there was no noticeable change in the size of the lumber. Figure.11 shows the graph of the air drying time for different sizes of lumber. The result shows that the changes are negligible.
Lumber Inside Lumber outside
0.50
0.60
0.70
0.80
0.90
1.00
0 5 10 15 20 25 30 35 40 45 50 55 60
Wei
ght o
f lum
ber
(gra
m)
Time (hour)
Required drying time of lumber
Lumber Inside MC Lumber InsideLumber Outside MC Lumber Outside

Journal of Ocean, Mechanical and Aerospace -Science and Engineering-, Vol.9
July 20, 2014
26 Published by International Society of Ocean, Mechanical and Aerospace Scientists and Engineers
Figure.11: Effect of air dry time on the size lumber using the proposed technique. 5.0 CONCLUSION The following conclusion is to answer the objective of the present study. • The low cost lumber drying model is proposed in the present
study. • The low cost model was constructed using a rectangular
frame and a polyethylene sheet. • Experiment was conducted to determine required drying
time of lumber using the proposed drying model and current technique which is applied by traditional shipyard in Kepulaun Riau, Indonesia.
• In the experiment, length of lumbers are as follows 31 cm, 20 cm and 12 cm. Width and thickness are the same in which 20 cm of width and 2 cm of thickness.
• The interval time is record • The analysis of experimental results show that required
drying time using the proposed model is shorter than the current technique.
ACKNOWLEDGEMENTS The authors would like to convey a great appreciation to Universiti Teknologi Malaysia for supporting this research. REFERENCE 1. A. Deah et.al 2012, Safety Issues in Production Traditional
Ships in Kepulauan Riau-Indonesia, the 6th Asia-Pacific Workshop on Marine Hydrodynamics, pp.496-500, Malaysia.
2. E. Prayetno et.al 2012, Quality Issues in Traditional Ship Production in Kepulauan Riau-Indonesia, the 6th Asia-Pacific Workshop on Marine Hydrodynamics, pp.491 - 495, Malaysia.
3. Mufti F.M et.al 2012, Design Issue in Traditional Shipbuilding Process, the 6th Asia-Pacific Workshop on Marine Hydrodynamics, pp.571 - 576, Malaysia.
4. Nofrizalet.al 2012, Production Process of Traditional Ships in Kepulauan Riau-Indonesia, the 6th Asia-Pacific Workshop on Marine Hydrodynamics, pp.110-117, Malaysia.
5. R. Baronas, F. Ivanauskas, I. Juodeikienė, A. Kajalavičiusc, 2001, Modelling of Moisture Movement in Wood during Outdoor Storage, Nonlinear Analysis: Modelling and Control, V. 6, No. 2, pp: 3-14.
6. Risandi.D.P et.al 2012, Planning of Traditional Ship Production in Bintan-Indonesia, The 6th Asia-Pacific Workshop on Marine Hydrodynamics, pp.592-595, Malaysia.
7. Simpson, William T. 2004. Estimating air drying times of lumber with multiple regression, Res. Note FPL-RN-0293. Madison, WI: U.S. Department of Agriculture, Forest Service, Forest Products Laboratory.6 p.
8. Surhan Jamil Haron et.al 2012, Delivery Issues in Malaysian Traditional Ship Production Process, the 6th Asia-Pacific Workshop on Marine Hydrodynamics, pp.588-591, Malaysia.
9. Jaswar Koto, Munirah and Dodi Sofyan Arief. (2014). Occupational Safety in Production of Traditional Fishing Vessels in Indonesia. Journal of Ocean, Mechanical and Aerospace Science and Engineering. Vol.4, 7-12.
10.0
14.0
18.0
22.0
26.0
30.0
0 20 40 60 80 100
Dry
ing
rate
(gra
m/c
m)
Drying time (hours)
Effect of air drying time on the size of lumber
Lumber 20 cm Lumber 12 cm

Publishe
ed & Printed
ISOReJalPekhtt
d OMAse esty Menara Hlan Sisingamakanbaru-Riautp://www.isom
Hotel angaraja No.89u, Indonesia mase.org/
9
Teknik MFakultasUniversIndoneshttp://ft.
Mesin s Teknik itas Riau, ia .unri.ac.id/
IISSN: 2354-70065