joint tactical information distribution system/mode s
TRANSCRIPT

Joint Tactical Information Distribution System/Mode S Sensor Electromagnetic Compatibility Test Plan
Ralph J. Yost
September 1985
DOT/FAA/CT-TN85/46
.' Document is on Iile at the Technical Center Library, Atlantic City Airport, N.J, 08405
.'
U5.Depar1rren1 at Tronspor1Ol1On
Federal AvkItIon AdI' .....SliUIIon
Technical Center Atlantic City Airport, N.J. 08405
t ....

NOTICE
This document is disseminated under the sponsorship of the Department of Transportation in the interest of information exchange. The· United States Government assumes no liability for the contents or use thereof.
The United States Government does not endorse products or manufacturers. Trade or manufacturer's names appear herein solely because they are considered essential to the object of this report.

1. R.po,t No.
DOT/FAA/CT-TN85/46
... Titl. ond Subtitl.
JOIN!' TACTICAL INFORMATION SENSOR ELECTROMAGNETIC
7. Authori.)
Ralph J. Yost 9. P.,,.,...i... 0,...1• .,1 ... N......d Ad....
Federal Aviation Administration Technical Center Atlantic City Airport, 12. Spon.o,ill......flcr No-o ..eI Ackb•••
U.S. Department of Transportation Federal Aviation Administration TeChnical Center
2. Gov.'''Ment Acc•••io.. No.
DISTRIBUTION SYSTEM/MODE S COMPATIBILITY TEST PLAN
New Jersey 08405
IAtlantic City Airport, New Jersey 08405 15. 5u"lo....,.'.,,. No,••
16. .lit."oct
3. R.cipi.nt'. COI.I.g No.
5.. Repo,t O.t.
September 1985 6. Peflonning O'....i..ti.n CO'"
DOT/FAA/CT-TN8S/46 8. P.,lo,...in. O"oPIi ••tion R.po,t No.
10. Work Unit No. (TRAIS)
11. co..".ct II' G,o..' No. F18-0 5G
13. Typo 01 A.pon o..d P.,iod Cov.,.eI
Technical Note
1... SpeA••,i .., A••nc., Coelo
The Federal Aviation Administration (FAA) Technical Center had agreed to conduct electromagnetic compatibility (EMC) testing in conjunction with the Department of Defense (DOD) and the Electromagnetic' Compatibility Analysis Center (ECAC). The EMC tests to be performed at the Technical Center will focus on the performance of air traffic control ground-based and airborne avionics equipment, navigation systems, and guidance systems that operate between the frequencies of approximately 890 MHz to 1215 MHz. The performance of these systems 'will be lOOnitored while subjected to signals from DOD's Joint Tactical Information Distribution System (JTIDS). JTlDS was designed and intended to be used in the same frequency spectrum as the FAA's air traffic control, navigat ion J and guidance equipment. This technical note presents a plan for testing the performance of the FAA's Mode S terminal air traf fic control ground system in the presence of interfering JTIDS signals.
17. K• ., Wo,eI.
EMC JTlDS Mode S Fruit
18. Dhtrilau'.Oft S,at.....,
Document is on file at the Technical Center Library, Atlantic City Airport, New Jersey 08405
19. S.cu,i,., CI...iI. (ol ttli. ,.,..,,) 20. S.cu,it., CI...il. (ol .hi, p...) 21. No. 01 p.... 22. Pric.
Unc las s i fied Unc lass i fied 27
For.. DOT F 1700.7 18-721 Reprocluctl.... f co...,I .....d ,ag. au,horlz.d

TABLE OF CONTENTS
Page
EXECUTIVE SUMMARY v
INTRODUCTION 1
Background 1 Purpose 1
DISCUSSION 1
TEST CONFIGURATION 3
SYSTEM DESCRIPTION 3
SPECIAL EQUIPMENT REQUIRED 11
Test Tsrget Generator 11 Radio Frequency Test Head 13 Fruit Source - 1090 MHz 13 TACAN/DHE Environment Simulator 17 JTIDS Simulator 17 Radiofrequency Interface Unit 17
DATA COLLECTION 17
SYSTEM PERFORMANCE PARAMETERS 20
JTIDS SIGNAL PARAMETERS 20
DATA ANALYSIS 22
COORDINATION AND AREAS OF RESPONSIBILITY 22
SCHEDULE 23
iii

Figure
1
2
3
4
5
6a 6b 6c
7
8
9
10
11
12
13
Table
1
2
3
LIST OF ILLUSTRATIONS
Page
Receiver Block Diagram 2
Functional Block Diagram of Mode S Sensor Receiver 4 Test Confi~uration
Radiofrequency Front End 5
Sum and Difference Antenna Patterns 6
Mode S Roll-Call Scheduling 8
ATCRBS/Mode S All-Call Interrogations 9 ATCRBS Reply Format 9 Mode S Interrogation 9
Mode S Reply Format 10
Test Target Generator Simplified Block Diagrsm 12
TTG Reply Synchronization 14
RCVR Radiofrequency Test Head (Channel #1) 15
Block Diagram Fruit Generator 16
RFIU Block Diagram 18
JTIDS/Mode S Sensor EMC Test Schedule 23
LIST OF TABLES
Page
Mode S Sensor JTIDS Effects Test Performance Parameters 19
JTIDS Signal Parameters 21
JTIDS Simulator Function Settings 22
iv

EXECUTIVE SUMMARY
The Department of Defense (DOD) is developing the Joint Tactical Information ~ Distribution System (JTIDS) to be operated in the same frequency spectrum as Federal Aviation Administration (FAA) navigation, guidance and Air Traffic Control (ATC) sys tems. JTIDS is a spread spect rum frequency hoppi ng sys·tem wit ich wi 11 operate in the 890-1215 MHz L-Band.
In order for JTIDS to be used in the L-Band. DOD must first be granted spectrum support from the National Telecommunications and Information Administration (NTIA). NTIA has required DOD to conduct a test program to provide the necessary data to evaluate the electromagnetic compatibility of JTIDS and the FAA systems.
This test plan is written to outline tests to determine the effect of JTIDS signals on the Mode S sensor currently in place at the FAA Technical Center.
v

INTRODUCTION
PURPOSE.
The purpose of this test plan is to outline tests to determine the effect of IDHA JTIDS signals on the Mode S sensor currently in place at the FAA Technical Center. The JTIDS effects testing is required to provide the performance data for the Mode S sensor and to obtain EMC data for increased JTIDS Time Slot Duty Factor (TSDF); i. e., percentage of time slots available to a single JTIDS user related to the total percentage of time slots transmitted by the JTIDS community.
BACKGROUND •
The Department of Defense (DOD) is developing the Joint Tactical Information Distribution System (JTIDS) that will provide totally Integrated Communications, Navigation, and Identification (ICN!) capabilities. Currently, DOD has requested spectrum support from the National Telecommunications and Information Administration (NTIA) for two JTIDS time waveforms. They are the Time-Division Multiple-Access (TDHA) System and the Distributed Time-Division Multiple-Access (DTDHA) System.
NTIA has requested that DOD consolidate the military services I JTIDS operational requirements and conduct a Joint Electromagnetic Compatibility (EMC) Test and Evaluation Program. This program will provide the necessary data and information to enable the government agencies and the civilian community to evaluate the EMC of the Joint Services JTIDS operations.
The test program will include Tactical Air Navigation (TACAN)/Distance Measuring Equipment (DME) beacons, TACAN/DME interrogators, an Air Traffic Control Radar Beacon System (ATCRBS) interrogator, AICRBS transponders, a Mode S sensor, a Mode S transponder, the Traffic Alert and Collision Avoidance System (TCAS), a Precis ion DME (DME/P) beacon, and a DME/P interrogator.
DOD requires frequency support from NTIA and the Federal Aviat ion Adminis trat ion (FAA) in order to make a major production decision in December 1985 for IDHA JTIDS and in March 1986 for DTDHA JTIDS. The decision will be based on the risk of achieving a final Stage 4 frequency allocation which requires a public Federal COlIDIIunications Commission (FCC) hearing in 1989.
DISCUSSION
Because the allowed time for setup and testing covers less than 4 months, and because of the complexity of the Mode S sensor, a truly exhaustive test program of the Mode S sensor in the presence of JTIDS is not possible. However. it does appear possible to determine whether JTIDS has a noticeable effect on the sensor receiver through the use of the Mode S diagnostic Range Angle Accuracy (RAA) software and examining the output data listing produced by it. It is expected that if JTIDS will produce an unwanted effect on the Mode S sensor. its effect will be most noticeable in the receiver and detected by monitoring three system performance parameters: reply message, reply decode status. and monopulse video value. This information will be provided in the output data listing of RAA. A block diagram of the receiver is shown in figure 1.
1

--- --
I
r----------- --,I AlYrGN/V1"9 SYSTEM I
~ ':;: S·/..{.,. ....... Ll = /)c;/~~ ,-D.-:. 0 -~c
,---
A
~
(irda ..... AA)
I
\ V \ 1/ \ 1/ J
I I, 1 I
I J
'- --- ---- ---- ____ .J ,
.rl.. A :E. ']'
J, u J, $
"A
cTU V.n.. r-
L...
~12 TRIM'Sn..
I, U
",~1.bO fi.+,:t. ~.,~ JIi RI£",S'
IJ= :€.-b;' JJ=-4r'
nONdl'<I£ <#" ~.z L il 81"'1 ,o~
- - - .CONT~OI.
f'RQc€:s sO,f
~ A."~( j;. ..<r._ i
... c.,tch..c=)!Rl'"tU
"I 1/11
1" To/rru-Irt;.:, 0-~ S cJr
MONO PUL • po
p:r
D5t.1I y,,--:- F...;:.. , ,PwE l"
1113,0'J.
.4
~
R. F. rRONr EN/)
I II;)..
II II nj FILr£R MoUI/I.E
11/3111
IIIJIIJ r- ,I'''"ItS, r-"'
Jt \ J, iJ f~rfor..,G7'Ce
cot·rT/ioL./VI,,?!;, to r rW8
/11, Q7
U IV DATA 5T~ms ~/
f/lIlst: LOGliMP
~OJ)UL'" /"lOOt/I...
/11111"
..........-i
IL r Video D'l lCt a~,.
pWB's (;I.)
1A31'18 t 1113119'
Di-~ .. L JJ S,' .".LJ
\ "'DNC"'<>E f -----------~V
To/~""". frcc.es S 0 r
FIGURE 1. RECEIVER BLOCK DIAGRAM
2

Once testing is started and cursory data are collected and analyzed, it may be necessary to concentrate the tes t effort in other areas of the sensor and/ or examine other performance parameters more closely.
I t has been recognized by NTIA, DOD, and FAA that the Mode S sensor engineering model currently in operation at the Technical Center is not of the same configuration as the final production version of sensors that will be used in the Air Traffic Control (ATC) system. Further, it has been agreed to by NTIA, DOD, and FAA that JTIDS effects testing of the existing sensor is necessary in order to establish (before December 1985) what effects, if any, the JTIDS spectrum has on the Mode S sensor. When informat ion is availab Ie on product ion Mode S sensors, it will be compared to the engineering model at the Technical Center and a determination will be made as to whether or not further JTIDS testing is necessary.
TEST CONFIGURATION
Figure 2 shows a general test setup to the Mode S sensor receiver. By running the sensors I diagnostic software routine ItRAA t II the setup allows the sensor to provide roll-call interrogat ions to the Test Target Generator (TTG). The TTG. wh ich operates in a ''handshake'' fashion with the sensors' processor, provides roll-call replies in the form of pulsed video. The video output of the TTG is used to modulate the radio frequency (RF) Test Head and provide replies at RF level to the sensor. The output of the RF Test Head will be combined with an extraneous pulse environment and JTIDS signals befor,e being injected into the sensors RF front end. The RF front end is illustrated in figure 3.
The extraneous pulse environment will consist of nonsynchronous unsolicited ATCRBS and Mode S replies (fruit) and TACAN/DME pulses. Fruit will be generated by the 1090 MHz Fruit Source built at the Technical Center. A TACAN/ DME beacon simulator will be used to provide the TACAN/DME environment.
A spectrum analyzer will be used to calibrate signals and provide continuous signal checking of all signal levels.
SYSTEM DESCRIPTION
Mode S is a cooperative surveillance and communications system for ATC. Each aircraft is assigned a discrete address or unique code which permits data link communications to or from a particular aircraft. The data link operates integrally with Mode S surveillance interrogations and replies.
The Mode S sensor has two modes of operation: ATCRBS mode and Mode S. The sensor uses the available processing time (channel), first for ATCRBS functions and then for Mode S functions. This is possible because Mode S employs monopulse direction finding; a technique using a rotating fan-beam antenna with a sum pattern and a difference pattern. The interrogation is transmitted, and the reply is received on the sum and difference patterns. The ratio of the amplitudes of the signals received on the difference and sum patterns is used to determine the off-boresight angle of the target; Le., the angular difference between the target position and the antenna pointing angle. The sum and difference antenna patterns can be seen in figure 4.
3

IOQO MH.. SIGNAL VECTOR SOURC.E VOLTMETER
~
AA CARD
RF TESTTTG READER BHEAD ~
I SPECTRUM I.. AN...LYZER• ~~ '1 n'
"TlOS I
SIMULATOR SOURc.1!. \/ I~-
~ RFIU
MONITO"
Ri .,,/)Je" ~:! ~,.0 ;o~,.
IlU.EC T10NAL .. COU P"'~Rr+ " SOvA<e.
IOqO M~ .. FRuIT
SOURCE. ~~ \/..,. [lIRe< "OHltL..
Cc>U ""-RTACAN/o""E --t~ ENViRoNMeNT
SIMULIITOR MOllE S SENSOR
RECiIVER
~ ,. ~ :.. ,,""" A/ PROC.ESSOR
TAPe. K( •ORIVE.
~'" !lEX
PRItlTER
FIGURE 2. FUNCTIONAL BLOCK DIAGRAM OF MODE S SENSOR RECEIVER TEST CONFIGURATION

••
OLANK ItlG SW ITCH
A /- PHASE SH IHER
"'C",:,::::::.~P' f ,,-po ., ....~ ~ CIRCULATOR
A2 ~ .
H '" Clc:::
" VOLTAGE'" .""10:
~ H 0
IJ> '" J::)" '" c::: '"Z n Kl
'" ~ Z .... '" ~
' o
ATTENUi\TOR _I
G..
A1
..
-(\...-' _
..
1.1 .4
."~.."
..r
... run..,\,1
~ 'I ~.1"--: ..J :1
AU CP'O
we
,....~
w,
..". ,-.I'''' IU..cp", ..... : _
l "' .. d,. .,.
vlrw 4-4
• Ofo Ii II
W5C r'a..J ~l I.. A1'.III.. ,.=:J)
l ••• •I 0 0• •
OSC I LLATOR
~'~nI ,~. w.!.. H./lcliJ~r!-q' -/a
.,,,, ,...,.'fl. , , . c,., .. HYBRID COUPLER ASSEMBLY
AI
""-.u.-----;;-- AMPL IF IER
, 0
VI!_ &e
CIRCULATOR
•
1-,- FILTER
PHASE SHIFTER---- IF AMP
A. . --- Q
•• A ..rtJ -MIXER
to WAY POVIER OIVIDEf\-J

111-401140401/ I l'1-4-'640H L
, ... to ,-, I \
I \ I -3\ \ I I
\ \ I I lD
\ " J "0
\ , I J <I\ 1/ I \ II I \ I I
\ I I\I" o
0,...-..
(0)
(b)I SUM
t:> = 01 FFERENCE
9gb = OFF-BORE SIGHT ANGLE
FIGURE 4. SUM AND DIFFERENCE ANTENNA PATTERNS
6

Reliable and improved ATCRBS surveillance data are obtained with a nominal four "hits" per target, contrasted to today's ATCRBS of 16 to 30 hits per target. A Mode S period is the time interval between the end of an ATCRBS listening period and the next ATCRBS interrogat ion. The Mode S period is used to perform Mode S surveillance and data link communications.
Mode S surveillance interrogations are scheduled in range order. In each antenna beam dwell, the Mode S sensor first interrogates the Mode S aircraft furthest from it. It computes the expected arrival time of the reply, and times the interrogation of the next furthest aircraft so that the replies will arrive at the sensor in sequence but not overlapped. It cont inues interrogat ing succeeding aircraft at decreasing ranges until the first reply is expected, then schedules a "listening" period to receive the replies to its interrogations. It repeats this procedure, interrogating all targets in line-of-sight during one roll-call schedule. Figure 5 illustrates the Mode S scheduling.
Only aircraft on the sensor's roll-call list can be discretely interrogated. To acquire targets not yet on the sensor's roll-call list, Mode S transmits, when in the ATCRBS mode, an ATCRBS/Mode S all-call interrogation, which is similar to today's corresponding ATCRBS interrogation with an additional pulse - 1'4 (see figure 6a). An ATCRBS transponder is unaffected by the presence of the 1'4 pulse and responds with a normal ATCRBS reply (figure 6b). Mode S transponders recognize the interrogation as a Mode S all-call interrogation and respond with a Mode S all-call reply containing its discrete address.
After determining the position and velocity of a Mode S equipped aircraft, the sensor places the target on its roll-call list: On a subsequent discrete interrogation, the Mode S transponder can be locked-out from replying to all-call interrogat ions, thereby eliminat ing unwanted replies. In the ATCRBS mode, Mode S transmits a 1'2 suppression pulse on the omnidirectional antenna each time there is at} ATCRBS/ all-call interrogat ion, just as is presently done to suppress ATCRBS transponders outside of the antenna's main beam. In the Mode S mode, each discrete interrogation consists of a preamble of 1'1-1'2 suppression pulse pairs to suppress ATCRBS transponders that are in the antenna main beam when the particular Mode S target is being interrogated (see figure 6c). This intentional suppression (nominally 35 microseconds) is to prevent unwanted ATCRBS replies from being triggered by a discrete interrogation.
Each Mode S reply consists of a four-pulse preamble, which is designed to make the Mode S reply easily distinguishable from an ATCRBS reply. Mode S replies can be 56 microseconds or 112 microseconds long as compared with an ATCRBS reply which is nominally 20.3 microseconds. (See figure 7.)
The standard 56-bit message field of the Mode S sensor's interrogation and the Mode S transponder's reply will direct a wide range of ATC automation functions.
Extended-length message (ELM) capability provides transmission of up to 16, aO-bit message segments. This is provided to accommmodate the needs of the nr>re sophisticated airborne installations, including transfer of teletype and other long messages between the air and ground.
7

TRANSACTION
f-----cYcLE-~---I
~:~_·----------ROLL-CALL SCHEDULE -------------1 .. _
f--DA8S PERIOO~ -l I
ATCR8S PERIOD
*This Mode S period comprises three schedules. The second schedule include~ eight transactions, grouped in three cyles of 4.3 and 1 transactions, respectively.
llJl.-'-'---'--'-_------'--'--L...l-L..J._----'---'---REPLIES
INTERROGAT IONS
. 11--1...1_ '-----'----J~ I ~'-----'---'---JL_
FIGURE 5. MODE S ROLL-CALL SCHEDULING
8

•••
, c, co,_0 ,
I a '-'"
INT£RROGATION
11I·4-tlIU~
I--{ ""oel. A: 0.0 ~ ..C } __-11_ -lt.' ' ''',""od'C. ZI.O"uc
INT£RROGATION ~~l----_...J ~ i---l 1---1 08~ ••c 0.8,.,...c 0.8~"c
I- 2.0,.." --I r- i r:I
SLS CONTROL PI 1 _--.: L..--...J POI
TRANSMISSION
FIGURE 6a. ATCRBS/MODE S ALL-CALL INTERROGATIONS
ItH-'llIII
" c, " C. A. ,- , ,- , , -, co, co,, , , ,
,', ,, ' ,I
'I , I , ,
t I~~
I .,. ,. 7ii:~ ".1
l'lII[ 1,.'01
FIGURE 6b. ATCRBS REPLY FORMAT
_____ PREAMBLE DATA BLOCI<11 I' OR 29 fLuC
1 "-..""...-_+-.. " ..'" I:: 'jI I ~ O~:!:Ol,1o&Scc
P, P, jI I I D!!! i !?L:.-i L"-:~ I I I I I~" ///OUA-BIT
O.B_ SYNC PHASE PHASE REVERSAL POSITIONSo.S,.,...,c REVERSAL
FIGURE 6c. MODE S INTERROGATION
9

I I IPREAMBLE DATA BLOCK 8.0 ~sec 56 OR 11 Z ~sec
BIT I I BIT 2 I BIT 3 I BIT 4 I I ~I_~ I BIT N I""-,--r-,--r-,--r-j--r--r '--""-"T--r--Y-" '\'0'\'0'\'0'\'0 ,I ','0'1'0'I I I I I I I I I I I I I I I I
- - , I I I I I I
I I ~ lo I I I I I
0.0 0.5 1.0 3.5 4.5 8.0 9.0
I I I I ITIME (~ucl ,NOTE; N :. 56 or 112
o o o o I 0 I 1 I
EXAMPLE' REPLY DATA BLOCK WAVEFORM CORRESPONDING TO BIT SEDUENCE 0010... 001 SEQUENCE 0010.•.00\
FIGURE 7. I«)DE S REPLY FORMAT

Mode S has high lOOssage reliability, afforded by differential phase shift keying (DPSK) modulation, in which a phase reversal of the RF carrier indicates a binary "one" and an absence of a reversal indicates a "zero .1I DPSK provides interference immunity, fade margin, and multipath immunity which are superior to such other modulation techniques as pulse amplitude modulation. Mode S employs a variation of pulse amplitude modulation, known as pulse position modulation, for its replies. This provides reliable bit detection in the presence of ATCRBS interference and assures constant energy for accurate monopulse angular measurements. Mode S uses an error detection and correction scheme which places parity bits in the address field. The result of this coding is that an error anywhere in the lOOssage will alter its address. The transponder will not reply to an interrogation containing an ,error because the interrogation does not appear to be addressed to this particular transponder. The sensor will sense an error in a reply because it is awaiting a reply from only one specific aircraft whose address is known. Using its knowledge of the correct address, the sensor can perform error correct ion on Mode S replies, even in the presence of asynchronous AICRBS replies.
To perform many of its functions, Mode S incorporates a distributed computer architecture. This architecture features the multiple use of cOllllllOn modules such as computers, lOOmory couplers, data buses, and modems. The application of redundancy at the module level supports the high reliability requirements of Mode S Common backup (as standby units) is provided on-line for each module type such that failure/recovery, in general, can be accomplished at the local level without major perturbation to the remainder of the system. All communication between computers is through global lOOmory, such that each computer with its tasks becomes an independent subsystem. If a computer fails, its tasks can be switched automatically to another computer with minimum interference with the rest of the system.
Mode S computers are grouped into ensembles with up to four computers in each ensemble. These computers are connected to an ensemble data bus through which they communicate with the rest of the system. Each Mode S computer consists of two central processors, voting logic for the central processors and 8,192 bits of local error-correcting code lOOmory. The code of a Mode S computer is executed simultaneously by each central processor. Results from the central processor executions are compared (or voted). If results agree, they are passed on to their destination; otherwise, the Mode S computer involved is immediately switched off-line to prevent any erroneous data from being passed to the data bus and on to the global lOOmory.
Mode S employs 36 computers of which 6 are redundant. Each of the 30 required computers has a different load module, depending on the particular system task being performed in that computer. Furthermore, each of these computer load modules is available in global lOOmory and can be downloaded, if required, into a redundant computer. This is the end result of the failure/recovery process for computer failures.
SPECIAL EQUIPMENT REQUIRED
TEST TARGET GENERATOR.
The TTG is a unit that provides accurate digital pulse responses to sensor interrogations. It is used in conjunction with a card reader to input program test scenarios and patterns. As seen in figure 8, the TTG consists of two memories and
II

CARD READER
FRONT PANEL
LISTEN WINDOW FROM PROCESSOR
REPLY STATE DATA
CONTROL. r----I
MEMORY BOARD ,,~
"6
REPLY DATA
~ . MEMORY MONOPUL..SE
A\O DELAY A'2
FRONT PANEL
PATTERN CQNTfiOL
eOARD . CLOCKS AS
PROCESSOR CONTROL MEMORY
ACCESS GRANT FROM PROCESSOR A,2
DABS ENABLE FROM THE PROCESSOR
DATA
DELAYED MQNOPULSEDATA
ACP tv ARP
DATA
FIGURE 8. TEST TARGET GENERATOR SIMPLIFIED BLOCK DIAGRAM

a controller. The TTG controls input of data from the card reader and synchronizes the output of the data with the Mode S modulation control unit (MCU).
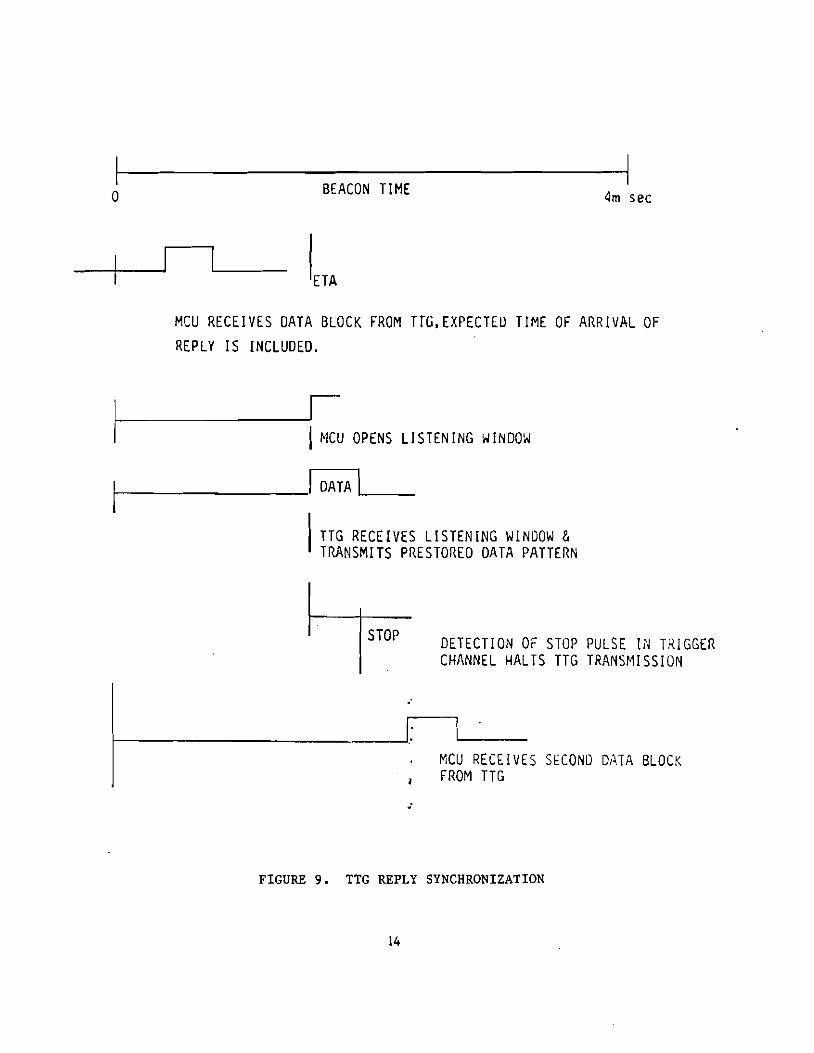
The TIG's processor control memory (PCM) sends an "access request" to the MCU. When the MCU is able, it responds with an "access grant" signal to the PCM. The PCM next sends a data block which directs the MCU to generate a "listening window" which is detected by the TIG and is used to coordinate release of data by the reply data memory (ROM). The ROM stores and releases data which simulate the output of a Mode S aircraft transponder. A stop pulse is generated in one of the ROM's· 16 channels and data transmission is halted until the next listening window is detected. (See figure 9.)
TTG operation will be synchronized to the sensor processor by using the DABS CLOCK. A separate synchronization pulse output is provided by the TTG to allow an oscilloscope to be used to examine the data pulses.
RADIOFREQUENCY TEST HEAD.
This unit will be used to provide separate 1090 MHz pulse amplitude modulated sum <:~) and del ta (to) channel RF signal outputs for connect ion to the sensor receiver front end input ports. A separate external 1090 MHz Continuous Wave (CW) source is required as an RF input signal. The RF Test Head provides sum and delta outputs with the following characteristics:
1. Adjustable sum and delta RF output levels over a 99 dB range in steps of 1 dB increments.
2. To simulate different monopulse video values, relative delta to sum RF levels are adjustable over a 75 dB range in 0.1 dB steps.
3. To simulate a reply left or right of antenna boresight (mainbeam) , relative phasing of either 0 degrees or 180 degrees is available, adjustable over a ±15 degree range.
A schematic diagram of the RF Test Head is provided in figure 10.
FRUIT SOURCE 1090 MHz.
A block diagram of the ATCRBS/Mode S Fruit Source is 'shown in figure 11. As indicated, the system consists of five separate RF sources. These sources are modulated by ATCRBS type fruit replies from four separate generators and Mode S "fruit replies from two separate reply generators. Fruit rates of both ATCRBS and ~ode S are keyboard controllable. The range of control is from 0 to more than 80K in ATCRBS and from 0 to more than 2K in Mode S (both are in increments of 10 per ~econd).
the ATCRBS codes are randomly selected from a programmable read only memory (PROM) ~hich contains 12 codes. Eight of the 12 can be read out via the keyboard/display. The Mode S fruit replies are also selected from a PROM and consist of 20 different messages. The percentage of long and short Mode S fruit replies is selectable via dual in-line package (DIP) switches on the components cards.
13
BEACON TIMEo 4m sec
ETA
MCU RECEIVES DATA BLOCK FROM TrG.EXPECTE~ TIME OF ARRIVAL OF REPLY IS INCLUDED.
_____---'1 I MCU OPENS LISTENING WINDOW
_______1 DATA 1__
ITTG RECEIVES LISTENING WINDOW & TRANSMITS PRESTORED DATA PATTERN
STOP DETECTION OF STOP PULSE IN TRIGGER CH~NNEL HALTS TTG TRANSMISSION
."
r------------I: 1,--_"MCU RECEIVES SECOND DATA BLOCK FROM TTG
..
FIGURE 9. TTG REPLY SYNCHRONIZATION
14

OMNI
\
\ '--- C,~"tI'I
2
'--- FROM -::'H. ~t.:.-o..4l'2,
0- ',dt:::.SVM #7 IdB ST'EP~<:'A!..!e
.p.~ACJ.
PHASE #2S~IF;-ER (V~R)
O"CABLE ')(
(,,~---+--------C: ()
1800 (""-ABLE.
~/
S'J1,
SloJ\,
~5V
POWER SUPPLY
GANGED r------- -------------------7 , / / ,
/ , / COWN loO.fl, [)')WN / /
~ PULSED b.2V uP :,lP\JrUP
(FL.,f)N, iTG) b.2V /N'75:.
~.
1l5V ,o.c.
FIGURE 10. RCVR RADIOFREQUENCY TEST HEAD (CHANNEL #1)
15

F
VIT
r
Il'""'1 t>o"-d.
IOf/omlt."
1v IITa'd.f /(F
,
,crvrf6",*./ R.-,Pj 6-" &,,1".
0 0 (I/a,.)
/0 90 milt!' ~
,c/,arl 1tn:.£'85 t?~
c.... ~./ ~'p/7~" CJ,nV'
I I ( Va,. )
/0,/0 mlli!
Conto/ f?F L~y(" G",Jlnp
NO/1' IITU'd5 /-?;:
flu;".; Rr;I,/ Cr. 6".,(va r ) 11
3 3 FI?
/0'0 /1111 ~ ov
#10"" S IlI.tlt' 5 !PI=" . ,r;.",r ~n6,., eon'" • c;,,.,?,, / (Vdr),....
I /
1090 mile .. m"d',. .$ Il7otlt' J RF ..err,.,r -£16"'1
ConI"
cr." fr.1 (FII,.q Z
r
LEP G~J)
tJ/.f/'LA i .lkr~;'J
FIGURE 11. BLOCK DIAGRAM FRUIT GENERATOR
16
Fral f-/f7&<1S !fJ,c ~'p'l~'" &,,1"
c;,A~4/ (tid,. ) ~ 2 ..

The Fruit Source utilizes an Amplitude Distribution Unit. This unit varies the amplitude (reply signal strength) of each reply (at random) in order to simulate an approximately constant aircraft density within a radius of 100 nautical miles (nmi). Output power of the RF fruit source will be varied distributively from -77 dBm minimum to -47 dBm maximum. Fruit rates for Mode Sand ATCRBS will be 52 and 17K, respectively.
TACAN/DME ENVIRONMENT SIMULATOR.
The TACAN/DME environment will be generated by a TACAN/DME beacon simulator. The extraneous-pulse environment of the Los Angeles Basin model representing 743 aircraft will be simulated by a TACAN/DME environment of nine aircraft in the antenna mainbeam (equivalent to 270 ppps). This is based upon a 4.5 0 ATCRBS antenna beamwidth (nine aircraft/mainbeam) and a TACAN/DME interrogation rate of 30 pp/aircraft/s.
To simplify the simulation, a single power level of -50 dBm can be used for the 270 interrogations. Depending on transmitter powers and antenna gains, this power level corresponds to a distance of approximately 10 to 30 nmi. To simulate the sidelobe and back lobe TACAN/DME interrogators, the same interrogat ions rate with a power level of -75 dBm can be used.
JTIDS SIMULATOR.
The JTIDS signals will be generated from a single TDMA JTIDS signal source. Foreground and background signal levels can be adjusted independently. The unit has the capability of operat ing on a fixed frequency JTIDS channel or in the frequency- hopping mode. Timeslot duty factor (percent) of the JTIDS signal output is selectable.
RADIOFREQUENCY INTERFACE UNIT •
.The Radiofrequency Interface Unit (RFIU) is a major aid in maintaining calibration and continuity of· the test setup. This device reliably provides the functions of monit.oring, amplitude control, switching, and combining of three separate RF sources. All necessary couplers, programmable attenuators and switches, combiners, isolators, terminations, and data bus control circuits are hard-wired into a single enclosed cabinet. A block diagram of the RFIU is shown in figure 12. This device eliminates the problems of RF path-loss variations due to such things as component movement and connector damage. The only RF connections to be made are simple cable runs from the various signal sources and test units to the RFIU.
DATA COLLECTION
Mode S sensor performance parameter data will be collected with an extraneous-pulse environment. The Mode S sensor environment consists of the sum of ATCRBS, Mode S fruit, and TACAN/DME pulses. The rates and other parameters that will be varied are shown in table 1.
For each combination of ATCRBS, Mode S, and TACAN/DME environment, JTIDS signal, and JTIDS TSDF, a scenario wi 11 be run. The Mode S sensor performance wi 11 be recorded on magnetic tape. The scenario will be rerun until the performance of the Mode S sensor is measured for all of the test variable combinations.
17

'SOLATORS 2JA- 200~
'SOLATORS 2JA-2009
-j
ISOLATORS 2JA- 20B9
HPB761B SWITCH
" I II -'0 -10 -10 DESIRED 30420-'0 30420-10 3042B-'O SIGNAL
2 - ---l NARDA NARDA NARDA
HP3330S 110 deSOURCE ,
10 dB STEP ArTEN.
MONITOR \
GENERAL3042B~I~It- M'CROWAVE ISOURCE 2 ---"TI 3291-'20-1I 1 I
MONITOR 2
HP 33305 3042B-'O 110 dB
SOURCE 3 '0 dB STEP ATTEN.MONITOR 3
UNIT UNDER TEST
(Xl 'II HP07610
I~ ---l SWITCH 2
sonI HP333I1B, -,I SWITCH
TEST
HP33304 II de
'dB STEP AlTEN
HP33304 II dB
'dB STEP ATTEN.
PORT #1 ~---[...~I L_....J
TEST PORT # 2
son TERM'NATlON~>l '
MlZAC TEST H-8-4
PORT" 3
FIGURE 12. RF·IU BLOCK DIAGRAM

TABLE 1. MODE S SENSOR JTIDS EFFECTS TEST PERFORMANCE PARAMETERS
1- Mode S signal level at input Varied from -60 to -83 dBm to the Mode S sensor
2. JTIDS signal level at input to the -35 to +10 dBm in 10 dB or Mode S sensor smaller increments when
effects are first noted
3. JTIDS Signal Normal (hopping)
4. JTIDS TSDF 100/100, 100/50*, 100/25*, 80/40*, 40/20*, 60/60, SO/SO, 40/40, 20/20, 10/10
5. JTIDS Background -50 dBm
6. TACAN/DME Environment Pulse pair distribution of Nonperiodic, 270 pulses
TACAN/DME interrogators per second (pps) Channel 7Y (1094 MIIz) Signal level at input to -50 dBm
sensor receiver
7. Mode S fruit rates o and 52 (per second)
8. ATCRBS fruit rates o and 17,000 (per second)
* Complete only if an effect was detected at a JTIDS TSDF of 100/100 and a signal level of -40 dBm or weaker (determines if background contributes to the effect).
**This corresDonds to a background environment of JTIDS users at a distance of 15 nmi.
19
SYSTEM PERFORMANCE PARAMETERS
The Mode S sensor receiver system performance parameters to be monitored throughout the tests are found in the putput data listing of the diagnostic software routine RAA. These parameters include reply decode status, reply message, and reply monopulse video value.
1. Reply Decode Status (or Failure Code (FC»:
a. FC-OO - Normal reply decode
b. FC-Ol - No reply (preamble) detected in listening window
c. FC-lO - Bad message decode (uncorrectable error or bad parity)
FC-ll - No IIIOnopulse estimate (either multiple low confidence bits or the reply was received outside the antenna pattern main beam lobe area as defined by receiver threshold settings for sum, delta, and anni signal amplitude comparison processing).
Reply Message: Each reply message should be reported the same. Any inconsistencies in the reported message content would indicate an interference effect.
Reply Monopulse Video Value: Reported as a decimal number, the monopulse video value is derived from a ratio of delta to sum signal levels in the receiver and compared to a lookup table in the processor's memory. The monopulse value indicates azimuth location of a target referenced to bores ight but in the main lobe of the antenna pattern. Minimum va1ues used could be 24 (1.78') up ~o 214 (-1.25'), with boresight (no azimuth offset) at 128.
JTIDS SIGNAL PARAMETERS
The JTIDS signal parameters used in these tests are shown in table 2. The JTIDS system multiplexes transmissions from a deployment of users on the basis of 7.8125 milliseconds timeslots. Under full-load conditions, 100 percent of these times lots could be utilized, and a receiver in the environment might receive bursts of signal at a rate of one burst every 7.8125 milliseconds.
20

TABLE 2. JTIDS SIGNAL PARAMETERS
Total Timeslot Duty Factor (Percent> 100 to 10
Fore2round Timeslot Dutv Factor Ratio Variable
-50 dBm* variable
-35 to +10 dBm in 10 dB or smaller increments when effects are first noted
Wide-band
Double pulse
Absolute Level of Back2round JTIDS Si2Ilal
RF Foreground Level
Mode of Operation
Waveform
*This corresponds to a JTIDS background level greater than expected.
To determine the effect of the JTIDS TSDF, a range of values from 100 percent to 10 percent was chosen. The JTIDS signal source is capable of attenuating a portion of the timeslots transmitted to approximate the effect of an environment of JTIDS users. The foreground duty factor ratios (percentage of timeslots not attenuated) are All, None, 1 of 2, 1 of 4, and 1 of 8. The timeslots that are attenuated can be held at a fixed level of -50 dBm. The foreground JTIDS environment will be stepped from -35 to +10 dBm.
The JTIDS foreground will consist of a single user located on the same radial as a desired target. The JTIDS background (-50 dBm mainbeam or -76 dBm side lobe) will be comprised of four users in a ring. One user will be on the same radial as a desired target along with the single JTIDS foreground user, and the other three will be in the sidelobes. The JTIDS background times lot allocation will be equally distributed among the four background users.
To simulate the background users and a single foreground user, it was necessary to overcome the hardware limitations of the JTIDS simulator. The JTIDS simulator function settings required to achieve the desired TSDF combinations are presented in table 3. Except for the 80/40 TSDF, if the des ired TSDF was not at tainab Ie due to equipment limitations, the closest TSDF that was larger was used. For 80/40, the combinat ion that placed the foreground at 44 percent was used. Any other combination that could be used to approximate 80/40 greatly exceeded the 40 percent TSDF foreground requirement.
21

TABLE 3. JTIDS SIMULATOR FUNCTION SETTINGS
Required Required Desired TSDF TSDF Mode
Setting Setting
100/50 70 1 of 4*
100/25 50 1 of 2*
80/40 50 1 of 8*
40/20 50 1 of 8*
*The foreground and background ports are reversed for these tests (e.g., 1 of 4 becomes 3 of 4 in the foreground).
DATA ANALYSIS
Mode S performance parameters will be analyzed for each combination of extraneous pulse environment and JTIDS signal and TSDF. The performance of the Mode S sensor will be noted with and without the extraneous pulse environment and then compared to the performance of the system in the presence of JTIDS (with various signal strengths and TSDF combinations as listed in table 1).
The output data from sensor software diagnostic ''RAA'' wi 11 be post-test reduced on a Digital Equipment Corporation PDP-II computer system which resides in the sensor building. Plots and graphs will be used to present the data in a comprehensive form. The data result will be presented to show "baseline performance" data (without JTIDS signals present> along with the saine performance parameter data in the presence of JTIDS. Data presented in this manner will show the magnitude of change in performance of the sensor (if any) at particular JTIDS signal levels and TSDF.
COORDINATION AND AREAS OF RESPONSIBILITY.
The Department of Defense will provide the JTIDS signal source simulator and the RFIU, and appropriate personnel to operate them. The FAA Technical Center will provide the 1090 KHz Fruit Source, Mode S sensor, and associated TTG and RF Test Head. Technical Center personnel from ACT-100 will be utilized to operate the sensor and diagnos tic software as well as data reduction programs on the PDP-ll. Personnel from ACT-520 will operate the TTG, RF Test Head, and Fruit Source, as well as inaure proper test setup, configuration, and procedures.
22

SCHEDULE
Shown in figure 13 is the proposed JTIDS/Mode S sensor EKC test schedule. The schedule assumes (and is contingent upon) availability of the Mode S sensor and JTIDS signal source simulator. Reliability of all equipment involved is also implied.
5 10 JUNE
15 20 25 30 5 10 JULY
15 20 25 30 5 10 AUGUST 15 20 25 30 5
SEPTEMBER 10 15 20 25 30
SET UP
EQUIPMENT CHECK OUT
PRELIMINARY DAtA COLLECTION
AND ANALYSIS
,. FOR TIll! RECORD" DATA COLLECTION AND REDUCTION
DAtA ANALYSIS
FIGURE 13. JTIDS/MODE S SENSOR EMC TEST SCHEDULE
23