joint research centre - github pages research centre the european commission's in-house science...
TRANSCRIPT

Joint Research Centrethe European Commission's in-house science service
Serving society
Stimulating innovation
Supporting legislation
Overview of the Correlation and CO2MPAS
Process
Ispra, 15/05/2017
J. Pavlovic, G. Fontaras,
V. Arcidiacono, V. Valverde, K. Anagnostopoulos, S.
Tsiakmakis, B. Ciuffo, J., D. Komnos, A. Tansini
Yes
Yes
No
WLTP Test DataTA data –
NEDC DV –TA Doc.
Dice report emailed to Timestamp
Server
NEDC to be
tested?
Physical NEDC Test
No –
Accept
DV,
Add H
ash in T
A d
oc
CO2DV
CO2 𝐶𝑂2𝑀𝑃𝐴𝑆> 0.96
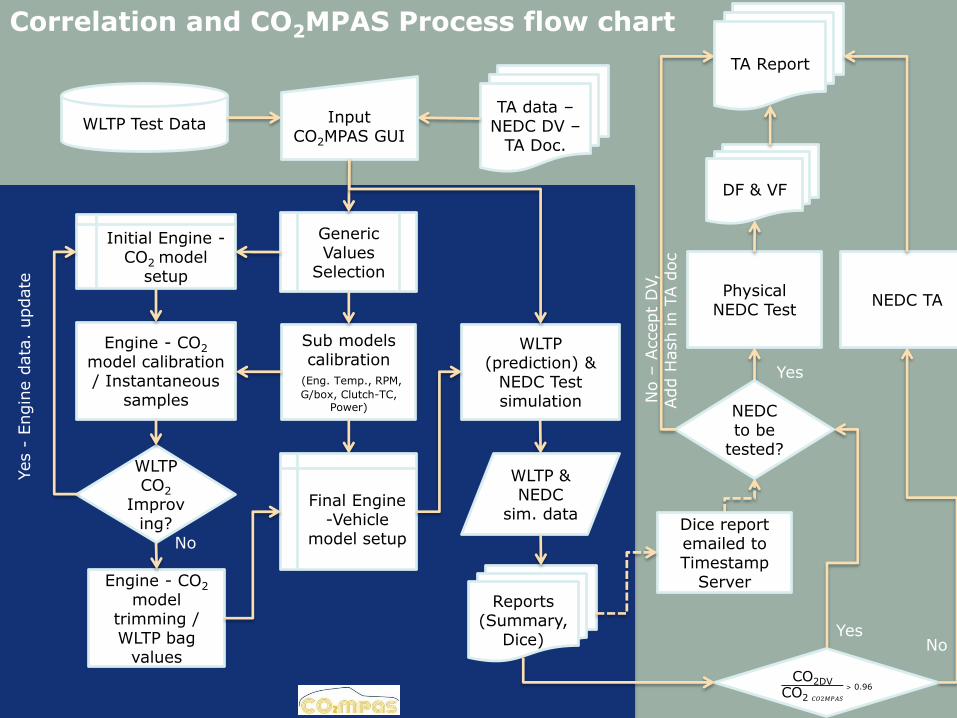
Correlation and CO2MPAS Process flow chart
Input CO2MPAS GUI
Generic Values
Selection
Sub models calibration
(Eng. Temp., RPM,
G/box, Clutch-TC, Power)
WLTP CO2
Improving?
Engine - CO2
model calibration / Instantaneous
samples
Initial Engine -CO2 model
setup
Engine - CO2
model trimming / WLTP bag
values
Yes -
Engin
e d
ata
. update
No
Final Engine -Vehicle
model setup
WLTP (prediction) &
NEDC Test simulation
WLTP & NEDC
sim. data
Reports (Summary,
Dice)
NEDC TA
DF & VF
TA Report
CO2MPAS Report
• CO2MPAS detailed report contains all input/output data,
charts, summarized results.
• Two important tabs for TA process in that report are:
1. OUTPUT REPORT and
2. DICE REPORT
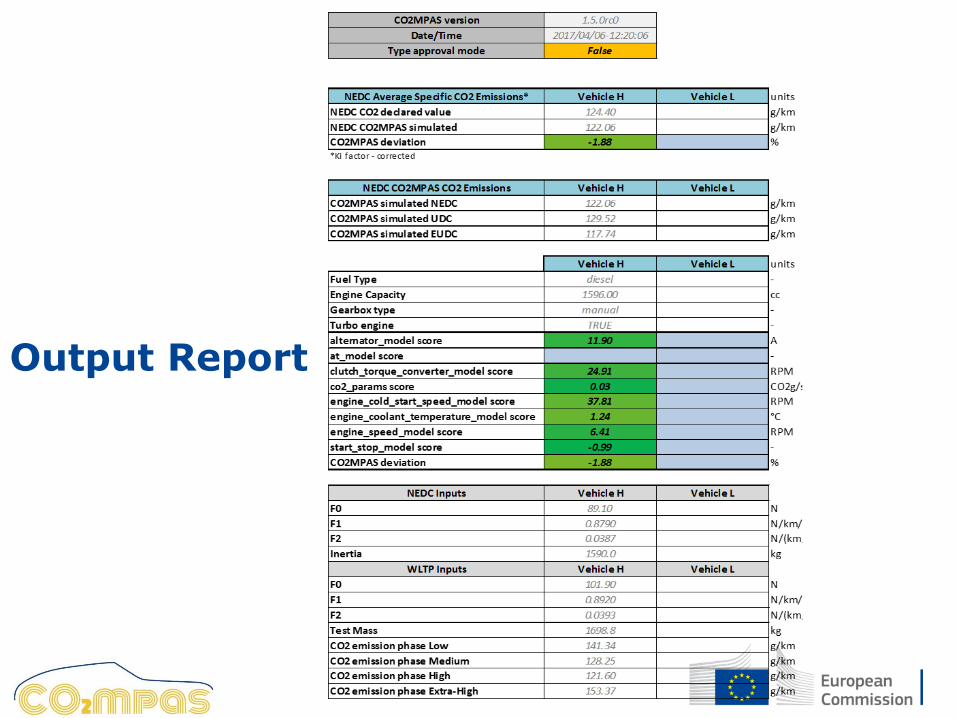
Output Report

Output Report
1. If CO2MPAS deviation
≤4% OEM declared NEDC
CO2 value is accepted;
2. If CO2MPAS deviation
>4% OEM has option to
accept new value or to
request physical test.
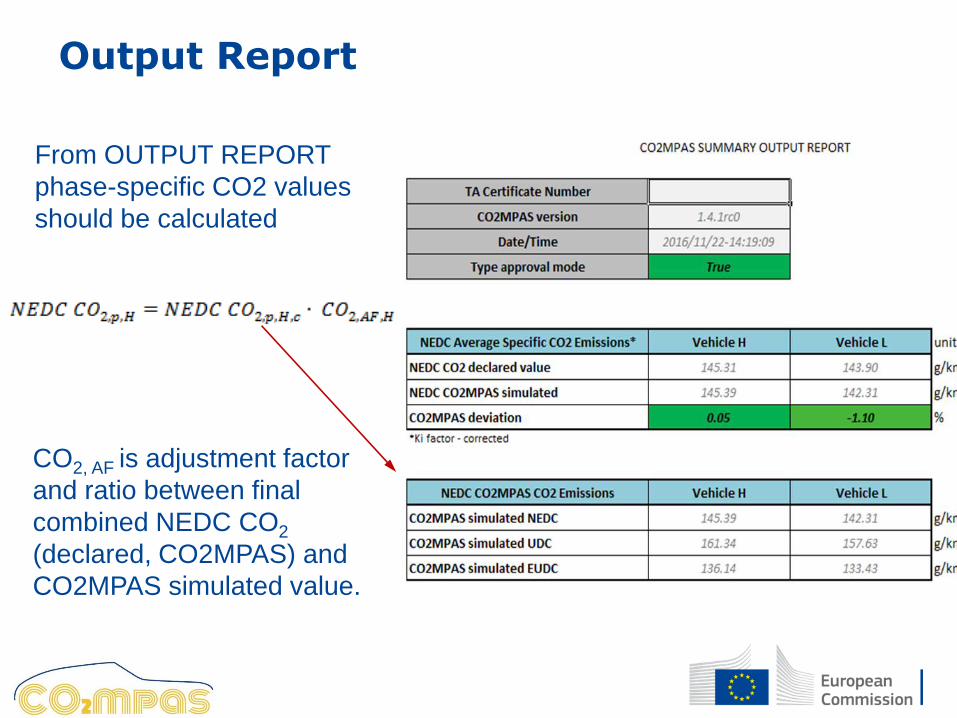
Output Report
From OUTPUT REPORT
phase-specific CO2 values
should be calculated
CO2, AF is adjustment factor
and ratio between final
combined NEDC CO2
(declared, CO2MPAS) and
CO2MPAS simulated value.
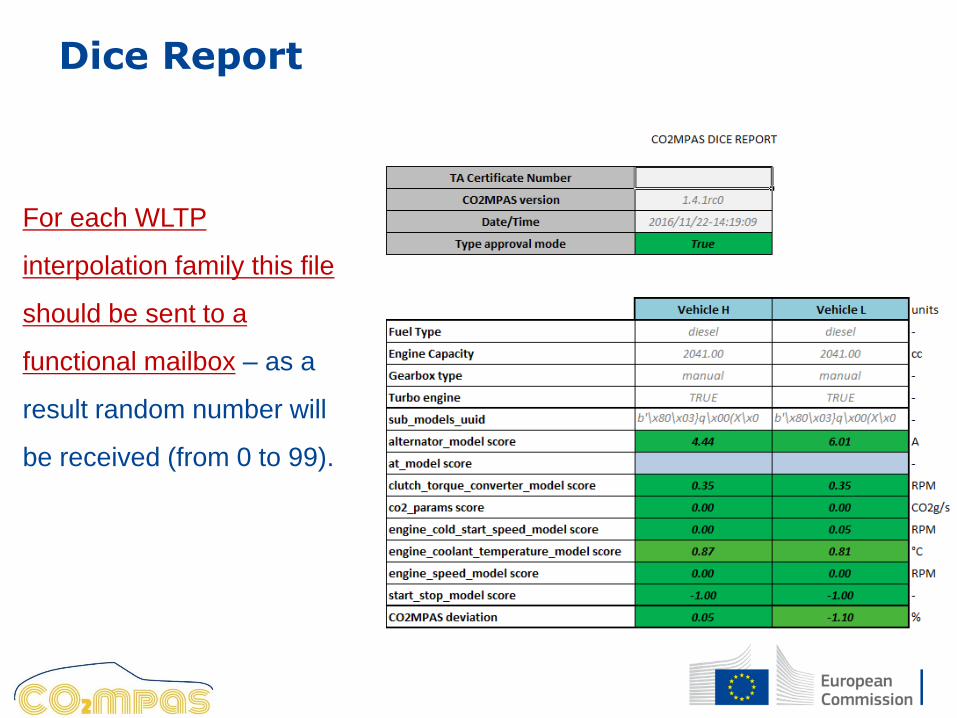
Dice Report
For each WLTP
interpolation family this file
should be sent to a
functional mailbox – as a
result random number will
be received (from 0 to 99).

Random Number
CO2MPAS DEVIATION ≤4%
SCENARIO A
RN 0-89
DV ACCEPTED
DICE REPORT SENT
CO2MPAS DEVIATION >4%
SCENARIO B
CO2MPAS ACCEPTED
RN 95-99RN 90-94
END TA PROCESS
1 NEDC-L TEST
1 NEDC-H TEST

Random Number
CO2MPAS DEVIATION >4%
SCENARIO C
NEGLECT RN RECEIVED
PHYSICAL NEDC TESTING
DICE REPORT SENT
TEST 1
TEST 2
TEST 3

Random Testing
Only in cases where CO2MPAS was used to confirm declared value
there is 10% of chance for performing one random physical test.
From this test Verification Factor and Relative Deviation should be
recorded in TA certificate and CoC.
Verification Factor VF is used to check accuracy of the input data (fuel
saving gear, start-stop activation time, and BERS). In case of non
conformity it shall be set to 1.
Relative Deviation De is deviation between measured and OEM
declared value

In the following slides,
• Start-Stop Activation Time
• Fuel saving for automatic vehicles
• Brake Energy Recuperation System
will be clarified with specific methods in real examples.
VERIFICATION FACTOR
CO2MPAS team will support you
and try to find
the solution if you face any doubts
about the model and its usage.

START STOP ACTIVATION TIME
Is the Start-Stop activation time declared correctly? Identify from random NEDC test when the first Start-Stop occurred
from the measured engine speed signal (RPM=0 for the first time). T Then, considering the start stop activation time the above must
apply:𝑡𝑑𝑒𝑐𝑙𝑎𝑟𝑒𝑑 ≥ 𝑡𝑚𝑒𝑎𝑠𝑢𝑟𝑒𝑑
WRONG INPUT! CORRECT INPUT!
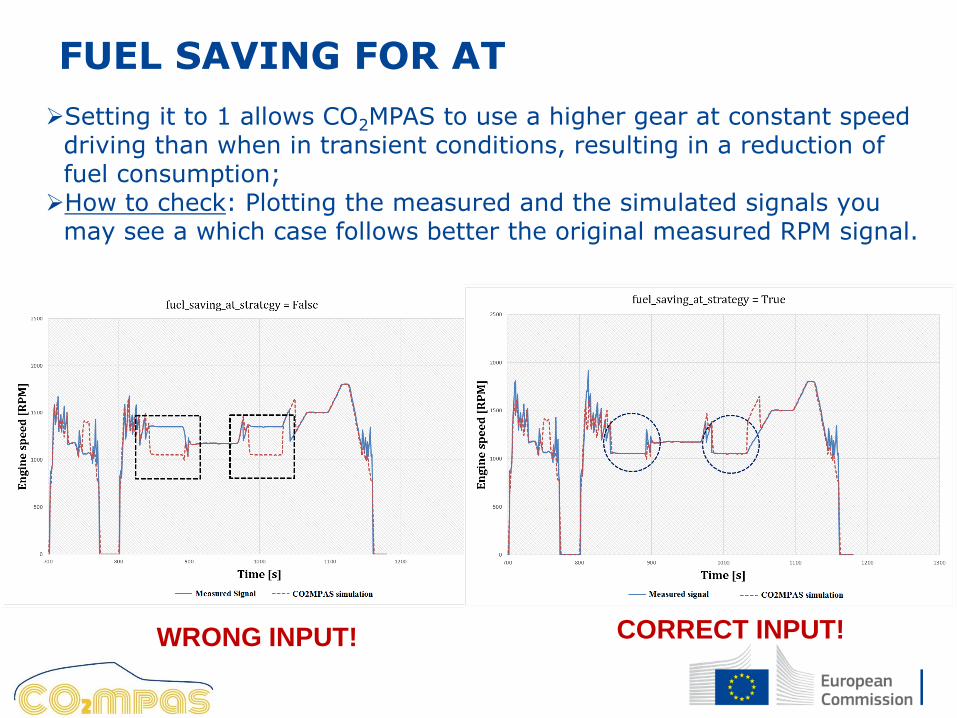
FUEL SAVING FOR AT
Setting it to 1 allows CO2MPAS to use a higher gear at constant speed driving than when in transient conditions, resulting in a reduction of fuel consumption;
How to check: Plotting the measured and the simulated signals you may see a which case follows better the original measured RPM signal.
WRONG INPUT! CORRECT INPUT!

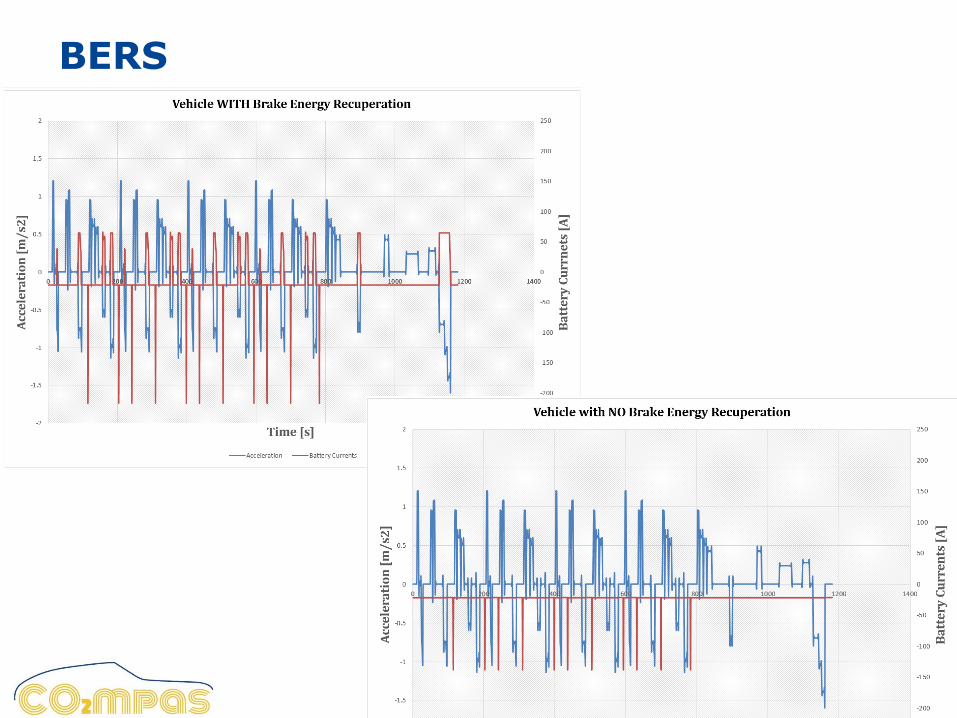
BERS
Setting it to 1 means that the vehicle is equipped with any kind of break energy recuperation technology or regenerative breaking;You should check in parallel the acceleration signal and the
battery current. When the vehicle brakes, the acceleration is negative.
At the periods of breaking (Acceleration < 0), you will observe
positive peaks in the battery signal.
BERS

Yes
Yes
No
WLTP Test DataTA data –
NEDC DV –TA Doc.
Dice report emailed to Timestamp
Server
NEDC to be
tested?
Physical NEDC Test
No –
Accept
DV,
Add H
ash in T
A d
oc
CO2DV
CO2 𝐶𝑂2𝑀𝑃𝐴𝑆≥ 0.96
Correlation and CO2MPAS Process flow chart
Input CO2MPAS GUI
Generic Values
Selection
Sub models calibration
(Eng. Temp., RPM,
G/box, Clutch-TC, Power)
WLTP CO2
Improving?
Engine - CO2
model calibration / Instantaneous
samples
Initial Engine -CO2 model
setup
Engine - CO2
model trimming / WLTP bag
values
Yes -
Engin
e d
ata
. update
No
Final Engine -Vehicle
model setup
WLTP (prediction) &
NEDC Test simulation
WLTP & NEDC
sim. data
Reports (Summary,
Dice)
NEDC TA
DF & VF
TA Report

Technologies not covered with CO2MPAS
• Physical NEDC measurements shall be used instead of CO2MPAS in
case of HEVs (both OVC-HEVs and NOVC-HEVs)
• However, other provisions set out in Annex I regarding the physical
testing shall be respected, in particular:
1. Calculation of NEDC RLs and inertia;
2. Number of tests and interpretation of results; and
3. Calculation of CO2 and FC attributed to individual vehicles in the
NEDC interpolation family

JRC Science Hub: www.ec.europa.eu/jrc
Twitter: @EU_ScienceHub
LinkedIn: european-commission-joint-research-centre
YouTube: JRC Audiovisuals
Vimeo: Science@EC
Stay in touch
https://[email protected]

FUEL SAVING FOR AT
Second option to check: In case that it is still difficult to visually verify if in a specific automatic vehicle this technology applies, you shall calculate the mean error between the measured and the simulated engine_speed vector for the steady state parts of UDC and EUDC:
𝑒𝑟𝑟𝑜𝑟 =
𝑖=0
𝑛
(𝑅𝑃𝑀𝑚𝑒𝑎𝑠𝑢𝑟𝑒𝑑 𝑖 − 𝑅𝑃𝑀𝑠𝑖𝑚𝑢𝑙𝑎𝑡𝑒𝑑 𝑖 )
If the mean error is higher than 0, the fuel saving gear is likely not to be present in the vehicle