joint placement and device association of uav base
TRANSCRIPT
sensors
Article
Joint Placement and Device Association of UAV BaseStations in IoT Networks
Ashfaq Ahmed 1, Muhammad Awais 1,* , Tallha Akram 1 , Selman Kulac 2 ,Musaed Alhussein 3 and Khursheed Aurangzeb 3,∗
1 Department of Electrical & Computer Engineering, COMSATS University Islamabad, Wah Campus,Wah Cantt 47040, Pakistan; [email protected] (A.A.); [email protected] (T.A.)
2 Department of Electrical-Electronics Engineering, Faculty of Engineering, Duzce University, Konuralp,Duzce 81620, Turkey; [email protected]
3 Computer Engineering Department, College of Computer and Information Sciences, King Saud University,Riyadh 11543, Saudi Arabia; [email protected]
* Correspondence: [email protected] (M.A.); [email protected] (K.A.)
Received: 12 March 2019; Accepted: 27 April 2019; Published: 9 May 2019�����������������
Abstract: Drone base stations (DBSs) have received significant research interest in recent years.They provide a flexible and cost-effective solution to improve the coverage, connectivity, quality ofservice (QoS), and energy efficiency of large-area Internet of Things (IoT) networks. However, as DBSsare costly and power-limited devices, they require an efficient scheme for their deployment in practicalnetworks. This work proposes a realistic mathematical model for the joint optimization problem ofDBS placement and IoT users’ assignment in a massive IoT network scenario. The optimization goal isto maximize the connectivity of IoT users by utilizing the minimum number of DBS, while satisfyingpractical network constraints. Such an optimization problem is NP-hard, and the optimal solutionhas a complexity exponential to the number of DBSs and IoT users in the network. Furthermore,this work also proposes a linearization scheme and a low-complexity heuristic to solve the problem inpolynomial time. The simulations are performed for a number of network scenarios, and demonstratethat the proposed heuristic is numerically accurate and performs close to the optimal solution.
Keywords: resource management; Unmanned aerial vehicles (UAVs); Aerial base stations; Internetof Things (IoTs)
1. Introduction
The use of drone base stations (DBSs) has been realized as a promising addition to the conventionalwireless networks. DBSs are adopted to achieve multiple objectives. On one hand, they help toincrease the coverage of existing terrestrial networks, such as broadband and cellular networks [1].On the other hand, they serve as assisting relays to improve the connectivity of ground wirelessdevices [2]. In contrast to the terrestrial BSs which are fixed, DBSs have the ability to fly anddeliver network services to any hard-to-reach areas. In addition to the horizontal manoeuvring,they have the ability to adapt their altitude. This enables them to establish LOS links to groundusers [3]. Moreover, they improve the capacity of networks by serving as mobile hotspots. Alongwith the open-air communication, small drones have also proven to be an effective solution for indoorcommunications [4].
Internet of Things (IoT) is one exciting application of DBSs. IoT refers to a set of small, uniquelyidentifiable devices connected to the Internet. Practical IoT networks are composed of a massivenumber of heterogenous devices, which include smart phones, sensors, electronic gadgets andwearables, network connectivity modules implanted on the vehicles, animals, household electrical
Sensors 2019, 19, 2157; doi:10.3390/s19092157 www.mdpi.com/journal/sensors
Sensors 2019, 19, 2157 2 of 16
appliances, medical equipment, and many more. These devices perform tasks in a diverse rangeof applications, such as E-health [5], personal healthcare devices [6], radio sensor networks [7],the intelligent transport system (ITS) [8], smart cities [9], and industrial IoT [10]. The massive nature ofIoT poses some major challenges, including spectrum scarcity, reliability, energy efficiency, high-speeduplinks, and ultra-low latency. In particular, the IoT devices are highly power constrained and lackthe ability to communicate at longer distances. This becomes a critical issue when these devices aredeployed in areas with poor or no coverage provided by existing terrestrial wireless networks.
In such an IoT scenario, the use of DBSs can be a promising solution. The DBSs can serve therole of moving data aggregators—in other words, they can fly close to IoT devices, collect their data,and transmit it to other devices which are out-of-range of the transmitting IoT devices. In addition,due to their aerial nature, DBSs can be deployed at high altitudes. This helps to mitigate the shadowingeffects and increases the probability of LOS communication between the DBSs and ground IoT devices.Consequently, the battery-limited IoT devices will be able to communicate with much lower transmitpower. In addition, DBSs also have the ability to change their location based on the activation pattern ofIoT devices. This helps them to support an anticipated number of devices in massive IoT deployment.
1.1. Literature Review
Despite the elegant features, DBSs themselves are power-constrained machines. Using dronesfor IoT communications can be an expensive solution if they are not optimally positioned. The totalcost of DBS deployment constitutes the flight time, the connection establishment time, disconnectiontime, and the cost of drones as a device. Therefore, it is of paramount importance to come up with anoptimal drone placement to serve the maximum number of IoT devices. In the literature, the droneplacement problem for different objectives is considered in a number of published works. In [11],the authors consider a 2D placement problem with an objective to maximize the network coveragewhile minimizing the transmit power. A heuristic is proposed to solve the optimization problem.The formulated 2D placement problem is further modified for efficient drones deployment in a 3Dscenario. In [12], a backhaul-aware 3D drone placement is considered for a heterogeneous network.The placement algorithm maximizes the sum-rate and number of served users, considering the limitingfactors, the peak data rate of wireless backhaul, and the bandwidth of DBS. In most of the research,the free-space path loss model has been considered for DBS deployment; however, in real scenarios,the IoT devices are scattered everywhere, that is, at indoor or outdoor locations. In [13], the wirelesscoverage for indoor users inside the high-rise buildings is considered. The presented model assumes asingle drone. A hybrid path-loss model is proposed, which takes into account the path losses due tofree-space, building penetration, and indoor losses. Particle swarm optimization (PSO) is generallyused to minimize the total transmit power required to cover the indoor users. In [14], a solution wasproposed to maximize the revenue of the cellular network using 3D placement of DBSs. The problemwas formulated as a mixed-integer non-linear problem (MINLP) and solved using a heuristic. In [15],3D deployment of DBS was considered to study energy-efficient communication in mobile ad hocnetworks. The work proposes an optimal DBS placement that minimizes the UAV-recall-frequency(UAV-RF), while taking into account the on-board circuit power. The authors also studied the effect ofscattering on the optimal hovering altitude of DBS. Furthermore, the work concludes that minimumUAV-RF is achieved when the transmit power is equal to the power consumed by the on-board circuit.Network life can be prolonged by limiting this on-board circuit power. In [16], a mathematical modelis proposed for the optimal number of drones, along with their efficient placement in wireless cellularnetworks. The problem is solved using a PSO algorithm. In [17], a heuristic solution was proposedthat minimizes the number of DBSs to provide wireless coverage to a group of distributed TBSs. In [18],the placement of DBSs was studied to maximize the coverage for users with different QoS requirements.In [19], a method was proposed for joint radio resource allocation, 3D placement, and user association ofDBSs for IoT networks. As discussed earlier, drones can be used for the assistance of already deployednetworks. In [20], the resource allocation problem for drone-assisted networks was investigated,
Sensors 2019, 19, 2157 3 of 16
where the drones were utilized to harvest energy to the D2D pairs. Similarly, in [1], the drones wereadopted to assist the TBSs for densification. In [21], the authors proposed a methodology for UAVtrajectory design and radio resource assignment for a vehicle-to-anything scenario. The work proposesa joint scheduling strategy where a vehicle can be served by both the terrestrial BS (TBS) or DBS,and the one that provides maximum throughput is selected. The TBSs are selected on the basis ofround robin scheduling, whereas the DBS are selected using both round robin and proportionalityfair scheduling. A heuristic solution is proposed for UAV trajectory planning. DBSs can be used ina distributed and multi-layered architecture, such as the micro-cell/picocell, macrocell/microcell,or just macrocell [22]. The DBSs can also function in cooperation, using swarm formation. But as theDBSs have limited computational, storage, and communication capacities, they are unable to performcomputationally intensive tasks. In order to extend the capacity of DBSs swarms, an DBSs-edge-cloudcomputational model [23] was adopted in order to support resource-intensive application, such as bigdata, artificial intelligence, and computer vision. An on-demand UAV placement was proposed in [24],where the users were arbitrarily distributed. The problem was modelled as a Knapsack-like problem,where a density-aware placement algorithm was proposed to maximize the user coverage subject tothe constraint of the minimum required data rates per user.
In [25], a joint optimization problem was solved for the placement and power allocation (PA) toimprove the performance of the NOMA-UAV network. The objective was to maximize the sum rate ofusers. Along with IoT, the body sensor network (BSN) is also among one of the major applications of5G networks. Both in IoT and BSN, the nodes are very quickly drained due to a number of performedoperations, including registration, removal, and routing. Therefore, an energy-efficient solution isrequired to maintain a high transmission capacity. In [26], an efficient approach for device discoveryin 5G-based IoT and BSNs using multiple UAVs was proposed, where significant achieved gainsin energy consumption were claimed. An integrative IoT platform is presented in [27], where thedrones are utilized to serve different IoT devices. [2] studies the role of drones as relays, both foramplify-and-forward (AF) and decode-and-forward (DF) protocols in the cooperative communication.
To the best of our knowledge, in most existing studies, one aspect of resource allocation isaddressed, in that there are works which focus on DBS assignment alone, or works in which userassociation is optimized given a fixed deployment of DBSs. In contrast, this work proposes amathematical model that jointly optimizes the DBS placement and resource allocation problem.
1.2. Contribution
The main contributions to this work are as follows.
• Firstly, a mathematical model is presented that jointly optimizes the resources used by IoT devices.The objective of the optimization problem is to minimize the ratio of the number of DBSs to theconnected IoT devices. The proposed model is developed by adopting a realistic air-to-ground(A2G) path loss model;
• The formulation of the proposed model considers the practical network constraints, whichinclude: (a) the DBS deployment budget, (b) the network’s QoS requirements, and (c) the DBSbattery-life prolongevity;
• A low-complexity heuristic is proposed to solve the optimization problem;• The simulation results are carried out for a number of network scenarios and validate the
accuracy of the proposed solution. The results’ comparisons show that the proposed algorithm’sperformance is close to that of the optimal solution.
2. System Model and Problem Formulation
Figure 1 illustrates an example of a massive IoT network spread over a metropolitan city.In practical situations, hundreds of heterogenous IoT devices are deployed over large geographicalareas. These devices perform tasks in a wide variety of applications, including smart homes,

Sensors 2019, 19, 2157 4 of 16
remote asset control in industries, connected vehicles, wearable gadgets, smart shops, smart airports,tele-medicine, environmental monitoring, and disaster management. Such massive IoT deploymentresults in enormous growth of internet traffic, and requires existing cellular networks to undergo majorarchitectural changes.
IoT
devices
RRH
(BS)
Potential
Drone-BS
placement
locations
Figure 1. Proposed system model of an Internet of Things (IoT) network spread. It consists of Nheterogeneous IoT (mobile and stationary) users spread over a metropolitan area with M potentiallocations for DBS placement.
In a general IoT network, the IoT user equipments (UEs) are able to communicate with each otherthrough wireless resources provided by TBSs, equipped with remote radio heads (RRHs). The RRHsare then connected to each other through high-speed communication links. Due to their mobility,it may be that a massive number of IoT devices are active in a given geographical area for a limitedtime. In such a situation, the DBSs come handy and provide a cost-effective solution to complement theTBSs and improve the connectivity and energy efficiency of IoT networks. DBSs can also help to restorecommunications in areas where terrestrial infrastructure has been collapsed after a disastrous situation.
Consider an IoT network which serves a total of N IoT devices (In the following text, the word IoTdevices is used interchangeably with IoT users or simply users) in a given geographical area. The areais divided into M potential candidate locations where DBS can be deployed. Due to their mobility,DBSs are able to move from one location to another in order to fulfil the connectivity requirements.Let’s say the triplet (xi, yi, hi) denotes the location of DBS i in a 3D system, where xi, yi are its positioncoordinates in a X-Y coordinate system, and hi is its height. This work assumes a constant height h forall DBSs deployed in the network. A DBS can potentially occupy any discrete location between (0, 0, h)and (xmax, ymax, h).
The DBS placement algorithm is aimed at determining the optimal number and position of DBSswhich maximizes the connectivity for a given set of IoT users. An air-to-ground (A2G) path loss modelis assumed in this work, and discussed as follows.
2.1. Air-to-Ground (A2G) Path Loss Model
As shown in Figure 1, the exact locations of the IoT devices and the approximate locations ofthe obstacles, such as high-rise buildings, are known, along with the environment (e.g., urban, rural,suburban). However, due to a lack of complete information, the probabilistic approach is adopted.

Sensors 2019, 19, 2157 5 of 16
The probability of line-of-sight (LoS) and non-line-of-sight (NLOS) between DBSs placed at location mand the IoT device at n are given as [28]:
PnmLoS =
11 + a exp(−b[θmn − a])
, ∀m, n (1)
PmnNLoS = 1− Pmn
LoS, ∀m, n (2)
where a and b are the constants, and their values depend on the carrier frequency fc and type ofenvironment, such as rural, urban, or dense urban [28]. θmn is the elevation angle between the DBS mand the IoT device n, and is equal to tan−1 h
rmn, where h is the altitude of DBS and rmn is the horizontal
distance between DBS m, and the IoT device n is given as:
rmn =√(xn − xm)2 + (yn − ym)2 + h2, ∀m, n (3)
The expressions for path loss for LOS and NLOS communication are given as LLoS,mn = Y + σLoS
and LNLoS,mn = Y + σNLoS, respectively. Here, Y = 10α(
4π fcrmnc
)[28], where c is the speed of light, α
is the path-loss exponent, and σLoS and σNLoS are average additional losses which occur in additionto the free-space propagation loss. The values of σLoS and σNLoS depend on the environment. Finally,the average path loss can be represented as a function of DBS height and coverage circle, as:
L(xm, ym, hm) = PmnLoSLmn
LoS + PmnNLoSLmn
NLoS, ∀m, n (4)
and the average channel gain can be computed as:
gmn = L(xm, ym, hm)−1, ∀m, n (5)
Using the channel gain computed above, the signal-to-noise ratio (SINR) for a downlink channelbetween a DBS m and IoT user n can be computed as:
SINRmn =Pmgmn
∑u∈Iint
Pugun + σ2 (6)
where Pm is the transmit power of DBS m, Iint is the set of interfering DBSs, and σ is thebackground noise.
2.2. Variable Definition
The main notations and variables used in this work are listed in Table 1. This work considers anIoT network composed of N IoT devices and M candidate locations for DBS placement. Let’s say x is aDBS placement vector of size M, given as:
x = (x1, x2, · · · , xM) (7)
where an entry xi in x is a binary “1” when a DBS is placed at location i, and “0” otherwise. Similarly,let’s say Y is the user-DBS connectivity matrix of size N×M. An entry ynm of Y is a binary “1” when auser n is connected to a DBS placed at potential location m, and “0” otherwise.
2.3. System Constraints
The DBS deployment problem modelled in this work considers the following practical constraints.
Sensors 2019, 19, 2157 6 of 16
2.3.1. Minimum Users Connectivity Constraint
To achieve the QoS requirements of the IoT network, a certain minimum percentage β of total IoTdevices must be served. Mathematically,
N
∑n=1
M
∑m=1
ymn ≥ βN (8)
where β ∈ [0, 1].
2.3.2. User Connectivity with Deployed DBS Constraint
According to this constraint, an IoT user must be connected to a potential location where DBS hasactually been deployed. Mathematically,
ymn ≤ xm, ∀n ∈ {1, · · · , N}, m ∈ {1, · · · , M}, (9)
Equation (9) means that if a DBS is placed at a certain location, m (i.e., xm = ‘1’ in x), then a user may ormay not be connected to it (i.e., entries in the m-th row of Y can be “0” or “1”). However, if a DBS isnot placed at location m (i.e., xm = ‘0’), then no user can be connected to this location (i.e., all entries inrow m of Y must be equal to “0”).
2.3.3. Single DBS Connectivity for a User Constraint
A user/device can be connected to one DBS at most. Mathematically, this constraint can beformulated as:
M
∑m=1
ymn ≤ 1, ∀n (10)
since rows of Y correspond to the DBSs and its columns correspond to users, ∑Mm=1 ymn indicates the
number of DBSs to which the user n is simultaneously connected. According to (10), this sum must beless than or equal to “1” for each IoT user in the network.
2.3.4. Maximum and Minimum Capacity of DBS Constraint
Each DBS in the network is a resource-limited device, and is capable of serving a certain maximumnumber γmax of users. Mathematically:
N
∑n=1
ymn ≤ γmaxxm, ∀m ∈ {1, · · · , M} (11)
According to Equation (11), if a DBS is assigned at location m (i.e., xm = ‘1’), then the total numberof users connected to it (i.e., ∑N
n=1 ymn) must be upper-bounded by γmax. Similarly, a DBS must beconnected to a certain minimum number γmin of users to justify its deployment cost. Mathematically:
N
∑n=1
ymn ≥ γminxm, ∀m ∈ {1, · · · , M} (12)
2.3.5. DBS Deployment Budget Constraint
The DBS deployment incurs a cost, which includes the costs of flight time and connectionestablishment. The total deployment cost of all DBSs assigned must not exceed a certain availablebudget. Mathematically, this constraint can be modeled as:
M
∑m=1
cmxm ≤ Cmax (13)

Sensors 2019, 19, 2157 7 of 16
where Cmax is the maximum available budget for DBS deployment, and cm is the deployment cost of asingle DBS placed at location m.
2.3.6. Maximum User-DBS Distance Constraint
A user can only be connected to a DBS if its distance to the DBS location lies within a certainmaximum value dmax. Mathematically,
ymn · dmn ≤ dmax (14)
where dmn denotes the distance between an IoT device n and the DBS placed at location m.
2.4. An Optimization Model for Drone-BS Deployment for Maximal Coverage
Given the network scenario and practical constraints mentioned above, this work considers thefollowing mathematical model for DBS placement.
minxm∈{0,1},ymn∈{0,1},∀n,m
No. of DBSs︷ ︸︸ ︷M
∑m=1
xm
N
∑n=1
M
∑m=1
ymn︸ ︷︷ ︸No. of connected IoT devices
subject to:
Constraints (8)–(14)
(15)
The optimization problem of (15) is an integer fractional optimization model. The numerator ofthe objective function denotes the total number of DBSs deployed, whereas the denominator denotesthe total number of IoT users served by the network. Therefore, the optimization goal is to obtainmaximum network connectivity with the minimum number of DBSs, while satisfying the practicalnetwork constraints.
2.5. Linearization of Optimization Problem
This work linearizes the fractional optimization problem of (15) using the method proposed in [29].
Let us consider two variables t = {∑Nn=1 ∑M
m=1 ymn}−1 and α = max[1, min(∑N
n=1 ∑Mm=1 ymn)
−1],
where ymn ∈ {0, 1} and ∑Nn=1 ∑M
m=1 ymn > 0. Therefore, α = max[1, 1] = 1. Now the optimizationproblem (15) can be rewritten as:
minxm∈{0,1},ymn∈{0,1},
0≤t≤1∀n,m
αM
∑m=1
xmt
subject to:
Constraints (8)–(14)
αN
∑n=1
M
∑m=1
ymnt = 1
(16)
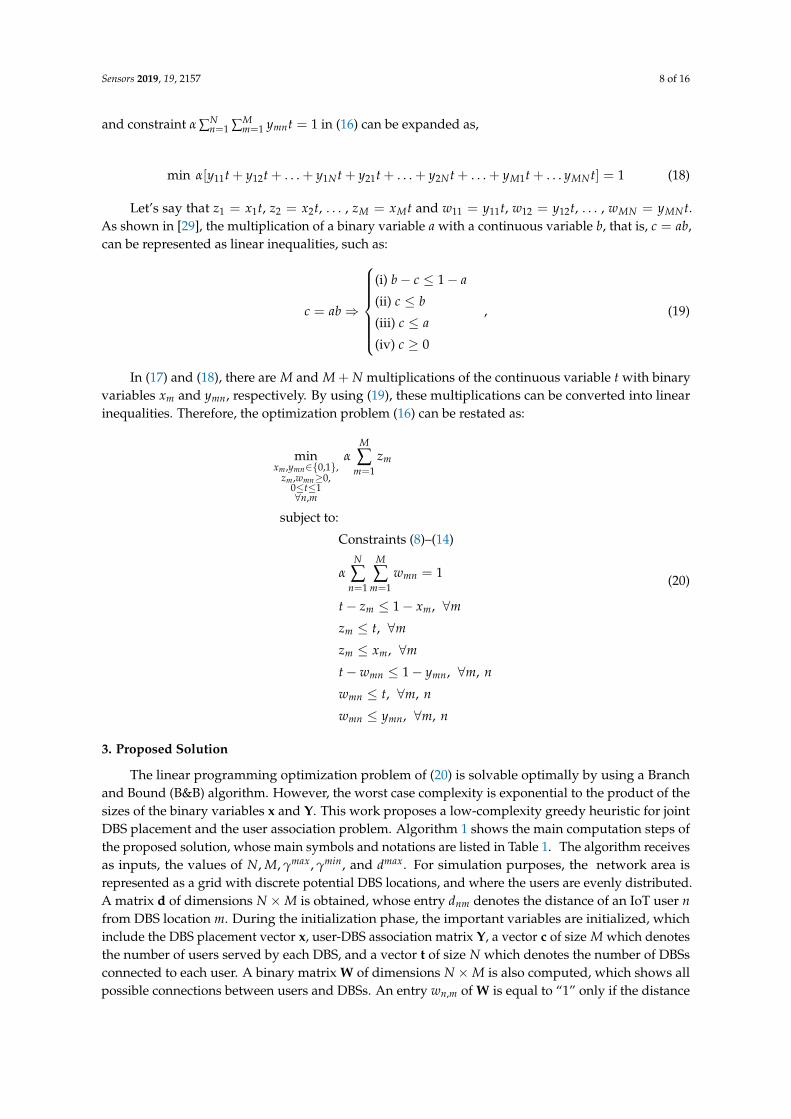
The objective function in (16) can be expanded as,
min α[x1t + x2t + . . . + xMt] (17)
Sensors 2019, 19, 2157 8 of 16
and constraint α ∑Nn=1 ∑M
m=1 ymnt = 1 in (16) can be expanded as,
min α[y11t + y12t + . . . + y1Nt + y21t + . . . + y2Nt + . . . + yM1t + . . . yMNt] = 1 (18)
Let’s say that z1 = x1t, z2 = x2t, . . . , zM = xMt and w11 = y11t, w12 = y12t, . . . , wMN = yMNt.As shown in [29], the multiplication of a binary variable a with a continuous variable b, that is, c = ab,can be represented as linear inequalities, such as:
c = ab⇒
(i) b− c ≤ 1− a
(ii) c ≤ b
(iii) c ≤ a
(iv) c ≥ 0
, (19)
In (17) and (18), there are M and M + N multiplications of the continuous variable t with binaryvariables xm and ymn, respectively. By using (19), these multiplications can be converted into linearinequalities. Therefore, the optimization problem (16) can be restated as:
minxm ,ymn∈{0,1},
zm ,wmn≥0,0≤t≤1∀n,m
αM
∑m=1
zm
subject to:
Constraints (8)–(14)
αN
∑n=1
M
∑m=1
wmn = 1
t− zm ≤ 1− xm, ∀m
zm ≤ t, ∀m
zm ≤ xm, ∀m
t− wmn ≤ 1− ymn, ∀m, n
wmn ≤ t, ∀m, n
wmn ≤ ymn, ∀m, n
(20)
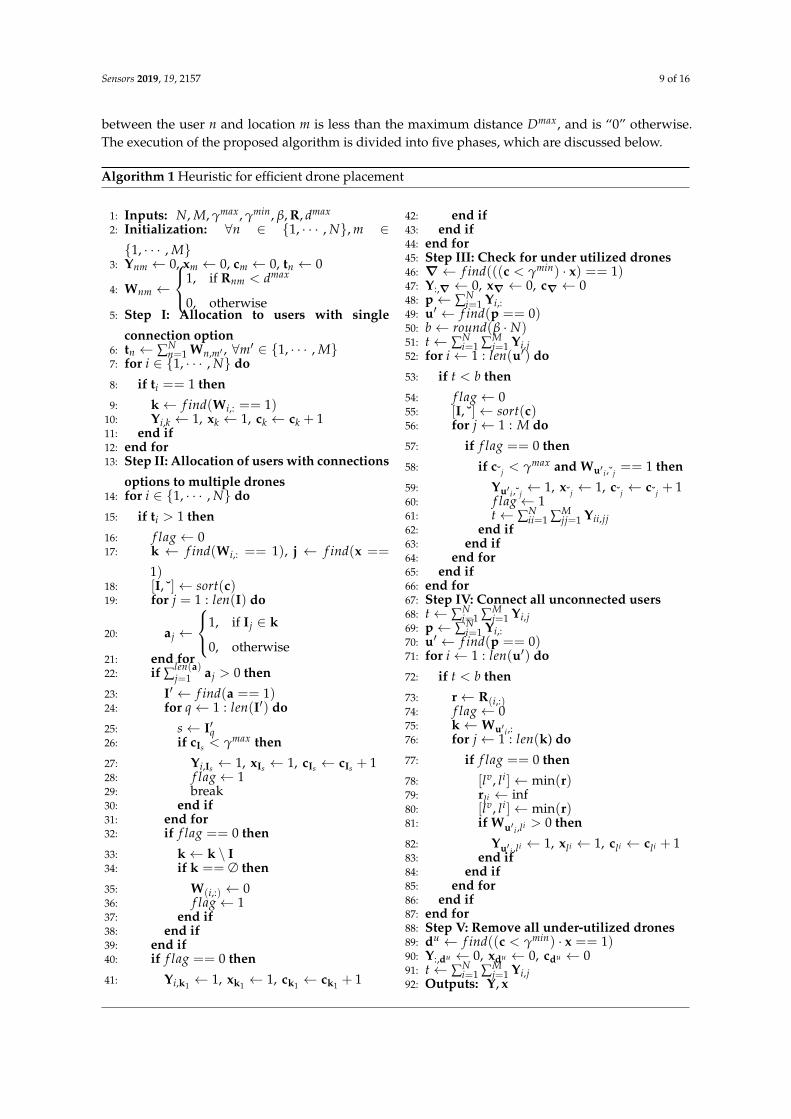
3. Proposed Solution
The linear programming optimization problem of (20) is solvable optimally by using a Branchand Bound (B&B) algorithm. However, the worst case complexity is exponential to the product of thesizes of the binary variables x and Y. This work proposes a low-complexity greedy heuristic for jointDBS placement and the user association problem. Algorithm 1 shows the main computation steps ofthe proposed solution, whose main symbols and notations are listed in Table 1. The algorithm receivesas inputs, the values of N, M, γmax, γmin, and dmax. For simulation purposes, the network area isrepresented as a grid with discrete potential DBS locations, and where the users are evenly distributed.A matrix d of dimensions N ×M is obtained, whose entry dnm denotes the distance of an IoT user nfrom DBS location m. During the initialization phase, the important variables are initialized, whichinclude the DBS placement vector x, user-DBS association matrix Y, a vector c of size M which denotesthe number of users served by each DBS, and a vector t of size N which denotes the number of DBSsconnected to each user. A binary matrix W of dimensions N ×M is also computed, which shows allpossible connections between users and DBSs. An entry wn,m of W is equal to “1” only if the distance
Sensors 2019, 19, 2157 9 of 16
between the user n and location m is less than the maximum distance Dmax, and is “0” otherwise.The execution of the proposed algorithm is divided into five phases, which are discussed below.
Algorithm 1 Heuristic for efficient drone placement
1: Inputs: N, M, γmax, γmin, β, R, dmax
2: Initialization: ∀n ∈ {1, · · · , N}, m ∈{1, · · · , M}
3: Ynm ← 0, xm ← 0, cm ← 0, tn ← 0
4: Wnm ←
1, if Rnm < dmax
0, otherwise5: Step I: Allocation to users with single
connection option6: tn ← ∑N
n=1 Wn,m′ , ∀m′ ∈ {1, · · · , M}7: for i ∈ {1, · · · , N} do
8: if ti == 1 then
9: k← f ind(Wi,: == 1)10: Yi,k ← 1, xk ← 1, ck ← ck + 111: end if12: end for13: Step II: Allocation of users with connections
options to multiple drones14: for i ∈ {1, · · · , N} do
15: if ti > 1 then
16: f lag← 017: k ← f ind(Wi,: == 1), j ← f ind(x ==
1)18: [I, ˘]← sort(c)19: for j = 1 : len(I) do
20: aj ←
1, if Ij ∈ k
0, otherwise21: end for22: if ∑
len(a)j=1 aj > 0 then
23: I′ ← f ind(a == 1)24: for q← 1 : len(I′) do
25: s← I′q26: if cIs < γmax then
27: Yi,Is ← 1, xIs ← 1, cIs ← cIs + 128: f lag← 129: break30: end if31: end for32: if f lag == 0 then
33: k← k \ I34: if k == ∅ then
35: W(i,:) ← 036: f lag← 137: end if38: end if39: end if40: if f lag == 0 then
41: Yi,k1 ← 1, xk1 ← 1, ck1 ← ck1 + 1
42: end if43: end if44: end for45: Step III: Check for under utilized drones46: ∇← f ind(((c < γmin) · x) == 1)47: Y:,∇ ← 0, x∇ ← 0, c∇ ← 048: p← ∑N
i=1 Yi,:49: u′ ← f ind(p == 0)50: b← round(β · N)51: t← ∑N
i=1 ∑Mj=1 Yi,j
52: for i← 1 : len(u′) do
53: if t < b then
54: f lag← 055: [I, ˘]← sort(c)56: for j← 1 : M do
57: if f lag == 0 then
58: if c˘j < γmax and Wu′ i ,˘j== 1 then
59: Yu′ i ,˘j← 1, x˘j ← 1, c˘j ← c˘j + 1
60: f lag← 161: t← ∑N
ii=1 ∑Mjj=1 Yii,jj
62: end if63: end if64: end for65: end if66: end for67: Step IV: Connect all unconnected users68: t← ∑N
i=1 ∑Mj=1 Yi,j
69: p← ∑Ni=1 Yi,:
70: u′ ← f ind(p == 0)71: for i← 1 : len(u′) do
72: if t < b then
73: r← R(i,:)74: f lag← 075: k← Wu′ i ,:76: for j← 1 : len(k) do
77: if f lag == 0 then
78: [lv, li]← min(r)79: rli ← inf80: [lv, li]← min(r)81: if Wu′ i ,li > 0 then
82: Yu′ i ,li ← 1, xli ← 1, cli ← cli + 183: end if84: end if85: end for86: end if87: end for88: Step V: Remove all under-utilized drones89: du ← f ind((c < γmin) · x == 1)90: Y:,du ← 0, xdu ← 0, cdu ← 091: t← ∑N
i=1 ∑Mj=1 Yi,j
92: Outputs: Y, x
Sensors 2019, 19, 2157 10 of 16
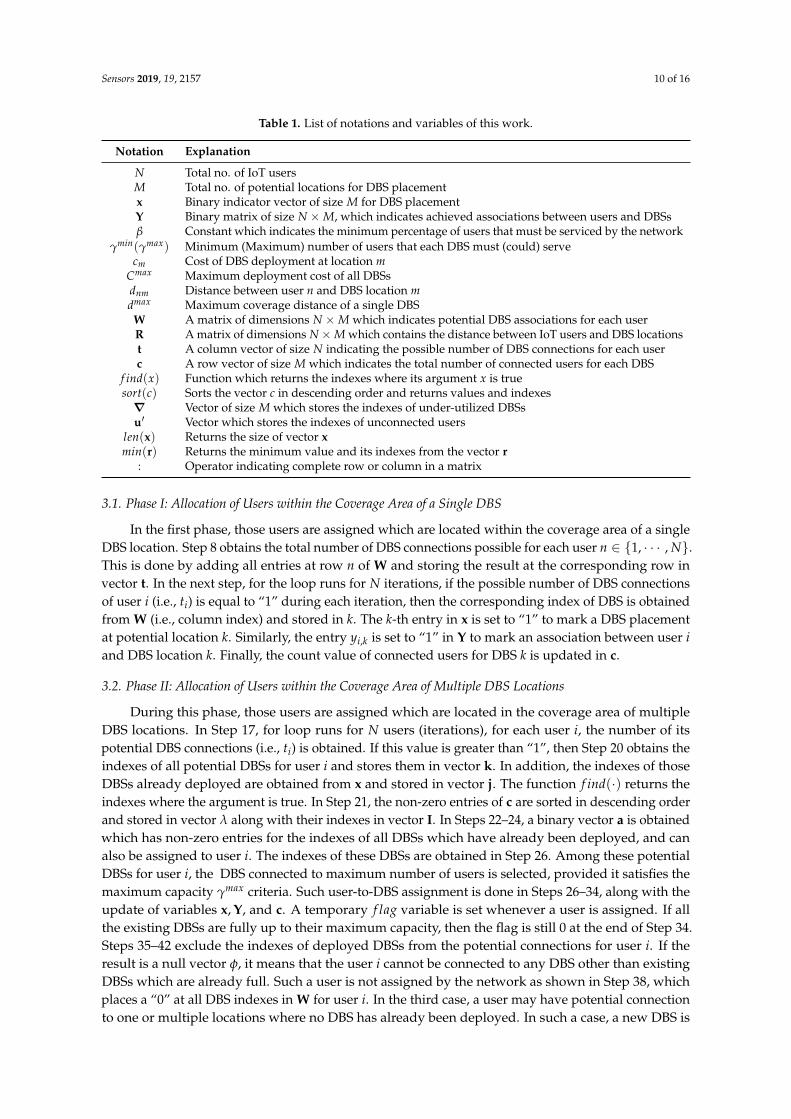
Table 1. List of notations and variables of this work.
Notation Explanation
N Total no. of IoT usersM Total no. of potential locations for DBS placementx Binary indicator vector of size M for DBS placementY Binary matrix of size N ×M, which indicates achieved associations between users and DBSsβ Constant which indicates the minimum percentage of users that must be serviced by the network
γmin(γmax) Minimum (Maximum) number of users that each DBS must (could) servecm Cost of DBS deployment at location m
Cmax Maximum deployment cost of all DBSsdnm Distance between user n and DBS location mdmax Maximum coverage distance of a single DBSW A matrix of dimensions N ×M which indicates potential DBS associations for each userR A matrix of dimensions N×M which contains the distance between IoT users and DBS locationst A column vector of size N indicating the possible number of DBS connections for each userc A row vector of size M which indicates the total number of connected users for each DBS
f ind(x) Function which returns the indexes where its argument x is truesort(c) Sorts the vector c in descending order and returns values and indexes∇ Vector of size M which stores the indexes of under-utilized DBSsu′ Vector which stores the indexes of unconnected users
len(x) Returns the size of vector xmin(r) Returns the minimum value and its indexes from the vector r
: Operator indicating complete row or column in a matrix
3.1. Phase I: Allocation of Users within the Coverage Area of a Single DBS
In the first phase, those users are assigned which are located within the coverage area of a singleDBS location. Step 8 obtains the total number of DBS connections possible for each user n ∈ {1, · · · , N}.This is done by adding all entries at row n of W and storing the result at the corresponding row invector t. In the next step, for the loop runs for N iterations, if the possible number of DBS connectionsof user i (i.e., ti) is equal to “1” during each iteration, then the corresponding index of DBS is obtainedfrom W (i.e., column index) and stored in k. The k-th entry in x is set to “1” to mark a DBS placementat potential location k. Similarly, the entry yi,k is set to “1” in Y to mark an association between user iand DBS location k. Finally, the count value of connected users for DBS k is updated in c.
3.2. Phase II: Allocation of Users within the Coverage Area of Multiple DBS Locations
During this phase, those users are assigned which are located in the coverage area of multipleDBS locations. In Step 17, for loop runs for N users (iterations), for each user i, the number of itspotential DBS connections (i.e., ti) is obtained. If this value is greater than “1”, then Step 20 obtains theindexes of all potential DBSs for user i and stores them in vector k. In addition, the indexes of thoseDBSs already deployed are obtained from x and stored in vector j. The function f ind(·) returns theindexes where the argument is true. In Step 21, the non-zero entries of c are sorted in descending orderand stored in vector λ along with their indexes in vector I. In Steps 22–24, a binary vector a is obtainedwhich has non-zero entries for the indexes of all DBSs which have already been deployed, and canalso be assigned to user i. The indexes of these DBSs are obtained in Step 26. Among these potentialDBSs for user i, the DBS connected to maximum number of users is selected, provided it satisfies themaximum capacity γmax criteria. Such user-to-DBS assignment is done in Steps 26–34, along with theupdate of variables x, Y, and c. A temporary f lag variable is set whenever a user is assigned. If allthe existing DBSs are fully up to their maximum capacity, then the flag is still 0 at the end of Step 34.Steps 35–42 exclude the indexes of deployed DBSs from the potential connections for user i. If theresult is a null vector φ, it means that the user i cannot be connected to any DBS other than existingDBSs which are already full. Such a user is not assigned by the network as shown in Step 38, whichplaces a “0” at all DBS indexes in W for user i. In the third case, a user may have potential connectionto one or multiple locations where no DBS has already been deployed. In such a case, a new DBS is

Sensors 2019, 19, 2157 11 of 16
placed at the location with the smallest available index, and user i is associated to it. This is done inSteps 43–47 by updating the corresponding entries of x, Y, and c.
3.3. Phase III: Check for Under-Utilized Drones
In Step 50, the indexes are stored in∇ for all DBSs that remain under-utilized after the associationsteps of phase I and II. These DBSs are removed in Step 51 by disassociating their connected usersand setting the relevant entries of Y, x, and c to “0”. In Steps 52–53, the indexes of unconnected usersare obtained and stored in vector u′. Step 54 computes b, that is, the minimum number of users thatmust be serviced, whereas Step 55 computes t, that is, the number of users that have been servicedso far. If the number of served users is less than the minimum users to be served, it is executed untilboth these numbers become equal. During each iteration of the loop, that is, in Steps 56–70, one ofthe unconnected users is selected from the list u′ and assigned to an existing DBS with the highestutilization, with the condition that the DBS is not overcrowded and belongs to the set of DBSs thathave potential connections for the user. The user-DBS association is marked by updating the relevantentries of Y, x, and c.
3.4. Step IV: Association of All Unconnected Users until Now
In this phase, the users which remain unconnected in the previous phases are associated to theDBSs. Their indexes are obtained in u′ in Step 75. The for loop of Steps 76–92 performs user-DBSassociation on the basis of distance. For each user i ∈ u′, its distances from all the DBS locations areobtained from matrix R and stored in r in Step 78. In Step 79, the list of potential DBS connections forthe users is obtained and stored in k. In Steps 82–86, among all potential DBSs for the user, the DBSwith the minimum distance is selected. The user association to this DBS is marked in Step 87 byupdating the relevant matrices.
3.5. Step V: Remove All Under-Utilized Drones
Finally, the under-utilized drones are removed by disassociating the users connected to them,and the total number of connected users is computed. The outputs of the algorithm are the user-DBSassociation matrix Y and the DBS placement vector x.
3.6. Complexity
The main advantage of the proposed method is its low computational complexity, where thecomplexity is calculated in terms of flops. The complexity of the initialization phase (Steps 2–4)is 5MN. The complexity of Steps 6–12 is 2MN + 4N. The worst case complexity of Steps 14–44is M2N + 11MN + 13N, and Steps 46–66 have a worst case complexity equal to 2M2 + M2N + 9M,where Steps 68–87 have a complexity 6MN + 9N and Steps 89–91 have a complexity equal to 5M+ MNflops. The worst case complexity of the proposed heuristic overall is 0(M2N), whereas the complexityof the optimal algorithm is 2NM2
. This clearly demonstrates that the proposed solution is fairlyapplicable for practical, large-area IoT networks.
4. Results and Discussion
This section presents the simulation results of proposed solution. As discussed earlier, the networkarea is visualized as a grid with discrete points which represent the potential DBS locations, and theusers are evenly distributed on the grid. The simulations are carried out for a variety of realisticnetwork scenarios with grid sizes of 3× 3, 4× 4, and 5× 5 DBS locations, with the total number ofusers N ranging from 50 up to 200 and β = 0.2 and 0.8. The optimization goal is to minimize theutility function of (15), which is represented as a ratio between the number of deployed DBSs and thenumber of connected users. The performance of the proposed heuristic is compared with the optimalalgorithm. As discussed earlier, β is the minimum fraction of users that must be serviced. This means
Sensors 2019, 19, 2157 12 of 16
that for a larger β, more drones need to apparently be deployed. Similarly, if the grid size is smaller,it would be difficult to service a larger β percentage of users. These facts have been proven through anumber of simulations, and the results are discussed below.
Before going into the simulation analysis, let’s try to analyze the objective function. The objectivefunction is the ratio of the total number of deployed drones to the total number of connected users.The objective is to minimize this ratio. From the basic mathematical theory, it can be easily observedthat this ratio (objective function) could be minimized if:
• The numerator is decreased, keeping the denominator fixed;• The denominator is increased, keeping the numerator fixed;• The numerator is decreased, and at the same time, the denominator is increased.
In this objective function, the numerator represents the total number of deployed drones, whereasthe denominator represents the total number of connected users. Therefore, from the analysis above,either a smaller number of drones have to be deployed, keeping a fixed number of connected users,or more users need to be connected with a smaller number of drones. The third option is to decreasethe number of drones, and increase the number of connected users at the same time.
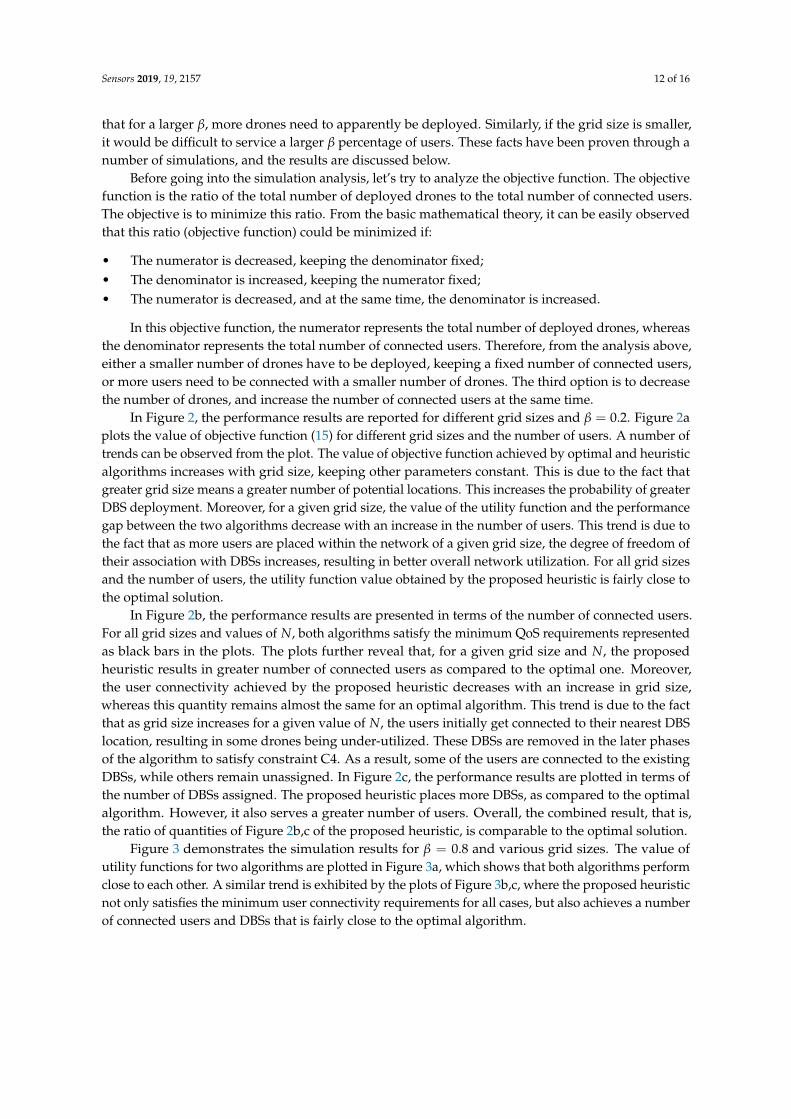
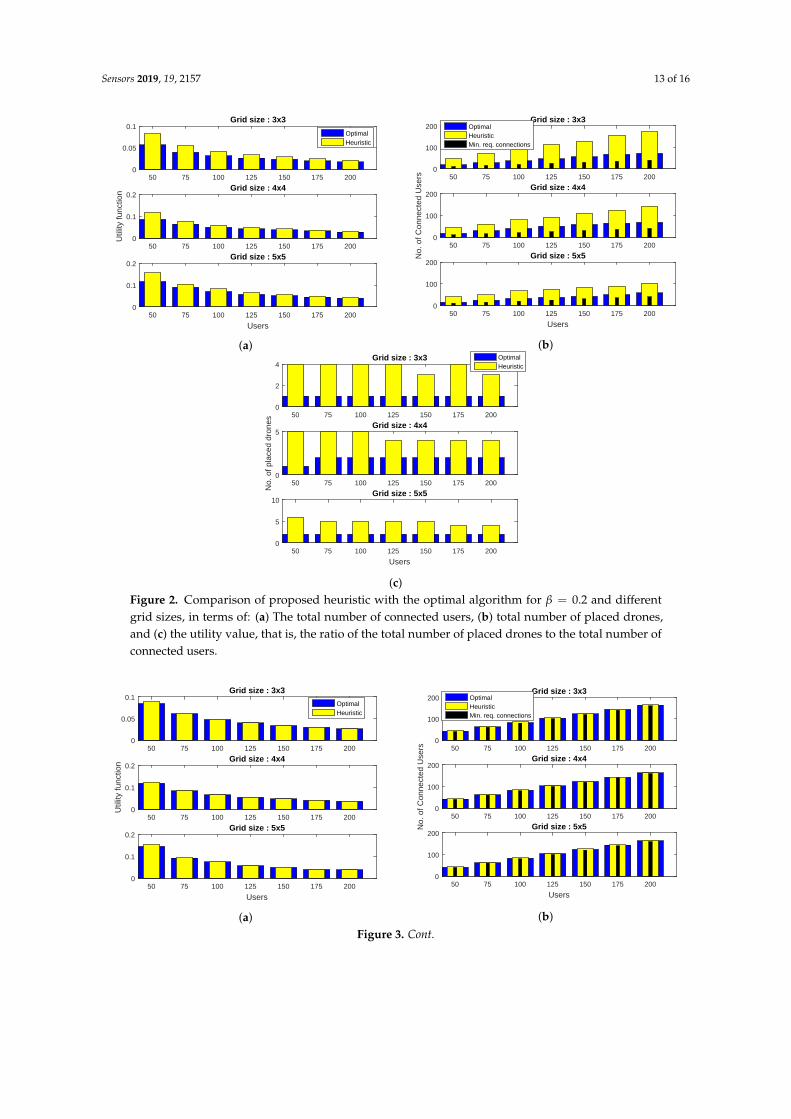
In Figure 2, the performance results are reported for different grid sizes and β = 0.2. Figure 2aplots the value of objective function (15) for different grid sizes and the number of users. A number oftrends can be observed from the plot. The value of objective function achieved by optimal and heuristicalgorithms increases with grid size, keeping other parameters constant. This is due to the fact thatgreater grid size means a greater number of potential locations. This increases the probability of greaterDBS deployment. Moreover, for a given grid size, the value of the utility function and the performancegap between the two algorithms decrease with an increase in the number of users. This trend is due tothe fact that as more users are placed within the network of a given grid size, the degree of freedom oftheir association with DBSs increases, resulting in better overall network utilization. For all grid sizesand the number of users, the utility function value obtained by the proposed heuristic is fairly close tothe optimal solution.
In Figure 2b, the performance results are presented in terms of the number of connected users.For all grid sizes and values of N, both algorithms satisfy the minimum QoS requirements representedas black bars in the plots. The plots further reveal that, for a given grid size and N, the proposedheuristic results in greater number of connected users as compared to the optimal one. Moreover,the user connectivity achieved by the proposed heuristic decreases with an increase in grid size,whereas this quantity remains almost the same for an optimal algorithm. This trend is due to the factthat as grid size increases for a given value of N, the users initially get connected to their nearest DBSlocation, resulting in some drones being under-utilized. These DBSs are removed in the later phasesof the algorithm to satisfy constraint C4. As a result, some of the users are connected to the existingDBSs, while others remain unassigned. In Figure 2c, the performance results are plotted in terms ofthe number of DBSs assigned. The proposed heuristic places more DBSs, as compared to the optimalalgorithm. However, it also serves a greater number of users. Overall, the combined result, that is,the ratio of quantities of Figure 2b,c of the proposed heuristic, is comparable to the optimal solution.
Figure 3 demonstrates the simulation results for β = 0.8 and various grid sizes. The value ofutility functions for two algorithms are plotted in Figure 3a, which shows that both algorithms performclose to each other. A similar trend is exhibited by the plots of Figure 3b,c, where the proposed heuristicnot only satisfies the minimum user connectivity requirements for all cases, but also achieves a numberof connected users and DBSs that is fairly close to the optimal algorithm.
Sensors 2019, 19, 2157 13 of 16
50 75 100 125 150 175 2000
0.05
0.1Grid size : 3x3
OptimalHeuristic
50 75 100 125 150 175 200
Util
ity fu
nctio
n
0
0.1
0.2Grid size : 4x4
Users50 75 100 125 150 175 200
0
0.1
0.2Grid size : 5x5
(a)
50 75 100 125 150 175 2000
100
200Grid size : 3x3
OptimalHeuristicMin. req. connections
50 75 100 125 150 175 200
No.
of C
onne
cted
Use
rs
0
100
200Grid size : 4x4
Users50 75 100 125 150 175 200
0
100
200Grid size : 5x5
(b)
50 75 100 125 150 175 2000
2
4Grid size : 3x3 Optimal
Heuristic
50 75 100 125 150 175 200
No.
of p
lace
d dr
ones
0
5Grid size : 4x4
Users50 75 100 125 150 175 200
0
5
10Grid size : 5x5
(c)Figure 2. Comparison of proposed heuristic with the optimal algorithm for β = 0.2 and differentgrid sizes, in terms of: (a) The total number of connected users, (b) total number of placed drones,and (c) the utility value, that is, the ratio of the total number of placed drones to the total number ofconnected users.
50 75 100 125 150 175 2000
0.05
0.1Grid size : 3x3
OptimalHeuristic
50 75 100 125 150 175 200
Util
ity fu
nctio
n
0
0.1
0.2Grid size : 4x4
Users50 75 100 125 150 175 200
0
0.1
0.2Grid size : 5x5
(a)
50 75 100 125 150 175 2000
100
200Grid size : 3x3
OptimalHeuristicMin. req. connections
50 75 100 125 150 175 200
No.
of C
onne
cted
Use
rs
0
100
200Grid size : 4x4
Users50 75 100 125 150 175 200
0
100
200Grid size : 5x5
(b)Figure 3. Cont.
Sensors 2019, 19, 2157 14 of 16
50 75 100 125 150 175 2000
2
4Grid size : 3x3
OptimalHeuristic
50 75 100 125 150 175 200
No.
of p
lace
d dr
ones
0
5
10Grid size : 4x4
Users50 75 100 125 150 175 200
0
5
10Grid size : 5x5
(c)Figure 3. Comparison of proposed heuristic with the optimal algorithm for β = 0.8 and differentgrid sizes in terms of: (a) The total number of connected users, (b) total number of placed drones,and (c) the utility value, that is, the ratio of the total number of placed drones to the total number ofconnected users.
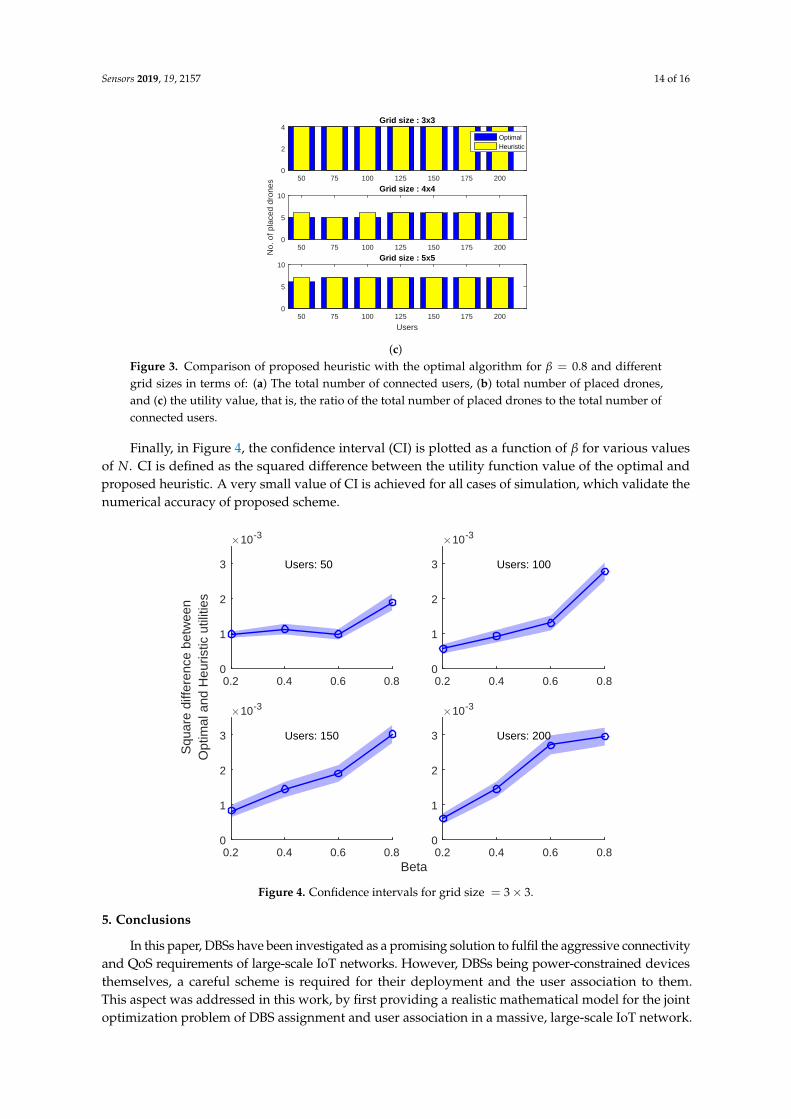
Finally, in Figure 4, the confidence interval (CI) is plotted as a function of β for various valuesof N. CI is defined as the squared difference between the utility function value of the optimal andproposed heuristic. A very small value of CI is achieved for all cases of simulation, which validate thenumerical accuracy of proposed scheme.
0.2 0.4 0.6 0.8
#10-3
0
1
2
3 Users: 50
0.2 0.4 0.6 0.8
#10-3
0
1
2
3 Users: 100
Beta0.2 0.4 0.6 0.8
Squ
are
diffe
renc
e be
twee
nO
ptim
al a
nd H
euris
tic u
tiliti
es
#10-3
0
1
2
3 Users: 150
0.2 0.4 0.6 0.8
#10-3
0
1
2
3 Users: 200
Figure 4. Confidence intervals for grid size = 3× 3.
5. Conclusions
In this paper, DBSs have been investigated as a promising solution to fulfil the aggressive connectivityand QoS requirements of large-scale IoT networks. However, DBSs being power-constrained devicesthemselves, a careful scheme is required for their deployment and the user association to them.This aspect was addressed in this work, by first providing a realistic mathematical model for the jointoptimization problem of DBS assignment and user association in a massive, large-scale IoT network.

Sensors 2019, 19, 2157 15 of 16
The mathematical model was developed by keeping in mind an air-to-ground path-loss model andpractical network constraints. The objective function minimizes the ratio between the number of DBSsutilized to the number of users connected. Such an integer fractional problem suffers from prohibitivecomplexity when solved optimally for practical-sized networks. A linearization of the problem wasproposed, along with a low-complexity heuristic algorithm for its solution in linear time. A comparisonof the results of the proposed solution with the optimal one confirmed the accuracy and validity ofour approach.
Author Contributions: Conceptualization, A.A. and M.A. (Muhammad Awais); Investigation, M.A.(Muhammad Awais); Methodology, A.A. and T.A.; Software, A.A., M.A. (Muhammad Awais) and T.A.; Validation,M.A. (Musaed Alhussein) and K.A.; Writing—original draft, A.A. and M.A. (Muhammad Awais); Writing—review& editing, T.A., Selman Kulac, M.A. (Musaed Alhussein) and K.A.
Acknowledgments: The authors extend their appreciation to the Deanship of Scientific Research at King SaudUniversity for funding this work through research group NO. (RG-1438-034).
Conflicts of Interest: The authors declare no conflict of interest.
References
1. Lagum, F.; Bor-Yaliniz, I.; Yanikomeroglu, H. Strategic Densification with UAV-BSs in Cellular Networks.IEEE Wirel. Commun. Lett. 2018, 7, 384–387. [CrossRef]
2. Yin, S.; Tan, J.; Li, L. UAV-assisted Cooperative Communications with Wireless Information and PowerTransfer. arXiv 2017, arXiv:1710.00174.
3. Al-Hourani, A.; Kandeepan, S.; Lardner, S. Optimal LAP Altitude for Maximum Coverage. IEEE Wirel.Commun. Lett. 2014, 3, 569–572. [CrossRef]
4. Pereira, A.A.; Espada, J.P.; Crespo, R.G.; Aguilar, S.R. Platform for controlling and getting data fromnetwork connected drones in indoor environments. Future Gener. Comput. Syst. 2019, 92, 656–662.[CrossRef]
5. Sharma, S.; Chen, K.; Sheth, A. Toward practical privacy-preserving analytics for IoT and cloud-basedhealthcare systems. IEEE Internet Comput. 2018, 22, 42–51. [CrossRef]
6. Woo, M.W.; Lee, J.; Park, K. A reliable IoT system for Personal Healthcare Devices. Future Gener.Comput. Syst. 2018, 78, 626–640. [CrossRef]
7. Ahmad, A.; Ahmad, S.; Rehmani, M.H.; Hassan, N.U. A Survey on Radio Resource Allocation in CognitiveRadio Sensor Networks. IEEE Commun. Surv. Tutor. 2015, 17, 888–917. [CrossRef]
8. Yan, Y.; Xu, C. A Development Analysis of China’s Intelligent Transportation System. In Proceedings ofthe 2013 IEEE International Conference on Green Computing and Communications and IEEE Internet ofThings and IEEE Cyber, Physical and Social Computing, Beijing, China, 20–23 August 2013; pp. 1072–1076.
9. Sanchez-Gomez, J.; Sanchez-Iborra, R.; Skarmeta, A. Transmission Technologies Comparison forIoT Communications in Smart-Cities. In Proceedings of the GLOBECOM 2017—2017 IEEE GlobalCommunications Conference, Singapore, 4–8 December 2017; pp. 1–6.
10. Fu, J.; Liu, Y.; Chao, H.; Bhargava, B.K.; Zhang, Z. Secure Data Storage and Searching for Industrial IoTby Integrating Fog Computing and Cloud Computing. IEEE Trans. Ind. Inform. 2018, 14, 4519–4528.[CrossRef]
11. Alzenad, M.; El-Keyi, A.; Lagum, F.; Yanikomeroglu, H. 3-D Placement of an Unmanned Aerial VehicleBase Station (UAV-BS) for Energy-Efficient Maximal Coverage. IEEE Wirel. Commun. Lett. 2017, 6, 434–437.[CrossRef]
12. Kalantari, E.; Shakir, M.Z.; Yanikomeroglu, H.; Yongacoglu, A. Backhaul-aware robust 3D droneplacement in 5G+ wireless networks. In Proceedings of the 2017 IEEE International Conference onIEEE Communications Workshops (ICC Workshops), Paris, France, 21–25 May 2017; pp. 109–114.
13. Shakhatreh, H.; Khreishah, A.; Alsarhan, A.; Khalil, I.; Sawalmeh, A.; Othman, N.S. Efficient 3D placementof a UAV using particle swarm optimization. In Proceedings of the 2017 8th International Conference onInformation and Communication Systems (ICICS), Irbid, Jordan, 4–6 April 2017; pp. 258–263.

Sensors 2019, 19, 2157 16 of 16
14. Bor-Yaliniz, R.I.; El-Keyi, A.; Yanikomeroglu, H. Efficient 3-D placement of an aerial base station in nextgeneration cellular networks. In Proceedings of the 2016 IEEE International Conference on Communications(ICC), Kuala Lumpur, Malaysia, 22–27 May 2016; pp. 1–5.
15. Lu, J.; Wan, S.; Chen, X.; Fan, P. Energy-Efficient 3D UAV-BS Placement versus Mobile Users’ Densityand Circuit Power. In Proceedings of the 2017 IEEE Globecom Workshops (GC Wkshps), Singapore,4–8 December 2017; pp. 1–6.
16. Kalantari, E.; Yanikomeroglu, H.; Yongacoglu, A. On the Number and 3D Placement of Drone Base Stationsin Wireless Cellular Networks. In Proceedings of the 2016 IEEE 84th Vehicular Technology Conference(VTC-Fall), Montreal, QC, Canada, 18–21 September 2016; pp. 1–6.
17. Lyu., J.; Zeng, Y.; Zhang, R.; Lim, T.J. Placement Optimization of UAV-Mounted Mobile Base Stations.IEEE Commun. Lett. 2017, 21, 604–607. [CrossRef]
18. Alzenad, M.; El-Keyi, A.; Yanikomeroglu, H. 3-D placement of an unmanned aerial vehicle base station formaximum coverage of users with different QoS requirements. IEEE Wirel. Commun. Lett. 2018, 7, 38–41.[CrossRef]
19. Azizi, A.; Mokari, N.; Javan, M.R. Joint Radio Resource Allocation, 3D Placement and User Association ofAerial Base Stations in IoT Networks. arXiv 2017, arXiv:1710.05315.
20. Wang, H.; Wang, J.; Ding, G.; Wang, L.; Tsiftsis, T.A.; Sharma, P.K. Resource allocation for energy harvesting-powered D2D communication underlaying UAV-assisted networks. IEEE Trans. Green Commun. Netw. 2018,2, 14–24. [CrossRef]
21. Mignardi, S.; Buratti, C.; Bazzi, A.; Verdone, R. Trajectories and Resource Management of Flying BaseStations for C-V2X. Sensors 2019, 19, 811. [CrossRef] [PubMed]
22. Huo, Y.; Dong, X.; Lu, T.; Xu, W.; Yuen, M. Distributed and multi-layer UAV network for the next-generationwireless communication. arXiv 2018, arXiv:1805.01534.
23. Chen, W.; Liu, B.; Huang, H.; Guo, S.; Zheng, Z. When UAV Swarm Meets Edge-Cloud Computing:The QoS Perspective. IEEE Netw. 2019, 33, 36–43. [CrossRef]
24. Lai, C.C.; Chen, C.T.; Wang, L.C. On-Demand Density-Aware UAV Base Station 3D Placement forArbitrarily Distributed Users with Guaranteed Data Rates. IEEE Wirel. Commun. Lett. 2019. [CrossRef]
25. Liu, X.; Wang, J.; Zhao, N.; Chen, Y.; Zhang, S.; Ding, Z.; Yu, F.R. Placement and Power Allocation forNOMA-UAV Networks. IEEE Wirel. Commun. Lett. 2019. [CrossRef]
26. Sharma, V.; Song, F.; You, I.; Atiquzzaman, M. Energy efficient device discovery for reliable communicationin 5G-based IoT and BSNs using unmanned aerial vehicles. J. Netw. Comput. Appl. 2017, 97, 79–95.[CrossRef]
27. Motlagh, N.H.; Bagaa, M.; Taleb, T. UAV Selection for a UAV-Based Integrative IoT Platform.In Proceedings of the 2016 IEEE Global Communications Conference (GLOBECOM), Washington, DC,USA, 4–8 December 2016; pp. 1–6.
28. Al-Hourani, A.; Kandeepan, S.; Jamalipour, A. Modeling air-to-ground path loss for low altitude platformsin urban environments. In Proceedings of the 2014 IEEE Global Communications Conference, Austin, TX,USA, 8–12 December 2014; pp. 2898–2904.
29. Li, H.L. A global approach for general 0–1 fractional programming. Eur. J. Oper. Res. 1994, 73, 590–596.[CrossRef]
© 2019 by the authors. Licensee MDPI, Basel, Switzerland. This article is an open accessarticle distributed under the terms and conditions of the Creative Commons Attribution(CC BY) license (http://creativecommons.org/licenses/by/4.0/).