joint multi-cluster needs assessment (jmcna)
TRANSCRIPT

REACHInformingmore effectivehumanitarian action
SOMALIA
November 2019
Joint Multi-Cluster Needs Assessment (JMCNA)Round III
1
Somalia Joint Multi-Cluster Needs Assessment, November 2019
Assessment conducted in the framework of: Somalia Assessment Working Group Somalia Information Management Working Group
Funded by:
With the support of:
Data collection partners: Action Contre la Faim (ACF), American Refugee Committee (ARC), Concern Worldwide (CWW), Danish Refugee Council (DRC), HIMILO Foundation (HIMFO), International Organisation for Migration (IOM), Islamic Relief, MCA Network, Mercy Corps, Norwegian Church Aid (NCA), Norwegian Refugee Council (NRC), Oxfam, Polish Humanitarian Action (PAH), Skills Active Forward (SAF-UK), Save the Children (SCI), Somali Community Concern (SCC), Shabelle Community Development Organisation (SHACDO), Secours Islamique France (SIF), Somali Aid, SOS Children’s Village International, United Nations High Commissioner for Refugees (UNHCR), Women and Child Care Organisation (WOCCA), World Vision, and Wamo Relief, Rehabilitation Services (WRRS), and the Somali Ministry of Humanitarian Affairs and Disaster Management.

2
Somalia Joint Multi-Cluster Needs Assessment, November 2019
Enumerator and respondent, during JMCNA data collection, © REACH
About REACH REACH facilitates the development of information tools and products that enhance the capacity of aid actors to make evidence-based decisions in emergency, recovery and development contexts. The methodologies used by REACH include primary data collection and in-depth analysis, and all activities are conducted through inter-agency aid coordination mechanisms. REACH is a joint initiative of IMPACT Initiatives, ACTED and the United Nations Institute for Training and Research - Operational Satellite Applications Programme (UNITAR-UNOSAT). For more information please visit our website: www.reach-initiative.org. You can contact us directly at: [email protected] and follow us on Twitter @REACH_info.

3
Somalia Joint Multi-Cluster Needs Assessment, November 2019
SUMMARY Somalia has been experiencing a multi-layered, complex, and protracted crisis over the past three decades; insecurity and conflict continue to exacerbate the effects of periodic natural shocks, such as droughts and flooding. The compound nature of the crisis influences displacement patterns and constrains the availability of resources, while the presence of armed groups severely impedes the level of access of humanitarian actors. The intensity and magnitude of the intractable crisis continue to necessitate short- and long-term humanitarian and development-oriented interventions that are informed by evidence. Consequently, the Office of Coordination for Humanitarian Affairs (OCHA), the Somalia Assessment Working Group (AWG), the Inter Cluster Coordination Group (ICCG), and the Information Management Working Group (IMWG), conducted the third Joint Multi-Cluster Needs Assessment (JMCNA) in Somalia with support from REACH. The JMCNA aims to facilitate a harmonised response plan at the operationally relevant district level; it relies on the coordinated efforts of partners to encourage joint planning, data collection, analysis and interpretation of results. The ultimate goal of the assessment is to inform partners at the strategic level and the Humanitarian Needs Overview (HNO) and Humanitarian Response Plan (HRP) process. Primary data was collected by means of a household-level survey designed with the participation of the humanitarian clusters in Somalia. Cluster leads outlined information gaps and the type of data required to inform their strategic plans. Key indicators were developed by REACH with the substantive input of participating partners, and subsequently validated by clusters. REACH drafted the household survey through an iterative consultation process with cluster partners and OCHA. It is aligned, as much as possible, with the draft Joint Inter-Sectoral Analysis Framework (JIAF) which serves as a common and structured method for assessing the severity of needs across different clusters. The JMCNA covered 17 of 18 regions, 53 of 74 districts, and 943 settlements; data was collected from a total of 10,487 households. Households were sampled at the district level using stratified cluster sampling with probability proportional to population size, with households living in Internally Displaced Person (IDP) settlements and households living in non-IDP settlements as strata, a 90% confidence interval, a 10% margin of error, and a buffer of 15%. Data was collected between 23 June and 31 July 2019. The main limitations of the methodology remain the inability to access certain areas due to high levels of insecurity, or the ability to access only urban centres in certain districts, which lend an urban-bias towards the results and limit the generalisation of results only to urban areas of districts. The draft JIAF was employed to understand the context and severity of needs in Somalia. Through a desk review, secondary data on drought, displacement, and conflict was used to contextualise the protracted crisis, and interpret findings from the household-level survey. The main drivers of the recurring crises include underdeveloped government and structural institutions, social fractures along clan lines, and limited infrastructure and development. Additionally, economic and environmental instability due to drought, flooding, and displacement, perpetrate the cycles of armed conflict. The aforementioned aspects compound one another as both drivers and effects of the crisis. Additionally, access to humanitarian services is severely hindered by security concerns in the central and southern areas of the country. The multi-sectoral severity of needs in Somalia was assessed through the creation of a composite score, namely, the Multi Sectoral Needs Index (MSNI). The MSNI was based on the draft JIAF, and adapted to fit the Somali context. The MSNI includes 4 categories of severity, ranging from none or minimal needs (severity score 1) to extreme (severity score 4). The MSNI score for each household was captured by means of a decision-tree approach (Annex 10) and is an estimate of the severity of household needs based on their levels of pre-existing vulnerabilities, living standard gaps (LSGs) in each sector, and their reliance on negative coping strategies or capacity gaps (CG).

4
Somalia Joint Multi-Cluster Needs Assessment, November 2019
Key findings At the national level, a total of 13% of households were found to have a MSNI score of at least 3, representing severe or extreme humanitarian needs. Around three-quarters (76%) of households were found to be characterised by a MSNI score of 2, indicating that a large proportion of households across the country live in ‘stressed’ conditions and struggle to maintain basic living standards. In line with expectations, households living in IDP settlements (27%) were significantly more likely to have a severe MSNI score relative to households in non-IDP settlements (11%), indicating an asymmetric distribution in the level of multi-sectoral needs between the two population groups.1 Of all households with a MSNI score of at least 3, 77% had their needs driven primarily by severe LSG in Food Security and Livelihoods (FSL), and/or Water, Sanitation and Hygiene (WASH) LSGs, while 12% had their needs primarily driven by severe capacity gap scores. Across the board, needs in FSL and WASH – and to a lesser extent, reliance on negative coping mechanisms – tend to be the primary drivers of high MSNI severity scores. Notwithstanding the severity of multi-cluster needs, the JMCNA data also indicates that a high proportion of both households in IDP settlements and non-IDP settlements have sectoral LSG in nutrition, and shelter and non-food items. At the national level, the primary drivers of high MSNI scores were found to be mostly the same for IDP and non-IDP settlement households, with MSNI scores of at least 3 for households in IDP settlements more likely to be driven by WASH LSGs. However, results at the regional- and district-level indicate that the multi-cluster needs of households in IDP and non-IDP settlements are driven by different factors, and consequentially, the humanitarian response must be tailored to directly address the specific needs of both population groups. The geographic areas with the highest proportions of households with MSNI scores of 3 or above, were found to be concentrated in the southern, central and south-western areas of Somalia. The areas with the highest proportion of all households in MSNI severity categories 3 and 4 include the regions of Bakool (43%), Gedo (31%), Hiraan (31%), Bay (27%), Lower Juba (26%), and Lower Shabelle (17%). The highlighted regions correlate to areas which have been particularly affected by conflict, flooding, and drought, and where access for humanitarian actors remains restricted. Households residing in IDP settlements, as well as displaced households residing in non-IDP settlements, face particular difficulties, as evidenced by the most commonly reported factors influencing displacement decisions. Conflict- and protection-related factors remain the most commonly reported concerns, a trend supported by data from previous rounds of the JMCNA. Of particular importance is the relatively high proportion of households reporting income-generating opportunities and healthcare as important reasons for their decision to re-locate to their current settlement. The JMCNA also included questions focusing on a households’ perception on the evolution of their needs. In line with the main drivers of severe MSNI scores, food security and livelihood-related questions showed the lowest positive responses levels, followed by questions regarding access to shelters. The lowest confidence was found for households’ perception of their ability to access savings or financial support (76%) and their ability to service household debt (42%). Accountability to affected populations was measured through survey questions, as well as an interactive radio programme which was aired through Africa Voices Foundation. Seventy-six percent (76%) of all households reported not having enough information as a barrier to accessing aid. Physical access to humanitarian aid distributions was also a concern reported by households living in IDP and non-IDP settlement (28% and 22%, respectively). In summary, there are many contextual drivers of humanitarian need in Somalia, including conflict, drought and floods, widespread displacement, and general lack of infrastructure. Their impact on food security and livelihoods, and WASH, has left 13% of households in Somalia with severe or extreme humanitarian needs and no sustainable strategies to cope with these gaps. The data from the JMCNA was used to inform the Humanitarian Needs Overview and Humanitarian Response Plan through the calculation of people in need of humanitarian support.
1 P-value: <.01***

5
Somalia Joint Multi-Cluster Needs Assessment, November 2019
CONTENTS
SUMMARY ................................................................................................................................................. 3 List of Acronyms ............................................................................................................................................... 7 Geographical Classifications ............................................................................................................................. 8 List of Figures, Tables and Maps ...................................................................................................................... 8
INTRODUCTION .......................................................................................................................................... 9
METHODOLOGY ........................................................................................................................................11 Research questions ........................................................................................................................................ 11 Secondary data review ................................................................................................................................... 11 Coverage and scope ....................................................................................................................................... 11 Sampling ......................................................................................................................................................... 12 Data collection ................................................................................................................................................ 13 Data protection and data cleaning .................................................................................................................. 15 Analytical framework ....................................................................................................................................... 15 Dissemination of findings ................................................................................................................................ 17 Limitations ....................................................................................................................................................... 17
FINDINGS .................................................................................................................................................19 Event/shock .................................................................................................................................................... 19
Underlying factors ..................................................................................................................................... 19 Drivers ....................................................................................................................................................... 21 Household demographics and pre-existing vulnerabilities ........................................................................ 23 Primary and secondary effects of the crisis ............................................................................................... 27 Displacement trends .................................................................................................................................. 31
Current needs ................................................................................................................................................. 35 Overview of the Multi-Sector Needs Index ................................................................................................ 35 MSNI across regions ................................................................................................................................. 35 MSNI across population groups by region................................................................................................. 36 Areas with the highest severity scores ...................................................................................................... 37 Primary drivers of high MSNI severity scores ............................................................................................ 38 Primary drivers of high MSNI severity scores by region ............................................................................ 40 Drivers of high MSNI severity scores by population group and area ......................................................... 40 Co-occurring needs ................................................................................................................................... 42 Cluster-specific needs ............................................................................................................................... 42 Cross-cluster needs .................................................................................................................................. 43
Forecasted Needs ........................................................................................................................................... 44 Accountability to affected populations ............................................................................................................. 45
CONCLUSION ...........................................................................................................................................47 BIBLIOGRAPHY .........................................................................................................................................48 ANNEXES .................................................................................................................................................50
Annex 1: Links to documentation and data ..................................................................................................... 50 Annex 2: Assessed settlements ...................................................................................................................... 52 Annex 3: List of districts by type of sampling method ..................................................................................... 71 Annex 4: Margins of error and generalizability of results ................................................................................ 73
Margins of error (MoE) for regions calculated at a confidence level of 90% ............................................. 73 Margin of error (MoE) for districts calculated at a confidence level of 90% ............................................... 74 Representativeness of results by district and population group ................................................................ 74
Annex 5: Survey questions and response options for primary data collected ................................................. 77 Annex 6: Field officer and enumerator training ............................................................................................... 96 Annex 7: Enumerator competency test ..........................................................................................................107 Annex 8: Data cleaning SOP .........................................................................................................................109 Annex 9: JIAF ................................................................................................................................................120
Overview of the JIAF Model .....................................................................................................................120

6
Somalia Joint Multi-Cluster Needs Assessment, November 2019
Objectives of using the JIAF model for the JMCNA .................................................................................121 Method of operationalization ....................................................................................................................122
Annex 10: Estimating the MSNI .....................................................................................................................123 Rationale underlying the calculation of the MSNI .....................................................................................123 Calculation procedure to estimate the MSNI ............................................................................................124
Annex 11: Criteria for severity classes ...........................................................................................................125 Annex 12: Scoring of indicators .....................................................................................................................126 Annex 13: Most reported primary and secondary factors influencing displacement decisions ......................146
Most reported primary and secondary factors for leaving previous settlement ........................................146 Most reported primary and secondary factors for arriving at current settlement ......................................147 Most reported primary and secondary factors for leaving previous settlement, by district .......................148 Most reported primary and secondary factors for arriving at current settlement, by district .....................149
Annex 14: How to read a sun-burst diagram..................................................................................................151 Annex 15: Primary drivers of MSNI severity scores of at least 3 by population group and by region ............152

7
Somalia Joint Multi-Cluster Needs Assessment, November 2019
List of Acronyms ACF Action Contre la Faim ACLED Armed Conflict Location and Event Data Project ARC American Refugee Committee AWG Assessment Working Group CCCM Camp Coordination and Camp Management CWW Concern Worldwide DRC Danish Refugee Council EU European Union FEWS-NET Famine Early Warning Systems Network FGS Federal Government of Somalia FSL Food Security and Livelihoods FSNAU Food Security and Nutrition Analysis Unit GIS Geographic Information System GTS Ground Truth Solutions HIMFO HIMILO Foundation HNO Humanitarian Needs Overview HRP Humanitarian Response Plan ICCG Inter Cluster Coordination Group IDP Internally Displaced Person IOM International Organisation for Migration IPC Integrated Phase Classification IMWG Information Management Working Group JIAF Joint Inter-Sectoral Analysis Framework JIAG Joint Inter-Sector Analysis Working Group JMCNA Joint Multi-Cluster Needs Assessment MSNI Multi-Sector Needs Index NCA Norwegian Church Aid NFI Non-Food Items NGO Non-Governmental Organisation NRC Norwegian Refugee Council OCHA Office of Coordination for Humanitarian Affairs PAH Polish Humanitarian Action SAF-UK Skills Active Forward SCC Somali Community Concern SCI Save the Children SHACDO Shabelle Community Development Organisation SIF Secours Islamique France SMS Short Message Service SWALIM Somalia Water and Land Information Management SOP Standard Operating Procedure UN United Nations UNDP United Nations Development Programme UNFPA United Nations Population Fund UNHCR United Nations High Commissioner for Refugees WASH Water, Sanitation, and Hygiene WBG World Bank Group WOCCA Women and Child Care Organisation WRRS Wamo Relief and Rehabilitation Services

8
Somalia Joint Multi-Cluster Needs Assessment, November 2019
Geographical Classifications
Federal Member State Highest form of governance below the national level Region Sub-division of Federal States District Sub-division of Regions Settlement Group of 15 or more households in one location
List of Figures, Tables and Maps Table 1: Proportion of households by pre-existing vulnerability severity score ..................................................... 25 Table 2: Proportion of households by impact severity score ................................................................................. 28 Table 3: Proportion of households by MSNI severity score ................................................................................... 35 Table 4: Proportion of households with a MSNI severity score of at least 3 .......................................................... 36 Table 5: Proportion of households with a MSNI severity score of 4 ...................................................................... 37 Table 6: Severity of co-occurring needs ................................................................................................................ 42 Table 7: Proportion of responses, by type, for select AAP indicators .................................................................... 45 Figure 1: Demographic profile ............................................................................................................................... 23 Figure 2: Top 5 primary reasons for leaving area of origin .................................................................................... 32 Figure 3: Top 5 secondary reasons for leaving area of origin................................................................................ 32 Figure 4: Top 5 primary reasons for arriving to current location ............................................................................ 32 Figure 5: Top 5 secondary reasons for arriving to current location ........................................................................ 32 Figure 6: Primary drivers of MSNI score of at least 3 for all households ............................................................... 39 Figure 7: Primary drivers of MSNI score of at least 3 for households in non-IDP settlements .............................. 39 Figure 8: Primary drivers of MSNI score of at least 3 for households in IDP settlements...................................... 39 Figure 9: Proportion of households with sectoral LSG severity scores of at least 3, by population group ............. 42 Figure 10: Most common combinations of clusters in which households were found to have LSG severity scores of at least 3 ............................................................................................................................................................ 43 Figure 11: Most commonly reported concerns in accessing humanitarian aid in the 3 months prior to data collection................................................................................................................................................................ 46 Map 1: Assessed households in IDP and non-IDP settlements ............................................................................ 12 Map 2: Proportion of households in non-IDP settlements with a pre-existing vulnerability severity score of 3 or higher .................................................................................................................................................................... 27 Map 3: Proportion of households in IDP settlements with a pre-existing vulnerability severity score of 3 or higher .............................................................................................................................................................................. 27 Map 4: Proportion of households in non-IDP settlements with an impact severity score of 3 or higher ................ 31 Map 5: Proportion of households in IDP settlements with an impact severity score of 3 or higher ........................ 31 Map 6: Most reported reason for leaving previous location by district ................................................................... 34 Map 7: Second most reported reason for leaving previous location by district ...................................................... 34 Map 8: Most reported reason for arriving in current location by district ................................................................. 34 Map 9: Second most reported reason for arriving in current location by district .................................................... 34 Map 10: Proportion of households in non-IDP settlements with a MSNI severity score of 3 or higher by district .. 38 Map 11: Proportion of households in IDP settlements with a MSNI severity score of 3 or higher by district ......... 38
9
Somalia Joint Multi-Cluster Needs Assessment, November 2019
INTRODUCTION
Somalia continues to experience a multifaceted, complex, and protracted crisis; natural shocks, armed conflict, and high levels of displacement play a potent role in the country’s development. The economy and livelihoods of the population are heavily dependent on adequate rainfall as well as access to functional markets for crops and livestock. An estimated 23% of the population reside in rural areas, while approximately 26% of the population is comprised of nomadic groups.2 Moreover, 85% of the population is reliant on agro-pastoral activities as a source of livelihood.3 Thus, fluctuations in seasonal rainfall, desertification, and poor agricultural and pastoral land-use practices such as deforestation and over-grazing, further expose the population to climatic shocks and diminish the productivity of pastoral land and agricultural outputs, which together underpin the productivity of the Somali economy. While the country received above-average rainfall during the 2018 Gu rain season (April-June), which interrupted four successive seasons of below-average rainfall,4 the heavy rains also resulted in flooding, severely disrupting livelihoods and influencing displacement patterns.5 However, the 2018 Deyr rains (October-December) remained below average levels, while the delayed and insufficient Gu rains in 2019 further exacerbated drought conditions.6,7 Although the 2019 Gu rains did recover towards the end of the season, they remained largely insufficient and erratic in their intensity and distribution, leading to lower than average levels of the Juba and Shabelle rivers, the lowest levels of cereal production since 2011, increased household debt, food insecurity, and displacement.8,9 Moreover, large swathes of the country remain under the influence of armed groups. The pervasiveness of insecurity drives displacement patterns and hinders the delivery of humanitarian aid to vulnerable communities. Widespread insecurity, especially in the central, southern, and western areas of the country, has led to damage to critical infrastructure and limited the availability of basic services. The recent waves of displacement have resulted in rapid urbanisation and an increased strain on access to basic goods, services, and infrastructure in urban centres. There are currently an estimated 2.6 million internally displaced persons (IDPs) in Somalia,10 with approximately 1.6 million people being displaced since November 2016 alone,11 and a further quarter million newly displaced people between January and July 2019.12 The effects of recurring climate-driven shocks, high levels of insecurity and violence, and large-scale displacements interact with and compound each other, consequently increasing household vulnerability, eroding resilience, and rapidly changing the humanitarian and development landscape. The intensity and magnitude of the intractable crisis continues to necessitate short- and long-term humanitarian and development-oriented interventions that are informed by evidence. Consequently, the Office of Coordination for Humanitarian Affairs (OCHA), the Somalia Assessment Working Group (AWG), the Inter Cluster Coordination Group (ICCG), and the Information Management Working Group (IMWG), conducted the third Joint Multi-Cluster Needs Assessment (JMCNA) in Somalia with support from REACH. The JMCNA is a nationally-representative household-level assessment that seeks to provide a snapshot of the humanitarian needs of the population, serve as a reliable source of data, reduce existing information gaps, inform strategic planning, and the prioritisation of humanitarian responses. The assessment was conducted at the operationally-relevant district-level and relied on the concerted and coordinated efforts of partners to support joint planning, data collection, analysis, and interpretation of results. The ultimate goal of the assessment is to inform
2 United Nations Population Fund (UNFPA). “Population Estimation Survey 2014 for the 18 Pre-War Regions of Somalia”. October 2014. p.22. 3 European Union (EU), Federal Government of Somalia (FGS), United Nations (UN), World Bank Group (WBG). “Somalia Drought Impact and Needs Assessment – Volume I”. April 2018. p.56 4 Ibid., p.10 5 Famine Early Warning Systems Network (FEWS-NET), Food Security Nutrition and Analysis Unit – Somalia (FSNAU). “Somalia Food Security Alert: Heavy Gu rainfall leads to widespread flooding”. 11 May 2018. p.1-2 6 Office of the Coordination of Humanitarian Affairs (OCHA). “Dry conditions worsen as Gu’ rains delayed”. 14 April 2019. p.1 7 OCHA. “Failed Gu’ rains push Somalia into severe drought”. 09 May 2019. p.1 8 FEWS-NET, FSNAU. “Somalia 2019 Post-Gu FSNAU FEWS-NET Technical Release”. 02 September 2019. p.1 9 OCHA. “Somalia Humanitarian Bulletin 1 – 31 August 2019”. August 2019. p.1 10 OCHA. “2019 Somalia Humanitarian Needs Overview”. November 2018. p.4 11 OCHA. “Somalia Humanitarian Bulletin 5 – 31 July 2018”. July 2018. p.1 12 OCHA. August 2019. Op. cit., p.2

10
Somalia Joint Multi-Cluster Needs Assessment, November 2019
partners at the strategic level and to contribute data and evidence to the Humanitarian Needs Overview (HNO) and Humanitarian Response Plan (HRP) processes in Somalia. The report first describes the data collection process and the methodology used to analyse results. The report subsequently presents a comprehensive review of the results in four sub-sections. The first sub-section provides further contextual information and outlines the consequences of the shock, the primary and secondary effects, the main drivers and underlying trends which continue to shape the crisis, and their impact on households with pre-existing vulnerabilities. The second sub-section is dedicated to interpreting the severity of current needs in an inter-sectoral manner, focusing on the intensity and magnitude of needs across sectors, affected population groups, and their spatial distribution. The penultimate sub-section briefly forecasts the potential evolution of needs, while the final sub-section presents the main findings on the humanitarian community’s accountability to the affected population. The conclusion summarises the main findings and recommendations.

11
Somalia Joint Multi-Cluster Needs Assessment, November 2019
METHODOLOGY
Research questions The JMCNA seeks to inform the HNO and HRP in the context of the ongoing drought and displacement crisis in Somalia by providing an updated, nation-wide, district-level, multi-sectoral analysis of the severity of current and forecasted needs across crisis-affected populations. Specifically, the JMCNA is guided by the following research questions:
What are the main household needs and priorities (sectoral and multi-sectoral) in Somalia?
What proportion of households have moderate and severe needs within and across sectors?
What do their survival, emergency, and livelihood problems consist of?
What is the level of household access to basic services? Are any groups excluded from accessing basic services?
Which population groups are the most vulnerable? Which are the main factors exacerbating or mitigating their needs?
What protection concerns currently affect population groups in Somalia? How do they intersect with other needs?
How do the answers to the aforementioned questions vary according to district and region, and displaced and non-displaced population groups?
How are needs expected to evolve in the future based on ongoing or planned responses and likely events (for example, displacement trends and intentions, climatic factors, reported loss of assets and outputs, and winterisation)?
Secondary data review The JMCNA brought together a variety of secondary data sources for a desk review, including existing United Nations (UN) and Non-Governmental Organisation (NGO) reports and assessments, academic articles, security updates, and cluster flash updates, amongst others. The secondary data review provides the contextual background upon which the results of the JMCNA are framed, as well as a source for area-level data such as the severity of drought, and number of incidents of conflict. Secondary data was also used to draw the sample frames for the sample strata, and to inform the selection of concepts, indicators, and severity thresholds. Finally, the desk review served to develop hypotheses for the relevant research questions, which were subsequently tested using primary data collected through a household survey, representative at the district-level.
Coverage and scope The JMCNA is a statistically representative assessment. Data was collected in a total of 17 of 18 regions, 53 of 74 districts, and 943 settlements. The populations of interest include households living in settlements for displaced persons (IDP sites) and settlements for non-displaced households (non-IDP sites). Data was collected on displaced households in formal and informal sites, as well as non-displaced households in both urban and rural areas. Respondents were asked a series of questions on household demographics, displacement trends, pre-existing vulnerabilities, the impact of the crisis, living standards, and coping mechanisms. Household needs were assessed for living standard gaps (LSGs) in education, nutrition, health, water, sanitation, and hygiene (WASH), food security and livelihoods (FSL), shelter and non-food items (NFI), and protection, as well as their reliance on negative coping strategies when faced with a lack of access to resources or services. The JMCNA also collected data on a household’s perception of the evolution of their needs, as well as the accountability of humanitarian actors to affected populations.

12
Somalia Joint Multi-Cluster Needs Assessment, November 2019
Map 1: Assessed households in IDP and non-IDP settlements
Sampling A stratified cluster sampling approach was used to ensure representativeness of the population groups and districts. Samples were drawn from two distinct sample frames for displaced and non-displaced settlements on the assumption that enumerators are predominantly likely to encounter displaced households living in IDP settlements, and to encounter non-displaced households in non-IDP settlements. Districts were included as an additional stratum when drawing the samples for both households living in displaced and non-displaced settlements, ensuring representativeness at the district level. Samples were drawn with a confidence level of 90% and a margin of error of 10% for each population group at the district level. The minimum cluster size was set at 6 households. A buffer of 15% was added to the minimum sample size to counter any possibility of data loss due to poor data quality or due to certain settlements becoming inaccessible during data collection. Stratified cluster sampling was used as it optimises efficiency and coverage while maintaining representativeness of the types of settlements and therefore, displaced and non-displaced population groups. In certain districts with large urban centres, simple two-stage random sampling was used whenever it proved to be more feasible and efficient.13
13 Additional modifications were also introduced for the sampling procedure in Banadir due to the fact that Banadir hosts the largest proportion of displaced households and is characterised by a mix of protracted and newly arrived displaced households. 11 of the 17 districts in Banadir were sampled specifically for households that have been displaced for extended periods of time; thus, results for 11 of the 17 districts in Banadir are not directly comparable to other districts nationwide as they are inhabited mostly by protracted displaced households, and are thus informative for a specific sub-group of the displaced population only. Results for the districts of Hodan, Dharkenley, Kahda, and Daynile, which host the majority of the displaced population in Banadir, remain

13
Somalia Joint Multi-Cluster Needs Assessment, November 2019
A total of 10,783 households were assessed; however, 296 interviews were discarded after data cleaning due to poor data quality, resulting in a final sample of 10,487 households, of which 2,891 households identified themselves as internally displaced and 7,275 as non-displaced. Of the 10,487 households, 4,396 households were living in IDP settlements, while 6,091 households were living in non-IDP settlements. 116 refugee and 205 returnee households were also encountered by the enumerators; however, since the sample was not stratified for refugee and returnee groups, results are not representative for these population groups. Data was collected at the household level by means of a structured questionnaire. The household was used as the unit of measurement as it is the most relevant for examining the severity of needs and vulnerabilities, improves the coverage of the assessment, and optimises the trade-offs between the quality of information collected and the required sample sizes to ensure representative and generalizable results. District-level results were subsequently weighted and aggregated at the regional and national levels in order to explore broader trends and dynamics. Prior to constructing the sample frame, the REACH Security Manager and REACH Field Officers used their networks to verify whether any regions or districts were inaccessible due to security concerns. Any area with a high risk of insecurity was removed from the list of potential settlements. The sample frame for households living in non-IDP settlement was constructed using the WorldPop population data for Somalia and cross-referenced with the OCHA pre-war settlement list.14 The sample frame for households in IDP settlements was constructed using the master list of sites for internally displaced persons from the Camp Coordination and Camp Management (CCCM) cluster and the REACH Detailed Site Assessments.15 Refer to Annex 2 for a complete list of assessed settlements and to Annex 3 for a list of districts by type of sampling method. Refer to Annex 4 for an overview of the margins of error at the regional and district levels, both of which are calculated at a confidence level of 90%, as well as a summary of the level of generalisability of results at the district level. Households were chosen at the settlement level by means of a systematic random sampling approach which aimed to minimise the influence of human decision-making and to maximise randomness. Each team of enumerators first met at the centre of the target settlement and used a random number generator application, with the minimum number set to 0 and the maximum number to 360, to generate a first random number which was used as a compass heading. Each enumerator then generated a second random number ranging from a minimum of 0 and a maximum of 1,000 which was used as an indication of distance measured in feet. Enumerators walked in the direction of their compass heading for the specified distance dictated by the two randomly generated numbers to find their individual starting points. From the starting point, each enumerator generated a third random number ranging from a minimum of 0 and a maximum of 360 which was once again used as a compass heading. Enumerators walked from their starting point in the exact direction indicated by compass up to the periphery of the settlement. On their way to the periphery, enumerators counted and noted the number of households passed on both sides of their path. Enumerators then calculated the skip-interval based on the number of households encountered on route divided by the target number of households to be interviewed per enumerator. The first household to be interviewed for the survey was selected by using a random number generated with the minimum number fixed as 1 and the maximum number fixed as the total number of houses counted along the route taken by the enumerator. The second household to be interviewed was encountered after skipping the number of households as indicated by the skip-interval. The questionnaire was administered to either the head of the household or any member of the household above the age of 18 able to speak on behalf of the household. In cases where the respondent was between the ages of 15 and 17, enumerators tried to ensure that an adult guardian was present during the interview.
Data collection Primary data was collected by means of a household-level survey designed with the participation of the humanitarian clusters in Somalia. Cluster Coordinators and Information Management Officers outlined existing information gaps and the type of data required to inform strategic planning. Key indicators were developed by REACH with the substantive input, and validation of, partners and clusters. REACH subsequently drafted the survey tool through an iterative and consultative process with cluster partners and OCHA, and was aligned, as far as
directly comparable to other districts nationwide. The sampling procedure for non-displaced households remains the same across all 15 districts assessed in Banadir. Two districts in Banadir were excluded due to high levels of insecurity. 14 WorldPop. “Somalia 100m Population, Version 2”. University of Southampton. 2017. 15 CCCM Cluster Somalia, REACH. “Detailed Site Assessment: IDP Site Master List”. 2019.

14
Somalia Joint Multi-Cluster Needs Assessment, November 2019
possible, with the draft Joint Inter-Sectoral Analysis Framework (JIAF) which provided a structured method for assessing the severity of needs. Secondary data on the impact of the crisis was also collected on indicators such as the severity of drought, prevalence of conflict, and integrated phase classification on food security and nutrition (IPC), amongst others. Particular attention was paid to the collection of sensitive information that could potentially result in harm to respondents or enumerators. Therefore, questions relating to clan affiliation, or other sensitive protection data, were excluded from the survey. Moreover, due to the lack of a sufficient number of female enumerators in each field team, the assessment did not collect anthropometric data such as middle-upper arm circumference (MUAC) screening of pregnant and/or lactating women. Refer to Annex 5 for the complete list of survey questions and response options. Data collection was conducted from the 23rd of June until the 31st of July. Eight REACH Field Officers attended a training session conducted by REACH Assessment Officers and the Senior Field Manager from the 10th to the 14th of June 2019. The Field Officers reviewed the list of settlements along with up to date information on the security situation; settlements or districts with high levels of insecurity were removed from the sample frame. The Field Officers also translated the tool from English to standard Somali, with each Field Officer in charge of translating different sections of the questionnaire. Subsequently, the Field Officers collectively checked and revised the translations of all sections of the questionnaire to ensure that the questions and terms used in the Somali version were unambiguous and understood in the same manner by everyone. Field Officers also provided useful feedback during the testing phase of the questionnaire by participating in an in-depth review of the survey, and by providing feedback on the formulation of questions, the use of constraints, the use of skip-logic between questions, and by contributing their contextual knowledge. The training provided to the Field Officers covered the following subject areas: familiarisation with the JMCNA assessment, defining, identifying, and approaching a household, seeking informed consent, interviewing skills, effective listening, establishing trust and building a positive rapport, understanding ethical and culturally-sensitive issues, and respecting the enumerator code of conduct.16 In particular, Field Officers were sensitised to the importance of obtaining informed consent and were trained to explain the objectives of the assessment to the respondents, explain how data would be used, managed, and protected, as well as potential associated risks such as the temporary storage of names, telephone numbers and GPS location data. Field Officers and enumerators were trained to request a respondent’s assent to each statement relating to the acquisition of informed consent. The training of the Field Officers also included a theoretical and practical field-based session on the importance of randomisation. Practicing randomisation techniques yielded useful feedback which was communicated to all team leaders and enumerators, especially those working in areas with relatively elevated levels of insecurity. The eight Field Officers subsequently held a series of training workshops in key districts in order to train team leaders and enumerators from the districts being assessed. In case REACH Field Officers could not conduct a training workshop in a particular district, team leaders were invited to workshops in selected districts and were tasked with subsequently conducting enumerator training in their respective districts. Where possible, REACH worked closely with partner organisations to coordinate data collection on the ground. Partner organisations contributed to the assessment by providing vehicles and enumerators in their areas of operation. As far as possible, enumerators with prior experience with REACH assessments were hired. All enumerators were administered a written test to ensure that they possess the required competencies to administer the household survey. Refer to Annex 6 for an overview of the training provided to Field Officers, team leaders, and enumerators, and to Annex 7 for the test administered to enumerators. Data was collected with the assistance of the 24 following partners: Action Contre la Faim (ACF), American Refugee Committee (ARC), Concern Worldwide (CWW), Danish Refugee Council (DRC), HIMILO Foundation (HIMFO), International Organisation for Migration (IOM), Islamic Relief, MCA Network, Mercy Corps, Norwegian Church Aid (NCA), Norwegian Refugee Council (NRC), Oxfam, Polish Humanitarian Action (PAH), Skills Active Forward (SAF-UK), Save the Children (SCI), Somali Community Concern (SCC), Shabelle Community Development Organisation (SHACDO), Secours Islamique France (SIF), Somali Aid, SOS Children’s Village International, United Nations High
16 The training provided to Field Officers and enumerators, including the enumerator code of conduct, underscores the importance of the humanitarian principles that underpin all assessments and activities conducted by REACH staff. The training placed special emphasis on the skills required to build a positive rapport during interviews, an awareness and sensitivity to cultural and gender-based issues, the prevention of possibly revisiting potential past trauma to the respondent, and the prevention of brokering relationships and sexual harassment. Refer to Annex 6 for an overview of the training provided to Field Officers, team leaders, and enumerators.
15
Somalia Joint Multi-Cluster Needs Assessment, November 2019
Commissioner for Refugees (UNHCR), Women and Child Care Organisation (WOCCA), World Vision, and Wamo Relief and Rehabilitation Services (WRRS). The JMCNA was conducted in close collaboration with OCHA, the IMWG and ICCG, and the Somali Ministry of Humanitarian Affairs and Disaster Management.
Data protection and data cleaning REACH Field Officers acted as the focal points for data collection, coordination, data cleaning, and reported regularly to the REACH Assessment Officers. Each day, data was uploaded from the smartphones used by the enumerators to the Kobo Collect server. The REACH Database Officer downloaded all datasets and removed all sensitive information which could be otherwise used to identify individuals or households, and disaggregated the data sets by district. Subsequently, REACH Geographic Information System (GIS) Specialist and Officers conducted spatial verification checks to verify that GPS points corresponded to the sample frame. The Database Officer returned the anonymized data by district to the REACH Field Officer in charge of that district only. Only the Database Officer had access to the raw data and retained the GPS coordinates and contact details of households and enumerators, which were used for telephoning respondents during the data checking process in case certain responses required clarification. All data that could be used to identify respondents or households were deleted immediately after data cleaning was concluded. REACH Field Officers conducted daily data checks following the data cleaning Standard Operating Procedure (SOP), noting any changes in the change-log before sending the cleaned data to the REACH Assessment Officers for verification. The Assessment Officers re-checked all data and took note of any recommendations or points for follow-up and provided feedback to the Field Officers, who transmitted the information to team leaders and enumerators during their daily briefings. In addition to the daily data checks, the final dataset for each district underwent a thorough cleaning guided by the data cleaning SOP. Finally, the data was weighted by population size in each district, during aggregation to the regional and national levels to prepare the final dataset for analysis and to avoid biasing the results during aggregation and comparison. Refer to Annex 8 for the data cleaning SOP followed by REACH Field Officers and Assessment Officers.
Analytical framework Data analysis was done following the draft JIAF model currently being developed by the Joint Inter-Sector Analysis Working Group (JIAG). The JIAF was adapted to the Somali context and severity thresholds were determined in collaboration with humanitarian clusters, and aligned with global cluster guidelines, wherever possible. The draft JIAF underscores the importance of analysing the context in which humanitarian actors plan and operate, the immediate drivers of the crisis, and the underlying factors that exacerbate or mitigate the impact of shocks on vulnerable population groups as a prerequisite to estimating multi-sectoral needs. The context outlines the humanitarian, socioeconomic and cultural, economic, and legal context within which the findings are framed. The event or shock is defined as a sudden or protracted event that disrupts the functioning of a community and causes human, material, or environmental loss. The findings pertaining to the event or shock help identify the causes and drivers of the crisis, including notably, its intensity and location, while the examination of underlying factors outlines the processes or conditions that influence the intensity of the shock, the exposure and vulnerability, and the resulting potential risks to crisis-affected population groups. The provisory theoretical model provided by the draft JIAF was operationalised to estimate the severity of needs. The overarching indicator measuring the severity of needs was built on two interacting pillars of humanitarian conditions that capture (1) living standard gaps (LSG), and (2) capacity gaps (CG) or the use of negative or unsustainable coping mechanisms.17 LSG measure the ability of a household to meet their basic needs in terms of quality, availability, access, and use; CG measure a household’s use of negative coping strategies to overcome gaps in their living standards and meet basic needs. The JMCNA relies on the draft JIAF to estimate the scale and severity of the crisis, understand the drivers of severity scores of the LSG and CG pillars, compare the intensity of
17 The draft JIAF model also includes a pillar on well-being and human rights violation which was not operationalised for the JMCNA. Well-being refers to the final outcome of low living standards and use of negative coping strategies on a household’s overall physical and mental health, and is measured by mortality, morbidity, malnutrition, human rights violations, and trauma; however, due to the difficulty in obtaining such area-level and sensitive data from a household survey, the JMCNA excluded operationalising the well-being pillar and instead relied on secondary sources to complement its findings. Thus, the 2019 JMCNA followed the draft JIAF as closely as possible with the exception of collecting data on well-being and human rights violations.

16
Somalia Joint Multi-Cluster Needs Assessment, November 2019
needs between population groups, across geographical areas, and sectors, and understand the potential evolution of the needs. Refer to Annex 9 for an overview of the draft JIAF, the objectives and approach to its use for the JMCNA. The two humanitarian condition pillars (LSG and CG), as well as the impact pillar (which measures the effects of the shock), were subsequently aggregated into a final composite multi-sector needs index (MSNI) which estimates the overall severity of a household’s needs.18 The MSNI is a composite measure, developed by REACH, which reflects the intensity and magnitude of the crisis; intensity is indicated by the severity of needs while magnitude is indicated by the proportion of households falling under each severity class of the MSNI. The final MSNI score may be viewed as a measure of the severity of needs within a household (based on its living standards gaps, capacity gaps and levels of impact), with higher severity signifying an increased risk of severe well-being concerns (e.g. mortality) within the household. The MSNI score for each household was estimated by means of a decision-tree approach. The underlying assumption of the decision-tree calculation is that a household’s living standards in food and water are typically the last to be eroded as they represent the most basic needs. However, a household may also approach a high MSNI score if it exhibits co-occurring needs in protection, shelter, or health, as degraded living standards in these sectors will also tend to contribute to a higher likelihood of severe needs within a household. This is a reasonable assumption for the Somali context where protection related risks abound. A high MSNI score may also be accorded if a household has a high CG score; the underlying assumption being that a household may maintain a certain standard of living precisely because they resort to using harmful or irreversible negative coping strategies. In order to overcome the substitution effect that is encountered in aggregating a composite index through linear additive models, the estimation of the MSNI used a combination of approaches. Each (sub-) indicator for the pre-existing vulnerabilities, impact, sector-specific LSG, and CG pillars was scored using a combination of a decision-tree, weighted scoring, and a sufficient condition approach. The decision-tree approach combines different indicators using logical AND, OR combinations while allowing for the use of relative weights. The sufficient condition approach accords a score to a household based on the importance of a particular indicator if it is deemed sufficient enough to categorise the household as being in need, irrespective of its score on other indicators. Different indicators, or combination of indicators, were re-scaled to correspond to a severity scale of 1-4, with 1 representing minimal needs, 2 representing stress, 3 representing severe needs and 4 representing extreme needs. The re-scaling of scores was accomplished by aggregating the maximum total score per indicator, or combination of indicators, for each pillar and dividing it by a constant factor to re-fit it to a scale ranging from 1 to 4. It should be noted that although the draft JIAF severity scale ranges from 1 to 5, with 5 representing a catastrophic level of needs such as heightened levels of mortality, grave human rights violations, and widespread morbidity, REACH is not in a position to classify a household at level 5 as such a declaration requires an analysis of data which is typically best collected at the area-level, with multiple independent sources of evidence, and joint verification. Therefore, while the two scales differ in their ranges, they are nevertheless comparable as any household MSNI score of 3 or 4 is indicative of a household with severe or extreme humanitarian needs. Cluster Coordinators, Information Management Officers, and NGO were engaged to outline information gaps, provide their feedback on, and validate the different steps in the estimation of the MSNI, based on their cluster-specific and contextual knowledge of the country and its regions. Refer to Annex 10 for an overview of the rationale underlying the different steps in estimating the MSNI. Refer to Annex 11 for an overview of the different criteria that characterise the various severity classes ranging from none or minimal needs (severity class 1) to extreme needs (severity class 4).19 Refer to Annex 12 for an overview of the decision-tree, weighted scoring, and sufficient condition approach for scoring each indicator and composite indicators.
18 It is important to note that the MSNI is an analytical approach proposed by REACH for the 2019 Multi-Sector Needs Assessments (MSNA), and does not refer to the inter-sectoral severity model part of the draft JIAF. The MSNI is an interim solution proposed by REACH for inter-sectoral analysis within the MSNA, until the officially endorsed model is available from the JIAG at the global level. 19 Although the draft JIAF severity scale ranges from 1 to 5, REACH is not in a position to classify a household at level 5, and thus the MSNI severity scale ranges from 1 to 4.

17
Somalia Joint Multi-Cluster Needs Assessment, November 2019
Dissemination of findings Following the analysis, preliminary findings were assembled into a presentation for joint workshops with clusters and operational partner organisations. At these workshops REACH presented the main findings and the results of group difference tests, with partners providing their interpretations of findings, based on their sectoral and contextual knowledge. REACH teams provided an overview of preliminary findings at workshops in Mogadishu, Hargeisa, Kismayo, Baidoa, Garowe, and Nairobi in early September. Results of the assessment, and in particular, findings related to the accountability towards affected populations were broadcast on several radio stations in collaboration with Africa Voices Foundation (AVF), a partner organisation specialised in interactive radio. Somali citizens were encouraged to listen to the radio show and were invited to submit their feedback via short message services (SMS). Together, AVF and REACH thus managed to capture the opinions of 8,251 individuals which helped triangulate the findings of the assessment.
Limitations The JMCNA encountered challenges related to the operational environment in Somalia that limited the scope and generalisability of the assessment. The data sources used to construct the sample frames were limited in their temporal scope and reliability. The sample frame used for non-displaced households was constructed using WorldPop population data for Somalia and the OCHA pre-war settlement list. The OCHA pre-war settlement list contains data ranging from 1997 to 2006, and is thus quite dated. Furthermore, while new settlements have been established, certain settlements have either changed names, do not exist anymore, or have moved location. Thus, the sample frame primarily relied on WorldPop data and was cross-referenced with the OCHA settlement list; however, as WorldPop data estimates population density it does not differentiate between displaced and non-displaced settlements, leading to a potential over-estimation of the size of non-displaced settlements. In order to mitigate the effects of this limitation and the need for constant re-sampling during data collection, REACH Field Officers, relying on their knowledge of their respective areas and the support of operating partners, scrutinized the sample frame and highlighted settlements that no longer existed or were inaccessible due to insecurity for removal from the sample frame. However, during data collection, re-sampling was nevertheless required due to the changing and fluid nature of the security situation; data was not collected from certain settlements either because households had moved, or when certain areas experienced sporadic incidents of conflict. Although the re-sampling conducted by REACH Assessment Officers maintained the minimum sample sizes required to ensure statistical representativeness, in certain districts the number of interviews conducted by enumerators fell slightly short of the minimum sample size. Therefore, results for these districts are presented as indicative only and not statistically representative.20 Additionally, the sample frames relied on lists of settlement types, rather than the self-reported IDP/non-IDP status of households. From the sample of 7,275 non-displaced households, enumerators encountered 1,615 households who identified themselves as being non-displaced but were residing in settlements or camps drawn from the sample frame for IDPs. From the sample of 2,891 IDP households, enumerators encountered 338 households who identified themselves as being displaced but were residing in sites drawn from the sample frame of settlements of non-displaced persons. The issue was compounded by households which were either located in between clearly defined settlements, or where both settlements of displaced and non-displaced households were located in very close proximity to each other. The analysis therefore presents results of comparisons of households by type of residential settlement, namely, sites for displaced and non-displaced persons, rather than by the self-reported status of the household. The underlying assumption is that households living within a particular settlement may have similar levels of needs, irrespective of their self-reported status. Thus, relatively poor non-displaced households may live in camps for displaced persons and may be dependent on humanitarian aid, while households that have been displaced for extended periods of time and living in settlements of non-displaced households may be better off than those living in formal or informal camps of displaced persons. Moreover, the sample frames did not account for nomadic groups, refugees and returnees. While enumerators did encounter refugee and returnee households, given the low number of households encountered, findings could not be analysed as representative or indicative. Given that the settlement lists used to build the sample frames are
20 Refer to Annex 4 for the list of districts with statistically representative or indicative data.

18
Somalia Joint Multi-Cluster Needs Assessment, November 2019
static in nature, they inherently do not account for nomadic groups, who constitute 26% of the total population,21 and who largely engage in pastoralist activities. Therefore, there is a potential of underestimating the cluster-specific and overall severity of needs of nomadic groups as they generally tend to have lower levels of access to services and are more exposed to the effects of shocks relative to other population groups by virtue of their non-sedentary lifestyle. The inaccessibility of certain districts remains a major limitation of the data collection process and assessments in Somalia, thereby generating a bias towards accessible areas and urban areas. Moreover, for certain districts only urban centres were accessible while rural areas were hard to reach due to elevated levels of insecurity and logistical reasons;22 thus, there is a skew towards urban centres for some districts in the central, southern, and western areas of the country, which may lead to a more positive estimate of household needs as urban centres also tend to be more accessible and served by humanitarian actors. These limitations imply that certain population groups of interest residing in hard to reach areas remain excluded from the assessment. In the absence of contrary evidence and the availability of limited indicative data,23 it may be reasonable to assume that households residing in districts with high levels of insecurity and risk of violence, and households residing in rural areas, have lower living standards, resort more frequently to negative coping strategies, and have limited access to humanitarian assistance. The limitation also implies that district-level results for such areas of Somalia may be more appropriately interpreted as representative for urban and peri-urban areas within the districts rather than the entire district. As previously mentioned, the JMCNA did not capture certain information that would place enumerators or respondents at risk of harm, and therefore precludes an analysis of the interaction of the severity of needs and other associated factors such as clan affiliation or the exclusion of minority groups, leading to an underestimation of the severity of needs as they relate to the aforementioned factors. Moreover, the structured nature of the survey designed for quantitative analysis did not allow for a more nuanced and detailed discussion around protection concerns, which are generally under-reported due to the nature of the questions being asked, the fact that most respondents were female (approximately 71%) while most enumerators were male, and the general unwillingness of respondents to speak freely and openly regarding such sensitive issues. Finally, the JMCNA encountered challenges in the remote monitoring of enumerators during data collection due to security and logistical reasons. In certain instances, security concerns precluded enumerators from walking around the settlements and traversing to- and fro- in front of the same households more than once lest they be viewed with suspicion, while in certain locations due to the small number of dwellings in the settlement, randomisation procedures were less than ideal. It may be reasonably assumed that such divergences from the procedure may result in sampling bias, an underestimation of severity of needs, and reduce the representativeness of the data collected, especially for the south central and south west areas, where security risks are relatively higher.
21 UNFPA. 2014. Op. cit., p.22 22 See Map 1: Assessed displaced and non-displaced households. The distribution of assessed settlements is relatively less uniform across districts and regions south of Galgaduud than to the north. 23 EU, FGS, UN, WBG. 2018. Op. cit., p.19, 52, 56

19
Somalia Joint Multi-Cluster Needs Assessment, November 2019
FINDINGS
Event/shock
Underlying factors The impact of the devastating conflict continues to influence the structure and development of Somali society, politics and economy to date. Although Somalia continues to make progress in its recovery from the effects of the protracted crisis, the gains remain tenuous and susceptible to deterioration in face of sudden shocks or lack of access to basic services. A number of latent factors exacerbate or mitigate the primary and secondary effects of the drivers of the crisis. Political and legal Political and legal institutions can significantly refract and mediate the effects of crises. Institutions remain fragile and lack the robustness required to withstand shocks or crises, resulting in risks that threaten the political, economic, and social stability at the national, regional, or local levels. Statutory State systems and judicial avenues are complemented by long-existing and firmly entrenched clan systems. It is fairly common for individuals to take recourse to the traditional clan systems for a variety of issues, thereby necessitating the State and traditional structures to work together. The constantly evolving relations between clans, and between clans and the State, are held in a delicate balance, leading to sporadic conflicts between groups for control over resources, rents, and influence, at the local community, district, and regional levels. Limited institutional development is both a cause and an effect of armed conflict. The limited capacity of the government and local authorities to provide basic services, especially in rural areas, implies that a large proportion of the population is reliant on external assistance to sustain living standards and sources of livelihoods. In turn, continued high levels of violence impede the ability of authorities to exercise control, guarantee order, and deliver aid to populations in need. Furthermore, the lack of effective government institutions coupled with insecurity, precludes the development of markets, businesses, income-generating activities, and value- and supply-chains. The limited capacity of institutions in urban and rural areas also hinders the integration and rehabilitation of displaced households, and intensifies the strain placed on services, especially in urban centres already dealing with a large influx of displaced households. Weak governance structures also compound the effects of conflicts, droughts and floods. The dearth of harmonised and coordinated planning results in fragmented responses to the successive cycles of natural shocks. The protracted nature of the crisis, the fragile governance system, and prevalence of clan-related conflict remain a significant obstacle for the implementation of durable solutions and to long-term recovery, leaving in their wake a population that continues to rely extensively on the humanitarian community to maintain adequate and decent living standards.
Socio-economic Civil society in Somalia is highly complex and dynamic. A number of clans, sub-clans, minority groups, and marginalised groups without any clan affiliation co-exist beside each other in a delicate balance of power relations, political and economic influence, and access to capital and resources. Although relations are fluid and constantly evolving, by and large, civil society remains fractured along clan- and group-identities. Conflicts between and amongst clans and communities, lead to a further marginalisation of groups already deprived of capital and resources, which in turn contributes to increasing their vulnerability and exposure to risks. Structural inequalities further entrench the disparities between groups; in particular, women and girls, children and the elderly, minority groups, groups without any clan affiliation, and people living with disabilities – especially those with sensory, mental, intellectual, and psychosocial difficulties. These groups tend to have relatively lower levels of political, economic, and social capital and resources that they can mobilise to sustain their standards of living. Structural and social inequalities are a significant driver of vulnerability and marginalisation, and especially more so when coupled with the limited development and widespread poverty rates that are a characteristic feature of the country. These differences are notably starker when urban-rural cleavages are taken into account; the

20
Somalia Joint Multi-Cluster Needs Assessment, November 2019
proportion of people experiencing severe multidimensional poverty in rural areas is 87% compared to 30% in urban areas.24 The practice of different forms of livelihood activities, environmental profile, levels of infrastructure, and insecurity are closely tied to the differences in poverty rates between rural and urban areas.
Infrastructure and technology Decades of conflict have crippled the infrastructure across the country. Weak institutional capacity further hinders the ability of federal, state, regional, and district authorities to expand the public sector and develop an adequate network of infrastructure to respond to the needs of a relatively young, growing, and urbanising population as well as the large-scale movements of displaced households. Authorities often limit themselves to the provision of defence and security, and the maintenance of road networks; basic amenities such as water, electricity, and gas are largely provided by the private sector. Moreover, a general lack of government regulation limits the availability, access, and quality of privately-provided services. The lack of adequate provision of basic goods and services further degrades the living standards in densely packed urban areas, notably impacting the environment, health, and well-being of the population. The lack of basic infrastructure, such as piped water systems, sewage systems, and waste disposal, have consequential ramifications for the health and well-being of the population, the planned development of cities and towns, and the delivery of basic services. Urban centres already bear the burden of large influxes of displaced households which further increase the strain on the availability and access of public goods and services, whereas in rural areas infrastructure and public services are quasi-non-existent. Moreover, the lack of basic infrastructure such as paved roads, coupled with widespread insecurity, makes the delivery of basic services to rural areas difficult for government authorities and humanitarian actors alike. Notwithstanding the general lack of infrastructure, the development of the telecommunication sector stands in stark contrast to other basic services such as roads, water, and electricity. Radio and mobile telephone coverage extends across large parts of the country, helping to connect and inform a considerable proportion of the population. The extensive telecommunication coverage has important implications for outreach to communities in both urban and rural areas, and is an important instrument for community engagement and interaction between various actors and affected populations. Environment The rhythm of Somalia’s development is dictated by the patterns of rainfall which govern the recurring cycles of drought and flooding, the growth of vegetation, the practice of traditional livelihoods, and the growth of the economy. Somalia is particularly susceptible to recurrent droughts due to a number of intertwined factors. The majority of the country is characterised by arid or semi-arid conditions; a little more than half of the territory is covered by savannah vegetation, while only about 13% of the land is cultivable, of which the majority is found in the south of the country in the riverine regions.25 The arid landscape has low levels of soil-moisture retention, which is further reduced by poor agricultural practices such as the removal of vegetative cover for agriculture, the exploitation of woodlands for fuel, deforestation for pasture lands, over-grazing of pastures, and desertification.26,27 The aridity of the country is largely due to the seasonal monsoon and wind patterns, which are themselves influenced by teleconnections with large-scale systems, resulting in a wide variation in precipitation, humidity, and potential evapotranspiration across the different regions in Somalia.28 Thus, while the southern regions receive more than 580 millimetres of rainfall on average per year, the northern regions receive less than 10 millimetres per year.29 Most importantly, the increasingly erratic nature of rainfall and seasonal variations due to climate change exerts a significant influence in driving the severity of naturally occurring drought cycles.
24 Oxford Poverty and Human Development Initiative. “Somalia Country Briefing”, Multidimensional Poverty Index Data Bank. OPHI, University of Oxford. 2017. p.5 25 Somalia Water and Land Information Management (SWALIM). “Analysis of the General Climatic Conditions of Somalia in Support of Drought Monitoring. Project Report No. W-14”. June 2009. p.3 26 Ibid., p.14 27 United Nations Development Programme (UNDP). “Climate Change Adaptation: Somalia”. 28 SWALIM. June 2009. Op. cit., p.6 29 Ibid.

21
Somalia Joint Multi-Cluster Needs Assessment, November 2019
Somalia has two perennial rivers, the Juba and the Shabelle, located in the south of the country. In times of heavy rainfall, the Juba and Shabelle, which have their catchment areas in the Ethiopian highlands, have often overflowed their banks at breakage points in the plains of Somalia and submerged large areas of riverine districts. The increasing frequency of floods are likely due to climate change, the unpredictable nature and wide variations in seasons, the natural topography and geology of the country. Both rivers flow along shallower slopes in Somalia, resulting in raised river bed levels, thereby making the adjacent areas relatively lower than the river channels and more prone to rainfall-fed river floods.30 Heavy rains also give rise to transient streams that result in flash-floods, resulting in the loss of human life, the interruption of livelihood activities, the destruction of property and assets, and the displacement of households. The country also has very limited fresh water resources; underground aquifers remain the main source of water for the majority of the country.31 Moreover, access to groundwater sources remains restricted due to their location at great depths, and their dependency on infiltration from regular rainfall, which in turn is mediated by the topography and geology of the different regions. The general lack of precipitation and difficulty in accessing ground water has important implications for the growth of vegetation, available arable land, and livelihoods of agro-pastoralists.
Drivers The successive crises in Somalia have been driven primarily by armed conflict and recurrent climatic shocks which have resulted in the destruction of infrastructure, disruption of livelihoods, displacement of households, limited development, and limited access to basic goods and services. The impact of climate change, and particularly the variability in rainfall, coupled with a general lack of government capacity, greatly influences the severity of drought, the increasing occurrence of river- and flash-floods, and constrains the potential for agricultural and pastoralist activities which underpin the productivity of the Somali economy. The periodic cycles of droughts and floods also feed into the inter-generational and inter-regional cycles of conflict over resources. Drought Drought is a complex phenomenon driven by natural and social processes, with no well-defined beginning or end, and is difficult to define conceptually and operationally.32,33 Although a lack of precipitation is often viewed as the primary driver of drought, and in most cases is the main limiting factor, a drought is dependent on a number of associated factors such as temperature, radiation, wind speeds, relative humidity, evapotranspiration, soil moisture retention, ground-water levels, amongst others, which in isolation or in combination, influence the severity of a drought, in both the short- and long-runs.34,35 Therefore, droughts in Somalia may be of different types: meteorological, hydrological, and soil-moisture drought, and may occur in isolation or in combination. While drought is a naturally occurring phenomenon, it has also become a short-hand reference for a general paucity of rainfall, available fresh water, food shortages, and levels of malnutrition.36 In Somalia, drought management strategies have been relatively slow to adapt to the different types of drought and indicate a general lack of capacity as an additional underlying factor which further intensifies the effects of droughts. Over the past three decades Somalia has experienced four cycles of severe drought, resulting in extreme food insecurity, and devastating famines in 1992 and 2011.37 The most recent drought in 2016 thrust more than half of the country’s population into food insecurity and led to the displacement of 1.6 million people.38 Economic damages of the most recent drought have been estimated at 3.25 billion dollars.39 Given that a large proportion of the population reside in rural areas and is dependent on agro-pastoralist activities, even a small increase in
30 SWALIM. “Hydraulic Behaviour of the Juba and Shabelle Rivers. Basic Analysis for Irrigation and Flood Management Purposes”. Support to the Sustainable Management of the Shebelle and Juba Rivers in Southern Somalia Project (GCP/SOM/047/EC). Technical Report No W-13. August 2009. p.1 31 SWALIM. June 2009. Op. cit., p.11-12 32 Ibid., p.18 33 Wilhite, Donald and Glantz, Michael. "Understanding the Drought Phenomenon: The Role of Definitions". Drought Mitigation Center Faculty Publications. Paper 20. 1985. p.3 34 Ibid., p.4-8 35 SWALIM. June 2009. Op. cit., p.20 36 Ibid., p.25 37 EU, FGS, UN, WBG. 2018. Op. cit., p.18 38 OCHA. July 2018. Op. cit., p. 1 39 EU, FGS, UN, WBG. 2018. Op. cit., p.23

22
Somalia Joint Multi-Cluster Needs Assessment, November 2019
the severity of drought can significantly disrupt livelihoods, magnify the threats to food security, increase malnutrition levels, limit access to water, and drive displacement. In early 2019, the late Gu rains led to the failure of crop yields, a decline in livestock production and herd sizes, a distortion of market prices and supply chains, as well as displacement of households.40 Although the rains recovered towards the end of the season, their inconsistent and intermittent nature did little to counter the effects of the drought, and on the contrary, led to flooding, damage to assets, and further displacement.41 Flooding The recent increasing frequency of floods may largely be attributed to natural and anthropogenic factors, resulting in more frequent and intense floods even during periods of normal flow. In addition to natural factors such as rainfall patterns, geography, and topography, a slew of human-induced changes has contributed to the increasing frequency of severe floods. In order to support agricultural activities, natural flood plains have been encroached upon, and levees and barrages have been breached to access water for irrigation during dry spells.42 Moreover, spontaneous openings of relief channels, coupled with a general lack of capacity, have resulted in poor river management practices and deterioration of existing infrastructure.43 Of the many barrages or weirs operational in the pre-conflict years, the majority are no longer functional or only partially functional.44 As a result, large swathes of the country, and especially the riverine areas, are increasingly prone to river-flooding and flash-flooding. Although areas prone to river breakages and extensive flooding are known and mapped, the deterioration of infrastructure, unplanned encroachment and exploitation of embankments during the dry seasons, have resulted in periodic overflows and floods during high-flow periods. The riverine areas in Somalia have a high potential for agriculture produce. During the pre-conflict years, crop produce accounted for approximately 20% of foreign exchange; however, the impact of conflict resulted in the complete collapse of irrigation programmes with current agriculture exports at negligible levels close to zero.45 In addition to river flooding, Somalia is also prone to flash-flooding. Periods of heavy rainfall or the impact of cyclones give birth to numerous ephemeral streams and rivers that do not readily infiltrate the arid soil and instead form fast moving streams that carry debris. Depending on the volume and flow rate, these floods can carry away humans, livestock, and even vehicles. Flash floods are particularly dangerous in Somalia where dry soils lack the capacity to absorb large amounts of water in short periods of time; moreover, the general lack of infrastructure such as storm drains, relief gullies, and the accumulation of debris, intensifies the damage caused by flash floods. Somalia bore the brunt of tropical cyclones such as cyclone Chapala and Megh in 2015 and cyclone Sagar in 2018. In October 2019 river- and flash-flooding submerged large areas of riverine districts triggering emergency responses to assist the affected populations.46 While heavy rains do often lead to marginal improvements such as an excess supply of freshwater, the accompanying floods lead to widespread damage to property, disruption of livelihoods, and the displacement of households.47,48,49 Conflict Violence is often perpetuated across generations and is driven by clan-related conflict arising from control of resources, economic rents, and competition for power and influence. Moreover, conflicts between clans continue at the level of the sub-clan, village, household, and individual, with flash-points located primarily across pastoralist areas where resources are scarce and competition is high, and along the borders of Sool and Sanaag in the north due to long-running political reasons. Violent and non-violent clan conflicts are also more recurrent during periods
40 Food and Agriculture Organisation (FAO), Food Security Nutrition and Analysis Unit (FSNAU). “Food Security & Nutrition: Quarterly Brief – Focus on Gu 2019 Season Early Warning”. 29 April 2019. p.1-2, 4-7 41 FEWS-NET, FSNAU. “Somalia Food Security Alert: Heavy Gu rainfall leads to widespread flooding.” 11.05.2018. p.1-2 42 SWALIM. August 2009. Op. cit., p.1, 26 43 Ibid., p.1-2, 26, 57-58 44 Ibid., p.57-58; See also Annex B (p.79-85) 45 Ibid., p.57 46 FAO, SWALIM. “Somalia Floods Update”. 18 October 2019. 47 OCHA. “OCHA Somalia Flash Update #1 Humanitarian impact of flooding”. 21 October 2019. 48 OCHA. “OCHA Somalia Flash Update #2 Humanitarian impact of flooding”. 28 October 2019. 49 OCHA. “OCHA Somalia Flash Update #4 Humanitarian impact of flooding”. 06 November 2019.
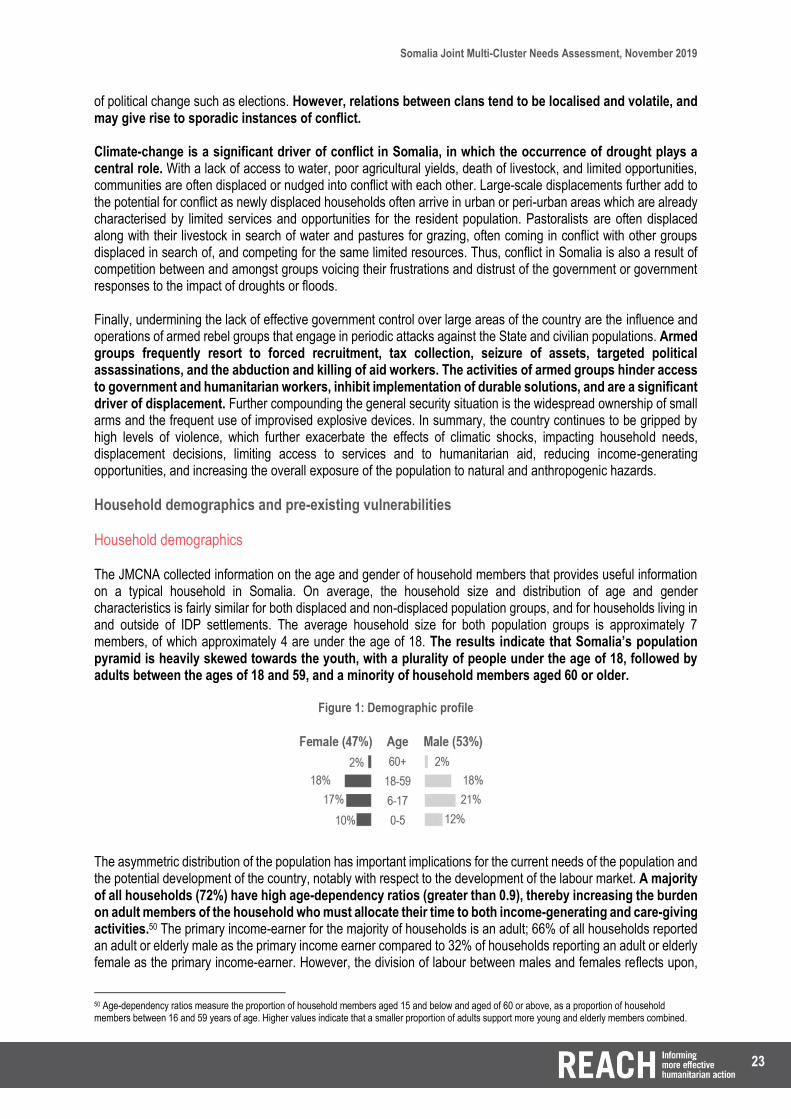
23
Somalia Joint Multi-Cluster Needs Assessment, November 2019
of political change such as elections. However, relations between clans tend to be localised and volatile, and may give rise to sporadic instances of conflict. Climate-change is a significant driver of conflict in Somalia, in which the occurrence of drought plays a central role. With a lack of access to water, poor agricultural yields, death of livestock, and limited opportunities, communities are often displaced or nudged into conflict with each other. Large-scale displacements further add to the potential for conflict as newly displaced households often arrive in urban or peri-urban areas which are already characterised by limited services and opportunities for the resident population. Pastoralists are often displaced along with their livestock in search of water and pastures for grazing, often coming in conflict with other groups displaced in search of, and competing for the same limited resources. Thus, conflict in Somalia is also a result of competition between and amongst groups voicing their frustrations and distrust of the government or government responses to the impact of droughts or floods. Finally, undermining the lack of effective government control over large areas of the country are the influence and operations of armed rebel groups that engage in periodic attacks against the State and civilian populations. Armed groups frequently resort to forced recruitment, tax collection, seizure of assets, targeted political assassinations, and the abduction and killing of aid workers. The activities of armed groups hinder access to government and humanitarian workers, inhibit implementation of durable solutions, and are a significant driver of displacement. Further compounding the general security situation is the widespread ownership of small arms and the frequent use of improvised explosive devices. In summary, the country continues to be gripped by high levels of violence, which further exacerbate the effects of climatic shocks, impacting household needs, displacement decisions, limiting access to services and to humanitarian aid, reducing income-generating opportunities, and increasing the overall exposure of the population to natural and anthropogenic hazards.
Household demographics and pre-existing vulnerabilities
Household demographics The JMCNA collected information on the age and gender of household members that provides useful information on a typical household in Somalia. On average, the household size and distribution of age and gender characteristics is fairly similar for both displaced and non-displaced population groups, and for households living in and outside of IDP settlements. The average household size for both population groups is approximately 7 members, of which approximately 4 are under the age of 18. The results indicate that Somalia’s population pyramid is heavily skewed towards the youth, with a plurality of people under the age of 18, followed by adults between the ages of 18 and 59, and a minority of household members aged 60 or older.
Figure 1: Demographic profile
The asymmetric distribution of the population has important implications for the current needs of the population and the potential development of the country, notably with respect to the development of the labour market. A majority of all households (72%) have high age-dependency ratios (greater than 0.9), thereby increasing the burden on adult members of the household who must allocate their time to both income-generating and care-giving activities.50 The primary income-earner for the majority of households is an adult; 66% of all households reported an adult or elderly male as the primary income earner compared to 32% of households reporting an adult or elderly female as the primary income-earner. However, the division of labour between males and females reflects upon,
50 Age-dependency ratios measure the proportion of household members aged 15 and below and aged of 60 or above, as a proportion of household members between 16 and 59 years of age. Higher values indicate that a smaller proportion of adults support more young and elderly members combined.

24
Somalia Joint Multi-Cluster Needs Assessment, November 2019
and reinforces, the structural differences between genders. In general, adult males participate relatively more in the labour market than adult females, lending limited support to the supposition that women tend to dedicate more of their time towards typical care-giving tasks. However, adult females in IDP settlements take on the role of primary income-earner more often relative to their homologues living in non-IDP settlements, with 42% of adult females working as the primary income-earner in households residing in IDP settlements compared to 32% of adult females working as the primary income-earner in non-IDP settlements (p-value: <.01***). The JMCNA results also highlight the changing role of women within households, with a slightly higher proportion of households reporting an adult or elderly female in charge of household expenditure decisions relative to adult or elderly males; 48% of all households reported an adult or elderly male as one of the primary decision-makers on household expenditure compared to 66% of households reporting an adult or elderly female as one of the primary decision-maker on household expenditure.51
Pre-existing vulnerabilities Across the country, both displaced and non-displaced households remain vulnerable to the impact of shocks. A household with a relatively higher level of pre-existing vulnerabilities is considered to be comparatively more exposed to higher levels of risk than a household with low levels of pre-existing vulnerabilities. The pre-existing vulnerability score is comprised of the following indicators: household vulnerability (vulnerable heads of households, primary income earners, other vulnerable members), possession of legal documentation, dependency levels (age- and work-dependency ratios, time spent on care-giving tasks), poverty levels (income per capita, household debt-to-income ratio), household expenditure on basic goods and services, and length of displacement for displaced households. The vulnerability of a household may be further compounded if they are displaced from their previous location, if they belong to a minority group, or if individuals in the household have sensory, mental or intellectual disabilities, that limit their access to services and hinder their participation as full members of society. As these factors are not mutually exclusive a household may be highly vulnerable depending on the number and combination of factors influencing its level of exposure to shocks.52 Refer to Annex 12 for further details on indicators and the scoring of severity thresholds. The national-level results indicate that close to a quarter of all households may be characterised as severely vulnerable, with 22% of all households in category 3 (severe) and 72% of households in category 2 (stressed). The results for severe pre-existing vulnerabilities are significantly different between households living in IDP (53%) and non-IDP settlements (19%) (p-value: <.01***). However, the difference between both population groups is reduced once the indicator on length of displacement is excluded, with the proportion of households in severity category 3 almost doubling. The change in proportion of households between severity category 2 and 3 is even starker for households living in non-IDP settlements, with the proportion of 19% households in severity category 3 increasing to 42%. The indicator on the duration of displacement affects the score for both population groups as non-displaced households are accorded the lowest score; thus, the indicator is particularly sensitive to the case-load of displaced persons and their duration of displacement. This discrepancy is due to the assumption that households are significantly more vulnerable due to the nature of, and issues that accompany, displacement, such as the loss of livelihoods, resources, and support networks; thus, the low score attributed to non-displaced households reduced the overall severity scores. Notwithstanding the assumptions related to displacement, the difference in results also lends support to the conclusion that, in general, both population groups have severe levels of pre-existing vulnerabilities.
51 Response choices for the question on who is responsible for decisions on household expenditure are of the select multiple type; therefore, the percentages do not equal 100%. 52 It is however problematic to advance generalised assumptions regarding the pre-existing vulnerability of an individual or household based on only a few characteristics. For instance, there is limited evidence to suggest that displaced single-male headed households may be more vulnerable than non-displaced married female-headed households due to differences in social roles and support networks, while in certain areas, non-displaced households may have relatively lower living standards when compared to displaced households due to the level of external aid that is targeted towards aiding displaced population groups.
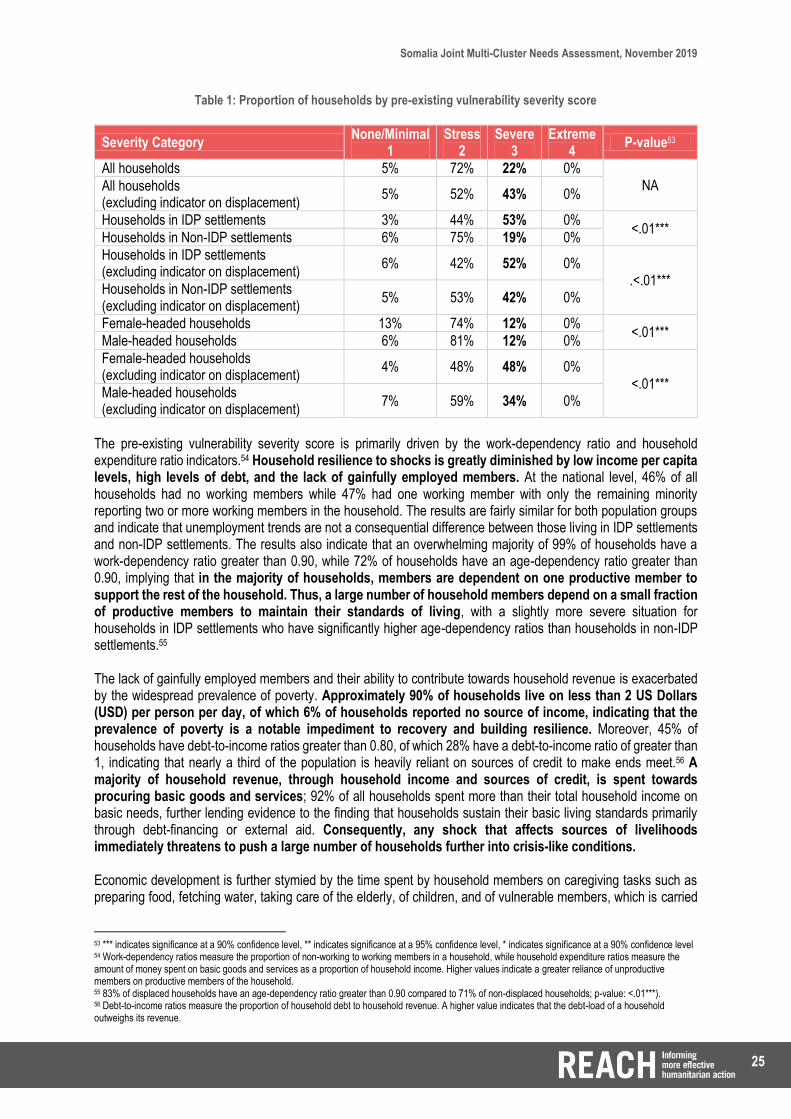
25
Somalia Joint Multi-Cluster Needs Assessment, November 2019
Table 1: Proportion of households by pre-existing vulnerability severity score
The pre-existing vulnerability severity score is primarily driven by the work-dependency ratio and household expenditure ratio indicators.54 Household resilience to shocks is greatly diminished by low income per capita levels, high levels of debt, and the lack of gainfully employed members. At the national level, 46% of all households had no working members while 47% had one working member with only the remaining minority reporting two or more working members in the household. The results are fairly similar for both population groups and indicate that unemployment trends are not a consequential difference between those living in IDP settlements and non-IDP settlements. The results also indicate that an overwhelming majority of 99% of households have a work-dependency ratio greater than 0.90, while 72% of households have an age-dependency ratio greater than 0.90, implying that in the majority of households, members are dependent on one productive member to support the rest of the household. Thus, a large number of household members depend on a small fraction of productive members to maintain their standards of living, with a slightly more severe situation for households in IDP settlements who have significantly higher age-dependency ratios than households in non-IDP settlements.55
The lack of gainfully employed members and their ability to contribute towards household revenue is exacerbated by the widespread prevalence of poverty. Approximately 90% of households live on less than 2 US Dollars (USD) per person per day, of which 6% of households reported no source of income, indicating that the prevalence of poverty is a notable impediment to recovery and building resilience. Moreover, 45% of households have debt-to-income ratios greater than 0.80, of which 28% have a debt-to-income ratio of greater than 1, indicating that nearly a third of the population is heavily reliant on sources of credit to make ends meet.56 A majority of household revenue, through household income and sources of credit, is spent towards procuring basic goods and services; 92% of all households spent more than their total household income on basic needs, further lending evidence to the finding that households sustain their basic living standards primarily through debt-financing or external aid. Consequently, any shock that affects sources of livelihoods immediately threatens to push a large number of households further into crisis-like conditions. Economic development is further stymied by the time spent by household members on caregiving tasks such as preparing food, fetching water, taking care of the elderly, of children, and of vulnerable members, which is carried
53 *** indicates significance at a 90% confidence level, ** indicates significance at a 95% confidence level, * indicates significance at a 90% confidence level 54 Work-dependency ratios measure the proportion of non-working to working members in a household, while household expenditure ratios measure the amount of money spent on basic goods and services as a proportion of household income. Higher values indicate a greater reliance of unproductive members on productive members of the household. 55 83% of displaced households have an age-dependency ratio greater than 0.90 compared to 71% of non-displaced households; p-value: <.01***). 56 Debt-to-income ratios measure the proportion of household debt to household revenue. A higher value indicates that the debt-load of a household outweighs its revenue.
Severity Category None/Minimal
1 Stress
2 Severe
3 Extreme
4 P-value53
All households 5% 72% 22% 0%
NA All households (excluding indicator on displacement)
5% 52% 43% 0%
Households in IDP settlements 3% 44% 53% 0% <.01***
Households in Non-IDP settlements 6% 75% 19% 0%
Households in IDP settlements (excluding indicator on displacement)
6% 42% 52% 0% .<.01***
Households in Non-IDP settlements (excluding indicator on displacement)
5% 53% 42% 0%
Female-headed households 13% 74% 12% 0% <.01***
Male-headed households 6% 81% 12% 0%
Female-headed households (excluding indicator on displacement)
4% 48% 48% 0%
<.01*** Male-headed households (excluding indicator on displacement)
7% 59% 34% 0%

26
Somalia Joint Multi-Cluster Needs Assessment, November 2019
out typically by female members of a household. The JMCNA results on the proportion of persons with disabilities in a household are reflective of the general estimate of 15% provided by the World Health Organisation (WHO) with 19% of households in IDP settlements and 12% of households in non-IDP settlements reporting the presence of at least one household member with a disability (p-value: <.01***).57 However, on average, households in non-IDP settlements tend to spend more time on care-giving tasks compared to households in IDP settlements, with 30% of households in non-IDP settlements spending more than 4 hours per day on typical caregiving tasks compared to 18% of households in IDP settlements (p-value: <.01***). These findings are largely similar across regions and districts. The lack of any formal or developed social security net further necessitates reliance on such care-giving activities and on coping mechanisms to sustain basic living standards. However, balancing the time spent towards income-generating activities and care-giving tasks is even more problematic for households in IDP settlements because of their relatively higher age-dependency ratios, lack of employment opportunities, reduced resilience, and susceptibility to the impact of shocks. Households are particularly vulnerable when the length of displacement is also taken into account. Households that have been recently displaced may be more vulnerable than other groups even if they may be the target of focused humanitarian assistance. Recently displaced households may be particularly at risk as they often have few livelihood opportunities, social support networks, and live in precarious conditions. Households that have been displaced for extended periods of time may be less vulnerable as they have had time to adapt to the context in their area of arrival, had time to find adequate livelihood activities, and on general have lower MSNI severity scores or lower capacity gap scores. A correlation analysis between length of displacement and MSNI severity scores (value: -0.007), and between length of displacement and capacity gap scores (value: -0.011) does indicate the expected negative relationship but is far from adequate to validate the assumption. The spatial distribution of households with high vulnerability severity scores is striking. The findings indicate that vulnerable households are to be found across the country, with each region having at least between 1% and 20% of households with high severity scores. Moreover, higher concentrations of vulnerable households in IDP settlements co-exist besides relatively lower proportions of vulnerable households in non-IDP settlements.
57 World Health Organisation. World Report on Disability. 2011. p.7

27
Somalia Joint Multi-Cluster Needs Assessment, November 2019
Map 2: Proportion of households in non-IDP settlements with a pre-existing vulnerability severity score of 3 or higher
The highest concentration of households in non-IDP settlements with severe pre-existing vulnerability scores are located in the districts of Taleex (62%), followed by Baidoa (43%), Badhaadhe (40%), Gebiley (38%), Kismaayo (36%), Cabudwaaq (34%), Xudun (33%), Ceel
Afweyn (32%), Cadaado (31%), and Afmadow (31%)58.
Map 3: Proportion of households in IDP settlements with a pre-existing vulnerability severity score of 3 or higher
The highest concentration of households in IDP settlements with severe pre-existing vulnerability scores are located in the districts of Afgooye (90%), Taleex (86%), Xudur (81%), Ceel Waaq (75%), Ceel Afweyn
(72%), Baidoa (72%), Luuq (70%), Buuhoodle (68%)58, Hobyo (67%), Caynabo (66%), Laas Caanood (64%), Garoowe (64%), Galdogob (64%), Kismaayo (61%), Garbahaarey (60%), Belet Weyne (59%), Laasqoray (59%), Burco (57%), Ceel Baarde (57%), Burtinle (57%),
Afmadow (56%)58, Cabudwaaq (56%), Waajid (56%), Cadaado (54%), Banadir (52%), Xudun (52%), Wanla
Weyn (51%), Gaalkacyo (48%), Belet Xaawo (46%)58, Doolow (46%), Owdweyne (46%), Bossaso (46%), Dhuusamarreeb (42%)58, Lughaye (39%), Hargeysa (33%), Berbera (33%), and Ceerigabo (31%).
Primary and secondary effects of the crisis The effects of the crisis, drought, and conflict, are experienced differentially across geographic areas, sectors, and by population groups. The primary and secondary effects make themselves apparent in their impact on households, on systems and services, and on access to humanitarian aid. The impact score is comprised of the following indicators: hazard-prone environment, conflict-prone environment, separation of family members, loss of employment, loss of or damage to shelters, displacement push-factors, barriers to humanitarian aid, and the Integrated Phase Classification (IPC) score. Refer to Annex 12 for further details on indicators and scoring. The JMCNA results indicate that, at the national level, a majority of the population has experienced a minimal impact of the crisis in the months preceding data collection, with fairly similar proportions of households in IDP settlements (1%) and non-IDP settlements (3%) falling under severity category 3. However, there is a difference in how households in IDP and non-IDP settlements are impacted by the crisis with 61% of households in IDP settlements and 17% of households in non-IDP settlements falling under severity category 2.59 Households in IDP settlements are separated from households in non-IDP settlements by 43 percentage points in category 2 and by 58 This data is not statistically representative and should be taken as indicative only. 59 The impact score is comprised of the following indicators: hazard-prone environment, conflict-prone environment, separation of family
members, loss of employment, loss of or damage to shelters, displacement push-factors, barriers to humanitarian aid, and the Integrated Phase Classification (IPC) score. Refer to Annex 12 for further details on indicators and scoring.

28
Somalia Joint Multi-Cluster Needs Assessment, November 2019
45 percentage points in severity category 1. The large difference may be explained by the fact that displaced households are more susceptible to the impact of the crisis by the very virtue of the nature of displacement and associated outcomes; displaced households often have relatively fewer resources, livelihood opportunities, limited support networks, and reside in temporary or sub-standard shelters, amongst others, which in turn, limits their resilience and capacity to deal with the effects of the crisis.60
Table 2: Proportion of households by impact severity score
There is a significant difference between both population groups at the national level with respect to all sub-indicators that contribute towards the overall impact score, with the exception of drought. Drought is measured by the mean anomaly of evapotranspiration.61 A large percentage of both groups – 82% of households in IDP settlements and 77% of households in non-IDP settlements reside in areas where the mean anomaly of evapotranspiration remains at 100% (indicating no deviation from the historic mean), while only 4% and 10%, respectively, residing in areas where the mean anomaly of evapotranspiration ranges from 70% to 30%.62,63 While the majority of the population resides in areas with no large deviation from average historical conditions, their situation remains relatively dire. First, since the mean anomaly only measures deviation from average conditions in the same period historically, and given the fact that Somalia has been in drought like conditions prior to data collection for the JMCNA, even a small change has important implications. Even minor deviations from historic trends would have a consequential impact, especially on the livelihoods of agro-pastoralists. Second, there is a large dispersion in the data, ranging from a minimum of 2% to a maximum of 250%, indicating that while certain settlements and districts retained a surplus of water compared to the same period in previous years, other districts were severely deprived of, and continued to lose, water through evaporation and transpiration.
60 The impact score does contain an indicator on displacement push-factors to capture the effects of drought, flooding, and conflict, which is particularly sensitive to the responses of displaced households and which tends to reduce the relative severity score of non-displaced households. Exclusion of the indicator on displacement push-factors indicates that in general the results do not vary significantly; there is a 14 percentage point decrease for non-displaced households in severity category 1 and a corresponding 13 percentage point increase for non-displaced households in severity category 2. More importantly, there is a tiny percentage point change for displaced households, indicating that displacement push-factors account for very little of the variation in severity of impact scores between displaced and non-displaced households. 61 The level of evapotranspiration indicates whether there is a net loss or gain of moisture retained by the soil and vegetation, while the mean anomaly compares the level of evapotranspiration to historic trends. 62 Secondary data for constructing a drought severity score was sourced from the United States Geological Survey and FEWS-NET Data Portal. The seasonal evapotranspiration (ET) anomaly data set for the May-September Long-Cycle (Ethiopia) was used. The latitude and longitude of assessed settlements was matched to the dataset to attribute a mean anomaly of evapotranspiration score to households in each settlement. 63 The anomaly is a ratio value of the actual evapotranspiration compared to the corresponding median of actual evapotranspiration, and is expressed in percentage values. Evapotranspiration anomalies indicate surpluses or deficits in water surface evaporation, soil moisture evaporation, and plant transpiration. Values lower than 100% indicate drought-like conditions, with values over a 100% indicate a surplus of water and biomass. For more information consult: USGS, FEWS-NET.
Severity Category None/Minimal
1 Stress
2 Severe
3 Extreme
4 P-value
All households 77% 22% 1% 0%
NA All households (excluding indicator on displacement)
65% 32% 2% 0%
Households in IDP settlements 36% 61% 3% 0% <.01***
Households in non-IDP settlements 81% 17% 1% 0%
Households in IDP settlements (excluding indicator on displacement)
34% 63% 3% 0% <.01***
Households in non-IDP settlements (excluding indicator on displacement)
69% 29% 2% 0%
Female-headed households 79% 19% 1% 0% <.01***
Male-headed households 72% 27% 2% 0%
Female-headed households (excluding indicator on displacement)
70% 28% 2% 0%
<.01*** Male-headed households (excluding indicator on displacement)
56% 41% 3% 0%

29
Somalia Joint Multi-Cluster Needs Assessment, November 2019
While drought impacted both displaced and non-displaced groups in relatively similar manners at the national level, the difference in impact was largely felt across geographical areas rather than by population groups, with minor exceptions. Results at the district-level are more informative, indicating that some districts experienced more severe drought-like conditions than elsewhere in the country. The highest proportions of households in IDP settlements that experienced a deviation of at least 50% from the mean were found in the districts of Canyabo (33%), Ceerigaabo (31%)64, Cadaado (28%), Galdogob (25%), Cabudwaaq (20%), while households in non-IDP settlements that experienced a deviation of at least 50% from the mean were found the districts of Taleex (51%), Burtinle (46%), Caynabo (37%), Kismaayo (27%), and Buuhoodle (26%)65. Households residing in the aforementioned districts are particularly susceptible to the impact of drought as there are between approximately 15% and 40% of the population in these districts engaged in some form of agro-pastoralist activity. In contrast to the impact of drought, there is a significant difference between population groups with respect to the threat of conflict. Of households in IDP settlements, 40% reside in an area of a radius of 10 kilometres which experienced more than 50 conflict related incidents in 2019 compared to 8% of households in non-IDP settlements (p-value: <.01***).66 The results indicate that households in IDP settlements are more likely to be exposed to incidents of violence and insecurity. The concentration of displaced households in areas of escalated violence is probably due to the fact that most displaced households have moved to Baidoa or Mogadishu, of which the latter is particularly characterised by a high number of incidents of conflict, thereby leading to a higher conflict environment score for displaced households. Indeed, 100% of all households in Banadir region reside within 10 kilometres of more than 50 incidents of conflict. A substantial proportion of households in both IDP settlements and non-IDP settlements are also to be found in an area of a radius of 10 kilometres which experienced more than 30 conflict related incidents since January 2019, notably in Marka (100%), Bossaso (99%), Belet Weyne (78%), Balcad (74%), and Kismaayo (69%). Most of the conflict affected regions and settlements found in the central, southern, and western areas of the country with the regions of Bay, Banadir, Bari, Hiraan, Lower and Middle Shabelle, and Lower Juba having the highest proportions of households affected by conflict. The impacts of conflict, drought, and flooding have also been measured at the household level, notably in relation to their effects on the loss of employment, the separation of family members, and damage to shelters. In total 12% of households reported a loss of employment in the three months preceding data collection. At the national level, 18% of households in IDP settlements and 11% of households in non-IDP settlements reported a loss in employment for at least one member in the household. Of the households reporting a loss of employment, the largest proportion of both population groups reported a loss of employment due to drought (42%), followed by ‘other reasons’ (32%), conflict (22%), ‘don’t know’ (15%), and floods (10%). A slightly larger proportion of households in IDP settlements (49%) reported a loss in employment due to drought compared to households in non-IDP settlements (41%) while a slightly larger proportion of households in non-IDP settlements reported a loss in employment due to flooding (10%) compared to households in IDP settlements (6%). The differences between groups concerning the loss of employment due to drought or flooding are not statistically significant. Although the difference between groups is small, the results indicate that during floods, non-displaced households, that rely relatively more on agro-pastoralist income-generating activities than displaced households, may be particularly affected with respect to their livelihoods.67 Of the households reporting a loss of employment, 22% and 13% of households in IDP and non-IDP settlements, respectively, reported a loss of employment due to conflict (p-value: 0.07*), and 26% and 33% of households in IDP and non-IDP settlements, respectively, reported a loss of employment due to ‘other reasons’ (p-value: 0.34). The results indicate that the livelihoods of households in IDP settlements are relatively more threatened by conflict compared to households in non-IDP settlements. The findings suggest that drought in particular threatens the livelihoods and sources of income of households in IDP settlements; drought is an important driver of displacement, and menaces the sustainability of agro-pastoralist activities. Thus, households in IDP settlements are particularly affected as they may have greater difficulty in
64 This data is not statistically representative at the settlement level and should be taken as indicative only. 65 This data is not statistically representative and should be taken as indicative only. 66 Secondary data for constructing a conflict environment severity score was sourced from the Armed Conflict Location and Event Data Project (ACLED). The latitude and longitude of assessed households was matched to the dataset to attribute a severity score to households in each settlement based on whether households were located within a radius of 10 kilometres of conflict incidents that occurred since January 2019. 67 At the national level, 17% of non-displaced households and 8% of displaced households engage in cash-crop farming, while 20% of non-displaced households and 4% of displaced households engage in livestock production.

30
Somalia Joint Multi-Cluster Needs Assessment, November 2019
adapting to, and finding, new sources of livelihoods in their areas of arrival. Similarly, drought also threatens the livelihoods of non-displaced households that are more likely to engage in agro-pastoralist activities compared to displaced households. The secondary effects of drought, flooding, and conflict may also be partly captured through the knock-on effects they exert on the business environment and sources of livelihoods. The second most reported reason for loss in employment for both groups has been due to ‘other reasons’, which include a loss of employment opportunities, termination of contracts, poor health or inability to work, and clan dynamics, amongst others. The data suggests that secondary effects of drought, flooding, and conflict further tend to impact households by limiting the availability of opportunities, and by impacting the health and well-being of household members of working age. These secondary effects also partially manifest themselves in the reasons cited for the separation of household members. Of the households reporting on the separation of family members, an overwhelming majority of all households reported that family members had left the household either in search of education or employment opportunities, with only approximately 3% reporting the direct effects of flood, drought, or conflict as reasons for separation. Twenty-six percent (26%) of all households reported sustaining long-term damage to their shelters which was left unrepaired, with a significantly higher proportion of households residing in IDP settlements reporting damaged shelters; 37% of households in IDP settlements and 24% of households in non-IDP settlements reported damage to shelters in the 3 months preceding data collection (p-value: <.01***). Of the 26% of all households reporting damage to their shelters, 29% of households in IDP settlements and 25% of households in non-IDP settlements reported flood-related damage while approximately 78% and 68% of households in IDP settlements and non-IDP settlements, respectively reported poor construction or poor quality materials as the reason for shelter damage. Importantly, the use of poor quality materials or construction leaves the shelters even more susceptible to damage by natural shocks. Finally, the prevalence of insecurity and conflict is a key driver of the impact of the crisis as it restricts the delivery of services and ability of the affected population to access humanitarian aid. Twenty-eight percent (28%) of households in IDP settlements and 22% of households in non-IDP settlements reported being unable to physically reach points of humanitarian aid distribution or services. Additionally, 17% of households in IDP settlements and 11% of households in non-IDP settlements reported insecurity at points of humanitarian aid distribution, or insecurity on route to humanitarian aid as the main barriers to accessing humanitarian aid. Access also remains severely limited for humanitarian actors to operate in a number of districts, primarily due to insecurity. Moreover, access is also restricted by the limited road network.68 The findings indicate that a high proportion of households with severe needs reside in areas which are partially or completely inaccessible to humanitarian actors.
68 For further information, consult: REACH. “Somalia Country Reference Map”. 2016.

31
Somalia Joint Multi-Cluster Needs Assessment, November 2019
Map 4: Proportion of households in non-IDP settlements with an impact severity score of 3 or
higher
The highest concentration of households in non-IDP settlements with severe impact scores are located in the district of Marka (28%).
Map 5: Proportion of households in IDP settlements with an impact severity score of 3 or higher
No single district has more than 20% of its population residing in IDP settlements with severe impact scores. The highest proportion of households in IDP settlements with an impact severity score of 3 or higher were found in Belet Weyne (11%).
Displacement trends The effects of conflict, drought, and the erosion of livelihoods are key drivers influencing the displacement of households in Somalia. Displaced households were asked questions concerning the primary and secondary reasons they left their previous locations as well as the primary and secondary reasons for arriving to their current location. In particular, at least one conflict-related factor was reported as the primary or secondary reason that influenced a household’s decision to re-locate.69 Notably, more than 50% of displaced households reported at least one conflict related reason as the primary reason for leaving their previous location in the districts of Ceel Waaq (100%), Berbera (98%), Laas Caanood (93%), Ceel Barde (63%)70, Waajid (53%), Garoowe (52%), Bossaso (51%), and Jowhar (51%). The absence of conflict in the area of arrival features prominently amongst the primary and secondary reasons reported by displaced households that influenced their decision to arrive to their current location, further corroborating the importance of conflict in determining displacement trends. At least one conflict-related reason was reported as the primary reason by approximately 31% of displaced households and as the secondary reason by approximately 13% of displaced households. However, a number of mostly rural settlements across districts in the central, southern, and western areas of the country remained inaccessible to enumerators due to security concerns. Therefore, results for such districts should be more accurately interpreted as reflecting the views of households in relatively safer, urban settlements rather than for the entire district. Approximately 49% of displaced households reported at least one conflict-related factor as the main reason for leaving their previous location, with approximately 34% reporting at least one conflict-related factor as the secondary reason. Drought was the second most reported reason driving displacement decisions, and was cited as the primary and secondary reason by 18% and 10% of displaced households, respectively,
69 Conflict-related factors include: actual conflict in the community, arrival of armed groups, withdrawal of armed groups/security forces, conflict in the surrounding area but not in the community, fear of conflict in the community, and personal threats 70 This data is not statistically representative and should be taken as indicative only.

32
Somalia Joint Multi-Cluster Needs Assessment, November 2019
followed closely by the lack of livelihood opportunities as the primary and secondary reason by 9% and 13% of displaced households, respectively. Given the agro-pastoralist nature of many Somalis, it is reasonable to assume that the lack of livelihood opportunities is closely related to the effects of drought. Drought was cited as the primary reason for leaving their previous location by the majority of households in districts of Caynabo (97%), Owdweyne (85%), Ceel Afweyn (76%), Xudun (72%), Galdogob (57%), and as the secondary reason by households in Waajid (57%). Importantly, households that reported drought as the primary reason influencing their displacement, also reported reasons closely related to drought as the secondary reason driving their displacement such as the lack of water (70% in Owdweyne, 32% in Xudun, 27% in Ceel Afweyn, and 23% in Lughaye), the lack of food (60% in Caynabo), or the lack of livelihood opportunities (55% in Galdogob, 28% in Gebiley, and 20% in Kismaayo). The availability of local food, markets, and opportunities for cultivation was cited as an important pull factor for households residing in Berbera (98%), Caynabo (62%), Owdweyne (57%), Laasqoray (48%), and Lughaye (22%), while the availability of water was reported as the primary pull factor by households in Ceel Afweyn (37%), Burco (32%), and Cadaado (28%).
Moreover, displacement has also been driven, in part, by the lure of available sources of livelihood and assistance provided by humanitarian actors, with displaced households reporting the availability of work/income opportunities as the second most important reason for a household to arrive to its current location. The lack and availability of health services is also important to highlight as it features as an important factor; it was reported relatively more often than the presence of shelter or water as the reason a household decided to re-locate and indicates that households are willing to travel and re-locate in search of healthcare. The lack of livelihoods and job opportunities was reported as the primary reason for relocating by a large proportion of households in Afmadow (56%)71, Laasqoray (48%), Burtinle (43%), Burco and Borama (32%), and as important pull factor for households that re-located to Kismaayo (59%), Gebiley and Burtinle (44%), Afmadow (38%), Borama (32%), and Xudur (31%). A large proportion of households cited the lack of health services as the main reason driving their displacement from their previous location in Laas Caanood (91%), Afmadow (36%), Doolow (28%), and Borama (22%). The presence of shelters was an important reason influencing a household’s decision to re-locate to Caynabo (60%), Garoowe (54%), Xudun (51%), Burtinle (45%), Afgooye (37%), Burco (33%), Lughaye (28%), and Hargeysa (25%). A large proportion of households also reported some form of humanitarian aid as an important reason for their re-location. Notably, households were attracted to the presence of food distribution or aid in Waajid (90%), Doolow (49%), Galdogob (42%), Jowhar (39%), Xudur (24%), and Cabudwaaq (20%), and to cash distribution in Xudun (50%). Refer to Annex 13 for an overview of the most reported primary and secondary factors driving displacement decisions.
71 This data is not statistically representative and should be taken as indicative only.

32
Somalia Joint Multi-Cluster Needs Assessment, November 2019
Figure 2: Top 5 primary reasons for leaving area of origin
Figure 3: Top 5 secondary reasons for leaving area of origin
Figure 4: Top 5 primary reasons for arriving to current location
Figure 5: Top 5 secondary reasons for arriving to current location
Finally, the impact of the aforementioned factors is noticeably strong on the displacement decisions of households, with 81% of displaced households reporting their intentions to settle in their current location within the next year and only 19% indicating any intention to move elsewhere, of which 12% intend to re-locate elsewhere within the same city. Of those reporting intentions to re-locate, 40% reported wanting to move to Banadir region, followed by Lower Juba, Lower Shabelle, and Bakool reported by 13%, 9%, and 8%, respectively. The results indicate an increased strain on the availability, quality, and access to services, and housing, land, and property issues, especially in large urban centres, potentially putting displaced and non-displaced groups in competition and conflict for limited resources. However, the JMCNA results also point to fairly stable and good relations between displaced and non-displaced communities. Of all households surveyed, approximately 32% of households in non-IDP settlements were hosting other households while 40% of households in IDP settlements were hosting other households. Moreover, over 90% of households in both IDP and non-IDP settlements reported relations between displaced and non-displaced households as being either good or very good, with approximately 70% of both groups forecasting good relations between the two groups for the next year.
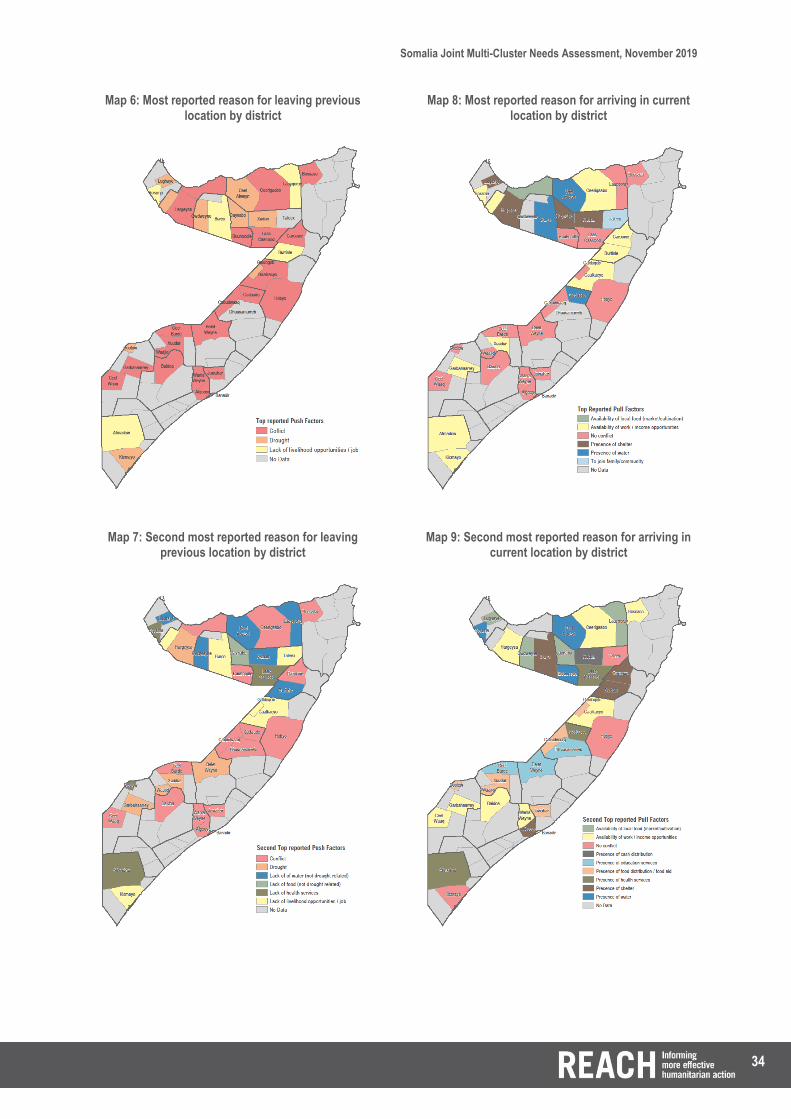
34
Somalia Joint Multi-Cluster Needs Assessment, November 2019
Map 6: Most reported reason for leaving previous location by district
Map 7: Second most reported reason for leaving previous location by district
Map 8: Most reported reason for arriving in current location by district
Map 9: Second most reported reason for arriving in current location by district

35
Somalia Joint Multi-Cluster Needs Assessment, November 2019
Current needs
Overview of the Multi-Sector Needs Index The 2019 JMCNA results indicate that a tiny fraction (less than 1%) of the population have a MSNI score of 4 (extreme), while 12% have a MSNI score of 3 (severe), with the majority of 76% of the population characterised by a MSNI score of 2 (stressed). On average, households in IDP settlements have higher MSNI severity scores relative to their homologues in non-IDP settlements, with 27% of households in IDP settlements identified as having a MSNI score of at least 3 compared to 11% of households in non-IDP settlements (p-value: <.01***). There are noticeable differences between the two groups at both ends of the MSNI scale, pointing to an asymmetric distribution in the severity of needs for both population groups.
Table 3: Proportion of households by MSNI severity score
Severity Category 1 2 3 4 P-value
All households 11% 76% 12% 0.31% NA
Households in IDP settlements 1% 72% 27% 0.46% <.01***
Households in non-IDP settlements 12% 77% 11% 0.30%
Female-headed households 13% 74% 12% 0.28% <.01***
Male-headed households 6% 81% 12% 0.38%
There is a small, but significant, difference in the MSNI scores for male and female-headed households with male-headed households being slightly more affected. The difference between the two groups lies within categories 1, 2 and 4 and indicate that male-headed households may have lower living standards. The finding runs counter to expectations, and one possible explanation concerns the definition of female- and male-headed households; any household with a female member who participates in household expenditure decisions was classified as a female-headed household.72 Results may also be contaminated by spill-overs from the severity scores of displaced and non-displaced population groups. Finally, male-headed households may indeed have lower living standards than female-headed households as the latter may be more specifically targeted as beneficiaries of humanitarian aid; however, it is likely that these differences only hold for certain cluster-specific severity scores.
MSNI across regions Although the results indicate a peak in severity category 2 for both population groups, the national-level results obscure important regional variations in the MSNI scores. The areas with the highest proportion of all households in severity categories 3 and 4 are found in the regions of Bakool (43%), Gedo (31%), Hiraan (31%), Bay (27%), Lower Juba (26%), and Lower Shabelle (17%). The high proportion of households with severe or extreme MSNI scores is likely due to the fact that the aforementioned regions are areas which have been particularly impacted by drought, flooding, and conflict. Bay, Bakool, Gedo, Hiraan, Lower Juba, and Lower Shabelle are also regions with elevated levels of insecurity, and consequently, limited access for data collection. Given the restrictive environment which prevented enumerators from accessing hard to reach rural areas, and the potential skew towards collecting data only from accessible urban centres, it is reasonable to suppose that the MSNI severity scores well underestimate the true severity of needs on the assumption that households living in inaccessible and conflict-prone areas may have lower living standards, may resort more frequently to unsustainable or negative coping strategies, and may have limited access to services or humanitarian aid.
72 The JMCNA data indicates that when another male member participates in such decisions, they tend to be either males under the age of 18 or above the age of 59 in the majority of the cases.

36
Somalia Joint Multi-Cluster Needs Assessment, November 2019
MSNI across population groups by region The high proportion of households with MSNI scores of at least 3 in the regions of Bay, Bakool, Gedo, Hiraan, and Lower Juba are driven by severe needs for both households in IDP settlements and in non-IDP settlements. In contrast, the high proportion of households with severe MSNI scores in Lower Shabelle is driven primarily by severe needs identified amongst households living in non-IDP settlements (19%). However, in general, the majority of proportions of households with MSNI scores of at least 3 across most regions are driven by the severity of needs identified amongst households living in IDP settlements. While a higher proportion of households in IDP settlements were found to have a MSNI score of at least 3, households in IDP settlements represent approximately 10% of the total national population, which means that a higher absolute number of households in non-IDP settlements may have a severe or extreme MSNI score.
Table 4: Proportion of households with a MSNI severity score of at least 3
Region Estimated
total population73 All
households Households in
IDP settlements
Households in non-IDP
settlements P-value
Awdal 673,263 (5.5%) 9.31% 3.05% 9.43% 0.19
Woqooyi Galbeed 1,242,003 (10.1%) 8.50% 4.74% 8.61% 0.30
Togdheer 721,363 (5.9%) 5.74% 22.23% 5.03% <.01***
Sool 327,428 (2.7%) 4.09% 16.12% 2.39% <.01***
Sanaag 544,123 (4.4%) 8.86% 29.02% 7.45% <.01***
Bari 719,512 (5.8%) 8.11% 28.57% 4.60% <.01***
Nugaal 392,698 (3.2%) 11.74% 28.34% 6.47% <.01***
Mudug 717,863 (5.8%) 10.41% 30.68% 7.58% <.01***
Galgaduud 569,434 (4.6%) 12.66% 20.99% 12.47% 0.12
Hiraan 520,685 (4.2%) 30.89% 46.59% 19.69% 0.01**
Middle Shabelle 516,036 (4.2%) 8.89% 24.14% 7.66% 0.04**
Banadir 1,650,227 (13.4%) 12.55% 24.67% 5.00% <.01***
Lower Shabelle 1,202,219 (9.8%) 17.04% 3.38% 19.23% <.01***
Bay 792,182 (6.4%) 27.05% 48.48% 20.34% <.01***
Bakool 367,226 (3.0%) 42.87% 43.79% 42.83% 0.89
Gedo 508,405 (4.1%) 31.44% 25.97% 32.02% 0.59
Middle Juba74 362,921 (2.9%) NA NA NA NA
Lower Juba 489,307 (4.0%) 26.25% 48.72% 19.18% <.01**
A large percentage of households with a MSNI severity score of at least 3 are located in Hiraan, Gedo, Lower Juba, Galgaduud, and Bakool regions, indicating that the overall severity of needs is high, and that lower level of living standards are relatively similar for both population groups in these regions. In contrast, there are large and significant differences between displaced and non-displaced households in Togdheer, Sool, Sanaag, Bari, Nugaal, Mudug, Banadir, Lower Shabelle, Bay, and Lower Juba regions, indicating that households in IDP settlements are particularly impacted by the protracted crisis relative to households in non-IDP settlements. While the proportion of households with a MSNI severity score of at least 3 indicates the severity of needs, the estimated population by region is useful in identifying the magnitude of needs and indicative caseloads.75 However, it should be noted that the population estimates date from 2014 and thus the magnitude of needs may well be underestimated. The magnitude and severity of needs are highest in Banadir and Lower Shabelle which
73 UNFPA. 2014. Op. cit., p.31, 101 74 Not assessed due to insecurity and constraints on access 75 Key stakeholders agreed that the JMCNA focus on estimating the intensity of needs rather than the magnitude, and therefore, the estimation of case-loads is beyond the scope of the assessment.

37
Somalia Joint Multi-Cluster Needs Assessment, November 2019
both have estimated populations over 1 million as of 2014. The regions of Banadir, Galgaduud, Gedo, Middle and Lower Shabelle, Mudug, and Hiraan also host the highest proportions of displaced households relative to other regions, indicating that the overall needs of displaced households, and by extension households living in IDP settlements, are higher in terms of magnitude.76 The significant difference, or lack thereof, between groups has implications for the prioritisation and targeting of beneficiaries in the humanitarian response.
Areas with the highest severity scores The highest concentration of all households with a MSNI severity score of at least 3 are found in the South central and South west areas of the country, notably, in the districts of Garbahaareey (65%)77, Belet Xaawo (64%)77, Ceel Barde (46%)77, Xudur (44%), Afmadow (36%)77, Wanla Weyn (35%), Waajid (31%), Belet Weyne (31%), Hobyo (29%), Baardheere (29%), Baidoa (28%), Cadaado (27%), Badhaadhe (24%), Doolow (24%), Luuq (22%), Marka (21%), Ceel Waaq (20%), and Qoryooley (19%). In addition to the proportions of households with a severity score of at least 3, there is a tiny fraction of the population with an extreme level of needs (MSNI severity category 4) in the regions of Galgaduud (3%) and Bay (1%). Households with extreme MSNI severity scores are found in the districts of Cabudwaaq (4%), Cadaado (2%), Baidoa (1%), Ceel Waaq (1%), Hobyo (<1%), and Banadir (<1%).
Table 5: Proportion of households with a MSNI severity score of 4
District All households Households in
IDP settlements Households in
non-IDP settlements P-value
Cabudwaaq 3.81% 0% 3.90% 0.4
Cadaado 2.49% 6.25% 2.41% 0.58
Baidoa 1.40% 0% 1.19% <.01***
Ceel Waaq 1.30% 2.02% 1.30% 0.51
Hobyo 0.81% 0% 0.81% 0.35
Banadir 0.31% 0.43% 0.24% <.01***
Households in the districts of Banadir, Baidoa, Cabudwaaq, Cadaado, Ceel Waaq, and Hobyo have been identified as having an extreme level of needs. Given the context in the aforementioned districts, it is unsurprising that there are few significant differences between population groups. However, contrary to expectations, households in non-IDP settlements in Cadaado, Ceel Waaq, and Banadir, have more extreme needs relative to their homologues in IDP settlements. The only significant differences between groups are found in Baidoa and Banadir. Given the small effect size in differences between groups and the relatively small proportion of households with a MSNI score of 4, the significance of the test used to examine group differences should not be used to guide humanitarian response planning.
76 UNFPA. 2014. Op. cit., p.101-102 77 This data is not statistically representative and should be taken as indicative only.

38
Somalia Joint Multi-Cluster Needs Assessment, November 2019
Map 10: Proportion of households in non-IDP settlements with a MSNI severity score of 3 or higher
by district
The highest concentration of households in non-IDP settlements with a MSNI severity score of at least 3 are
located in the districts of Garbahaareey (64%)78, Belet
Xaawo (64%)78, Ceel Barde (46%)78, Xudur (44%), Wanla
Weyn (40%), and Afmadow (33%)78.
Map 11: Proportion of households in IDP settlements with a MSNI severity score of 3 or higher by district
The highest concentration of households in IDP settlements with a MSNI severity score of at least 3 are located in the districts of Baardheere (100%)79, Xudur (79%), Afmadow
(66%)78, Garbahaareey (65%)78, Hobyo (56%), Belet Xaawo
(50%)78, Ceel Waaq (50%), Baidoa (48%), Belet Weyne (47%), Ceel Afweyn (47%), Waajid (44%), Cadaado (42%), Ceel Barde (33%), Garoowe (30%), and Gaalkacyo (31%).
Primary drivers of high MSNI severity scores High MSNI severity scores are primarily driven by LSG scores of at least 3 in the FSL and WASH sectors, followed by the use of negative coping strategies (capacity gaps).80 Of the subset of all households with a MSNI severity score of at least 3, 77% have MSNI scores primarily driven by high LSG scores in FSL and/or WASH. Forty-four percent (44%) of households with a MSNI score of at least 3 have their scores driven primarily by LSG in WASH, while 29% have high MSNI scores due to LSG in FSL; 4% have severe or extreme MSNI scores due primarily to concomitant needs in both FSL and WASH. Of the remaining 24% of households with a MSNI score of at least 3, 20% have high severity scores due to their reliance on unsustainable or negative coping strategies, 2% have been severely impacted by the crisis and have a LSG severity score of at least 3 in either health, protection or shelter. Finally, 2% have severe LSG scores in at least two of the three sectors of health, protection, and shelter. By and large, at the national level, the primary drivers of high MSNI scores for households in IDP settlements and households in non-IDP settlements are fairly similar, with minor exceptions. A higher proportion of households in IDP settlements with a MSNI score of at least 3 have their score primarily driving by severe LSG scores in WASH, while severe LSG scores in FSL tend to be the primary driver of severe MSNI scores for a higher proportion of households in non-IDP settlements.81
78 This data is not statistically representative and should be taken as indicative only. 79 This data is not statistically representative at the settlement level and should be taken as indicative only.
80 Refer to Annex 9 for an overview of the different components of the draft JIAF model. 81 Refer to Annex 10 for an overview of the estimation of the final MSNI score.

39
Somalia Joint Multi-Cluster Needs Assessment, November 2019
Figure 6: Primary drivers of MSNI score of at least 3 for all households
Figure 7: Primary drivers of MSNI score of at least 3 for
households in non-IDP settlements
Refer to Annex 14 for how to read a sun-burst diagram.
Figure 8: Primary drivers of MSNI score of at least 3 for
households in IDP settlements

40
Somalia Joint Multi-Cluster Needs Assessment, November 2019
Primary drivers of high MSNI severity scores by region Although WASH and FSL LSGs remain the main drivers of high MSNI severity scores across the majority of regions there are important variations in the contribution of primary drivers of high MSNI scores at the regional level. LSGs in WASH primarily drive the regional-level MSNI scores of at least 3, in 12 of 17 regions, followed by FSL, which primarily drive overall MSNI scores in 4 regions, and, finally by capacity gaps in 1 region. Low living standards in the WASH sector are the main driver of high MSNI scores in the majority of regions, and especially so in Lower Juba (for 79% of households with a MSNI score of at least 3), Bari (75%), Sanaag (71%), Bakool (64%), Gedo (64%), Sool (58%), Lower Shabelle (56%), Banadir (44%), Bay (43%), Nugaal (40%), Middle Shabelle (40%), and Hiraan (39%). Low living standards in the FSL sector and capacity gaps are often the secondary driver of high MSNI scores in the aforementioned regions. Low living standards in the FSL sector primarily drive the MSNI severity score in Togdheer (68%), Galgaduud (59%), Woqooyi Galbeed (56%), and Awdal (44%), while high capacity gap scores are the primary driver for a high MSNI severity score in the region of Mudug (52%).
Primary drivers of high MSNI severity scores by population group and area The primary drivers of MSNI scores of at least 3 are however quite different when disaggregated for households in IDP settlements and non-IDP settlements, with severe or extreme LSG in WASH, FSL, and severe or extreme capacity gaps affecting both groups in a differential manner. At least 30% of households in IDP settlements with a high MSNI score have their score primarily driven by needs in FSL (severe or extreme LSG in FSL) in the regions of Togdheer (90%), Woqooyi Galbeed (77%), Gedo (39%), and Galgaduud (30%), while those with high MSNI scores primarily driven by needs in WASH are found in Hiraan (91%), Lower Juba (79%), Bari (71%), Nugaal (70%), Lower Shabelle (52%), Sanaag (45%), Bakool (39%), Gedo (34%), Sool (33%), and Bay (31%). In comparison, high proportions of households in non-IDP settlements have their MSNI scores of at least 3 primarily driven by needs in FSL in the regions of Togdheer (57%), Woqooyi Galbeed (56%), Galgaduud (52%), Awdal (44%), Hiraan (40%), Middle Shabelle (38%), Sool (38%), and Nugaal (30%), while needs in WASH primarily drive severe or extreme MSNI scores in in Lower Juba (76%), Bari (74%), Sanaag (70%), Bakool (67%), Gedo (65%), Lower Shabelle (57%), Banadir (52%), Sool (51%), Bay (48%), Middle Shabelle (40%), Mudug (38%), Togdheer (38%), Nugaal (37%), Woqooyi Galbeed (33%), and Hiraan (32%). Moreover, co-occuring needs in both FSL and WASH are found to be the primary driver of high MSNI scores for high proportions of households in IDP settlements in the regions of Bay (58%), Sanaag (30%), Bari (27%), Lower Juba (19%), Bakool (15%), and Awdal (12%) while it is the case for lower proportions of households in non-IDP settlements in Hiraan (12%) and Mudug (12%). The top ten districts with high MSNI scores primarily driven by needs in FSL for all households include Wanla Weyn (30%), Belet Weyne (12%), Ceerigaabo (10%), Xudur (10%), Baidoa (10%), Waajid (9%), Ceel Barde (9%)82, Cadaado (9%), Luuq (9%), and Garbahaareey (7%).82 The districts of Garbahaarey (51%)82, Belet Xaawo (32%)82, Xudur (31%), Admadow (30%), Ceel Barde (29%), Baardheere (26%), Badhaadhe (24%), Hobyo (19%), Qoryooley (19%), and Belet Weyne (18%) are characterised by relatively high proportions of households with high MSNI scores primarily driven by needs in WASH. Notwithstanding the generally high levels of severe or extreme needs in WASH and FSL across population groups and regions, the contribution of high capacity gap scores towards a MSNI severity score of at least 3 indicates that a sizeable proportion of households maintain basic living standards through the use of harmful or unsustainable coping mechanisms. Severe or extreme capacity gap scores as a primary driver of high MSNI scores are similarly high for both households in IDP settlements and households in non-IDP settlements in the regions of Banadir (37% and 33%, respectively), Galgaduud (37% and 41%, respectively), and Gedo (27% and 21%, respectively). Higher proportions of households in IDP settlements are found to have high capacity gap scores compared to households in non-IDP settlements in the regions of Awdal (88% and 34%, respectively), Bakool (45% and 10%, respectively), Middle Shabelle (95% and 22%, respectively), Mudug (85% and 25%, respectively), and Sool (57% and 11%, respectively). Contrary to expectations, higher proportions of households in non-IDP settlements have high capacity gap scores relative to their counterparts in IDP settlements in the regions of Bari (27% compared to 3%), Bay (27% compared to 2%), Nugaal (30%
82 This data is not statistically representative and should be taken as indicative only.

41
Somalia Joint Multi-Cluster Needs Assessment, November 2019
compared to 11%), and Woqooyi Galbeed (11% compared to 0%). Refer to Annex 15 for an overview of the primary drivers of MSNI scores of at least 3 by population group and by region.

42
Somalia Joint Multi-Cluster Needs Assessment, November 2019
Co-occurring needs While severe or extreme MSNI scores may be driven independently by severity or extreme scores in LSG and CG, a minority of less than 10% of households at the national level have a severity score of at least 3 in both LSG and CG. Such households, which are characterised by both severe or extreme LSG and CG scores, are arguably more in need as they already have very low living standards and make increasing use of harmful or unsustainable coping strategies.
Table 6: Severity of co-occurring needs
Severity of co-occurring needs in Living Standard Gaps (LSG) and Capacity Gaps (CG)
No severe LSG AND
No severe CG
At least 1 severe CG
BUT No severe
LSG
At least 1 severe LSG
BUT No severe CG
At least 1 severe LSG
AND 1 severe CG
Households in IDP settlements 30% 2% 61% 6%
Households in non-IDP settlements 53% 1% 44% 2%
The results are however quite different at the district level. The top ten districts with the highest proportions of all households with co-occurring needs in LSG and CG (scores of at least 3) include Belet Xaawo (54%)83, Ceel Barde (14%)83, Garbahaarey (9%), Doolow (9%), Cabudwaaq (8%), Afmadow (8%)83, Cadaado (7%), Baydhaba (6%), Luuq (5%), and Waajid (5%). The highest proportions of households in IDP settlements with co-occuring needs in LSG and CG are found in Belet Xaawo (39%)83, Jowhar (23%), Cadaado (20%), Afmadow (19%)83, Ceel Waaq (16%), Baidoa (14%), and Gebiley (10%). The highest proportions of households in non-IDP settlements with co-occuring needs in LSG and CG are found in Belet Xaawo (55%)83, Xudur (14%), Doolow (13%), and Ceel Barde (12%).
Cluster-specific needs Severe or extreme MSNI scores reported thus far have been mainly driven by LSG in FSL and WASH; however, across individual clusters, the highest proportion of households have LSG severity scores in the areas of shelter and non-food items, and nutrition, with a higher proportion of households residing in IDP settlements found to have needs in the aforementioned clusters relative to households in non-IDP settlements.84
Figure 9: Proportion of households with sectoral LSG severity scores of at least 3, by population group
83 This data is not statistically representative and should be taken as indicative only. 84 Due to the steps in the decision-tree approach to estimating the MSNI, severe LSG scores in nutrition, or shelter and non-food items, drive the MSNI severity score only if they occur in conjunction with other clusters such as health, or protection.
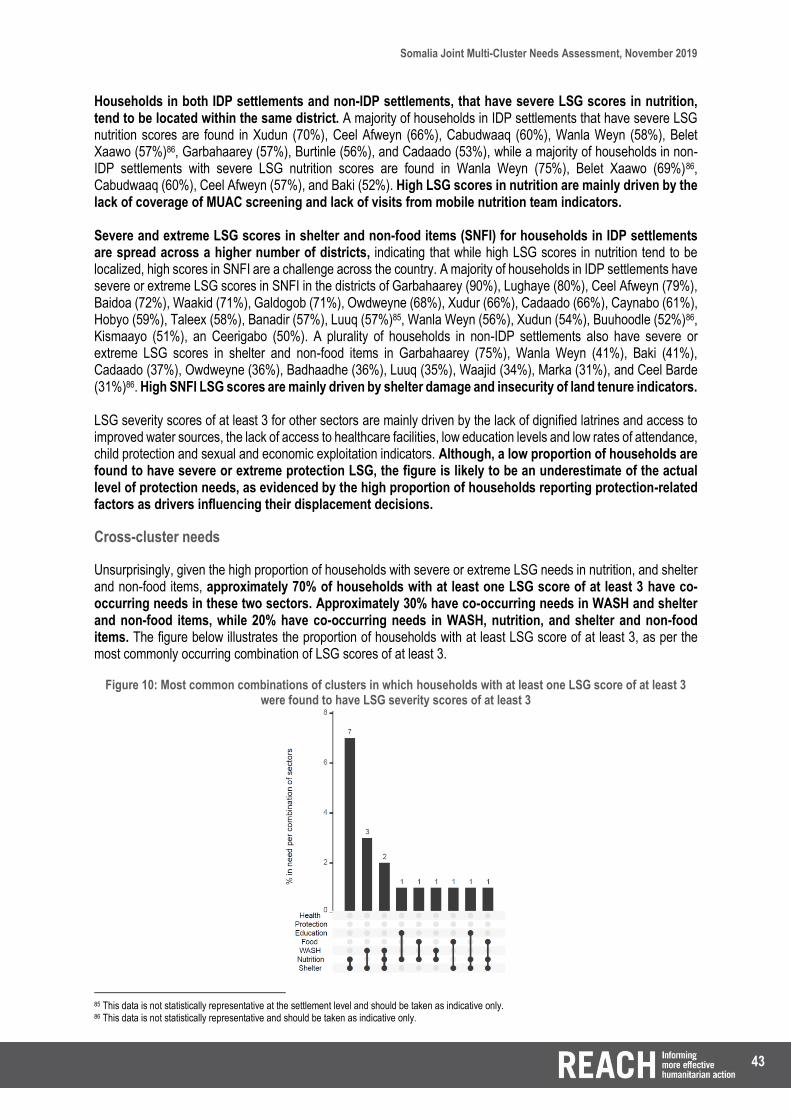
43
Somalia Joint Multi-Cluster Needs Assessment, November 2019
Households in both IDP settlements and non-IDP settlements, that have severe LSG scores in nutrition, tend to be located within the same district. A majority of households in IDP settlements that have severe LSG nutrition scores are found in Xudun (70%), Ceel Afweyn (66%), Cabudwaaq (60%), Wanla Weyn (58%), Belet Xaawo (57%)86, Garbahaarey (57%), Burtinle (56%), and Cadaado (53%), while a majority of households in non-IDP settlements with severe LSG nutrition scores are found in Wanla Weyn (75%), Belet Xaawo (69%)86, Cabudwaaq (60%), Ceel Afweyn (57%), and Baki (52%). High LSG scores in nutrition are mainly driven by the lack of coverage of MUAC screening and lack of visits from mobile nutrition team indicators. Severe and extreme LSG scores in shelter and non-food items (SNFI) for households in IDP settlements are spread across a higher number of districts, indicating that while high LSG scores in nutrition tend to be localized, high scores in SNFI are a challenge across the country. A majority of households in IDP settlements have severe or extreme LSG scores in SNFI in the districts of Garbahaarey (90%), Lughaye (80%), Ceel Afweyn (79%), Baidoa (72%), Waakid (71%), Galdogob (71%), Owdweyne (68%), Xudur (66%), Cadaado (66%), Caynabo (61%), Hobyo (59%), Taleex (58%), Banadir (57%), Luuq (57%)85, Wanla Weyn (56%), Xudun (54%), Buuhoodle (52%)86, Kismaayo (51%), an Ceerigabo (50%). A plurality of households in non-IDP settlements also have severe or extreme LSG scores in shelter and non-food items in Garbahaarey (75%), Wanla Weyn (41%), Baki (41%), Cadaado (37%), Owdweyne (36%), Badhaadhe (36%), Luuq (35%), Waajid (34%), Marka (31%), and Ceel Barde (31%)86. High SNFI LSG scores are mainly driven by shelter damage and insecurity of land tenure indicators. LSG severity scores of at least 3 for other sectors are mainly driven by the lack of dignified latrines and access to improved water sources, the lack of access to healthcare facilities, low education levels and low rates of attendance, child protection and sexual and economic exploitation indicators. Although, a low proportion of households are found to have severe or extreme protection LSG, the figure is likely to be an underestimate of the actual level of protection needs, as evidenced by the high proportion of households reporting protection-related factors as drivers influencing their displacement decisions.
Cross-cluster needs
Unsurprisingly, given the high proportion of households with severe or extreme LSG needs in nutrition, and shelter and non-food items, approximately 70% of households with at least one LSG score of at least 3 have co-occurring needs in these two sectors. Approximately 30% have co-occurring needs in WASH and shelter and non-food items, while 20% have co-occurring needs in WASH, nutrition, and shelter and non-food items. The figure below illustrates the proportion of households with at least LSG score of at least 3, as per the most commonly occurring combination of LSG scores of at least 3.
Figure 10: Most common combinations of clusters in which households with at least one LSG score of at least 3 were found to have LSG severity scores of at least 3
85 This data is not statistically representative at the settlement level and should be taken as indicative only. 86 This data is not statistically representative and should be taken as indicative only.
44
Somalia Joint Multi-Cluster Needs Assessment, November 2019
Forecasted Needs The JMCNA survey also included a limited number of questions designed to capture the potential evolution of needs in the months following the assessment. By including indicators that measure a household’s perception of their future access to goods and services, the JMCNA aims to provide an indication of the challenges that households anticipate facing. At the national level, an overwhelming majority of 76% all households anticipated difficulties in their ability to access financial savings or support from remittances over the year following data collection, with 12% not sure, and only a minority of 12% reporting confidence in their ability to access savings in the future. Although the results are significantly different for households in IDP settlements and households in non-IDP settlements, with the former including a higher proportion of households providing a negative response to the question, they remain high for both groups; 86% of households in IDP settlements anticipate difficulties in accessing savings or support from remittances compared to 75% of households in non-IDP settlements (p-value: <.01***). To further compound the situation, 42% of all households reported anticipating difficulties in their ability to service household debt over the year following data collection; with 57% of households in IDP settlements and 40% of households in non-IDP settlements reporting negative responses (p-value: <.01***). With respect to food security and livelihoods, of the 46% of households reporting owning land, 50% reported that they do not believe they would have sufficient grain for the next planting season, while of the 30% of households reporting owning livestock, 58% reported that they did not anticipate enough calves or kids to survive till the next year. The difference in negative responses found for households in IDP settlements (78%) relative to households in non-IDP settlements (56%) with respect to their forecast for the survival of livestock calves or kids until the next year is significant (p-value: <.01***) and indicates that households in IDP settlements may potentially be even more reliant on livelihood support over the next year. With respect to needs in shelter and non-food items, 31% of all households reported that they did not anticipate having access to their shelter over the winter season, while 49% of all households reported that they did not anticipate having access to enough blankets for the winter season. Unsurprisingly, households residing in IDP settlements anticipate greater difficulties in accessing their shelters (56%) or sufficient blankets (74%) for the winter season compared to households in non-IDP settlements anticipating difficulties in accessing their shelters (29%) or sufficient blankets (46%) (p-values: <.01***). These findings are further corroborated by the feedback received at the Hirshabelle Consultation Meeting, held by OCHA at Belet Weyne on the 12th of September 2019, where findings from FSNAU and JMCNA were presented, and participants highlighted the forecasted needs, as perceived by clusters, partners, and local implementing organisations. In particular, participants anticipated continued disruption to humanitarian assistance and previous gains due to droughts, floods, and conflict. Emphasis was placed on the shortage of access to food, and the continued importance of general food distribution, food vouchers, and unconditional cash transfers, as important response mechanisms. Furthermore, discussions specific to the region of Hiraan, highlighted the continued importance of WASH, shelter and non-food items, and protection activities and programmes, as the region is particularly affected by riverine and flash floods.

45
Somalia Joint Multi-Cluster Needs Assessment, November 2019
Accountability to affected populations Seven questions on Accountability to Affected Populations (AAP) were included in the JMCNA, with three questions specifically focusing on community consultation and satisfaction regarding water and sanitation facilities. The remaining four, relating to humanitarian aid, sought to gather data on information awareness, awareness of grievance mechanisms, negative consequences of aid distribution and the main concerns facing a household in accessing aid. At first glance, the JMCNA results paint a bleak picture of the inclusion of AAP components in the humanitarian response in Somalia. Together, all AAP-related results indicate that the lack of information is a crucial barrier. At the national level, only 11% of all households report having been contacted by humanitarian workers regarding the type of aid needed in the 3 months prior to data collection. The lack of information amongst households is further made evident by 80% of all households reporting no awareness of feedback or grievance mechanisms, which is particularly important for the distribution of aid which is targeted towards beneficiaries residing in IDP settlements. Moreover, at least a tenth of all households reported negative outcomes in their community due to humanitarian aid. While the findings differ by a few percentage points for each population group, the differences are not significant.
Table 7: Proportion of responses, by type, for select AAP indicators
Proportion of responses for households reporting…
Indicator
…being contacted by humanitarian workers
regarding the type of aid needed in the three months prior to data
collection
…being aware of any procedures or mechanisms
to make complaints or provide feed-back
regarding any humanitarian assistance
…feeling that humanitarian assistance has led to negative outcomes in their community
(for example unequal distribution of aid, disputes,
violence or insecurity)
Response options Yes No DNK Yes No DNK Yes No DNK All households 11% 84% 5% 13% 80% 7% 13% 77% 10% Households in
IDP settlements 13% 81% 6% 14% 76% 10% 11% 75% 14%
Households in non-IDP settlements
11% 84% 5% 12% 81% 7% 13% 77% 10%
However, the JMCNA AAP results are more informative at the geographical level. The regions and districts with the highest proportion of households reporting having been contacted by humanitarian workers in the three months preceding data collection are also the regions and districts characterised by relatively severe levels of needs. Areas reporting higher positive responses include the regions of Hiraan (37%), Bay (23%), and Bakool (20%), and the districts of Lughaye (57%), Ceel Waaq (51%), Eyl (39%), Belet Weyne (37%), Hobyo (33%), and Buur Hakaba (32%). Similarly, the regions of Hiraan (29%), Bay (26%), Togdheer (21%), and Bakool (20%), and the districts of Qoryooley (42%), Lughaye (40%), Ceel Waaq (39%), Buur Hakaba (37%), Doolow (33%), Eyl (31%), Berbera (31%), and Hobyo (30%), had the highest proportions of households reporting awareness of feedback and complaint mechanisms. In contrast, a large proportion of households reported perceiving the negative outcomes of humanitarian aid. In particular, a high proportion of respondents reported negative outcomes resulting from humanitarian aid in the regions of Lower Shabelle (34%), Hiraan (34%), Bay (20%), Lower Juba (16%), Sanaag (15%), and Bari (15%), and in the districts of Qoryooley (52%), Afgooye (47%), Buur Hakaba (43%), Belet Weyne (33%), Gebiley (30%), Marka (30%), Kismaayo (29%), Berbera (28%), Hobyo (25%), Jariiban (24%), and Ceel Afweyn (22%). The most commonly reported barrier to access to humanitarian aid corroborates the importance of information, with 76% of all households reporting insufficient information to access humanitarian aid. Physical constraints, such as the inability to reach centres of humanitarian aid distribution was reported as the second most common barrier at 22%, followed by security concerns on route to points of aid distribution (7%), security concerns at points of aid distribution (4%), and exclusion by gate-keepers (2%). Physical and security constraints on access are more commonly reported across the central and southern areas of the country.
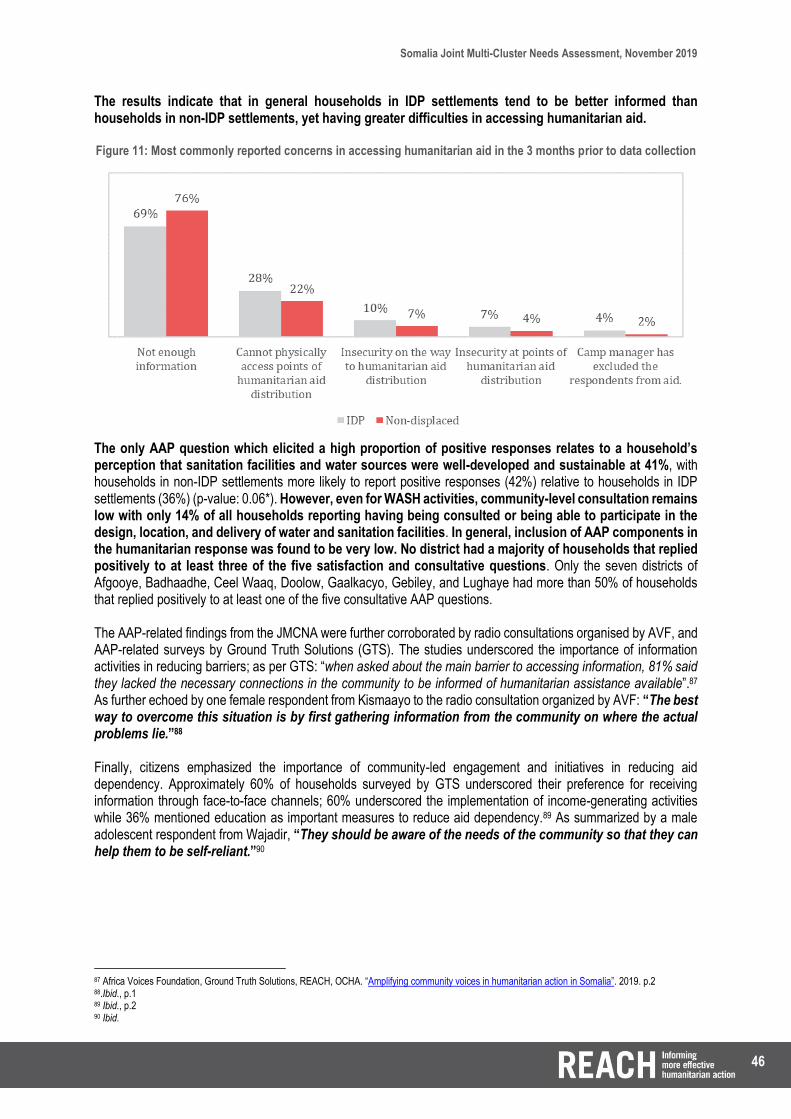
46
Somalia Joint Multi-Cluster Needs Assessment, November 2019
The results indicate that in general households in IDP settlements tend to be better informed than households in non-IDP settlements, yet having greater difficulties in accessing humanitarian aid. Figure 11: Most commonly reported concerns in accessing humanitarian aid in the 3 months prior to data collection
The only AAP question which elicited a high proportion of positive responses relates to a household’s perception that sanitation facilities and water sources were well-developed and sustainable at 41%, with households in non-IDP settlements more likely to report positive responses (42%) relative to households in IDP settlements (36%) (p-value: 0.06*). However, even for WASH activities, community-level consultation remains low with only 14% of all households reporting having being consulted or being able to participate in the design, location, and delivery of water and sanitation facilities. In general, inclusion of AAP components in the humanitarian response was found to be very low. No district had a majority of households that replied positively to at least three of the five satisfaction and consultative questions. Only the seven districts of Afgooye, Badhaadhe, Ceel Waaq, Doolow, Gaalkacyo, Gebiley, and Lughaye had more than 50% of households that replied positively to at least one of the five consultative AAP questions. The AAP-related findings from the JMCNA were further corroborated by radio consultations organised by AVF, and AAP-related surveys by Ground Truth Solutions (GTS). The studies underscored the importance of information activities in reducing barriers; as per GTS: “when asked about the main barrier to accessing information, 81% said they lacked the necessary connections in the community to be informed of humanitarian assistance available”.87 As further echoed by one female respondent from Kismaayo to the radio consultation organized by AVF: “The best way to overcome this situation is by first gathering information from the community on where the actual problems lie.”88 Finally, citizens emphasized the importance of community-led engagement and initiatives in reducing aid dependency. Approximately 60% of households surveyed by GTS underscored their preference for receiving information through face-to-face channels; 60% underscored the implementation of income-generating activities while 36% mentioned education as important measures to reduce aid dependency.89 As summarized by a male adolescent respondent from Wajadir, “They should be aware of the needs of the community so that they can help them to be self-reliant.”90
87 Africa Voices Foundation, Ground Truth Solutions, REACH, OCHA. “Amplifying community voices in humanitarian action in Somalia”. 2019. p.2 88.Ibid., p.1 89 Ibid., p.2 90 Ibid.
47
Somalia Joint Multi-Cluster Needs Assessment, November 2019
CONCLUSION The main objective of the JMCNA is to inform the HNO and HRP processes in the context of the ongoing drought and displacement crises in Somalia by providing an updated, nation-wide, district-level, multi-sectoral analysis of the severity of current and forecasted needs across crisis-affected populations. The results of the 2019 JMCNA highlight the extent and severity of population needs, as well as the drivers of needs, and contextual factors which either contribute to, or alleviate, the burden of needs of households. Both primary and secondary data, collected through the JMCNA, and operationalised by means of the draft JIAF, indicate that fragile political and legal institutions, wide socio-economic inequalities, poor infrastructure, and continuous environmental shocks lower the living standards of a large proportion of the population. The generally low prevalence of adequate living standards, and the reliance on harmful or unsustainable coping strategies, leave households susceptible to shocks which further erodes the potential of livelihood sources, and means to long-term recovery and self-reliance. Although a minimal impact of the crisis was reported by a large proportion of households (1% of households in impact severity category 3), nearly a quarter of (22%) of all households were found to have a severe pre-existing vulnerability score. The results indicate that a substantial proportion of households have long-term characteristics which reduce their levels of self-reliance and increase their exposure to the potential impact of natural and anthropogenic crises. The vast majority of households in Somalia have some level of need (MSNI of 2 or above). A tiny fraction, of less than 1% of households, were found to have a MSNI score of 4 (extreme), with 12% characterised by a MSNI score of 3 (severe), while the majority of 76% of households were found to be living with a MSNI score of 2 (stressed). In particular, there is a higher proportion of households residing in IDP settlements with severe multi-cluster needs compared to households in non-IDP settlements, with 27% of those in IDP settlements having a MSNI severity score of 3 compared to 12% of households in non-IDP settlements. The highest proportions of households with a MSNI severity score of at least 3 were found in areas which tend to be characterised by increased levels of insecurity and restricted access for humanitarian actors, such as Bakool (43%), Gedo (31%), Hiraan (31%), Bay (27%), and Lower Juba (26%). Households with an extreme level of severity of needs (MSNI 4) were found in the districts of Cabudwaaq (4%), Cadaado (2%), Baidoa (1%), Ceel Waaq (1%), Hobyo (1%), and Banadir (<1%). Across the board, severe and extreme MSNI scores were driven primarily by LSG in FSL, and WASH. Of households with a MSNI of at least 3, 77% had a severe or extreme LSG score in either FSL or WASH. A further 12% had their MSNI scores primarily driven by capacity gap scores of at least 3, indicating that at least a tenth of households with severe multi-sectoral needs resorted to some harmful or unsustainable coping mechanisms. Notwithstanding the multi-cluster focus of the MSNI, a large proportion of households were also found to have severe LSG in nutrition, and shelter and non-food items. Finally, a small fraction of households was found in a very precarious position of inadequate living standards and reliance on negative coping mechanisms; at least 6% of households in IDP settlements and 2% of households in non-IDP settlements were found to be living with severe or extreme LSG score in at least one sector and severe or extreme CG. Given the contextual factors, prevalence of vulnerability to shocks, and drivers of current household needs, focus should be given to FSL and WASH as the primary drivers of high MSNI amongst both population groups. The humanitarian response should also be prepared for external factors which may impact these drivers of needs, such as cyclical periods of drought and flooding, as well as influence displacement decisions. Moreover, JMCNA data also suggests that the humanitarian response should be strengthened with a focus on the development of durable solutions, with a particular focus given to those areas with highest levels of need and reported barriers in accessing assistance, namely south west Somalia. Finally, the JMCNA results underscore the importance of information and community-led engagement in AAP initiatives. By working with humanitarian actors across Somalia, REACH will continue to support an evidence-based response.
48
Somalia Joint Multi-Cluster Needs Assessment, November 2019
BIBLIOGRAPHY
Armed Conflict Location and Event Data Project. Data Export Tool. https://www.acleddata.com/data/
Africa Voices Foundation, Ground Truth Solutions, REACH, OCHA. “Amplifying community voices in humanitarian action in Somalia”. 2019. https://reliefweb.int/sites/reliefweb.int/files/resources/Amplifying%20community%20voices%20as%20part%20of%20humanitarian%20action%20in%20Somalia.pdf
CCCM Cluster Somalia, REACH. “Detailed Site Assessment: IDP Site Master List”. 2019
European Union, Federal Government of Somalia, United Nations, World Bank Group. “Somalia Drought Impact and Needs Assessment – Volume I”. April 2018. https://www.undp.org/content/undp/en/home/librarypage/climate-and-disaster-resilience-/somalia-drought-impact-and-needs-assessment.html
Famine Early Warning Systems Network, Food Security Nutrition and Analysis Unit - Somalia. “Somalia Food Security Alert: Heavy Gu rainfall leads to widespread flooding”. 11 May 2018. http://www.fsnau.org/downloads/SOMALIA-Alert-05112018.pdf
Famine Early Warning Systems Network, Food Security Nutrition and Analysis Unit - Somalia. “Somalia 2019 Post-Gu FSNAU FEWS-NET Technical Release”. 02 September 2019. www.fsnau.org/downloads/Somalia-2019-Post-Gu-FSNAU-FEWS-NET-Technical-Release.pdf
Famine Early Warning Systems Network, Food Security Nutrition and Analysis Unit - Somalia. “Somalia Food Security Alert: Heavy Gu rainfall leads to widespread flooding.” 11.05.2018. http://www.fsnau.org/downloads/SOMALIA-Alert-05112018.pdf
Food and Agriculture Organisation, Food Security Nutrition and Analysis Unit. “Food Security & Nutrition: Quarterly Brief – Focus on Gu 2019 Season Early Warning”. 29.04.2019. www.fsnau.org/downloads/FSNAU-Food-Security-Quarterly-Brief-April-2019.pdf
Food and Agriculture Organisation, Somalia Water and Land Information Management. “Somalia Floods Update”. 18 October 2019. http://www.faoswalim.org/resources/site_files/SOMALIA%20FLOODS%20UPDATE%2018102019.pdf
Office of the Coordination of Humanitarian Affairs. “2019 Somalia Humanitarian Needs Overview”. November 2018. https://reliefweb.int/sites/reliefweb.int/files/resources/Somalia_2019_HNO.PDF
Office of the Coordination of Humanitarian Affairs. “Dry conditions worsen as Gu’ rains delayed”. 14 April 2019. https://reliefweb.int/sites/reliefweb.int/files/resources/20190414_Humanitarian%20Snapshot.pdf
Office of the Coordination of Humanitarian Affairs. “Failed Gu’ rains push Somalia into severe drought”. 09 May 2019. https://reliefweb.int/sites/reliefweb.int/files/resources/20190509_humanitarian_snapshot.pdf
Office of the Coordination of Humanitarian Affairs. “Somalia Humanitarian Bulletin 5 – 31 July 2018”. July 2018. https://www.humanitarianresponse.info/sites/www.humanitarianresponse.info/files/documents/files/humanitarian_bulletin_31_july_2018.pdf
Office of the Coordination of Humanitarian Affairs. “Somalia Humanitarian Bulletin 1 – 31 August 2019”. August 2019. https://reliefweb.int/sites/reliefweb.int/files/resources/August%202019%20Humanitarian%20Bulletin-Final%20JB.pdf

49
Somalia Joint Multi-Cluster Needs Assessment, November 2019
Office of the Coordination of Humanitarian Affairs. “OCHA Somalia Flash Update #1 Humanitarian impact of flooding”. 21 October 2019. https://reliefweb.int/report/somalia/ocha-somalia-flash-update-1-humanitarian-impact-flooding-21-october-2019
Office of the Coordination of Humanitarian Affairs. “OCHA Somalia Flash Update #2 Humanitarian impact of flooding”. 28 October 2019. https://reliefweb.int/report/somalia/ocha-somalia-flash-update-2-humanitarian-impact-flooding-28-october-2019-enso
Office of the Coordination of Humanitarian Affairs. “OCHA Somalia Flash Update #4 Humanitarian impact of flooding”. 06 November 2019. https://reliefweb.int/report/somalia/ocha-somalia-flash-update-4-humanitarian-impact-flooding-6-november-2019
Oxford Poverty and Human Development Initiative. “Somalia Country Briefing”, Multidimensional Poverty Index Data Bank. OPHI, University of Oxford. 2017. https://ophi.org.uk/multidimensional-poverty-index/mpi-country-briefings/
REACH. “Somalia Country Reference Map”. 2016. https://www.impact-repository.org/document/reach/1673cd30/reach_som_map_idp_somalia_refrence_map_0_portrait_en_compressed_0.pdf
Somalia Water and Land Information Management. “Analysis of the General Climatic Conditions of Somalia in Support of Drought Monitoring. Project Report No. W-14”. June 2009. http://frrims.faoswalim.org/assets/downloads/W-14%20Analysis%20of%20General%20Climatic%20Conditions%20in%20Somalia%20in%20Support%20of%20Drought%20Monitoring.pdf
Somalia Water and Land Information Management. “Hydraulic Behaviour of the Juba and Shabelle Rivers. Basic Analysis for Irrigation and Flood Management Purposes”. Support to the Sustainable Management of the Shebelle and Juba Rivers in Southern Somalia Project (GCP/SOM/047/EC). Technical Report No W-13. August 2009. http://frrims.faoswalim.org/assets/downloads/W-13%20Hydraulic%20Behaviour%20of%20the%20Juba%20and%20Shabelle%20Rivers.pdf
United Nations Population Fund. “Population Estimation Survey 2014 for the 18 Pre-War Regions of Somalia”. October 2014. https://somalia.unfpa.org/sites/default/files/pub-pdf/Population-Estimation-Survey-of-Somalia-PESS-2013-2014.pdf
United Nations Development Programme. “Climate Change Adaptation: Somalia”. https://www.adaptation-undp.org/explore/eastern-africa/somalia
United States Geological Survey, Famine Early Warning Systems Network. Data Portals: Seasonal ET Anomaly May-Sep (long cycle, Ethiopia). https://earlywarning.usgs.gov/fews/search/Africa/East%20Africa
Wilhite, Donald and Glantz, Michael. "Understanding the Drought Phenomenon: The Role of Definitions". Drought Mitigation Center Faculty Publications. Paper 20. 1985. http://digitalcommons.unl.edu/droughtfacpub/20
WorldPop. “Somalia 100m Population, Version 2”. University of Southampton. 2017. https://www.worldpop.org/doi/10.5258/SOTON/WP00534
World Health Organisation. “World Report on Disability”. 2011. https://www.refworld.org/pdfid/50854a322.pdf

50
Somalia Joint Multi-Cluster Needs Assessment, November 2019
ANNEXES
Annex 1: Links to documentation and data All published JMCNA 2019 documents: https://www.reachresourcecentre.info/country/somalia/cycle/709/#cycle-709 JMCNA 2019 Terms of Reference: https://www.impact-repository.org/document/reach/4261bcc5/unnamed-file-1.pdf JMCNA 2019 Dataset (excluding food security indicators; full dataset available upon request): https://www.impact-repository.org/document/reach/810d7d57/reach_som_jmcna_iii_dataset_july_2019_edited.xlsx JMCNA 2019 Data Dashboard: https://reach-info.org/som/msna/ JMCNA 2019 Brief: https://www.impact-repository.org/document/reach/385f37f1/REACH_SOM_Brief_JMCNA_December2019.pdf JMCNA 2019 National Factsheet: https://www.impact-repository.org/document/reach/83db465d/REACH_SOM_Factsheet_JMCNA_August-2019.pdf JMCNA 2019 Regional Factsheet – Awdal: https://www.impact-repository.org/document/reach/282e58d1/reach_som_factsheet_Awdal_region_-August-2019.pdf JMCNA 2019 Regional Factsheet – Bakool: https://www.impact-repository.org/document/reach/acc5140b/reach_som_factsheet_Bakool_region_-August-2019.pdf JMCNA 2019 Regional Factsheet – Banadir: https://www.impact-repository.org/document/reach/2e61be4d/reach_som_factsheet_Banadir_region_-August-2019.pdf JMCNA 2019 Regional Factsheet – Bari: https://www.impact-repository.org/document/reach/6733618e/reach_som_factsheet_Bari_region_- August-2019.pdf JMCNA 2019 Regional Factsheet – Bay: https://www.impact-repository.org/document/reach/947c1c45/reach_som_factsheet_Bay_region_-August-2019.pdf JMCNA 2019 Regional Factsheet – Galgaduud: https://www.impact-repository.org/document/reach/50c83d93/reach_som_factsheet_Galgaduud_region_-August-2019.pdf JMCNA 2019 Regional Factsheet – Gedo: https://www.impact-repository.org/document/reach/76987314/reach_som_factsheet_Gedo_region_-August-2019.pdf JMCNA 2019 Regional Factsheet – Hiraan: https://www.impact-repository.org/document/reach/9ca17638/reach_som_factsheet_Hiraan_region_-August-2019.pdf JMCNA 2019 Regional Factsheet – Lower Juba: https://www.impact-repository.org/document/reach/2e071a92/reach_som_factsheet_Lower-Jubba_region_-August-2019.pdf JMCNA 2019 Regional Factsheet – Lower Shabelle: https://www.impact-repository.org/document/reach/e1f2db99/reach_som_factsheet_Lower-Shabelle_region_-August-2019.pdf JMCNA 2019 Regional Factsheet – Middle Shabelle: https://www.impact-repository.org/document/reach/56c95692/reach_som_factsheet_Middle-Shabelle_region_-August-2019.pdf JMCNA 2019 Regional Factsheet – Mudug: https://www.impact-repository.org/document/reach/036b68b9/reach_som_factsheet_Mudug_region_-August-2019.pdf

51
Somalia Joint Multi-Cluster Needs Assessment, November 2019
JMCNA 2019 Regional Factsheet – Nugaal: https://www.impact-repository.org/document/reach/795a692b/reach_som_factsheet_Nugaal_region_-August-2019.pdf JMCNA 2019 Regional Factsheet – Sanaag: https://www.impact-repository.org/document/reach/dc309b17/reach_som_factsheet_Sanaag_region_-August-2019.pdf JMCNA 2019 Regional Factsheet – Sool: https://www.impact-repository.org/document/reach/f3075cfa/reach_som_factsheet_Sool_region_-August-2019.pdf JMCNA 2019 Regional Factsheet – Togdheer: https://www.impact-repository.org/document/reach/488bfb32/reach_som_factsheet_Togdheer_region_-August-2019.pdf JMCNA 2019 Regional Factsheet – Woqooyi Galbeed: https://www.impact-repository.org/document/reach/399b862c/reach_som_factsheet_Waqooyi-Galbeed_region_-August-2019.pdf JMCNA 2018 data and publications: https://www.reachresourcecentre.info/country/somalia/cycle/1193/#cycle-1193 JMCNA 2017 data and publications: https://www.reachresourcecentre.info/country/somalia/cycle/1184/#cycle-1184

52
Somalia Joint Multi-Cluster Needs Assessment, November 2019
Annex 2: Assessed settlements
District Site Name Strata Number of Surveys Population
Abdulaziz Alxigma Displaced 6 21
Afgooye Warmahan Non-displaced 6 158
Afgooye Sabiid Non-displaced 2 269
Afgooye Deefow Non-displaced 1 31
Afgooye Baalgure Non-displaced 13 2245
Afgooye Raqeyle Non-displaced 6 127
Afgooye Lafoole Non-displaced 30 6876
Afgooye Carbiska Non-displaced 6 1398
Afgooye Wakaaladda Biyaha Non-displaced 39 9159
Afgooye Siinka Dheer Non-displaced 13 3664
Afgooye Jaanle Displaced 1 115
Afgooye Camp Buundo3 Displaced 6 75
Afgooye Tofiq Displaced 6 80
Afgooye Caro Displaced 6 55
Afgooye Alfaraj Displaced 12 274
Afgooye Ayle Camp Displaced 6 108
Afgooye Caanoole Displaced 6 26
Afgooye Hawo Tako Laanta 1Aad Displaced 12 200
Afgooye Hawo Tako Laanta 3Aad Displaced 18 300
Afgooye Baqdad Displaced 6 70
Afgooye Camp Jabad Geele Displaced 6 130
Afgooye Alnacim Displaced 6 50
Afgooye Ukurow Displaced 6 65
Afgooye Gadisow Displaced 12 37
Afgooye Kaamka Dugsi Sare Displaced 6 150
Afmadow Golel Non-displaced 3 985
Afmadow Dhobley Non-displaced 14 2500
Afmadow Rama Guda Non-displaced 6 370
Afmadow Cadi Non-displaced 3 221
Afmadow Afmadow Non-displaced 46 10208
Afmadow Barquuqe Non-displaced 1 258
Afmadow Xayo Non-displaced 1 50
Afmadow Danwadaag Non-displaced 1 40
Afmadow Buulo Kutur Displaced 4 25
Afmadow Fanole Displaced 12 50
Afmadow Kaxda Nabada Displaced 36 400
Afmadow Waamo Displaced 6 80
Afmadow Camaron Displaced 6 40
Afmadow Camp Ajuuran Displaced 6 200
Afmadow Camp Buale Displaced 6 60
Afmadow Camp Hargeys Displaced 12 200
Afmadow Camp Nasib Displaced 6 20
Afmadow Ceel Dhiig Displaced 6 20
Afmadow Danwadaag Displaced 36 550
Baardheere Sarinleey Non-displaced 7 8794
Baardheere Buulo Asharaaf Non-displaced 2 820
Baardheere Buulo Leysaan Non-displaced 9 5618

53
Somalia Joint Multi-Cluster Needs Assessment, November 2019
Baardheere Buulo Garas Non-displaced 4 4166
Baardheere Wadajir Non-displaced 44 22241
Baardheere Baardheere Non-displaced 8 7762
Baardheere Buulo Kurmaan Non-displaced 2 2707
Baardheere Buulo Gaduud Non-displaced 1 483
Baardheere Horsed Comp Displaced 14 120
Badhaadhe Qandal Non-displaced 26 50
Badhan Midigale Non-displaced 11 48
Badhan Cawsane Non-displaced 13 96
Badhan Dhabar Dalool Non-displaced 7 48
Badhan Haylaan Non-displaced 6 47
Badhan Hiil Buraan Non-displaced 11 51
Badhan Habar Shiro Non-displaced 7 47
Badhan Kaladhac Non-displaced 13 91
Badhan Dildishi IDP Camp Displaced 12 64
Badhan Cashuur IDP Camp Displaced 3 53
Badhan Bilcil IDP Camp Displaced 28 70
Badhan Xadhka-Dheere Displaced 3 80
Badhan Gumar IDP Displaced 7 300
Badhan Ceel-Laheley Displaced 1 40
Badhan Gebidher Displaced 4 70
Baidoa Laanta 5A Non-displaced 1 20
Baidoa Laanta 3A Non-displaced 3 20
Baidoa Baidoa Non-displaced 86 137470
Baidoa Wadajir-3 Displaced 6 95
Baidoa Riikoy Displaced 6 187
Baidoa Idaale-1 Displaced 6 411
Baidoa Eesow Displaced 6 200
Baidoa Sagam Displaced 6 176
Baidoa Tawsi Kaar Displaced 6 95
Baidoa Alla-Amin Displaced 6 185
Baidoa Hafata Displaced 6 163
Baidoa Hilaac-2 Displaced 6 67
Baidoa Yarabi Displaced 6 150
Baidoa Jeelow Displaced 6 180
Baidoa Iskari-2 Displaced 6 61
Baidoa Dini Iyo Doon Displaced 6 120
Baidoa Burey Manas Displaced 6 50
Baidoa Tagal Displaced 6 140
Baidoa Hanano-2 Displaced 6 586
Baidoa Sooraan Displaced 6 150
Baki Carawayne Non-displaced 24 2854
Baki Xoorrey Non-displaced 24 1965
Baki Baki Non-displaced 12 3144
Baki Beeyo Kulul Non-displaced 12 526
Baki Dacawaley Non-displaced 6 83
Baki Qoton Qardhiile Non-displaced 18 1098
Baki Ruqi Non-displaced 6 536
Baki Abokor-Caddaawe Non-displaced 6 1038
Baki Old Baki Non-displaced 24 1764

54
Somalia Joint Multi-Cluster Needs Assessment, November 2019
Baki Besareh Non-displaced 12 1169
Balcad Gololey Non-displaced 2 1971
Balcad Balcad Non-displaced 17 1971
Balcad Cabdule-Cadde Non-displaced 1 1971
Balcad Halgan Non-displaced 12 1971
Balcad Buulo-Feermo Non-displaced 8 1971
Balcad Bananey Non-displaced 3 1971
Balcad Faarax-Gololey Non-displaced 3 883
Balcad Mareerey Non-displaced 4 1750
Balcad Kurshaale Non-displaced 6 1132
Balcad Muuryaale Non-displaced 1 92
Balcad Caro-Faag Non-displaced 1 1006
Balcad Garas-Bintow Non-displaced 2 1127
Balcad Caliyaalo Non-displaced 6 1774
Bandarbayla Biyo Gaduud Non-displaced 6 21
Bandarbayla Sarmaan Non-displaced 6 19
Bandarbayla Arris Non-displaced 12 19
Bandarbayla Bandarbayla Non-displaced 60 700
Bandarbayla Dhuudo Non-displaced 36 462
Bandarbayla Kulule Non-displaced 18 19
Bandarbayla Durdura Non-displaced 6 19
Bandarbayla Dhariinbaar Non-displaced 6 19
Bandarbayla Falfalax Non-displaced 1 19
Belet weyne Beletweyne Non-displaced 5 300
Belet weyne Bacad Non-displaced 6 350
Belet weyne Ilkacado Non-displaced 6 125
Belet weyne Qoqane Non-displaced 13 145
Belet weyne Koshin Non-displaced 48 2500
Belet weyne Hawo Tako Non-displaced 18 1850
Belet weyne Bundoweyn Non-displaced 24 2200
Belet weyne Howl-Wadag Non-displaced 24 2400
Belet weyne Guricade Non-displaced 6 189
Belet weyne Leebow Non-displaced 6 385
Belet weyne Badbaado Howlwadag Displaced 3 49
Belet weyne Bilisdiid Displaced 6 280
Belet weyne Buloqorah Displaced 6 337
Belet weyne Bulsho Displaced 6 300
Belet weyne Doomeey Displaced 6 575
Belet weyne Ex Airport 2 Displaced 12 281
Belet weyne Gurmad Iyo Gargar Displaced 12 333
Belet weyne Iftin Displaced 6 210
Belet weyne Jumbur Displaced 6 312
Belet weyne Midnimo Displaced 24 1235
Belet weyne Nasiib Displaced 6 922
Belet weyne Tawakal2 Displaced 6 284
Belet weyne Ugas Khaliif Displaced 1 120
Belet weyne Wadajir Koshin Displaced 6 200
Belet weyne Alla-Suge Displaced 6 83
Belet weyne Alla-Amin2 Displaced 6 170
Belet xaawo Oda1 Non-displaced 11 1765

55
Somalia Joint Multi-Cluster Needs Assessment, November 2019
Belet xaawo Malkaariyey Non-displaced 14 1982
Belet xaawo Beled Aamin Non-displaced 41 35
Belet xaawo Qansax Oomane Non-displaced 1 437
Belet xaawo Bulahawa Non-displaced 42 10018
Belet xaawo Qurac Ijaabo Non-displaced 7 76
Belet xaawo Oodan Non-displaced 3 70
Belet xaawo Carabo Non-displaced 5 109
Belet xaawo Bannaney Non-displaced 5 31
Belet xaawo Belet Xaawo Non-displaced 44 6943
Belet xaawo Lebi Raar Non-displaced 5 511
Belet xaawo Beled Amin Displaced 75 1270
Berbera Dara Godle Non-displaced 1 260
Berbera Xamaas Non-displaced 2 347
Berbera Laaso-Dawaco Non-displaced 1 337
Berbera Lafaruug Non-displaced 5 263
Berbera Eil Geradi Non-displaced 6 3666
Berbera Magab Non-displaced 2 3089
Berbera Berbera Non-displaced 50 44985
Berbera Jaama Laye Non-displaced 1 784
Berbera Beeyo-Dhaadheer Non-displaced 1 982
Berbera Burco Kibir Non-displaced 2 2011
Berbera Laas Ciidle Non-displaced 2 1405
Berbera Dhaymoole Non-displaced 3 2876
Berbera Shimbiraale Non-displaced 1 1232
Berbera Dalaw Non-displaced 3 954
Berbera Batalaale 1 Displaced 8 200
Berbera Batalaale 2 Displaced 23 300
Berbera Magaalo Cad Displaced 11 185
Berbera Jaamalaye Displaced 5 180
Berbera Xudhuunka Displaced 12 200
Berbera Barwaaqo Displaced 9 150
Berbera Control Ka Galbeedka Displaced 2 40
Berbera Xabaalo Tumalood Displaced 5 115
Boondheere Kaam Wasaradda Cafimadka Displaced 6 114
Boondheere Cloction Displaced 6 36
Borama Xariirad Non-displaced 6 5297
Borama Dhagaxa Madow Non-displaced 6 9843
Borama Ciye Non-displaced 6 168
Borama Cadaad Non-displaced 6 2532
Borama Cara-Garanug Non-displaced 6 1912
Borama Holhol Non-displaced 6 662
Borama Dunbuluq Non-displaced 6 6425
Borama Borama Non-displaced 90 115501
Borama Gubadka Non-displaced 6 427
Borama Goroyo-Cawl Non-displaced 6 3913
Borama Ah34 Xero Dhiigta Displaced 3 100
Borama U21 (Qoorgaab 2) Displaced 2 45
Borama Kaydka Biyaha Displaced 10 350
Borama Aa27 (Qoorgaab 1) Displaced 24 800
Borama Af32 Displaced 10 500

56
Somalia Joint Multi-Cluster Needs Assessment, November 2019
Borama Tukhantukhi Aa27 Displaced 4 95
Borama Sitee Xaddi,Ar44 Displaced 3 215
Borama Dunbuluq Ag33 Displaced 3 200
Borama Xaaslayda Displaced 8 200
Borama Magaalo Cad Displaced 1 73
Borama Boon Displaced 10 370
Bossaso Bossaso Non-displaced 71 32084
Bossaso Shilkow Displaced 6 300
Bossaso Banadir A Displaced 24 510
Bossaso Ajuuran A Displaced 6 300
Bossaso Tuurjaale IDP Displaced 12 410
Bossaso Tawakal IDP Displaced 24 1840
Bossaso Abow B Displaced 24 845
Bossaso Xadoole Displaced 6 500
Bossaso Raf Raaxo Displaced 6 820
Bossaso Farjano Displaced 12 580
Bossaso Absameb Displaced 6 500
Bossaso Gawraca IDP Displaced 6 350
Bossaso Xaafatu Carab IDP Displaced 1 287
Bossaso Suwayto IDP Displaced 3 470
Burco Ceel-Dhere Non-displaced 6 5253
Burco Burco Non-displaced 66 126568
Burco Dakhanyado Non-displaced 6 6713
Burco Beer Two Non-displaced 6 1321
Burco Xayira Non-displaced 6 2740
Burco Gaatama Non-displaced 6 1061
Burco Kiridh Non-displaced 6 10345
Burco Taallo-Buur Non-displaced 6 3428
Burco Dhoqoshay Non-displaced 12 19041
Burco Daryaleh Non-displaced 2 289
Burco Dhariyalay Non-displaced 6 869
Burco Balli Dhiig Non-displaced 6 3513
Burco Warabeye Displaced 1 60
Burco Koosaar Displaced 5 800
Burco 27 Ka May Displaced 3 365
Burco Aljazeera Displaced 9 1500
Burco Koosar B Displaced 3 900
Burco Guryo-Samo Displaced 5 950
Burco Barwaaqo Displaced 3 206
Burco Aadan Sale Ban (A) Displaced 21 4030
Burco Ali Xuseen IDP Displaced 19 2735
Burco Alla-Aamin IDP Displaced 5 600
Burco October Village Displaced 2 222
Burco Aqil Yare Displaced 3 600
Burtinle Burtinle Non-displaced 51 2571
Burtinle Jalam Non-displaced 8 531
Burtinle Balli Dacar Non-displaced 19 946
Burtinle Camp Ladan Displaced 16 199
Burtinle Camp Kalkaal1 Displaced 43 548
Burtinle Kalkaal2 Displaced 21 220

57
Somalia Joint Multi-Cluster Needs Assessment, November 2019
Buuhoodle Muraayada Non-displaced 3 274
Buuhoodle Qorilugud Non-displaced 18 3195
Buuhoodle Buuhoodle Non-displaced 27 5937
Buuhoodle Shangale Non-displaced 1 57
Buuhoodle Widhwidh Non-displaced 19 4162
Buuhoodle Geed Dheer Non-displaced 1 53
Buuhoodle Balli Dandan Non-displaced 1 54
Buuhoodle Shangalle Displaced 1 150
Buuhoodle Shangalle A Displaced 6 260
Buuhoodle Maroodi-Jeex Displaced 6 65
Buuhoodle Geed Xamarle Displaced 12 60
Buuhoodle Bali Hadhac IDP Displaced 18 500
Buuhoodle Shululux Displaced 12 330
Buuhoodle Dhabasaar IDP Displaced 18 400
Buuhoodle Ilma Dandan IDP Displaced 6 415
Buuhoodle Darasalam Displaced 6 140
Buuhoodle Gocondhale Displaced 6 200
Buuhoodle Badhaxley Displaced 12 400
Buur hakaba Buurey-Deerow Non-displaced 24 1481
Buur hakaba Daweeda Non-displaced 6 45
Buur hakaba Buur Hakaba Non-displaced 66 7877
Buur hakaba Masusoow Non-displaced 18 1428
Buur hakaba Abaawle (1) Non-displaced 6 395
Buur hakaba Dooye Shiidle Non-displaced 6 400
Buur hakaba Hagarow Non-displaced 12 293
Buur hakaba Barkatle Yarey Non-displaced 12 542
Buur hakaba Goley Wiine Non-displaced 6 102
Cabudwaaq Booso Non-displaced 1 93
Cabudwaaq Balli Cad Non-displaced 7 4724
Cabudwaaq Balanbal Non-displaced 5 4767
Cabudwaaq #N/A Non-displaced 63 141276
Cabudwaaq Garasle 1 Displaced 24 500
Cabudwaaq Garasle 2 Displaced 18 170
Cabudwaaq Xurfada 1 Displaced 6 60
Cabudwaaq Xurfada 2 Displaced 6 150
Cabudwaaq Wadajir 1 Displaced 18 400
Cabudwaaq Danwadaag Displaced 2 240
Cabudwaaq Baraka Yamayska Displaced 18 500
Cabudwaaq Landheer Displaced 24 450
Cabudwaaq Bali Giish Displaced 12 150
Cabudwaaq Jaqafaabir Displaced 6 400
Cabudwaaq Kulmiye Displaced 6 144
Cadaado Galinsoor Non-displaced 5 3894
Cadaado Biyo Gaduud Non-displaced 1 28
Cadaado Cadaado Non-displaced 66 34807
Cadaado Balli Angie Berdo Non-displaced 1 55
Cadaado Kulmiye Displaced 20 200
Cadaado Karama IDP/Camp Displaced 36 370
Cadaado Daryeel Displaced 23 300
Caynabo Hog-Mashruuca Non-displaced 1 70

58
Somalia Joint Multi-Cluster Needs Assessment, November 2019
Caynabo Wariiley Non-displaced 6 962
Caynabo Xurfada Non-displaced 12 1832
Caynabo Berkeda Cali Xirsi Non-displaced 18 2469
Caynabo Dhanaano Non-displaced 6 1067
Caynabo Qori Dheere Non-displaced 12 1299
Caynabo Fadhiyar Non-displaced 36 4717
Caynabo God Heeri Non-displaced 6 1809
Caynabo Wadaamagoo Non-displaced 12 2156
Caynabo Caynabo Non-displaced 36 7798
Caynabo Habari Heshay Non-displaced 6 175
Caynabo Caynabo IDPa Displaced 39 2538
Caynabo Aamuso Displaced 5 218
Caynabo Yamayska Displaced 5 250
Caynabo Madigaan Displaced 5 600
Caynabo Guumeys IDP Displaced 7 700
Caynabo Cunaaye Displaced 9 240
Caynabo Wadaamagoo Displaced 2 500
Caynabo Tiger Displaced 2 150
Caynabo Gawsa Wayne Displaced 2 150
Caynabo God Dhuub (A) Displaced 2 300
Ceel afweyn Dhuur Cilaan Non-displaced 2 167
Ceel afweyn Gudmo Biyo Cas Non-displaced 1 407
Ceel afweyn Barde Looxle Non-displaced 1 50
Ceel afweyn Bixin Non-displaced 2 25
Ceel afweyn Ceel Afweyn Non-displaced 39 17042
Ceel afweyn Ceelcade Non-displaced 6 3046
Ceel afweyn Fadhi Gaab Non-displaced 5 3794
Ceel afweyn Balan Baal Non-displaced 6 1945
Ceel afweyn Gar Adag Non-displaced 9 2133
Ceel afweyn Sincaro Non-displaced 9 4033
Ceel afweyn Ceelfiito Displaced 2 80
Ceel afweyn Karashar 1 Displaced 13 520
Ceel afweyn Karashar 2 Displaced 15 520
Ceel afweyn Balanbaal IDP Displaced 2 50
Ceel afweyn Wargumbi Displaced 3 72
Ceel afweyn Shinbiro Juujaa Displaced 11 500
Ceel afweyn Minja Maqarshe Displaced 9 350
Ceel afweyn Bardayaalciyaw Displaced 9 300
Ceel afweyn Kaamka Cismaan Cali Muuse Displaced 4 150
Ceel afweyn Daraylamood Displaced 7 200
Ceel barde Biyo Qabobe Non-displaced 1 15
Ceel barde Haluul Non-displaced 2 15
Ceel barde Higloley Non-displaced 2 15
Ceel barde Kheyro Haboon Non-displaced 2 15
Ceel barde Ceel Barde Non-displaced 68 11654
Ceel barde Hiirey Non-displaced 6 897
Ceel barde Danshood Displaced 21 211
Ceel barde Qorahey Displaced 41 315
Ceel barde Oondheere Displaced 15 75
Ceel waaq El Banda Non-displaced 2 640

59
Somalia Joint Multi-Cluster Needs Assessment, November 2019
Ceel waaq Ceel Waaq Non-displaced 77 17656
Ceel waaq Bardera IDP Displaced 17 20
Ceel waaq Gambia IDP Displaced 17 30
Ceerigaabo Dacawo Non-displaced 28 1500
Ceerigaabo Madar Moge Non-displaced 11 257
Ceerigaabo Haldhaagan Non-displaced 8 319
Ceerigaabo Xamaas Non-displaced 3 50
Ceerigaabo Karin Non-displaced 3 50
Ceerigaabo Jiidali Non-displaced 6 127
Ceerigaabo Xabow Non-displaced 9 1740
Ceerigaabo Ceel La Qoday Non-displaced 8 359
Ceerigaabo Ceerigaabo Non-displaced 41 6760
Ceerigaabo Goob Non-displaced 6 52
Ceerigaabo Dayaxa Non-displaced 6 177
Ceerigaabo Dagaar Non-displaced 6 27
Ceerigaabo Yufle Non-displaced 5 685
Ceerigaabo Fiqifuliye Non-displaced 12 202
Ceerigaabo Xin-Galool Non-displaced 22 3779
Ceerigaabo Xaafad Soomaal Displaced 15 400
Ceerigaabo Camp 3 Displaced 2 35
Ceerigaabo War-Idaad Displaced 20 400
Ceerigaabo Caaydhaha Displaced 2 15
Ceerigaabo Xamaas Displaced 12 400
Ceerigaabo Degbo Displaced 10 250
Daynile Daynile Non-displaced 79 46634
Daynile Nabad Iyo Nolol Displaced 6 1596
Daynile Xidig Displaced 1 888
Daynile Sahal Displaced 7 206
Daynile Aabeey Center Displaced 6 406
Daynile Nuurweyne Center Displaced 6 817
Daynile Ruuxanta Canter Displaced 12 2179
Daynile Ramaas Displaced 6 1652
Daynile Dankulan Center Displaced 6 533
Daynile Sagal,Ciid Center Displaced 6 663
Daynile Food Cade Displaced 6 533
Daynile Rabi Yasir Cdnter Displaced 6 227
Daynile Allesuge Center Displaced 6 675
Daynile Isgaashi Center Displaced 1 462
Daynile Balsaar Center Displaced 6 213
Daynile Wanaagsan Center Displaced 6 995
Daynile Mubaarak IDP Center Displaced 6 512
Daynile Garasbaley/Rowdo Camp Displaced 6 21
Daynile Shukran Camp Displaced 5 16
Daynile Caawiye Center Displaced 6 551
Daynile Tabaruuc Center Displaced 6 142
Daynile Qanciye Displaced 1 263
Daynile Garasbaaleey Maryamo Kaam Displaced 6 149
Dharkenley Dharkenley Non-displaced 79 39825
Dharkenley Camp Named By Afraad Xoosh Displaced 12 142
Dharkenley Koobad Displaced 12 568

60
Somalia Joint Multi-Cluster Needs Assessment, November 2019
Dharkenley N9 Displaced 12 220
Dharkenley Camp Named By Al-Raxma Displaced 6 107
Dharkenley Badbaado/Section Three Displaced 12 533
Dharkenley Section Six Displaced 6 495
Dharkenley Badbaado /Section One Displaced 18 497
Dharkenley Section 2 Displaced 6 534
Dharkenley Section 5 Displaced 18 500
Dharkenley Badbaado Section 4 Displaced 36 533
Dhuusamarreeb Dhuusamarreeb Non-displaced 72 72538
Dhuusamarreeb Horog Non-displaced 1 1054
Dhuusamarreeb Ceel Dheere Non-displaced 2 1379
Dhuusamarreeb Guri-Ceel Non-displaced 2 2428
Dhuusamarreeb Mareer Guur Non-displaced 1 2282
Dhuusamarreeb Ceel Xaamud Displaced 18 380
Dhuusamarreeb Landheer Displaced 5 120
Dhuusamarreeb Gargaar Displaced 4 200
Dhuusamarreeb Tuulaoog Displaced 2 30
Dhuusamarreeb Hanaano Displaced 48 838
Dhuusamarreeb Rajo Displaced 6 120
Doolow Doolow Non-displaced 28 7044
Doolow Buulo Qalooc Non-displaced 2 461
Doolow Barabaraay Non-displaced 1 122
Doolow Gubataay Non-displaced 1 549
Doolow Saadhuumaay Non-displaced 2 449
Doolow Sur Gaduud Non-displaced 1 89
Doolow Kabasa Displaced 56 5928
Doolow Qansahley Displaced 23 3956
Eyl Eyl Non-displaced 72 3998
Eyl Dhanaane Non-displaced 6 52
Eyl Baarweyn Non-displaced 12 49
Eyl Bandunbuto Non-displaced 6 48
Eyl Aftugweyne Non-displaced 6 304
Eyl Uusgure Non-displaced 12 143
Eyl Maraya Non-displaced 6 48
Eyl Dilin Mahato Non-displaced 6 121
Eyl Gabac Non-displaced 6 50
Eyl Ladega Non-displaced 6 47
Gaalkacyo Labo Warood Non-displaced 4 5198
Gaalkacyo Bacaadweyn Non-displaced 8 10675
Gaalkacyo Abaarey Non-displaced 2 405
Gaalkacyo Ceel-Berde Non-displaced 1 608
Gaalkacyo Gaalkacyo Non-displaced 65 62145
Gaalkacyo Taalo Cad 1 IDP Displaced 2 350
Gaalkacyo Buulo Bacley IDP Displaced 6 973
Gaalkacyo Tawakal Displaced 6 960
Gaalkacyo Halabooqad Displaced 6 1285
Gaalkacyo Madiino Displaced 6 580
Gaalkacyo Salaama1 Displaced 6 300
Gaalkacyo Samawade Displaced 6 320
Gaalkacyo Barwaaqo Displaced 6 272

61
Somalia Joint Multi-Cluster Needs Assessment, November 2019
Gaalkacyo Kulmiye Displaced 12 60
Gaalkacyo Waayo Arag IDP Displaced 6 887
Gaalkacyo New Donyaale Displaced 6 375
Gaalkacyo Margaago Displaced 6 1063
Gaalkacyo Cagaaran Displaced 12 1620
Gaalkacyo Mustaqbal 2 IDP Displaced 6 650
Gaalkacyo Mustaqbal 2B IDP Displaced 1 423
Gaalkacyo Afarta Kare IDP Displaced 12 120
Gaalkacyo Dagaari Non-displaced 1 1622
Gaalkacyo Bandiidley Non-displaced 4 1981
Gaalkacyo Sadax-Higlo Non-displaced 1 235
Gaalkacyo Gaalkacyos Non-displaced 64 62145
Gaalkacyo Burbisharo IDP Displaced 12 430
Gaalkacyo Bulla Juwan IDP Displaced 18 780
Gaalkacyo Arafat IDP Displaced 6 280
Gaalkacyo Hayan IDP Displaced 6 360
Gaalkacyo Bahsan IDP Displaced 6 380
Gaalkacyo Gargar IDP Displaced 1 90
Gaalkacyo Gass IDP Displaced 12 375
Gaalkacyo Bulla Noto & Bantu.1 IDP Displaced 6 480
Gaalkacyo Liiban & Bantu 2 Displaced 12 305
Gaalkacyo Mahaday & Isse/Al Nasiib Displaced 6 270
Gaalkacyo Daryel IDP Displaced 6 460
Gaalkacyo Qorahey IDP Displaced 6 270
Gaalkacyo Mudug IDP Displaced 6 760
Gaalkacyo Ceelgaab IDP Displaced 6 450
Gaalkacyo Doho Mudug IDP Displaced 6 300
Galdogob Bayra Non-displaced 7 3420
Galdogob Roox Non-displaced 13 6824
Galdogob Bursaalax Non-displaced 31 8248
Galdogob Galdogob Non-displaced 8 3342
Galdogob Gal Dhuumood Non-displaced 20 8147
Galdogob Danwadaag Displaced 16 480
Galdogob Allaale Displaced 20 450
Galdogob Waayo Arag Displaced 20 470
Galdogob Horseed IDP Displaced 22 440
Galdogob Salaama Displaced 5 130
Garbahaarey Qalwo Non-displaced 1 100
Garbahaarey Garboharey Non-displaced 76 21155
Garbahaarey Qadiidda Non-displaced 2 162
Garbahaarey #N/A Displaced 15 80
Garbahaarey Taftataag Displaced 35 120
Garbahaarey Xashiweer Displaced 14 80
Garowe Ceelbuux Non-displaced 2 206
Garowe Cuun Non-displaced 1 250
Garowe Sinujif Non-displaced 1 584
Garowe Kalabayr Non-displaced 23 3852
Garowe Reebanti Non-displaced 36 5426
Garowe Garowe Non-displaced 14 2176
Garowe Birta Dheer Non-displaced 1 32

62
Somalia Joint Multi-Cluster Needs Assessment, November 2019
Garowe Rabbaable Non-displaced 1 90
Garowe Camp Ajuuraan Displaced 6 688
Garowe Camp Jiingadda/Sandaqadaha Displaced 18 570
Garowe Jilab1 Displaced 12 657
Garowe Jilab2 Displaced 6 460
Garowe Camp Waabari Displaced 6 200
Garowe Hiiraan Camp Displaced 12 156
Garowe Camp Buundo Displaced 6 158
Garowe Camp Tawakal Displaced 12 500
Garowe Camp Riigga Displaced 12 318
Garowe Camp Alawakiil Displaced 6 357
Garowe Camp Siligga Displaced 12 446
Garowe Camp Shabeele Displaced 12 725
Gebiley Cayngala Non-displaced 18 691
Gebiley Ilkaweyne Non-displaced 6 1768
Gebiley Kalabaydh Non-displaced 18 9445
Gebiley Idhanka Deeryahan Non-displaced 12 2313
Gebiley Waalid-Xoor Non-displaced 6 1328
Gebiley Gogaysa Upper Non-displaced 6 485
Gebiley Gees Dheere Non-displaced 6 59
Gebiley Qunyar Dega Non-displaced 6 211
Gebiley Gebiley Non-displaced 18 1964
Gebiley Ifad Gabilay Non-displaced 18 8513
Gebiley Galooley 2 Non-displaced 6 1139
Gebiley Ijaara Non-displaced 6 1126
Gebiley Jago Buldhuq Displaced 6 100
Gebiley Horumarinta Beeraha Displaced 3 70
Gebiley Nafaqo Displaced 14 300
Gebiley 18Ka May Displaced 26 500
Gebiley Xaarboob Displaced 8 150
Gebiley Laaca Displaced 13 150
Gebiley Xuunshaley Displaced 5 170
Hamar jaab jab Hamar Jaab Jab Non-displaced 5 3244
Hamar jaab jab Mogadisho 2 Displaced 4 32
Hamar weyne Kaam Xaaraye Displaced 6 21
Hargeysa Qudhaco Non-displaced 6 1424
Hargeysa Illinta Dhexe Non-displaced 1 642
Hargeysa Ilinta Dhexe Non-displaced 7 114
Hargeysa Malugta Dhexe Non-displaced 6 496
Hargeysa Jaleelo Non-displaced 6 985
Hargeysa Cadaadley Non-displaced 6 7594
Hargeysa Aw Barkhadle Non-displaced 1 1495
Hargeysa Xidhinta Non-displaced 6 1222
Hargeysa Malawley Non-displaced 6 4543
Hargeysa Hargeysa Non-displaced 30 260665
Hargeysa Ibraahim Koodbuur Non-displaced 30 107212
Hargeysa Har Cadaad Non-displaced 6 1284
Hargeysa Qudhaca Non-displaced 2 433
Hargeysa Sheekh-Waafi Non-displaced 6 4035
Hargeysa Labi-Sagaal Ah Non-displaced 6 7931

63
Somalia Joint Multi-Cluster Needs Assessment, November 2019
Hargeysa Balli-Gubadle Non-displaced 6 7649
Hargeysa Ayax 1 Displaced 6 2000
Hargeysa Ayax 2 Displaced 24 3500
Hargeysa State House Displaced 18 4000
Hargeysa Cakaara Displaced 6 500
Hargeysa Ayax 3 Displaced 6 2000
Hargeysa Abdaal Displaced 6 200
Hargeysa Ayax 4 Displaced 6 420
Hargeysa Digaale Displaced 12 1180
Hargeysa Camp Barwaqo Displaced 12 300
Hargeysa Malka Durduro Displaced 6 150
Hargeysa Sheedaha 150 Displaced 6 500
Hargeysa Qoobka Displaced 6 100
Hargeysa Dablatagay Displaced 6 150
Hawl wadaag Hawl Wadaag Non-displaced 4 6723
Hawl wadaag Burco Displaced 6 36
Hawl wadaag Durdor Displaced 12 145
Hawl wadaag Rajo Kam Displaced 6 43
Hawl wadaag Al Cadaala Displaced 12 114
Hawl wadaag Kam Ali Aden Displaced 6 50
Hawl wadaag Walaweyn Displaced 6 107
Hawl wadaag Kabartimo Displaced 30 114
Hawl wadaag Jameeco Camp Displaced 4 14
Hawl wadaag Bur Iyo Qalin Displaced 6 32
Hawl wadaag Janaale Displaced 2 92
Hobyo Gal Gorum Non-displaced 6 23
Hobyo Qaydarrey Non-displaced 12 564
Hobyo Bajeelo Non-displaced 6 884
Hobyo Bacadwayn Non-displaced 6 543
Hobyo Af-Barwaaqo Non-displaced 1 392
Hobyo Budbud Non-displaced 12 1219
Hobyo Ceel-Dibir Non-displaced 7 1953
Hobyo Xaaro Non-displaced 6 562
Hobyo Lulubsho Non-displaced 18 2214
Hobyo Xero Dhagaxleey Non-displaced 18 1420
Hobyo Wisil Non-displaced 24 2962
Hobyo Hobyo Non-displaced 6 2388
Hobyo Gawaan Non-displaced 6 1043
Hobyo Kaam Hobyo Displaced 13 49
Hobyo Midnimo Displaced 37 153
Hobyo Kaam Kulmiye Displaced 19 65
Hodan Hodan Non-displaced 79 10859
Hodan Bismillahi Camp Displaced 7 99
Hodan 26 Ka June Displaced 5 71
Hodan Maraayle Displaced 1 45
Hodan Garas Dheer Displaced 4 71
Hodan Macalin 1 Displaced 6 92
Hodan Durbaan Displaced 6 50
Hodan Malaylay Displaced 1 43
Hodan Aqbalaa Displaced 6 50

64
Somalia Joint Multi-Cluster Needs Assessment, November 2019
Hodan Haween Kam Displaced 2 142
Hodan Kaam Alla Bari Displaced 6 114
Hodan Alla Tuuk Displaced 1 71
Hodan Tiin Tiinley Displaced 6 43
Hodan Ar Cas Displaced 2 121
Hodan Hiiraan Displaced 2 99
Hodan Biyoley Displaced 6 85
Hodan Kapka Displaced 6 107
Hodan Sucdi Displaced 6 78
Hodan Aw Kulmiye Displaced 12 92
Hodan Taangi Camp Displaced 6 121
Hodan Bashash Displaced 6 78
Hodan Gabaldeye Displaced 6 99
Hodan Balanbale Camp Displaced 6 114
Hodan Altaqwo Displaced 1 39
Hodan Curyamid Displaced 6 36
Hodan Galgaduud Kam Displaced 2 104
Hodan Daruuro Displaced 5 28
Hodan Villa Waajid Displaced 7 50
Iskushuban Xiriiro Non-displaced 6 150
Iskushuban Itaageer Non-displaced 6 77
Iskushuban Dharjaale Non-displaced 18 1223
Iskushuban Gargoore Non-displaced 8 37
Iskushuban Dharoor Non-displaced 12 179
Iskushuban Iskushuban Non-displaced 66 4816
Iskushuban Biike Non-displaced 12 42
Iskushuban Xuubabays Non-displaced 12 39
Iskushuban Handa Non-displaced 6 74
Iskushuban Hurdiya Non-displaced 12 1693
Jariiban Gadobjiran Non-displaced 6 644
Jariiban Cara-Caso Non-displaced 2 119
Jariiban Jariiban Non-displaced 63 5982
Jariiban Il-Foocshe Non-displaced 1 58
Jariiban Dhinawda Dhigdhigley Non-displaced 2 62
Jariiban Garcad Non-displaced 6 414
Jariiban Dhinoode Non-displaced 1 64
Jowhar Biyasa Non-displaced 19 2000
Jowhar Kiliga-Shiinaha Non-displaced 6 1959
Jowhar Buurane Non-displaced 6 1494
Jowhar Baaroweyne Non-displaced 6 2635
Jowhar Damasha Non-displaced 6 949
Jowhar Moyka Non-displaced 6 1721
Jowhar Jowhar Non-displaced 42 73535
Jowhar Baalguri Non-displaced 6 27548
Jowhar Jowhar Soomaali Non-displaced 6 14009
Jowhar Kalundi Non-displaced 4 300
Jowhar Buulo Makiino Non-displaced 4 322
Jowhar Bulo Balley Non-displaced 2 162
Jowhar Eyle Displaced 1 50
Jowhar Jilyaale3 Displaced 6 29

65
Somalia Joint Multi-Cluster Needs Assessment, November 2019
Jowhar Block 56 Displaced 6 25
Jowhar Jiliyaale Displaced 6 100
Jowhar Jiliyaale4 Displaced 7 150
Jowhar Biyaaso Displaced 11 120
Jowhar Tawkal Displaced 6 50
Jowhar Waaqwaaqley8 Displaced 6 50
Jowhar Biyaaso 3 Displaced 6 80
Jowhar Subagle Displaced 12 120
Jowhar Biyaaso1 Displaced 6 50
Jowhar Biyasa5 2 Displaced 6 40
Jowhar Biyaasa 2 Displaced 6 35
Jowhar Kaamka Shiikh Saabit Displaced 6 60
Jowhar Kaam40 Displaced 6 50
Jowhar Tawakal Displaced 6 960
Jowhar Kaam Blok45 Displaced 18 200
Kahda Kahda Non-displaced 79 39326
Kahda Daara Salaam Center 1 Displaced 2 178
Kahda Kuntuwaarey Displaced 6 497
Kahda Xusni Center Displaced 6 199
Kahda Bakool Center Displaced 6 114
Kahda Yaaqle Displaced 6 398
Kahda Iskaashi2 Displaced 6 240
Kahda Maandeeq 1 Displaced 6 213
Kahda Hormar Center Displaced 6 199
Kahda Kaxda 2 Displaced 6 103
Kahda Allaweyn Displaced 6 385
Kahda Danwadaag Displaced 6 185
Kahda Barwaaqo 2 Displaced 6 355
Kahda Hubaal Displaced 6 238
Kahda Marhaba Displaced 6 201
Kahda Allamagan Displaced 2 121
Kahda Xusna Center Displaced 2 75
Kahda Dibjir Displaced 6 53
Kahda Biyo Cade Displaced 6 213
Kahda Kuntuwarey Displaced 1 57
Kahda Garasbalay 1 Displaced 6 171
Kahda Buurfuule Center Displaced 6 208
Kahda Days Center Displaced 6 320
Kahda Alla Weyn Kaam Displaced 2 85
Karaan Karaan Non-displaced 25 26024
Karaan Mariina Kaam Displaced 6 178
Kismayo Yoontoy Non-displaced 18 6194
Kismayo Dalsan Non-displaced 1 150
Kismayo Luglaaw Non-displaced 1 1407
Kismayo Goob Weyn Non-displaced 4 1310
Kismayo Dalxiiska Non-displaced 15 7675
Kismayo Kismayo Non-displaced 39 19414
Kismayo Badar Two Displaced 1 106
Kismayo Nasru-Din Displaced 6 333
Kismayo Sakuyi Displaced 6 76

66
Somalia Joint Multi-Cluster Needs Assessment, November 2019
Kismayo Sato Displaced 6 113
Kismayo Taleh Displaced 6 107
Kismayo Tariiqane Displaced 3 28
Kismayo Tawakal 1 Displaced 1 119
Kismayo Bakayley Displaced 6 41
Kismayo Towfiq 1 Displaced 6 94
Kismayo Baraw 3 Displaced 1 50
Kismayo Bass 1 Displaced 1 65
Kismayo Alhamdu Displaced 1 20
Kismayo Camp A Displaced 6 61
Kismayo Camp B2 Displaced 2 47
Kismayo Dhamase Displaced 6 64
Kismayo Dudu Displaced 6 69
Kismayo Farhan 2 Displaced 1 118
Kismayo Gargaar Displaced 6 108
Kismayo Halane Displaced 6 129
Kismayo Hangish Displaced 6 36
Kismayo Hanshi Displaced 1 88
Kismayo Indha Badan Displaced 6 98
Kismayo Kulmiye Displaced 6 31
Kismayo Mako Mani Displaced 6 45
Kismayo Mumino Market Displaced 1 80
Kismayo Nageeye Displaced 6 85
Kismayo Najah Displaced 6 154
Laas caanood Yagoori Non-displaced 3 1527
Laas caanood Adhicadeeye Non-displaced 1 349
Laas caanood Laasodaar Non-displaced 1 109
Laas caanood Laas Caanood Non-displaced 64 58647
Laas caanood Daraymadoobe Non-displaced 7 11712
Laas caanood Karin Dabayl Non-displaced 1 175
Laas caanood Jaamlaaye Displaced 30 400
Laas caanood Adhicaadeeye2 Displaced 12 300
Laas caanood Sahagabogabo Displaced 6 200
Laas caanood Dalsan Displaced 6 800
Laas caanood Qoriley Displaced 6 400
Laas caanood Sahdheer Displaced 30 1794
Laas caanood Farxaskulle Displaced 12 600
Laas caanood Sayidka Displaced 6 680
Laas caanood Aray Cade Displaced 6 260
Laas caanood Adhicadeeye1 Displaced 12 342
Laas caanood Kalbardaalay Displaced 12 250
Laasqoray Laasqoray Non-displaced 72 43512
Laasqoray Mash-Caleed Non-displaced 3 72
Laasqoray Ulxeed Non-displaced 3 1057
Laasqoray Mush-Xaleed Non-displaced 4 1175
Lughaye Geerisa Non-displaced 12 7821
Lughaye Xoog Faras Non-displaced 24 3954
Lughaye Farda Lagu-Xidh Non-displaced 6 2763
Lughaye Karuure Non-displaced 12 2610
Lughaye Garaaca Non-displaced 18 1687

67
Somalia Joint Multi-Cluster Needs Assessment, November 2019
Lughaye Lughaye Non-displaced 6 4289
Lughaye Xoore Non-displaced 6 45
Lughaye Kalawle Non-displaced 12 4495
Lughaye Hulka Non-displaced 6 975
Lughaye Tuurka Non-displaced 12 439
Lughaye Ceel La Helay Non-displaced 6 4668
Lughaye Sheed Dheer Non-displaced 6 389
Lughaye Almis Displaced 4 190
Lughaye Fado Lagu Xidh Displaced 15 350
Lughaye Horseed Displaced 3 70
Lughaye Bulo Quxle Displaced 7 250
Lughaye Gobdheere Displaced 4 100
Lughaye Duqaa Rayti Displaced 3 80
Lughaye Xajile Displaced 1 150
Lughaye Harasses Bari Displaced 26 1150
Lughaye Ido Cadays Displaced 6 150
Lughaye Balayga Displaced 9 276
Luuq Aroosow Non-displaced 1 51
Luuq Geer Boolow Non-displaced 4 536
Luuq Halbow1 Non-displaced 1 523
Luuq Luuq Non-displaced 10 2113
Luuq Suulale Non-displaced 1 114
Luuq Heli-Shiid 2 Non-displaced 8 2285
Luuq Heli-Shiid Non-displaced 46 11247
Luuq Tuulo Marexan Non-displaced 2 421
Luuq Ban Munduli Non-displaced 6 1153
Luuq Kulmiye IDP Displaced 6 400
Luuq Jaziira IDP Displaced 4 444
Luuq Busley IDP Displaced 11 653
Luuq Duyacley Displaced 4 250
Luuq Akaro Displaced 12 800
Luuq Luuq Town Displaced 7 600
Marka Abiikarow Non-displaced 1 506
Marka Gendawe Non-displaced 2 1960
Marka Marka Non-displaced 51 45837
Marka Istaduuto Non-displaced 11 15276
Marka Ceel-Caddow Non-displaced 3 1598
Marka Ceel-Jaale Non-displaced 2 340
Marka Shalaambood Non-displaced 12 7438
Mataban Beergadiid Non-displaced 6 400
Mataban Jiracle Non-displaced 6 125
Owdweyne Ceel Baxay Non-displaced 1 216
Owdweyne Godwaraabe Non-displaced 12 681
Owdweyne Xidh-Xidh Non-displaced 6 1529
Owdweyne Qaloocato Non-displaced 6 514
Owdweyne Gawama Non-displaced 24 1006
Owdweyne Haro Sheikh Non-displaced 6 1440
Owdweyne Cabdi Faarax Non-displaced 6 1234
Owdweyne Xaqayo-Malaas Non-displaced 6 1579
Owdweyne Odweyne Non-displaced 6 2291

68
Somalia Joint Multi-Cluster Needs Assessment, November 2019
Owdweyne Jameecaadka Non-displaced 6 261
Owdweyne Goroyo Ood Non-displaced 6 1455
Owdweyne Bali Cabdule Non-displaced 6 1094
Owdweyne Wacays Oodane Non-displaced 6 1449
Owdweyne Daba-Goroyaale Non-displaced 24 3378
Owdweyne Jeenyo Laaye Non-displaced 6 1281
Owdweyne Ceel Bilcile Non-displaced 12 1723
Owdweyne Kama Barwqo Displaced 23 100
Owdweyne Iftiin Displaced 47 190
Qardho Rako Non-displaced 4 295
Qardho Qalwo Non-displaced 1 56
Qardho Dalwayn Non-displaced 3 295
Qardho Xiddo Non-displaced 6 965
Qardho Sheerbi Non-displaced 3 482
Qardho Guud Cad Non-displaced 2 437
Qardho Qardho Non-displaced 53 7960
Qardho Libaax-Xar Non-displaced 1 39
Qardho Gar-Hel Non-displaced 1 58
Qardho Yakayake Non-displaced 1 39
Qardho Libow Non-displaced 2 19
Qardho Dangoroyo Non-displaced 2 128
Qoryooley Bulo Eylo Non-displaced 6 388
Qoryooley Tugaarrey Non-displaced 12 367
Qoryooley Buulo-Jameeco Non-displaced 2 597
Qoryooley Camp 2 Non-displaced 1 1389
Qoryooley Madax Marodi Non-displaced 12 356
Qoryooley Buulo Jadiid Non-displaced 6 557
Qoryooley Garasjeret (Main) Non-displaced 6 1591
Qoryooley Bulukoy Non-displaced 6 390
Qoryooley Bulo Muse Non-displaced 18 2382
Qoryooley Ay Aarta Non-displaced 5 1371
Qoryooley Farxaane Non-displaced 18 2437
Qoryooley Degaybere Non-displaced 6 5013
Qoryooley Alambuur Non-displaced 6 669
Qoryooley Qoryooley Non-displaced 18 2773
Qoryooley Buulo Siidow Non-displaced 3 3252
Qoryooley Buulo Sheekh Non-displaced 6 1808
Qoryooley Haduuman Non-displaced 5 752
Qoryooley Ahmed Gaas Non-displaced 6 750
Shangaani Shangaani Non-displaced 2 930
Sheikh Bixin Dule Non-displaced 6 446
Sheikh Mija Caseeye Non-displaced 6 826
Sheikh Laaleys Non-displaced 21 446
Sheikh Huddisa Non-displaced 6 502
Sheikh Raamaale Non-displaced 6 1358
Sheikh Gugux Non-displaced 6 359
Sheikh Siir Non-displaced 12 1059
Sheikh Calaacule Non-displaced 6 442
Sheikh Sheikh Non-displaced 36 13640
Sheikh Gidheys Non-displaced 7 1048

69
Somalia Joint Multi-Cluster Needs Assessment, November 2019
Sheikh Dubur Non-displaced 6 411
Sheikh Cagaaray Non-displaced 6 1509
Sheikh Galoolley Non-displaced 6 1414
Shibis Shibis Non-displaced 4 3633
Shibis Kaam Laansaleeti Displaced 6 57
Shibis Safarada Talyaniga Displaced 12 355
Taleex Laa-Baas Non-displaced 1 36
Taleex Kal-Cad Non-displaced 3 39
Taleex Taleex Non-displaced 73 6381
Taleex Kalcad IDP Displaced 13 160
Taleex Dhummay Displaced 15 150
Taleex Cadad Jaanle Kaam Displaced 16 150
Taleex Gumburka Qawlo Displaced 25 160
Taleex Fadhiyar Displaced 3 50
Waaberi Waaberi Non-displaced 11 10157
Waaberi Beel Displaced 6 89
Waaberi Wabari Displaced 2 43
Waaberi Mogdhisho Displaced 6 21
Waajid Waajid Non-displaced 78 5194
Waajid Elbon IDP Displaced 7 200
Waajid Tawakal IDP Displaced 39 575
Waajid All Amin Displaced 7 104
Waajid Burdhuxunle IDP Displaced 5 200
Waajid Kulmiye Ipd Camp Displaced 6 280
Waajid Towfiq IDP Displaced 19 320
Wadajir Wadajir Non-displaced 17 24520
Wanla weyne Aw Mayaw Non-displaced 1 113
Wanla weyne Boraan Non-displaced 1 65
Wanla weyne Masiirey Non-displaced 1 145
Wanla weyne Bulo Ajuso Non-displaced 2 97
Wanla weyne Labagaras Non-displaced 2 162
Wanla weyne Baloow Non-displaced 6 129
Wanla weyne Farxaane Non-displaced 6 273
Wanla weyne Eeribka Non-displaced 6 196
Wanla weyne Heero Non-displaced 34 2641
Wanla weyne Aw Cusman Non-displaced 13 1755
Wanla weyne War Muusow Non-displaced 15 468
Wanla weyne Bocorey Non-displaced 6 65
Wanla weyne Yaaq Dhuub Non-displaced 12 170
Wanla weyne Garooreey Non-displaced 6 40
Wanla weyne Maykiridi Non-displaced 1 347
Wanla weyne Bulo Abtile Non-displaced 4 145
Wanla weyne Sagaaroole Non-displaced 8 645
Wanla weyne Hawal Fiiley Non-displaced 13 64
Wanla weyne Agal Gubay Yarey Non-displaced 4 337
Wanla weyne Waraaboole Non-displaced 3 116
Wanla weyne Shanta Kulan Displaced 7 140
Wanla weyne Kaamka Cagaboorey Displaced 19 250
Wanla weyne Kaamka Daa Uud Buule Displaced 18 200
Wanla weyne Kamka Bakaal Displaced 8 150

70
Somalia Joint Multi-Cluster Needs Assessment, November 2019
Wanla weyne Teendhada Displaced 20 400
Wanla weyne Meynun Cam Displaced 10 210
Wardhiigleey Wardhiigleey Non-displaced 7 9067
Wardhiigleey Buula Mareer Displaced 12 53
Wardhiigleey Kaam Kuus Displaced 6 25
Wardhiigleey Warta Nabada Displaced 3 36
Wardhiigleey Mahad Alle Displaced 6 71
Wardhiigleey Ooflaw Cam Displaced 6 99
Wardhiigleey Al Xaq Cam Displaced 18 284
Wardhiigleey Xawaal Barbaar Displaced 1 80
Wardhiigleey Qoryooley Kaam Displaced 6 45
Wardhiigleey Bariire2 Displaced 6 107
Xudun Xudun Non-displaced 76 6455
Xudun Laasocurdin Displaced 6 200
Xudun Holhol Displaced 18 300
Xudun Godaale Displaced 6 350
Xudun Siigodheer Displaced 6 100
Xudun Barakacayaasha Xudun Displaced 6 200
Xudun Ceel Liibaan Displaced 6 20
Xudun Faroxal Displaced 6 50
Xudun Dhaban Displaced 12 110
Xudun Wagxin Displaced 7 60
Xudun Duuray Displaced 12 150
Xudun Dobshabeel Displaced 16 180
Xudun Cadaybuur Displaced 18 150
Xudun Lafweyne Displaced 24 320
Xudur Xudur Non-displaced 7 2980
Xudur Xudur Non-displaced 65 34639
Xudur Madax Waraabe Non-displaced 5 560
Xudur Gaabaney Non-displaced 1 83
Xudur Waney Non-displaced 1 27
Xudur Tieglow IDP 2 Displaced 15 30
Xudur Abagbeedey Displaced 10 30
Xudur Morishilinli Displaced 18 56
Xudur Lahelow Displaced 19 50
Zeylac Lawya Caddo Non-displaced 18 529
Zeylac Toqoshi Non-displaced 3 1020
Zeylac Zeylac Non-displaced 20 3652
Zeylac Caasha Caddo Non-displaced 4 1575
Zeylac Cali Weeci Non-displaced 5 1359
Zeylac Jidhi Non-displaced 5 1278
Zeylac Xussein Non-displaced 16 3324
Zeylac Cabdil Qaaddir Non-displaced 19 3867
Zeylac Habaas Non-displaced 3 1181
Zeylac Geelka Goojis Non-displaced 3 963
Zeylac Sh. Dudub Non-displaced 8 1277

71
Somalia Joint Multi-Cluster Needs Assessment, November 2019
Annex 3: List of districts by type of sampling method
District Non-displaced strata Displaced strata
Afgooye Two-stage random sampling Cluster sampling
Afmadow Two-stage random sampling Cluster sampling
Baardheere Two-stage random sampling Two-stage random sampling
Badhaadhe Two-stage random sampling
Badhan Two-stage random sampling Two-stage random sampling
Baidoa Two-stage random sampling Cluster sampling
Baki Cluster sampling
Balcad Two-stage random sampling
Bandarbayla Cluster sampling
Belet weyne Cluster sampling Cluster sampling
Belet xaawo Two-stage random sampling Two-stage random sampling
Berbera Two-stage random sampling Two-stage random sampling
Borama Cluster sampling Two-stage random sampling
Bossaso Two-stage random sampling Cluster sampling
Burco Cluster sampling Two-stage random sampling
Burtinle Two-stage random sampling Two-stage random sampling
Buuhoodle Two-stage random sampling Cluster sampling
Buur hakaba Cluster sampling
Cabudwaaq Two-stage random sampling Cluster sampling
Cadaado Two-stage random sampling Two-stage random sampling
Caynabo Cluster sampling Two-stage random sampling
Ceel afweyn Two-stage random sampling Two-stage random sampling
Ceel barde Two-stage random sampling Two-stage random sampling
Ceel waaq Two-stage random sampling Two-stage random sampling
Ceerigaabo Two-stage random sampling Two-stage random sampling
Dhuusamarreeb Two-stage random sampling Two-stage random sampling
Doolow Two-stage random sampling Two-stage random sampling
Eyl Cluster sampling
Gaalkacyo Two-stage random sampling Cluster sampling
Galdogob Two-stage random sampling Two-stage random sampling
Garbahaarey Two-stage random sampling Two-stage random sampling
Garowe Two-stage random sampling Cluster sampling
Gebiley Cluster sampling Two-stage random sampling
Hargeysa Cluster sampling Cluster sampling
Hobyo Cluster sampling Two-stage random sampling
Iskushuban Cluster sampling
Jariiban Two-stage random sampling
Jowhar Cluster sampling Cluster sampling
Kismayo Two-stage random sampling Cluster sampling
Laas caanood Two-stage random sampling Cluster sampling
Laasqoray Two-stage random sampling
Lughaye Cluster sampling Two-stage random sampling
Luuq Two-stage random sampling Two-stage random sampling
Marka Two-stage random sampling
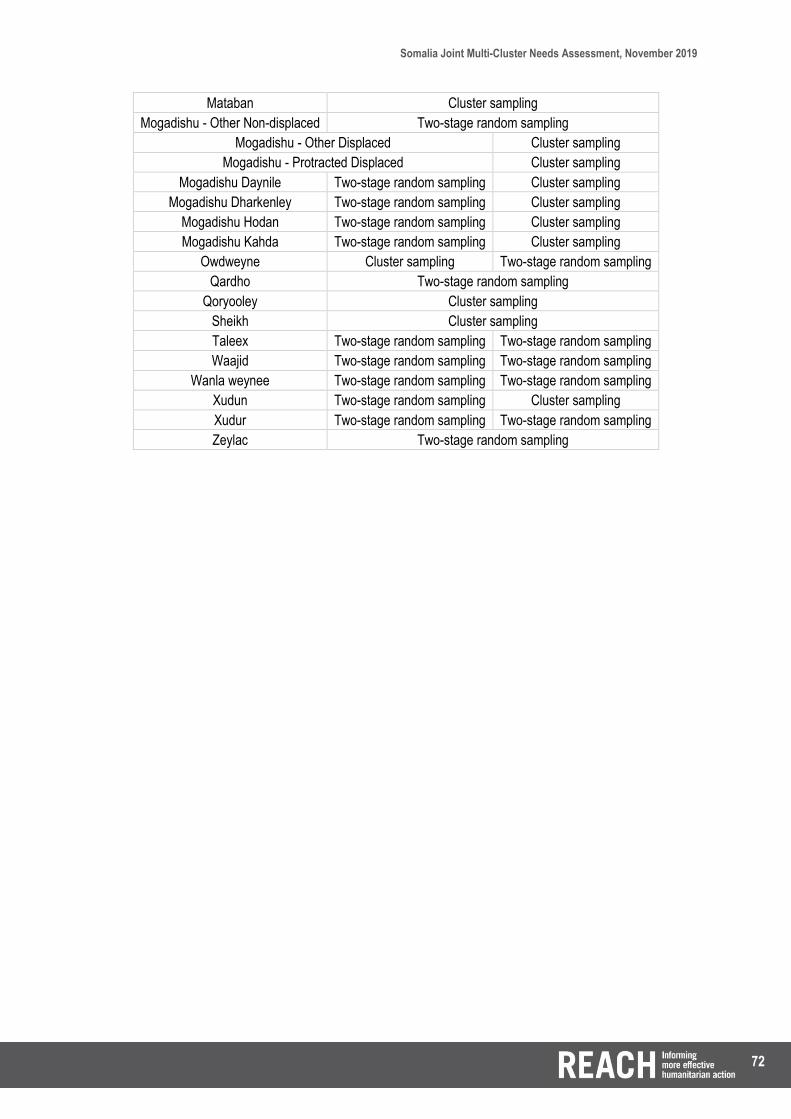
72
Somalia Joint Multi-Cluster Needs Assessment, November 2019
Mataban Cluster sampling
Mogadishu - Other Non-displaced Two-stage random sampling
Mogadishu - Other Displaced Cluster sampling
Mogadishu - Protracted Displaced Cluster sampling
Mogadishu Daynile Two-stage random sampling Cluster sampling
Mogadishu Dharkenley Two-stage random sampling Cluster sampling
Mogadishu Hodan Two-stage random sampling Cluster sampling
Mogadishu Kahda Two-stage random sampling Cluster sampling
Owdweyne Cluster sampling Two-stage random sampling
Qardho Two-stage random sampling
Qoryooley Cluster sampling
Sheikh Cluster sampling
Taleex Two-stage random sampling Two-stage random sampling
Waajid Two-stage random sampling Two-stage random sampling
Wanla weynee Two-stage random sampling Two-stage random sampling
Xudun Two-stage random sampling Cluster sampling
Xudur Two-stage random sampling Two-stage random sampling
Zeylac Two-stage random sampling
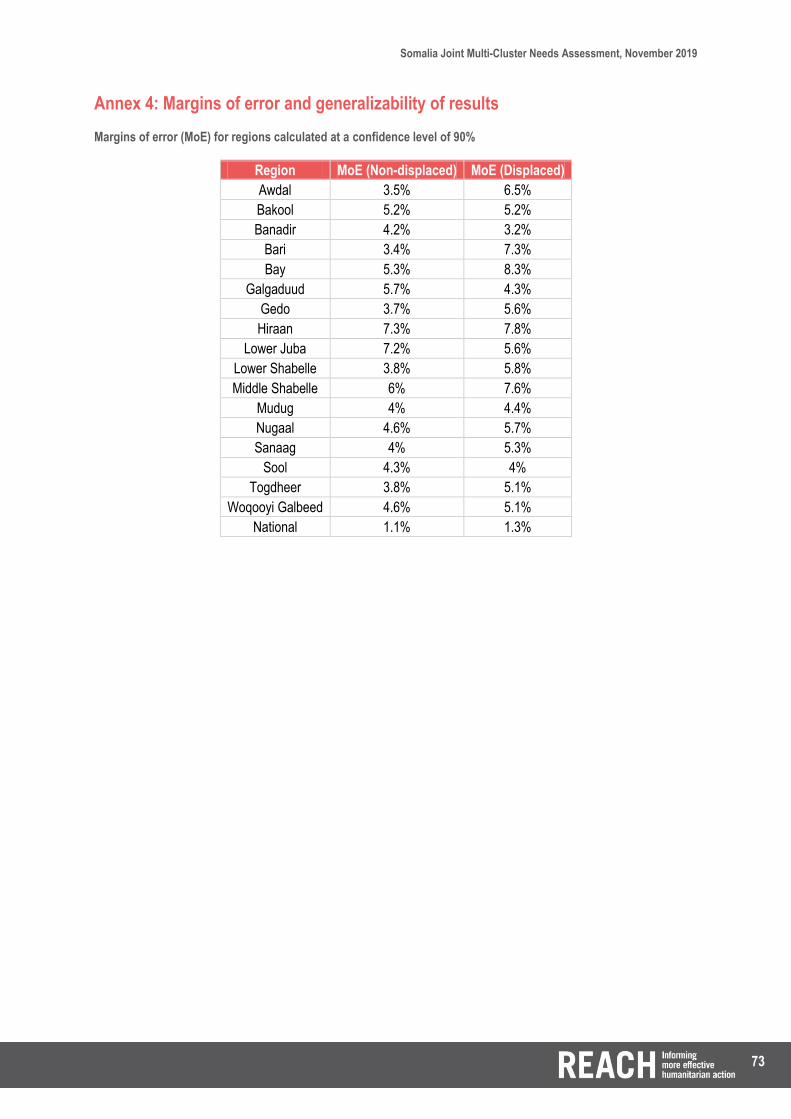
73
Somalia Joint Multi-Cluster Needs Assessment, November 2019
Annex 4: Margins of error and generalizability of results Margins of error (MoE) for regions calculated at a confidence level of 90%
Region MoE (Non-displaced) MoE (Displaced)
Awdal 3.5% 6.5%
Bakool 5.2% 5.2%
Banadir 4.2% 3.2%
Bari 3.4% 7.3%
Bay 5.3% 8.3%
Galgaduud 5.7% 4.3%
Gedo 3.7% 5.6%
Hiraan 7.3% 7.8%
Lower Juba 7.2% 5.6%
Lower Shabelle 3.8% 5.8%
Middle Shabelle 6% 7.6%
Mudug 4% 4.4%
Nugaal 4.6% 5.7%
Sanaag 4% 5.3%
Sool 4.3% 4%
Togdheer 3.8% 5.1%
Woqooyi Galbeed 4.6% 5.1%
National 1.1% 1.3%
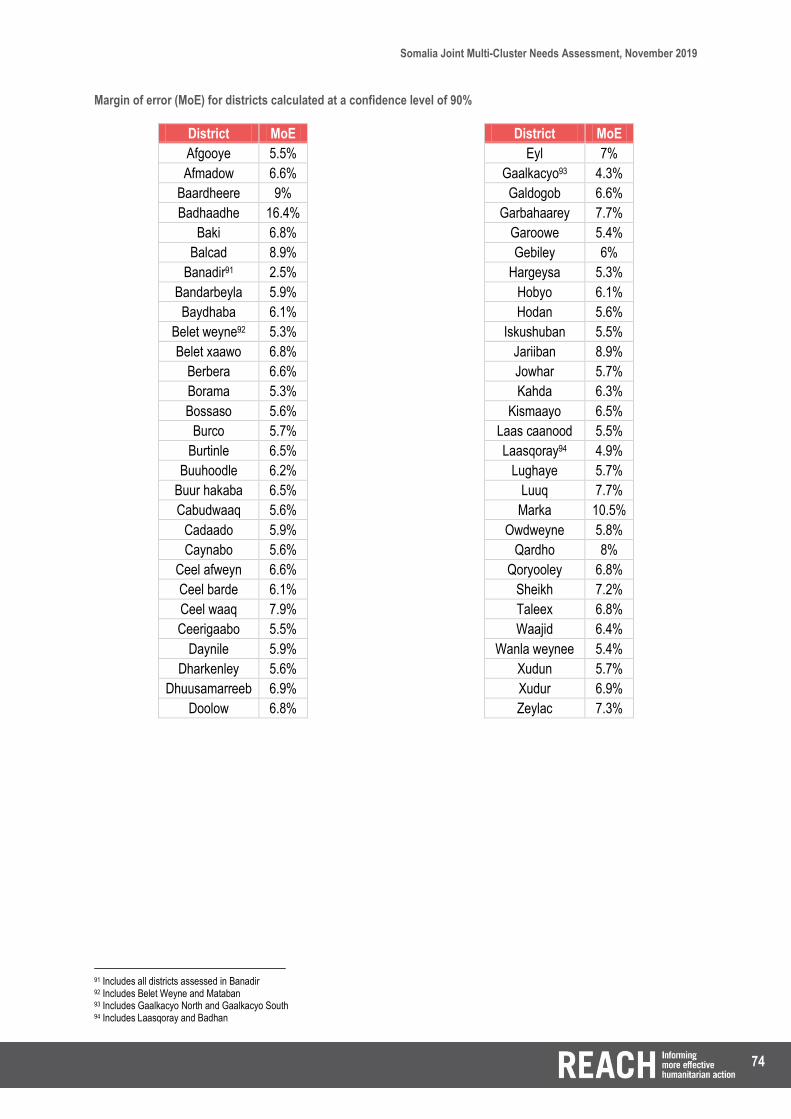
74
Somalia Joint Multi-Cluster Needs Assessment, November 2019
Margin of error (MoE) for districts calculated at a confidence level of 90%
District MoE
Afgooye 5.5%
Afmadow 6.6%
Baardheere 9%
Badhaadhe 16.4%
Baki 6.8%
Balcad 8.9%
Banadir91 2.5%
Bandarbeyla 5.9%
Baydhaba 6.1%
Belet weyne92 5.3%
Belet xaawo 6.8%
Berbera 6.6%
Borama 5.3%
Bossaso 5.6%
Burco 5.7%
Burtinle 6.5%
Buuhoodle 6.2%
Buur hakaba 6.5%
Cabudwaaq 5.6%
Cadaado 5.9%
Caynabo 5.6%
Ceel afweyn 6.6%
Ceel barde 6.1%
Ceel waaq 7.9%
Ceerigaabo 5.5%
Daynile 5.9%
Dharkenley 5.6%
Dhuusamarreeb 6.9%
Doolow 6.8%
District MoE
Eyl 7%
Gaalkacyo93 4.3%
Galdogob 6.6%
Garbahaarey 7.7%
Garoowe 5.4%
Gebiley 6%
Hargeysa 5.3%
Hobyo 6.1%
Hodan 5.6%
Iskushuban 5.5%
Jariiban 8.9%
Jowhar 5.7%
Kahda 6.3%
Kismaayo 6.5%
Laas caanood 5.5%
Laasqoray94 4.9%
Lughaye 5.7%
Luuq 7.7%
Marka 10.5%
Owdweyne 5.8%
Qardho 8%
Qoryooley 6.8%
Sheikh 7.2%
Taleex 6.8%
Waajid 6.4%
Wanla weynee 5.4%
Xudun 5.7%
Xudur 6.9%
Zeylac 7.3%
91 Includes all districts assessed in Banadir 92 Includes Belet Weyne and Mataban 93 Includes Gaalkacyo North and Gaalkacyo South 94 Includes Laasqoray and Badhan

74
Somalia Joint Multi-Cluster Needs Assessment, November 2019
Representativeness of results by district and population group
Region District # Surveys Groups
assessed
Level of generalisation:
Non-IDP settlements
Level of generalisation: IDP settlements
Awdal Baki 147 Non-IDP
settlements only Statistically
representative NA
Awdal Borama 244 IDP and non-IDP
settlements Statistically
representative Statistically
representative
Awdal Lughaye 210 IDP and non-IDP
settlements Statistically
representative Statistically
representative
Awdal Zeylac 127 Non-IDP
settlements only Statistically
representative NA
Bakool Ceel Barde 183 IDP and non-IDP
settlements Indicative
Statistically representative
Bakool Waajid 161 IDP and non-IDP
settlements Statistically
representative Statistically
representative
Bakool Xudur 142 IDP and non-IDP
settlements Statistically
representative Statistically
representative
Banadir Abdulaziz 6 IDP and non-IDP
settlements Statistically
representative Statistically
representative
Banadir Boondheere 8 IDP and non-IDP
settlements Statistically
representative Statistically
representative
Banadir Daynile 199 IDP and non-IDP
settlements Statistically
representative Statistically
representative
Banadir Dharkenley 217 IDP and non-IDP
settlements Statistically
representative Statistically
representative
Banadir Hamar jaab jab 6 IDP and non-IDP
settlements Statistically
representative Statistically
representative
Banadir Hamar Weyne 6 IDP and non-IDP
settlements Statistically
representative Statistically
representative
Banadir Hawl Wadaag 86 IDP and non-IDP
settlements Statistically
representative Statistically
representative
Banadir Hodan 215 IDP and non-IDP
settlements Statistically
representative Statistically
representative
Banadir Kahda 179 IDP and non-IDP
settlements Statistically
representative Statistically
representative
Banadir Karaan 29 IDP and non-IDP
settlements Statistically
representative Statistically
representative
Banadir Shangaani 2 IDP and non-IDP
settlements Statistically
representative Statistically
representative
Banadir Shibis 21 IDP and non-IDP
settlements Statistically
representative Statistically
representative
Banadir Waaberi 14 IDP and non-IDP
settlements Statistically
representative Statistically
representative
Banadir Wadajir 18 IDP and non-IDP
settlements Statistically
representative Statistically
representative
Banadir Wardhiigleey 55 IDP and non-IDP
settlements Statistically
representative Statistically
representative
Bari Bandarbayla 174 Non-IDP
settlements only Statistically
representative NA
Bari Bossaso 271 IDP and non-IDP
settlements Statistically
representative Statistically
representative

75
Somalia Joint Multi-Cluster Needs Assessment, November 2019
Bari Iskushuban 217 Non-IDP
settlements only Statistically
representative NA
Bari Qardho 107 Non-IDP
settlements only Statistically
representative NA
Bay Baidoa 191 IDP and non-IDP
settlements Statistically
representative Statistically
representative
Bay Buur Hakaba 160 Non-IDP
settlements only Statistically
representative NA
Galgaduud Cabudwaaq 267 IDP and non-IDP
settlements Statistically
representative Statistically
representative
Galgaduud Cadaado 208 IDP and non-IDP
settlements Statistically
representative Statistically
representative
Galgaduud Dhuusamarreeb 167 IDP and non-IDP
settlements Indicative
Statistically representative
Gedo Baardheere 89 IDP and non-IDP
settlements Statistically
representative Indicative
Gedo Belet Xaawo 147 IDP and non-IDP
settlements Indicative Indicative
Gedo Ceel Waaq 110 IDP and non-IDP
settlements Statistically
representative Statistically
representative
Gedo Doolow 153 IDP and non-IDP
settlements Statistically
representative Statistically
representative
Gedo Garbahaarey 117 IDP and non-IDP
settlements Indicative
Statistically representative
Gedo Luuq 118 IDP and non-IDP
settlements Statistically
representative Indicative
Hiraan Belet Weyne 239 IDP and non-IDP
settlements Statistically
representative Statistically
representative
Hiraan Mataban 12 Non-IDP
settlements only Statistically
representative NA
Lower Juba Afmadow 180 IDP and non-IDP
settlements Indicative
Statistically representative
Lower Juba Badhaadhe 26 Non-IDP
settlements only Statistically
representative NA
Lower Juba Jamaame 3 Non-IDP
settlements only Insufficient data
collected NA
Lower Juba Kismayo 169 IDP and non-IDP
settlements Statistically
representative Statistically
representative
Lower Shabelle
Afgooye 228 IDP and non-IDP
settlements Statistically
representative Statistically
representative
Lower Shabelle
Baraawe 2 Non-IDP
settlements only Insufficient data
collected NA
Lower Shabelle
Kurtunwaarey 1 Non-IDP
settlements only Insufficient data
collected NA
Lower Shabelle
Marka 72 Non-IDP
settlements only Statistically
representative NA
Lower Shabelle
Qoryooley 146 Non-IDP
settlements only Statistically
representative NA
Lower Shabelle
Sablaale 2 Non-IDP
settlements only Insufficient data
collected NA
Lower Shabelle
Wanla Weyn 227 IDP and non-IDP
settlements Statistically
representative Statistically
representative
Middle Shabelle
Balcad 84 Non-IDP
settlements only Statistically
representative NA

76
Somalia Joint Multi-Cluster Needs Assessment, November 2019
Middle Shabelle
Jowhar 216 IDP and non-IDP
settlements Statistically
representative Statistically
representative
Mudug Gaalkacyo95 376 IDP and non-IDP
settlements Statistically
representative Statistically
representative
Mudug Galdogob 159 IDP and non-IDP
settlements Statistically
representative Statistically
representative
Mudug Hobyo 181 IDP and non-IDP
settlements Statistically
representative Statistically
representative
Mudug Jariiban 84 Non-IDP
settlements only Statistically
representative NA
Nugaal Burtinle 170 IDP and non-IDP
settlements Statistically
representative Statistically
representative
Nugaal Eyl 136 Non-IDP
settlements only Statistically
representative NA
Nugaal Garowe 230 IDP and non-IDP
settlements Statistically
representative Statistically
representative
Sanaag Badhan 178 IDP and non-IDP
settlements Statistically
representative Statistically
representative
Sanaag Ceel Afweyn 148 IDP and non-IDP
settlements Statistically
representative Statistically
representative
Sanaag Ceerigaabo 230 IDP and non-IDP
settlements Statistically
representative Indicative
Sanaag Laasqoray 106 Non-IDP
settlements only Statistically
representative NA
Sool Caynabo 218 IDP and non-IDP
settlements Statistically
representative Statistically
representative
Sool Laas Caanood 221 IDP and non-IDP
settlements Statistically
representative Statistically
representative
Sool Taleex 148 IDP and non-IDP
settlements Statistically
representative Statistically
representative
Sool Xudun 204 IDP and non-IDP
settlements Statistically
representative Statistically
representative
Togdheer Burco 215 IDP and non-IDP
settlements Statistically
representative Statistically
representative
Togdheer Buuhoodle 177 IDP and non-IDP
settlements Indicative
Statistically representative
Togdheer Owdweyne 202 IDP and non-IDP
settlements Statistically
representative Statistically
representative
Togdheer Sheikh 131 Non-IDP
settlements only Statistically
representative NA
Woqooyi Galbeed
Berbera 155 IDP and non-IDP
settlements Statistically
representative Statistically
representative
Woqooyi Galbeed
Gebiley 194 IDP and non-IDP
settlements Statistically
representative Statistically
representative
Woqooyi Galbeed
Hargeysa 246 IDP and non-IDP
settlements Statistically
representative Statistically
representative
95 Includes Gaalkacyo North and Gaalkacyo South
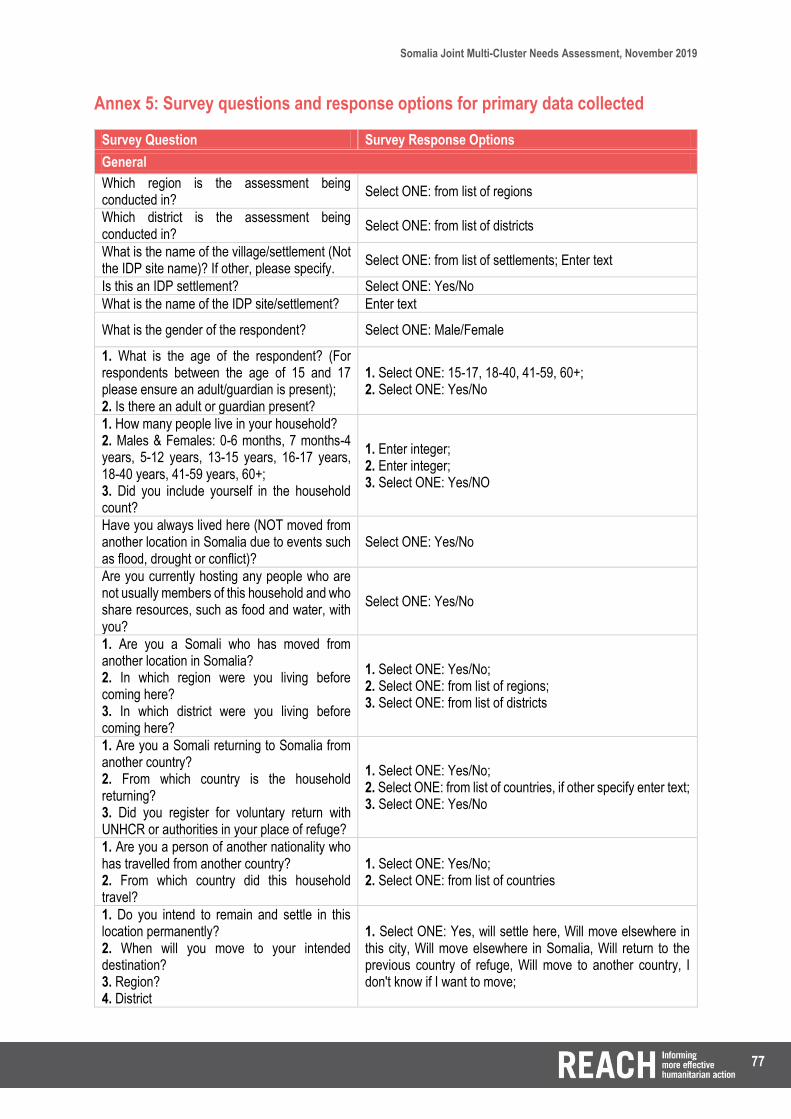
77
Somalia Joint Multi-Cluster Needs Assessment, November 2019
Annex 5: Survey questions and response options for primary data collected
Survey Question Survey Response Options
General
Which region is the assessment being conducted in?
Select ONE: from list of regions
Which district is the assessment being conducted in?
Select ONE: from list of districts
What is the name of the village/settlement (Not the IDP site name)? If other, please specify.
Select ONE: from list of settlements; Enter text
Is this an IDP settlement? Select ONE: Yes/No
What is the name of the IDP site/settlement? Enter text
What is the gender of the respondent? Select ONE: Male/Female
1. What is the age of the respondent? (For respondents between the age of 15 and 17 please ensure an adult/guardian is present); 2. Is there an adult or guardian present?
1. Select ONE: 15-17, 18-40, 41-59, 60+; 2. Select ONE: Yes/No
1. How many people live in your household? 2. Males & Females: 0-6 months, 7 months-4 years, 5-12 years, 13-15 years, 16-17 years, 18-40 years, 41-59 years, 60+; 3. Did you include yourself in the household count?
1. Enter integer; 2. Enter integer; 3. Select ONE: Yes/NO
Have you always lived here (NOT moved from another location in Somalia due to events such as flood, drought or conflict)?
Select ONE: Yes/No
Are you currently hosting any people who are not usually members of this household and who share resources, such as food and water, with you?
Select ONE: Yes/No
1. Are you a Somali who has moved from another location in Somalia? 2. In which region were you living before coming here? 3. In which district were you living before coming here?
1. Select ONE: Yes/No; 2. Select ONE: from list of regions; 3. Select ONE: from list of districts
1. Are you a Somali returning to Somalia from another country? 2. From which country is the household returning? 3. Did you register for voluntary return with UNHCR or authorities in your place of refuge?
1. Select ONE: Yes/No; 2. Select ONE: from list of countries, if other specify enter text; 3. Select ONE: Yes/No
1. Are you a person of another nationality who has travelled from another country? 2. From which country did this household travel?
1. Select ONE: Yes/No; 2. Select ONE: from list of countries
1. Do you intend to remain and settle in this location permanently? 2. When will you move to your intended destination? 3. Region? 4. District
1. Select ONE: Yes, will settle here, Will move elsewhere in this city, Will move elsewhere in Somalia, Will return to the previous country of refuge, Will move to another country, I don't know if I want to move;

78
Somalia Joint Multi-Cluster Needs Assessment, November 2019
2. Select ONE: In the next week, In the next month, In the next three months, In the next six months, More than six months from now; 3. Select ONE: from list of regions; 4. Select ONE: from list of districts
Pre-existing vulnerabilities
1. Who is the main income-earner of the household? 2. Who decides on household expenditure?
1. Select ONE for income earner; 2. Select MULTIPLE for expenditure decider; Options: Adult male (aged 60 +), Adult female (aged 60 +), Adult male (aged 18 to 59), Adult female (aged 18 to 59), Male child (aged 14-17), Female child (aged 14-17), Male child (aged 13 or below), Female child (aged 13 or below)
Are there any female household members who have given birth in the past 6 months or who are pregnant?
Select ONE: Yes/No
1. In your household, are there any members that have physical or cognitive difficulties (for e.g. mobility, hearing, sight, communicating, etc.) which impacts their ability to carry out daily activities such as working, studying, walking, getting dressed, remembering things? 2. How many household members fall into the following categories? No difficulty carrying out daily activities, Minor difficulties carrying daily activities but does not need assistance or attention, Some difficulties carrying daily activities and needs some assistance and attention (for e.g. 1-2 hours per day), A lot of difficulty carrying daily activities and needs quite a bit of assistance and attention (for e.g. 3-6 hours per day), Cannot carry daily activities independently and needs permanent assistance and attention; 3. Is there at least one person with difficulties between 5 years old and above 59 years old?
1. Select ONE: Yes/No; 2. Enter integer; 3. Select ONE: Yes/No
Are there any members in the household suffering from chronic disease (any illness which lasts 3 months of longer)?
Select ONE: Yes/No/Don't know
1. Do all adult household members have some form of identity documentation (for example passport or national ID card) in their possession? 2. If anyone in your household does not have some form of identity documentation, do you think they could obtain it if needed?
1. Select ONE: Yes/No/Don't know; 2. Select ONE: Yes/No/Don't know
How many members of the household are currently engaged in remunerated work?
Enter integer
How much time on average did household members spend in care-giving tasks (e.g. fetching water, preparing food, child-rearing) in the past 3 months/90 days?
Select ONE: Less than 1h/day, 1-2h/day, 2-3h/day, 3-4h/day, 4+h/day, Don't know
What was the average household income (including remittances) in the past 3 months/90 days?
Select ONE: None, less than 30$/day, 31-60$/day, 61-100$/day, 101-150$/day, 151-200$/day, 200+$/day, Don’t know

79
Somalia Joint Multi-Cluster Needs Assessment, November 2019
1. What was the average household income (including remittances) in the past 3 months/90 days? 2. What was the average household debt in the past 3 months/90 days?
1.2. Select ONE: None, less than 30$/day, 31-60$/day, 61-100$/day, 101-150$/day, 151-200$/day, 200+$/day, Don’t know
1. Do you pay for XYZ? 2. How much on average did the household spend on XYZ in the past 3 months? 3. Has this cost increased or decreased in the past 3 months?
1. Select ONE: Yes/No; 2. Select ONE: $ intervals; 3. Select ONE: Increased/Decreased/Same/Don't know
1. When did you leave your area of origin? 2. When did you arrive at the current location?
Enter Date
1. How long does it take you to reach the nearest market? 2. How do you get there?
1. Select ONE: Less than 15 mins, 15-30 mins, 30 mins-1h, 1-3h, 3+h; 2. Select ONE: Walking, Car, Bus, Moto, Bicycle, Cart
Impact
1. Were there any household members separated from the household in the past 3 months/90 days? 2. What is the gender and age of the separated member? 3. Why was the person separated from the household?
1. Select ONE: Yes/No/Don't know; 2. Select MULTIPLE: Female below 18, Female above 18, Male below 18, Male above 18; 3. Select MULTIPLE: Staying with relatives, Flood, Drought, Conflict, Missing (no reason), Abducted, Voluntarily joined armed groups, Forcibly joined armed groups, Detained (no reason), Left house to study, Left house to work, Early marriage, Don't know
1. How many members of the household lost their employment in the past 3 months/90 days? 2. Was the loss of employment due to flood, drought, or conflict?
1. Select ONE: Yes/No; 2. Select MULTIPLE: Flood, Conflict, Drought, Other; If other specify (enter text), Don't know
1. Have you suffered a loss in herd size in the past 3 months/90 days? 2. Have you suffered a loss in access to cultivable land in the past 3 months/90 days?
1.2. Select ONE: Yes – all, Yes more than 75%, Yes more than 50%, Yes more than 25%, No Losses, Don't know
1. Has your shelter (walls, roof, doors) been damaged (moderate or heavy) and not been repaired in the past 3 months/90 days? 2. What was the main reason for shelter damage?
1. Select ONE: Yes/No; 2. Select ONE: Flooding, Conflict, Poor material, Poor construction
1. When did you leave your area of origin? 2. When did you arrive at the current location? 3. Which are the two main reasons for why you left your previous location? 3.a. First reason; 3.b. Second reason; 4. Which are the two main reasons for why you chose to come to this location? 4.a. First reason; 4.b. Second reason
1. & 2. Enter Date; 3.a./3.b. Select ONE: Actual conflict in community, Conflict in surrounding area, but not in my community, Fear of conflict in community, Arrival of armed groups, Withdrawal of armed groups/ security forces, Personal threats, Flooding, Lack of livelihood opportunities/job, Lack of health services, Lack of education services, Drought, Lack of water (not drought related), Lack of food (not drought related), Livestock disease outbreak/livestock death, Pressure from authorities, Pressure from host communities, None, I don't know or don’t want to answer; 4.a./4.b. Select ONE: No conflict, Availability of work/ income opportunities, Presence of health services, Presence of education services, Presence of food distribution/food aid, Availability of local food (market/cultivation), Presence of shelter, Presence of water, Presence of cash distribution,
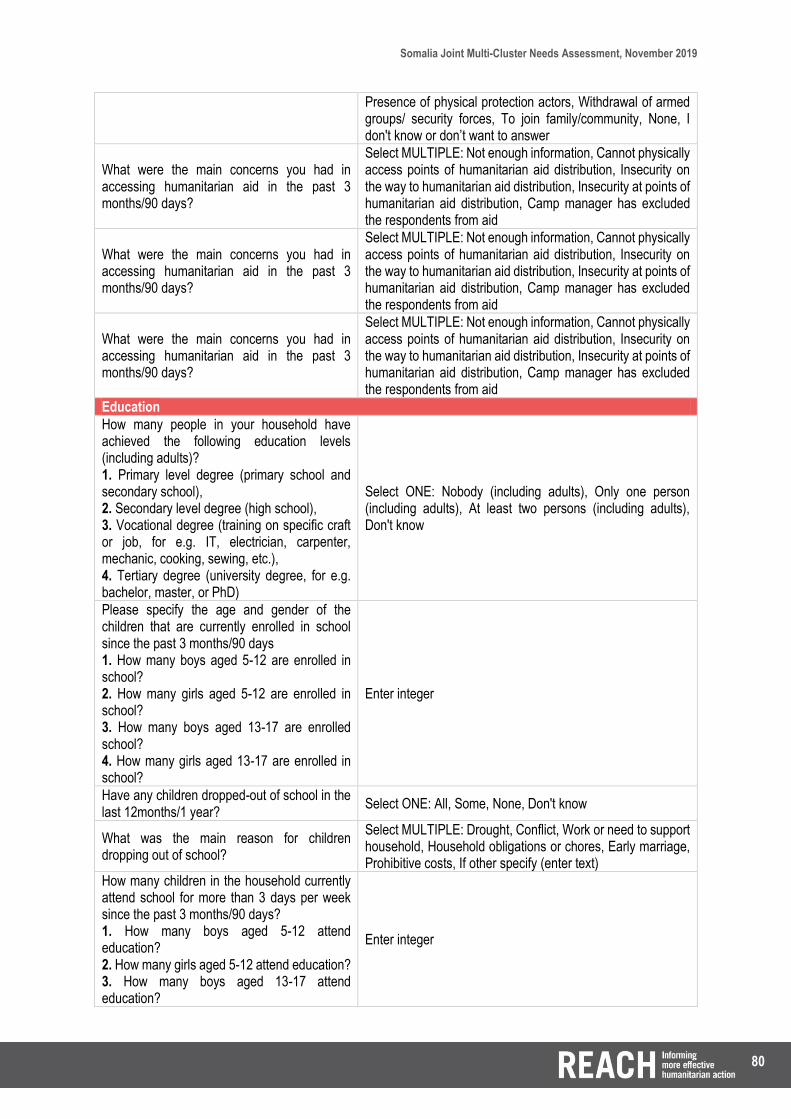
80
Somalia Joint Multi-Cluster Needs Assessment, November 2019
Presence of physical protection actors, Withdrawal of armed groups/ security forces, To join family/community, None, I don't know or don’t want to answer
What were the main concerns you had in accessing humanitarian aid in the past 3 months/90 days?
Select MULTIPLE: Not enough information, Cannot physically access points of humanitarian aid distribution, Insecurity on the way to humanitarian aid distribution, Insecurity at points of humanitarian aid distribution, Camp manager has excluded the respondents from aid
Education
How many people in your household have achieved the following education levels (including adults)? 1. Primary level degree (primary school and secondary school), 2. Secondary level degree (high school), 3. Vocational degree (training on specific craft or job, for e.g. IT, electrician, carpenter, mechanic, cooking, sewing, etc.), 4. Tertiary degree (university degree, for e.g. bachelor, master, or PhD)
Select ONE: Nobody (including adults), Only one person (including adults), At least two persons (including adults), Don't know
Please specify the age and gender of the children that are currently enrolled in school since the past 3 months/90 days 1. How many boys aged 5-12 are enrolled in school? 2. How many girls aged 5-12 are enrolled in school? 3. How many boys aged 13-17 are enrolled school? 4. How many girls aged 13-17 are enrolled in school?
Enter integer
Have any children dropped-out of school in the last 12months/1 year?
Select ONE: All, Some, None, Don't know
What was the main reason for children dropping out of school?
Select MULTIPLE: Drought, Conflict, Work or need to support household, Household obligations or chores, Early marriage, Prohibitive costs, If other specify (enter text)
How many children in the household currently attend school for more than 3 days per week since the past 3 months/90 days? 1. How many boys aged 5-12 attend education? 2. How many girls aged 5-12 attend education? 3. How many boys aged 13-17 attend education?
Enter integer

81
Somalia Joint Multi-Cluster Needs Assessment, November 2019
4. How many girls aged 13-17 attend education?
They are child(ren) that do not attend school regurlary. Were these children attending school for more than 3 days in the last 12months/1 year?
Select ONE: Yes/No/Don't know
1. Do you pay for education? 2. How much on average did the household spend on children's education (school fees, uniforms, books, etc.) in the past 3 months? 3. Has this cost increased or decreased in the past 3 months?
1. Select ONE: Yes/No; 2. Select ONE: Less than 10$/month, 10-50$/month, 50-100$/month, 100+$/month, Don't know; 3. Select ONE: Increased, Decreased, Stayed the same, Don't know
1. How long does it take the children to go to the nearest educational facility (primary, secondary, vocational, quoranic, basic literacy and numeracy classes, university)? 2. How do you get there?
1. Select ONE: Less than 15 mins, 15-30 mins, 30 mins-1h, 1-3h, 3+h; 2. Select ONE: Walking, Car, Bus, Moto, Bicycle, Cart
Have you been able to access the educational facility?
Select ONE: Yes/No
What are the 3 mains concerns you have for school enrollment or attendance? A. First concern; B. Second concern; C. Third concern
A.B.C. Select ONE: There is no school, School stopped functioning and is now closed (Occupied by armed forces, partially damaged, totally damaged, occupied by displaced persons, lack of students), Unsafe to travel or go to school, fear of recruitment in/on way to school, fear of abduction in/on way to school), fear of violence against children at school (corporal punishment, harassment by teachers and other students, bullying, etc.), Cannot afford to pay for the school fees (e.g. school supplies, tuition, textbook, food, uniforms, etc.), cannot afford to pay for transport, recently or continuous movement to different locations, newly arrived at location and have yet to enrol/register, unable to enrol school due to discrimination, poor performance/dismissed, Inability to register or enrol children in the school (Lack of documentation to enrol child), Children cannot physically go to the school (Disability (of child), traumatization (of child), school is too far away, no transport available to bring to school, no fuel available to bring to school, child ill, disabled or unhealthy, child is too young), School and classes are overcrowded, Lack of staff to run the school (Lack of teachers, lack of skilled/trained teachers, lack of gender appropriate teachers/staff), School is in poor condition (e.g. lack of furniture, no electricity, water leaks, poor latrines, poor amenities, etc.), WASH facilities are in poor conditions, WASH facilities are not separated by gender, The curriculum and teaching are not adapted for children (curriculum is not appropriate; language is not appropriate), Children are busy working or supporting the household, Parental refusal to send children to school, Lack of interest of children in education, None, If other specify (enter text)

82
Somalia Joint Multi-Cluster Needs Assessment, November 2019
If available, what would be the main type of support you would require for school enrollment or attendance?
Select ONE: Do not want support, Cash for school fees, Cash for school supplies (bags, pencils), Cash for text books, Cash for transportation to school, Cash for children’s food, Direct provision of school supplies (bags, pencils), Direct provision of text books, Direct provision of school uniforms, Transportation to school, Water and food at school / Food for education, Healthcare at school, Increased access for disabled children, Increased access for minority groups, No response, Don't Know, Other specify (enter text)
Nutrition
Have you or anyone in your household received a visit from the following in the past 6 months: 1. Mobile nutrition team to assess for malnutrition? 2. Mobile team doing MUAC screening for children under age 5?
1.2. Select ONE: Yes/No/Don't know
Have you or anyone in your household received a visit from the following in the past 6 months: 1. Mobile nutrition team to assess for malnutrition? 2. Mobile team doing MUAC screening for pregnant or lactating women?
1.2. Select ONE: Yes/No/Don't know
Are there any pregnant or lactating women in your household using any of the following supplements: Plumpy Sup/Nut or Corn Soybean Based vegetable oil?
Select ONE: Yes/No/Don't know
Are there any children using any of the following supplements: Plumpy Sup, Plumpy Nut?
Select ONE: Yes/No/Don't know
Are there any children enrolled in a nutritional centre or therapeutic feeding centre since the past 6 months?
Select ONE: Yes/No/Don't know
1. How long does it take you to reach the nearest nutritional centre or therapeutic feeding centre? 2. How do you get there?
1. Select ONE: Less than 15 mins, 15-30 mins, 30 mins-1h, 1-3h, 3+h; 2. Select ONE: Walking, Car, Bus, Moto, Bicycle, Cart
Have you been able to access the nearest nutritional centre or therapeutic feeding centre when needed?
Select ONE: Yes/No
Have you or anyone in your household received a visit from the following in the past 6 months: Mobile nutrition team to assess for malnutrition?
Select ONE: Yes/No/Don't know
What are the 3 main concerns you have in accessing nutritional services? A. First concern; B. Second concern; C. Third concern
A.B.C. Select ONE: Unaware that services are available, Unaware that supplements are available, Difficulty in enrolling children in programmes, Facilities too far to travel to, Prohibitive costs, Insecurity in travelling to and from centres, Inaccessible to disabled persons, Inaccessible to minority groups/clans, Facilities not staffed or staff not present, Not enough female/male service providers for female/male claimants, None, If other specify (enter text)
Health
Have any children (less than 5 years old) in the household suffered from the following illnesses or complications in the past 3 months/90 days?
Select MULTIPLE: Malaria, Fever, Acute Watery Diarrhoea (3 or more liqid stools), Respiratory problems, Malnutrition

83
Somalia Joint Multi-Cluster Needs Assessment, November 2019
(diagnosed by health or nutrition center), Other, Don't know, None
Have any other members (i.e. female (not pregnant) above 5 years and male above 5 years) from the household suffered from the following?
Select MULTIPLE: Malaria, Fever, Acute Watery Diarrhoea (3 or more liqid stools), Respiratory problems, Malnutrition (diagnosed by health or nutrition center), Gastrointestinal problems, Other, Don't know, None
Have any pregnant women or any women from the household who gave birth (in the last 6 months) suffered from pre- or post-partum complications (any complications during or immediately after pregnancy)?
Select ONE: Yes/No/Don't know
Where have women in the family given birth in the past year?
Select ONE: Health center / Hospital, At home, Traditional birth attendent house/center, There was no birth last year, Don't Know, If other specify (enter text)
Have all children in the household have been vaccinated?
Select ONE: All, Some, None, Don't know
Do all vaccinated children have a vaccination card?
Select ONE: All, Some, None, Don't know
Does anyone in your household face or has faced one or more of the following problems in the past 12 months/1 year?
Depression: Depressed mood for most of the day, nearly every day, Significant reduction in interest or pleasure in all or vast majority of activities most of the day, nearly every day, Significant weight loss when not dieting or weight gain, or decrease/increase in appetite, nearly every day, Slow thought and responses and slow movement, Feeling fatigued or loss of energy nearly every day, Feelings of guilt or lack of self-value, nearly every day, Reduced ability to think or concentrate, nearly every day, Recurrent thoughts of suicide or death, or attempts at suicide; Schizophrenia: Delusions, Hallucinations, Disorganised speech, or lack of sense in speech, Always disorganised, Catatonic behaviour, Diminished emotional expression; Mental health stressors: Inappropriate affect (for e.g. laughing in the absence of a stimulus, intense fear without reason, etc.), Disturbed sleep patterns (sleeping excessively, or very little, nearly every day), Excessive eating, Dysphoric mood (depression, anxiety, anger, violence), Depersonalisation (detachment or disconnect from self), Derealisation (a feeling that surroundings are not real), Cognitive deficits impacting language, processing, executive function, and/or memory, Hostility and aggression, Lack of social cognition (for e.g. does not talk to anybody), Excessive khat consumption; None of the above; Don't know
Has anyone in your family been chained? Select ONE: Yes/No/Don't know
1. Do you pay for health care? 2. How much on average did the household spend on healthcare (consultation, medicine) in the past 3 months/90 days? 3. Has this cost increased or decreased in the past 3 months/90 days?
1. Select ONE: Yes/No; 2. Select ONE: Less than 10$/month, 10-50$/month, 50-100$/month, 100+$/month, Don't know; 3. Select ONE: Increased, Decreased, Stayed the same, Don't know
Were you able to access a healthcare facility in response to this issue? (Asked as a follow-up question to the two questions regarding the
Select ONE: Yes/No

84
Somalia Joint Multi-Cluster Needs Assessment, November 2019
'incidence of disease' indicator, and first question on maternal health)
1. How long does it take you to reach the nearest healthcare facility? 2. How do you get there? 3. What is the type of health facility?
1. Select ONE: Less than 15 mins, 15-30 mins, 30 mins-1h, 1-3h, 3+h; 2. Select ONE: Walking, Car, Bus, Moto, Bicycle, Cart; 3. Select ONE: Government clinic or hospital, Private clinic or hospital, NGO run clinic or hospital, Traditional mid-wife, Traditional healer, Pharmacy, Shop selling medication, Other specify (enter text)
Have you or anyone in your household had access to a mobile health team (doctors, nurses, NGO) in the past 6 months?
Select ONE: Yes/No/Don't know
What are the 3 main concerns you have in accessing healthcare services? A. First concern; B. Second concern; C. Third concern
A.B.C. Select ONE: There were never any health facilities nearby, We can't afford to use the facility, The facility is too far away, The facility is inaccessible due to insecurity, Not enough staff, Facility has no or low quality medical supplies and/or medicines, Inaccessible to disabled persons, Inaccessible to minority groups/clans, Staff not qualified, Facilities not specialised for type of treatment sought, Not enough female/male healthcare workers for female/male patients, Health facility is not functional due to flooding, Unaware that facilities are available, Health facility is not functional for another reason, None, Other specify (enter text)
Why have children not been vaccinated? A. First reason; B. Second reason; C. Third reason
A.B.C. Select ONE: There were never any health facilities nearby, We can't afford to use the facility, The facility is too far away, The facility is inaccessible due to insecurity, Not enough staff, Facility has no or low quality medical supplies and/or medicines, Inaccessible to disabled persons, Inaccessible to minority groups/clans, Staff not qualified, Facilities not specialised for type of treatment sought, Not enough female/male healthcare workers for female/male patients, Health facility is not functional due to flooding, Unaware that facilities are available, Health facility is not functional for another reason, None, Other specify (enter text)
If available, what would be the main type of support you would require for healthcare or accessing healthcare facilities?
Select ONE: Cash for medicines, Cash for doctor’s fees, Direct provision (Medicines), Transport to facilities, More qualified healthcare workers at facilities, More qualified healthcare workers for home-visits, Increased access for physically disabled persons, Increased services for mentally disabled persons, Increased services for addictions and consumption of khat, Increased services for pregnant or lactating women, Increased access for minority groups/clans, Infrastructure provision (More healthcare facilities, Near healthcare facilities), If other specify (enter text), Do not want support
If available, what would be the main type of support you would require for vaccinating children?
Select ONE: Cash for vaccines, Cash for doctor’s fees, Direct provision (Vaccines), Transport to facilities, More qualified healthcare workers at facilities, More qualified healthcare workers for home-visits, Increased access for physically disabled persons, Home visits for vaccinations, Increased access for minority groups/clans, Infrastructure provision (More healthcare facilities, Near healthcare facilities), If other specify (enter text), Do not want support
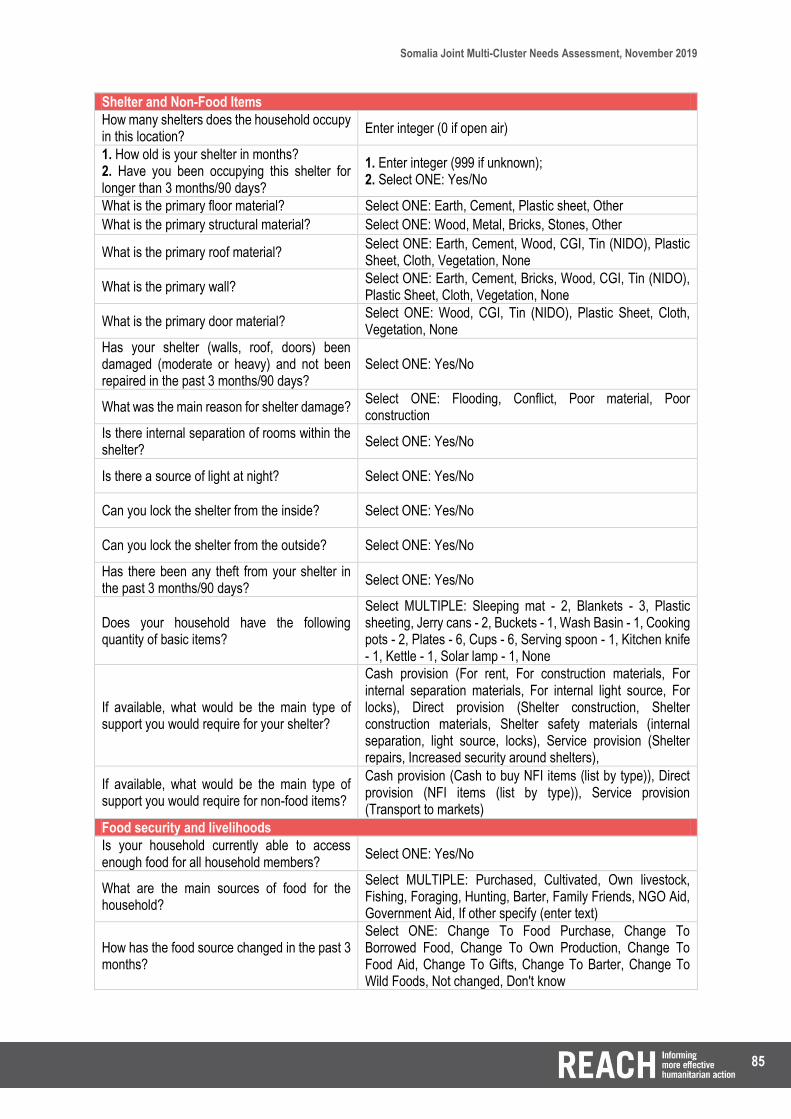
85
Somalia Joint Multi-Cluster Needs Assessment, November 2019
Shelter and Non-Food Items
How many shelters does the household occupy in this location?
Enter integer (0 if open air)
1. How old is your shelter in months? 2. Have you been occupying this shelter for longer than 3 months/90 days?
1. Enter integer (999 if unknown); 2. Select ONE: Yes/No
What is the primary floor material? Select ONE: Earth, Cement, Plastic sheet, Other
What is the primary structural material? Select ONE: Wood, Metal, Bricks, Stones, Other
What is the primary roof material? Select ONE: Earth, Cement, Wood, CGI, Tin (NIDO), Plastic Sheet, Cloth, Vegetation, None
What is the primary wall? Select ONE: Earth, Cement, Bricks, Wood, CGI, Tin (NIDO), Plastic Sheet, Cloth, Vegetation, None
What is the primary door material? Select ONE: Wood, CGI, Tin (NIDO), Plastic Sheet, Cloth, Vegetation, None
Has your shelter (walls, roof, doors) been damaged (moderate or heavy) and not been repaired in the past 3 months/90 days?
Select ONE: Yes/No
What was the main reason for shelter damage? Select ONE: Flooding, Conflict, Poor material, Poor construction
Is there internal separation of rooms within the shelter?
Select ONE: Yes/No
Is there a source of light at night? Select ONE: Yes/No
Can you lock the shelter from the inside? Select ONE: Yes/No
Can you lock the shelter from the outside? Select ONE: Yes/No
Has there been any theft from your shelter in the past 3 months/90 days?
Select ONE: Yes/No
Does your household have the following quantity of basic items?
Select MULTIPLE: Sleeping mat - 2, Blankets - 3, Plastic sheeting, Jerry cans - 2, Buckets - 1, Wash Basin - 1, Cooking pots - 2, Plates - 6, Cups - 6, Serving spoon - 1, Kitchen knife - 1, Kettle - 1, Solar lamp - 1, None
If available, what would be the main type of support you would require for your shelter?
Cash provision (For rent, For construction materials, For internal separation materials, For internal light source, For locks), Direct provision (Shelter construction, Shelter construction materials, Shelter safety materials (internal separation, light source, locks), Service provision (Shelter repairs, Increased security around shelters),
If available, what would be the main type of support you would require for non-food items?
Cash provision (Cash to buy NFI items (list by type)), Direct provision (NFI items (list by type)), Service provision (Transport to markets)
Food security and livelihoods
Is your household currently able to access enough food for all household members?
Select ONE: Yes/No
What are the main sources of food for the household?
Select MULTIPLE: Purchased, Cultivated, Own livestock, Fishing, Foraging, Hunting, Barter, Family Friends, NGO Aid, Government Aid, If other specify (enter text)
How has the food source changed in the past 3 months?
Select ONE: Change To Food Purchase, Change To Borrowed Food, Change To Own Production, Change To Food Aid, Change To Gifts, Change To Barter, Change To Wild Foods, Not changed, Don't know
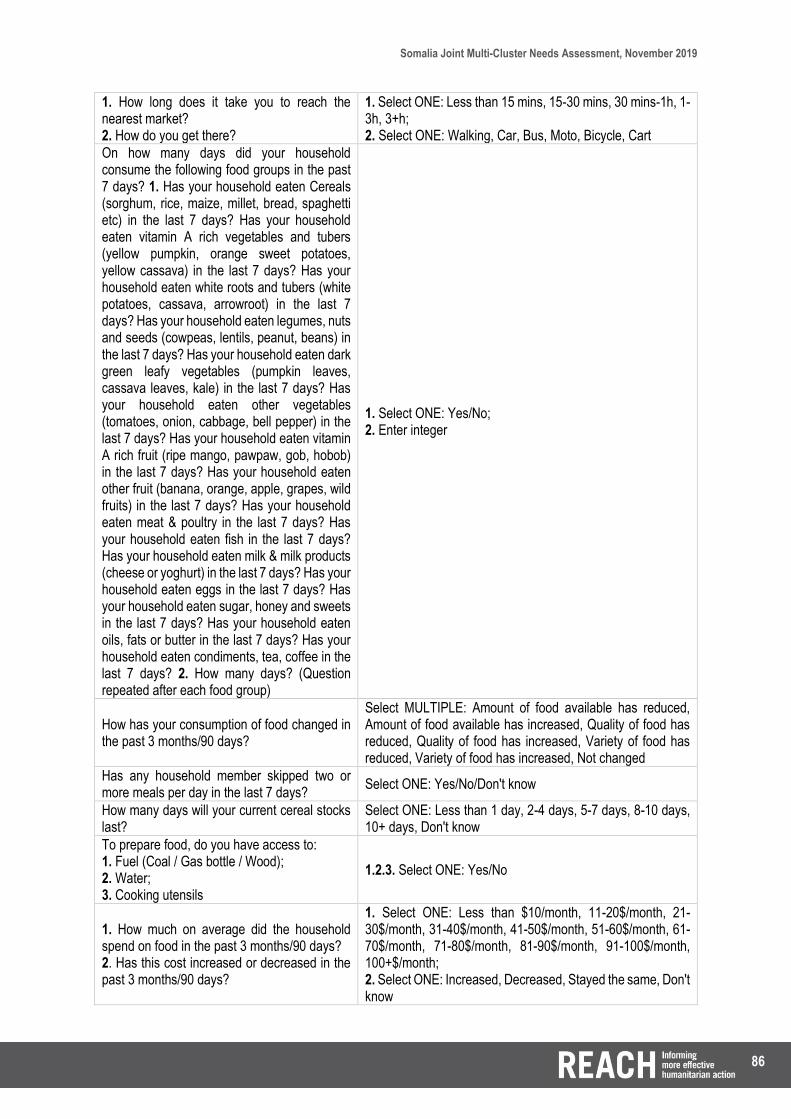
86
Somalia Joint Multi-Cluster Needs Assessment, November 2019
1. How long does it take you to reach the nearest market? 2. How do you get there?
1. Select ONE: Less than 15 mins, 15-30 mins, 30 mins-1h, 1-3h, 3+h; 2. Select ONE: Walking, Car, Bus, Moto, Bicycle, Cart
On how many days did your household consume the following food groups in the past 7 days? 1. Has your household eaten Cereals (sorghum, rice, maize, millet, bread, spaghetti etc) in the last 7 days? Has your household eaten vitamin A rich vegetables and tubers (yellow pumpkin, orange sweet potatoes, yellow cassava) in the last 7 days? Has your household eaten white roots and tubers (white potatoes, cassava, arrowroot) in the last 7 days? Has your household eaten legumes, nuts and seeds (cowpeas, lentils, peanut, beans) in the last 7 days? Has your household eaten dark green leafy vegetables (pumpkin leaves, cassava leaves, kale) in the last 7 days? Has your household eaten other vegetables (tomatoes, onion, cabbage, bell pepper) in the last 7 days? Has your household eaten vitamin A rich fruit (ripe mango, pawpaw, gob, hobob) in the last 7 days? Has your household eaten other fruit (banana, orange, apple, grapes, wild fruits) in the last 7 days? Has your household eaten meat & poultry in the last 7 days? Has your household eaten fish in the last 7 days? Has your household eaten milk & milk products (cheese or yoghurt) in the last 7 days? Has your household eaten eggs in the last 7 days? Has your household eaten sugar, honey and sweets in the last 7 days? Has your household eaten oils, fats or butter in the last 7 days? Has your household eaten condiments, tea, coffee in the last 7 days? 2. How many days? (Question repeated after each food group)
1. Select ONE: Yes/No; 2. Enter integer
How has your consumption of food changed in the past 3 months/90 days?
Select MULTIPLE: Amount of food available has reduced, Amount of food available has increased, Quality of food has reduced, Quality of food has increased, Variety of food has reduced, Variety of food has increased, Not changed
Has any household member skipped two or more meals per day in the last 7 days?
Select ONE: Yes/No/Don't know
How many days will your current cereal stocks last?
Select ONE: Less than 1 day, 2-4 days, 5-7 days, 8-10 days, 10+ days, Don't know
To prepare food, do you have access to: 1. Fuel (Coal / Gas bottle / Wood); 2. Water; 3. Cooking utensils
1.2.3. Select ONE: Yes/No
1. How much on average did the household spend on food in the past 3 months/90 days? 2. Has this cost increased or decreased in the past 3 months/90 days?
1. Select ONE: Less than $10/month, 11-20$/month, 21-30$/month, 31-40$/month, 41-50$/month, 51-60$/month, 61-70$/month, 71-80$/month, 81-90$/month, 91-100$/month, 100+$/month; 2. Select ONE: Increased, Decreased, Stayed the same, Don't know
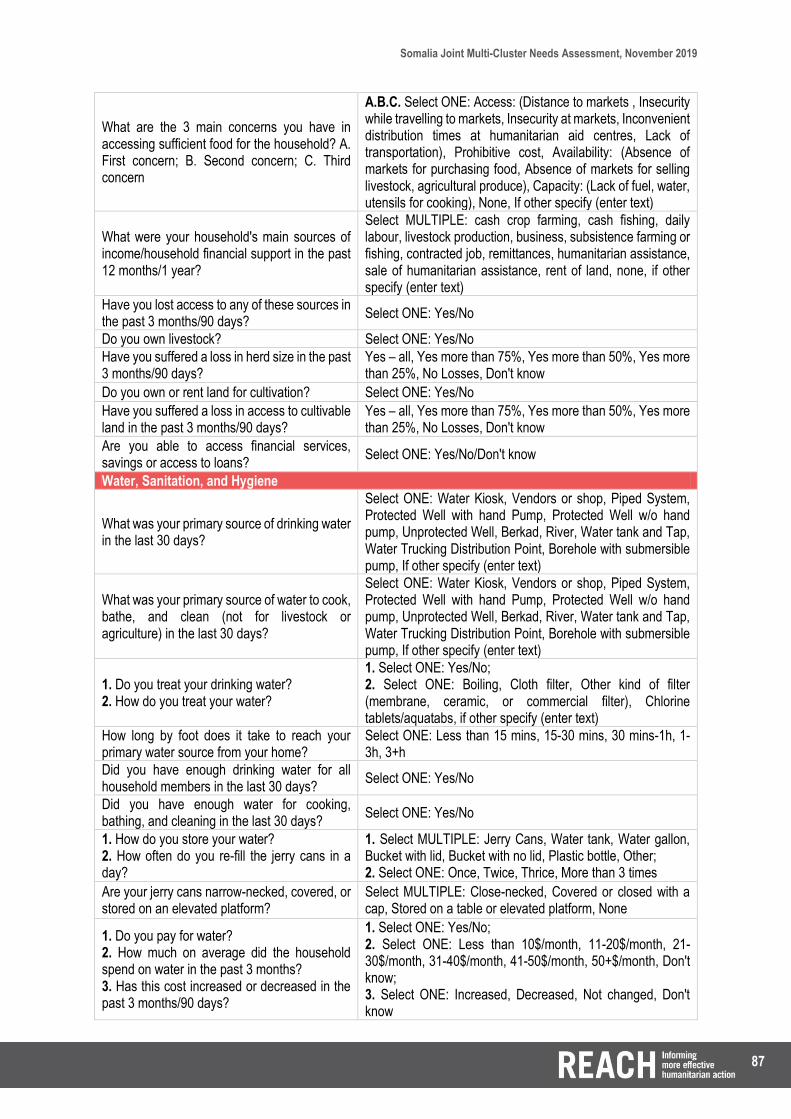
87
Somalia Joint Multi-Cluster Needs Assessment, November 2019
What are the 3 main concerns you have in accessing sufficient food for the household? A. First concern; B. Second concern; C. Third concern
A.B.C. Select ONE: Access: (Distance to markets , Insecurity while travelling to markets, Insecurity at markets, Inconvenient distribution times at humanitarian aid centres, Lack of transportation), Prohibitive cost, Availability: (Absence of markets for purchasing food, Absence of markets for selling livestock, agricultural produce), Capacity: (Lack of fuel, water, utensils for cooking), None, If other specify (enter text)
What were your household's main sources of income/household financial support in the past 12 months/1 year?
Select MULTIPLE: cash crop farming, cash fishing, daily labour, livestock production, business, subsistence farming or fishing, contracted job, remittances, humanitarian assistance, sale of humanitarian assistance, rent of land, none, if other specify (enter text)
Have you lost access to any of these sources in the past 3 months/90 days?
Select ONE: Yes/No
Do you own livestock? Select ONE: Yes/No
Have you suffered a loss in herd size in the past 3 months/90 days?
Yes – all, Yes more than 75%, Yes more than 50%, Yes more than 25%, No Losses, Don't know
Do you own or rent land for cultivation? Select ONE: Yes/No
Have you suffered a loss in access to cultivable land in the past 3 months/90 days?
Yes – all, Yes more than 75%, Yes more than 50%, Yes more than 25%, No Losses, Don't know
Are you able to access financial services, savings or access to loans?
Select ONE: Yes/No/Don't know
Water, Sanitation, and Hygiene
What was your primary source of drinking water in the last 30 days?
Select ONE: Water Kiosk, Vendors or shop, Piped System, Protected Well with hand Pump, Protected Well w/o hand pump, Unprotected Well, Berkad, River, Water tank and Tap, Water Trucking Distribution Point, Borehole with submersible pump, If other specify (enter text)
What was your primary source of water to cook, bathe, and clean (not for livestock or agriculture) in the last 30 days?
Select ONE: Water Kiosk, Vendors or shop, Piped System, Protected Well with hand Pump, Protected Well w/o hand pump, Unprotected Well, Berkad, River, Water tank and Tap, Water Trucking Distribution Point, Borehole with submersible pump, If other specify (enter text)
1. Do you treat your drinking water? 2. How do you treat your water?
1. Select ONE: Yes/No; 2. Select ONE: Boiling, Cloth filter, Other kind of filter (membrane, ceramic, or commercial filter), Chlorine tablets/aquatabs, if other specify (enter text)
How long by foot does it take to reach your primary water source from your home?
Select ONE: Less than 15 mins, 15-30 mins, 30 mins-1h, 1-3h, 3+h
Did you have enough drinking water for all household members in the last 30 days?
Select ONE: Yes/No
Did you have enough water for cooking, bathing, and cleaning in the last 30 days?
Select ONE: Yes/No
1. How do you store your water? 2. How often do you re-fill the jerry cans in a day?
1. Select MULTIPLE: Jerry Cans, Water tank, Water gallon, Bucket with lid, Bucket with no lid, Plastic bottle, Other; 2. Select ONE: Once, Twice, Thrice, More than 3 times
Are your jerry cans narrow-necked, covered, or stored on an elevated platform?
Select MULTIPLE: Close-necked, Covered or closed with a cap, Stored on a table or elevated platform, None
1. Do you pay for water? 2. How much on average did the household spend on water in the past 3 months? 3. Has this cost increased or decreased in the past 3 months/90 days?
1. Select ONE: Yes/No; 2. Select ONE: Less than 10$/month, 11-20$/month, 21-30$/month, 31-40$/month, 41-50$/month, 50+$/month, Don't know; 3. Select ONE: Increased, Decreased, Not changed, Don't know

88
Somalia Joint Multi-Cluster Needs Assessment, November 2019
Does your household have access to a latrine? Select ONE: Yes - personal latrine, Yes - shared latrine, No latrine
Does your household have access to a latrine? Select ONE: Yes - personal latrine, Yes - shared latrine, No latrine
Do you share the latrine with more than 2 other households (not including your own)?
Select ONE: Yes/No
What type of latrine do you mainly use? Select ONE: Flush latrine to the open, Flush latrine to a tank/sewer system/pit, Pit latrine covered/with slab, Pit latrine open/without slab, If other specify (enter text)
Are latrines used by your household separated by gender?
Select ONE: Yes/No
Are latrines used by your household accessible for disabled people?
Select ONE: Yes/No
Are latrines used by your household lockable from the inside?
Select ONE: Yes/No
Do latrines used by your household have functional facilities for handwashing (water and soap)?
Select ONE: Yes/No
Do latrines used by your household have lighting at night?
Select ONE: Yes/No
How hygienic were latrines in the last 30 days? Select ONE: Very hygienic, Hygienic, Unhygienic, Very unhygienic
How long by foot does it take to reach the nearest latrine you use from your home?
Select ONE: Less than 15 mins, 15-30 mins, 30 mins-1h, 1-3h, 3+h
How do you dispose of faeces, and/or faeces of children?
Select ONE: Household or communal covered pit, Burial if in designated areas far from houses and water sources, In open, Burning - near or far from home
What environmental sanitation problems does the household face? (direct observation within 10m of dwelling)
Select MULTIPLE: Faecal matter, Stagnant water, Solid household waste matter, Decaying organic matter such as dead animals, Rodents, None
At what times do you wash your hands?
Select Multiple: Before eating, Before feeding baby (including breastfeeding), Before preparing food, Serving food, After defecating, After disposing of baby's faeces/washing baby's bottom, After eating, I never wash my hands, Other
Do you have soap in your household or daily access to soap?
Select ONE: Yes/No
Do women in the household have access to and use hygienic menstruation materials?
Select ONE: Yes/No/Don't know
How long by foot does it take to reach the nearest handwashing facility you use from your home?
Select ONE: Less than 15 mins, 15-30 mins, 30 mins-1h, 1-3h, 3+h
What are the 3 main concerns you have in accessing drinking water, or water for cooking, cleaning, bathing? A. First concern; B. Second concern; C. Third concern
A.B.C. Select ONE: Availability: (Irregular supply, Not enough water at source), Capacity: (Not enough jerry-cans, containers, storage capacity), Quality: (Poor water quality, Functionality of water source), Access: (Distance to source (>500m, or >7 minutes walking), Excessive waiting time at source (>30 minutes), Insecurity while travelling to source, Insecurity at water source, Prohibitive cost, None, if other specify (enter text)
What are the 3 main concerns you have in accessing latrines? A. First concern; B. Second concern; C. Third concern
A.B.C. Select ONE: Access: Distance to facility (>50m), Excessive waiting time at facility (>30 minutes), Insecurity while travelling to latrines, Insecurity at latrines, Not accessible for disabled persons, No access for minority groups/clans, Quality: No gender segregation, No walls or

89
Somalia Joint Multi-Cluster Needs Assessment, November 2019
internal light, No lock on inside of door, Not cleaned or maintained, Facilities are full, Facilities are crowded, None, if other specify (enter text)
What are the 3 main concerns you have in accessing handwashing facilities or hygienic menstruation materials? A. First concern; B. Second concern; C. Third concern
A.B.C. Select ONE: Not enough water or no washbasins, No soap, Difficulty in obtaining soap, Difficulty in obtaining menstruation materials, None, if other specify (enter text)
If difficulty in obtaining soap: Select ONE: Believe to be unnecessary, Cost, No functioning markets, Insecurity travelling to, or at markets, Quality
If difficulty in obtaining menstruation materials Select ONE: Believe to be unnecessary, Cost, Functioning markets, Insecurity travelling to, or at markets, Not re-usable, No washing possible
If available, what would be the main type of support you would require for accessing drinking water or water for cooking, bathing, cleaning?
Select ONE: Cash support (To buy water, To buy jerry-cans or tanks), Direct provision (Treatment means (chlorine tabs, filters, fuel for boiling water), Tanks or jerry-cans for increased storage capacity, Service provision (Transport to markets, Transport to water distribution points, Increased access for disabled persons, Increased access for minority groups/clans, Increased security at water distribution points), Infrastructure provision (Nearer water distribution points, More water distribution points)
If available, what would be the main type of support you would require for accessing latrines?
Direct provision (Water and soap at facilities, Containers for waste-disposal), Infrastructure provision (Nearer facilities, More facilities, More private facilities (lights, locks, etc.), Washbasin at facilities, Service provision (Cleaner facilities, Increased security at facilities, Increased access for disabled persons, Increased access for minority groups/clans)
If available, what would be the main type of support you would require for accessing handwashing facilities, hygienic materials?
Select ONE: Cash support only (to buy materials), Direct provision (soap, menstruation materials by type), Service provision (Transport to markets)
Has your household been consulted, or able to participate in the design, location, delivery of drinking water or water sources?
Select ONE: Yes/No/Don't know
Has your household been consulted, or able to participate in the design, location, delivery of sanitation facilities?
Select ONE: Yes/No/Don't know
Do you believe that water sources are well developed and sustainable?
Select ONE: Yes/No/Don't know
Protection
Are members of your household able to move freely in the community and surrounding area?
Select ONE: Yes/No
1. Are there any areas in your community where boys or men do not feel safe? 2. Where do boys and men not feel safe? 3. Are there any areas in your community where girls or women do not feel safe? 4. Where do girls and women not feel safe?
1. 3. Select ONE: Yes/No/Don't know; 2. 4. Select MULTIPLE: In shelters, When leaving settlement/town, Water points, Latrines, Bathing areas, Markets, Schools, Health centres, Feeding centres, Humanitarian aid distribution points, Choose not to answer, If other specify (enter text)
1. Were there any household members separated from the household in the past 3 months/90 days? 2. What is the gender and age of the separated member?
1. Select ONE: Yes/No/Don't know; 2. Select MULTIPLE: Female below 18, Female above 18, Male below 18, Male above 18; 3. Select MULTIPLE: Staying with relatives, Flood, Drought, Conflict, Missing (no reason), Abducted, Voluntarily joined armed groups, Forcibly joined armed groups, Detained (no

90
Somalia Joint Multi-Cluster Needs Assessment, November 2019
3. Why was the person separated from the household?
reason), Left house to study, Left house to work, Early marriage
1. Were there any household members separated from the household in the past 3 months/90 days? 2. What is the gender and age of the separated member? 3. Why was the person separated from the household?
1. Select ONE: Yes/No/Don't know; 2. Select MULTIPLE: Female below 18, Female above 18, Male below 18, Male above 18; 3. Select MULTIPLE: Staying with relatives, Flood, Drought, Conflict, Missing (no reason), Abducted, Voluntarily joined armed groups, Forcibly joined armed groups, Detained (no reason), Left house to study, Left house to work, Early marriage, Don't know
1. In the last 3 months/90 days, were you or your household members worried about theft or harassment? 2. In the last 3 months/90 days, were you or your household members worried about light or moderate injuries due to accidents or violence (for e.g. injuries which can interrupt normal activities for a few days; no permanent disabilities)? 3. In the last 3 months/90 days, were you or your household members worried about grave injuries due to accident or violence (for e.g. injuries resulting in permanent disabilities, long term interruption of normal activities)? 4. In the last 3 months/90 days, were you or your household members worried about sexual or gender-based violence? 5. In the last 3 months/90 days, were you or your household members worried about abductions or kidnapping? 6. In the last 3 months/90 days, were you or your household members worried about landmines or unexploded ordinance or dangerous debris? 7. In the last 3 months/90 days, were you or your household members worried about the risk or danger of death?
1.2.3.4.5.6.7. Select ONE: Never, Sometimes, Always
1. Is anyone in your household currently working in dangerous or illegal conditions of work, or working without being paid? 2. What is the gender and age of the household member engaged in such work?
1. Select ONE: Yes/No/Don't know; 2. Select MULTIPLE: Female below 18, Female above 18, Male below 18, Male above 18;
1. Do you own the land you are settled on or the dwelling in which you live? 2. Do you own any documentation indicating land tenure or rental agreement?
1.2. Select ONE: Yes/No/Don't know

91
Somalia Joint Multi-Cluster Needs Assessment, November 2019
1. Have you lost or have had any ownership or rental documents destroyed in the last 3 months/90 days? 2. If you do not have a written property title of ownership, do you think you could obtain it? 3. If you needed to, could you renew your rental contract or obtain a new one?
1.2.3. Select ONE: Yes/No/Don't know
Have you had any land seized or grabbed from you in your area of origin or your previous location of residence?
Select ONE: Yes/No/Don't know
Do you have any housing, land, or property-related disputes with other households, land-owners, rent-collectors, or tenants in the past 3 months/90 days?
Select ONE: Yes/No/Don't know
1. Have you made use of a dispute resolution mechanism in the past 3 months/90 days? 2. Have you been satisfied with the dispute resolution mechanism that you have made use of?
1.2. Select ONE: Yes/No/Don't know
The following section is going to ask about Sexual and Gender Based Violence, do you feel comfortable in replying to those questions?
Select ONE: Yes/No
Where do women and girls go if they have experienced some form of violence?
Select MULTIPLE: Community leader, Community elders, Health centre, UN or NGO agency, Police, Armed group, Nowhere to report, Would not report it, Don't know/Don't want to answer, If other specify (enter text)
Are you aware of any medical, legal, psychosocial services available in case of an attack of sexual or gender based violence?
Select ONE: Yes/No/Don't know
1. Has anyone in the household made use of SGBV medical, legal, or psychosocial services in the past 6 months? 2. Have you been satisfied with the SGBV services offered?
1.2. Select ONE: Yes/No/Don't know
1. Where would you go if a crime has been committed against you or a member of your household? 2. Can you access effective and affordable judicial remedy? 3. Do you trust that your request will be treated appropriately and without unreasonable delays?
1. Select MULTIPLE: Community leader, Community elders, Health centre, UN or NGO agency, Police, Armed group, Nowhere to report, Would not report it, Don't know/Don't want to answer, If other specify (enter text); 2.3. Select ONE: Yes/No/Don't know
Have any children in the household been injured in the past 2 weeks/14 days?
Select ONE: Yes/No/Don't know
Is there a child-friendly space in your community where children can meet and play with or without supervision (for e.g. a park, gym, playground, etc.)?
Select ONE: Yes/No/Don't know
Are there any medical, legal, or social services for children in your community or area of residence?
Select ONE: Yes/No/Don't know
Are you satisfied with using such services? Select ONE: Yes/No/Don't know/Have not used services
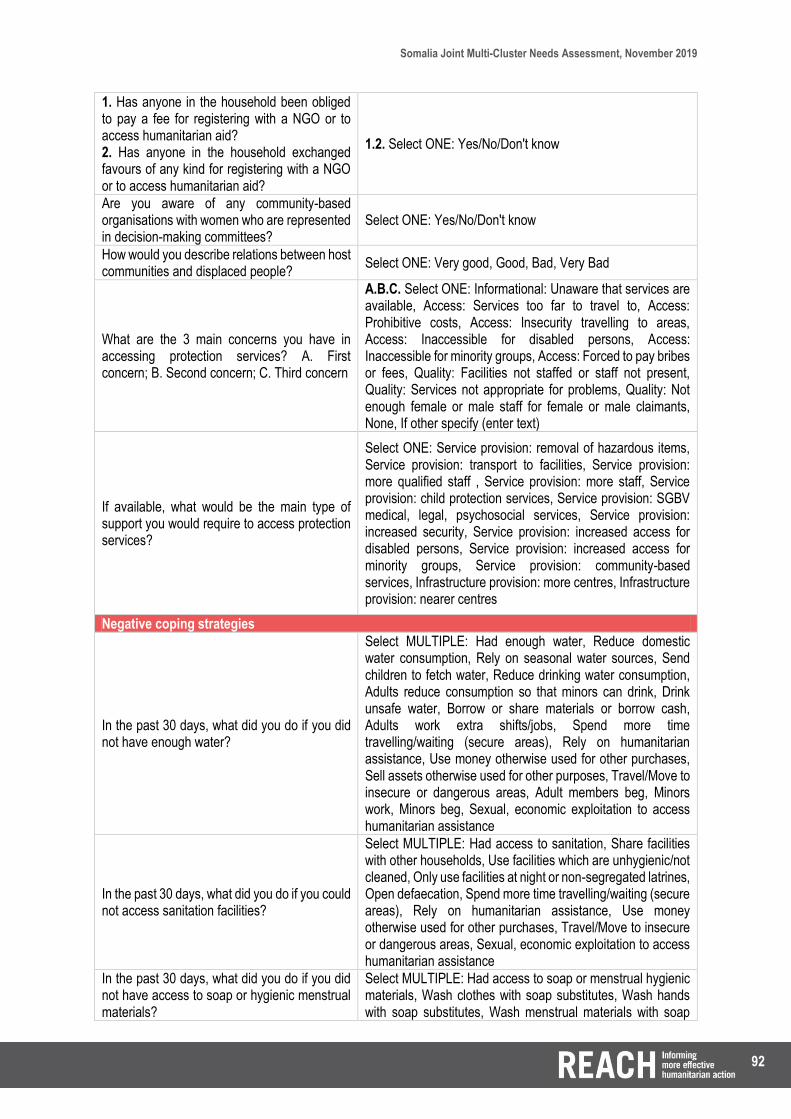
92
Somalia Joint Multi-Cluster Needs Assessment, November 2019
1. Has anyone in the household been obliged to pay a fee for registering with a NGO or to access humanitarian aid? 2. Has anyone in the household exchanged favours of any kind for registering with a NGO or to access humanitarian aid?
1.2. Select ONE: Yes/No/Don't know
Are you aware of any community-based organisations with women who are represented in decision-making committees?
Select ONE: Yes/No/Don't know
How would you describe relations between host communities and displaced people?
Select ONE: Very good, Good, Bad, Very Bad
What are the 3 main concerns you have in accessing protection services? A. First concern; B. Second concern; C. Third concern
A.B.C. Select ONE: Informational: Unaware that services are available, Access: Services too far to travel to, Access: Prohibitive costs, Access: Insecurity travelling to areas, Access: Inaccessible for disabled persons, Access: Inaccessible for minority groups, Access: Forced to pay bribes or fees, Quality: Facilities not staffed or staff not present, Quality: Services not appropriate for problems, Quality: Not enough female or male staff for female or male claimants, None, If other specify (enter text)
If available, what would be the main type of support you would require to access protection services?
Select ONE: Service provision: removal of hazardous items, Service provision: transport to facilities, Service provision: more qualified staff , Service provision: more staff, Service provision: child protection services, Service provision: SGBV medical, legal, psychosocial services, Service provision: increased security, Service provision: increased access for disabled persons, Service provision: increased access for minority groups, Service provision: community-based services, Infrastructure provision: more centres, Infrastructure provision: nearer centres
Negative coping strategies
In the past 30 days, what did you do if you did not have enough water?
Select MULTIPLE: Had enough water, Reduce domestic water consumption, Rely on seasonal water sources, Send children to fetch water, Reduce drinking water consumption, Adults reduce consumption so that minors can drink, Drink unsafe water, Borrow or share materials or borrow cash, Adults work extra shifts/jobs, Spend more time travelling/waiting (secure areas), Rely on humanitarian assistance, Use money otherwise used for other purchases, Sell assets otherwise used for other purposes, Travel/Move to insecure or dangerous areas, Adult members beg, Minors work, Minors beg, Sexual, economic exploitation to access humanitarian assistance
In the past 30 days, what did you do if you could not access sanitation facilities?
Select MULTIPLE: Had access to sanitation, Share facilities with other households, Use facilities which are unhygienic/not cleaned, Only use facilities at night or non-segregated latrines, Open defaecation, Spend more time travelling/waiting (secure areas), Rely on humanitarian assistance, Use money otherwise used for other purchases, Travel/Move to insecure or dangerous areas, Sexual, economic exploitation to access humanitarian assistance
In the past 30 days, what did you do if you did not have access to soap or hygienic menstrual materials?
Select MULTIPLE: Had access to soap or menstrual hygienic materials, Wash clothes with soap substitutes, Wash hands with soap substitutes, Wash menstrual materials with soap
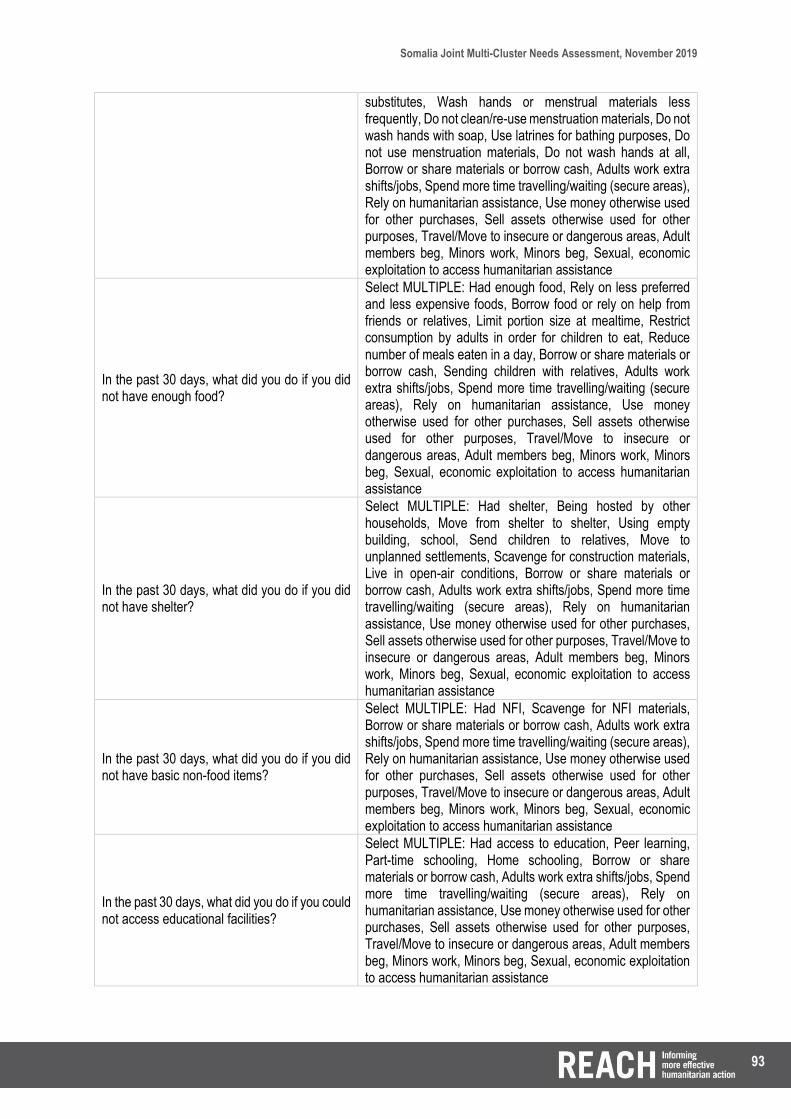
93
Somalia Joint Multi-Cluster Needs Assessment, November 2019
substitutes, Wash hands or menstrual materials less frequently, Do not clean/re-use menstruation materials, Do not wash hands with soap, Use latrines for bathing purposes, Do not use menstruation materials, Do not wash hands at all, Borrow or share materials or borrow cash, Adults work extra shifts/jobs, Spend more time travelling/waiting (secure areas), Rely on humanitarian assistance, Use money otherwise used for other purchases, Sell assets otherwise used for other purposes, Travel/Move to insecure or dangerous areas, Adult members beg, Minors work, Minors beg, Sexual, economic exploitation to access humanitarian assistance
In the past 30 days, what did you do if you did not have enough food?
Select MULTIPLE: Had enough food, Rely on less preferred and less expensive foods, Borrow food or rely on help from friends or relatives, Limit portion size at mealtime, Restrict consumption by adults in order for children to eat, Reduce number of meals eaten in a day, Borrow or share materials or borrow cash, Sending children with relatives, Adults work extra shifts/jobs, Spend more time travelling/waiting (secure areas), Rely on humanitarian assistance, Use money otherwise used for other purchases, Sell assets otherwise used for other purposes, Travel/Move to insecure or dangerous areas, Adult members beg, Minors work, Minors beg, Sexual, economic exploitation to access humanitarian assistance
In the past 30 days, what did you do if you did not have shelter?
Select MULTIPLE: Had shelter, Being hosted by other households, Move from shelter to shelter, Using empty building, school, Send children to relatives, Move to unplanned settlements, Scavenge for construction materials, Live in open-air conditions, Borrow or share materials or borrow cash, Adults work extra shifts/jobs, Spend more time travelling/waiting (secure areas), Rely on humanitarian assistance, Use money otherwise used for other purchases, Sell assets otherwise used for other purposes, Travel/Move to insecure or dangerous areas, Adult members beg, Minors work, Minors beg, Sexual, economic exploitation to access humanitarian assistance
In the past 30 days, what did you do if you did not have basic non-food items?
Select MULTIPLE: Had NFI, Scavenge for NFI materials, Borrow or share materials or borrow cash, Adults work extra shifts/jobs, Spend more time travelling/waiting (secure areas), Rely on humanitarian assistance, Use money otherwise used for other purchases, Sell assets otherwise used for other purposes, Travel/Move to insecure or dangerous areas, Adult members beg, Minors work, Minors beg, Sexual, economic exploitation to access humanitarian assistance
In the past 30 days, what did you do if you could not access educational facilities?
Select MULTIPLE: Had access to education, Peer learning, Part-time schooling, Home schooling, Borrow or share materials or borrow cash, Adults work extra shifts/jobs, Spend more time travelling/waiting (secure areas), Rely on humanitarian assistance, Use money otherwise used for other purchases, Sell assets otherwise used for other purposes, Travel/Move to insecure or dangerous areas, Adult members beg, Minors work, Minors beg, Sexual, economic exploitation to access humanitarian assistance

94
Somalia Joint Multi-Cluster Needs Assessment, November 2019
In the past 30 days, what did you do if you could not access healthcare facilities?
Select MULTIPLE: Had access to healthcare, Self-medicate, Seek treatment or service from unqualified workers, Do not seek treatment or healthcare when sick, Borrow or share materials or borrow cash, Adults work extra shifts/jobs, Spend more time travelling/waiting (secure areas), Rely on humanitarian assistance, Use money otherwise used for other purchases, Sell assets otherwise used for other purposes, Travel/Move to insecure or dangerous areas, Adult members beg, Minors work, Minors beg, Sexual, economic exploitation to access humanitarian assistance
In the past 30 days what did you do if you did not have enough resources or access to basic services?
Select MULTIPLE: Had enough resources or access to basic services, Borrow or share materials or borrow cash, Adults work extra shifts/jobs, Spend more time travelling/waiting (secure areas), Rely on humanitarian assistance, Use money otherwise used for other purchases, Sell assets otherwise used for other purposes, Travel/Move to insecure or dangerous areas, Adult members beg, Minors work, Minors beg, Sexual, economic exploitation to access humanitarian assistance
Forecasted needs indicators
1. Do you believe that you will have access to your shelter for the winter season? 2. Do you believe that you will have enough blankets and warm clothes for the winter season? 3. Do you believe that you will have enough fuel for cooking for the winter season?
1.2.3. Select ONE: Yes/No/Don't know
1. How would you describe relations between host communities and displaced people? 2. Do you believe that relations between displaced persons and host communities will be fair or good over the next year?
1. Select ONE: Very good, Good, Bad, Very Bad; 2. Select ONE: Yes/No/Don't know
1. Do you believe that you will have enough baby animals/calves from your livestock to survive to next year? 2. Do you believe that you will have sufficient grain to plant for the next planting season? 3. Do you believe that you will be able to repay household debt over the next year? 4. Do you believe that you will have sufficient financial savings or support from remittances for next year?
1.2.3.4. Select ONE: Yes/No/Don't know
Accountability to Affected Population
Has your household been contacted by humanitarian workers regarding the type of aid you would like to receive in the past 3 months/90 days?
Select ONE: Yes/No/Don't know
Are you aware of any procedures or mechanisms to make complaints or provide feed-back regarding any humanitarian assistance?
Select ONE: Yes/No/Don't know
Do you feel that humanitarian assistance has led to negative outcomes in your community (for e.g. unequal distribution, disputes, violence or conflict, insecurity etc.)
Select ONE: Yes/No/Don't know

95
Somalia Joint Multi-Cluster Needs Assessment, November 2019
What were the main concerns you had in accessing humanitarian aid in the past 3 months/90 days?
Select MULTIPLE: Not enough information, Cannot physically access points of humanitarian aid distribution, Insecurity on the way to humanitarian aid distribution, Insecurity at points of humanitarian aid distribution, Camp manager has excluded the respondents from aid
Item Repository Check-list
Does your household own the following items? Sleeping mats; Blankets for adults and/or children; Mosquito nets; Jerry cans or water tanks; Kitchen set (pots, pans, cutlery, kettle); Solar lamp or any internal source of lighting; Clothing articles (shirt, pants, dress, warm clothes, footwear); Toiletries (toothbrush, toothpaste, soap, shampoo); Menstrual materials and/or diapers; Cooking stove; Fuel & generator; Locks on doors; Phone and/or Radio; Cleaning equipment (broom, mop, bucket); Waste-bin; Household tools (hammer, nails, rope, etc.); School supplies & stationery; Children’s toys; Furniture (bed, tables, chairs, stools); Storage space; Fan and/or air-conditioning; Refrigerator; Transport (car, motorbike, moped, bicycle)
Select ONE: Yes/No for each item

96
Somalia Joint Multi-Cluster Needs Assessment, November 2019
Annex 6: Field officer and enumerator training Purpose of training
• Understand the assessment so you can explain it to others • Gain the necessary skills to carry out a household-level survey • Familiarize yourself with the sampling techniques • Familiarize yourself with the survey questions, definitions, and nuances • Gain understanding of the ethics and principles guiding this assessment
The JMCNA
• A national assessment covering the entire country, that seeks to… • Capture the severity of needs at the district level, while focusing on… • Displaced (IDP, refugees, returnees) and non-displaced persons (host- and non-host resident communities), • With the aim of asking the following questions:
• What are the needs of the different population groups? • What do their survival, emergency, and livelihood problems consist? • What is the level of access to basic services? • Which groups are the most vulnerable? • How do these needs compare across geographical areas?
Field Check-list: Before leaving for the field to collect data make sure of the following:
• Check and clear security situation of your destination • Authorisation letter to present to authorities if approached • Your smartphone (fully charged) and charger • Latest version of the questionnaire • Note book and pen • Water • Appropriate visibility
Defining a household What is a household?
• A group of persons who normally live and eat together • A household is often a family living in the same house or compound and eating together, but can include extended
relatives or non-related people • One person who lives and eats on his or her own • Several persons who are not related to each other. What matters is that they live together in the same house or
compound and eat together. • If a man has two or more wives and they and their children live and eat together, they form one household. • If the wives and their children live and eat separately, they will form more than one household. • If two or more groups of persons, each of which has its own separate eating and housekeeping arrangements, live
in the same dwelling, treat them as separate households. • If a household has a visitor staying with them for 3 months or longer, they are considered part of the household
How do you identify a household?
• As you walk past structures (houses, tents, bulls, etc.) count the number of main doors of each structure. • If more than one household is in the selected point, ask one adult to tell you how many households there are. • If more than one household is in the selected point, select one – you can only interview one household per
house/structure/compound/homestead. • To not show any sort of favouritism specify that you can only interview one household which is selected at
random but that their views and answers will be reflective of the needs of the other households sharing the structure/house/compound.
• If you notice that there are many buildings or structures large enough for more than one family but only one main door, then go to a few and ask how many households (as per the definition above) live there and use an average number if you come across many such structures
Approaching a household

97
Somalia Joint Multi-Cluster Needs Assessment, November 2019
• First introduce yourself and then ask to speak to the household head or someone who is in charge. • Respondents can include men and women • This must be someone 18 years or older • Only in the case of a child headed household can the respondent be 15 years or older • In the case of a child respondent aged between 15 and 17 years make sure an adult guardian is present • Explain the objectives of the survey and the assessment
Informed consent Asking for consent
• Briefly explain the survey and ask for the respondent’s consent to participate. • Obtaining informed consent implies:
• Explaining the objectives of the assessment • Explaining how the data will be used • Explaining that the respondent’s participation is voluntary • Explaining that the respondent/household will not receive any benefits for participating in the survey • Explaining that the respondent can choose to terminate the interview at any time of their choosing and
without reason and that there is no penalty for doing so • Explaining the expected duration of the interview • Explaining the potential risks and benefits
• Temporary storage of personal information and GPS points • Obtaining informed consent implies:
• Explaining that data collected will be confidential • Data will be anonymized and aggregated • Sensitive data will only be stored as long as necessary for the analysis and then
deleted • However, the respondent will not be able to access their data • That the respondent cannot request to have their data or information deleted once
the interview has been completed. • Explaining that you may only interview respondents between 15-17 years if an adult
guardian is present. • If the participants do not consent, do not start the survey. Close the survey. Always note how many
respondents declined to be interviewed. Do not record GPS or any other information. • Ensure that the respondent gives their assent to each statement you have explained to them. • Answer any questions from the respondent before starting the survey.
Interviewing skills General tips
• Be friendly, smile • Speak in a pleasant tone • Be an active and engaged listener, encourage the participant to continue • Be neutral – don’t influence the participant’s response. • Do not use leading questions • Do not read out answer options unless explicitly stated in the question • Be patient and relaxed • Probe the participant for additional information if necessary • Take notes during the interview to ensure accuracy and understanding of responses. Note any important details. • Do not correct the respondent – we want to capture the participant’s feelings and opinions, not yours!
Effective listening
• Face the participant and maintain eye contact • Be attentive but relaxed • Do not interrupt • Do not influence the responses • Wait for the speaker to pause before asking clarifying questions • Ask questions to make sure you understand the response • Do not read out answer options unless explicitly stated in the question • Pay attention

98
Somalia Joint Multi-Cluster Needs Assessment, November 2019
• Treat everyone that you meet with respect, including the participant, his/her family members, NGO staff, and other enumerators
Interviewing respondents between 15-17 years
• Girls aged between 15-17 years should be interviewed by a female enumerator. • Interviews shall not be conducted in a closed room, simply take some distance. • Ask yourself: Are you the most appropriate person to conduct this interview? (e.g. gender) • Be well aware of culture, gender, trauma • Consider the child’s age, maturity and developmental stage when you start/during the interview • Show empathy: what could the respondent be feeling? • Build confidence and trust • Pay attention to verbal and non-verbal communication • Use simple language and questions • Also applicable for respondents of any other age, but especially so for younger respondents.
Constructive and destructive forms of rapport
• What are appropriate ways to build rapport? • How do you start the interaction? • What can you say or do to make the participant and yourself feel relaxed? • If the conversation becomes tense, how can you make it more comfortable? • What would make a participant feel that he/she can trust you? • If a participant becomes emotional, what is the best way to react? • What might hinder rapport? • What kind of actions would make a participant feel uncomfortable? Hurt? Angry? • What kind of clothing would express disrespect for the participant? • What kind of culturally specific words or gestures would convey interview bias? • What parting words or behaviors will help the participant feel that they had a positive interview experience with
REACH? Using probing questions Probes should be used whenever:
• The interviewer doesn’t understand the respondent’s reply • Respondents give the interviewer any reason to think that they have not given a complete report of their thinking • Say "don't know" or "I can't answer that” • Give an answer that doesn’t fit with any options provided • Seem to have not understood the question
For clarity/specificity
• Can you be more specific? • Can you tell me more about that? • What is your best estimate? • What do you think? • Which would be closer? • Which answer comes closest to how you feel/ think? • If you had to pick one answer, what would you choose?
For completeness
• Anything else? • Tell me more.
Other probing techniques • Repeat the question • Echo their response • Pause a second
Summary: Interviewing skills Make a good first impression
• When first approaching the respondent, do your best to make him/her feel at ease. With a few well-chosen words you can put the respondent in the right frame of mind for the interview. Open the interview with a smile and greeting and then proceed with your introduction.

99
Somalia Joint Multi-Cluster Needs Assessment, November 2019
Always have a positive approach • Never adopt an apologetic manner, and do not use words such as "Are you too busy?" Such questions invite refusal
before you start. Rather, tell the respondent, "I would like to ask you a few questions" or "I would like to talk with you for a few moments.”
Stress confidentiality of responses when necessary • If the respondent is hesitant about responding to the interview or asks what the data will be used for, explain that the
information you collect will remain confidential, no individual names will be used for any purpose, and that all information will be grouped together to write a report.
Answer any questions from the respondent • Before agreeing to be interviewed, the respondent may ask you some questions about the survey or how she was
selected to be interviewed. Be direct and pleasant when you answer. Show respect during data collection
• Make sure you arrive on time and with all necessary materials. • Be prepared mentally and physically. • Do not have side conversations. • Do not answer your cell phones for personal reasons (exception for security calls from team leaders/enumerators). • Don’t rush the respondent. • Don’t make any promises to the respondent.
Ethical issues and safety Guiding principles
• The humanitarian imperative always comes first! Always remember the purpose of your work and that the data you are collecting is to support the humanitarian community’s response to populations in need
• Respect all cultures and customs and remember that the refugees have faced immense difficulties in the recent past.
• Be aware of the sensitivities that may arise when you interview a person of the opposite sex or of different beliefs/culture.
• Always communicate politely with the individuals you encounter in the field and treat everyone as dignified human beings.
• Respect your colleagues and your team leaders. • Report any misconduct by staff or partners, and any security issue/concern to your team leader.
Enumerator code of conduct All staff and enumerators must abide by the following principles
• Do no harm. • Must obtain consent and assent. • Respect the rights of respondents at all times. • Always create a conducive environment in all interactions. • Always ensure confidentiality and sensitivity. • Maintain personal and professional standards during all engagements.
All staff and enumerators must:
• Never raise their voice or shout at respondents • Never discriminate. • Never attempt to create relationships (sexual) • Never intimidate/humiliate • Never place a respondent at risk of abuse, or expose them to insecurity • No brokering/Aiding relationship. • Never film or take selfies/videos/pictures. • Never use language that is inappropriate. • Never make promises. • Never get contact numbers from respondents for personal benefits.
Randomisation Why randomise?
• The JMCNA is a nation-wide representative survey • All groups/types of people should be represented and have the same probability of being selected
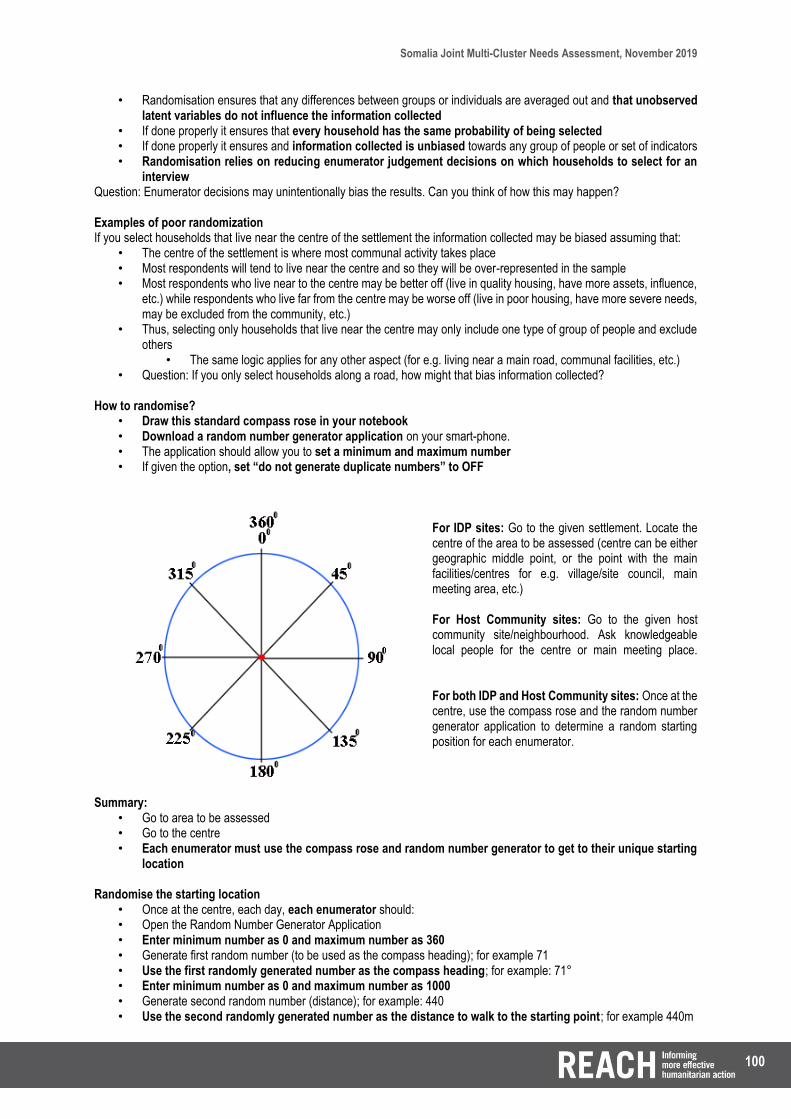
100
Somalia Joint Multi-Cluster Needs Assessment, November 2019
• Randomisation ensures that any differences between groups or individuals are averaged out and that unobserved latent variables do not influence the information collected
• If done properly it ensures that every household has the same probability of being selected • If done properly it ensures and information collected is unbiased towards any group of people or set of indicators • Randomisation relies on reducing enumerator judgement decisions on which households to select for an
interview Question: Enumerator decisions may unintentionally bias the results. Can you think of how this may happen? Examples of poor randomization If you select households that live near the centre of the settlement the information collected may be biased assuming that:
• The centre of the settlement is where most communal activity takes place • Most respondents will tend to live near the centre and so they will be over-represented in the sample • Most respondents who live near to the centre may be better off (live in quality housing, have more assets, influence,
etc.) while respondents who live far from the centre may be worse off (live in poor housing, have more severe needs, may be excluded from the community, etc.)
• Thus, selecting only households that live near the centre may only include one type of group of people and exclude others
• The same logic applies for any other aspect (for e.g. living near a main road, communal facilities, etc.) • Question: If you only select households along a road, how might that bias information collected?
How to randomise?
• Draw this standard compass rose in your notebook • Download a random number generator application on your smart-phone. • The application should allow you to set a minimum and maximum number • If given the option, set “do not generate duplicate numbers” to OFF
For IDP sites: Go to the given settlement. Locate the centre of the area to be assessed (centre can be either geographic middle point, or the point with the main facilities/centres for e.g. village/site council, main meeting area, etc.) For Host Community sites: Go to the given host community site/neighbourhood. Ask knowledgeable local people for the centre or main meeting place. For both IDP and Host Community sites: Once at the centre, use the compass rose and the random number generator application to determine a random starting position for each enumerator.
Summary: • Go to area to be assessed • Go to the centre • Each enumerator must use the compass rose and random number generator to get to their unique starting
location Randomise the starting location
• Once at the centre, each day, each enumerator should: • Open the Random Number Generator Application • Enter minimum number as 0 and maximum number as 360 • Generate first random number (to be used as the compass heading); for example 71 • Use the first randomly generated number as the compass heading; for example: 71° • Enter minimum number as 0 and maximum number as 1000 • Generate second random number (distance); for example: 440 • Use the second randomly generated number as the distance to walk to the starting point; for example 440m

101
Somalia Joint Multi-Cluster Needs Assessment, November 2019
• Walk exactly in the direction indicated by the compass heading (follow the heading using the 1st random number; in this case 71°) for a distance of X metres (using the 2nd random number; in this case 440 metres)
• You have now reached your starting point. Each enumerator should have a different starting point randomly selected using the method above. Do not select the starting point as a group.
• If the settlement/village is in a radius smaller than 1000m; enumerators should use 500m as the second default option.
Randomise the directions for enumerator surveys
• Once each enumerator has their starting point, they should: • Open the Random Number Generator Application • Enter minimum number as 0 and maximum number as 360 • Generate a third random number (compass heading; for example: 7°) • Use the third randomly generated number as the direction the enumerator has to follow; in this case 7° • Walk exactly in the direction indicated by the compass (follow the heading) till the end of the settlement • Have all enumerators practice selecting the starting point from the centre (compass+distance) and the direction of
survey (compass) Calculate the skip factor for systematic random sampling
• Count the number of households the enumerator walks past while following the compass heading till the outer limit/boundary of the area to be surveyed (for example, the enumerator counts 122 households along their route)
• Calculate the skip factor by using the formula: • Total number of households along the route / Target number of household interviews per
enumerator • For example: 122 households / 10 interviews = 12.2 • Skip factor = 12 (round up if decimal >5; round down if decimal <5)
• Note: In this example it is assumed that the enumerator needs to complete a target number of 10 interviews for that specific day
• Have all enumerators practice calculating the skip-factor; use different targets per enumerator to make sure they don’t do this as a group
Randomly select the first household to be surveyed
• Once the enumerator has reached the outer limit of the survey area, they should: • Open the Random Number Generator Application • Enter minimum number as 1 and maximum number as “total number of households” counted by enumerator
along their route • Using the example above the min. number will be 1 and max. number will be 122 • Generate random number (for example: 87) • Walk to the 87th household along the enumerator path and interview that household
Continue survey using the skip factor
• Count and skip the next 12 households • Interview the 13th household along the path; in this case the 100th household • Repeat, by skipping the next 12 households, and interview the 113th household • Repeat, and continue till the target number of surveys have been conducted • If the enumerator reaches the end of the settlement before the target number of interviews has been
completed, they should return to their starting point and continue the skip method Potential problems – multi-story dwellings and barriers
• In case the enumerator encounters buildings along their path they should count the number of floors in the building and multiply by 2 (assuming 2 households per floor)
• In case the enumerator encounters a barrier along their path they should go around it and continue in the same direction indicated by the compass heading
• When it is impossible for the enumerator to go around the barrier and there are households beyond, the enumerator should repeat the random direction procedure using the compass
Potential problems – main & secondary roads
• The enumerators should not follow a main road if it is tangential to the compass direction • Only follow main or secondary roads if they happen to coincide with the compass heading • If needed, the enumerator can follow a main or secondary road when necessary (for e.g. to get around barriers) but
should then return to their compass direction as far as possible

102
Somalia Joint Multi-Cluster Needs Assessment, November 2019
Potential problems – non-response (no one at home or declined consent)
• When a household is not at home, the enumerator should go to the next closest household and interview them, and restart the skip counting from that household which was interviewed and not the previous household which was skipped
• If a respondent does not wish to answer the questionnaire, the enumerator should not count that household as skipped, but restart the skip counting from that household
• Enumerators should keep note of how many households were not at home, and how many households chose not to answer the questionnaire and convey this information to the team leaders and field officers at the end of the day
Potential problems – ill-defined limits of survey area
• In host-community type survey areas, an enumerator will not know the limit or boundary of the area to be surveyed. • In this case, the enumerator should first:
• Rely on their knowledge of the area to define the limit of the neighbourhood/ward and count households up to this limit
• Ask knowledgeable local people to inform them of the neighbourhood limits • Ask several people the same question and decide on the most cited answer as the limits • Count households up to the limits indicated
• If the problem persists, only use this as a second option in the rare case that the first option is not available: • Each enumerator should select a different starting point using the compass/random number method
outlined (no common starting point) • The enumerators should set a standardized buffer of households up till which they will count • The buffer should be set as 3 multiplied by the target number of interviews for all the enumerators
combined Potential problems – example of ill-define limits of survey area
• Go to the given GPS point and ask what neighbourhood it is, and where does it extend to (street or landmark indicating boundary)
• Ask at least 3-5 people the same question to get a sense of how well-defined the area is • Total number of interviews to be conducted for a host-community area: 120 • Target per enumerator: 120 total interviews / 8 enumerators = 15 interviews per enumerator • From the starting point (not centre), each enumerator should randomize their direction and count up to
120 x 3 = 360 households ; where 120 is the total number of interviews for all enumerators combined, and 3 is the buffer
• Then, apply the skip factor calculation: 360/15 = 24 (skip factor denominator is always the target number of interviews per enumerator)
• Randomise the first household to be surveyed (setting the minimum to 1 and maximum to 360 as outlined before) • Go to that random household and then skip every 24 households • Continue and repeat until target number of interviews per enumerator is completed
General tips – facilitation and getting information
• First, approach the local authorities, village or community leaders, camp managers, etc. to inform them of the survey, gain access to the households, and to gather information
• Ask for information that will help facilitate your work and reduce time: • How many households (not individuals) live in the area? • What are the limits of the settlement/area to be surveyed? Are there any land-marks or roads to indicate
the limits? • Are there any households living beyond these limits but who are also part of the settlement? • Is there a need to inform all households that a survey is taking place and to be available to answer
questions if selected? General tips – reducing time
• Prepare your notebook in advance (compass rose; heading markers) • When moving from your starting point to the end of the area to be surveyed draw the path you have taken, and
note down and count the number of houses on either side of your path • (for e.g. on the left: HH 1,2,4,5,6,8,11,14,15, and on the right HH 3,7,9,10,12,13…etc.) so that you don’t
have to walk all the way back to your starting point

103
Somalia Joint Multi-Cluster Needs Assessment, November 2019
• Calculate the skip-factor when you reach the end limit of the area to be surveyed and go directly to the first randomly chosen household (using the random number generator application) thereby eliminating the need to walk back to the starting point
General tips – prioritise security of enumerators and respondents
• Spend time speaking with local leaders regarding the security situation • Do not attract unwanted attention to yourself • Do not wear NGO identification if it will put you or your team at risk • Do not use your smart-phone more than you need to • Avoid walking back and forth in front of the same households • Dress and interact appropriately with everybody • Maintain a respectful dialogue when interacting with others • Do not escalate situations • If you feel threatened or fearful that a situation may be risky, leave the area in a calm but expeditious way
KOBO Survey tool Respones and question types and parameters
• Integer: a number response will be required • Text: a free text entry, it will appear on the phone as a blank space for text input • Multiple Choice: will display a list of multiple choices (squares), of which you can select more than one option • Single Choice: will display a list of multiple choices (circles), of which you can select just one option • Date: YYYY-MM (year-month) • GPS: Gives you and records the exact location • Constraints: Makes sure that the response is logical and not conflicting. For e.g. if you ask how many days in the last
week it was raining, the response cannot be 8 days. • Relevance: Makes sure only questions relevant to the respondent are asked • Skip Logic: Sometimes you will only want a question to be asked of those people who meet certain conditions - i.e.
you want to ask questions only if certain answers have been given to earlier questions. For e.g. questions on school-aged children attendance will only be shown if there are 1. school-aged children, and 2. school-aged children enrolled in school
• Required: Forces you to respond to the question to prevent blank answers General structure of the survey
1. Introduction 2. Household demographics 3. Other household questions 4. Displacement 5. Education 6. Health 7. Nutrition 8. Water, sanitation, and hygiene (WASH)
9. Shelter and non-food items (NFI) 10. Protection 11. Food security and livelihoods (FSL) 12. Coping mechanisms 13. Accountability to affected populations (AAP) 14. Item repository check-list 15. End of interview

104
Somalia Joint Multi-Cluster Needs Assessment, November 2019
Introduction • The introduction section introduces the survey to the respondent, asks information on the region, district, and settlement,
the gender, and age of the respondent. • It is important to read the introduction to the interviewee. • If the interviewee does not want to be interviewed, that is fine. Select No, close the form and move on.
Notes regarding the main respondent: • The person being interviewed must be over 15 years old. • If it is a large household, it is preferable to interview the mother/female head of household as they are more likely to be
able to answer all of the questions. • If you are interviewing a man, please politely ask if the female head of the household can also be in attendance.
Household demographics
• This section asks questions on who lives in the household and their characteristics: • Who is the main income earner? • Who decides on household expenditure? • Does everyone have ID? • Demographic list: How many people live in the household? What is their age and gender? • Questions on whether there are any pregnant/lactating women, persons with disabilities, and chronic illnesses?
Notes regarding household demographics: • Make sure the respondent includes themselves in the household count • Ensure that numbers are correctly entered; a lot of subsequent questions depend on accurate information from this
section Other household questions
• This section asks questions on household work and economic factors: • How many people are employed in paid work? • Have any persons lost employment? • How much time do they spend in care-giving tasks? • What is the average monthly income/debt over the past 3 months?
Notes regarding other household questions: • Some questions, in this and other sections, ask for a monthly average for the past 3 months (the recall period) • If there is any confusion, clarify with the respondent that you are interested in the average number, for the recall period
of 3 months • If needed, convert amounts of currency to dollars
Displacement questions
• This section asks questions on whether the household was displaced, the length of displacement and the reasons for displacement:
• Questions on classifying the household as displaced (internally, refugee, or returnee) or non-displaced (hosting or non-hosting)
• The push factors driving them away and the pull factors attracting them to the current location Notes regarding displacement questions:
• There may be some confusion in responding to these questions as households may have been living all their lives as displaced and may not consider themselves as such
• There may be some confusion between area of origin and previous location if they have moved multiple times • The characteristics of interest are whether they moved location due to events such as flood, conflict, drought, better
opportunities, etc. and that these factors may even go back more than one generation Recurring questions in most sections
• There are some types of questions common to most sections such as: • How much do you pay for services? Time taken to reach services/facilities/areas? • Barriers to access (choose main reasons why households cannot access certain areas/services) • Main support required (choose one type of support requested by the household)
Notes regarding common questions: • Time taken questions should ask about total time taken (from the house to location, and back to the house) • Barriers should be asked if access is limited or not possible (choose best fitting answer according to categories)

105
Somalia Joint Multi-Cluster Needs Assessment, November 2019
• Main support required (choose best fitting answer according to categories) • Do not prompt respondents or read out options; let them answer and clarify their response if there is any confusion
Education questions
• This section asks questions on education levels, enrollment and attendance rates, drop-outs, cost of education, access, barriers to access, and main support required
Notes regarding education questions: • If there is more than one school-aged child, and there are different answers for questions such as how long does it take
to get to school, enter the answer which is the longest as we are interested in the severity of needs • As a general rule, in case of conflicting or more than one response, enter the answer which reflects the higher severity
of needs Health questions
• This section asks questions on health in the household, specific to children under 5, pregnant/lactating women, and other members, mental health, cost of health, access, barriers to access, and main support required
Notes regarding health questions: • Mental health issues can be a sensitive topic, so always soften the questions with a small introduction and reminder that
the survey is confidential and their answers will be anonymised • Do not read out symptoms very quickly; allow the respondent time to think and answer • Do not judge or make respondents feel uncomfortable
Nutrition questions
• This section asks questions on nutrition coverage and counselling in the household, the use of supplements specific to children under 5, and pregnant/lactating women, and barriers to access
Notes regarding nutrition questions: • Clarify that mobile teams may do house visits but can also be accessed in camp-like settings; the important distinguishing
feature of a mobile team is that they are not in a permanent location but can move easily • Show photos of MUAC screening, plumpy sup and plumpy nut supplements
WASH questions
• This section asks questions on water quality, quantity, dignified sanitation, use of hygienic materials, barriers to access, and main support required
• As it is a relatively longer section, take a moment to give the respondent time to think, remind them of the survey objectives, and ask if they have any questions so far
Notes regarding WASH questions: • Distinguish between drinking water and domestic water (cooking, cleaning, bathing, NOT for agriculture or animals)
where necessary • For direct observation questions on environmental sanitation, walk around the dwelling and take note of what is directly
observable to you; do not rely on respondent answers for these questions Shelter and Non-Food Item questions
• This section asks questions on shelter use, quality, safety and security, types of NFI items, and main support required Notes regarding Shelter and NFI questions:
• Shelter questions will appear when number of household shelter occupation is entered • Be aware of difference between shelter structure (supporting material) and shelter wall (material being supported) • For NFI items, ensure that you read out the associated quantity per each item when reading out the options
Protection questions
• This section asks questions on vulnerabilities, general safety and security, rule of law, sexual and gender based violence (SGBV), child protection, housing, land and property, main barriers to access, and main support required
• As it is a relatively longer section, take a moment to give the respondent time to think, remind them of the survey objectives, and ask if they have any questions so far
Notes regarding protection questions: • Introduce questions on SGBV only after having asked the screening question if the respondent is comfortable answering
such questions

106
Somalia Joint Multi-Cluster Needs Assessment, November 2019
Food security and livelihood questions • This section asks questions on food sources, patterns of food consumption, changes to food consumption, livelihood
and income, main barriers to access, and main support required Notes regarding Food security and livelihood questions:
• For food consumption questions, give the respondent time to think about how many days they consumed certain foods • Provide examples as per the questions of the food groups if there is any confusion
Coping mechanism questions
• This section asks questions on what the household did if and when faced with limited or no access to basic services, items, or resources
Notes regarding coping mechanism questions: • Give the respondent time to think about which strategies they may have used • Remind them of the recall period when reading out the questions • Classify the answer according to the available categories • If there is any confusion, ask probing questions to clarify • Some strategies may be used more than once for different sections; enter the strategy used per section even if it was
used repeatedly Accountability to affected population and item repository check-list questions
• Thank the respondent for their time and contribution so far; remind them that their answers will be used to better inform humanitarian action and that they are strictly confidential
• Inform them that they are very near the end of the survey AAP questions
• This section asks questions on household perceptions regarding humanitarian aid, for e.g. awareness, participation, satisfaction, and general perception
Item repository check-list
• This section asks a series of Yes/No questions as to whether the household owns certain items or not End of interview
• Thank the respondent and household for their time and contribution

107
Somalia Joint Multi-Cluster Needs Assessment, November 2019
Annex 7: Enumerator competency test Guidance to candidates:
Please answer all questions.
The time limit is 30 minutes.
Read the questions and instructions carefully before noting down your answers.
The names and figures used are not real. The test is designed for assessing contextual understanding only. You want to conduct new interview in an IDP camp in a village and you come across the following people. Could you match them to each of the following groups: Internally displaced people (IDP), Returnee and Refugee?
1. Somali who has moved from another location in Somalia
2. Somali who is returning from another country 3. Non-Somali who is coming from another country
1) There is a nearby school roughly 500 m inside a camp where you are conducting the interview. You have asked a
question about whether the respondent has access to school? The respondent says no, they do not have access. What will you do?
cation
2) You have asked the head of the household, who is 44 years old male, the number of people living in his household
in each age and gender group. Look at the below table and state what you think is missing:
Males 0-6 months 1
Females 0-6 months 2
Males 6 months - 4 years 1
Females 6 months - 4 years 0
Males 5-12 years 0
Females 5-12 years 0
Males 13-15 years 2
Females 13-15 years 1
Males 16-17 years 2
Females 16-17 years 2
Males 18-40 years 0
Females 18-40 years 0
Males 41-59 years 0
Females 41-59 years 1
Males 60 or older 0
Females 60 or older 0
Total members in the household 12 3) A household ate sorghum, meat and milk on Monday, Tuesday and Thursday. Did the household eat the following in the last week? (Tick what applies)
Vegetables: How many days did the household they eat the following in the last week? (Enter figure)
Staples (cereals, rice): _______
Meat: _______
Vegetables: _______

108
Somalia Joint Multi-Cluster Needs Assessment, November 2019
4) A person you are interviewing reports that there is, in total, one broken berkad in his village, one water truck, and a
river. The majority of the population collects their drinking water from the river nearby.
How many functioning Berkad are in the village? (Enter figure): ______________
What is the most commonly used drinking water source in the village? ______________ 5) A person you are interviewing reports that there are many newly arrived IDPs in her village. The IDPs arrived without
mosquito nets, soap, and cooking pots, whilst the vast majority arrived with sleeping mats. What are the most needed items for the newly arrived IDPs? (Select all that apply)
6) A person you are interviewing reports his village is hosting 10,000 IDPs. Out of these IDPs, 8,000 arrived in December
2017, whilst 2,000 arrived in May 2018.
When did the majority of IDPs arrive? (Write down the month and year): ______________
When did the most recent IDPs arrive? (Write down the month and year): ______________ 7) A person you are interviewing reports that in her village most families say that because of a lack of food many adults
skip meals so that their children can eat. A few families have sent their children to neighbours to receive food, whilst a few individual households buy less expensive food to cope with a lack of food/resources.
What is the most common coping strategy people in the village use to deal with a lack of food? (Select one)
9.) A person you are interviewing reports that there was some conflict last month in village A and village B. In village A around 90% of shelters were damaged because of the conflict, whilst in village B cattle was taken but shelters were not damaged due to the conflict. What proportion of shelters were destroyed because of conflict in village A? (Select one)

109
Somalia Joint Multi-Cluster Needs Assessment, November 2019
Annex 8: Data cleaning SOP Data acquisition and preparation:
Enumerators to upload survey data to kobo.
Senior Database Officer to download raw data.
Senior Database Officer to remove all data columns except for UUID, P-Code, GPS coordinates, Precision, District, Time of acquisition.
GIS Spatial Verification:
Senior Database Officer to send data columns requested to GIS (UUID, P-code, GPS coordinates, Precision, District, Time of acquisition). Each time new data is downloaded, the Senior Database Officer will send all the data including data from previous days.
The GIS Specialist will conduct first spatial verification. GIS team to filter new data of each day, each time when doing spatial verification.
Output from GIS verification to be sent back to Senior Database Officer.
Output contains four types of checks marked as either “inconsistent” or “clear” for District, Settlement, P-Code, and Outliers. Outlier verification to be done visually by GIS and later on by Field Officers. Final output column “SV” will read “Not Clear” if any of the four types of checks is inconsistent; “Clear” otherwise. See below.
o Clear (the spatial verification was successful for that specific type of error) o Inconsistent district (inconsistency b/w GPS location and selected district) o Inconsistent settlement (inconsistency b/w GPS location and selected settlement) o Low GPS precision o Outlier (outlier in the GPS location compared to other locations with same PCODE) o Settlement not targeted (reported settlement or GPS location within a settlement not o included in the sampling frame) o And a final column 'SV' for the final spatial verification output, which can be 'clear' or 'not clear'.”
Preparation for Field Officer (FO) data checks and cleaning:
Senior Database Officer to attach GIS verified output columns to full data set.
Senior Database Officer to remove personal identifiable information (names, tel. numbers, GPS coordinates).
Senior Database Officer to disaggregate data set by district and send only the disaggregated and anonymized data to FO by district.
110
Somalia Joint Multi-Cluster Needs Assessment, November 2019
FO data checks and cleaning:
FO to filter data each time new data arrives. Their data set will continuously increase as new data arrives. FO to save copies of data before populating the macro-enabled excel cleaning tool.
FO to use excel cleaning tool for all data checks and cleaning.
FO will first conduct spatial verification by going through the SV column. In all cases where SV is marked “Not clear” FO to use the webmap application to spatially verify data. FO can either ‘delete’ entry if very suspicious and justify deletion in the comments, or change SV to Clear after verification and inserting justification in the comments.
FO to continue data checks using macro-enabled excel tool.
Main checks to be undertaken: (UUID + SV; Location + time taken check; Translation/’other’ response checks; Outliers (for variables indicated by Assessment Officers (AO) and as per FO’s own knowledge too); Contradictions (for variables indicated by AOs and as per FO’s own knowledge too)).
Once FO data cleaning is completed, they must send the cleaned data and change-log back to Senior Database Officer. Senior Database Officer will share the cleaned data with AOs.
AO data checks and cleaning:
AOs will conduct a second check on the data sent back by FOs and shared by Senior Database Officer
Main checks to be undertaken: (‘Other’ responses; Outliers; Contradictions; Random spot checks and comparison of data collected morning/afternoon; Verification of all change-log entries and deletions)
Once AO data cleaning is completed, they must send the cleaned data back to Senior Database Officer with comments and two follow up possibilities. First, send back to FO for second verification; or, second, validate as cleaned and acceptable data
Post-cleaning procedure
If data is to be checked for a second time by FO, the same procedure above is to be followed, and Senior Database Officer to share data to and from FO and AOs. Final validation by AOs.
Senior Database Officer to merge final data sets after each data set undergoes 1st spatial verification (GIS), 2nd spatial verification (GIS), 1st data check and cleaning (FO), 2nd data check and cleaning (AO), potential 3rd check (FO&AO).
At the end of each day, FO, AO need to update the Tracker tool on their progress. General notes
Save copies! Always make a copy of the master file before making any changes.
On the first day FO will receive the macro-enabled excel tool with the data for their district already filled in. This is to ensure that each FO will use the same format for the data types and cleaning method.
From the second day when new data arrives, FO should filter the data and copy the new data into a separate file. They should then populate the macro-enabled tool with data from this file.
Types of data checks to be done: See above for list of types of checks and below for detailed information.
All changes should be noted and justified in the comments section. They should not be communicated to AOs or any other staff by phone but only in written form.
For any call-backs, AO/FO to send UUID to Senior Database Officer who will share the requested personal information to the FO responsible only
Daily Data Download
Data will be downloaded on a daily basis from the kobo server. So each field officer will receive the raw data of his/her area of coverage.
On the first day field officers will receive the raw data set file and the macro-enabled data cleaning sheet filled with the data to conduct the checks and cleaning.
Next day the field officers will only receive raw data with the newly uploaded surveys included, so they need to filter the new surveys and then populate the macro-enabled excel cleaning tool.
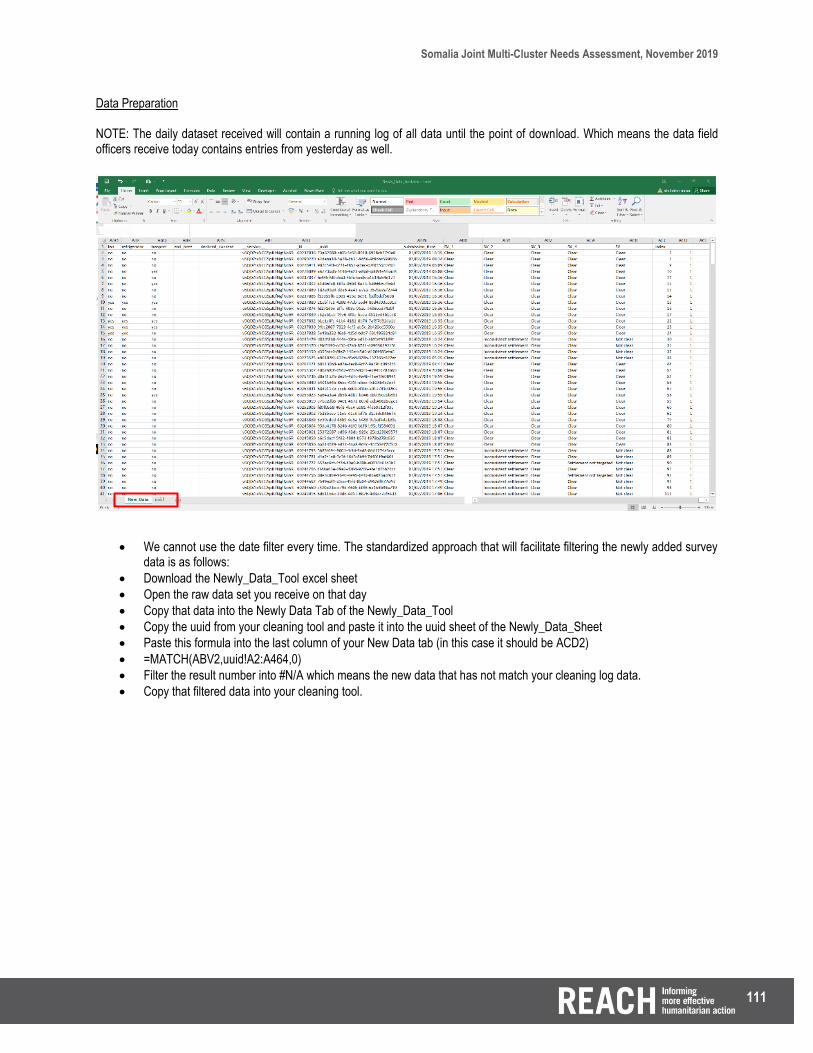
111
Somalia Joint Multi-Cluster Needs Assessment, November 2019
Data Preparation NOTE: The daily dataset received will contain a running log of all data until the point of download. Which means the data field officers receive today contains entries from yesterday as well.
We cannot use the date filter every time. The standardized approach that will facilitate filtering the newly added survey data is as follows:
Download the Newly_Data_Tool excel sheet
Open the raw data set you receive on that day
Copy that data into the Newly Data Tab of the Newly_Data_Tool
Copy the uuid from your cleaning tool and paste it into the uuid sheet of the Newly_Data_Sheet
Paste this formula into the last column of your New Data tab (in this case it should be ACD2)
=MATCH(ABV2,uuid!A2:A464,0)
Filter the result number into #N/A which means the new data that has not match your cleaning log data.
Copy that filtered data into your cleaning tool.

112
Somalia Joint Multi-Cluster Needs Assessment, November 2019
Keyboard Shortcuts The macro-enabled sheet is an excel template that makes cleaning kobo data faster and easier. It contains a number of shortcuts that help you find, flag, correct and delete errors in the data. To allow smooth functionality of the macro sheet please close other office applications during data cleaning.
Procedure for data cleaning for FO and AO
Familiarize yourself with the data collection tool i.e. know how the tool logics – relevance and constraints, work.
Have the last version of the tool opened next to you in order to understand what each question stands for.
Follow the column structure as it is – It is not advisable to skip any column to check later.
Be ready to perform sort and filter a million times! Pivots could aid the process or would be an alternative.
Note: When you filter data and want to edit it; be sure to filter responses one at a time. You cannot filter and change all at once.
Look at things based on the specific context of work i.e. urban vs rural, IDP vs HC, riverine vs non-riverine and household size, etc.
Inspect if one enumerator is reporting the same answers repeatedly
Conduct the data checks on daily basis, and share the feedback with enumerators and AO/GIS.
Check all OTHER values in the dataset – please do translations when needed.
Inform enumerators not to report in OTHER when the answers can be found in the questionnaire.

113
Somalia Joint Multi-Cluster Needs Assessment, November 2019
Checks for FO and AO
# Cell(s) Question ACTION
1 A, B, C Enumerator Name and Agency Correct the spelling in enumerator name and enumerator agency as needed.
2
ADE ADF ADG ADH ADI ADJ
Spatial Verification (SV) SV_1: can be ‘Clear’ (the spatial verification was successful for that specific type of error) or ‘Inconsistent district’ (inconsistency b/w gps location and selected district) SV_2: can be ‘Clear’ (the spatial verification was successful for that specific type of error) or ‘Inconsistent settlement’ (inconsistency b/w gps location and selected settlement) SV_ 3: can be ‘Clear’ (the spatial verification was successful for that specific type of error) or ‘Low GPS precision’ (the precision of the GPS was too low) SV_ 4: can be be ‘Clear’ (the spatial verification was successful for that specific type of error) or ‘Settlement not targeted’ (reported settlement not included in the sampling frame) SV_5: final spatial verification output, which can be 'Clear' or 'Not clear'. Final column SV reports "Clear" only if there is no spatial verification error occurring. If there is even one error, it will return "Not clear".
When spatially verifying the surveys uploaded, the actual coordinates captured in the tool will be compared to the targeted sample frame and see if falls into category of the SV Comments. To better understand the comments and provide feedbacks/corrections, please see the updated WebMap. Use the account credentials shared with you during the training!
3 F G H
Time check Check_StartTime; Check_EndTime; Check_Time
The survey should take a minimum of 45 minutes to complete. Any survey completed in less than 45 minutes will be followed up with the team leader and enumerator. If the time check shows negative sign - that means the enumerator phone dates were adjusted either during or after the data collection - so the best option is to ignore the negative sign and check if it less than the 45 minutes threshold for survey completion.
4 U
Check all translations Translate OTHER Settlement Cross check your data with the sample frame.
All targeted areas in the sample frame are available in the choices sheet. So in case if you need to add new location. Select the settlement type IDP/HC. Then select the Region/District. Then select other option and provide the new settlement name here.
5
CM FK, FN IC
Check all translations and OTHER responses
Ensure that all entries in OTHER sections are responses which are not found in the survey response options. Otherwise reclassify them and log the change.

114
Somalia Joint Multi-Cluster Needs Assessment, November 2019
IK OD OT RM UV VM
Continue across the excel sheet and ensure all entries are correctly translated.
6 V W
Check Respondent Gender and Age resp_gender; resp_age
Please check and filter the proportion of males/females interviewed in order to determine if only one gender was interviewed from the whole area. If, for example, 1 male is interviewed out of 90 surveys, confirm with enumerators about it. Check the age of interviewed respondents in your dataset. By filtering this column, check frequency of age i.e. how frequently is age12_17 reported? At the same time check resp_gender.
7 X Y
Check whether a guardian was present when required guardian_present
Check and ask enumerators why were respondents between age15_17 interviewed without the presence of a guardian. Flag issue if repeated by the same enumerator or repeated in a particular location.
8
P Q R S T
Check location information region; district; idp_settlement; settlement; settlement_other
Quickly go through these columns especially when you are dealing with multiple locations at once. Ensure idp_settlement is filled if data has been collected at an IDP site. Also check if settlement_other has values and enquire the team why settlement was selected OTHER. Ensure that spellings of names are consistent throughout.
9 R S T
Check IDP location information idp_settlement; settlement; settlement_other
Filter this column to identify the surveys collected in an IDP settlement. Double check this with the data collection plan of that specific day i.e. It is unlikely to see this question selected YES if today plan doesn’t include IDP sites. If you see so, take a note of this and raise with enumerators. Similarly, check whether the collection from IDP sites or from HC in the city/settlement/village.
10 AM – BF
BE BG – BP
Check household demographics section male_age groups; female_age groups total_hh (cell BE)
Check if the demographic fields are reporting high numbers e.g. 3 members of males_41_59 are in the same HH. Flag it! For total_hh: Check potential outliers – high and low figures. Low figures are 0 and 1; High figures are any numbers above 10. Check the number of children against the total number of members. Flag any entries with more children than expected (for e.g. 10 children and 13 total household members). Ask enumerators for clarification.
11 Ensure that household demographic data has not
been changed
If any household demographic data has been changed (especially for ages under 18) please report it to the AO.
12 BR – BY
CA CB
Check number of vulnerable household members persons_with_disabilities;
Filter all the following fields one by one to check any potential outliers – could be high figures in this case. A high is any figure above 3. Double check the number

115
Somalia Joint Multi-Cluster Needs Assessment, November 2019
PLW; chronic
of PWD, PLW, and chronically-ill members against the number of total household members.
13 BR
BT – BX BZ
Check that enumerators have correctly entered disability information persons_with_disabilities; XYZ_difficulties; disabilities_group
Check that if any household members have reported difficulties and in which category. Check whether any of those members fall in the category between 5 and 59 years of age. Check against the total number of household members.
14 CD – CM
Check number of persons who lost employment and reasons for losing employment lost_employment; lost_employment_reasons
Check that total number of reasons for lost employment correspond with the total number of persons who lost employment. Ensure that responses in OTHER are translated.
15 CO CP CQ
Check logic between income, current debt, and ability to repay debt average_income; avergage_debt; fore_hhdebt
Check if DON’T KNOW is reported for average debt. If it is the case, check that whether they reply YES or NO for whether they can repay debt in the next year. Ideally, they should also report DON’T KNOW for the latter. Flag otherwise. Ensure enumerators clarify the response to this question when interviewing respondents. Finally, check that the debt-levels make sense when compared with income levels; flag any entry which seems illogical.
16 CR S
Check that there are not too many HC responses in IDP sites yes_no_host; idp_settlement
Check if the enumerators are reporting YES and said YES to the idp_settlement variable, because it is very unlikely to interview too many host communities living inside an IDP settlement. So flag such issues and debrief enumerators.
17
CU CX CY DA DB
Check population profile yes_no_returnee; returnee_country; refugee; country_origin
Check if the HH is a returnee (Somali returning from another country). Confirm if the HH is a refugee (non-Somali). If yes, please confirm the country of origin. Check if reported ‘Somalia’ or somewhere in Somalia i.e. “Baidoa” or “Puntland” or “Galkacyo” for country_origin. If you see such responses. Raise immediately and flag. Ensure all entries in OTHER are translated.
18
CX CY DB DC DD DE
Check time-taken for cross-border movements returnee_country; country_origin; left_aoo; arrived_current
Check both date left area of origin and date arrived current location – if you find that some of the responses seem illogical, take a note and brief the enumerators. There is a built-in check to ensure first, that the date of departure and arrival is not the same. A second check to ensure that the household could not have travelled from another country to Somalia within the span of 1 day. If you see such entries, flag immediately and brief enumerators.
19
DI DJ DL DM
Check displacement reasons disp_why1; disp_why2; dest_loc_why1; dest_loc_why2
Check if both reasons are relevant to the context of the assessment or seem logical. If no, ask the team to explain.

116
Somalia Joint Multi-Cluster Needs Assessment, November 2019
20
FB FC FD FF FG FH
Check contradictions between time taken and transport to school and access to school time_school; transport_school; access_school; school_barrier
If respondents indicate a specific time to go to school, mode of transport, but NO access to school, check that the barrier reported to access is logical (for example, insecurity on the way or at school is reasonable, but no school present is less reasonable). Flag such entries and raise with enumerators and AOs.
21 GX – HX
HY
Check history of mental problems with practice of chaining mental_problems_faced; using_chains
Check if a respondent answers YES to chaining but NO to any mental problems faced. Flag any such entries.
22 JD JE
Check appropriate sources of water primary_source_drinking_water; primary_water_for_cooking
Check the reported water source against available water sources in the area
23 JF JG
JN – JV
Check correspondence between water sufficiency and storage variables enough_drinking_water; enough_cooking_water; how_water_stored; refill_jerrycan
Check if households report having enough water, and confirm with the how_water_stored variable and refill_jerrycan variable
24 KB KL KM
Check correspondence between defaecation practices and environmental sanitation household_access_latrine; dispose_children_faeces; environmental_sanitation_problems
Check if NONE is reported for environmental_sanitation_problem against the responses for dispose_children_faeces and household_access_latrine. If a respondent does not have access to latrine, or disposes of faeces in open but also has no environmental sanitation problems; flag entry and ask enumerators for clarification.
25 KT LD
Check correspondence between handwashing practices and access to soap when_wash_hands; access_to_soap
Flag any entry where respondents never wash hands but have access to soap. Brief enumerators and ask for clarification.
26 MD ME
Check number of shelters occupied by household shelter_occupy
Check how many shelters a household occupies along with total household size. Flag any entries with more than 3 shelters or where the number of shelters and size of household seems illogical. Confirm if answer to shelter_occupy is 0 – (i.e. open air conditions). Ask enumerators how did they manage to identify that household!
27
MF MG MH DD
Check and compare age of shelter with duration of occupation age_of_shelter; occupying_longer_3_months; arrived_current
Check the answer reported for age of shelter and compare it against age of household members, and date of arrival in the area. Flag any entries that seem to indicate more than a few years of occupation. Occupation of a shelter for longer than the oldest member of the household, or longer than the date of arrival in the area is illogical and should be flagged immediately. Check that if a shelter is only marked as 1 month old then the answer to occupation for more than 3 months cannot be yes! Flag such issues and seek clarification from the enumerators.

117
Somalia Joint Multi-Cluster Needs Assessment, November 2019
28
NN NO NP OE OF
Check appropriateness of responses free_movement; unsafe_male; unsafe_area_male; unsafe_female; unsafe_area_female
Check which answers are irrelevant to the context of the assessment or considered unreasonable
29
Z AA QB QC QD QE QF
Check correspondence between land ownership and head of household; and between land ownership and responses to documentation breadwinner; household_expenditure; own_land; doc_land_tenure; destroyed_doc; obtain_title; obtain_new_contract
If this question is answered YES, check the breadwinner and household_expenditure variables because it is not very practical for a certain age and gender to own a land (i.e. a female child at the age of 14 years owning a land by herself doesn’t sound very reasonable, so seek further clarification). Double check any entry where answers between own_land; doc_land_tenure; destroyed_doc; obtain_title; obtain_new_contract are illogical. Flag any entry where the household does NOT own land but has documentation for land tenure; or where the household does NOT KNOW whether they own land but has documentation, etc.
30 UH UI UJ
Check correspondence between availability of food and practice of skipping meals skip_meal; stock_last
Flag any entry where households have skipped meals but have stocks to last more than 7 days. Ask for clarification.
31
UW VO VQ VL
Check correspondence between source of income and ownership of livestock/cultivable land income_source; own_livestock; land_cultivation
If a respondent answers that they get their income from livestock or land, check to see whether they answer YES for livestock ownership or land cultivation, respectively.
32 ACA – ACW
Check ownership of items in repository check-list Check all variables listed from ACA - ACW
First, If a respondent answers NO to all items flag entry. Second, filter responses from ACW moving backwards. If a respondent answers owning relatively luxurious items (e.g. refrigerator, moto, car) but not basic items (mats, blankets), flag entry. Third, check basic items against list of NFI to double check.
33
CO CP EZ IE JL UO BE
Check all income and expenditure variables together average_income; average_debt; cash_bracket_education; cash_bracket_treatment; how_much_pay_water; spent_food; total_HH
Variables concerning cash, income and debt should be checked together. Check potential outliers and inconsistencies. Should not generally be a problem as respondents have to choose a bracket. Open all cash bracket responses and check the brackets chosen against total hh_average_income and average_debt column. If bracket chosen for any service is higher than total income, or average_debt flag entry. Check if the reported household expenditure of the current period in that area is acceptable and matches your knowledge of the context. Finally, check that all amounts correspond to the total_hh size and flag any entries that seem illogical.

118
Somalia Joint Multi-Cluster Needs Assessment, November 2019
34
FD FX FZ GK IX KB LD
Check all access variables together access_school; child_health_access; pregnancy_health_access; adult_health_access; access_nearest_nutrition_center; household_access_latrine; access_to_soap
Access variables for all clusters should be checked together. Check which answers seem illogical for the context or that may be unreasonable. Check whether respondents pay for service, how much time it takes and mode of transport used against whether they can access service, and finally examine barriers to access. Flag any issues or outliers.
35
FG – FJ FL FM
GM – GP GT – GW
IM IN
IZ – JC LH – LK LM – LP LR – LU
LV LW LX LY LZ NJ NK
SA – SC SD
UR – UU
Check all barrier variables and all main support variables school_barrier; cash_education; cash_education_other; health_barrier; vaccination_barrier; cash_health; cash_vaccination; nutrition_barrier; water_access_barrier; latrine_access_barrier; hygiene_barrier; difficulty_obtaining_soap; difficulty_obtaining_menstruation; main_support_required; main_support_latrines; main_support_handwashing; shelter_support; nfis_support; protection_barrier; protection_support; food_barrier
All barriers for all clusters should be checked together. Check which answers are irrelevant or illogical for the context or that may be unreasonable. Flag any issues or outliers. Check barriers along with main support required. Normally, we would expect the main support required to correspond to the main barriers listed.
36
FB IG IX JJ KK LE SS
Check all time taken variables together time_school; time_health; nearest_nutrition_center; time_to_reach_water_source; time_to_reach_latrine; nearest_handwashing_facility; time_market
All time taken to access variables should be checked together. If a respondent answers that certain markets or services are very close by while others are very far (extreme values reported for the same respondent) flag entry.
37 - Check all Male/Female disaggregated variables
Any variable disaggregated for male female: Check if both columns are reporting irrelevant answers or considered unreasonable.
38 - All entries into fields marked ‘OTHER’
Check that data entered into OTHER columns are translated, logical, and consistent with the context. If data entered into OTHER column matches any of the potential survey responses re-classify that entry and log the change. Raise any issues immediately with the team and AO.
39 - Compare first 7 entries collected in the morning with the last 7 entries collected in the afternoon
Check and compare the quality of the data in the first 15 and last 15 entries. If the last 15 entries are consistently worse than the first 15 speak to

119
Somalia Joint Multi-Cluster Needs Assessment, November 2019
enumerators to ensure that they do not compromise data quality because of enumerator or respondent fatigue. Check time taken for completing these surveys.
40 - Randomly select 10 entries to check throughout the day
Do random spot checks on 10 data entries taken during the hottest time of the day to ensure that no data quality is being compromised because of heat or fatigue. Check time taken for completing these surveys.

120
Somalia Joint Multi-Cluster Needs Assessment, November 2019
Annex 9: JIAF Overview of the JIAF Model
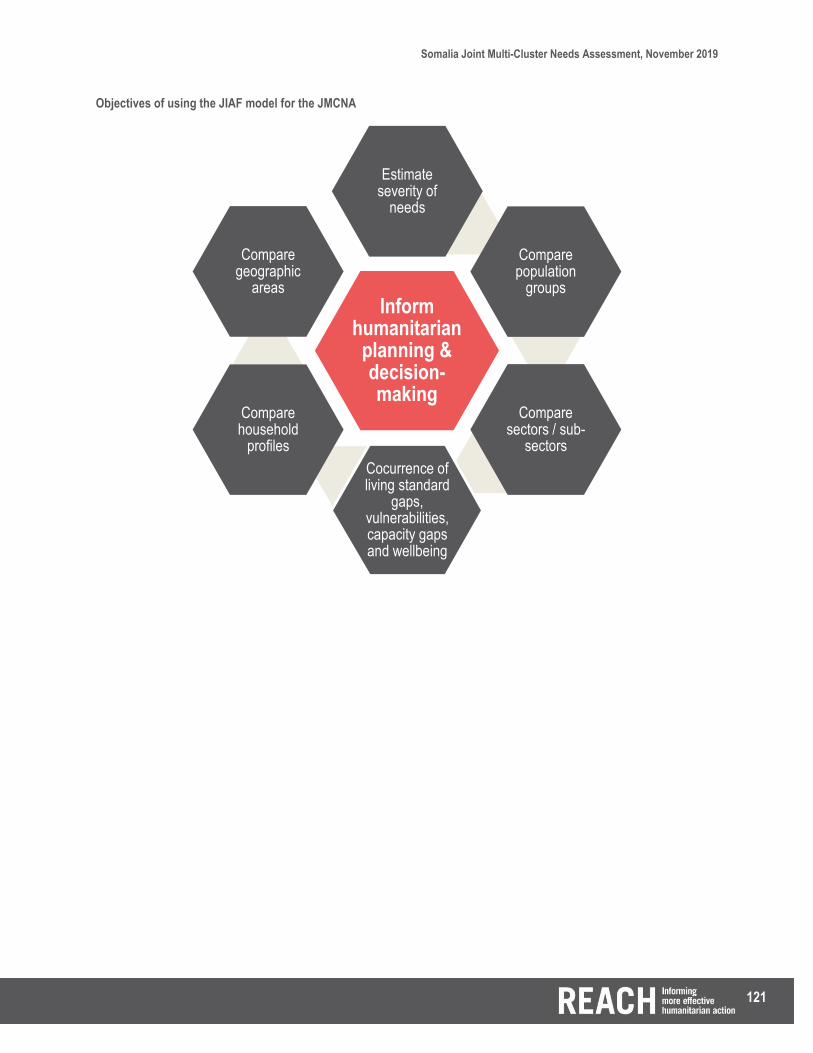
121
Somalia Joint Multi-Cluster Needs Assessment, November 2019
Objectives of using the JIAF model for the JMCNA
Inform humanitarian
planning & decision-making
Estimate severity of
needs
Compare population
groups
Compare sectors / sub-
sectors
Cocurrence of living standard
gaps, vulnerabilities, capacity gaps and wellbeing
Compare household
profiles
Compare geographic
areas

122
Somalia Joint Multi-Cluster Needs Assessment, November 2019
Method of operationalization
JIAF Pillar JIAF Sub-pillar MSNA Operationalisation
Context N/A Desk review
Event/ Shock Drivers Desk review
Underlying factors/ pre-existing vulnerabilities
Primary data collection on household-level vulnerabilities; secondary data on community or location level vulnerabilities
Impact Impact on People Primary data collection; complemented by secondary data to establish Humanitarian Profile
Impact on Systems and Services
Desk review; triangulated with primary data on access to basic services
Impact on Humanitarian Access
Primary data collection; complemented by secondary data on relief actor access
Humanitarian Conditions
Living Standards Primary data collection; triangulated with secondary data
Coping Mechanisms Primary data collection; triangulated with secondary data
Well-being Primary data collection; complemented by secondary data on mortality, morbidity, malnutrition (excluded from the JMCNA framework)
Severity of Humanitarian Conditions
Analysis of primary data collected to estimate severity of needs (MSNI) and categorize proportion of households by severity category
Current and Forecasted Priority Needs/ Concerns
N/A Through joint analysis workshop where findings of all components are presented and experts are guided to facilitate interpretation and development of recommendations regarding priority humanitarian needs, both current and forecasted; complemented by primary data on likely evolution variables

123
Somalia Joint Multi-Cluster Needs Assessment, November 2019
Annex 10: Estimating the MSNI Rationale underlying the calculation of the MSNI

124
Somalia Joint Multi-Cluster Needs Assessment, November 2019
Calculation procedure to estimate the MSNI

125
Somalia Joint Multi-Cluster Needs Assessment, November 2019
Annex 11: Criteria for severity classes
Severity Description
1
Living standards are acceptable (taking into account the context): possibility of having some signs of deterioration and/or inadequate social basic services, possible needs for strengthening the Legal framework.
Ability to afford/meet essential all basic needs without adopting unsustainable coping mechanisms (such as erosion/depletion of assets).
No or minimal/low risk of impact on well-being.
2
Living standards under stress, leading to adoption of coping strategies (that reduce ability to protect or invest in livelihoods).
Reduced quality or stressed social/basic services.
Inability to afford/meet some basic needs without adopting stressed, unsustainable and/or short-term reversible coping mechanisms.
Minimal impact on well-being (stressed physical/mental well-being) overall.
Possibility of having some localized/targeted incidents of violence (including human rights violations).
3
Degrading living standards (from usual/typical), leading to adoption of negative coping mechanisms with threat of irreversible harm (such as accelerated erosion/depletion of assets). Reduced access/availability of social/basic goods and services
Inability to meet some basic needs without adopting crisis/emergency - short/medium term irreversible - coping mechanisms.
Degrading well-being. Physical and mental harm resulting in a loss of dignity.
4
Collapse of living standards, with survival based on humanitarian assistance and/or long term irreversible extreme coping strategies.
Partial collapse of social/basic goods and services.
Extreme loss/liquidation of livelihood assets that will lead to large gaps/needs in the short term.
Widespread physical and mental harm (but still reversible). Widespread grave violations of human rights. Presence of irreversible harm and heightened mortality
5
Total collapse of living standards.
Total collapse of social/basic services.
Near/Full exhaustion of coping options.
Last resort coping mechanisms/exhausted.
Widespread mortality (CDR, U5DR) and/or irreversible harm. Widespread physical and mental irreversible harm leading to excess mortality.
Widespread grave violations of human rights.

126
Somalia Joint Multi-Cluster Needs Assessment, November 2019
Annex 12: Scoring of indicators Note: Cells highlighted in orange indicate sufficient conditions; i.e. if a household falls within that category it is accorded that score irrespective of its score on any other indicators for that section.
Pre-existing vulnerability indicators
Concept Indicators None/ Minimal (1-2) Stress (3-4) Severe (5-6) Extreme (7-8)
1 2 3 4 5 6 7 8
Household vulnerability
Head of household96
Adult Male-headed
Adult Female-headed
Male Elderly-headed
Female Elderly-headed
Male Child-headed
Female Child-headed
Male Child-headed Under 13
Female Child-headed Under 13
(Male 18-59) (Female 18-59) (Male AND 60+) (Female AND
60+) (Male AND 14-
17) (Female AND
14-17) (Male AND 13-) (Female AND 13-)
Primary income earner
Adult Male-headed
Adult Female-headed
Male Elderly-headed
Female Elderly-headed
Male Child-headed
Female Child-headed
Male Child-headed Under 13
Female Child-headed Under 13
(Male 18-59) (Female 18-59) (Male AND 60+) (Female AND
60+) (Male AND 14-
17) (Female AND
14-17) (Male AND 13-) (Female AND 13-)
Vulnerable members97,98
None (PWD-0) (PWD-1) (PWD-2) (PWD-3) (PLW AND
PWD-3) (PWD-4)
(PLW AND PWD-4)
OR OR OR OR OR
(Chronically ill) (PLW AND
PWD-1) (PLW AND
PWD-2) (PWD-3 AND Chronically ill)
(PWD-4 AND Chronically ill)
OR OR OR
(PLW) (PLW AND
Chronically ill) (PWD-2 AND Chronically ill)
OR
(PWD-1 AND Chronically ill)
Legal status Documentation
(Has documents)
(Does not have documents
(Does not have documents
(Does not have documents
AND AND AND
can obtain it) does not know if
they can obtain it) cannot obtain it)
96 Females are classified as more vulnerable than males due to the assumption that the context accords more opportunities and security to males. A head of household is the person who decides on household expenditure. In case more than one person decides on household expenditure, the severity score is accorded according to the sex and age of the more vulnerable member. 97 PWD refers to Persons With Disabilities. The accompanying levels ranging from 0 to 4 indicate the severity of disability. 0 = no difficulty carrying out daily activities; 1 = Minor difficulties but does not require assistance; 2 = Some difficulties and needs assistance (1-2h/day); 3 = A lot of difficulties and needs quite a bit of assistance (3-6h/day); 4 = Cannot carry out daily activities independently and needs permanent assistance. 98 PLW refers to Pregnant and Lactating Women, defined as any household members who gave birth in the past 6 months or are currently pregnant.

127
Somalia Joint Multi-Cluster Needs Assessment, November 2019
Dependency levels
Age dependency ratio99 0 < ADR <
20% 21 < ADR < 30% 31 < ADR < 40% 41 < ADR < 60% 61 < ADR < 70% 71 < ADR < 80% 81 < ADR < 90% 91 < ADR < 100%
Work dependency ratio100
0 < WDR < 20%
21 < WDR < 30% 31 < WDR < 40% 41 < WDR < 60% 61 < WDR < 70% 71 < WDR <
80% 81 < WDR < 90%
91 < WDR < 100%
Time spent for care-giving tasks101
CGT < 1h/day 1h/day < CGT <
2h/day 2h/day < CGT <
3h/day
3h/day < CGT < 4h/day
CGT > 4+h/day
Poverty
Total household income/capita
Income:
200+$/month Income: 151-200$/month
Income: 101-150$/month
Income: 61-100$/month
Income: 31-60$/month
Income: <30$/month
None
Debt to income ratio102 No debt DIR < 25% 26 < DIR < 50% 51 < DIR < 60% 61 < DIR < 80% 81 < DIR <
100% 101 < DIR <
150% 151+% < DIR
Household expenditure103
Expenditure on basic goods and services
HHEX < 25% 26 < HHEX <
50% 51 < HHEX < 75%
76 < HHEX < 80%
81 < HHEX < 90%
91 < HHEX < 100%
101 < HHEX < 200%
200+% < HHEX
Displacement Length of
displacement104
Not displaced Between 6 and 12
months Between 12 and
24 months Between 24 and
36 months Between 36 and
48 months More than 48
months Less than 3
months
OR
Between 3 and 6
months
99 Age dependency ratio (ADR) is a ratio of young and old members of non-working age (under 15 and over 60) (numerator) and adult members of working age (16 – 59) (denominator). A higher age dependency ratio indicates that more of the household expenditure may need to be spent on education, healthcare, care services, etc. 100 Work dependency ratio (WDR) is a ratio of total non-working household members (numerator) and total working household members (denominator). A higher work dependency ratio indicates that there are fewer working members to support all members of the household. Both dependency ratios are used since the inverse of the age dependency ratio may not fully capture the work-dependency ratio. In case of no working members the equation will lead to a problem of division by zero; thus such households are automatically classified in severity class 8. 101 Care giving time (CGT) measures how many hours on average household members devote to care-giving tasks such as child-care, caring for elderly members, fetching water, and preparing food. 102 Debt-Income ratio (DIR) is a ratio of total household debt (numerator) and total household income (denominator). As responses are classified by category, the mid-point of each category is used to calculate the ratio. In the special case where income or debt is 200+$; 200 is used as the value. In the special case where a household has debt, but has reported ‘none’ as income the value 10 will be used to avoid a division by zero problem. A higher debt to income ratio indicates that a household may well be living in poverty, or the risk of falling in to poverty. 103 Household expenditure (HHEX) is a ratio variable that aggregates all expenditure variables on basic goods and services (education, health, water, and food) divided by total reported income. As responses are classified by category, the mid-point of each category is used to calculate the ratio. In the special case where expenditure is 100+$, that figure is used as the value. Higher ratios indicate more income being spent on basic services. 104 Households being displaced for less than 3 months or for more than 12 months are attributed the same score as it is assumed that both (recently displaced and households displaced for a long time) face stress, albeit due to different reasons. It is assumed that recently displaced households are stressed due to the fact that they have just arrived in a new location and need to re-build their living standards and resilience, while households being displaced for more than 12, or 24 months or more, face stress by virtue of the fact of being in a situation of long-term displacement.
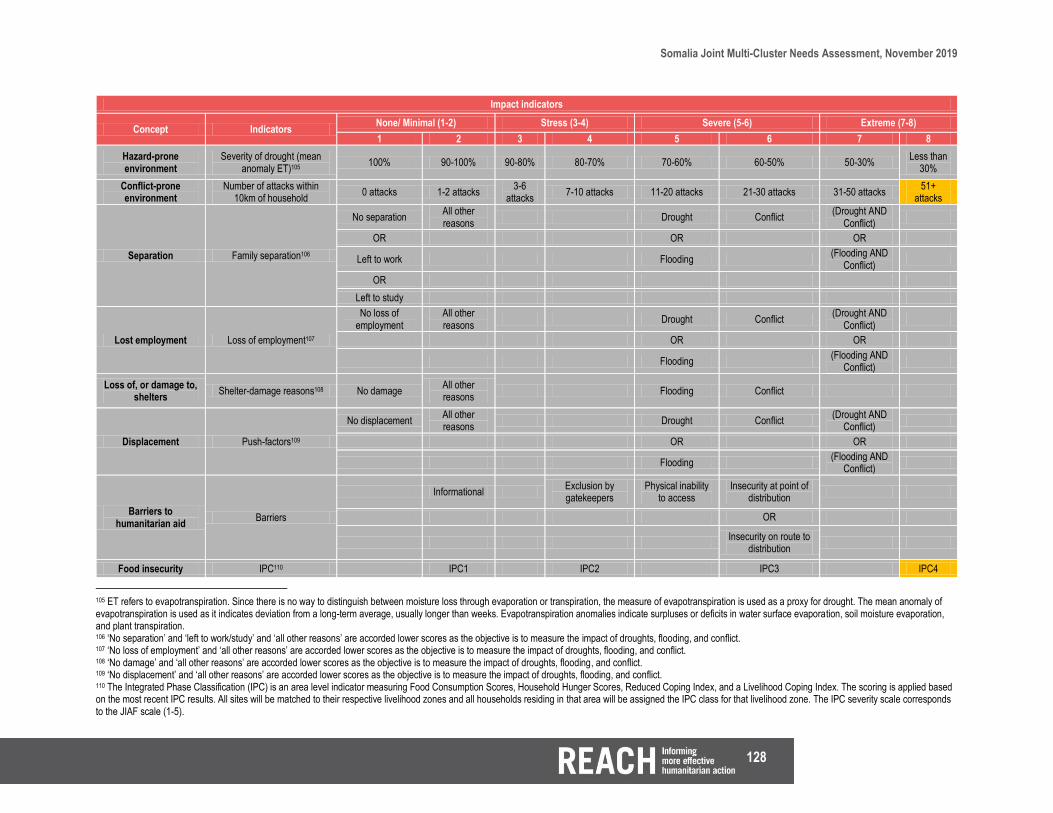
128
Somalia Joint Multi-Cluster Needs Assessment, November 2019
Impact indicators
Concept Indicators None/ Minimal (1-2) Stress (3-4) Severe (5-6) Extreme (7-8)
1 2 3 4 5 6 7 8
Hazard-prone environment
Severity of drought (mean anomaly ET)105
100% 90-100% 90-80% 80-70% 70-60% 60-50% 50-30% Less than
30%
Conflict-prone environment
Number of attacks within 10km of household
0 attacks 1-2 attacks 3-6
attacks 7-10 attacks 11-20 attacks 21-30 attacks 31-50 attacks
51+ attacks
Separation Family separation106
No separation All other reasons
Drought Conflict (Drought AND
Conflict)
OR OR OR
Left to work Flooding (Flooding AND
Conflict)
OR
Left to study
Lost employment Loss of employment107
No loss of employment
All other reasons
Drought Conflict (Drought AND
Conflict)
OR OR
Flooding (Flooding AND
Conflict)
Loss of, or damage to, shelters
Shelter-damage reasons108 No damage All other reasons
Flooding Conflict
Displacement Push-factors109
No displacement All other reasons
Drought Conflict (Drought AND
Conflict)
OR OR
Flooding (Flooding AND
Conflict)
Barriers to humanitarian aid
Barriers
Informational Exclusion by gatekeepers
Physical inability to access
Insecurity at point of distribution
OR
Insecurity on route to
distribution
Food insecurity IPC110 IPC1 IPC2 IPC3 IPC4
105 ET refers to evapotranspiration. Since there is no way to distinguish between moisture loss through evaporation or transpiration, the measure of evapotranspiration is used as a proxy for drought. The mean anomaly of evapotranspiration is used as it indicates deviation from a long-term average, usually longer than weeks. Evapotranspiration anomalies indicate surpluses or deficits in water surface evaporation, soil moisture evaporation, and plant transpiration. 106 ‘No separation’ and ‘left to work/study’ and ‘all other reasons’ are accorded lower scores as the objective is to measure the impact of droughts, flooding, and conflict. 107 ‘No loss of employment’ and ‘all other reasons’ are accorded lower scores as the objective is to measure the impact of droughts, flooding, and conflict. 108 ‘No damage’ and ‘all other reasons’ are accorded lower scores as the objective is to measure the impact of droughts, flooding, and conflict. 109 ‘No displacement’ and ‘all other reasons’ are accorded lower scores as the objective is to measure the impact of droughts, flooding, and conflict. 110 The Integrated Phase Classification (IPC) is an area level indicator measuring Food Consumption Scores, Household Hunger Scores, Reduced Coping Index, and a Livelihood Coping Index. The scoring is applied based on the most recent IPC results. All sites will be matched to their respective livelihood zones and all households residing in that area will be assigned the IPC class for that livelihood zone. The IPC severity scale corresponds to the JIAF scale (1-5).
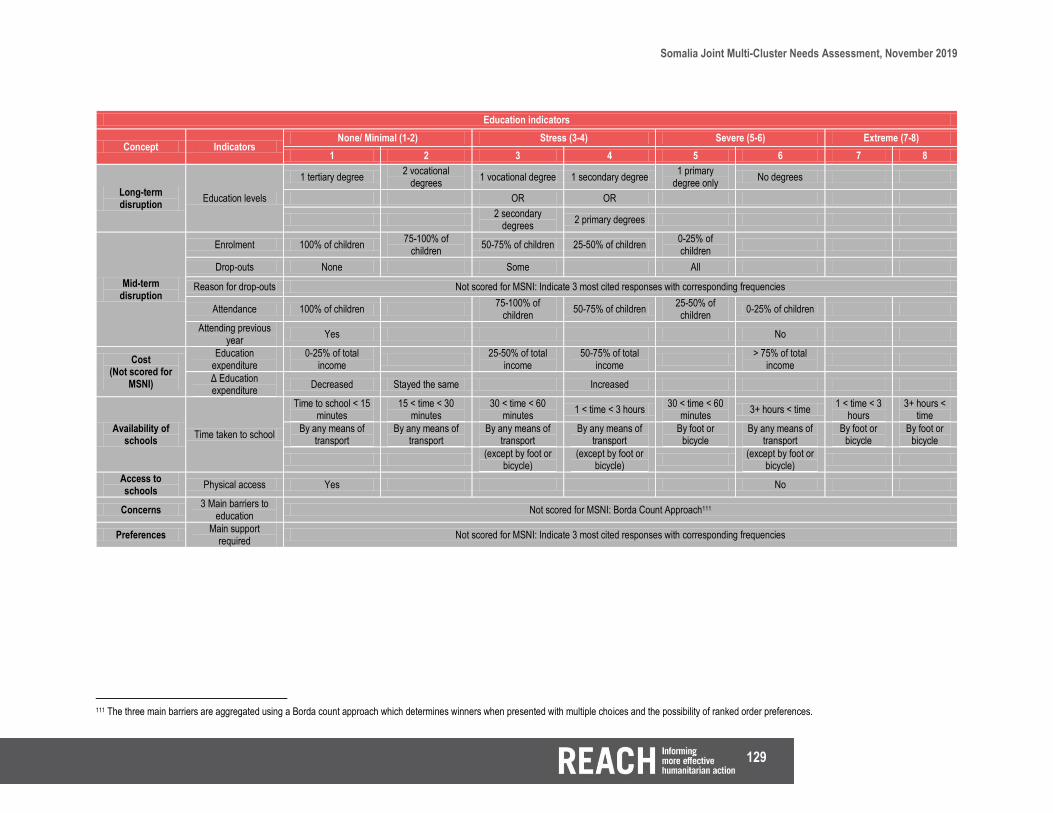
129
Somalia Joint Multi-Cluster Needs Assessment, November 2019
Education indicators
Concept Indicators None/ Minimal (1-2) Stress (3-4) Severe (5-6) Extreme (7-8)
1 2 3 4 5 6 7 8
Long-term disruption
Education levels
1 tertiary degree 2 vocational
degrees 1 vocational degree 1 secondary degree
1 primary degree only
No degrees
OR OR
2 secondary
degrees 2 primary degrees
Mid-term disruption
Enrolment 100% of children 75-100% of
children 50-75% of children 25-50% of children
0-25% of children
Drop-outs None Some All
Reason for drop-outs Not scored for MSNI: Indicate 3 most cited responses with corresponding frequencies
Attendance 100% of children 75-100% of
children 50-75% of children
25-50% of children
0-25% of children
Attending previous year
Yes No
Cost (Not scored for
MSNI)
Education expenditure
0-25% of total income
25-50% of total
income 50-75% of total
income
> 75% of total income
Δ Education expenditure
Decreased Stayed the same Increased
Availability of schools
Time taken to school
Time to school < 15 minutes
15 < time < 30 minutes
30 < time < 60 minutes
1 < time < 3 hours 30 < time < 60
minutes 3+ hours < time
1 < time < 3 hours
3+ hours < time
By any means of transport
By any means of transport
By any means of transport
By any means of transport
By foot or bicycle
By any means of transport
By foot or bicycle
By foot or bicycle
(except by foot or
bicycle) (except by foot or
bicycle)
(except by foot or bicycle)
Access to schools
Physical access Yes No
Concerns 3 Main barriers to
education Not scored for MSNI: Borda Count Approach111
Preferences Main support
required Not scored for MSNI: Indicate 3 most cited responses with corresponding frequencies
111 The three main barriers are aggregated using a Borda count approach which determines winners when presented with multiple choices and the possibility of ranked order preferences.
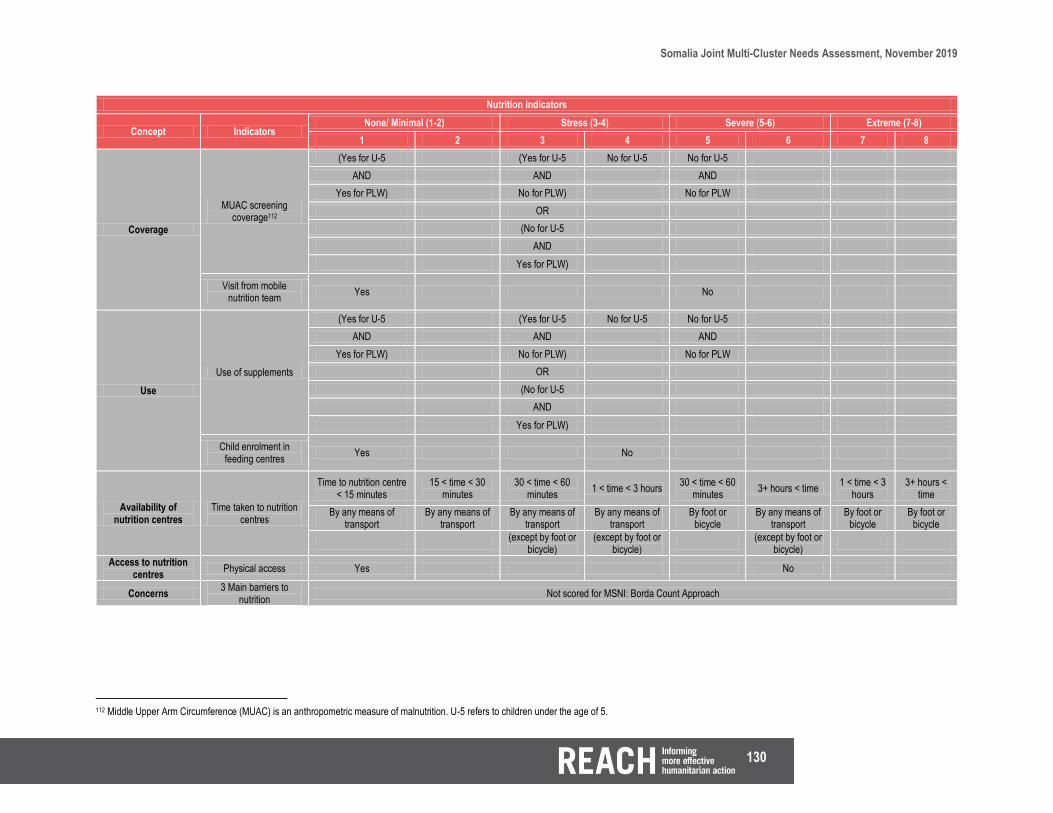
130
Somalia Joint Multi-Cluster Needs Assessment, November 2019
Nutrition indicators
Concept Indicators None/ Minimal (1-2) Stress (3-4) Severe (5-6) Extreme (7-8)
1 2 3 4 5 6 7 8
Coverage
MUAC screening coverage112
(Yes for U-5 (Yes for U-5 No for U-5 No for U-5
AND AND AND
Yes for PLW) No for PLW) No for PLW
OR
(No for U-5
AND
Yes for PLW)
Visit from mobile nutrition team
Yes No
Use
Use of supplements
(Yes for U-5 (Yes for U-5 No for U-5 No for U-5
AND AND AND
Yes for PLW) No for PLW) No for PLW
OR
(No for U-5
AND
Yes for PLW)
Child enrolment in feeding centres
Yes No
Availability of nutrition centres
Time taken to nutrition centres
Time to nutrition centre < 15 minutes
15 < time < 30 minutes
30 < time < 60 minutes
1 < time < 3 hours 30 < time < 60
minutes 3+ hours < time
1 < time < 3 hours
3+ hours < time
By any means of transport
By any means of transport
By any means of transport
By any means of transport
By foot or bicycle
By any means of transport
By foot or bicycle
By foot or bicycle
(except by foot or
bicycle) (except by foot or
bicycle)
(except by foot or bicycle)
Access to nutrition centres
Physical access Yes No
Concerns 3 Main barriers to
nutrition Not scored for MSNI: Borda Count Approach
112 Middle Upper Arm Circumference (MUAC) is an anthropometric measure of malnutrition. U-5 refers to children under the age of 5.

131
Somalia Joint Multi-Cluster Needs Assessment, November 2019
Health indicators
Concept Indicators None/ Minimal (1-2) Stress (3-4) Severe (5-6) Extreme (7-8)
1 2 3 4 5 6 7 8
Burden of disease
U-5 incidence None At least 1 At least 2 At least 3 At least 4
Adult prevalence None At least 1 At least 2 At least 3 At least 4
Maternal health
Complications before, during, or after child
birth No Yes
Location of child birth Healthcare centre or hospital
Traditional birth
attendant house/centre
At home
Vaccinations Vaccinated children and possession of
cards
(All children vaccinated
(All children vaccinated
(Some children
vaccinated
(Some children
vaccinated
No children vaccinated
AND AND AND AND
Possessing vaccination
cards)
Not possessing vaccination
cards)
Possessing
vaccination cards)
Not possessing vaccination
cards)
Mental health
Depression, Schizophrenia,
Stressors, and history of chaining113
One or no issue reported
One or no issue reported
At least 2 mental health stressors
At least 3 mental health stressors
(At least 3 mental health
stressors
At least 5 mental health
stressors
At least 3 issues relating to
Depression
At least 5 issues relating to Depression (of which depressed mood AND
loss of interest)
AND AND OR OR
History of chaining
History of chaining)
At least 2 issues
related to Schizophrenia
At least 3 issues relating to Schizophrenia
Cost (Not scored
for MSNI)
Healthcare expenditure
0-25% of total income
25-50% of total
income 50-75% of total
income
> 75% of total income
Δ Healthcare expenditure
Decreased Stayed the
same Increased
Availability of healthcare
Time taken to healthcare
Time to health centre < 15
minutes
15 < time < 30 minutes
30 < time < 60 minutes
1 < time < 3 hours 30 < time < 60
minutes 3+ hours <
time 1 < time < 3 hours 3+ hours < time
By any means of transport
By any means of transport
By any means of transport
By any means of transport
By foot or bicycle
By any means of transport
By foot or bicycle By foot or bicycle
(except by foot or
bicycle) (except by foot or
bicycle)
(except by foot or bicycle)
113 The first part of the indicator measures whether any household members have exhibited any symptoms of depression and schizophrenia as per the Diagnostic and Statistical Manual IV (DSM IV) or general mental health stressors (as per the DSM IV and adapted to the local context) in the past one year. The second part of the indicator measures whether anyone in the household has previously been chained, wherein people with mental health issues have been attached with limited mobility at home (the indicator is not time-bound). The goal is to measure whether there is a past history of mental health problems, which is likely to aggravate any current or future stress and may bring about complications.

132
Somalia Joint Multi-Cluster Needs Assessment, November 2019
Type of healthcare facility
Government clinic or hospital
NGO clinic or hospital
Traditional mid-wife
Pharmacy or shop selling medication
Traditional
healer OR
Private clinic of hospital
Visit from healthcare workers
Yes No
Access to healthcare
Physical access for adults, PLW, and U-5
Physical access for all 3 groups
Physical access for 2
of 3 groups
Physical access for 1 of
3 groups
No access for all 3 groups
(adults, PLW, and U-5)
(adults and PLW) OR (adults and U-5) OR (PLW and U-5) or (adults and PLW)
(adults, PLW, or U-5)
(adults, PLW, and U-5)
Concerns 3 Main barriers to
healthcare Not scored for MSNI: Borda Count Approach
Concerns 3 Main barriers to
vaccinations Not scored for MSNI: Borda Count Approach
Preferences Main support required
- healthcare Not scored for MSNI: Indicate 3 most cited responses with corresponding frequencies
Preferences Main support required
- vaccinations Not scored for MSNI: Indicate 3 most cited responses with corresponding frequencies

133
Somalia Joint Multi-Cluster Needs Assessment, November 2019
Shelter & NFI indicators
Concept Indicators None/ Minimal (1-2) Stress (3-4) Severe (5-6) Extreme (7-8)
1 2 3 4 5 6 7 8
Shelter occupation and density
Available space114 SD < 1 SD = 1 1 < SD < 1.25 1.25 < SD <
1.5 1.5 < SD <
1.75 1.75 < SD < 2 2 < SD < 2.25 2.25 < SD
Shelter quality Shelter materials
Floor, Structure, Walls, Roof, and Door made of
adequate materials
Sub-standard material for floor
Sub-standard materials for
door
Sub-standard materials for
walls
(Sub-standard materials for
door
(Sub-standard materials for
structure
(Sub-standard materials for
structure
Sub-standard materials for
Structure, Walls, Roof, Floor, and
Door
AND OR AND
Sub-standard materials for
walls)
Sub-standard materials for
roof)
Sub-standard materials for
roof)
Shelter condition
Shelter security115 Composite index comprising indicators on internal separation and source of light; internal and external locks; and theft from the shelter.
7 6 5 4 3 2 1 0
Long-term Shelter damage
Shelter damage and not repaired
No Ye
Reasons for shelter damage
Not scored for MSNI: Indicate 3 most cited responses with corresponding frequencies
Security of tenure
Land ownership and documentation116
(Owns land (Owns land (Owns land (Owns land (Does not own
land (Does not own
land (Does not own
land (Does not own land
AND AND AND AND AND AND AND AND
Has documentation Has
documentation Does not have
documents Does not have
documents Has
documents Has documents
Does not have documents
Does not have documents
AND AND AND AND AND AND AND AND
Has no HLP dispute) Has HLP dispute)
Has no HLP dispute)
Has HLP dispute)
Has no HLP dispute)
Has HLP dispute)
Has no HLP dispute)
Has HLP dispute)
Non-Food Items (NFI)
Number of NFI possessed by household117
Possession of all 13 items
Possession of 10 to 12 items
Possession of 8 to 9 items
Possession of at least 7 items
Possession of at least 6 items
Possession of 3 to 6 items
Possession of 1 to 2 items
Possession of no items
Preferences Main support
required - shelter Not scored for MSNI: Indicate 3 most cited responses with corresponding frequencies
Preferences Main support required - NFI
Not scored for MSNI: Indicate 3 most cited responses with corresponding frequencies
114 This variable is constructed using questions on how many shelters the household occupies, and the assumption that a shelter accommodates 4 people on average. The density indicator is calculated according to the following formula: (total number of household members) / (number of shelters * 4) 115 Higher scores are accorded for the presence of the aforementioned sub-indicators. The sum of the 5 indicators ranges from 0 to 7. 116 HLP refers to Housing, Land, and Property 117 The list of Non-Food Items (NFI) includes: sleeping mats, blankets, plastic sheeting, jerry-cans, buckets, wash basin, cooking pot, plates, cups, serving spoon, kitchen knife, kettle, and a solar lamp.

134
Somalia Joint Multi-Cluster Needs Assessment, November 2019
WASH indicators
Concept Indicators None/ Minimal (1-2) Stress (3-4) Severe (5-6) Extreme (7-8)
1 2 3 4 5 6 1 2
Access to an improved water
source
Improved drinking water source
Piped system Protected well with
hand pump Vendors or Shop
Protected well without hand
pump Unprotected well Berkad118 River
OR OR OR OR
Borehole with
submersible pump Water tank and tap
Water trucking distribution point
Other
OR
Water kiosk
Improved domestic water source
Piped system Protected well with
hand pump Vendors or Shop
Protected well without hand
pump Unprotected well Berkad River
OR OR OR OR
Borehole with
submersible pump Water tank and tap
Water trucking distribution point
Other
OR
Water kiosk
Self-treatment
Boiling No treatment Cloth filter No treatment No treatment No treatment No treatment No treatment
OR (if source: protected well with hand pump
(if source: protected well without hand
pump)
(if source: vendors
(if source: unprotected well)
(if source: Berkad)
(if source: river)
Chlorine Aquatabs
OR OR
OR borehole with
submersible pump water trucking
Ceramic filter OR OR
tank and tap water distribution
point
OR OR OR
Commercial/ membrane filter
piped system) treatment is
‘other’)
Access: Time taken to water source
Time to water sources < 15
minutes
15 < time < 30 minutes
30 < time < 60
minutes
1 < time < 3 hours
3+ hours < time
Sufficiency Sufficient quantity
drinking water Yes No
118 A berkad is a water reservoir used to collect water during wet seasons and store it for later use during dry seasons.
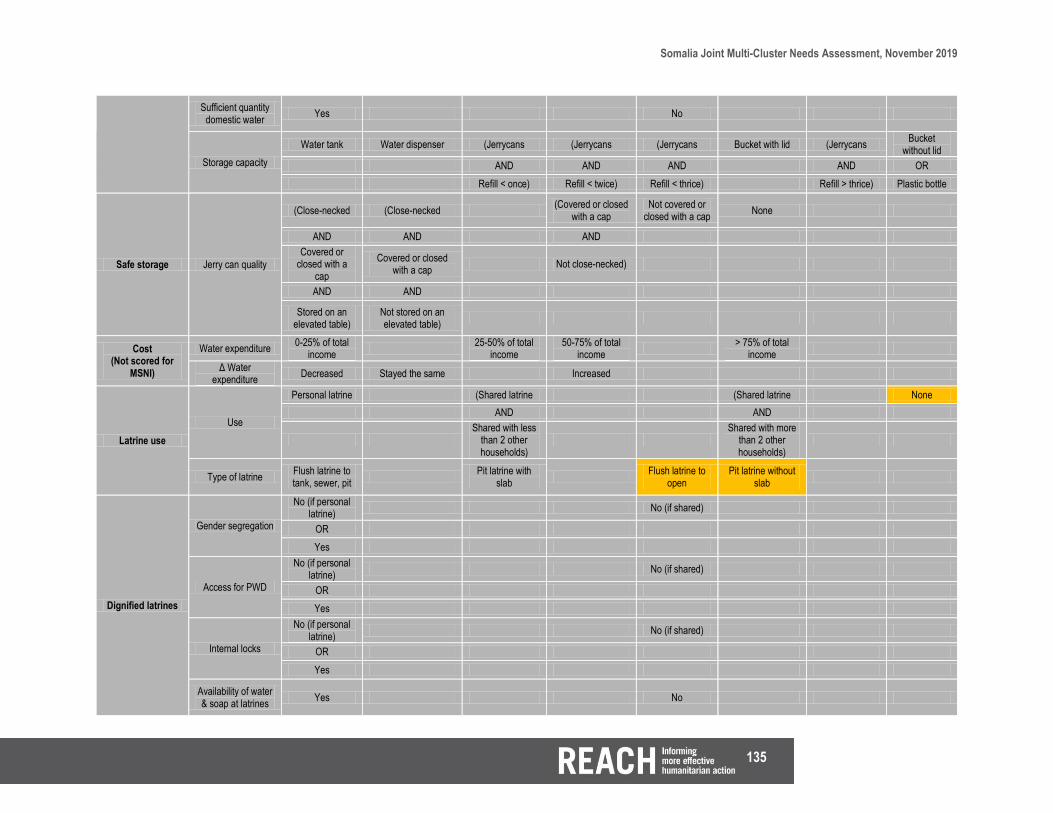
135
Somalia Joint Multi-Cluster Needs Assessment, November 2019
Sufficient quantity domestic water
Yes No
Storage capacity
Water tank Water dispenser (Jerrycans (Jerrycans (Jerrycans Bucket with lid (Jerrycans Bucket
without lid
AND AND AND AND OR
Refill < once) Refill < twice) Refill < thrice) Refill > thrice) Plastic bottle
Safe storage Jerry can quality
(Close-necked (Close-necked (Covered or closed
with a cap Not covered or
closed with a cap None
AND AND AND
Covered or closed with a
cap
Covered or closed with a cap
Not close-necked)
AND AND
Stored on an elevated table)
Not stored on an elevated table)
Cost (Not scored for
MSNI)
Water expenditure 0-25% of total
income
25-50% of total income
50-75% of total income
> 75% of total
income
Δ Water expenditure
Decreased Stayed the same Increased
Latrine use
Use
Personal latrine (Shared latrine (Shared latrine None
AND AND
Shared with less
than 2 other households)
Shared with more
than 2 other households)
Type of latrine Flush latrine to tank, sewer, pit
Pit latrine with
slab
Flush latrine to open
Pit latrine without slab
Dignified latrines
Gender segregation
No (if personal latrine)
No (if shared)
OR
Yes
Access for PWD
No (if personal latrine)
No (if shared)
OR
Yes
Internal locks
No (if personal latrine)
No (if shared)
OR
Yes
Availability of water & soap at latrines
Yes No
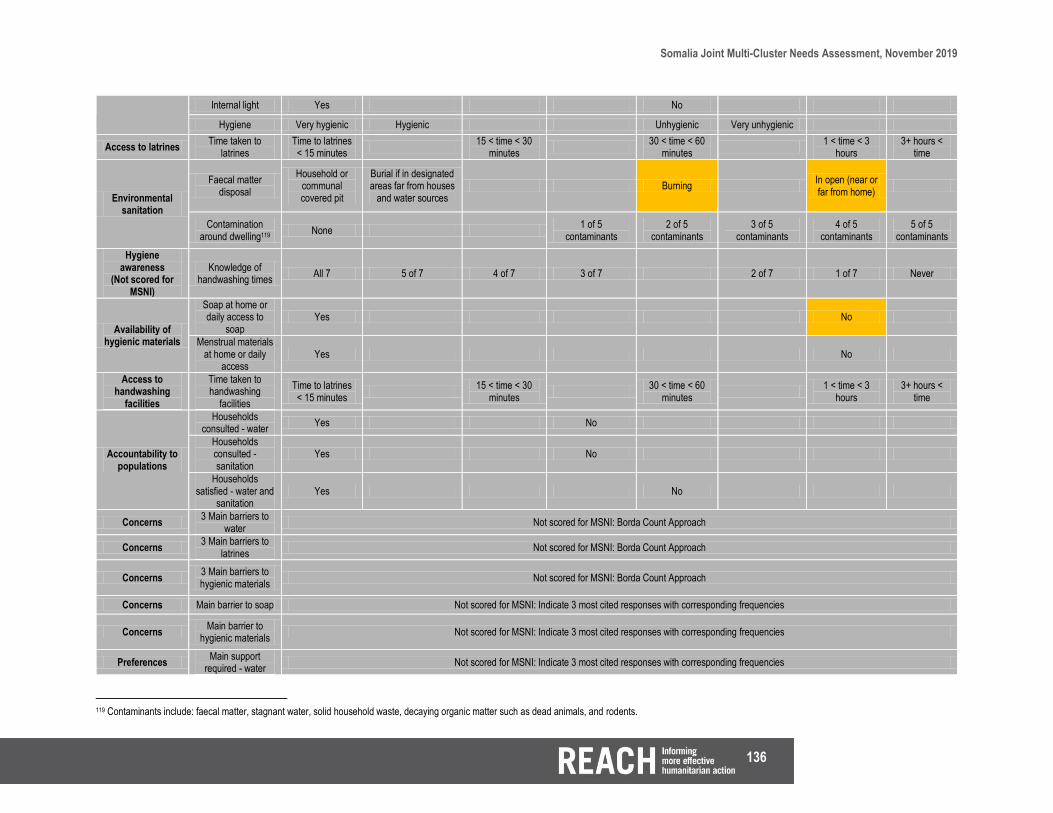
136
Somalia Joint Multi-Cluster Needs Assessment, November 2019
Internal light Yes No
Hygiene Very hygienic Hygienic Unhygienic Very unhygienic
Access to latrines Time taken to
latrines Time to latrines < 15 minutes
15 < time < 30
minutes
30 < time < 60 minutes
1 < time < 3
hours 3+ hours <
time
Environmental sanitation
Faecal matter disposal
Household or communal covered pit
Burial if in designated areas far from houses
and water sources Burning
In open (near or far from home)
Contamination around dwelling119
None 1 of 5
contaminants 2 of 5
contaminants 3 of 5
contaminants 4 of 5
contaminants 5 of 5
contaminants
Hygiene awareness
(Not scored for MSNI)
Knowledge of handwashing times
All 7 5 of 7 4 of 7 3 of 7 2 of 7 1 of 7 Never
Availability of hygienic materials
Soap at home or daily access to
soap Yes No
Menstrual materials at home or daily
access Yes No
Access to handwashing
facilities
Time taken to handwashing
facilities
Time to latrines < 15 minutes
15 < time < 30
minutes
30 < time < 60 minutes
1 < time < 3
hours 3+ hours <
time
Accountability to populations
Households consulted - water
Yes No
Households consulted - sanitation
Yes No
Households satisfied - water and
sanitation Yes No
Concerns 3 Main barriers to
water Not scored for MSNI: Borda Count Approach
Concerns 3 Main barriers to
latrines Not scored for MSNI: Borda Count Approach
Concerns 3 Main barriers to hygienic materials
Not scored for MSNI: Borda Count Approach
Concerns Main barrier to soap Not scored for MSNI: Indicate 3 most cited responses with corresponding frequencies
Concerns Main barrier to
hygienic materials Not scored for MSNI: Indicate 3 most cited responses with corresponding frequencies
Preferences Main support
required - water Not scored for MSNI: Indicate 3 most cited responses with corresponding frequencies
119 Contaminants include: faecal matter, stagnant water, solid household waste, decaying organic matter such as dead animals, and rodents.

137
Somalia Joint Multi-Cluster Needs Assessment, November 2019
Preferences Main support
required - latrines Not scored for MSNI: Indicate 3 most cited responses with corresponding frequencies
Preferences Main support
required - hygienic materials
Not scored for MSNI: Indicate 3 most cited responses with corresponding frequencies
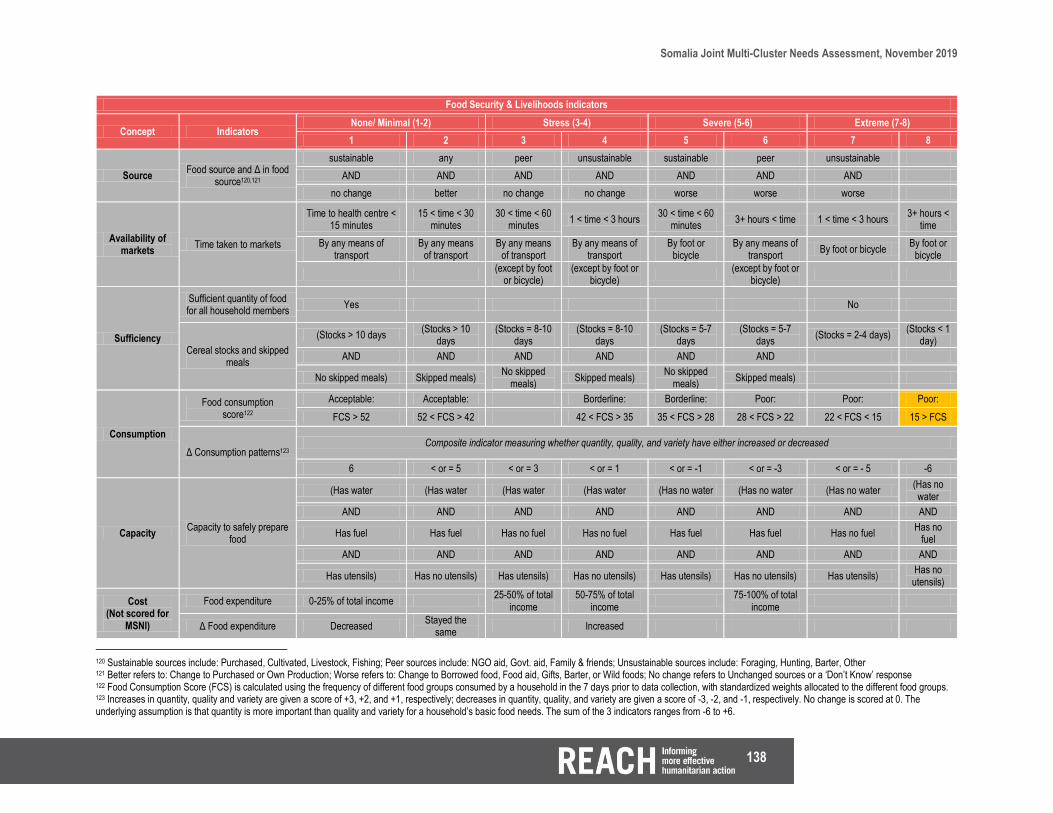
138
Somalia Joint Multi-Cluster Needs Assessment, November 2019
Food Security & Livelihoods indicators
Concept Indicators None/ Minimal (1-2) Stress (3-4) Severe (5-6) Extreme (7-8)
1 2 3 4 5 6 7 8
Source Food source and Δ in food
source120,121
sustainable any peer unsustainable sustainable peer unsustainable
AND AND AND AND AND AND AND
no change better no change no change worse worse worse
Availability of markets
Time taken to markets
Time to health centre < 15 minutes
15 < time < 30 minutes
30 < time < 60 minutes
1 < time < 3 hours 30 < time < 60
minutes 3+ hours < time 1 < time < 3 hours
3+ hours < time
By any means of transport
By any means of transport
By any means of transport
By any means of transport
By foot or bicycle
By any means of transport
By foot or bicycle By foot or
bicycle
(except by foot
or bicycle) (except by foot or
bicycle)
(except by foot or bicycle)
Sufficiency
Sufficient quantity of food for all household members
Yes No
Cereal stocks and skipped meals
(Stocks > 10 days (Stocks > 10
days (Stocks = 8-10
days (Stocks = 8-10
days (Stocks = 5-7
days (Stocks = 5-7
days (Stocks = 2-4 days)
(Stocks < 1 day)
AND AND AND AND AND AND
No skipped meals) Skipped meals) No skipped
meals) Skipped meals)
No skipped meals)
Skipped meals)
Consumption
Food consumption score122
Acceptable: Acceptable: Borderline: Borderline: Poor: Poor: Poor:
FCS > 52 52 < FCS > 42 42 < FCS > 35 35 < FCS > 28 28 < FCS > 22 22 < FCS < 15 15 > FCS
Δ Consumption patterns123 Composite indicator measuring whether quantity, quality, and variety have either increased or decreased
6 < or = 5 < or = 3 < or = 1 < or = -1 < or = -3 < or = - 5 -6
Capacity Capacity to safely prepare
food
(Has water (Has water (Has water (Has water (Has no water (Has no water (Has no water (Has no water
AND AND AND AND AND AND AND AND
Has fuel Has fuel Has no fuel Has no fuel Has fuel Has fuel Has no fuel Has no
fuel
AND AND AND AND AND AND AND AND
Has utensils) Has no utensils) Has utensils) Has no utensils) Has utensils) Has no utensils) Has utensils) Has no utensils)
Cost (Not scored for
MSNI)
Food expenditure 0-25% of total income 25-50% of total
income 50-75% of total
income
75-100% of total income
Δ Food expenditure Decreased Stayed the
same Increased
120 Sustainable sources include: Purchased, Cultivated, Livestock, Fishing; Peer sources include: NGO aid, Govt. aid, Family & friends; Unsustainable sources include: Foraging, Hunting, Barter, Other 121 Better refers to: Change to Purchased or Own Production; Worse refers to: Change to Borrowed food, Food aid, Gifts, Barter, or Wild foods; No change refers to Unchanged sources or a ‘Don’t Know’ response 122 Food Consumption Score (FCS) is calculated using the frequency of different food groups consumed by a household in the 7 days prior to data collection, with standardized weights allocated to the different food groups. 123 Increases in quantity, quality and variety are given a score of +3, +2, and +1, respectively; decreases in quantity, quality, and variety are given a score of -3, -2, and -1, respectively. No change is scored at 0. The underlying assumption is that quantity is more important than quality and variety for a household’s basic food needs. The sum of the 3 indicators ranges from -6 to +6.

139
Somalia Joint Multi-Cluster Needs Assessment, November 2019
Income Livelihood incomes
Own business Livestock production
Cash crop farming Subsistence
farming Humanitarian
assistance
Sale of humanitarian assistance
None
OR OR OR OR
Contracted job Cash fishing Subsistence
fishing Remittances
OR OR OR
Rent of land Daily labour Other
Loss of income source No Yes
Assets
Livelihood assets
Own livestock No ownership of
livestock
OR OR
Access to cultivable land No access to cultivable land
OR OR
Able to access savings/financial
services
No Ability to access savings
Loss of assets (livestock) No losses Loss < 25% 50% > Loss >
25% 75% > Loss >
50% Loss > 75%
Loss of assets (cultivable land)
No losses Loss < 25% 50% > Loss >
25% 75% > Loss >
50% Loss > 75%
Concerns 3 Main barriers to food
access Not scored for MSNI: Borda Count Approach
Preferences Main support required -
food Not scored for MSNI: Indicate 3 most cited responses with corresponding frequencies

140
Somalia Joint Multi-Cluster Needs Assessment, November 2019
Protection indicators
Concept Indicators None/ Minimal (1-2) Stress (3-4) Severe (5-6) Extreme (7-8)
1 2 3 4 5 6 7 8
Freedom of movement
Ability to move freely and feeling of
security
Able to move freely in and
around surrounding
areas
(Able to move freely in and
around surrounding areas
(Able to move freely in and
around surrounding
areas
Not able to move freely in and
around surrounding areas
(Not able to move freely in and
around surrounding
areas
AND AND AND
Areas where men and boys do not
feel safe)
Areas where women and girls do not feel safe)
Areas where men and boys do not
feel safe
AND
Areas where
women and girls do not feel safe)
Family separation
Separation of adults and children
(No adults separated
Left to study At least 1 adult
separated At least 1 child
separated (At least 1 adult
separated
AND Or AND
No children separated)
Left to work 1 child separated)
Safety and security
Safety and security concerns
Never worried Sometimes worried
about theft/harassment
Sometimes worried about small/medium
injuries
Always worried about
theft/harassment
Sometimes worried about
sexual violence
Sometimes worried about
landmines/UXOs
Always worried about sexual
violence
OR OR OR OR
Always worried about
small/medium injuries
Sometimes worried about grave injuries
Sometimes worried about
abduction
Always worried about grave
injuries
OR OR
Sometimes
worried about risk of death
Always worried about abduction
OR
Always worried
about landmines/UXOs
OR
Always worried
about risk of death
Hazardous work Hazardous or
exploitative work
(No adults engaged in
hazardous work
At least 1 adult engaged in
hazardous work
At least 1 child engaged in
hazardous work (At least 1 adult
AND AND

141
Somalia Joint Multi-Cluster Needs Assessment, November 2019
No children engaged in
hazardous work)
1 child engaged in hazardous
work)
Housing, land, and property
Land ownership and documentation
(Owns land (Owns land (Owns land (Owns land (Does not own land (Does not own
land (Does not own
land (Does not own
land
AND AND AND AND AND AND AND AND
Has documentation
Has documentation
Does not have documentation
Does not have documentation
Has documentation Has
documentation Does not have documentation
Does not have documentation
AND AND AND AND AND AND AND AND
Can obtain/renew it)
Cannot obtain/renew it)
Can obtain/renew it)
Cannot obtain/renew it)
Can obtain/renew it)
Cannot obtain/renew it)
Can obtain/renew it)
Cannot obtain/renew it)
HLP dispute resolution
mechanisms, use and satisfaction
No HLP dispute (Has HLP
dispute (Has HLP dispute (Has HLP dispute
AND AND AND
Made use of
resolution mechanism
Not made use of resolution
mechanism)
Made use of resolution
mechanism
AND AND
Satisfied with
outcome)
Not satisfied with outcome)
Land seizure No land seizure Land seized in
previous location or area of origin
Gender based violence
GBV referral pathways,
awareness, use, and satisfaction124
Composite indicator comprised of sub-indicators on availability of GBV pathways, awareness of pathways, use, and satisfaction.
6 5 4 3 2 1 0
Recourse to justice
Police Community
leaders UN or NGO agency Armed group Nowhere to report
OR OR OR
Community
elders Health centre Would not report
Rule of law
Access and effectiveness of
judicial remedy125
Composite indicator comprised of sub-indicators on access and effectiveness of judicial remedy.
4 3 2 1 0
Recourse to justice
Police Community
leaders UN or NGO agency Armed group Nowhere to report
OR OR OR
Community
elders Health centre Would not report
Child protection Injuries to children No Yes Yes
AND
124 GBV refers to Gender-Based Violence. For each sub-indicator, if ‘yes’ add 2, if ‘don’t know’ add 1, if ‘no’, add 0. The sum of the 3 indicators ranges from 0 to 6. 125 For each sub-indicator, if ‘yes’ add 2, if ‘don’t know’ add 1, if ‘no’, add 0. The sum of the 2 indicators ranges from 0 to 4.
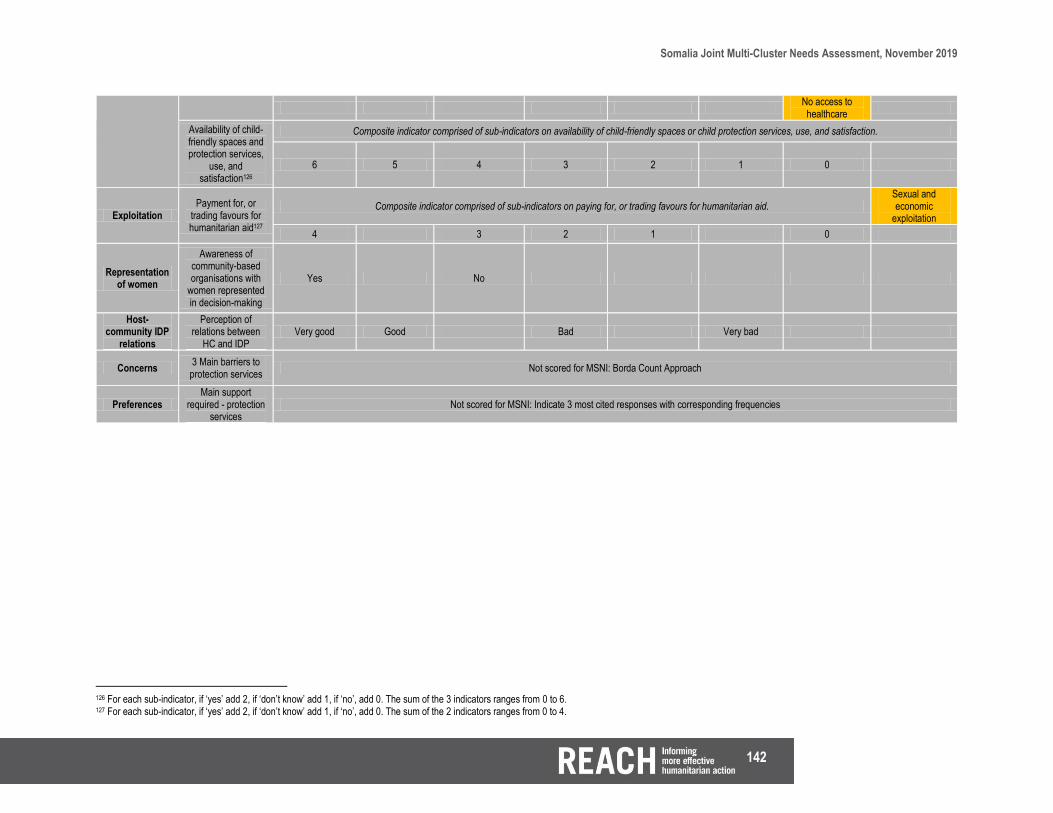
142
Somalia Joint Multi-Cluster Needs Assessment, November 2019
No access to healthcare
Availability of child-friendly spaces and protection services,
use, and satisfaction126
Composite indicator comprised of sub-indicators on availability of child-friendly spaces or child protection services, use, and satisfaction.
6 5 4 3 2 1 0
Exploitation Payment for, or
trading favours for humanitarian aid127
Composite indicator comprised of sub-indicators on paying for, or trading favours for humanitarian aid. Sexual and economic
exploitation
4 3 2 1 0
Representation of women
Awareness of community-based organisations with
women represented in decision-making
Yes No
Host-community IDP
relations
Perception of relations between
HC and IDP Very good Good Bad Very bad
Concerns 3 Main barriers to protection services
Not scored for MSNI: Borda Count Approach
Preferences Main support
required - protection services
Not scored for MSNI: Indicate 3 most cited responses with corresponding frequencies
126 For each sub-indicator, if ‘yes’ add 2, if ‘don’t know’ add 1, if ‘no’, add 0. The sum of the 3 indicators ranges from 0 to 6. 127 For each sub-indicator, if ‘yes’ add 2, if ‘don’t know’ add 1, if ‘no’, add 0. The sum of the 2 indicators ranges from 0 to 4.

143
Somalia Joint Multi-Cluster Needs Assessment, November 2019
Negative Coping Strategy indicators
Concept Indicators None/ Minimal (1-2) Stress (3-4) Severe (5-6) Extreme (7-8)
1 2 3 4 5 6 7 8
Negative Coping Strategy
Index
Water
Borrow or share materials or borrow cash
Spend more time travelling/waiting (secure areas)
Reduce domestic water consumption
Adults work extra shifts/jobs
Send children to fetch water
Reduce drinking water consumption
Adult members beg
Drink unsafe water
OR OR OR OR OR OR OR
None Rely on seasonal
water sources
Use money otherwise used
for other purchases
Sell assets otherwise used
for other purposes
Adults reduce consumption so that
minors can drink Minors work Minors beg
OR OR OR
Rely on humanitarian
assistance
Travel/Move to insecure or
dangerous areas
Sexual, economic exploitation to access
humanitarian assistance
Sanitation
None Share facilities with other households
Use facilities which are unhygienic/not
cleaned
Use money otherwise used
for other purchases
Only use facilities at
night or non-segregated latrines
Travel/Move to insecure or
dangerous areas Open defaecation
OR OR OR
Spend more time travelling/waiting (secure areas)
Rely on humanitarian assistance
Sexual, economic exploitation to access
humanitarian assistance
Hygienic materials
Wash clothes with soap substitutes
Wash hands with soap substitutes
Wash hands or menstrual materials
less frequently
Adults work extra shifts/jobs
Sell assets otherwise used
for other purposes
Use latrines for bathing purposes
Do not use menstruation
materials
Do not wash hands at all
OR OR OR OR OR OR OR
Borrow or share materials or borrow cash
Wash menstrual materials with soap
substitutes
Do not clean/re-use menstruation
materials
Use money otherwise used
for other purchases
Do not wash hands
with soap Adult members
beg Minors beg
OR OR OR OR OR
None Spend more time travelling/waiting (secure areas)
Rely on humanitarian assistance
Minors work
Sexual, economic exploitation to access
humanitarian assistance
OR
Travel/Move to
insecure or dangerous areas

144
Somalia Joint Multi-Cluster Needs Assessment, November 2019
Food
Borrow or share materials or borrow cash
Rely on less preferred and less expensive
foods
Rely on humanitarian assistance
Borrow food or rely on help from
friends or relatives
Limit portion size at mealtime
Reduce number of meals eaten in a
day
Adult members beg
Minors beg
OR OR OR OR OR OR OR
None Spend more time travelling/waiting (secure areas)
Send children to
relatives
Sell assets otherwise used
for other purposes
Restrict consumption by
adults in order for children to eat
Minors work
Sexual, economic exploitation to access
humanitarian assistance
OR OR
Adults work extra
shifts/jobs
Travel/Move to insecure or
dangerous areas
OR
Use money otherwise used
for other purchases
Shelter
Borrow or share materials or borrow cash
Spend more time travelling/waiting (secure areas)
Being hosted by other households
Move from shelter to shelter
Move to unplanned settlements
Adult members
beg Live in open-air
conditions
OR OR OR OR OR OR
None Scavenge for construction
materials
Send children to relatives
Squat: Using empty building,
school Minors work Minors beg
OR OR OR OR OR
Rely on humanitarian
assistance Adults work extra
shifts/jobs
Sell assets otherwise used
for other purposes
Travel/Move to insecure or
dangerous areas
Sexual, economic exploitation to access
humanitarian assistance
OR
Use money otherwise used
for other purchases
Non-Food Items
Borrow or share materials or borrow cash
Spend more time travelling/waiting (secure areas)
Rely on humanitarian assistance
Adults work extra shifts/jobs
Sell assets otherwise used
for other purposes
Scavenge for NFI materials
Adult members beg
Minors beg
OR OR OR OR
None
Use money otherwise used
for other purchases
Minors work
Sexual, economic exploitation to access
humanitarian assistance

145
Somalia Joint Multi-Cluster Needs Assessment, November 2019
OR
Travel/Move to
insecure or dangerous areas
Education
Borrow or share materials or borrow cash
Peer learning Home schooling Adults work extra
shifts/jobs
Sell assets otherwise used
for other purposes
Adult members beg
Minors beg
OR OR OR OR OR OR
None Part-time schooling Rely on humanitarian
assistance
Use money otherwise used
for other purchases
Minors work
Sexual, economic exploitation to access
humanitarian assistance
OR OR
Spend more time travelling/waiting (secure areas)
Travel/Move to
insecure or dangerous areas
Healthcare
Borrow or share materials or borrow cash
Spend more time travelling/waiting (secure areas)
Rely on humanitarian assistance
Self-medicate
Seek treatment or service from unqualified
workers
Do not seek treatment or healthcare
Minors beg
OR OR OR OR OR
None Adults work extra
shifts/jobs
Sell assets otherwise used
for other purposes
Adult members beg
Sexual, economic exploitation to access
humanitarian assistance
OR OR
Use money otherwise used
for other purchases
Minors work
OR
Travel/Move to
insecure or dangerous areas

146
Somalia Joint Multi-Cluster Needs Assessment, November 2019
Annex 13: Most reported primary and secondary factors influencing displacement decisions Most reported primary and secondary factors for leaving previous settlement
# Primary reasons Average Secondary reasons Average Contribution by factor
0 All conflict-related factors
48.87% All conflict-related factors
33.92% 82.79% (reasons 1-6 below) (reasons 1-6 below)
1 Actual conflict in community 28.99% Actual conflict in community 3.49% 32.48%
2 Arrival of armed groups 6.43% Arrival of armed groups 11.92% 18.35%
3 Withdrawal of armed groups/ security forces
0.21% Withdrawal of armed groups/ security forces
3.11% 3.32%
4 Conflict in surrounding area, but not in my community
6.54% Conflict in surrounding area, but not in my community
2.61% 9.15%
5 Fear of conflict in community 0.65% Fear of conflict in community 6.73% 7.38%
6 Personal threats 6.04% Personal threats 6.06% 12.10%
7 Pressure from authorities 0.18% Pressure from authorities 5.77% 5.95%
8 Pressure from host communities 0.12% Pressure from host communities 0.27% 0.39%
9 Eviction 1.49% Eviction 2.34% 3.83%
10 Drought 18.03% Drought 9.90% 27.93%
11 Flooding 1.09% Flooding 3.51% 4.60%
12 Lack of livelihood opportunities/job
9.23% Lack of livelihood opportunities/job
12.76% 21.99%
13 Lack of food (not drought related)
3.47% Lack of food (not drought related)
6.02% 9.49%
14 Lack of water (not drought related)
5.68% Lack of water (not drought related)
7.49% 13.17%
15 Lack of education services 0.59% Lack of education services 2.48% 3.07%
16 Lack of health services 4.03% Lack of health services 10.39% 14.42%
17 Livestock disease outbreak/livestock death
0.48% Livestock disease outbreak/livestock death
1.03% 1.51%
18 None 5.96% None 3.53% 9.49%
19 I don’t know or don’t want to answer
0.78% I don’t know or don’t want to answer
0.60% 1.38%
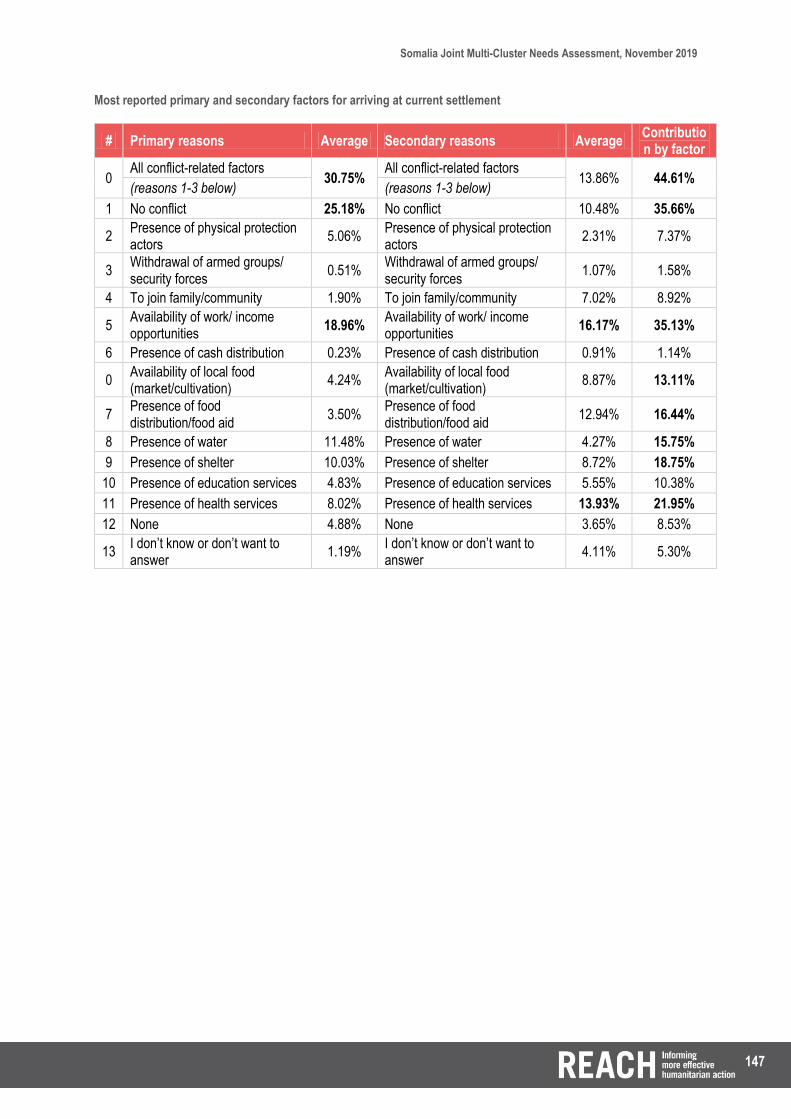
147
Somalia Joint Multi-Cluster Needs Assessment, November 2019
Most reported primary and secondary factors for arriving at current settlement
# Primary reasons Average Secondary reasons Average Contribution by factor
0 All conflict-related factors
30.75% All conflict-related factors
13.86% 44.61% (reasons 1-3 below) (reasons 1-3 below)
1 No conflict 25.18% No conflict 10.48% 35.66%
2 Presence of physical protection actors
5.06% Presence of physical protection actors
2.31% 7.37%
3 Withdrawal of armed groups/ security forces
0.51% Withdrawal of armed groups/ security forces
1.07% 1.58%
4 To join family/community 1.90% To join family/community 7.02% 8.92%
5 Availability of work/ income opportunities
18.96% Availability of work/ income opportunities
16.17% 35.13%
6 Presence of cash distribution 0.23% Presence of cash distribution 0.91% 1.14%
0 Availability of local food (market/cultivation)
4.24% Availability of local food (market/cultivation)
8.87% 13.11%
7 Presence of food distribution/food aid
3.50% Presence of food distribution/food aid
12.94% 16.44%
8 Presence of water 11.48% Presence of water 4.27% 15.75%
9 Presence of shelter 10.03% Presence of shelter 8.72% 18.75%
10 Presence of education services 4.83% Presence of education services 5.55% 10.38%
11 Presence of health services 8.02% Presence of health services 13.93% 21.95%
12 None 4.88% None 3.65% 8.53%
13 I don’t know or don’t want to answer
1.19% I don’t know or don’t want to answer
4.11% 5.30%

148
Somalia Joint Multi-Cluster Needs Assessment, November 2019
Most reported primary and secondary factors for leaving previous settlement, by district
District Primary reason for leaving previous
location Secondary reason for leaving previous
location
Afgooye Conflict 33,40% Conflict 26,18%
Afmadow Lack of livelihood opportunities /
job 55,65% Lack of health services 36,35%
Banadir Conflict 24,55% Drought 17,90%
Baydhaba Conflict 35,54% Conflict 33,31%
Belet Weyne Conflict 20,04% Drought 31,75%
Berbera Conflict 98,16% Conflict 98,11%
Borama Lack of livelihood opportunities /
job 32,00% Lack of health services 21,74%
Bossaso Conflict 51,49% Conflict 25,26%
Burco Lack of livelihood opportunities /
job 32,37% Lack of livelihood opportunities / job 32,79%
Burtinle Lack of livelihood opportunities /
job 42,98%
Lack of Presence of water (not drought related)
43,39%
Buuhoodle Conflict 34,15% Conflict 34,21%
Cabudwaaq Conflict 48,98% Conflict 32,57%
Cadaado Conflict 28,98% Conflict 28,01%
Caynabo Drought 96,80% Lack of food (not drought related) 59,68%
Ceel Afweyn Drought 75,80% Lack of Presence of water (not drought
related) 26,97%
Ceel Barde Conflict 63,22% Conflict 55,74%
Ceel Waaq Conflict 99,77% Conflict 99,77%
Ceerigaabo Conflict 32,83% Conflict 23,22%
Dhuusamarreeb
Conflict 49,15%
Doolow Drought 47,95% Lack of health services 28,31%
Gaalkacyo Conflict 23,90% Lack of livelihood opportunities / job 26,67%
Galdogob Drought 56,98% Lack of livelihood opportunities / job 54,88%
Garbahaarey Conflict 24,81% Drought 24,91%
Garoowe Conflict 52,12% Conflict 41,56%
Gebiley Drought 32,94% Lack of livelihood opportunities / job 28,19%
Hargeysa Conflict 48,52% Drought 24,43%
Hobyo Conflict 49,46% Conflict 49,36%
Jowhar Conflict 50,84% Conflict 20,40%
Kismaayo Drought 30,04% Lack of livelihood opportunities / job 20,29%
Laas Caanood Conflict 93,09% Lack of health services 91,32%
Laasqoray Lack of livelihood opportunities /
job 48,10%
Lack of Presence of water (not drought related)
47,71%
Lughaye Drought 40,00% Lack of Presence of water (not drought
related) 22,50%
Owdweyne Drought 84,80% Lack of Presence of water (not drought
related) 69,52%
Taleex Lack of livelihood opportunities / job 91,40%
Waajid Conflict 52,99% Drought 56,69%
Wanla Weyn Conflict 43,18% Conflict 25,58%
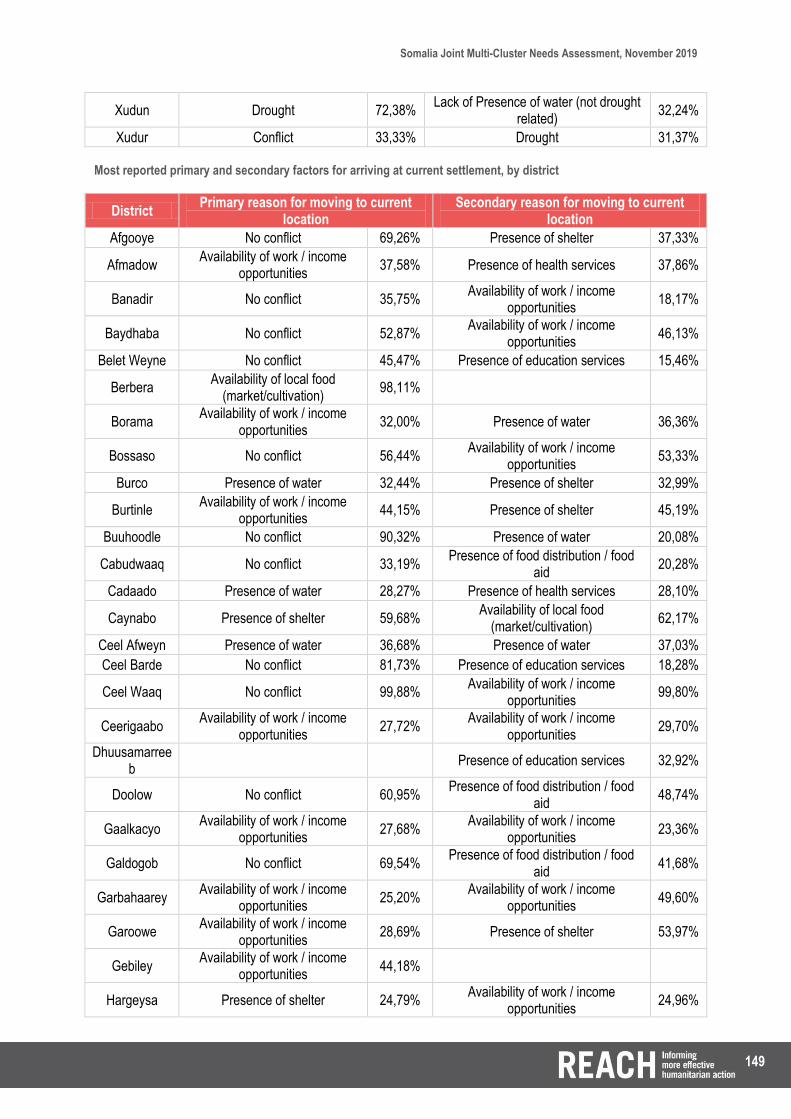
149
Somalia Joint Multi-Cluster Needs Assessment, November 2019
Xudun Drought 72,38% Lack of Presence of water (not drought
related) 32,24%
Xudur Conflict 33,33% Drought 31,37% Most reported primary and secondary factors for arriving at current settlement, by district
District Primary reason for moving to current
location Secondary reason for moving to current
location
Afgooye No conflict 69,26% Presence of shelter 37,33%
Afmadow Availability of work / income
opportunities 37,58% Presence of health services 37,86%
Banadir No conflict 35,75% Availability of work / income
opportunities 18,17%
Baydhaba No conflict 52,87% Availability of work / income
opportunities 46,13%
Belet Weyne No conflict 45,47% Presence of education services 15,46%
Berbera Availability of local food
(market/cultivation) 98,11%
Borama Availability of work / income
opportunities 32,00% Presence of water 36,36%
Bossaso No conflict 56,44% Availability of work / income
opportunities 53,33%
Burco Presence of water 32,44% Presence of shelter 32,99%
Burtinle Availability of work / income
opportunities 44,15% Presence of shelter 45,19%
Buuhoodle No conflict 90,32% Presence of water 20,08%
Cabudwaaq No conflict 33,19% Presence of food distribution / food
aid 20,28%
Cadaado Presence of water 28,27% Presence of health services 28,10%
Caynabo Presence of shelter 59,68% Availability of local food
(market/cultivation) 62,17%
Ceel Afweyn Presence of water 36,68% Presence of water 37,03%
Ceel Barde No conflict 81,73% Presence of education services 18,28%
Ceel Waaq No conflict 99,88% Availability of work / income
opportunities 99,80%
Ceerigaabo Availability of work / income
opportunities 27,72%
Availability of work / income opportunities
29,70%
Dhuusamarreeb
Presence of education services 32,92%
Doolow No conflict 60,95% Presence of food distribution / food
aid 48,74%
Gaalkacyo Availability of work / income
opportunities 27,68%
Availability of work / income opportunities
23,36%
Galdogob No conflict 69,54% Presence of food distribution / food
aid 41,68%
Garbahaarey Availability of work / income
opportunities 25,20%
Availability of work / income opportunities
49,60%
Garoowe Availability of work / income
opportunities 28,69% Presence of shelter 53,97%
Gebiley Availability of work / income
opportunities 44,18%
Hargeysa Presence of shelter 24,79% Availability of work / income
opportunities 24,96%

150
Somalia Joint Multi-Cluster Needs Assessment, November 2019
Hobyo No conflict 49,99% No conflict 49,36%
Jowhar No conflict 79,37% Presence of food distribution / food
aid 38,64%
Kismaayo Availability of work / income
opportunities 59,35% No conflict 26,38%
Laas Caanood No conflict 94,09% Presence of health services 91,59%
Laasqoray No conflict 47,96% Availability of local food
(market/cultivation) 47,72%
Lughaye Presence of shelter 27,50% Availability of local food
(market/cultivation) 21,62%
Owdweyne Availability of local food
(market/cultivation) 56,82%
Taleex To join family/community 30,74% No conflict 92,22%
Waajid No conflict 64,08% Presence of food distribution / food
aid 90,39%
Wanla Weyn No conflict 27,27% Availability of work / income
opportunities 36,36%
Xudun Presence of shelter 51,26% Presence of cash distribution 50,30%
Xudur Availability of work / income
opportunities 31,37%
Presence of food distribution / food aid
23,53%

151
Somalia Joint Multi-Cluster Needs Assessment, November 2019
Annex 14: How to read a sun-burst diagram The sunburst diagram shows hierarchical data. Every level of the hierarchy is represented by one ring or circle with the innermost circle as the top of the hierarchy.
The innermost circle represents the proportion of households categorised with a MSNI severity score of at least 3 (or, in the case of groups/areas of particular concern, the proportion of households categorised with the highest MSNI severity score). The ring immediately surrounding the innermost circle shows the proportion of households whose MSNI severity score (of at least 3) was primarily driven by:
a) Living Standard Gap (LSG) in food security/ livelihoods and/or WASH; OR b) Capacity gap; OR c) Co-occurring LSGs in health and shelter, or health and protection, or shelter and protection; OR d) LSG in health, or shelter, or protection and have been severely impacted by the event/shock;
The outer ring breaks down the primary divers of the MSNI severity score (above) even further, by showing the breakdown of the proportion of households:
i. Within a) (above) whose needs were driven by an LSG in food security, or WASH, or both; ii. Within c) whose needs were driven by co-occurring LSGs in either health and shelter, or health and protection, or shelter and protection, or all three sectors iii. Within d) whose needs were driven by an LSG in health, or shelter, or protection, in addition to an impact of the event/shock on households.
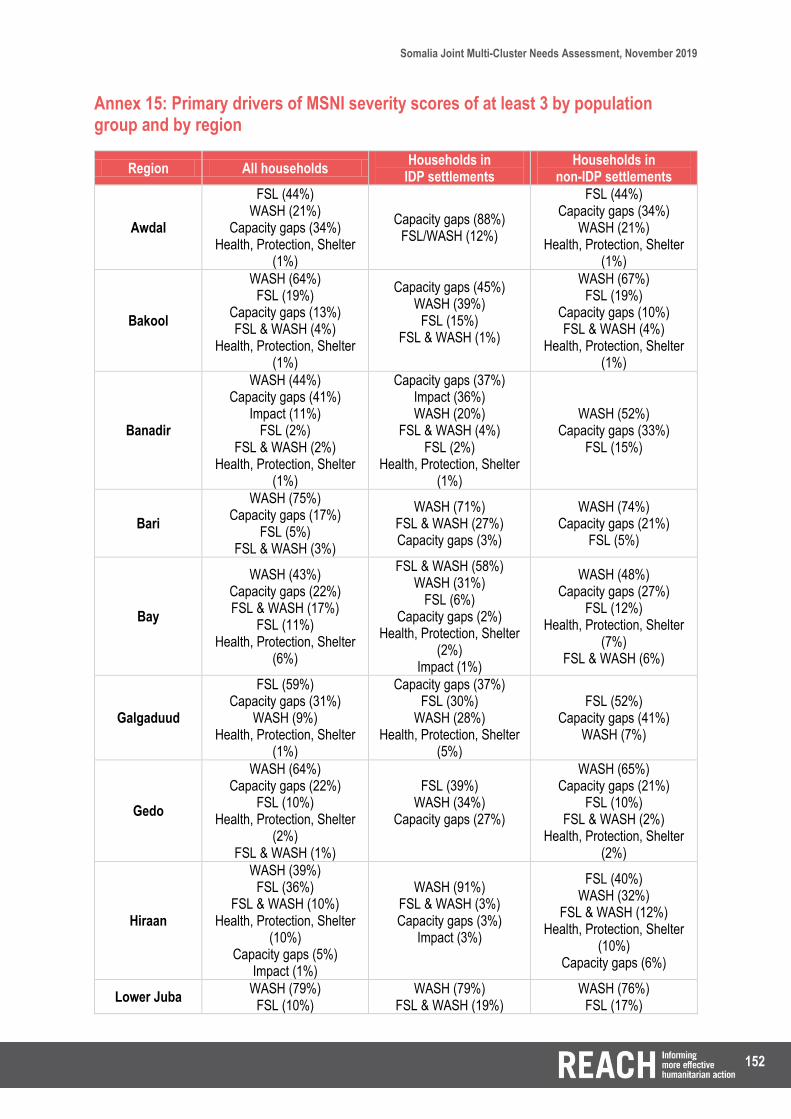
152
Somalia Joint Multi-Cluster Needs Assessment, November 2019
Annex 15: Primary drivers of MSNI severity scores of at least 3 by population group and by region
Region All households Households in
IDP settlements Households in
non-IDP settlements
Awdal
FSL (44%) WASH (21%)
Capacity gaps (34%) Health, Protection, Shelter
(1%)
Capacity gaps (88%) FSL/WASH (12%)
FSL (44%) Capacity gaps (34%)
WASH (21%) Health, Protection, Shelter
(1%)
Bakool
WASH (64%) FSL (19%)
Capacity gaps (13%) FSL & WASH (4%)
Health, Protection, Shelter (1%)
Capacity gaps (45%) WASH (39%)
FSL (15%) FSL & WASH (1%)
WASH (67%) FSL (19%)
Capacity gaps (10%) FSL & WASH (4%)
Health, Protection, Shelter (1%)
Banadir
WASH (44%) Capacity gaps (41%)
Impact (11%) FSL (2%)
FSL & WASH (2%) Health, Protection, Shelter
(1%)
Capacity gaps (37%) Impact (36%) WASH (20%)
FSL & WASH (4%) FSL (2%)
Health, Protection, Shelter (1%)
WASH (52%) Capacity gaps (33%)
FSL (15%)
Bari
WASH (75%) Capacity gaps (17%)
FSL (5%) FSL & WASH (3%)
WASH (71%) FSL & WASH (27%) Capacity gaps (3%)
WASH (74%) Capacity gaps (21%)
FSL (5%)
Bay
WASH (43%) Capacity gaps (22%) FSL & WASH (17%)
FSL (11%) Health, Protection, Shelter
(6%)
FSL & WASH (58%) WASH (31%)
FSL (6%) Capacity gaps (2%)
Health, Protection, Shelter (2%)
Impact (1%)
WASH (48%) Capacity gaps (27%)
FSL (12%) Health, Protection, Shelter
(7%) FSL & WASH (6%)
Galgaduud
FSL (59%) Capacity gaps (31%)
WASH (9%) Health, Protection, Shelter
(1%)
Capacity gaps (37%) FSL (30%)
WASH (28%) Health, Protection, Shelter
(5%)
FSL (52%) Capacity gaps (41%)
WASH (7%)
Gedo
WASH (64%) Capacity gaps (22%)
FSL (10%) Health, Protection, Shelter
(2%) FSL & WASH (1%)
FSL (39%) WASH (34%)
Capacity gaps (27%)
WASH (65%) Capacity gaps (21%)
FSL (10%) FSL & WASH (2%)
Health, Protection, Shelter (2%)
Hiraan
WASH (39%) FSL (36%)
FSL & WASH (10%) Health, Protection, Shelter
(10%) Capacity gaps (5%)
Impact (1%)
WASH (91%) FSL & WASH (3%) Capacity gaps (3%)
Impact (3%)
FSL (40%) WASH (32%)
FSL & WASH (12%) Health, Protection, Shelter
(10%) Capacity gaps (6%)
Lower Juba WASH (79%)
FSL (10%) WASH (79%)
FSL & WASH (19%) WASH (76%)
FSL (17%)

153
Somalia Joint Multi-Cluster Needs Assessment, November 2019
FSL & WASH (8%) Capacity gaps (3%)
FSL (1%) FSL & WASH (4%) Capacity gaps (4%)
Lower Shabelle
WASH (56%) FSL (23%)
Impact (18%) FSL & WASH (2%) Capacity gaps (1%)
WASH (52%) Impact (45%)
FSL (2%) Health, Protection, Shelter
(1%)
WASH (57%) FSL (23%)
Impact (16%) FSL & WASH (2%) Capacity gaps (2%)
Middle Shabelle WASH (40%)
FSL (38%) Capacity gaps (22%)
Capacity gaps (95%) Impact (5%)
WASH (40%) FSL (38%)
Capacity gaps (22%)
Mudug
Capacity gaps (52%) WASH (28%)
FSL (13%) FSL & WASH (8%)
Capacity gaps (85%) WASH (10%)
FSL (4%) FSL & WASH (2%)
WASH (38%) FSL (25%)
Capacity gaps (25%) FSL & WASH (12%)
Nugaal
WASH (40%) FSL (29%)
Capacity gaps (26%) Health, Protection, Shelter
(4%) FSL & WASH (1%)
WASH (70%) FSL (11%)
Capacity gaps (11%) FSL & WASH (7%)
Health, Protection, Shelter (2%)
WASH (37%) FSL (30%)
Capacity gaps (30%) Health, Protection, Shelter
(3%)
Sanaag
WASH (71%) FSL (22%)
Health, Protection, Shelter (4%)
FSL & WASH (2%) Capacity gaps (1%)
WASH (45%) FSL & WASH (30%)
FSL (22%) Capacity gaps (3%)
WASH (70%) FSL (23%)
Health, Protection, Shelter (5%)
FSL & WASH (1%) Capacity gaps (1%)
Sool
WASH (58%) FSL (26%)
Capacity gaps (15%) Health, Protection, Shelter
(1%)
Capacity gaps (57%) WASH (33%)
FSL (9%) Health, Protection, Shelter
(1%)
WASH (51%) FSL (38%)
Capacity gaps (11%)
Togdheer
FSL (68%) WASH (28%)
Capacity gaps (3%) Health, Protection, Shelter
(1%)
FSL (90%) WASH (9%)
Capacity gaps (1%)
FSL (57%) WASH (38%)
Capacity gaps (3%) Health, Protection, Shelter
(1%)
Woqooyi Galbeed
FSL (56%) WASH (33%)
Capacity gaps (11%)
FSL (77%) WASH (22%)
FSL & WASH (1%)
FSL (56%) WASH (33%)
Capacity gaps (11%)