joint economic optimization of heat exchanger design and
TRANSCRIPT
HAL Id: hal-00730289https://hal.archives-ouvertes.fr/hal-00730289
Submitted on 9 Sep 2012
HAL is a multi-disciplinary open accessarchive for the deposit and dissemination of sci-entific research documents, whether they are pub-lished or not. The documents may come fromteaching and research institutions in France orabroad, or from public or private research centers.
L’archive ouverte pluridisciplinaire HAL, estdestinée au dépôt et à la diffusion de documentsscientifiques de niveau recherche, publiés ou non,émanant des établissements d’enseignement et derecherche français ou étrangers, des laboratoirespublics ou privés.
Joint economic optimization of heat exchanger designand maintenance policy
Antonio C. Caputo, Pacifico M. Pelagagge, Paolo Salini
To cite this version:Antonio C. Caputo, Pacifico M. Pelagagge, Paolo Salini. Joint economic optimization of heat ex-changer design and maintenance policy. Applied Thermal Engineering, Elsevier, 2011, 31 (8-9),pp.1381. �10.1016/j.applthermaleng.2010.12.033�. �hal-00730289�

Accepted Manuscript
Title: Joint economic optimization of heat exchanger design and maintenance policy
Authors: Antonio C. Caputo, Pacifico M. Pelagagge, Paolo Salini
PII: S1359-4311(11)00002-0
DOI: 10.1016/j.applthermaleng.2010.12.033
Reference: ATE 3357
To appear in: Applied Thermal Engineering
Received Date: 11 January 2010
Revised Date: 3 November 2010
Accepted Date: 22 December 2010
Please cite this article as: A.C. Caputo, P.M. Pelagagge, P. Salini. Joint economic optimization ofheat exchanger design and maintenance policy, Applied Thermal Engineering (2011), doi: 10.1016/j.applthermaleng.2010.12.033
This is a PDF file of an unedited manuscript that has been accepted for publication. As a service toour customers we are providing this early version of the manuscript. The manuscript will undergocopyediting, typesetting, and review of the resulting proof before it is published in its final form. Pleasenote that during the production process errors may be discovered which could affect the content, and alllegal disclaimers that apply to the journal pertain.

JOINT ECONOMIC OPTIMIZATION OF HEAT EXCHANGER DESIGN AND
MAINTENANCE POLICY
Antonio C. Caputo – [email protected]
Department of Mechanical and Industrial Engineering,
University of Roma Tre, Italy.
Pacifico M. Pelagagge – [email protected]
Paolo Salini – [email protected]
Department of Mechanical, Energy and Management Engineering,
University of L’Aquila, Italy.
Abstract. In this paper a new approach to shell and tube heat exchanger optimization is
presented based on the minimization of the life-cycle cost. The method allows the joint
optimization of both the equipment design and the cleaning policy. Economic savings
resulting from the proposed design procedure are relevant especially when large sized
equipment is involved or when a large number of small sized units are installed. At first,
a thermal design procedure defines the heat transfer area as well as flow velocities and
the fouling rate, given the heat duty of the equipment. The capital investment, pressure
losses and the cleaning interval required to reach a maximum allowed fouling resis-
tance are thus calculated. An optimization algorithm is then utilized to determine the
optimal values of both geometric design parameters and maximum allowable fouling
resistance by pursuing the minimization of a total cost function. The objective function
includes capital investment, operational costs related to friction losses, and mainte-
nance costs deriving from the cleaning schedule. The research contribution comes from
integrating two optimization tasks which traditionally are carried out in separate ways.
1 University of Roma Tre, Department of Mechanical and Industrial Engineering, Via della Vasca Navale, 79 – 00146 Roma, Italy (phone: +39-06 57333546; e-mail: [email protected]).

In fact, during the design phase the heat exchanger architecture is usually optimized
neglecting maintenance expenses, while during the operational phase the heat ex-
changer architecture is already finalized and maintenance optimization approaches al-
low only to determine a minimum cost cleaning schedule based on the existing ex-
changer. In this work, instead, the problems of equipment sizing and cleaning schedule
determination are solved simultaneously so that the entire life cycle cost is minimized.
Optimization of the objective function is carried out resorting to a genetic algorithm. In
the paper the optimal design approach is described and an application example is pro-
vided to show the capability of the method.
Keywords: heat exchangers, fouling, genetic algorithm, cleaning, optimization.
NOMENCLATURE
aj Binary activation index [-]
Bc Baffle cut [%] CAUX Aquxiliary energy related cost of cleaning operation [€/cleaning] Cclean Unit cost of cleaning operation [€/cleaning] Cclean,tot Cleaning cost present value [€] CE Energy related expense for heat transfer reduction over time between cleaning [€/cleaning] Ces Operating cost [€/yr] Ces,tot Operating cost present value [€] Cfitt Fictious penalty cost [€] CI Capital investment [€] CM Miscellaneous maintenance related cost [€/cleaning] Ctot Total life cycle cost [€] Ds Internal shell diameter [mm] Dt Tubes external diameter [mm] Dti Tubes internal diameter [mm] f Inflation rate [%/year] Lbc Central baffle spacing [mm] Lbi, Lbo Extremal baffles spacing [mm] Ltp Tubes pitch [mm] LtpRatio Pitch ratio [%] Ltt Tubes length [mm] N Overall cleanings number [-] Nb Number of baffles [-] Nclean Number of annual cleaning operations [year-1] Nss Sealing strips number [-] Ntp Tube passes [-] Ntt Tubes number [-] Nyr Equipment life [years] Pj Binary violation index [-]

Prs Prandtl number (shell-side) [-]
Prt Prandtl number (tube-side) [-]
Rf Fouling resistance [m2 K/W]
Rf o Shell-side fouling resistance [m2 K/W]
Rf i Tube-side fouling resistance [m2 K/W] Rf all Allowed fouling resistance [m2 K/W] R*f Asymptotic fouling resistance [m2 K/W]
Res Reynolds number (shell-side) [-]
Ret Reynolds number (tube-side) [-] s Interest rate [%/year] S Actual heat exchange surface area [m2]
Sclean Basic heat exchange surface area [m2]
Sextra Additional heat exchange surface area [%]
Tis Shell-side inlet temperature [K]
Tos Shell-side outlet temperature [K]
Tit Tube-side inlet temperature [K]
Tot Tube-side outlet temperature [K]
Tclean Cleaning interval [h]
U Overall heat transfer coefficient (Uclean= clean exchanger, Udirt= fouled exchanger [W/m2 K]
vs Flow velocity (shell-side) [m/s]
vt Flow velocity (tube-side) [m/s] Greek Symbols αs Convective heat transfer coefficient (shell-side) [W/m2 K]
αt Convective heat transfer coefficient (tube-side) [W/m2 K]
β Reciprocal of the fouling time constant [day-1]
∆ps Pressure drop (shell-side) [kPa]
∆pt Pressure drop (tube-side) [kPa] θtp Tube layout angle [deg] λw Thermal conductivity of tube walls [W/m K] ϕd Fouling deposit growth rate [m2 K/W s] ϕr Fouling deposit removal rate [m2 K/W s]
1. INTRODUCTION
In recent times a renewed interest in the optimal design of heat exchangers has been
witnessed in the literature. This results from the availability of new optimization tech-
niques, such as genetic algorithms, able to handle a large number of design parameters
including both discrete and continuous variables. Considering the functional importance
and widespread utilization of heat exchangers in process plants, their minimum cost de-
sign is also an important goal. In particular, the minimization of energy related expenses
is critical in the optic of energy savings and resources conservation. However, given
that most of the life cycle cost of an exchanger is made up of operational costs, includ-

ing periodic cleaning to control fouling phenomena which deteriorate heat transfer, even
the optimization of maintenance schedules is a relevant problem. This applies either in
case of single large sized units and in case of multiple smaller sized units installed in a
process plant, where prospective economic savings can be relevant. For instance,
Kuppan [1] reports that the economic loss due to fouling in heat exchangers is about 1
G$/yr for American plants, whereas in Hewitt [2] an estimate of economic loss up to 1.4
G$/yr for U.S.A. and between 0.5 and 1 M$ for English plants is given. Passing to more
specific examples, Polley et al. [3] report the case of a 10 MW exchanger processing
100.000 bbl of crude oil per day located at the hot end of a preheat train, which could
cumulate a loss of $100.000 after 2000 h (three months) of operation, while Putman [4]
reports that about $265.000 annual losses can result from a 450 MW steam condenser
without cleaning.
Nevertheless, in the literature two basically different approaches have been pursued
as far as heat exchanger optimization is concerned. The first approach is aimed at the
optimal sizing of the heat exchanger usually based on a cost minimization goal, consid-
ering capital investment and energy related expenses, or on the maximization of some
thermal performance. In this approach the impact of periodical cleaning of the ex-
changer is neglected and fouling phenomena are considered only by including a prede-
fined allowance for a fouling resistance in the thermal design procedure. The second
approach, instead, assumes that the heat exchanger has been already built and that a
maintenance schedule has to be optimized in order to minimize maintenance and energy
related costs while satisfying the required heat duty.
Recent examples of design optimization methods are the works of Khalifeh Soltan et
al. [5], Unuvar and Kargici [6], Selbas et al. [7], Sena-Gonzalez et al. [8], Ponce-Ortega

et al. [9], Costa and Queiroz [10], and the optimization techniques utilized nowadays in
heat exchangers optimization are frequently of genetic nature [7, 11, 12, 13]. Although
some scholars are skeptical about the use of precise optimization methods when applied
to heat exchanger design, owing to the inherent fuzziness of the problem given the
uncertainty in operating conditions and in the adopted design correlations [14],
computer based optimization of heat exchanger design is an established and widely
accepted research subject. When evaluating a cost based objective function, the
investment cost has been usually estimated resorting to literature correlations [15], even
if the inconsistency of utilizing simplified parametric cost functions in detailed design
optimization procedures has been demonstrated by Caputo et al. [16,17], whereas the
operating cost is always considered as an energy related cost, imputable to overcoming
friction losses in the fluid flow.
Examples of maintenance schedule optimization approaches are provided, instead, by
Putman [18], Khan and Zubair [19], O’Donnell et al. [20], Sheikh et al. [21], Zubair et
al. [22], Zubair and Shah [23]. However, in this field a large contribution has been made
to maintenance of heat exchanger networks [24-33]. Some scholars also attempted to
include maintenance concerns in a design optimization procedure. For instance, Wildi-
Tremblay and Gosselin [34] included a minimum surface area constraint to account for
fouling within a genetic optimization procedure. A different approach was chosen,
instead, by Butterworth [35] who adopted the “design envelope” sizing method utilizing
a fouling resistance which is dependent on velocity and temperature within the heat
exchanger in order to find an arrangement which allows the exchanger to operate below
the fouling threshold. Similarly, Polley et al. [3] and Wilson et al. [36] modified the
Poddard plot design method to identify a fouling threshold and design the exchanger to
operate below that threshold so that fouling can be virtually eliminated. This could be
made by changing the thermal contacting arrangement, by increasing the tube-side ve-
locity (within a prescribed maximum pressure drop threshold), and by decreasing the
shell side heat transfer coefficient [36]. However, to operate below the fouling threshold
often results in higher fluid velocities. Therefore, while the described approach allows
to avoid any fouling related expenses (i.e. heat exchanger cleaning and additional fluid
consumption in auxiliary heaters) the fact that pressure drop related energy expenses are
not explicitly factored in does not guarantee that a design minimizing the life cycle cost
is obtained. Finally, Fryer et al. [37] discuss fouling impact on heat exchanger design in
the case of milk fouling, while Branch et al. [38] consider the case of crystallization
fouling.
In order to overcome the drawbacks of the current two-step approach (optimal design
neglecting maintenance and subsequent optimization of the cleaning schedule for an
existing exchanger), in this work a method for joint optimization of both the equipment
design and the cleaning policy is described. A genetic algorithm is utilized to determine
the optimal values of both geometric design parameters (i.e. shell diameter, tubes
diameter, pitch pattern etc.) and the maximum allowable fouling resistance so that the
minimization of a total cost function including capital investment, operational costs
related to friction losses, and fouling related costs deriving from the cleaning schedule is
obtained. In this manner a more precise approach respect that of previous literature
works [34] is obtained in that an overall cost minimization is pursued without imposing
any predetermined constraint on the exchanger surface area, while pumping energy
expenses and maintenance costs are explicitly included so that a minimization of life
cycle cost can be pursued as an alternative to looking for fouling free operation [3,35].
Furthermore, the proposed approach enables to overcome some of the limitations of
traditional optimization methods which, when neglecting fouling impact risk to
undersize the heat exchanger. This helps to remove some of the concerns expressed by
scholars about the use of computer based optimization for heat exchangers design [14],
provided that reliable fouling growth data are available from experiments.
This joint optimization approach appears to be effective especially when fouling related
costs are of the same order of magnitude respect the capital investment and the energy
expense for fluid pumping. In this case an optimal balance among the three competing
cost items is to be sought. In fact, when maintenance costs are negligible the life cycle
cost minimization reduces to a design balancing capital investment and pressure losses
and there is no need to concern about maintenance schedule. On the contrary, when
fouling costs are dominant respect capital investment and pumping costs, then the
equipment architecture does not affect the life cycle cost, which can be minimized by
optimizing the cleaning schedule only or by pursuing a fouling free heat exchanger
operating above the fouling threshold so that no cleaning is needed.
Therefore, we aim at cases where heat exchanger cost and maintenance cost are both
high, i.e. in cases of single large sized units, or when they are both low, as happens
when many small sized units are installed in the same process plant. In such cases a
joint optimization approach minimizing the life cycle cost can determine significant
economic savings.
The paper is organized as follows. At first a brief discussion of heat transfer surfaces
fouling is carried out with reference to its impact on the exchanger performances and
the cleaning process. Then the proposed optimization method is described. Finally, an
application example is provided to show the capability of the method. The method has
been developed with specific reference to shell and tube heat exchangers owing to their
widespread diffusion.
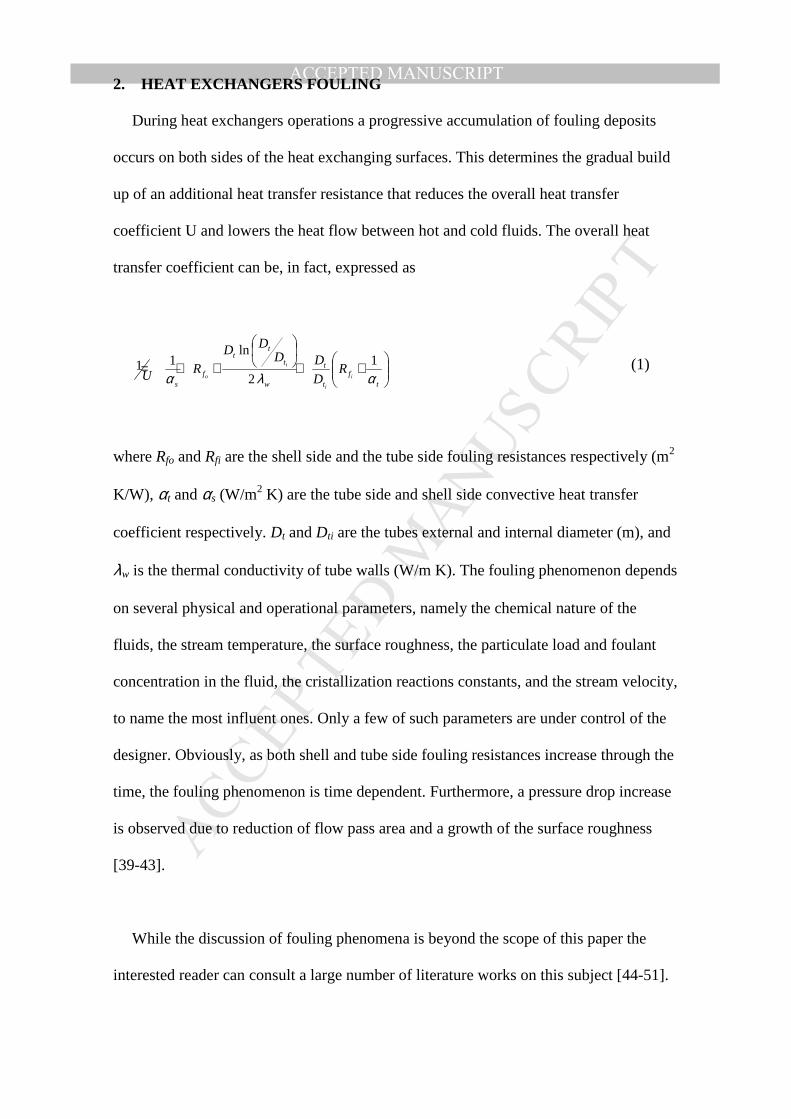
2. HEAT EXCHANGERS FOULING
During heat exchangers operations a progressive accumulation of fouling deposits
occurs on both sides of the heat exchanging surfaces. This determines the gradual build
up of an additional heat transfer resistance that reduces the overall heat transfer
coefficient U and lowers the heat flow between hot and cold fluids. The overall heat
transfer coefficient can be, in fact, expressed as
++
++=t
ft
t
w
t
tt
fs
i
i
i
oR
D
DDDD
RU αλα1
2
ln11 (1)
where Rfo and Rfi are the shell side and the tube side fouling resistances respectively (m2
K/W), αt and αs (W/m2 K) are the tube side and shell side convective heat transfer
coefficient respectively. Dt and Dti are the tubes external and internal diameter (m), and
λw is the thermal conductivity of tube walls (W/m K). The fouling phenomenon depends
on several physical and operational parameters, namely the chemical nature of the
fluids, the stream temperature, the surface roughness, the particulate load and foulant
concentration in the fluid, the cristallization reactions constants, and the stream velocity,
to name the most influent ones. Only a few of such parameters are under control of the
designer. Obviously, as both shell and tube side fouling resistances increase through the
time, the fouling phenomenon is time dependent. Furthermore, a pressure drop increase
is observed due to reduction of flow pass area and a growth of the surface roughness
[39-43].
While the discussion of fouling phenomena is beyond the scope of this paper the
interested reader can consult a large number of literature works on this subject [44-51].

Whichever the fouling process, the growth of the fouling film through time can be
expressed by
rdf
dt
dRϕϕ −= (2)
where φd is the fouling deposit growth rate and φr is the rate of deposit removal by the
flow. The overall fouling layer growth law is very difficult to predict especially when it
is time dependent. Generally, when deposits are brittle and the removal rate is
proportional to the fouling layer thickness, the fouling film growth law is linear with
time. In other cases the deposit rate decreases with time and the growth law is
asymptotic.
An example of the progressive decay of the overall heat transfer coefficient (U) from
its initial value Uclean is shown in Figure 1 according to different fouling mechanisms.
According to Ludwig [52], in case of asymptotic fouling, the fouling resistance can
be obtained integrating equation (2) thus obtaining the following law of fouling
resistance growth (also known as Kern and Seaton correlation)
)1(* tff eRR β−−= (3)
where R*f is an asymptotic fouling resistance value which is related to the fluid velocity
v, the tube diameter Dt and to the kind of foulant, while β is the reciprocal of the fouling
phenomenon time constant. Sample empirical correlations used for R*f estimation for
typical fluids are the following as given by Hewitt [2],

23.033.1* 101.0
tf Dv
R = Calcium carbonate on surface at constant temperature (4)
2* 55.0
vR f = Oil deposit at constant heat flux (5)
2.1* 015.0
vR f = Sand deposit from water at constant heat flux (6)
In equation (3) parameter β, which is representative of the instantaneous fouling rate,
is usually experimentally determined. In fact, it depends fom all the factors influencing
the fouling process and is hard to estimate analytically. However, a major influencing
parameter is the flow velocity. For instance, fouling rate is seen to vary as velocity to a
power ranging from – 0.35 to –0.66 [53, 54], while other scholars report more complex
relationships [55].
In this work, for sake of generality, we assume that the dependence of β from flow
velocity is represented by the following parametric equation,
k
ov
v
= 0ββ (7)
where β0 is a known value at the arbitrary reference flow velocity v0, while β is the
actual value at the flow velocity v.
This simplified formulation is highly flexible as many different β trends
corresponding to various fouling models can be easily accomodated by changing the
value of exponent k. In fact, when k = 0 β is constant, while when k=±1 β changes
linearly with flow velocity, and when k >1 or <1one has more or less than linear
variations with velocity, where the sign of k defines the increasing or decreasing trend.

Moreover, in a suitably narrow interval around v0 it is practically exact. Finally, given
that the fouling rate depends on the flow regime (laminar or turbulent) one can choose
different couples of β0 and k values according to whether one is above or below a
predetermined threshold velocity value v0.
At the beginning of heat exchanger’s operating life the heat transfer surfaces are
clean and the overall heat transfer coefficient Uclean is thus the sum of convective
coefficients, tube and shell-side, and the reciprocal of the thermal resistance of tube
wall. Then the fouling resistances are gradually added and progressively increase as the
fouling layer build up, until the accumulated fouling film eventually determines an
excessive heat transfer resistance and a cleaning operation is required to bring back the
equipment to its original condition. Figure 2 shows the trend of gradual decay of U and
its periodical restoration for two different values of the allowable fouling resistance. By
setting a threshold level for the maximum tolerated fouling resistance (i.e. the allowable
fouling resistance Rf all) , and knowing the trend of fouling resistance growth over time,
it is thus possible to determine the timing of the cleaning operations. Under the
asymptotic fouling hypothesis this corresponds to knowing the values of β and R*f and
triggering the cleaning when Rf computed by equation (3) becomes equal to Rf all.
However, the choice of Rf all value implies a trade off decision. In fact, referring to
Figure 2 it can be observed that if the allowable fouling resistance is set to a small
value, frequent maintenance stops are needed for cleaning. In this case, since the
minimum value of U is not much lower than Uclean, only a small oversizing of the
exchanger results, thus limiting the extra surface and the additional investment cost. On
the contrary, if the value of maximum fouling resistance is high, the maintenance stops
would be less frequent reducing the cleaning cost, but a higher extra surface area will be
needed to allow for the lower minimum value of U. In practice, given the heat duty
specification, the heat transfer area is determined by assuming a value for the minimum
allowable heat transfer coefficient in dirty operating conditions Udirt. The lower the Udirt
value is specified, the higher the oversizing of the heat exchanger results, but the lower
the cleaning expenses. Conversely, if a high value of Udirt is assumed, a small oversizing
results but more frequent cleaning operations will be required, thus asking for a trade
off analysis. However, this trade off holds under the assumption that oversizing the heat
exchanger means simply an extension of the heat transfer area without increasing the
fluid flow cross section (i.e. by increasing, for instance, the tube length while maintain-
ing the same bundle geometry and shell diameter). When, conversely, the oversizing of
a heat exchanger brings lower fluid velocities owing to larger cross sections, this would
accelerate fouling problems [56]. Then a larger oversizing of a heat exchanger is not
necessarily associated to lower cleaning costs and the increased rate of fouling associ-
ated with lower flow velocities reduces the benefit afforded by the extra area.
To ensure the effectiveness of the equipment for an acceptable working period,
designers must therefore necessarily overdesign the heat transfer surface, increasing the
investment cost. This also asks for throttling the mass flow during the initial period of
operating life when exchange surfaces are still clean and the transfer coefficient is high.
Generally, an oversizing from 25% up to 50% respect the total surface area required in
clean conditions is commonplace [57, 58]. Often, probabilistic design methods are also
employed to account for hardly predictable fouling effects [59-61].
However, an attempt to limit fouling by acting on the flow velocity can also be
pursued. In fact, as already pointed out, the deposition rate is influenced by the stream
velocity, and an increase of stream velocity can be beneficial from this point of view as
the higher the fluids velocity, the lower the tendency to foul, even if an increase of
pressure losses occurs. This also determines a trade off situation.

The restoration of initial heat transfer conditions is made resorting to chemical or
mechanical cleaning operations [62-65]. This often requires to put the equipment off
line and determines additional costs related to unavailability and operational problems.
Usually, mechanical cleaning is less expensive than the chemical one, but when a
strong mechanical action is required to remove deposits, even the mechanical cleaning
methods needs the exchanger to be put off-line. Generally, a 30°tube layout is more
efficient from a thermal point of view but it doesn’t allow a mechanical cleaning. On the
contrary, 45° or 90° tube layouts, with or without clean lines, are suitable to mechanical
cleaning but they are thermally less efficient. Moreover, the feasible kind of cleaning is
related to the ratio of shell internal diameter to tubes outside diameter. Table 1 (from
[2]) shows allowed shell-tube diameter combinations for mechanical cleaning.
Overall, setting a design value for Udirt determines a trade off between capital
investment and cleaning costs, while setting a flow velocity impacts the trade off
between capital investment, maintenance schedule and pumping costs. Moreover, the
exchanger constructive arrangement determines the allowed cleaning method, thus
further affecting the maintenance costs. Therefore, exchanger design and maintenance
scheduling problems are strictly interrelated.
3. PROPOSED APPROACH
The proposed procedure for optimal heat exchanger design includes the following
steps.
• Estimation of the exchanger heat transfer area based on the required duty and other
design specification assuming a set of values for design variables including a maximum
allowable fouling resistance Rf all;

• evaluation of the capital investment, operating costs, and the objective function;
• utilization of the optimisation algorithm to select a new set of values for the design
parameters;
• iteration of the previous steps until a minimum of the objective function is found.
The entire process is schematised in Figure 3. At present the procedure excludes heat
transfer with phase change.
Design specification indicate the heat duty of the exchanger, and are set by imposing
five of the following six parameters: the mass flow rates of the two fluids, as well as the
inlet and outlet temperatures of the fluids shell-side Tis, Tos, and tube-side, Tit, Tot. The
remaining parameter being determined by an energy balance.
A set of thermo physical properties, process data and fixed characteristics of the
equipment (i.e. heat exchanger TEMA type) are assigned by the designer. Starting from
the input data, a random starting value is given to a set of independent design variables
(VIP). The VIP number and meaning depends on the equations used to size the
equipment. In this work the Bell-Delaware method [2, 66] has been used and the
selected VIP are the inside shell diameter Ds (m), the tube outside diameter Dt (m), the
central baffle spacing Lbc (m), the extremal baffle spacings Lbi and Lbo, the pitch ratio
LptRatio, the baffle cut Bc, the sealing strips number Nss, the tube layout angle θtp and the
tube pass number Ntp. A further independent variable is the maximum allowable fouling
resistance Rf all. The other heat exchanger’s characteristics (i.e. the dependent design
variables, VDP) are then directly computed from the VIP. Using empirical rules of
thumbs it is possible to determine the tubes number Ntt, whereas using Bell-Delaware’s
design equations it is possible to evaluate all the others geometrical and fluid dynamical
equipment characteristic. Once the VDP are computed from the VIP the overall heat
transfer coefficient (U) is estimated. This allows to determine the total heat exchanger’s
tubes length Ltt (m), the surface area (S) and the baffles number Nb (as an integer
multiple of Lbc at least equal to the calculated Ltt).
The computed values of flow velocities and the constructive details of the exchanger
structure are then used, resorting to Eqs. 3-7, to predict the time interval (Tclean) when
the limit fouling resistance Rf all is reached and cleaning is to be performed. Then, com-
putation of the objective function follows.
Here we assume that the objective function to be minimized is the total life cycle cost
(Ctot) which is a sum of the capital investment, and the present worth of the pumping
costs for overcoming friction losses and fouling related costs occurring over the equip-
ment life.
Fouling related costs may include the following items [19, 33, 67].
a) Cleaning cost, i.e. the unit cost of each cleaning operation Cclean (€). Cleaning of heat
exchangers involves labour costs and capital expenditures for special equipment (tools, cranes
etc.) [19].
b) Additional energy consumption in auxiliary heaters or coolers during exchanger
cleaning if the exchanger is bypassed and the process unit is not shut down (CAUX). This
cost is dependent on the cleaning downtime and can be included in the value of the
cleaning operation cost.
c) Additional energy consumption in auxiliary heaters or coolers to compensate for pro-
gressive effectiveness drop in the exchanger, including any additional utilities consump-
tion such as increased atomization steam in fuel oil injectors owing to increased fuel
consumption, CE (€/yr). Opportunity cost of lost production owing to reduction in
throughput caused by fouling can be included in this item as is the extra maintenance
costs of process equipment caused by fouling-related effects, such as replacement of
furnace tubes due to prolonged operation at high temperatures. This cost can be com-
puted over the interval between cleanings by integrating its instantaneous time-varying
value CE(t).

Miscellaneous costs (CM) such as managing the cleaning program, shutdown and startup
of the process unit, opportunity cost of lost production during plant shutdown in the
cleaning downtime, maintenance of cleaning equipment. This cost item can be included
as well in the value of the cleaning operation cost.
All of the above cost items are strictly application-dependent and influenced by the
economic scenario, so that a single reference value of general applicability can not be
defined. Cclean is dependent on the allowable kind of cleaning (mechanical or chemical).
In case of mechanical cleaning Cclean is the daily cleaning cost times the duration of the
cleaning operation. The latter is usually a function of fouling deposit type and thickness
and, therefore, depends on the time between cleanings as well as from the utilized
cleaning equipment and workforce. Modern mechanical cleaning equipment allows a
rapid cleaning as extensively described by Putman [68], Saxon and Putnam [65], How-
ell e Saxon [69]. Hydraulic cleaning resorting to high pressure lances is a proven tech-
nology. A tube cleaning velocity from 0.1 to 1.5 m/s can be achieved with high pressure
cleaning lances, and equipment allowing simultaneous cleaning of multiple tubes are
available. Manufacturers reports cleaning speeds in the range of 80 to 750 tubes per
hour. In that case a 4 m long tube could be cleaned in 4 s and a bundle made of 1000
tubes could be cleaned in a three to four hours considering the dead time to reposition
the cleaning equipment. Saxon and Putman [65] report that a normal crew can clean
5000 tubes during a 12-hour shift, and that cleaning speed for a 20-ft long severely
fouled or blocked tube is 30 to 90 s. Even self propelled bundle extractors and lifters to
drive the extracted bundle to the cleaning bay are available to be operated by a single
technician, and have capacities even in excess of 30 t.
In case of chemical cleaning Cclean includes the antifoulant cost and is often expressed as
a function of the antifoulant consumption rate when on line cleaning is carried out.
Chemical cleaning is often considered more costly than mechanical cleaning because

additional circuitry involving pumps and tanks may be necessary, chemicals have to be
purchased, and the cleaning process may produce an effluent that will require treatment
before disposal [19]. However, chemical cleaning is compatible with nearly all ex-
changers internal configurations.
Casado [67] indicates a specific cleaning cost of 677 $/day and a cleaning downtime of
6 days. Smalili et al. [33] consider a value of 4000 £/cleaning which is consistent with
Casado data, while Markowski and Urbaniec [29] assume about 2500 $/cleaning. How-
ever, all of the cited cases apply to large sized multiMW exchangers. Furthermore,
Casado [67] reports, in 1980 dollars, a specific antifoulant cost of 7.3 $/(1000 lb) (1000
ft2) to be used at a typical concentration of 5 ppm.
From the above discussion a general expression of the total cost function can be
expressed as
( )∑∑
∫∑
===
++
+++
++++=
v
jfittjj
Nyr
ii
T
iEiMiAUXicleancleanNyr
ii
ies
Itot CPs
dttCCCCN
s
fCCC
clean
11
0 ,,,,
1 )1(
)(
)1(
)1( α (8)
where CI is the capital investment (€), Ces is the annual operating cost due to pumping
power caused by fluid friction losses (€/yr), f is the energy cost inflation rate (%/yr), s
is the interest rate (%/yr), Nyr is the equipment life (yr), Nclean = 1/ Tclean is the annual
cleanings number (1/yr), The last term is an optional penalty function term which
penalizes the cost of solutions violating one or more operating constraint imposed by
user; aj is a binary activation index for the j-th constraint (imposed by user: 0 if the
constraint is omitted, 1 if it is considered), Pj is a binary violation index (0 if constraint
is not violated, 1 otherwise), and Cfitt is a fictitious cost set at a very high value that lead
to the rejection of solutions not satisfying one or more constraint. The total cost function
is thus completely determined by specifying the constructive details of the heat ex-
changer, the allowable fouling resistance and the economic scenario parameters.

The genetic optimisation algorithm (GA), based on the value of the objective func-
tion, updates the trial values of the optimisation variables (VIP) which are then passed
to the design routine to define a new architecture of the heat exchanger. The process is
iterated until a minimum of the objective function is found or a prescribed convergence
criterion is met, as shown in the flow diagram of Figure 3.
The GA is allowed to freely select the decision variables values within the set of
values recommended by Hewitt [2] as a good pratice for heat exchangers construction.
While mechanical cleaning is not allowed below Dt = 14 mm, as already pointed out, it
should be also noted that some combinations of the proposed decision variables may be
an obstacle to cleaning (e.g. triangular layout of the bundle in case of mechanical clean-
ing). In this case the user can impose further constraint to the GA in order to avoid any
undesired configuration.
Further details of the adopted genetic algorithm for the optimization process are
given elsewhere [13].
It should be pointed out that the approach proposed in this work is centered on the
trial assignment by the optimization algorithm of the allowable fouling resistance as an
independent design variable, and on the computation of the cleaning frequency as
dictated by the specified fouling resistance and the geometrical characteristic of the
exchanger’s through the resulting fluids velocities, as shown by equations 3 to 7.
Knowing the fouling mechanism it is, in fact, possible to determine the time dependence
of fouling resistance as influenced by the constructive features of the equipment. Once
the fouling resistance growth law for the actual heat exchanger and fluids is known, to
set a threshold value for the fouling resistance is equal to set a service interval. In case a
change in the equipment architecture during the optimization process determines a
change in the fluid flow velocity, then its impact on the fouling rate is accounted for by

Equation (7) which allows, through Equation (3), to update the estimate of the cleaning
interval.
The proposed approach thus suggests to entrust the genetic algorithm with the
autonomous choice of the optimal allowable fouling resistance, once the asymptotic
decrease law of the overall heat transfer coefficient is known (Figure 1). In this manner
the value to be assigned to this critical parameter is managed within the entire
optimization procedure instead of being left to a trial and error approach or to the
designer’s arbitrary choice. The selected allowable fouling resistance determines, in
fact, the extra heat transfer surface requirements and the cleaning frequency, thus setting
the trade-off between capital investment and operating expenses. The resulting time
schedule of maintenance cleaning is also the optimal schedule for minimum life cycle
cost of the exchanger being designed. The reliability of the adopted fouling growth rate
law is, therefore, critical, to the success of the method.
As a concluding remark it should be pointed out that the proposed joint optimization
method is suitable especially in cases when fouling related costs are of the same order
of magnitude respect the capital investment and the energy expense for fluid pumping.
When maintenance costs are negligible the GA focuses on determining a heat exchanger
architecture which minimizes the sum of capital investment and present worth of life
cycle pumping energy consumption, irrespective of the cleaning schedule. When, on the
contrary, fouling costs are dominant respect capital investment and pumping costs, then
the GA merely tries to optimize the cleaning schedule without positively affecting the
exchanger design, or even selects design parameters so that cleaning is never performed,
i.e by selecting fluid velocities above the fouling threshold or by assuming the
asymptotic fouling resistance as a design parameter. In such cases the use of the
proposed design methodology is not appropriate.
4. CASE STUDY
In order to test the effectiveness of the proposed approach a case study is presented
here. The case study is based on the process specifications and streams data taken from
a textbook heat exchanger sizing example from Kern [70]. The considered equipment
exchanges heat between distilled water and raw water streams. The process data are
shown in Tables 2 and 3. In Kern’s original formulation a minimal tube-side velocity
higher than 1.8 m/s was imposed to prevent fouling. Here this constraint has been
removed as the actual fouling resistance determined by fluid nature and velocity is
considered. Moreover, no attempt will be made to compare the results of this model
equipment sizing with the sizing approach of Kern in that in the original example no
data were provided to determine the kind of fouling phenomenon which was considered.
The design optimization procedure was implemented on a personal computer
resorting to the Genetic Algorithm toolbox of the scientific computing environment
MATLAB. The heat exchanger was sized using the Bell-Delaware method and
investment cost updated to 2007 values, was estimated adopting, for simplicity, the Hall
approach [15] instead of a more accurate one [17]. Total cost was evaluated over a
working period of five years (40000 h).
The mechanical and chemical cleaning cost was assumed as 250 €/cleaning and 500
€/cleaning respectively, the exchanger operated 8000 h/yr, the fuel cost inflation rate
was neglected and the discount rate was set at s = 10%/yr. Electric energy cost was CkWh
= 0.12 €/kWh, and the pump efficiency was set as 0.75. The value of the cleaning cost
has been assumed considering the small size of the examined exchanger, wich has a
duty of about 410 kW and a bundle composed of a few hundredts tubes. According to
the preceding discussion on cleaning costs, it is likely that it could be cleaned in about
half a work day by a team of no more that two operators justifying the above assump-

tion. However, a sensitivity analysis on cleaning cost has also been carried out as shown
in the following. We also assumed that given the small size, and corresponding small
capital investment of the equipment, a stand-by unit was available to bypass the flow
without shutting down the process equipment, thus avoiding any cost related to process
interruption (CAUX = 0). Moreover, as we focus on cleaning operation only, the values
of CM and CE were set to zero.
To compute the β values the following assumptions were made; shell side β0 = 0.001
day-1, v0 = 0.5 m/s, k = -0.66; tube side β0 = 0.0008 day-1, v0 = 1 m/s, k = -0.66. This
gave the β vs flow velocity trends shown in Figure 4.
Moreover, the following additional constraints were imposed to shell and tube side
velocities vs and vt, as well as to the shell length-to-diameter ratio and the extra surface,
to ensure that the genetic algorithm converged to a technically feasible geometrical
configuration of the equipment, namely
0.5 < vt < 4 m/s
0.2 < vs < 1.5 m/s
3 < L/Ds < 15
The main characteristics of the resulting heat exchanger design as obtained from the
optimization procedure proposed in this work are shown in Table 4 (column labeled
“Joint Optimization”). For sake of comparison, in Table 4, TGA1, TGA2, TGA3
columns represent, instead, exchangers resulting from a traditional design optimization
procedure carried out by a genetic algorithm similar to that discussed by Caputo et al.
[13]. In those cases the heat exchanger architecture has been thus optimized neglecting
the maintenance cost, with the aim of minimizing an objective function represented
merely by the capital investment and the present value of the life cycle pumping energy
cost. An allowable fouling resistance of respectively 0.91x10⁻⁴, 1.81x10⁻⁴, 3.62x10⁻⁴
[m2 K/W] was arbitrarily chosen by the designer as would happen in practice to
properly oversize the equipment. The resulting maintenance schedule determined the
additional maintenance cost which was added to the former costs to estimate the overall
cost. In the “Joint Optimization” column, instead, the genetic algorithm minimized an
overall cost function sum of capital investment and present value of life cycle pumping
energy cost and maintenance costs as proposed in this work. In this case the algorithm
autonomously determined an “optimal” allowable fouling resistance value of 1.61x10⁻⁴
[m2 K/W]. Finally, for sake of further comparison, an additional column labeled
“Hybrid TGA” has been included in Table 4. This column represent a design obtained
through the traditional genetic algorithm optimization approach (i.e. neglecting the
maintenance cost in the objective function) but assuming as the designer-imposed
allowable fouling resistance the same optimal value of 1.61x10⁻⁴ [m2 K/W] obtained
through the joint optimization procedure.
Once the sizing algorithm in the optimization procedures has finalized the
constructive details of the exchanger, the tubes diameter and flow velocity are
determined and the asymptotic fouling resistance can be calculated thus allowing to
determine the fouling growth curve and the time interval required to reach the imposed
(TGA1, TGA2, TGA3, Hybrid TGA) or the self-determined (Joint Optimization)
allowable fouling resistance. This allows to compute the number of cleaning operations,
maintenance cost and the overall cost of the heat exchangers as shown in the Table.
A minimum cost value of about 19936 € has been obtained by the proposed “joint
optimization” approach. It interesting to note that when comparing the heat exchanger
design obtained by the “joint optimization” with that of the “hybrid” approach (i.e.
having the same “optimal” allowable fouling resistance value) a different design results
confirming the effectiveness of the “joint optimization” approach. In particular, when
maintenance costs are neglected, the “hybrid” approach gives a lower total cost
exchanger respect the “joint optimization” one (17900 € vs 18988 €), but when the

maintenance cost is factored in the situation is reversed (28135 € vs 19936€) and the
“joint approach” shows to be superior.
It is worth noting that even if all of the other exchangers (TGA1, TGA2, TGA3,
Hybrid TGA) have been obtained by minimizing a total cost function including capital
investment and energy cost, the fact that the allowable fouling resistance value was
arbitrarily set by the designer, as happens in practice, determined higher overall costs
than the ones incurred when even the allowable fouling resistance is treated as an
independent variable to be optimized. Overall, respect the best performing solution, all
other “optimized” solutions deteminad a cost increase of 11% to 30% which is
significant. This confirms that the arbitrary selection of a design value for the allowable
fouling resistance may significantly impact the life cycle cost of an exchanger leading to
poor economic performances, and that a computer based “joint optimization” approach
can be a viable design alternative.
Table 4 also shows the resulting heat exchange area (S) in comparison with the
theoretical heat transfer area (Sclean) required to satisfy the duty specifications had the
fouling phenomenon been negligible. A fouling-related percent increase of the heat
transfer area (Sextra) thus follows. It can be observed that the optimal design value of the
maximum fouling resistance implied an extra surface of 27% respect the value
obtainable neglecting fouling phenomena, consistent with extra surface values
suggested in the literature (ranging up to about 35%).
In case of the optimal “joint optimization” exchanger a total of 5 cleaning operations are
performed during the life cycle of 40000 h and the optimal maintenance interval is
about 6956 hours, i.e about once per year. The resulting trend of the overall heat transfer
coefficients and the corresponding maintenance schedules are shown in Figures 5, 6, 7

for the “Joint Optimization” exchanger as well as the TGA2, and the “hybrid TGA”
designs for sake of comparison.
Table 5 shows the influence of fouling rate obtained by changing the value of
parameter k in Equation (7). Finally, Table 6 shows the results of a sensistivity analysis
on the cleaning cost. It can be oserved that when maintenance cost increase the GA can
change the heat exchanger architecture so that maintenance is never carried out (i.e the
allowed fouling resistance is set at the asymptotic value).
5. CONCLUSIONS
In the paper a new design approach has been developed for finding the optimal shell and
tube heat exchanger configuration including the optimization of its cleaning schedule.
The optimization is based on the minimization of a total cost function including capital
investment and operational expenses connected to fluid moving and the equipment
periodical cleaning or any other fouling related expenditure. This model is based on
considering the maximum fouling resistance as one of the design parameters to be
optimized, provided that a reliable fouling growth rate estimation correlation is
available. This automatically solves the trade off implied by the choice of surface area,
cleaning schedule and flow velocities. The model is also able to evaluate the kind of
cleaning methods allowable for the designed heat exchanger. The proposed model is a
useful addition to the existing design optimization methods which neglect fouling
phenomena and periodical cleaning issues, and is more effective that traditional
cleaning schedule optimization methods which are applied to an exchanger of
predefined configuration. In this method, in fact, the problem of finding a geometric
configuration and cleaning schedule of the equipment is solved simultaneously

considering the impact that the equipment architecture has on the fouling process and
the resulting cleaning requirements. The model is expected to be effective especially
when fouling related costs are of the same order of magnitude respect the capital
investment and pumping energy expenditure. In fact, in this case the sizing problem and
the maintenance scheduling problem become interconnected from a cost optimization
perspective. This is likely to occur in case of large size and high cost exchangers or in
case of many smaller size units installed in the same plant, where small unit savings
make great overall savings. Overall, when cleaning costs become dominant the
contribution of design related costs becomes irrelevant. When, instead, equipment cost
are dominant then maintenance scheduling becomes irrelevant. In both cases the two
problems can be solved separately. Furthermore, when low cost exchangers are utilized
a stand by unit can be easily afforded making the optimization of the cleaning schedule
less relevant. In all other cases the design and maintenance problems are strictly
interdependent and a joint optimization approach is a valuable alternative.
As a future research it is planned to account for the effects of fouling on fluid flow
pressure drop and to include several different fouling growth laws to make the model of
general applicability. Furthermore, the fouling rate will be made dependent on the local
temperature within the heat exchanger. This will require to couple the exchanger sizing
module with a detailed thermal performance estimation model.
REFERENCES
[1] T.Kuppan, Heat exchanger design handbook, CRC Press, 2000.
[2] G.F.Hewitt (Ed.), Heat exchanger design handbook, Begell House, 1998.
[3] G.T. Polley, D.I. Wilson, B.L. Yeap, S.J. Pugh, Use of crude oil fouling threshold
data in heat exchanger design, Applied Thermal Engineering, 22 (2002) 763-776.
[4] R.E. Putman, The economics of regular condenser maintenance, Corporate publica-
tion, Conco Consulting Corp. Verona, PA, USA. Available at the URL
http://www.concosystems.com/Files/Articles/Return%20on%20Investment%20Anal
ysis%20The%20Economics%20of%20Regular%20Condenser%20Maintenance.pdf
(accessed October 2010).
[5] B. Khalifeh Soltan, M. Saffar-Avval, E. Damargin, Minimizing capital and
operating costs of shell and tube condensers using optimum baffle spacing, Applied
Thermal Engineering 24 (2004) 2801-2810.
[6] A. Unuvar, S.Kargici, An approach for the optimum design of heat exchangers,
International Journal of Energy Research (2004) 1379-1392.
[7] R. Selbas, O. Kizilkan, M. Reppich, A new design approach for shell and tube heat
exchangers using genetic algorithms from economic point of view, Chemical
Engineering and Processing 45 (2006) 268-275.
[8] M. Sena-Gonzalez, , J.M. Ponce-Ortega, A.J.Castro-Montoya, A.Jimenez-Gutierrez,
Feasible design space for shell and tube heat exchangers using Bell-Delaware
method, Industrial Engineering Chemical Research 46 (2007) 143-155.
[9] J.M. Ponce-Ortega, M. Sena-Gonzalez, A. Jimenez-Gutierrez, Use of genetic
algorithm for the optimal design of shell-and-tube heat exchangers, Applied Thermal
Engineering 29 (2009) 203-209.
[10] A.L.H. Costa, E.M. Queiroz, Design optimization of shell and tube heat
exchangers, Applied Thermal Engineering, 28 (2008) 1798-1805.
[11] M.C. Tayal, Y. Fu, U.M. Diwekar, Optimal design of heat exchangers: A genetic
algorithm framework, Industrial Engineering Chemical Research 38 (1999) 456-467.
[12] B.V. Babu, S.A. Munawar, Differential evolution strategies for optimum design of
shell and tube heat exchangers, Chemical Engineering Science 62 (2007) 3720-3739.
[13] A.C. Caputo, M.P.Pelagagge, P.Salini, Heat exchangers design based on economic
optimization, Applied Thermal Engineering 28 (2008) 1151–1159.
[14] K.J. Bell, On the pessimization of heat exchangers, Heat Transfer Engineering, 21
(2000) 1-2.
[15] M. Taal, I. Bulatov, J. Klemes, P.Stehlik, Cost estimation and energy price forecast
for economic evaluation of retrofit projects, Applied Thermal Engineering 23 (2003)
1819-1835.
[16] A.C. Caputo, P.M. Pelagagge, P. Salini, Optimal cost-based design of shell and
tube heat exchangers, Proc. 12th Brazilian Congress on Thermal Engineering and
Sciences ENCIT 2008, November 10-14 2008, Belo Horizonte, Brasil.
[17] A.C. Caputo, P.M. Pelagagge, P. Salini, A manufacturing-based cost model for
shell and tube heat exchangers, Proc. 7th International Conference on Manufacturing
Research (ICMR09), University of Warwick, UK, September 8-10, 2009.
[18] R.E. Putman, Timing cleanings to boost heat exchanger performance: Cutting
costs, facilitating production, Chemical Processing 64 (2001) 39-41.
[19] J.U.R. Khan, S.M. Zubair, A risk-based performance analysis of plate-and-frame
heat exchangers subject to fouling: Economics of heat exchanger cleaning, Heat
Transfer Engineering 25 (2004) 87-100.
[20] B.R. O'Donnell, B.A. Barna, C.D. Gosling, Optimize heat exchanger cleaning
schedules, Chemical Engineering Progress 97 (2001) 56-60.
[21] A.K. Sheikh, S.M. Zubair, M.U. Haq, M.O. Budair, Reliability-based maintenance
strategies for heat exchangers subject to fouling, Journal of Energy Resources Tech-
nology, Transactions of the ASME, 118 (1996) 306-312.
[22] S.M. Zubair, A.K. Sheikh, M.O. Budair, M.A. Badar, A maintenance strategy for
heat transfer equipment subject to fouling: A probabilistic approach, Journal of Heat
Transfer 119 (1997) 575-580.
[23] S.M. Zubair, R.K. Shah, Fouling of plate-and-frame heat exchangers and cleaning
strategies, International Journal of Heat Exchangers 5 (2004) 129-156.
[24] M.C. Georgiadis, L.G. Papageorgiou, Optimal energy and cleaning management in
heat exchanger networks under fouling, Chemical Engineering Research and Design
78 (2000) 168-179.
[25] M.C. Georgiadis, L.G. Papageorgiou, S. Macchietto, Optimal cleaning policies in
heat exchanger networks under rapid fouling, Industrial and Engineering Chemistry
Research 39 (2000) 441-454.
[26] J.H. Lavaja, M.J. Bagajewicz, On a new MILP model for the planning of heat-
exchanger network cleaning, Industrial and Engineering Chemistry Research 43
(2004) 3924-3938.

[27] Lavaja J. and M. Bagajewicz. A New MILP Model for the Planning of Heat Ex-
changer Network Cleaning. Part II: Throughput Loss Considerations. Industrial and
Engineering Chemistry Research 44 (2005) 8045-8056.
[28] J.H. Lavaja, M.J. Bagajewicz, On a new MILP model for the planning of heat-
exchanger network cleaning. Part III: Multiperiod cleaning under uncertainty with fi-
nancial risk management, Industrial and Engineering Chemistry Research 44 (2005)
8136-8146.
[29] M. Markowski, K. Urbaniec, Optimal cleaning schedule for heat exchangers in a
heat exchanger network, Applied Thermal Engineering, 25 (2005) 1019-1032.
[30] S. Sanaye, B. Niroomand, Simulation of heat exchanger network (HEN) and plan-
ning the optimum cleaning schedule, Energy Conversion and Management 48 (2007)
1450-1461.
[31] F. Smaili, V.S. Vassiliadis, D.I. Wilson, Mitigation of fouling in refinery heat ex-
changer networks by optimal management of cleaning, Energy and Fuels 15 (2001)
1038-1056.
[32] F. Smaili, V.S. Vassiliadis, D.I. Wilson, Long-term scheduling of cleaning of heat
exchanger networks: Comparison of outer approximation-based solutions with a
backtracking threshold accepting algorithm, Chemical Engineering Research and De-
sign 80 (2002) 561-578.
[33] F. Smaili, V.S. Vassiliadis, D.I. Wilson, Optimization of cleaning schedules in heat
exchanger networks subject to fouling, Chemical Engineering Communications, 189
(2002) 1517-1549.
[34] P. Wildi-Tremblay, L. Gosselin, Minimizing shell and tube heat exchanger cost
with genetic algorithms and considering maintenance, International Journal of
Energy Research (2007) 867-885.
[35] D. Butterworth, Design of shell-and-tube heat exchangers when the fouling de-
pends on local temperature and velocity, Applied Thermal Engineering, 22 (2002)
789-801.
[36] D.I. Wilson, G.T. Polley, S.J. Pugh, Mitigation of crude oil preheat train fouling by
design, Heat Transfer Engineering, 23 (2002) 24-37.
[37] P.J. Fryer, P.J. Hobin, S.P. Mawer, Optimal design of a heat exchanger undergoing
reaction fouling, Canadian Journal of Chemical Engineering 66 (1988) 558–562.
[38] C.A. Branch, H. Müller-Steinhagen, Influence of scaling on the performance of
shell-and-tube heat exchangers, Heat Transfer Engineering 12 (2) (1991) 36–45.
[39] T.R. Bott, Fouling of heat exchangers, Elsevier, 1995.
[40] R.W. Bryers, Fouling of heat exchanger surfaces, Engineering Foundation, 1983.
[41] B.A. Garrett-Price, S.A. Smith, R.L. Watts, J.G. Knudsen, Fouling of heat ex-
changers: Characteristics, costs, prevention, control, and removal”, Noyes Pub.,
1985.
[42] H. Muller-Steinhagen, Heat exchanger fouling: Mitigation and cleaning techniques,
Institution of Chemical Engineers, UK, 2000.
[43] H. Muller-Steinhagen, M.R. Malayeri, A.P. Watkinson, Recent advances in heat
exchanger fouling research, mitigation, and cleaning techniques, Heat Transfer Engi-
neering, 28 (2007) 173-176.
[44] S. Jun, V.M. Puri, Fouling models for heat exchangers in dairy processing: A re-
view, Journal of Food Process Engineering 28 (2005) 1-34.
[45] A.K. Sheikh, S.M. Zubair, M. Younas, M.O. Budair, Statistical aspects of fouling
processes, Proceedings of the Institution of Mechanical Engineers, Part E: Journal of
Process Mechanical Engineering, 215 (2001) 331-354.
[46] M.R. Jafari Nasr, M. Majidi Givi, Modeling of crude oil fouling in preheat ex-
changers of refinery distillation units, Applied Thermal Engineering 26 (2006) 1572-
1577.
[47] M.N. LeClercq-Perlat, M. Lalande, Review on the modeling of the removal of po-
rous contaminants deposited on heat transfer surfaces, International Chemical Engi-
neering 31 (1991) 74-93.
[48] S. McGurn, S. Thompson, Heat transfer models for boiler fouling monitoring,
Transactions of the Institute of Measurement and Control 17 (1995) 212-222.
[49] M.G. Mwaba, M.R. Golriz, J. Gu, A semi-empirical correlation for crystallization
fouling on heat exchange surfaces, Applied Thermal Engineering 26 (2006) 440-447.
[50] C. Riverol, V. Napolitano, Estimation of fouling in a plate heat exchanger through
the application on neural networks, Journal of Chemical Technology and Biotech-
nology 80 (2005) 594-600.

[51] H. Zabiri, V.R. Radhakrishnan, M. Ramasamy, N.M. Ramli, V. Do Thanh, C.S.
Wah, Development of heat exchanger fouling model and preventive maintenance di-
agnostic tool, Chemical Product and Process Modeling 2 (2007).
[52] E.E. Ludwig, ,Applied process design for chemical and petrochemical plants, vol.3,
3rd Ed., Gulf Publishing, 2001.
[53] M. Srinivasan, A.P. Watkinson, Fouling of some canadian crude oils, in P. Watkin-
son, H. Muller-Steinhagen, and M. Reza Malayeri, (Eds.), 2003 ECI Conference on
Heat Exchanger Fouling and Cleaning: Fundamentals and Applications, Santa Fe,
New Mexico, USA, paper 26, 192-199, 2004.
[54] F. Brahim, W. Augustin, M. Bohnet, Numerical simulation of the fouling on, struc-
tured heat transfer surfaces (Fouling), in P. Watkinson, H. Muller-Steinhagen, and
M. Reza Malayeri, (Eds.), 2003 ECI Conference on Heat Exchanger Fouling and
Cleaning: Fundamentals and Applications, Santa Fe, New Mexico, USA, paper 17,
121-129, 2004.
[55] B.L. Yeap, D.I. Wilson, G.T. Polley, S.J. Pugh, Retrofitting crude oil refinery heat
exchanger networks to minimise fouling while maximising heat recovery, in P. Wat-
kinson, H. Muller-Steinhagen, M. Reza Malayeri (Eds.), 2003 ECI Conference on
Heat Exchanger Fouling and Cleaning: Fundamentals and Applications, Santa Fe,
New Mexico, USA, paper 28, 211-218, 2004.
[56] E.M. Ishiyama, W.R. Paterson, D.I. Wilson, Thermo-hydraulic channelling in par-
allel heat exchangers subject to fouling, Chemical Engineering Science, 63 (2008)
3400-3410.
[57] B.C. Pak, E.A. Groll, J.E. Braun, Impact of fouling and cleaning on plate fin and
spine fin heat exchanger performance, ASHRAE Transactions, 111 Part 1, art. no.
OR-05-1-3 (2005) 496-504.
[58] H. Sanatgar, E.F.C. Somerscales, Account for fouling in heat exchanger design,
Chemical Engineering Progress 87 (1991) 53-59.
[59] S.M. Zubair, A.K. Sheikh, M. Younas, M.O. Budair, A risk based heat exchanger
analysis subject to fouling: Part I: Performance evaluation, Energy 25 (2000) 427-
443.
[60] S.M. Zubair, A.K. Sheikh, M. Younas, M.O. Budair, A risk based heat exchanger
analysis subject to fouling: Part II: Economics of heat exchangers cleaning, Energy
25 (2000) 445-461.
[61] S.M. Zubair, B.A. Qureshi, A probabilistic fouling and cost model for plate-and-
frame heat exchangers, International Journal of Energy Research 30 (2006) 1-17.
[62] N.A. Abdul-Latif, S.H.F. Al-Madfai, A.N. Ghanim, Removal of scale deposited on
heat-transfer surfaces using chemical methods, Industrial and Engineering Chemistry
Research 27 (1988) 1548-1551.
[63] W.W. Frenier, S.J. Barber, Choose the best heat exchanger cleaning method,
Chemical Engineering Progress 94 (1998) 37-44.
[64] D.I. Wilson, Challenges in cleaning: Recent developments and future prospects, in
P. Watkinson, H. Muller-Steinhagen, M. Reza Malayeri (Eds.), 2003 ECI Conference
on Heat Exchanger Fouling and Cleaning: Fundamentals and Applications, Santa Fe,
New Mexico, USA, paper 21, 148-157, 2004.
[65] G.E: Saxon, R.E. Putman, The practical application and innovation of cleaning
technology for heat exchangers, in P. Watkinson, H. Muller-Steinhagen, M. Reza
Malayeri (Eds.), 2003 ECI Conference on Heat Exchanger Fouling and Cleaning:
Fundamentals and Applications, Santa Fe, New Mexico, USA, paper 28, 211-218,
2004.
[66] R.K. Shah, D.P. Sekulic, Fundamentals of heat exchanger design, Wiley, 2003.
[67] E. Casado, Model optimizes exchanger cleaning, Hydrocarbon Processing (1980)
71-76.
[68] R.E. Putman, Optimizing the cleaning of heat exchangers, Corporate publication,
Conco Consulting Corp. Verona, PA, USA. Available at the URL
http://www.concosystems.com/Files/Articles/Optimizing%20the%20Cleaning%20of
%20Heat%20Exchangers.pdf (accessed October 2010).
[69] A.G. Howell, G.E. Saxon Jr, Condenser tube fouling and failures: Causes and miti-
gation, Power Plant Chemistry, 7 (2005) 708-716.
[70] D.Q. Kern, Process heat transfer, McGraw-Hill, 1950.
Figures captions Figure 1 - Different kind of fouling trends (adapted from [33]). Figure 2- Influence of allowed fouling resistance on cleaning policy. Figure 3 - Flow chart of optimization procedure using GA and considering maintenance. Figure 4 – Trend of β vs flow velocity tubeside (βT curve) and shell side (βS curve). Figure 5 - U trend through 5 years for the “Joint Optimization” exchanger. Figure 6 - U trend through 5 years for the “TGA2” exchanger. Figure 7 - U trend through 5 years for the “Hybrid TGA2” exchanger.
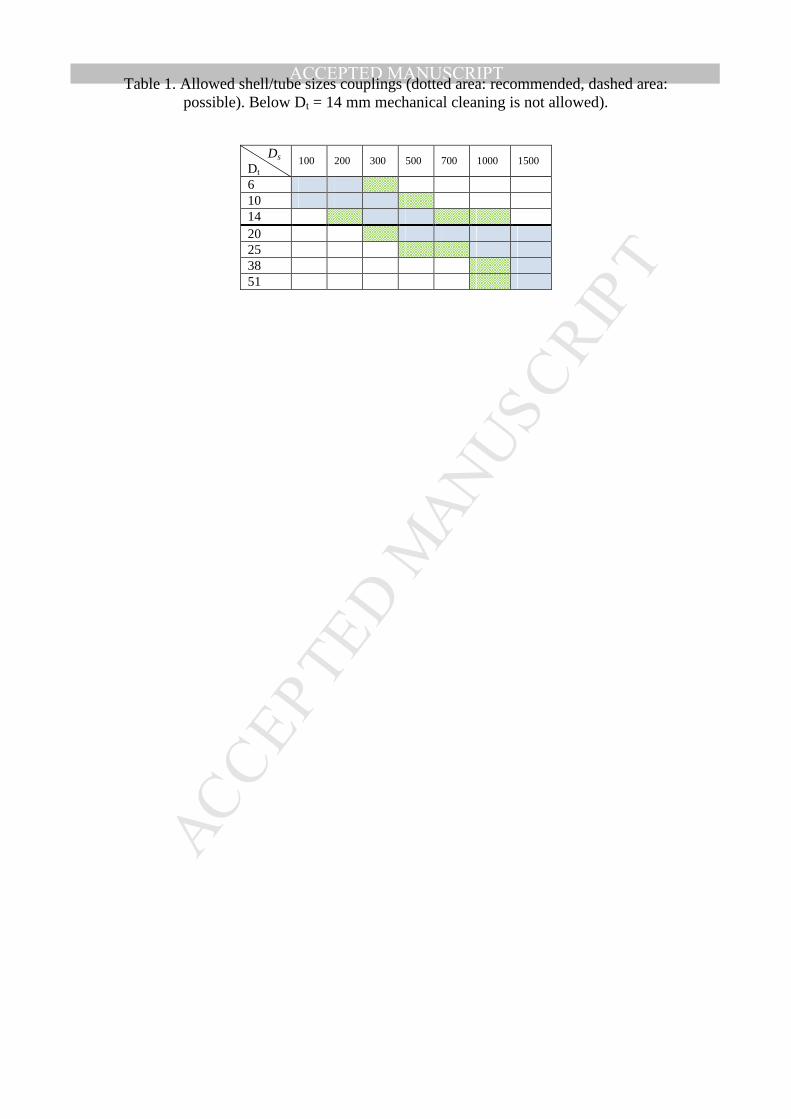
Table 1. Allowed shell/tube sizes couplings (dotted area: recommended, dashed area: possible). Below Dt = 14 mm mechanical cleaning is not allowed).
Ds Dt
100 200 300 500 700 1000 1500
6 10 14 20 25 38 51

Table 2. Heat exchanger thermal characteristics
Duty [kW] 410 Ft [ - ] 0.947 Ft [ - ] 1
∆TLM [°C] 6.35 ∆Tm [°C] 6.01 ∆Tm [°C] 6.35
Two or more tube passes One countercurrent tube pass
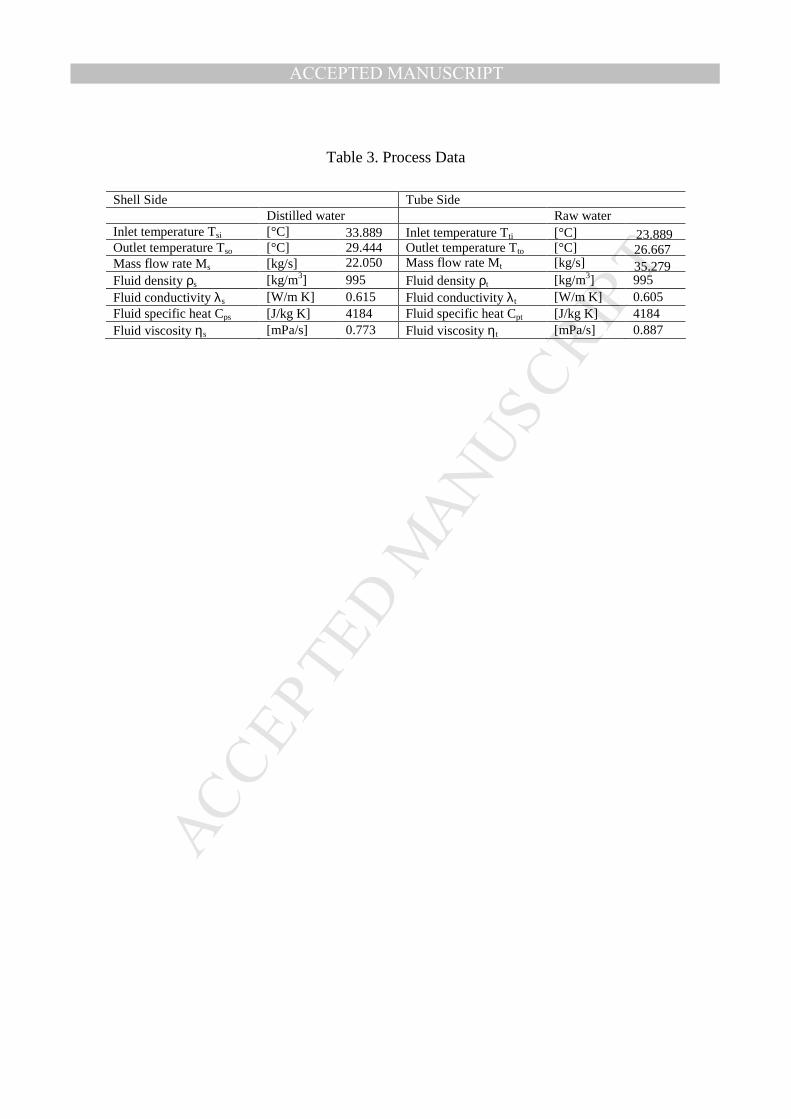
Table 3. Process Data
Shell Side Tube Side Distilled water Raw water Inlet temperature Tsi [°C] 33.889 Inlet temperature Tti [°C] 23.889 Outlet temperature Tso [°C] 29.444 Outlet temperature Tto [°C] 26.667 Mass flow rate Ms [kg/s] 22.050 Mass flow rate Mt [kg/s] 35.279 Fluid density ρs [kg/m3] 995 Fluid density ρt [kg/m3] 995 Fluid conductivity λs [W/m K] 0.615 Fluid conductivity λt [W/m K] 0.605 Fluid specific heat Cps [J/kg K] 4184 Fluid specific heat Cpt [J/kg K] 4184 Fluid viscosity ηs [mPa/s] 0.773 Fluid viscosity ηt [mPa/s] 0.887
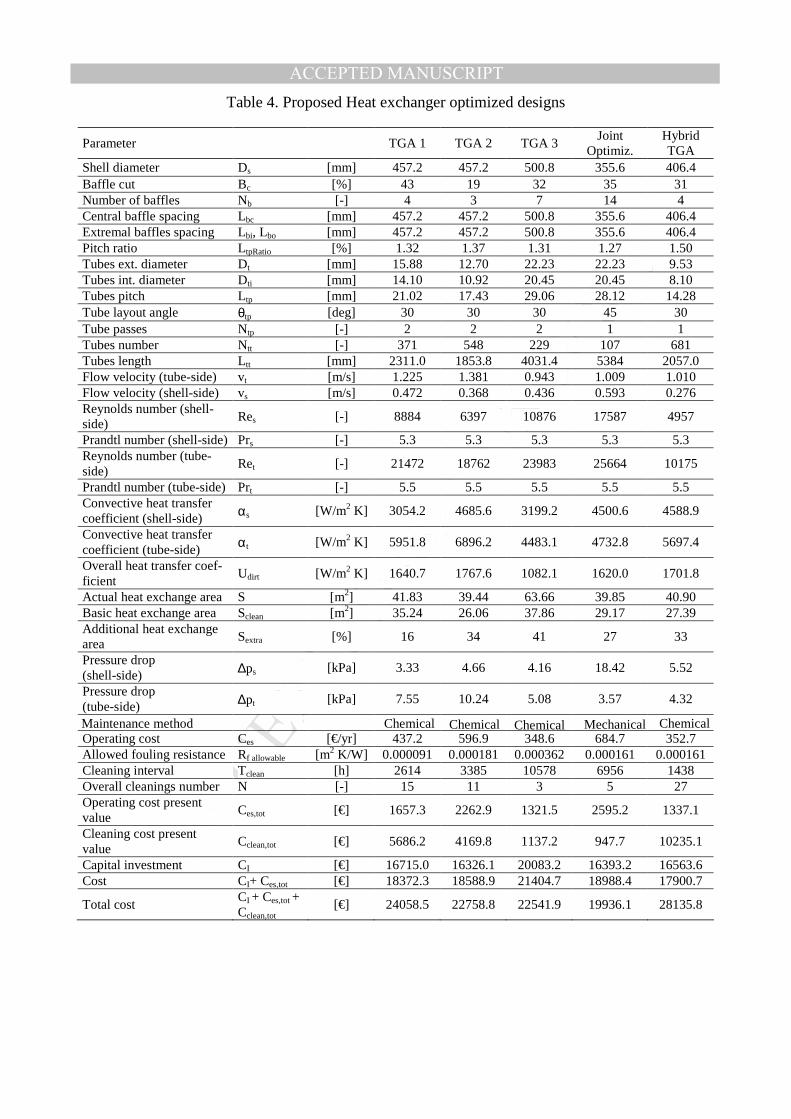
Table 4. Proposed Heat exchanger optimized designs
Parameter TGA 1 TGA 2 TGA 3 Joint
Optimiz. Hybrid TGA
Shell diameter Ds [mm] 457.2 457.2 500.8 355.6 406.4 Baffle cut Bc [%] 43 19 32 35 31 Number of baffles Nb [-] 4 3 7 14 4 Central baffle spacing Lbc [mm] 457.2 457.2 500.8 355.6 406.4 Extremal baffles spacing Lbi, Lbo [mm] 457.2 457.2 500.8 355.6 406.4 Pitch ratio LtpRatio [%] 1.32 1.37 1.31 1.27 1.50 Tubes ext. diameter Dt [mm] 15.88 12.70 22.23 22.23 9.53 Tubes int. diameter Dti [mm] 14.10 10.92 20.45 20.45 8.10 Tubes pitch Ltp [mm] 21.02 17.43 29.06 28.12 14.28 Tube layout angle θtp [deg] 30 30 30 45 30 Tube passes Ntp [-] 2 2 2 1 1 Tubes number Ntt [-] 371 548 229 107 681 Tubes length Ltt [mm] 2311.0 1853.8 4031.4 5384 2057.0 Flow velocity (tube-side) vt [m/s] 1.225 1.381 0.943 1.009 1.010 Flow velocity (shell-side) vs [m/s] 0.472 0.368 0.436 0.593 0.276 Reynolds number (shell-side)
Res [-] 8884 6397 10876 17587 4957
Prandtl number (shell-side) Prs [-] 5.3 5.3 5.3 5.3 5.3 Reynolds number (tube-side)
Ret [-] 21472 18762 23983 25664 10175
Prandtl number (tube-side) Prt [-] 5.5 5.5 5.5 5.5 5.5 Convective heat transfer coefficient (shell-side) αs [W/m2 K] 3054.2 4685.6 3199.2 4500.6 4588.9
Convective heat transfer coefficient (tube-side) αt [W/m2 K] 5951.8 6896.2 4483.1 4732.8 5697.4
Overall heat transfer coef-ficient
Udirt [W/m2 K] 1640.7 1767.6 1082.1 1620.0 1701.8
Actual heat exchange area S [m2] 41.83 39.44 63.66 39.85 40.90 Basic heat exchange area Sclean [m2] 35.24 26.06 37.86 29.17 27.39 Additional heat exchange area
Sextra [%] 16 34 41 27 33
Pressure drop (shell-side) ∆ps [kPa] 3.33 4.66 4.16 18.42 5.52
Pressure drop (tube-side) ∆pt [kPa] 7.55 10.24 5.08 3.57 4.32
Maintenance method Chemical Chemical Chemical Mechanical Chemical Operating cost Ces [€/yr] 437.2 596.9 348.6 684.7 352.7 Allowed fouling resistance Rf allowable [m2 K/W] 0.000091 0.000181 0.000362 0.000161 0.000161 Cleaning interval Tclean [h] 2614 3385 10578 6956 1438 Overall cleanings number N [-] 15 11 3 5 27 Operating cost present value
Ces,tot [€] 1657.3 2262.9 1321.5 2595.2 1337.1
Cleaning cost present value
Cclean,tot [€] 5686.2 4169.8 1137.2 947.7 10235.1
Capital investment CI [€] 16715.0 16326.1 20083.2 16393.2 16563.6 Cost CI+ Ces,tot [€] 18372.3 18588.9 21404.7 18988.4 17900.7
Total cost CI + Ces,tot + Cclean,tot
[€] 24058.5 22758.8 22541.9 19936.1 28135.8

Table 5. Sensitivity analysis to fouling rate
Parameter Joint
Optimization k=0.33
Joint Optimization
k=0.45
Joint Optimization
k=-0.33
Joint Optimization
k=-0.66 Shell diameter Ds [mm] 500.8 355.6 457.2 610.0 Baffle cut Bc [%] 31 45 16 28 Number of baffles Nb [-] 11 4 3 16 Central baffle spacing Lbc [mm] 318.0 355.6 457.2 122.0 Extremal baffles spacing Lbi, Lbo [mm] 286.0 355.6 457.2 124.0 Pitch ratio LtpRatio [%] 1.32 1.29 1.33 1.42 Tubes ext. diameter Dt [mm] 22.23 9.53 12.70 20.00 Tubes int. diameter Dti [mm] 20.45 8.10 10.92 16.00 Tubes pitch Ltp [mm] 29.42 12.26 16.85 28.50 Tube layout angle θtp [deg] 45 30 30 90 Tube passes Ntp [-] 2 2 2 2 Tubes number Ntt [-] 193 660 586 315 Tubes length Ltt [mm] 3802 1828 1879 2128 Flow velocity (tube-side) vt [m/s] 1.119 2.084 1.292 1.120 Flow velocity (shell-side) vs [m/s] 0.336 0.959 0.463 0.637 Reynolds number (shell-side) Res [-] 11809 9561 7021 25954 Prandtl number (shell-side) Prs [-] 5.3 5.3 5.3 5.3 Reynolds number (tube-side) Ret [-] 28456 20998 17546 22281 Prandtl number (tube-side) Prt [-] 5.5 5.5 5.5 5.5 Convective heat transfer coef-ficient (shell-side) αs [W/m2 K] 3755.9 4547.7 4935.7 4655.6
Convective heat transfer coef-ficient (tube-side) αt [W/m2 K] 5140.4 10171.4 6536.1 5401.5
Overall heat transfer coeffi-cient
Udirt [W/m2 K] 1335.2 1965.8 1611.2 1662.8
Actual heat exchange area S [m2] 50.56 35.11 42.76 41.13 Basic heat exchange area Sclean [m2] 32.58 22.88 25.95 30.43 Additional heat exchange area Sextra [%] 36 35 39 26 Pressure drop (shell-side) ∆ps [kPa] 7.18 11.60 5.88 16.85 Pressure drop (tube-side) ∆pt [kPa] 6.71 28.48 9.12 5.63 Maintenance Kind Mechanical Chemical Chemical Mechanical Operating cost Ces [€/yr] 508.0 1621.6 580.7 733.4 Allowed fouling resistance Rf allowable [m2 K/W] 0.000267 0.000166 0.000234 0.000144 Cleaning interval Tclean [h] 6667 9273 6876 7050 Overall cleanings number N [-] 5 4 5 5 Operating cost present value Ces,tot [€] 1925.7 6147.1 2201.3 2780.2 Cleaning cost present value Cclean,tot [€] 947.7 1516.3 1895.4 947.7 Capital investment CI [€] 18095.9 15611.9 16863.6 16600.7 Cost CI+ Ces,tot [€] 20021.6 21759 19064.9 19380.9
Total cost CI + Ces,tot + Cclean,tot
[€] 20969.3 23275.3 20960.3 20328.6
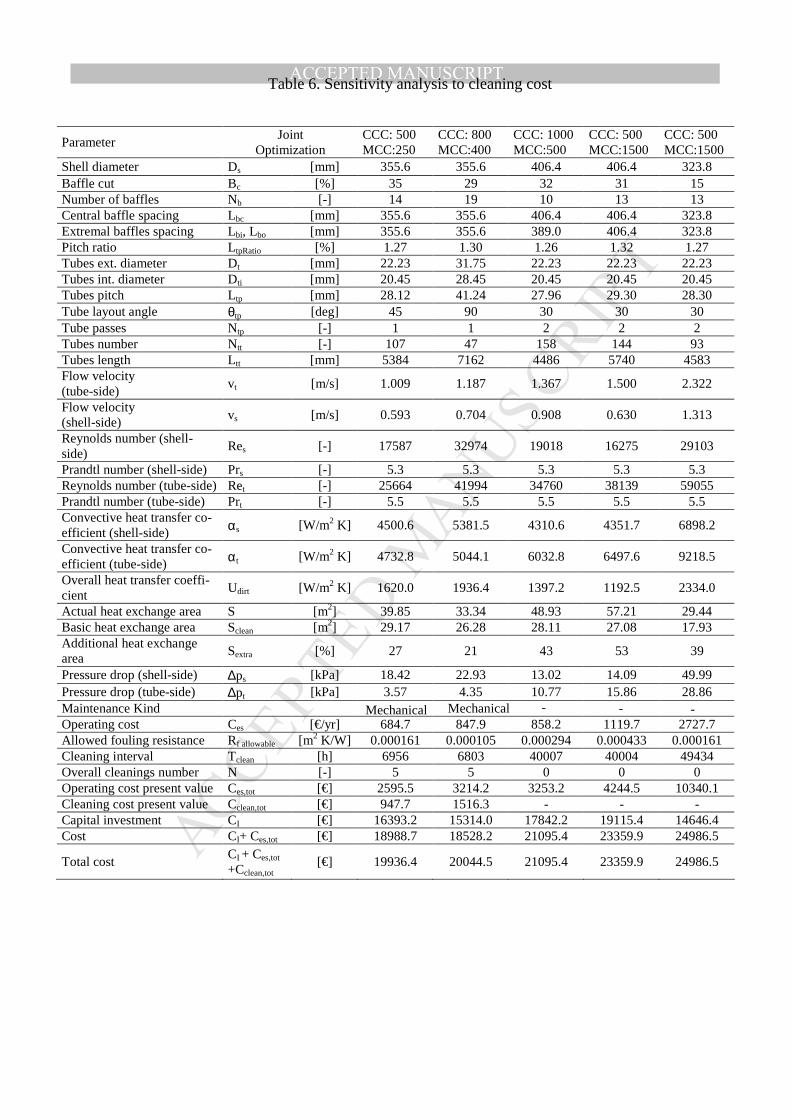
Table 6. Sensitivity analysis to cleaning cost
Parameter Joint
Optimization CCC: 500 MCC:250
CCC: 800 MCC:400
CCC: 1000 MCC:500
CCC: 500 MCC:1500
CCC: 500 MCC:1500
Shell diameter Ds [mm] 355.6 355.6 406.4 406.4 323.8 Baffle cut Bc [%] 35 29 32 31 15 Number of baffles Nb [-] 14 19 10 13 13 Central baffle spacing Lbc [mm] 355.6 355.6 406.4 406.4 323.8 Extremal baffles spacing Lbi, Lbo [mm] 355.6 355.6 389.0 406.4 323.8 Pitch ratio LtpRatio [%] 1.27 1.30 1.26 1.32 1.27 Tubes ext. diameter Dt [mm] 22.23 31.75 22.23 22.23 22.23 Tubes int. diameter Dti [mm] 20.45 28.45 20.45 20.45 20.45 Tubes pitch Ltp [mm] 28.12 41.24 27.96 29.30 28.30 Tube layout angle θtp [deg] 45 90 30 30 30 Tube passes Ntp [-] 1 1 2 2 2 Tubes number Ntt [-] 107 47 158 144 93 Tubes length Ltt [mm] 5384 7162 4486 5740 4583 Flow velocity (tube-side)
vt [m/s] 1.009 1.187 1.367 1.500 2.322
Flow velocity (shell-side)
vs [m/s] 0.593 0.704 0.908 0.630 1.313
Reynolds number (shell-side)
Res [-] 17587 32974 19018 16275 29103
Prandtl number (shell-side) Prs [-] 5.3 5.3 5.3 5.3 5.3 Reynolds number (tube-side) Ret [-] 25664 41994 34760 38139 59055 Prandtl number (tube-side) Prt [-] 5.5 5.5 5.5 5.5 5.5 Convective heat transfer co-efficient (shell-side) αs [W/m2 K] 4500.6 5381.5 4310.6 4351.7 6898.2
Convective heat transfer co-efficient (tube-side) αt [W/m2 K] 4732.8 5044.1 6032.8 6497.6 9218.5
Overall heat transfer coeffi-cient
Udirt [W/m2 K] 1620.0 1936.4 1397.2 1192.5 2334.0
Actual heat exchange area S [m2] 39.85 33.34 48.93 57.21 29.44 Basic heat exchange area Sclean [m2] 29.17 26.28 28.11 27.08 17.93 Additional heat exchange area
Sextra [%] 27 21 43 53 39
Pressure drop (shell-side) ∆ps [kPa] 18.42 22.93 13.02 14.09 49.99 Pressure drop (tube-side) ∆pt [kPa] 3.57 4.35 10.77 15.86 28.86 Maintenance Kind Mechanical Mechanical - - - Operating cost Ces [€/yr] 684.7 847.9 858.2 1119.7 2727.7 Allowed fouling resistance Rf allowable [m2 K/W] 0.000161 0.000105 0.000294 0.000433 0.000161 Cleaning interval Tclean [h] 6956 6803 40007 40004 49434 Overall cleanings number N [-] 5 5 0 0 0 Operating cost present value Ces,tot [€] 2595.5 3214.2 3253.2 4244.5 10340.1 Cleaning cost present value Cclean,tot [€] 947.7 1516.3 - - - Capital investment CI [€] 16393.2 15314.0 17842.2 19115.4 14646.4 Cost CI+ Ces,tot [€] 18988.7 18528.2 21095.4 23359.9 24986.5
Total cost CI + Ces,tot
+Cclean,tot [€] 19936.4 20044.5 21095.4 23359.9 24986.5
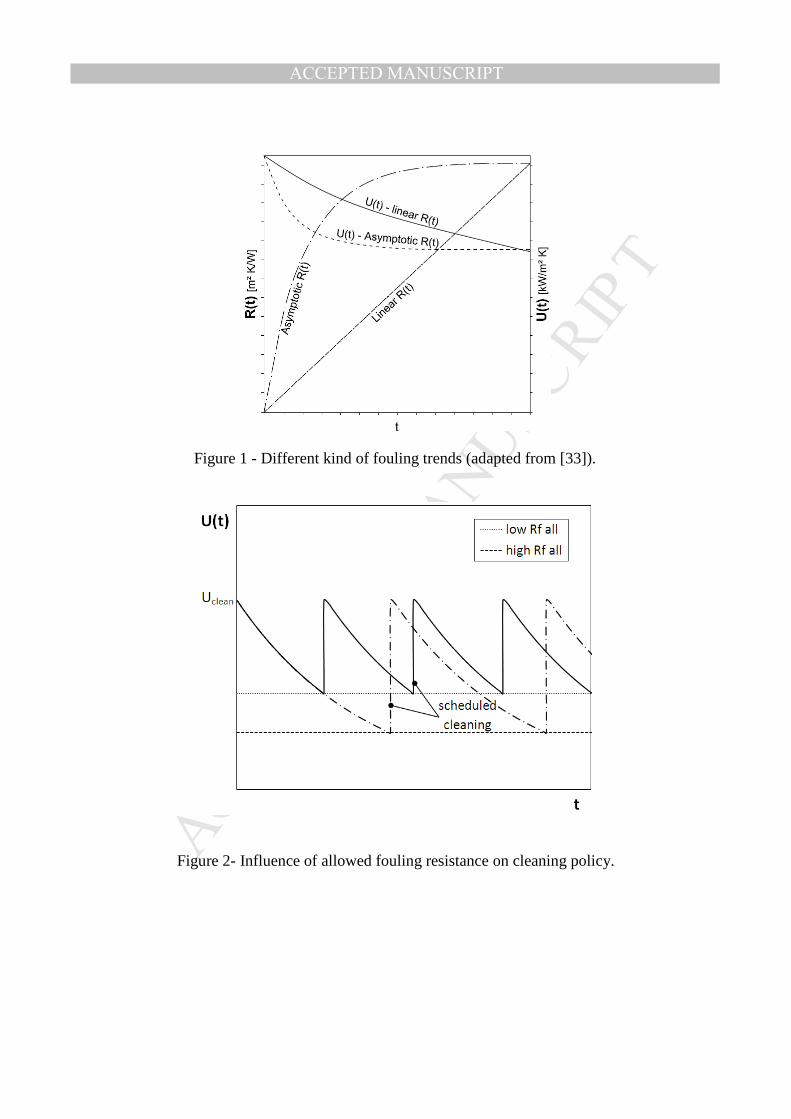
Figure 1 - Different kind of fouling trends (adapted from [33]).
Figure 2- Influence of allowed fouling resistance on cleaning policy.

Figure 3 - Flow chart of optimization procedure using GA and considering maintenance.
Figure 4 – Trend of β vs flow velocity tube-side (betaT curve) and shell-side (betaS curve).
Figure 5 - U trend through 5 years for the “Joint Optimization” exchanger.

Figure 6 - U trend through 5 years for the “TGA2” exchanger.
Figure 7 - U trend through 5 years for the “Hybrid TGA” exchanger.