johnson, et al., in press, earth surface processes and...
TRANSCRIPT
Johnson, et al., in press, Earth Surface Processes and Landforms
Recent Shifts in Coastline Change and Shoreline Stabilization Linked to Storm Climate
Change
Jennifer M. Johnson1, Laura J. Moore1*, Kenneth Ells2, A. Brad Murray2, Peter N. Adams3,
Richard A. MacKenzie3 III, and John M. Jaeger3
1Department of Geological Sciences, Coastal Environmental Change Lab, University of North
Carolina, Chapel Hill, NC, USA
2 Division of Earth and Ocean Sciences, Nicholas School of the Environment; Center for
Nonlinear and Complex Systems, Duke University, Durham, NC, USA
3 Department of Geological Sciences, University of Florida, Gainesville, FL, USA
ABSTRACT
Because cuspate coastlines are especially sensitive to changes in wave climate, they serve as
potential indicators of initial responses to changing wave conditions. Previous work demonstrates
that Cape Hatteras and Cape Lookout, NC, which are largely unaffected by shoreline stabilization
efforts, have become increasingly asymmetric over the past 30 years, consistent with model
predictions for coastline response to increases in Atlantic Ocean summer wave heights and resulting
changes in the distribution of wave-approach angles. Historic and recent shoreline change
observations for Cape Fear, North Carolina, and model simulations of coastline response to an
increasingly asymmetric wave climate in the presence of beach nourishment, produce comparable
differences in shoreline change rates in response to changes in wave climate. Results suggest that
the effect of beach nourishment is to compensate for—and therefore to mask—natural responses to
wave climate change that might otherwise be discernible in patterns of shoreline change alone.
Therefore, this case study suggests that the effects of wave climate change on human-modified
coastlines may be detectable in the spatial and temporal patterns of shoreline stabilization activities.
Similar analyses of cuspate features in areas where the change in wave climate is less pronounced
(i.e., Fishing Point, Maryland/Virginia) and where local geology appears to exert control on
2
coastline shape (i.e., Cape Canaveral, Florida), suggest that changes in shoreline configuration that
may be arising from shifting wave climate are currently limited to sandy wave-dominated coastlines
where the change in wave climate has been most pronounced. However, if hurricane-generated
wave heights continue to increase, large-scale shifts in patterns of erosion and accretion will likely
extend beyond sensitive cuspate features as the larger-scale coastline shape comes into equilibrium
with changing wave conditions.
Introduction
Coastal environments are highly dynamic, changing dramatically across a range of
temporal and spatial scales in response to natural processes and modifications of the environment
by humans. Climate change will influence coastal evolution by increasing sea level rise rates
(IPCC, 2014), and potentially by increasing the frequency of intense hurricanes (e.g., Webster et
al., 2005, Knutson et al., 2010, Emanuel, 2013). Whether or not hurricane activity changes,
predicted increases in the rate of sea-level rise over the next century will lead to increases in
storm impacts (Woodruff et al., 2013), likely resulting in increasing rates of landward migration
of barrier islands (e.g., FitzGerald et al., 2008; Moore et al., 2010). As storm behaviors change
(in response to climate change, or otherwise, e.g., Bromirski and Kossin, 2008), consequent
changes in ocean wave climate (e.g., Cox and Swail, 2001; Sterl and Caires, 2005; Komar and
Allan, 2008), may alter alongshore sediment transport gradients causing shifts in erosion hazard
areas (Ruggiero et al., 2010; Adams et al., 2011; Moore et al., 2013). As coastlines change in
response to these forcings, the tendency for humans to exert influence on coastal dynamics is also
likely to increase (e.g., McNamara and Keeler, 2013; Hapke et al., 2013).
Approximately 13% of the world’s urban areas—including an estimated 634 million
inhabitants—are located in low-elevation coastal zones (McGranahan et al., 2007). Consequently,
humans have employed many techniques to mitigate the effects of rising sea level and storms.
3
These techniques, including shoreline armoring, beach nourishment and artificial dune
construction, often have adverse effects that significantly alter sediment fluxes and the natural
migration of coastal environments (e.g., Pilkey et al., 1998; Magliocca et al., 2011; Slott et al.
2010; Ells and Murray, 2012). It is increasingly important to understand the coupled natural-
human processes that alter coastline evolution as global climate continues to change.
Here, using case-study examples from the U.S. East Coast (i.e., Cape Fear, North
Carolina; Fishing Point, Maryland and Virginia; and Cape Canaveral, Florida), we further address
the questions of how coastline morphology responds to changing climate forcing, and how
coupled human/coastline systems on developed coastlines respond, when local shoreline
stabilization prevents the coastline morphology from adjusting as it would on an undeveloped
coastline. These questions apply broadly wherever increasing rates of sea-level rise or changing
wave climates tend to increase rates of shoreline change. However, in this contribution we focus
on cuspate coastlines, because they are characterized by locally high curvature and a broad range
of coastline orientations (e.g., the coast of North Carolina in the U.S.), and are therefore
particularly sensitive to changes in wave climate (Ashton and Murray, 2006a, 2006b, Slott et al.,
2006). We present an analysis of shoreline change observations for each of the three cuspate
coastline examples and use these observations, along with records of beach nourishment, analyses
of wave data and model simulations, to determine whether the effects of wave climate change
such as those suggested for largely-unaltered Capes Hatteras and Lookout by Moore et al.,
(2013)—are discernible in areas where changes in wave climate have been more subtle (e.g.
Fishing Point, Maryland & Virginia), where the coast has been modified by humans (e.g. Cape
Fear, North Carolina) and where local geology may play a role in controlling coastline shape
(Cape Canaveral, Florida).
We hypothesize that if changes in patterns of shoreline erosion and accretion (and
therefore coastline shape) are not apparent in observations of Cape Fear, this may be because
4
shoreline stabilization efforts have masked the response of the coastline to an increasingly
asymmetric wave climate. We also hypothesize that changes in wave climate may be too subtle to
produce a detectable change in patterns of shoreline erosion and accretion in the vicinity of
Fishing Point, MD and that changes in wave climate along the eastern Florida coast may have
altered the shape of Cape Canaveral over the last several decades.
Background
Recent changes in regional wave climate have been documented by Komar and Allan
(2008), who analyzed 30 years of data from 3 buoys and found a trend of increasing summer
season significant wave heights, especially for large waves (i.e., hurricane-generated), along a
stretch of coast from New Jersey to South Carolina, with the magnitude of change increasing
southward. The authors attribute this shift to increases in hurricane intensity observed by Emanuel
(2005). Subsequent analyses have questioned the conclusion, based on these observations, that
hurricane intensity was increasing during the 30-year period, pointing out that the summer months
(June - August) Komar and Allan separated in their analysis do not correspond directly to the
tropical-storm season of June - November (Bromirski and Kossin, 2008). However, the
subsequent analyses have not questioned either the existence of the increasing wave-height trends
(whether all months or just the summer months are considered), or the point that waves with
heights over 3 m during the summer months can be attributed to hurricanes (Komar and Allen,
2008). The hurricane-generated waves (heights > 3m) off the coast of Cape May, NJ have
increased by an average of 0.01 m/yr between the mid-1970s and 2005, while those off of Cape
Hatteras, and Wilmington, NC increased in height by an average of 0.7 m and 1.8 m respectively
over the same time period (Komar and Allan, 2008). McNamara et al. (2011) found that when
summer season significant wave height increases off the coast of North Carolina, the wave
5
climate—defined as the distribution of wave influences from different directions—becomes
increasingly asymmetric, with a greater proportion of the influence on alongshore sediment flux
coming from waves approaching from the east and northeast.
Sustained changes in the relative influence of waves coming from different directions will
ultimately alter the shape of a coastline. Model simulations of a cuspate coastline using the
Coastline Evolution Model (CEM; Ashton and Murray, 2006a) predict that increased patterns of
storminess and associated wave climate alterations could result in greatly increased erosion rates
in cuspate bays updrift of cape tips, and a strong tendency for accretion downdrift of cape tips
(Slott et al., 2006). These alterations in shoreline change rates are superimposed on the
background rates related to sea-level rise effects (e.g. Moore et al., 2010) and migration of large-
scale coastline features (e.g Ashton and Murray, 2006a).
To determine if the effects of wave climate change are discernible in observations, Moore
et al. (2013) determined the difference between historic rates and recent rates of shoreline change
along stretches of the North Carolina coast (including Capes Hatteras and Lookout). They
compared these observations with model predictions for the response of a cuspate coastline to a
wave climate specifically altered to reflect the increased summer significant wave-height trend
identified by Komar and Allen (2008). Results suggest that the observed pattern of increasing
erosion (accretion) along northern (southern) flanks of both capes is consistent with the model-
predicted change in coastline shape expected to arise from the changes in wave climate identified
by Komar and Allan (2008) (Moore et al. 2013).
The two cape features examined by Moore et al. (2013) show a distinct geomorphic
signature of wave climate change. Both are located near the zone of maximum summer significant
wave-height increase identified by Komar and Allan (2008) and have been relatively unaltered by
human activities. We can expect coastline response to wave climate change to be different or less
6
detectable in areas where the change in wave climate is less pronounced or on developed
coastlines affected by shoreline stabilization efforts.
Shoreline stabilization can dramatically change the way a cuspate coastline responds to a
shift in wave climate, relative to what would occur without nourishment. Comparisons of
numerical model experiments with and without nourishment (both involving the same wave-
climate change scenario) suggest that the shoreline-change effects attributable solely to even an
isolated zone of nourishment could exceed the magnitude of change expected from sea-level rise
alone (Slott et al., 2010)—and that these anthropogenic effects can extend surprising distances
up- and down-drift from the site of shoreline stabilization.
These long-range effects stem largely from the way shoreline angles are affected on an
eroding stretch of coastline when one area is stabilized (Ells and Murray, 2011). Hypothetically,
in the absence of wave-driven alongshore sediment transport, the stabilized area would protrude
farther and farther seaward as the surrounding coastline recedes. However, gradients in
alongshore sediment transport tend to produce a diffusive smoothing locally along sandy
coastlines (e.g. Ashton and Murray, 2006a, b), which tends to prevent a stabilized section of
coastline from protruding abruptly. As the stabilized section begins to protrude, the altered
shoreline angles updrift and downdrift change the net sediment fluxes in ways that tend to keep
the shoreline smooth. The pattern of shoreline change updrift and downdrift of a stabilized section
depends on whether the stabilization is accomplished through hard structures (such as seawalls or
groynes), or through beach nourishment, which adds new sediment into the nearshore system
(Ells and Murray, 2011).
Averaged over time scales longer than that of the nourishment cycle, a long-term
nourishment project must add sediment at the long-term rate required to prevent the stabilized
area from eroding. As the stabilized area begins to protrude from the surrounding coastline, net
sediment fluxes into the area from updrift tend to be decreased by the altered shoreline angles,
7
while net downdrift fluxes out of the area tend to be increased. This tendency for an increased
divergence of alongshore sediment flux means that nourishment rates must be higher than they
would be if the stabilized area were not connected to the surrounding shoreline, reflecting the fact
that the nourishment is partly stabilizing the surrounding coastline as well (Ells and Murray,
2011). With stabilization through beach nourishment, the effects on updrift and downdrift
stretches of coastline are symmetric; even though the sand added during nourishment moves in
the downdrift direction, the altered shoreline angles and curvature updrift of the stabilized area
produce a convergence of sediment flux, and therefore deposition of sand from updrift, relative to
what would occur in the absence of stabilization. How far updrift and downdrift the effects of the
localized stabilization extend depend on the large-scale coastline morphology (as well as the
length of time considered). In summary, where human and natural influences are coupled, the
resulting system can exhibit complex responses to changes in forcing. By analyzing shoreline
change and nourishment data for the developed Cape Fear region as a case study, we examine
how localized, long-term beach nourishment interacts with changing climate forcing on cuspate-
cape coastline.
Study Areas
We examined three cuspate coastal landforms along the U.S. Mid-Atlantic coast (Figure
1); the highly-altered Cape Fear in North Carolina (NC) (Figure 1a), a northern location including
portions of the Delmarva Peninsula near Fishing Point, considered by some to be a ‘false cape’
(e.g., Leatherman et al., 1982) (Figure 1b), and the region surrounding Cape Canaveral, Florida
(FL) (Figure 1c). Each study area (encompassing the stretch of coast approximately 30km to the
north and south of the cape tip) has experienced a unique combination of wave climate change
and human alteration as outlined below.
Cape Fear, the southernmost of the three capes that characterize the coast of North Carolina,
lies just south of Wilmington, NC (Figure 1a ). The northern flank of this cape, extending from
8
Kure Beach to Fort Fisher, is considered part of the mainland, but features low-lying sandy
shorelines and is backed by a water body (Cape Fear River), similar to a barrier island. The
barrier islands along the southern flank of Cape Fear are primarily composed of channel-fill and
are more tide-dominated (i.e. punctuated by a greater number of inlets) than counterparts to the
north (Riggs et al., 1995). Relative sea level rise (RSLR) rates along the North Carolina coast
have been between 3.0 mm/yr and 3.3 mm/yr throughout the twentieth century (Kemp et al.,
2009). The coast adjacent to Cape Fear has been nourished repeatedly since the 1930s,
particularly along Kure, Carolina, and Wrightsville Beaches (USACE, 1965; USACE, 1998;
Valverde et al., 1999) (Figure 1a). This is in contrast to locations studied by Moore et al. (2013),
in part, because Cape Hatteras and Cape Lookout lie within their own respective national
seashores and are therefore managed by the National Park Service, remaining relatively
unaffected by direct human influence (Valverde et al., 1999). Though Cape Fear differs from the
other two NC capes in its degree of human manipulation, it exhibits similar morphology and is
subject to the same high-angle wave climate and southerly net alongshore transport direction as
Capes Hatteras and Lookout (Ashton and Murray, 2006a). The change in wave climate at Cape
Fear is also likely to be similar to the change in wave climate at Capes Hatteras and Lookout
because they are located in the same region, bracketed by buoys at which the increase in
hurricane-generated wave heights has been identified by Komar and Allen (2008). For this reason,
Cape Fear is an ideal location in which to assess the detectability of a geomorphic signature of
wave climate change in the presence of human alteration to the coastline.
Approximately 200 kilometers north of Cape Hatteras, Fishing Point lies along the Delmarva
Peninsula and includes coastline from southern Maryland (MD) and Virginia (VA) (Figure 1b).
Barrier islands in the study area extend ~30 km to the north and south of Fishing Point and
include a portion of Assateague Island National Seashore (ASIS) in the north, and Wallops Island,
Assawoman Island, Metompkin Island, Cedar Island and Parramore Island to the south. The latter
9
two islands are located in the Virginia Coastal Reserve, which is Long Term Ecological Research
site (VCR LTER). The islands of this region are mixed-energy barriers associated with a tidal
range of approximately 1.24 m, and a modern RSLR rate of approximately 4.3 mm/yr (Hayes,
1979). The five barrier islands south of Fishing Point are retreating along their entire length,
except for Parramore Island which exhibits alternating patterns of erosion and accretion at each
end associated with changes in ebb channel location within the surrounding large ebb tidal deltas
(Leatherman et al., 1982; Figure 1b). Direct human influence here is minimal (Valverde et al.,
1999), with the exception of Wallops Island, which is home to NASA’s Goddard Space Flight
Center Wallops Flight Facility (WFF). The shoreline near the WFF has been the site of repeated
shoreline stabilization efforts over the last century (NASA, 2010)—currently a seawall is being
repaired and extended (WFF, 2011), and an associated nourishment project is scheduled for the
near future (WFF, 2010). Because the strength of the trend in increasing wave height found by
Komar and Allan (2008) decreases to the north, wave climate change along the Delmarva
Peninsula has likely been less pronounced than it has along the North Carolina coastline (although
shifts in wave-angle distribution could occur for other reasons).
Cape Canaveral (formerly Cape Kennedy) is approximately 660 km south of Cape Fear on the
coast of east central Florida and lies on a peninsula, which hosts the Cape Canaveral Air Force
Station. The tide range in this area is approximately 1m (Nummedal et. al, 1977) and the local
relative sea level rise rate is about 2.2 mm/yr (Morton and Miller, 2005). In 1950, construction
began on an artificial inlet (Port Canaveral) just south of the cape tip, which requires high rates of
dredging to counter high rates of alongshore sediment transport (Work and Dean, 1990). The
peninsula itself is composed of a series of northeast trending beach ridges that date to ~ 4,000 to
150 B.P. (Rink and Forest, 2005). Approximately 3 km north of the tip of Cape Canaveral is an
area known as “False Cape,” home to the Kennedy Space Center shuttle launch area (Figure 1c).
Komar and Allan (2008) did not extend their analysis southward beyond the Charleston buoy
10
(most directly offshore of Wilmington, NC), though the trend of greater increases in summer
season significant wave height to the south (for the buoys analyzed by Komar and Allan (2008),
suggests this region has also experienced an increase in hurricane-generated waves.
Methods
Historical Shoreline Change Analysis
To conduct a shoreline change analysis for the north and south flanks of Cape Fear,
Fishing Point, and Cape Canaveral, we gathered available digital shoreline shapefiles (Table 1)
and used them to quantify and compare shoreline change rates pre- and post- 1975 (which we
refer to as historic and recent time periods, respectively). We selected 1975 as a breakpoint
between historic and recent rate calculations to coincide with the beginning of the time period of
wave observations analyzed by Komar and Allan (2008). Though the limited time period of wave
observations prevents determination of when summer-season significant wave heights began to
increase, analyzing two different periods allows us to determine how rates and patterns of
shoreline change have shifted since wave observation began (and increases in wave height could
be calculated). Available shorelines included 8 historic and 4 recent shorelines for Cape Fear
(USGS, 2011; NOAA, 2012, NCDCM, 2011), 6 historic and 8 recent shorelines for the area
surrounding Fishing Point (USGS, 2012; Oster, 2012; ASIS, 2012), and 11 historic shorelines and
11 recent shorelines for Cape Canaveral (USGS, 2012; NOAA, 2012; FF&W, 2012). Though
some of these shorelines offer only partial coverage of the study areas, we included all shorelines
in shoreline change rate analyses to provide the most representative measure of shoreline change
possible. (See Table 1 for a summary of shoreline metadata).
Following methods outlined by Moore et al. (2000), we calculated shoreline change rates
for each time period using the Digital Shoreline Analysis System (DSAS) for ArcGIS (Thieler et
11
al., 2000). Because a 1975 shoreline was not available for the Cape Fear location, we shifted our
breakpoint for Cape Fear to 1970 (consistent with the analysis of Moore et al., 2013). Prior to
calculating shoreline change rates, we projected all shorelines into the State Plane Coordinate
System and created an offshore baseline representing a visual average of all shorelines (i.e.,
representing the overall shape of the coast). Using DSAS, we then cast transects at 100 m
intervals from the baseline to intersect shorelines at a roughly perpendicular orientation. The
points where transects intersect the shorelines allow calculation of a linear regression rate (LRR)
of shoreline change (with erosion rates having negative values and accretion rates having positive
values) along each transect for each time period. Because we seek to quantify large-scale changes
in coastline shape, we focus our analysis on stretches of coast dominated by long-term, rather than
short-term (i.e., cape tip and inlet), processes. For this reason, we calculated rates of shoreline
change along all stretches of coast that are at least 2 km away from cape tips and beyond the zone
of inlet influence, which we qualitatively approximate as stretches of coastline where all
shorelines (across the time period of observation) on either side of an inlet are roughly parallel to
one another.
For some time periods and stretches of coast only two shorelines were available,
preventing calculation of LRRs (which requires a minimum of three shorelines) along the entire
stretch of coast (i.e., 100% of the coastline analyzed). In such instances, we calculated an end
point rate (EPR) instead (Table 2; see Supporting Information Section I for more detail). After
calculating shoreline change rates, we applied a Gaussian filter (1km for Cape Fear and Cape
Canaveral, and 600m for Fishing Point) to each set of rates to discern large-scale trends. Because
transects (and therefore shoreline change rates) within a window equal to one half of the filter
length are lost at the end of each dataset and adjacent to gaps within a data set (e.g. between
islands or on either side of an inlet-influenced shoreline), we chose a filter length that was as short
as possible (to minimize data loss but long enough to highlight general trends in shoreline change
12
rates across the study area. We applied the shorter filter length in the Fishing Point study area to
reduce data loss that would occur with the longer filter length across the short, discrete islands
that make up this stretch of coast.
Depending on the original data source, each shoreline has a positional uncertainty
associated with errors in georeferencing, digitization, t-sheet surveys, wet/dry line interpretation,
pixel size, lidar position and/or shoreline proxy offsets (e.g. Moore et al., 2000, Morton and
Miller, 2005; Moore et al., 2006, Limber et al., 2007, Fletcher et al., 2012). For some shorelines
positional uncertainty estimates were provided in associated metadata. When uncertainty
estimates were not provided, we estimated the maximum positional uncertainty based on
shoreline type using an established value from the literature, or we summed in quadrature
(following Morton and Miller (2005) and Fletcher et al. (2012)) estimates for all applicable errors
based on values available in the literature or values derived from our own analyses (as in the case
of most shorelines derived from aerial imagery for Cape Canaveral) (Tables 1 and 3). We then
used DSAS to calculate an uncertainty estimate at each transect for each shoreline change rate
(historical and recent) within a 90% confidence interval (as in Morton and Miller, 2005). Because
each filtered LRR or EPR shoreline change rate is derived from adjacent rates, actual uncertainty
estimates associated with the filtered rates presented in Figures 10-12 are lower than uncertainty
estimates on the raw rates. Thus, following Fletcher et al. (2012) we determined the uncertainty
estimate for each filtered rate according to:
(1) 𝑈𝑎𝑣𝑔 = √∑ 𝑈𝑖
2𝑛𝑖=1
𝑛
where U is the uncertainty and n is the number of transects used to determine the filtered rate. For
Cape Fear and Cape Canaveral, n= 10 (transects at 100m spacing, 1km filter) and, for Fishing
Point n =6 (transects at 100m spacing, 600m filter). Minimum, maximum and average Uavg for
filtered rates are reported in Table 4. We also calculated and reported Uavg for the cape-flank-
13
average filtered shoreline change rates presented for the north and south flank of each cape
(Figures 10-12). Though it provides a more representative estimate of uncertainty than simply
averaging uncertainty values, summing in quadrature involves the assumption that all transects
are independent. It is also highly influenced by the few very high uncertainty estimates in raw
and filtered shoreline change rates (e.g., Table 4). The former will tend to lead to underestimation
of uncertainty and the latter will tend to lead to overestimation.
To determine shifts in patterns of coastline change, we calculated the difference in
shoreline change rates (which we call shoreline change rate differences—SCRDs) between
historic and recent time periods by subtracting the historic rates of shoreline change from the
recent rates of shoreline change.
Positive (negative) SCRD values indicate that the coastline is becoming increasingly
accretional or less erosional (increasingly erosional or less accretional) since the observed onset
of an increasingly asymmetric wave climate. If the rate of shoreline advance/retreat is the same
from the historic to the recent, then the SCRD will be zero. We used Uavg for the average
shoreline change rates by flank to calculate Uavg for the average shoreline change rate differences
(SCRDs) by flank (Figures 10-12).
Beach Nourishment Data
We downloaded data regarding the timing and volume of beach nourishment along both
flanks of Cape Fear from the Program for the Study of Developed Shorelines (PSDS, 2012).
Between 1939 and 2010, approximately 70% of the Cape Fear study area was nourished at some
point. Data from PSDS include nourishment volumes and the length of coastline along which
nourishment sand was distributed for individual communities. We divided the episodes of
nourishment into five-year bins to more easily discern general trends in nourishment volume
through time (Figure 2). We then determined the cumulative nourishment sand volume along both
14
flanks of Cape Fear and calculated regression rates for each of three time periods having different
rates of sand emplacement.
To discern spatial patterns in nourishment activity we separated the nourishment episodes
by community. We then selected a representative community length to calculate a normalized
nourishment volume per meter of shoreline per community. We chose the community length by
determining the greatest alongshore length of a single nourishment episode as given for each
community in the PSDS (2012) data. We did not analyze nourishment volumes on the southern
flank of Cape Fear because nourishment activities there began only after the onset of the observed
changes in wave climate.
Wave Climate Change Analysis
Komar and Allan (2008) analyzed data from wave buoys, yet their analysis did not include
areas in the vicinity of Fishing Point and Cape Canaveral, presumably because wave buoys are
not available in these locations. To analyze both for an increase in wave height and direction in
the vicinity of Fishing Point and Cape Canaveral, we gathered data from 41 U.S. Army Corps of
Engineers Wave Information Study (WIS) stations (22 from FP and 19 from Cape Canaveral).
(WIS data can be downloaded from wis.usace.army.mil). Using measured wind speed and
directional data, WIS stations provide hindcasts of significant wave height at 3-hour intervals
from ~1980 to 1999. Following the analysis of buoy data by Komar and Allan (2008), for each
station we calculated a linear regression for both summer season (July-Sept) and hurricane season
(June – Nov.) significant wave height. We then separated waves greater than 3m in height,
identified as hurricane-generated waves when occurring in the summer months (Komar and Allan,
2008), and determined the rate of wave height increase (Figures 3 and 4). All trends are
significant at the 95% confidence level using the Wilcoxon rank-sum test.
15
To assess the directional effects of increases in summer (or hurricane) season significant
wave heights on wave climate, we examined changes in wave approach angle. We identified a
general shoreline trend (28° for Fishing Point and 340° for Cape Canaveral), which was used to
determine the relative wave approach angle. We calculated probability distribution functions
(PDFs; representing the relative influence on alongshore sediment flux from different offshore
wave-approach directions) for the overall annual wave climate, the summer months (July – Sept.),
the non-summer months (Oct. – June) (Figures 5 and 6), hurricane season (June – Nov.) and non-
hurricane season (Dec. – May). (See Section II of Supporting Information for analyses of data
from all WIS stations used in this study.)
Coastline Evolution Model Simulations
We used the Coastline Evolution Model (CEM) (Ashton and Murray, 2006a) to predict
how historical nourishment patterns, such as those occurring in the vicinity of Cape Fear, would
likely alter shoreline change rates in the presence and absence of changes in wave climate. CEM
uses a probability distribution function (PDF) to select a daily offshore wave direction and angle
(relative to a general alongshore domain), calculates wave shoaling and refraction over assumed
shore-parallel contours until depth-limited breaking occurs, and then uses the CERC equation to
calculate alongshore sediment transport (Ashton and Murray, 2006a). The wave-climate PDF can
be based on observed or hindcast wave data; it can be constructed to reproduce the relative
influence on alongshore sediment transport from waves within specified wave-angle bins.
Although the same set of waves occurring in different sequences produce different cross-shore
profile shapes over timescales of months (Southgate, 1995), previous experiments with CEM
(unpublished) have shown that when addressing large-scale, long-term coastline plan-view
morphodynamics, the sequencing of waves (e.g. temporal correlation of wave-angle directions to
represent storms vs. random selection from within the PDF) do not affect model results. Within
16
the model, perturbations in coastline shape that extend offshore can shadow adjacent coastline
segments from incoming wave energy, altering the net rates of alongshore sediment transport
(Figure 7). Gradients in alongshore sediment flux determine shoreline movement. Erosion and
accretion are assumed to extend along the equilibrium shoreface profile and the profile shape
remains constant. Starting with a simplified, straight, sandy coastline and using a PDF based
loosely on wave hindcast statistics from WIS station 509, we generated a cuspate Carolina-like
coastline for use as an initial condition (Slott et al., 2010; Ells and Murray, 2012). This initial-
condition coastline exhibits the main morphological characteristics of the Carolina Capes, but is
not intended to be a detailed simulation of that particular coastline. The modeling focuses on
alongshore sediment transport processes, intentionally omitting many processes and boundary
conditions believed to play a secondary role in large-scale sandy-coastline evolution. Our goal is
to generate broadly applicable insights rather than to investigate Cape Fear specifically, and in
addition model simplifications combined with inevitable limitations of wave-climate data would
prevent any attempt to use the observed coastline as an initial condition (without having the
interesting climate-change signals swamped by model spin-up adjustments of the morphology to
the input wave forcing). For model runs including wave climate change, we initiated a linear
increase in the probability of waves approaching from the east and northeast starting in 1970
(Figure 8).
To simulate beach nourishment we chose two locations (along the northern flank of the
modeled cuspate feature chosen to represent Cape Fear) that approximate the alongshore position
of Wrightsville Beach (“Town 1”) and Carolina Beach (“Town 2”) relative to the cape tip,
because these two communities have a history of nourishing in large quantities (Figure 1 and
Figure 9). In each simulation, at each time step, CEM calculated the volume of sand required to
stabilize the nourished stretches of coastline (to maintain the shoreline position that existed at the
time nourishment began), recorded that volume, and instantaneously added that volume of sand to
17
the shoreline (implicitly spread across the shoreface) to maintain the initial shoreline position.
(This nourishment algorithm is only applied within the coastline segments designated as
‘stabilized’, although these local actions also tend to stabilize surrounding stretches of coastline
through their effects on nearby shoreline orientations and therefore patterns of alongshore
sediment transport.) We ran two initial simulations, one without and one with wave climate
change. In these simulations, we began nourishment immediately and constrained the extent of
nourishment within each ‘town’ to limited alongshore zones (dark grey bars in Figure 9). To
explore the effect of observed increases in nourishment rate in neighboring communities with
time (e.g. Figure Eight Island and Kure Beach), we ran a third simulation in which nourishment
was constrained for the first 45 years to the limited alongshore zones but then expanded in model-
year 1985 (to the areas represented by light grey bars in Figure 9).
Results
Shoreline Change
During the historical time period (pre-1970), shoreline change rates for Cape Fear are
largely erosional (Figure 10a). The southern flank has a fairly uniform erosion rate of
approximately -0.5 to -1.5 m/yr and though erosion is also widespread on the northern flank, most
locations are only slightly erosional (0 to -0.5 m/yr). The few erosion hotspots on the northern
flank appear to be associated with historical inlet migration. In contrast, recent rates of shoreline
change along the southern flank are close to zero or accretional, and in some areas rates are
greater than 1.5 m/yr (Figure 10b). The northern flank is also accretional in the recent time period,
but a localized zone of high erosion rates occurs south of the Masonboro Inlet Jetty. The shoreline
change rate difference (SCRD) indicates that much of the coastline to the north and to the south of
Cape Fear has become more accretional since 1970 (Figure 10c). The recent erosion hotspot on
the northern flank just south of Masonboro Inlet appears as an isolated location of highly negative
18
SCRD values, indicating that this erosional trend has developed since 1970. Whereas a more
accretional southern flank is consistent with an increasingly asymmetric cape (Moore et al., 2013;
Slott et al., 2006), the recent accretional trend on the northern flank appears inconsistent with the
hypothesized adjustment to a changing wave climate (in the absence of shoreline stabilization).
Farther to the north in the area surrounding Fishing Point, a different pattern of shoreline
change emerges (Figure 11). For the historic time period, the northern flank can be divided into a
southern zone of moderate accretion (up to >2.5 m/yr) a mid-zone of moderate erosion (up to -1.5
m/yr) and a northern zone of little change (0.5 to -0.5 m/yr) (Figure 11a). Prior to 1975, the area
south of Fishing Point was highly erosional (-1.9 to -5 m/yr) except for Parramore Island at the
southern end, which was moderately accretional (1.5 to 2.5 m/yr). Since 1975, the entire study
area, except for a few short stretches (all less than 1.5 km in length), has been erosional, with the
greatest rates of erosion (up to -12.5 m/yr) occurring at the southern end of the south flank near
Parramore Island (Figure 11b). This large increase in the rate of erosion across the study area is
highlighted by negative SCRD values along both the northern and southern flanks (Figure 11c). A
prominent and well-documented exception to this is Wallops Island, where the historically high
rate of more than -2.5 m/yr has been reduced to values near zero (-0.5 – 0.5 m/yr) in the recent
past as a result of shoreline stabilization efforts designed to protect the NASA Wallops Flight
Facility (NASA, 2010). Because the barrier islands along the southern portion of this study area
are limited in spatial extent and because inlets have heavily influenced much of the southern
portion of the study area over time, there are significant data gaps along the southern flank. As a
result, rates are limited in spatial coverage and may not necessarily be representative of overall
coastal change in the region.
In the historic time period (prior to 1970), shoreline change rates for Cape Canaveral are
generally low (between 1.5 and -0.5 m/yr) except near the cape tip itself (Figure12a). High rates
of accretion near the cape tip on the southern flank gradually decrease southward to near zero
19
(-0.5 m/yr), whereas the high erosion rates near the cape tip on the northern flank (-1.5 to -2.5
m/yr) rapidly decrease northward becoming near zero (0 to -0.5 m/yr) and then moderately
accretional (0.5 to 2.5 m/yr). (Note: in the northernmost extent of the study area, only two
shorelines were available for each time period (1875 and 1924 and 1999 and 2004) and therefore
shoreline change rates along this stretch are EPRs rather than LRRs.) Patterns of recent shoreline
change along the southern flank of Cape Canaveral are similar to the historic patterns—rates are
highly accretional immediately south of the cape and transition to roughly zero (±0.5 m/yr)
southward (Figure 12b). Although the flank-averaged rates of change for the northern flank are
similar between the two time periods, shoreline change rates are more variable alongshore since
1970 with greater extremes in rates of erosion and accretion (e.g., -2.5 to >2.5 m/yr). Immediately
north of the cape tip SCRDs indicate the area is increasingly less erosional compared to the
historical time period, whereas a short stretch immediately south of False Cape is more erosional
(by -1.5 m/yr to -2.5 m/yr) (Figure 12c). Another zone of slightly enhanced accretion occurs
along False Cape itself whereas a zone of enhanced erosion (-0.5 m/yr to -2.5 m/yr) occurs
immediately to the north. These observations are in agreement with the analyses of Absalonsen
and Dean (2010).
Wave Climate
Our wave analysis for Fishing Point is consistent with the range of values reported to the
north and south by Komar and Allan (2008) and suggests that increases in summer season (July –
Sept.) and hurricane generated (summer waves >3 m) wave height within the vicinity of Fishing
Point (WIS Stations 163, 165-178, 180-188) were small (between 0.015 and 0.021 m/yr) (Figure
3). Our analysis for Cape Canaveral (WIS Stations 416-418, 430-440, 518-521) suggests an
average increase of 0.009 m/yr in summer season significant wave height, and a greater average
increase of 0.050 m/yr in hurricane-generated wave height (Figure 4). When we extended our
20
analysis of stations in the vicinity of Cape Canaveral to include the entire hurricane season (June
– Nov.), results were similar – indicating an average increase of 0.008 m/yr in overall hurricane
season waves, and an average increase of 0.05 m/yr in hurricane-generated waves.
We examined PDFs representing the relative influences on alongshore sediment flux from
different offshore wave approach angles for the Fishing Point and Cape Canaveral wave climate
data (Figures 5 and 6) to assess the effect of increases in hurricane-generated-wave height on the
relative influence of waves on alongshore transport. The analysis reveals an annually bimodal
wave climate at Fishing Point, with a greater contribution from waves approaching from the left
(northeasterly) (Figure 5a). During non-summer months, the wave climate is similar to the annual
wave climate (Figure 5b). During the summer months the wave climate appears more strongly
bimodal in comparison to the annual wave climate with more waves approaching from high
angles and the right (south) (Figure 5c). Hurricane-generated waves (those > 3m) approach from
predominantly high angles, with a greater proportion from the east and northeast (left) than the
south (right) (Figure 5d). Near Cape Canaveral, the wave climate appears low-angle and slightly
asymmetric, with a greater influence of waves coming from the left (north/northeast) relative to
the general orientation of the shoreline (Figure 6a). The PDF of wave direction for non-summer
months is similar to the annual analysis, displaying only a small change in the proportion of
waves approaching from the left at high angles (Figure 6b). Conversely, the PDF of wave
direction for summer months suggests a slight increase in high-angle waves from the left
(north/northeast) (Figure 6c) while the hurricane-generated waves approach shore from
predominantly low-angles with a slight asymmetry to the left (north/northeast) (Figure 6d).
Nourishment Observations and Modeling
We identified three distinct trends in the binned beach nourishment data (Figure 2). From
~1935 to 1960, the rate of nourishment was low (32,000 m3/yr) because relatively few
21
nourishment episodes took place during this time period. After 1960, the rate of beach
nourishment in the vicinity of Cape Fear increased by an order of magnitude (to 415,000 m3/yr)
and nearly doubled after 1980 (to 690,000 m3/yr). Along Wrightsville Beach and Carolina Beach,
nourishment has taken place since the 1930s, and the 1950s, respectively, with major episodes of
nourishment continuing to present day. The spatial distribution of nourishment through time
indicates that nourishment along Wrightsville Beach and Carolina Beach accounts for over 70%
of the total volume of sand emplaced along the northern flank of the cape (34% and 37%,
respectively). Because it has the longest history of human alteration of the three study areas, we
focused model simulations on the northern flank of Cape Fear to test our hypothesis that the
absence of a pattern of shoreline change rates consistent with Moore et al. (2013) suggests that
beach nourishment is compensating for—and therefore masking—the effects of changing wave
climate along Cape Fear.
As discussed above in the methods section, we conducted model simulations without and
with a changing wave climate (i.e., steady vs. increasingly asymmetric wave climate) as well as
with and without spatial expansion of nourishment. For model simulations in which the wave
climate was steady, the resulting trend in cumulative beach nourishment volume is roughly linear
(dashed black line, Figure 13), implying a temporally consistent tendency for the shoreline to
retreat, which is counteracted by a relatively consistent input of sand through time. Through the
updrift and downdrift effects of shoreline stabilization, the localized nourishment in these model
runs effectively prevents the erosion of the whole flank of the cape updrift of the cape tip (the
‘northern’ flank)—erosion that would otherwise occur as the cape features migrate downdrift (e.g.
Ashton and Murray, 2006a). However, for model simulations in which the wave climate becomes
increasingly asymmetric (Figure 8), the rate at which sand needs to be added to maintain the
initial shoreline position increases throughout the simulation (dotted black lines, Figure 13). The
increase in the rate of sand input occurs shortly after the initiation of wave climate change in the
22
model (1970), in response to the tendency for erosion rates along the north flank to increase under
the increasingly asymmetric wave climate. The black dotted line with open circles (Figure 13)
indicates the cumulative volume of sand input that is required to stabilize the shoreline when we
include the 1985 expansion of nourishment zones in the wave climate change simulation. For
comparison, we also show in Figure 13 (solid black line), the observed trend in cumulative
nourishment volume for both towns combined (from Figure 8).
From 1940-1960, the rate of sand input in all three simulations is considerably larger than
the actual rate of nourishment (Figure 13, dashed black line vs. solid black line). Around 1965
there is a rapid increase in observed cumulative nourishment volume and the difference between
observations and model simulations is reduced. Starting around 1985, the slope of the observed
trend in cumulative nourishment volume and the slope of the trend in model-generated cumulative
nourishment volume for both simulations including wave climate change (Figure 13, dotted black
line and dotted black line with circles) are similar, indicating that nourishment rates in the
simulations approximately equal those observed during this time period. The match between
observed and model-generated volumes is considerably less good for the simulation in which
wave climate change is not included (Figure 13, continuation of the dashed black line).
Throughout the three simulations we tracked model- generated cumulative nourishment
volumes for each town for comparison with observed nourishment volumes for each town (Figure
13, blue and green lines). Modeled nourishment volumes for Town 1 (representing Wrightsville
Beach)—with and without wave climate change (dotted and dashed blue lines, respectively)—are
initially (1940 - ~1980) larger than observed volumes (solid blue line). Beginning around 1980
there is a large increase in the observed cumulative volume and the trends switch such that the
observed cumulative volume becomes greater than model- generated cumulative volume. In the
case of Town 2 (which approximates Carolina Beach,) model- generated cumulative nourishment
volume is higher than the observed cumulative volume throughout time (except after 1980 in the
23
simulation without wave climate change) (Figure 13, green lines). Thus, it is the combination of a
slight-under prediction in the vicinity of ‘Town 1’ and a slight over-prediction since 1980 in the
vicinity of ‘Town 2’ that results in an overall rate of model- generated nourishment volume that
matches the observations. The fact that the total combined rate of nourishment from both towns
together matches the observations better than either town individually—combined with the result
that the combined nourishment rate does not depend significantly in the model on whether the
nourished areas are expanded in 1985 or not (solid line and circles in Figure 13 nearly
coincide)—supports the conclusion that the localized nourishments, in concert, effectively
prevent erosion along the whole ‘northern’ flank of the cape, through the updrift and downdrift
effects associated with alongshore sediment transport.
Discussion
Moore et al. (2013) examined two prominent cape features and found significant changes
in coastline evolution that are consistent with observed changes in Atlantic Ocean wave climate.
Here we have extended that analysis to assess the signature of wave climate change in the
evolution of cuspate coastlines under different conditions.
Limitations
The extent and accuracy of the shoreline change analysis is limited by the number of
shorelines available. Increasing the number of shorelines lends increased accuracy to analysis
(Dolan et al., 1991), but not all shorelines extend along the entire study area. While use of LRRs
to compute shoreline change is widely accepted, it is subject to the influence of outliers.
Assumptions of a linear trend in shoreline change may not reflect trend reversals or capture
cyclical changes in shoreline position (Dolan et al., 1991). However, including as many
24
shorelines as possible over the longest time span available reduces these biases (Dolan et al.,
1991)
Moore et al. (2013) defined their breakpoint, between recent and historic shoreline change
analyses, at 1975 because the observations of wave height began in 1975 (Komar and Allen,
2008). Because a 1975 shoreline is not available for Cape Fear, we instead used a breakpoint of
1970 for this study area. If wave height began increasing prior to 1975, the use of an earlier
breakpoint would increase the contrast between the two time periods and therefore enhance the
signature of a geomorphic response. If wave height began increasing closer to 1975, then our
inclusion of 1970 in recent shoreline change calculations reduces the difference between the
historic and recent time periods, likely decreasing the strength of any geomorphic signature.
However, across such temporal-spatial scales (of years to decades and tens of kilometers) a
breakpoint in 1970 instead of 1975 should have negligible impact on our results.
The use of buoy data for wave climate analysis does have several shortcomings.
Instrumentation changes, gaps in measurements and changes in measurement calculations can
introduce error into data, making it appear that increases in wave heights are larger than when
these sources of error are corrected for (Gemmrich et al., 2011). In addition, WIS station (509)—
used as a guide for choosing wave climate parameters that produce a Carolina-like coast—is
located at a position where water depth is considerably deeper than the base of the shoreface.
After daily wave angles are selected from the PDFs generated from WIS data, CEM refracts these
waves across shore-parallel bathymetric contours, so that wave data from the base of the
shoreface would be more appropriate. However, wave data collected at a location near the base of
the shoreface, and therefore closer to the shoreline, would not (because of wave-shadowing
effects) receive a distribution of waves that is representative of the wave climate affecting the
coastline more broadly. Thus, we use WIS station 509 as a rough basis for our wave climate
parameters, despite the shortcomings. Since our goal was to use model simulations to explore the
25
generic large-scale response of a cuspate coastline to repeated nourishment episodes in the
absence and presence of wave climate change (rather than a site-specific investigation of Cape
Fear), the potential inaccuracies inherent in buoy records (Gemmrich et al., 2011), and those
introduced by the assumption of shore-parallel contours, are likely inconsequential to the main
results of our analysis.
Nourishment data gathered from PSDS (2012) was grouped by community and into 5-year
bins, somewhat reducing the temporal resolution of the data. To represent nourishment in model
simulations, we generalized the extent of nourishment by selecting two zones within which
nourishment would take place. Because over 70% of the volume of sand emplaced on the
northern flank of Cape Fear was emplaced within these zones, we do not expect this
generalization to affect our results in a meaningful way.
Coastline Response to Wave Climate Change
Moore et al. (2013) found that Cape Hatteras and Cape Lookout have become increasingly
asymmetric since 1975 in response to an increasingly erosional (accretional) pattern of shoreline
change on the northern (southern) flanks of each cape. To link their observations to a change in
wave climate, Moore et al. (2013) used CEM to confirm that the increasingly asymmetric shape
of these cape features could result from an increasingly asymmetric high-angle wave climate
reflective of the Komar and Allan (2008) observations. In contrast to Capes Hatteras and
Lookout, the SCRD values for Cape Fear are generally accretional on both flanks (Figure13).
While an increasingly accretional southern flank is consistent with an increasingly asymmetric
cape, the more accretional signal along the northern flank (with the exception of the more
erosional area south of Masonboro Inlet jetty) initially appears inconsistent with the findings of
Moore et al. (2013).
26
CEM simulations for the evolution of a nourished, cuspate coastline match observations of
shoreline change and beach nourishment trends best when a change in wave climate (consistent
with observations; Komar and Allan, 2008) is included (Figure 13). The simulation results
provide support for our hypothesis that beach nourishment activities have masked an erosional
signal that may have been otherwise visible in recent shoreline change observations along the
northern flank of Cape Fear. To stabilize the shoreline, simulations without a change in wave
climate require a steady rate of nourishment to prevent local erosion, which is inconsistent with
observations (Figure 13). In contrast, simulations including an increasingly asymmetric wave
climate result in nourishment rates that increase monotonically, consistent with observations of
cumulative beach nourishment volume emplaced. This suggests that increasing amounts of sand
are needed per nourishment episode to stabilize a stretch of coastline that is increasingly out of
equilibrium with changing conditions.
From 1940-1960 (an era without a record of increasing summer season significant wave
heights) in all simulations, observed nourishment volumes are lower than the modeled volumes
needed to maintain a stable shoreline (Figure 13) which suggests the coast was eroding during
that time and that nourishment was not undertaken at a rate sufficient to counter landward
shoreline motion. This could be due in part to a smaller coastal population and lack of concern
over erosion, or to limited technology available to extract and emplace sand resources at a rate
sufficient to counter erosion. From 1960 to ~1985 observed rates of nourishment dramatically
increase until the cumulative volume approaches model-generated volumes. This may represent a
shift in population, decision-making and/or availability of technology, which led to emplacement
of sand via nourishment at a rate sufficient to make up for shoreline erosion in the previous
decades. After approximately 1985—the period in which the full spatial extent of nourishment for
each town was allowed (in the third simulation) to be consistent with the observed timing and
27
location of nourishment—observed and model-generated nourishment volumes are closely
aligned both in magnitude and trend (Figure 13).
Although shoreline change observations alone do not reflect the geomorphic signature of
an increasingly asymmetric wave climate, model-generated and observed increases in the rate at
which sand was emplaced through time suggest that the coast was becoming increasingly
erosional. With the exception of one location on the north flank of Cape Fear where nourishment
has not taken place (i.e. south of Masonboro Inlet, which is downdrift of an inlet where jetties
partially block alongshore transport) nourishment artificially stabilized the whole coastline
segment updrift of the cape (reflected in shoreline change patterns) thereby compensating for
coastline changes that would have otherwise occurred. In this case, coastline response to changing
wave climate appears to be discernible via changes in the volume of sand emplaced via beach
nourishment activities through time. These potential insights extend beyond the context of cuspate
capes subject to changing wave climates. On any sandy, wave-dominated coastline where erosion
rates are increased (by either increased rates of sea-level rise or by changing storm/wave
climates), even localized stabilization, through its updrift and downdrift effects, will tend to at
least partially mask coastline response to climate change—converting the response into one that
occurs chiefly in the human component of the system.
Though the increase in summer season significant wave height has been smaller in the
vicinity of Fishing Point than elsewhere, based on our analysis of WIS data, an increase in
hurricane-generated waves would likely result in a slight increase in the influence of waves
coming from the east and northeast (Figure 5d). If this shift were sufficient to alter patterns of
erosion and accretion we would expect it to produce a pattern of increasing erosion/less accretion
on the northern flank and decreased rates of erosion/more accretion on the southern flank
proximal to the cape, in a pattern similar to that observed for the Carolina capes. This is consistent
with the pattern of SCRD values on the northern flank as well as with the increasing rates of
28
southward migration of Fishing Point in recent decades (Leatherman et al., 1982). Although the
high rates of shoreline change locally occurring on Parramore Island in the southern portion of the
study area are inconsistent with the pattern of shoreline change we might expect in response to
changing wave climate, this stretch of coast is heavily influenced by inlets and the rotation of this
island’s shoreline around a central axis (i.e., alternating patterns of erosion and accretion at the
north and south ends) (Leatherman et al., 1982), the effects of which would likely overwhelm the
subtlety of a long-term signal of wave climate change such as we have sought to detect. In
addition, Parramore Island may be experiencing increased erosion rates in response to southward
extension of the cape feature through time which results in a southward shift of the wave-shadow
zone (and thus locally high, negative alongshore sediment transport gradients at the down-drift
edge of the wave-shadow zone). Given the more subtle nature of changes in wave climate in this
area, factors other than changing wave climate may also explain the enhanced erosion rates along
the northern flank in recent decades. For example, Fishing Point is located in a zone of
accelerating sea level rise, related to weakening of ocean circulation patterns in the Atlantic
(Sallenger et al., 2012; Ezer et al., 2013) and because this is a region of low-lying islands,
negative feedbacks related to overwash frequency and dune-grass species composition may be
contributing to widespread shoreline retreat (Wolner et al., 2013).
The changes in wave climate in the vicinity of Cape Canaveral differ from those observed
near Cape Fear and Fishing Point. Directional wave analysis suggests that the wave climate
(overall, summer months, and hurricane-generated) is dominated by low-angle waves. However,
consistent with analyses by Absalonsen and Dean (2010), our shoreline change analysis does not
reveal shoreline retreat at the False Cape protrusion, but rather shoreline stability and possible
advancement, despite the low-angle wave climate. Perhaps more interesting, is the occurrence of
Cape Canaveral in the presence of a low-angle wave climate. This appears contrary to findings by
Ashton et al. (2001) who suggest that cape features on sandy coastlines originate from a high-
29
angle wave climate. We offer two hypotheses to explain this apparent discrepancy: (1) It is
possible that Cape Canaveral and False Cape persist in their current configuration because of
underlying geologic control, such as the presence of the Anastasia Formation in the Cape
Canaveral vicinity, which may impede ‘natural’ barrier island formation farther south (Finkl et
al., 2008; Lovejoy, 1983). For example, if locally ‘hard’ geology tended to pin the shoreline
location (thereby locally reducing erosion, relative to areas updrift and downdrift) a protruding
portion of the shoreline would develop, with a smooth updrift shape analogous to that updrift of a
groin or jetty—potentially explaining the presence of False Cape and the shape of the shoreline
updrift. The orientation of the shoreline just downdrift of the protrusion, then, would tend to
become increasingly oblique relative to the regional coastline trend. The relative angles between
the approaching waves and the reoriented coastline could ultimately tip toward high-angle
dominance, possibly producing the growth of a subsidiary cape on the downdrift flank of the
protrusion—potentially explaining the formation of Cape Canaveral under what is a low-angle
wave climate with respect to the overall coastline trend. (2) The effects of refraction of the
assailing wave field by cape-associated shoals may alter the pattern of alongshore sediment
transport (AST), setting up AST gradients conducive to a pattern of perturbation growth (Kline et
al., in review). Both of these hypotheses offer explanations for shoreline change rates, and SCRD
values to differ from what might be expected under an increasingly low-angle wave climate.
However, further exploration of this deviation is beyond the scope of this manuscript.
Overall, our analysis suggests that coastline response to a changing wave climate, as well
as the detectability of coastline response, is dependent on numerous factors including the effects
of human intervention and geology. In some regions (e.g. Cape Fear, NC) coastline response to a
changing wave climate may not be observable directly from shoreline change rates, but might
instead be evident in records of shoreline stabilization efforts. Cape Canaveral and Fishing Point
appear to be subject to changes in wave climate, but local factors (i.e. less-pronounced changes in
30
wave climate, underlying geology, or the presence of complex nearshore bathymetry) may be
suppressing coastline response to these changes.
If changes in mid-Atlantic wave climate continue, new and continued shifts in alongshore
patterns of erosion and accretion may occur and extend beyond cuspate features, resulting in
regional changes in the location of erosional ‘hot spots.’ This would likely alter the spatial
distribution of beach nourishment activities, potentially leading to new areas of nourishment and
increasing competition for available nourishment sand (e.g. McNamara et al., 2011). If predicted
increases in hurricane activity (e.g., Emanuel, 2013) and sea level rise (IPCC,2014) are realized,
wave climate change, coastal erosion, and the consequent coupling of the human and coastline
systems may be enhanced along sandy coastlines in the future.
Conclusions
Using a combination of shoreline change analysis, nourishment observations, wave
analysis and model simulations we have provided support for our hypothesis that the effect of
changes in wave climate may be discernible in changing patterns of shoreline stabilization along
developed cuspate coastlines (e.g., Cape Fear, NC). Along some cuspate coastlines (e.g., Fishing
Point, MD/VA; Cape Canaveral, FL) wave climate may be changing, but local variations in a
range of factors appear to prevent us (at this time) from detecting any specific change in shoreline
behavior that we can reliably attribute to shifts in wave climate. As climate change leads to
potentially more frequent and/or more intense hurricanes in the future, we can expect changes in
wave climate to continue, resulting in more dramatic shifts in alongshore sediment transport
gradients, thereby extending the effects of wave climate change to sandy coastlines in general.
Changes to wave climates, in conjunction with SLR, have the potential to lead to increased
coastal erosion, and will influence future human-coastline interaction. How humans respond to
these changes will also significantly impact coastline shape.
31
Acknowledgements
We gratefully acknowledge funding for this work provided by a grant from the Geomorphology
and Land Use Dynamics Program of the National Science Foundation (#EAR 1053141) and the
Martin Fund in Geological Sciences at the University of North Carolina Chapel Hill. We thank
Tamlin Pavelsky and Tony Rodriguez for feedback on earlier versions of this manuscript. We
thank Editor Lane and two anonymous reviewers for their thoughtful comments and suggestions,
which improved the final version.
References
Absalonsen, L., and Dean, R. G. 2010. Characteristics of the Shoreline Change Along the Sandy
Beaches of the State of Florida: An Atlas, No. FLSGP-M-10-001, pp. 1–304. National Sea
Grant Library.
Adams P. N., Inman, D. L. and Lovering, J. L. 2011., Effects of climate change and wave
direction on longshore sediment transport patterns in Southern California, Climatic Change,
109, 211-228. DOI: 10.1007/s10584-011-0317-0
Assateague Island National Seashore (ASIS) 2012. ASIS shoreline data can be downloaded by
contacting park personnel at http://www.nps.gov/asis/naturescience/resource-management-
documents.htm.
Ashton, A., Murray, A. B. and Arnault, O. 2001. Formation of coastline features by large-scale
instabilities induced by high-angle waves, Nature, 414, 296-300.
32
Ashton, A. D., and Murray, A. B. 2006a. High-angle wave instability and emergent shoreline
shapes: 1. Modeling of sand waves, flying spits, and capes, Journal of Geophysical
Research, 111(F04011).
Ashton, A. D., and Murray A. B. 2006b. High-angle wave instability and emergent shoreline
shapes: 2. Wave climate analysis and comparisons to nature, Journal of Geophysical
Research: Earth Surface, 111(F4), 2156 - 2202.
Bromirski, P.D. and Kossin J.P. 2008. Increasing hurricane wave power along the U.S. Atlantic
and Gulf coasts, Journal of Geophysical Research, 113 (C07012), doi:10.1029/JC004706
Cox, A.T. and Swail V.R. 2001. A global wave hindcast over the period 1958 – 1997:
Validation and climate assessment, Journal of Geophysical Research, 106 (C2), pp. 2313
– 2329
Dolan, R., Fenster, M.S. Holme, S.J. 1991. Temporal Analysis of Shoreline Recession and
Accretion, Journal of Coastal Research, 7 (3), 723 – 744.
Ells, K., and Murray, A. B. 2012. Long-term, non-local coastline responses to local shoreline
stabilization, Geophys. Res. Lett., 39(19), L19401.
Emanuel, K. 2005. Increasing destructiveness of tropical cyclones over the past 30 years, Nature,
436, 686-688.
Emanuel, K.A. 2013. Downscaling CMIP5 climate models shows increased tropical cyclone
activity over the 21st century, Proc. Nat. Acad. Sci., 110, doi/10.1073/pnas.1301293110.
33
Ezer, T., Atkinson, L. P. Corlett, W. B. and Blanco, J. L. 2013. Gulf Stream's induced sea level
rise and variability along the U.S. mid-Atlantic coast, Journal of Geophysical Research:
Oceans, 118, 685-697.
Finkl, C.W., Becerra, J.E., Achatz, V. and Andrews, J.L. 2008. Geomorphological Mapping along
the Upper Southeast Florida Atlantic Continental Platform; I: Mapping Units,
Symbolization and Geographic Information System Presentation of Interpreted Seafloor
Topography, Journal of Coastal Research, 24 (6) 1388 – 1417.
FitzGerald, D.M, Fenster, M.S., Argow, B.A., Buynevich, I.V. 2008. Coastal impacts due to sea-
level rise, Annu. Rev. Earth Planet. Sci., 36, pp. 601-647, doi:
10.1146/annurev.earth.35.031306.140139
Fletcher, C.H., Romine, B.M., Genz, A.S., Barbee, M. M., Dyer, M., Anderon, T.R., Lim, S.C.,
Vitousek, S., Bochiccino, C. , Richmond, B. 2012. National Assessment of Shoreline
Change: Historical Shoreline Change in the Hawaiian Islands. U.S. Geological Survey Open
File Report 2011-1051.
Florida Fish and Wildlife (FF and W), Florida Shoreline (1:12,000). Marine Resources
Geographic System Internet Map Server.
http://ocean.floridamarine.org/mrgis/Description_Layers_Marine.htm
Gemmrich, J., Thomas, B., and Bouchard, R. 2011, Observational changes and trends in
northeast Pacific wave records, Geophysical Research Letters, 38 (L22601),
doi:10.1029/2011GL049518
Hapke, C.J., Katzmann, M.G., and Himmeltoss, E.A. 2013. Geomorphic and human influence on
large-scale coastal change, Geomorphology, 199, 160 – 170
34
Hayes, M.O. 1979. Barrier island morphology as a function of tidal and wave regime. In: Barrier
Islands from the Gulf of St. Lawrence to the Gulf of Mexico, S.P. Leatherman (ed). New
York: Academic Press. Pp. 1-27.
IPCC 2014. Sea Level Change. In Climate Change 2013: The Physical Science Basis.
Contribution of Working Group I to the Fifth Assessment Report of the Intergovernmental
Panel on Climate Change, (New York, NY, USA: Cambridge University Press).
Kemp, A. C., Horton, B. P., Culver, S. J., Corbett, D. R., van de Plassche, O., Gehrels, W. R.,
Douglas, B. C., and Parnell, A. C., 2009. Timing and magnitude of recent accelerated sea-
level rise (North Carolina, United States), Geology, 37(11), 1035-1038,
doi:10.1130/g30352a.1.
Kline, S. W., Adams, P. N., and Plant, N. G. (In Review), Influence of complex inner-shelf
bathymetry on the geomorphic evolution of a prominant cuspate foreland and adjacent
shoreline, Journal of Geophysical Research – Earth Surface.
Knutson, T. R., McBride, J. L., Chan, J., Emanuel, K., Holland, G., Landsea, C., Held, I., Kossin,
J. P., Srivastava, A. K. and Sugi, M. 2010. Tropical cyclones and climate change, Nature
Geoscience, 3, 157 - 163.
Komar, P. D., and Allan, J. C., 2008. Increasing Hurricane-Generated Wave Heights along the
U.S. East Coast and Their Climate Controls, Journal of Coastal Research, 24(2), 479-488,
doi:10.2112/07-0894.1.
Leatherman, S. P., Rice, T. E., and Goldsmith, V. 1982. Virginia Barrier Island Configuration: A
Reappraisal, Science, 215(4530), 285-287.
35
Limber, P., List, J., Warren, J., Farris, A., and Weber, K. 2007. Using Topographic LIDAR Data
to Delineate the North Carolina Shoreline. Coastal Sediments '07, 1837-1850. doi:
10.1061/40926(239)144
Lovejoy, D.W. 1983. The Anastasia Formation in Palm Beach and Martin counties, Florida.
Miami Geological Society Memoir, 3, 58-72.
Magliocca, N. R., McNamara, D. E. and Murray, A. B. 2011. Long-Term, Large-Scale
Morphodynamic Effects of Artificial Dune Construction along a Barrier Island Coastline,
Journal of Coastal Research, 27(5), 918-930, doi:10.2112/jcoastres-d-10-00088.1.
McGranahan, Balk, G., D. and Anderson, B. 2007. The rising tide: assessing the risks of climate
change and human settlements in low elevation coastal zones, edited, pp. 17-37,
Environment and Urbanization, doi:10.1177/0956247807076960.
McNamara, D., Murray, A. B. and Smith, M. D. 2011. Coastal sustainability depends on how
economic and coastline responses to climate change affect each other, Geophysical
Research Letters, 38, doi:10.1029/2011GL047207.
McNamara, D. and Keeler, A. 2013. A coupled physical and economic model of the response of
coastal real estate to climate risk, Nature Climate Change, 3, pp. 559 – 562,
doi:10.1038/nclimate1826
Moore, L. J. 2000, Shoreline mapping techniques, Journal of Coastal Research, 16(1), 111-124.
Moore, L. J., List, J. H., Williams, S. J. and Stolper, D. 2010. Complexities in barrier island
response to sea level rise: Insights from numerical model experiments, North Carolina Outer
36
Banks, Journal of Geophysical Research-Earth Surface, 115,
doi:F0300410.1029/2009jf001299.
Moore, L. J., McNamara, D.E., Murray, A.B, and Brenner, O. 2013. Recent Shifts in Large-Scale
Coastline Erosion Patterns Linked to Storm Climate Change, Geophysical Research Letters.
Moore, L. J., Ruggiero, P. and List, J. H. 2006. Comparing mean high water and high, water line
shorelines: Should proxy-datum offsets be incorporated into shoreline change analysis,
Journal of Coastal Research, 22(4), 894-905, doi:10.2112/104-0401.1.
Morton, R. A. and Miller, T.L., 2005. The National Assessment of Shoreline Change Part 2:
Historical Shoreline Change and Associated Land Loss along the U.S. Southeast Atlantic
Coast: U.S. Geological Survey Open File Report 2005-1401.
National Aerounatics and Space Administration (NASA) 2010. Wallops Island VA Wallops
Flight Center, Storm Damage Reduction Project Design for Wallops Island, Virginia
(January 2010). Retrieved from
http://sites.wff.nasa.gov/code250/docs/SRIPP_EIS_Appendix_A.pdf.
National Oceanic and Atmospheric Administration (NOAA) 2012. National Geodetic Survey
NOAA Shoreline Data Explorer,
[URL:http://www.ngs.noaa.gov/newsys_ims/shoreline/index.cfm].
North Carolina Department of Earth and Environment – Division of Coastal Management 2011.
Oceanfront shorelines [Data file(s): 1998, 2003, 2004] Retrieved from
http://dcm2.enr.state.nc.us/Maps/chdownload.htm#Oceanfront%20Shorelines.
37
Nummedal, D., Oertel, G.F., Hubbard, D.K. and Hine, A.C., 1977. Tidal inlet variability - Cape
Hatteras to Cape Canaveral:American Society of Civil Engineers, Coastal Sediments ’77, p.
543-562.
Oster, D. 2012. Beach Morphology of the Virginia Barrier Islands 1998, 2005 and 2009. Virginia
Coast Reserve Long-Term Ecological Research Project Data Publication knb-lter-vcr.204.6
(http://metacat.lternet.edu/knb/metacat/knb-lter-vcr.204.6/lter ).
Pilkey, O. H., Neal, W. J., Riggs, S. R. Webb, C. A., Bush, D. M., Pilkey, D. F., Bullock, J. and
Cowan, B. A. 1998. The North Carolina shore and its barrier islands, restless ribbons of
sand, Duke University Press, Durham.
Program for the Study of Developed Shorelines (PSDS) 2012. Inventory of Coastal Engineering.
[Data File(s): beachnourishment.zip] Retrieved from http://www.wcu.edu/9165.asp
Riggs, S. R., Cleary, W.J. and Snyder, S. W. 1995. Influence of inherited geological framework
on barrier shoreface morphology and dynamics, Marine Geology, 126, 213-234.
Rink, W. J., and Forrest, G. 2005. Dating Evidence for the Accretion History of Beach Ridges on
Cape Canaveral and Merritt Island, Florida, USA, Journal of Coastal Research, 21(5),
1000-1008.
Ruggiero, P., M., Buijsman, M., Kaminsky, G.M. and Gelfenbaum, G. 2010. Modeling the effects
of wave climate and sediment supply variability on large-scale shoreline change, Marine
Geology, 273, pp. 127- 140
38
Sallenger Jr., A. H., Doran, K. S. and Howd, P. A. 2012. Hotspot of accelerated sea-level rise on
the Atlantic coast of North America, Nature Climate Change, 2, 884 - 888.
Slott, J. M., Murray, A.B. and Ashton, A.D. 2010. Large-scale responses of complex-shaped
coastlines to local shoreline stabilization and climate change, Journal of Geophysical
Research-Earth Surface, 115, doi:F0303310.1029/2009jf001486.
Slott, J. M., Murray, A. B., Ashton, A. D. and Crowley, T. J. 2006. Coastline responses to
changing storm patterns, Geophysical Research Letters, 33(18),
doi:L1840410.1029/2006gl027445.
Southgate, H. G. 1995. The effects of wave chronology on medium and long term coastal
morphology, Coastal Engineering 26, 251-271.
Sterl, A., and Caires, S. 2005. Climatology, variability and extrema of ocean waves: The web-
based KNMI/ERA-40 wave atlas, Int. J. Climatol., 25, pp. 963 – 977.
Thieler, E.R., Himmelstoss, E.A., Zichichi, J.L., and Ergul, A, 2008. Digital Shoreline Analysis
System (DSAS) version 4.0—An ArcGIS extension for calculating shoreline change: U.S.
Geological Survey Open-File Report 2008-1278.
USACE, 1965. Carolina Beach and Vicinity, Carolina Beach Portion (Coastal Storm Damage
Reduction Program), Department of the Army, U.S. Corps of Engineers: Wilmington, NC.
USACE, 1998. Carolina Beach and Vicinity, NC Area South, Kure Beach (Coastal Storm
Damage Reduction Program), Department of the Army, U.S. Corps of Engineers:
Wilmington, NC.
39
United State Geological Survey (USGS) 2012. The National Assessment of Shoreline Change: A
GIS Compilation of Vector Shorelines and Associated Shoreline Change Data for the New
England and Mid-Atlantic Coasts. Open File Report 2010-1119[Data File(s):
DelmarvaN_shorelines.shp, DelmarvaS_shorelines.shp] Retrieved from
http://pubs.usgs.gov/of/2010/1119/data_catalog.html.
United States Geological Survey (USGS) 2011. The National Assessment of Shoreline Change: A
GIS Compilation of Vector Shorelines and Associated Shoreline Change Data for the U.S.
Southeast Atlantic Coast. Open File Report 2005-1326. [Data file: nc_zip]. Retrieved from
http://pubs.usgs.gov/of/2005/1326/gis-data.html.
Valverde, H. R., Trembanis, A.C.and Pilkey, O. H. 1999. Summary of beach nourishment
episodes on the US East Coast barrier islands, Journal of Coastal Research, 15(4), 1100-
1118.
Wallops Island Flight Facility (WFF) 2011. NASA Seawall Extension at Wallops Island, VA, U.S
Army Corps of Engineers Solicitation Number: W91236-11-B-0011, USACE District,
Norfolk, Retrieved from www.fbo.gov.
Wallops Island Flight Facility (WFF) 2010. Large ocean dredging and beach nourishment at
significant distances (15 to 20 NM) from the Wallops Island coastline to be nourished and
protected, U.S Army Corps of Engineers Solicitation Number: W91236-10-R-0026, USACE
District, Norfolk, Retrieved from www.fbo.gov.
40
Webster, P. J., Holland, G.J., Curry, J.A. and Chang, H.R. 2005. Changes in Tropical Cyclone
Number, Duration, and Intensity in a Warming Environment, Science, 309(5742), 1844-
1846.
Wolner, C.W.V, Moore, L.J., Young, D.R., Brantley, S.T., Bissett, S.N., McBride, R. A. 2013.
Ecomorphodynamic feedbacks and barrier island response to disturbance: Insights from the
Virginia Barrier Islands, Mid-Atlantic Bight, USA. Geomorphology, doi:
10.1016/j.geomorph2013.03035, accepted manuscript.
Woodruff, J.D., Irish, J.L., Camargo, S.J., 2013. Coastal Flooding by tropical cyclones and sea
level rise, Nature, 504, doi:10/1038/nature12855
Work, P., and Dean, R.G., 1990. Shoreline Changes Adjacent to Florida's East Coast Tidal Inlets,
University of Florida, Coastal and Oceanographic Engineering Department.
Johnson, et al., in press, Earth Surface Processes and Landforms
42
Tables
Table 1. Digital Shoreline Data Summary. Legend: P – shoreline provides partial coverage of
study area. F – shoreline provides full coverage of study area. MD DNR – Maryland Department
of Natural Resources. NAPP – National Aerial Photography Program. FL DOT- Florida
Department of Transportation. FL DEP – Florida Department of Environmental Protection.
1Morton & Miller, 2005, 2Limber et al., 2007, 3Hapke et al., 2010, 4ASIS, 2011, *assigned by data
source according to ref. 1, ^calculated using applicable values reported in Table 3; +estimated
conservatively based on aerial photo data source because no uncertainty data was available.
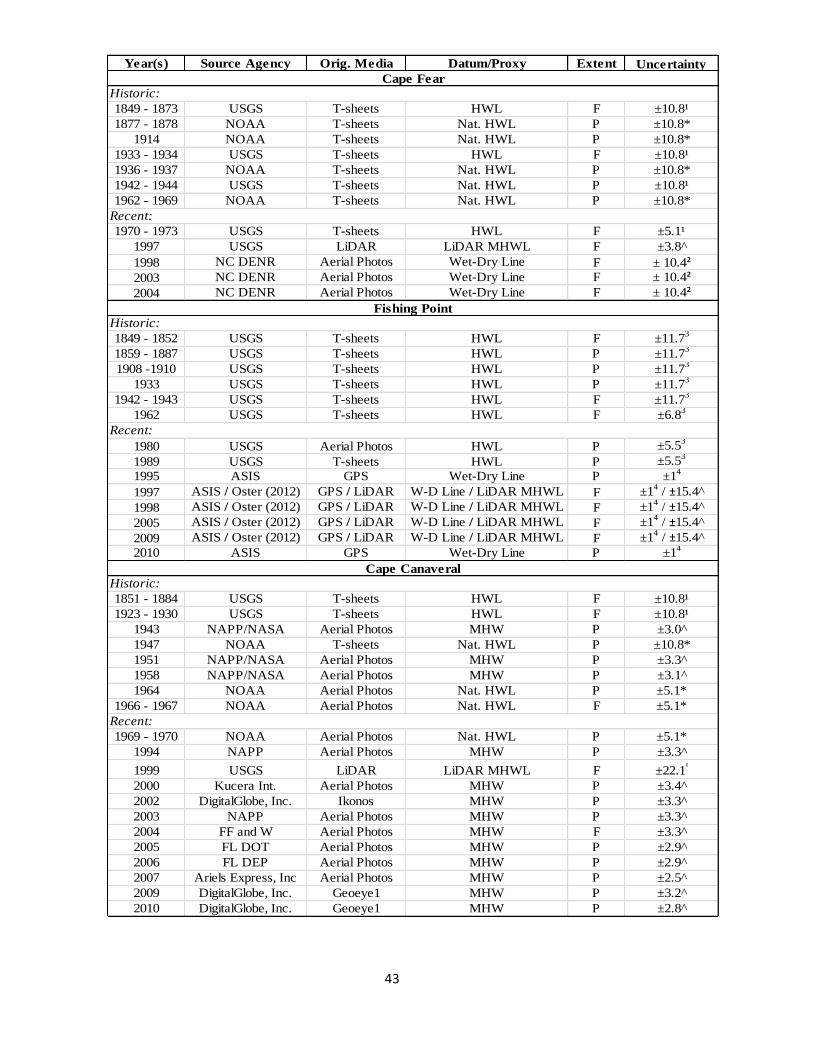
43
Year(s) Source Agency Orig. Media Datum/Proxy Extent Uncertainty
1849 - 1873 USGS T-sheets HWL F ±10.8¹
1877 - 1878 NOAA T-sheets Nat. HWL P ±10.8*
1914 NOAA T-sheets Nat. HWL P ±10.8*
1933 - 1934 USGS T-sheets HWL F ±10.8¹
1936 - 1937 NOAA T-sheets Nat. HWL P ±10.8*
1942 - 1944 USGS T-sheets Nat. HWL P ±10.8¹
1962 - 1969 NOAA T-sheets Nat. HWL P ±10.8*
1970 - 1973 USGS T-sheets HWL F ±5.1¹
1997 USGS LiDAR LiDAR MHWL F ±3.8^
1998 NC DENR Aerial Photos Wet-Dry Line F ± 10.4²2003 NC DENR Aerial Photos Wet-Dry Line F ± 10.4²
2004 NC DENR Aerial Photos Wet-Dry Line F ± 10.4²
1849 - 1852 USGS T-sheets HWL F ±11.73
1859 - 1887 USGS T-sheets HWL P ±11.73
1908 -1910 USGS T-sheets HWL P ±11.73
1933 USGS T-sheets HWL P ±11.73
1942 - 1943 USGS T-sheets HWL F ±11.73
1962 USGS T-sheets HWL F ±6.83
1980 USGS Aerial Photos HWL P ±5.53
1989 USGS T-sheets HWL P ±5.53
1995 ASIS GPS Wet-Dry Line P ±14
1997 ASIS / Oster (2012) GPS / LiDAR W-D Line / LiDAR MHWL F ±14 / ±15.4^
1998 ASIS / Oster (2012) GPS / LiDAR W-D Line / LiDAR MHWL F ±14 / ±15.4^
2005 ASIS / Oster (2012) GPS / LiDAR W-D Line / LiDAR MHWL F ±14 / ±15.4^
2009 ASIS / Oster (2012) GPS / LiDAR W-D Line / LiDAR MHWL F ±14 / ±15.4^
2010 ASIS GPS Wet-Dry Line P ±14
1851 - 1884 USGS T-sheets HWL F ±10.8¹
1923 - 1930 USGS T-sheets HWL F ±10.8¹
1943 NAPP/NASA Aerial Photos MHW P ±3.0^
1947 NOAA T-sheets Nat. HWL P ±10.8*
1951 NAPP/NASA Aerial Photos MHW P ±3.3^
1958 NAPP/NASA Aerial Photos MHW P ±3.1^
1964 NOAA Aerial Photos Nat. HWL P ±5.1*
1966 - 1967 NOAA Aerial Photos Nat. HWL F ±5.1*
1969 - 1970 NOAA Aerial Photos Nat. HWL P ±5.1*
1994 NAPP Aerial Photos MHW P ±3.3^
1999 USGS LiDAR LiDAR MHWL F ±22.1¹
2000 Kucera Int. Aerial Photos MHW P ±3.4^
2002 DigitalGlobe, Inc. Ikonos MHW P ±3.3^
2003 NAPP Aerial Photos MHW P ±3.3^
2004 FF and W Aerial Photos MHW F ±3.3^
2005 FL DOT Aerial Photos MHW P ±2.9^
2006 FL DEP Aerial Photos MHW P ±2.9^
2007 Ariels Express, Inc Aerial Photos MHW P ±2.5^
2009 DigitalGlobe, Inc. Geoeye1 MHW P ±3.2^
2010 DigitalGlobe, Inc. Geoeye1 MHW P ±2.8^
Cape Canaveral
Historic:
Recent:
Cape Fear
Historic:
Recent:
Fishing Point
Historic:
Recent:
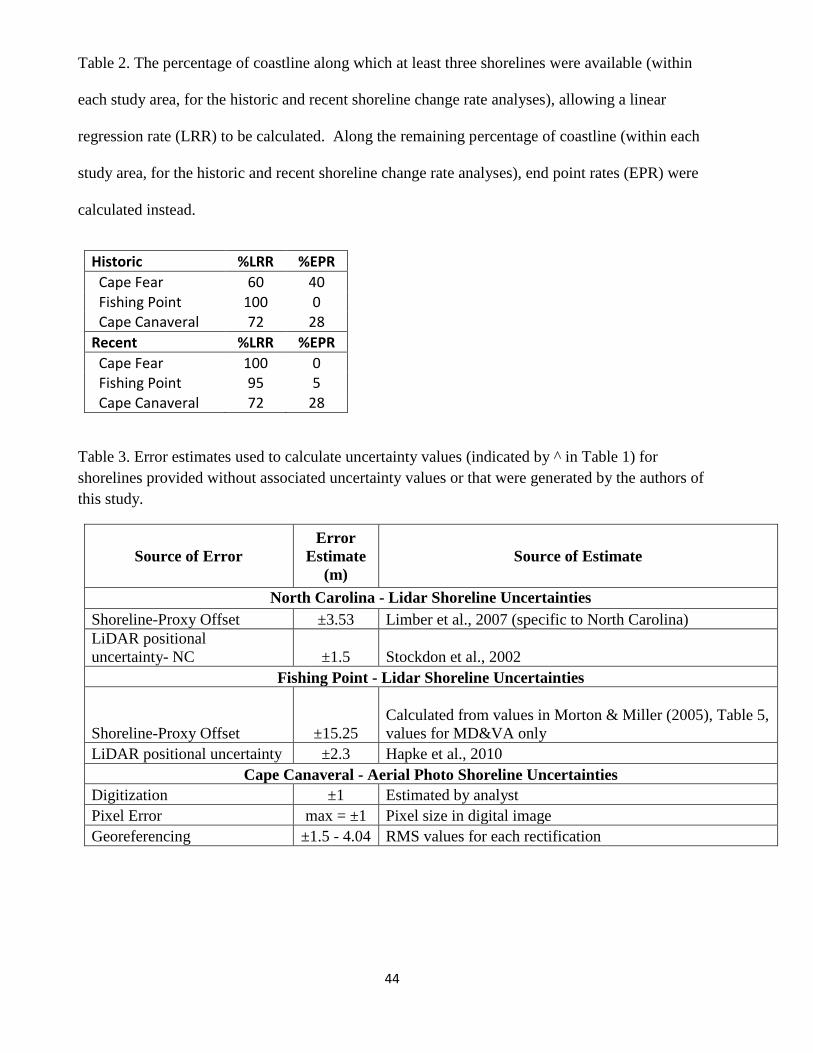
44
Table 2. The percentage of coastline along which at least three shorelines were available (within
each study area, for the historic and recent shoreline change rate analyses), allowing a linear
regression rate (LRR) to be calculated. Along the remaining percentage of coastline (within each
study area, for the historic and recent shoreline change rate analyses), end point rates (EPR) were
calculated instead.
Historic %LRR %EPR
Cape Fear 60 40 Fishing Point 100 0 Cape Canaveral 72 28
Recent %LRR %EPR
Cape Fear 100 0 Fishing Point 95 5 Cape Canaveral 72 28
Table 3. Error estimates used to calculate uncertainty values (indicated by ^ in Table 1) for
shorelines provided without associated uncertainty values or that were generated by the authors of
this study.
Source of Error
Error
Estimate
(m)
Source of Estimate
North Carolina - Lidar Shoreline Uncertainties
Shoreline-Proxy Offset ±3.53 Limber et al., 2007 (specific to North Carolina)
LiDAR positional
uncertainty- NC ±1.5 Stockdon et al., 2002
Fishing Point - Lidar Shoreline Uncertainties
Shoreline-Proxy Offset ±15.25
Calculated from values in Morton & Miller (2005), Table 5,
values for MD&VA only
LiDAR positional uncertainty ±2.3 Hapke et al., 2010
Cape Canaveral - Aerial Photo Shoreline Uncertainties
Digitization ±1 Estimated by analyst
Pixel Error max = ±1 Pixel size in digital image
Georeferencing ±1.5 - 4.04 RMS values for each rectification
Table 1. Digital Shoreline Metadata.
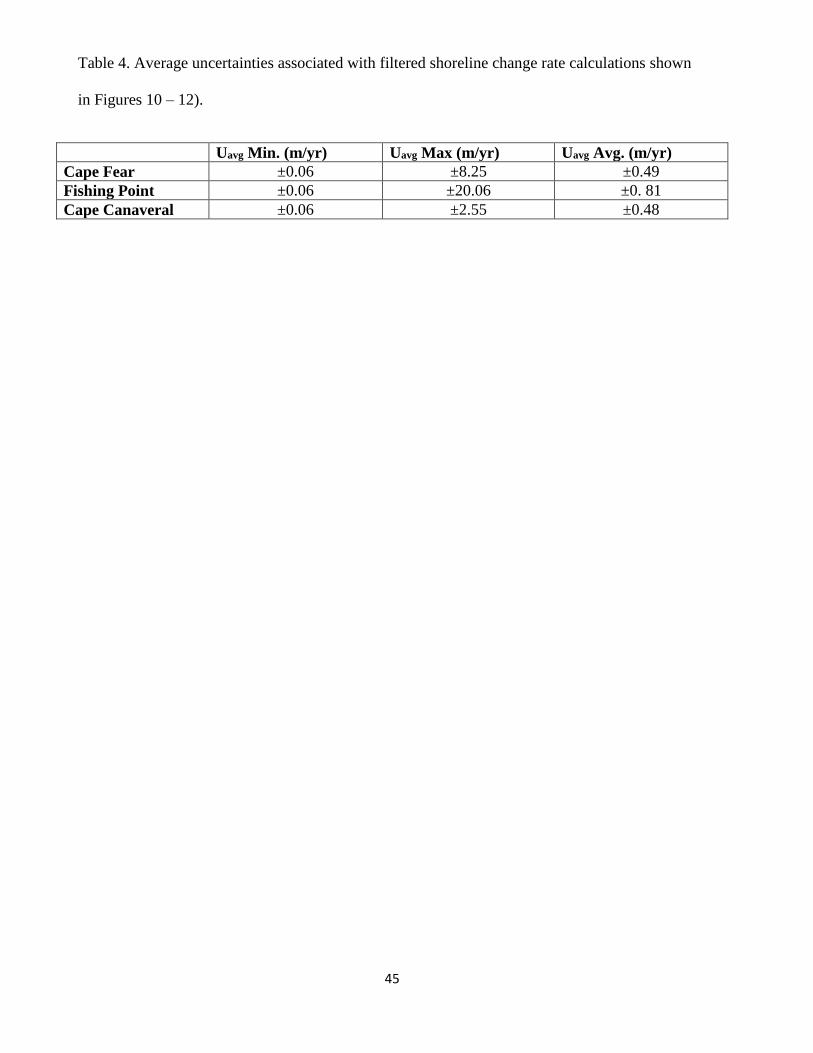
45
Table 4. Average uncertainties associated with filtered shoreline change rate calculations shown
in Figures 10 – 12).
Uavg Min. (m/yr) Uavg Max (m/yr) Uavg Avg. (m/yr)
Cape Fear ±0.06 ±8.25 ±0.49
Fishing Point ±0.06 ±20.06 ±0. 81
Cape Canaveral ±0.06 ±2.55 ±0.48
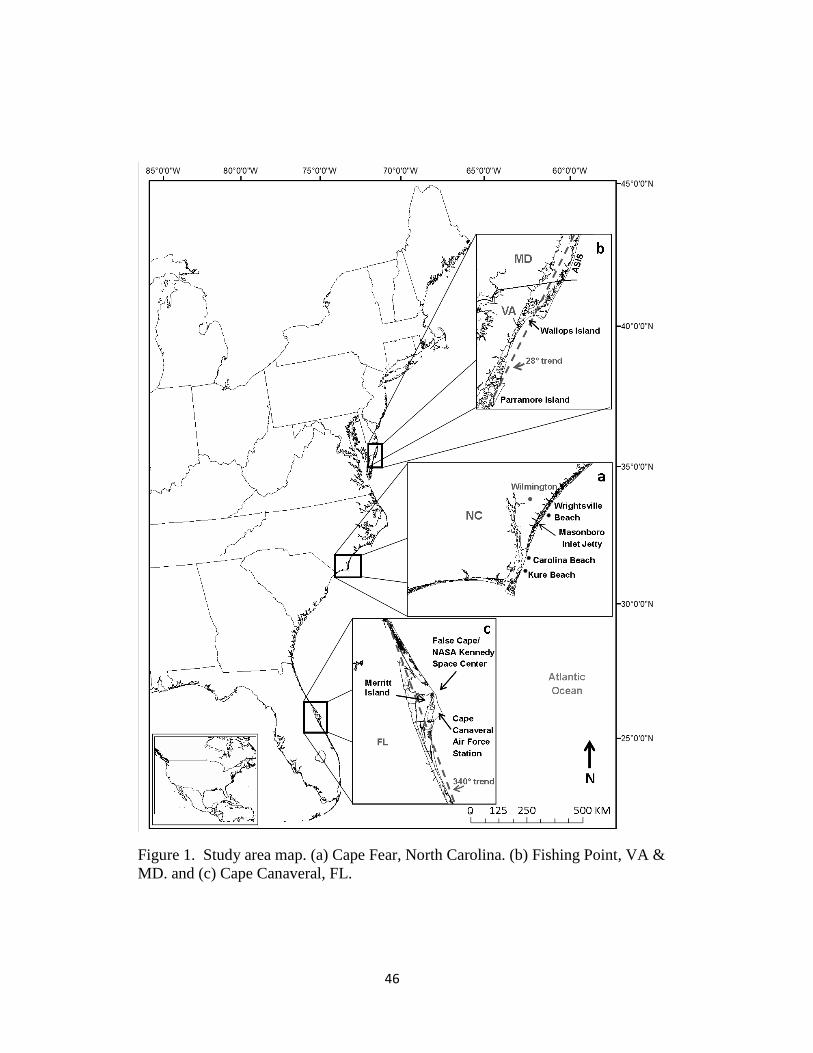
46
Figure 1. Study area map. (a) Cape Fear, North Carolina. (b) Fishing Point, VA &
MD. and (c) Cape Canaveral, FL.

47
Figure 2. Cumulative beach nourishment volume for the northern flank of Cape Fear
binned in 5-year increments. Three different rates of nourishment are indicated by
dashed, black lines.
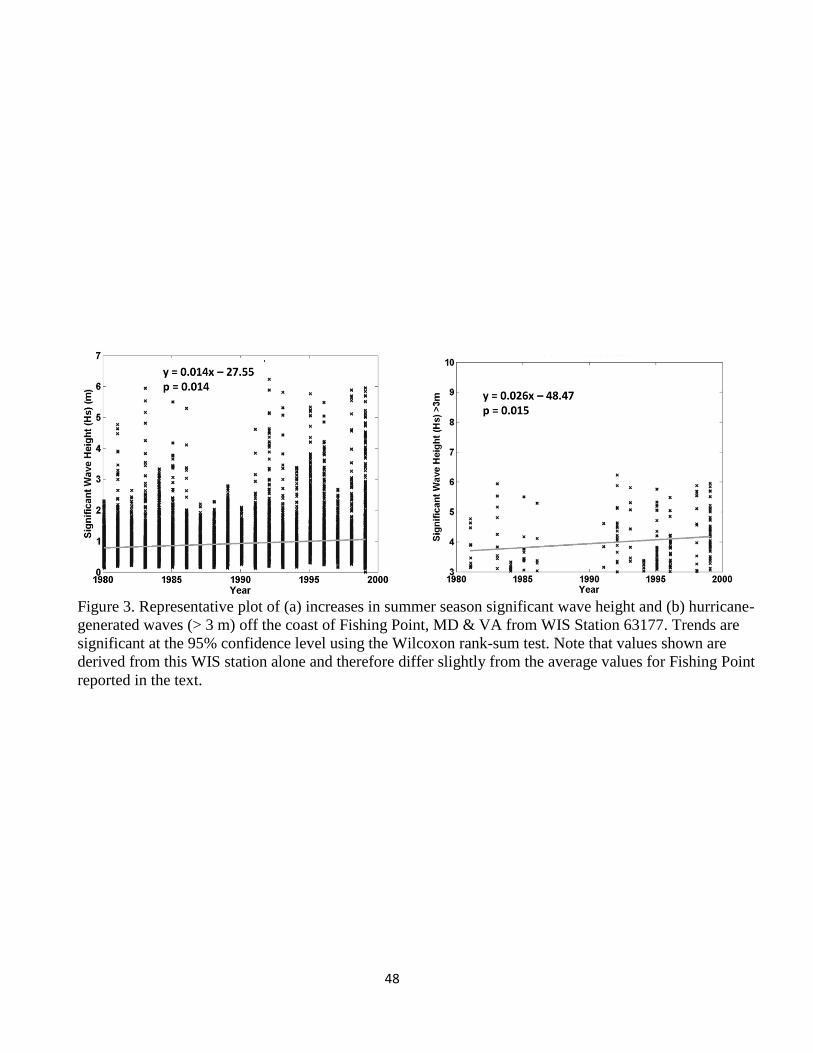
48
Figure 3. Representative plot of (a) increases in summer season significant wave height and (b) hurricane-
generated waves (> 3 m) off the coast of Fishing Point, MD & VA from WIS Station 63177. Trends are
significant at the 95% confidence level using the Wilcoxon rank-sum test. Note that values shown are
derived from this WIS station alone and therefore differ slightly from the average values for Fishing Point
reported in the text.
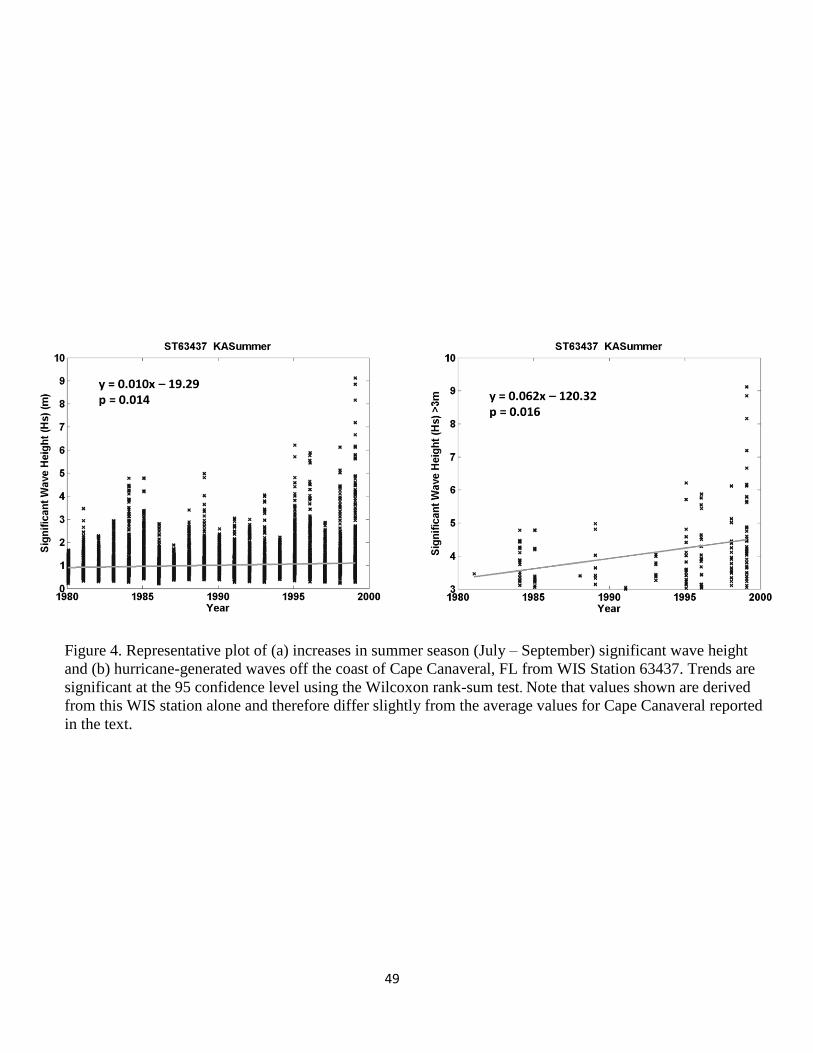
49
Figure 4. Representative plot of (a) increases in summer season (July – September) significant wave height
and (b) hurricane-generated waves off the coast of Cape Canaveral, FL from WIS Station 63437. Trends are
significant at the 95 confidence level using the Wilcoxon rank-sum test. Note that values shown are derived
from this WIS station alone and therefore differ slightly from the average values for Cape Canaveral reported
in the text.
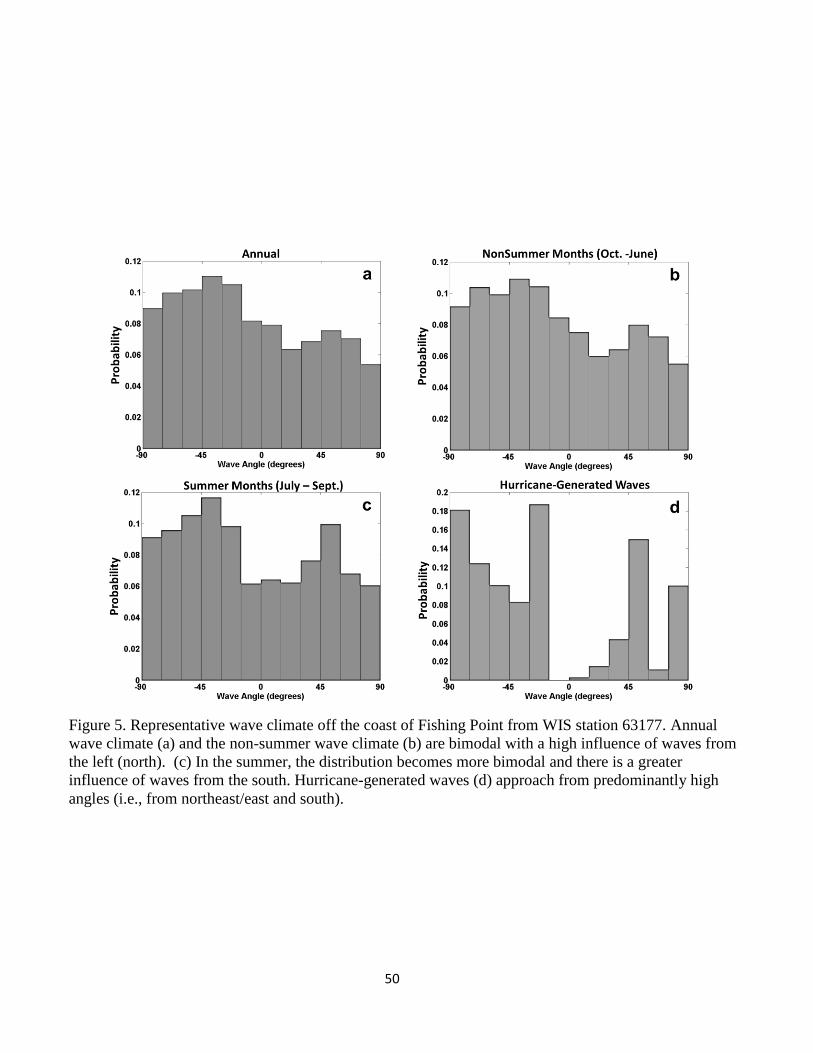
50
Figure 5. Representative wave climate off the coast of Fishing Point from WIS station 63177. Annual
wave climate (a) and the non-summer wave climate (b) are bimodal with a high influence of waves from
the left (north). (c) In the summer, the distribution becomes more bimodal and there is a greater
influence of waves from the south. Hurricane-generated waves (d) approach from predominantly high
angles (i.e., from northeast/east and south).
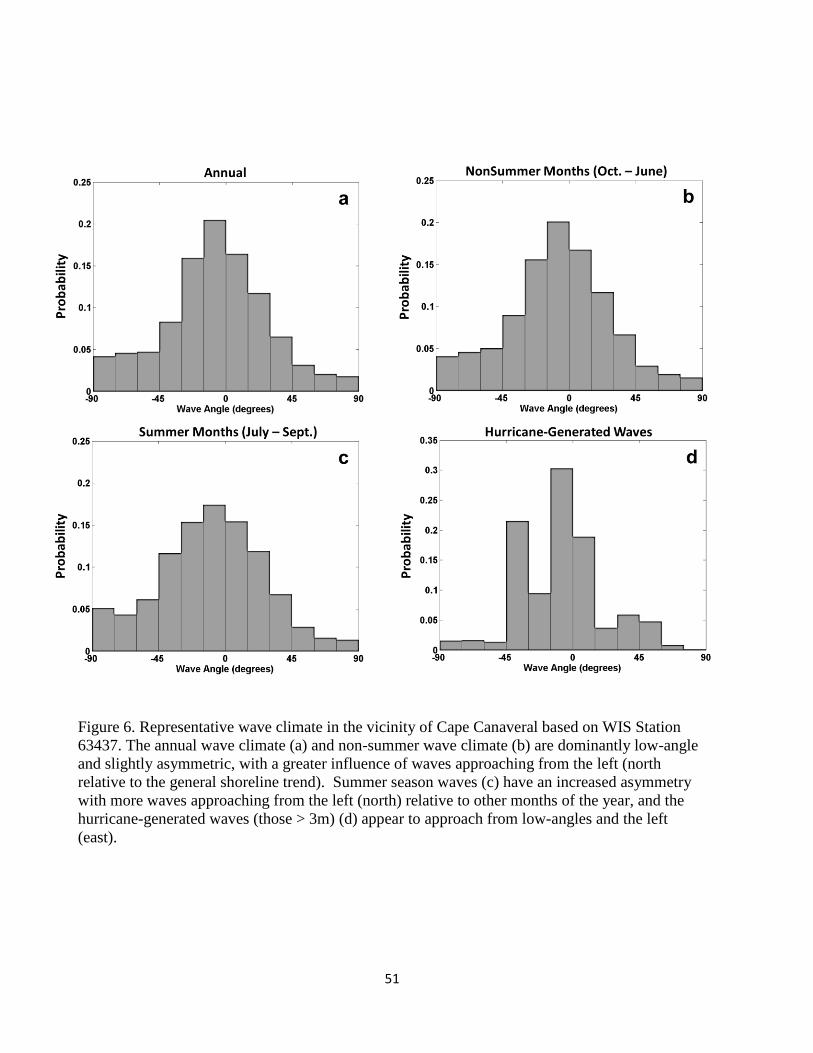
51
Figure 6. Representative wave climate in the vicinity of Cape Canaveral based on WIS Station
63437. The annual wave climate (a) and non-summer wave climate (b) are dominantly low-angle
and slightly asymmetric, with a greater influence of waves approaching from the left (north
relative to the general shoreline trend). Summer season waves (c) have an increased asymmetry
with more waves approaching from the left (north) relative to other months of the year, and the
hurricane-generated waves (those > 3m) (d) appear to approach from low-angles and the left
(east).
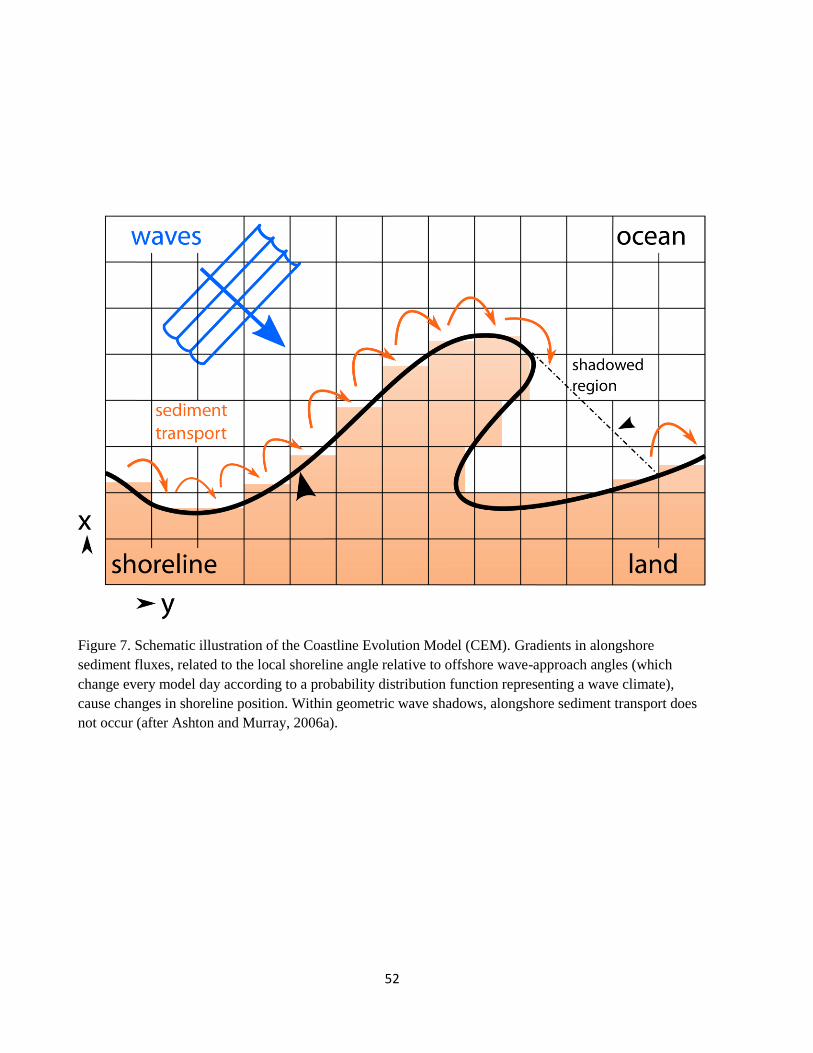
52
Figure 7. Schematic illustration of the Coastline Evolution Model (CEM). Gradients in alongshore
sediment fluxes, related to the local shoreline angle relative to offshore wave-approach angles (which
change every model day according to a probability distribution function representing a wave climate),
cause changes in shoreline position. Within geometric wave shadows, alongshore sediment transport does
not occur (after Ashton and Murray, 2006a).
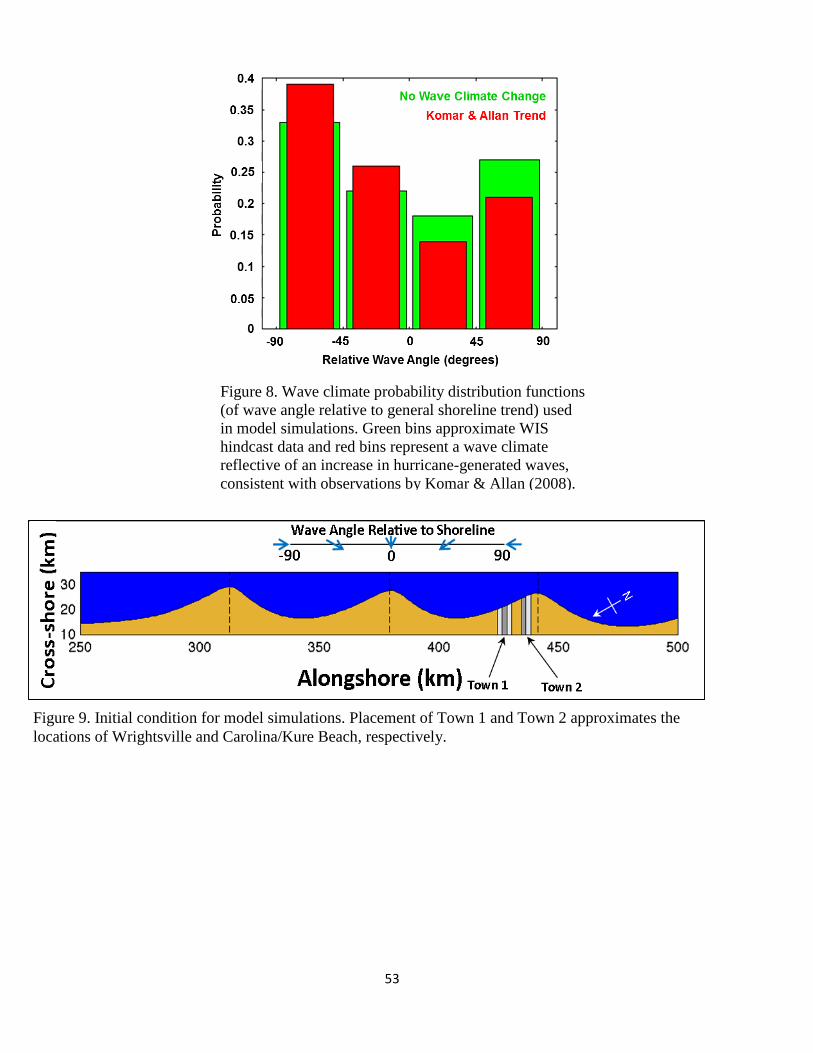
53
Figure 8. Wave climate probability distribution functions
(of wave angle relative to general shoreline trend) used
in model simulations. Green bins approximate WIS
hindcast data and red bins represent a wave climate
reflective of an increase in hurricane-generated waves,
consistent with observations by Komar & Allan (2008).
Figure 9. Initial condition for model simulations. Placement of Town 1 and Town 2 approximates the
locations of Wrightsville and Carolina/Kure Beach, respectively.
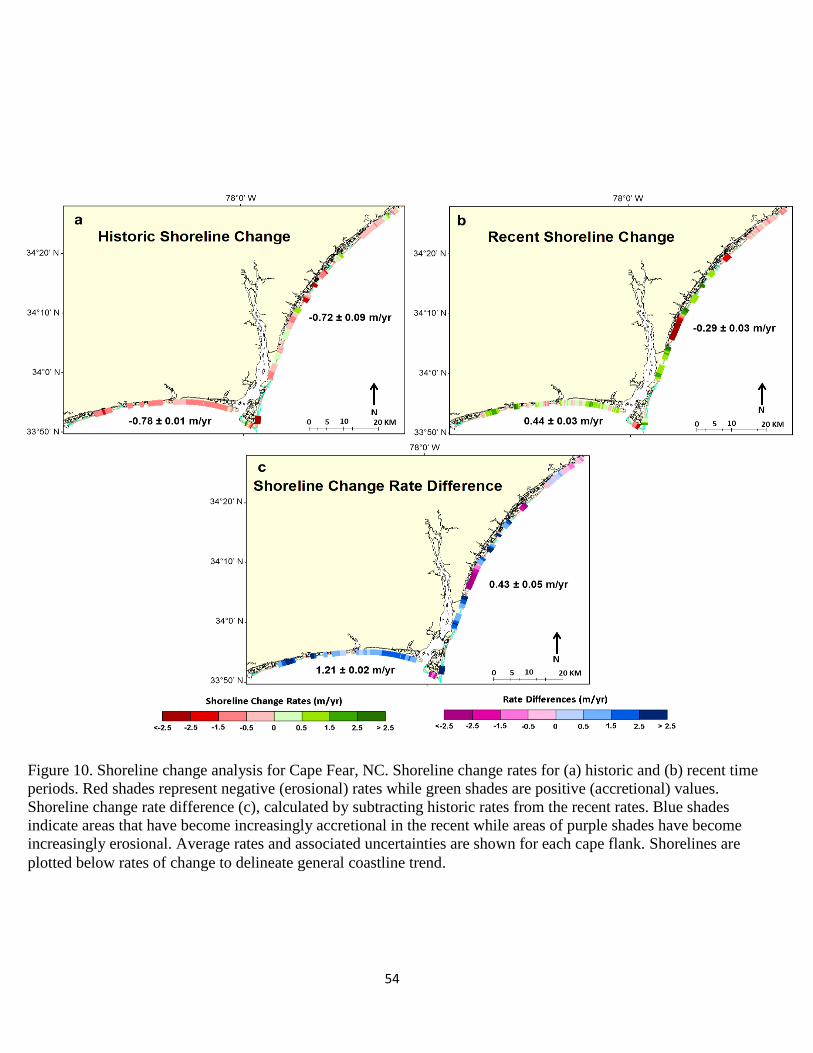
54
Figure 10. Shoreline change analysis for Cape Fear, NC. Shoreline change rates for (a) historic and (b) recent time
periods. Red shades represent negative (erosional) rates while green shades are positive (accretional) values.
Shoreline change rate difference (c), calculated by subtracting historic rates from the recent rates. Blue shades
indicate areas that have become increasingly accretional in the recent while areas of purple shades have become
increasingly erosional. Average rates and associated uncertainties are shown for each cape flank. Shorelines are
plotted below rates of change to delineate general coastline trend.
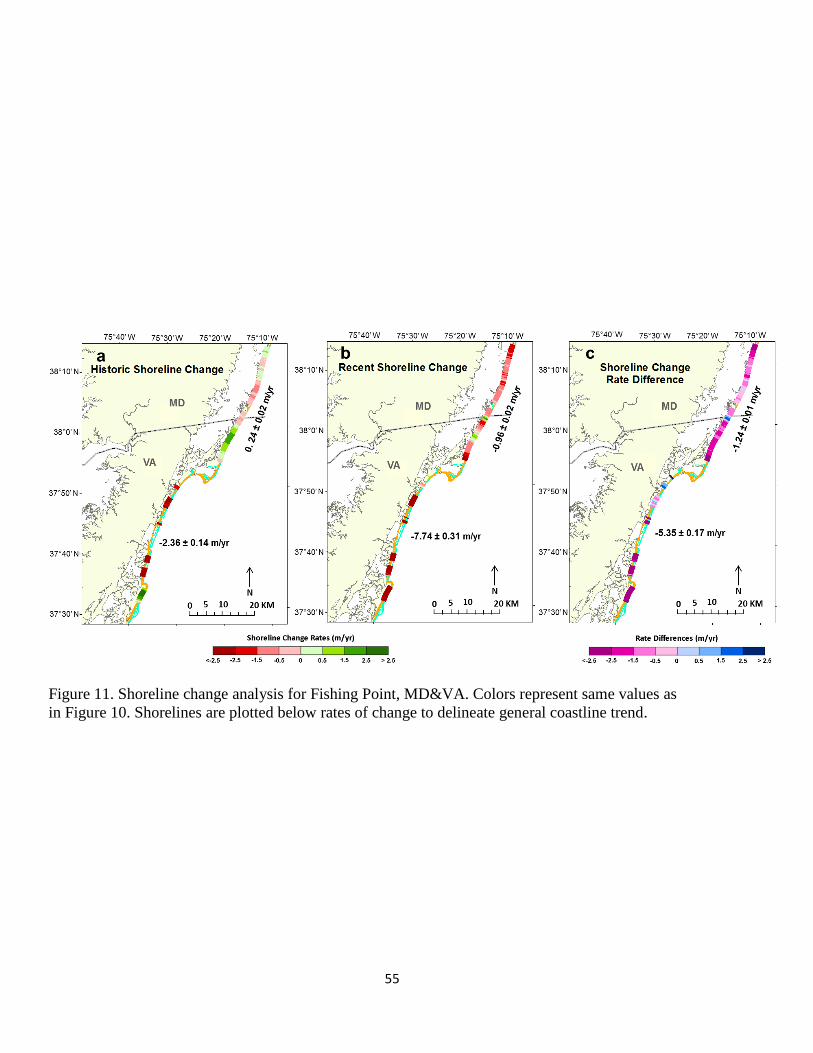
55
Figure 11. Shoreline change analysis for Fishing Point, MD&VA. Colors represent same values as
in Figure 10. Shorelines are plotted below rates of change to delineate general coastline trend.
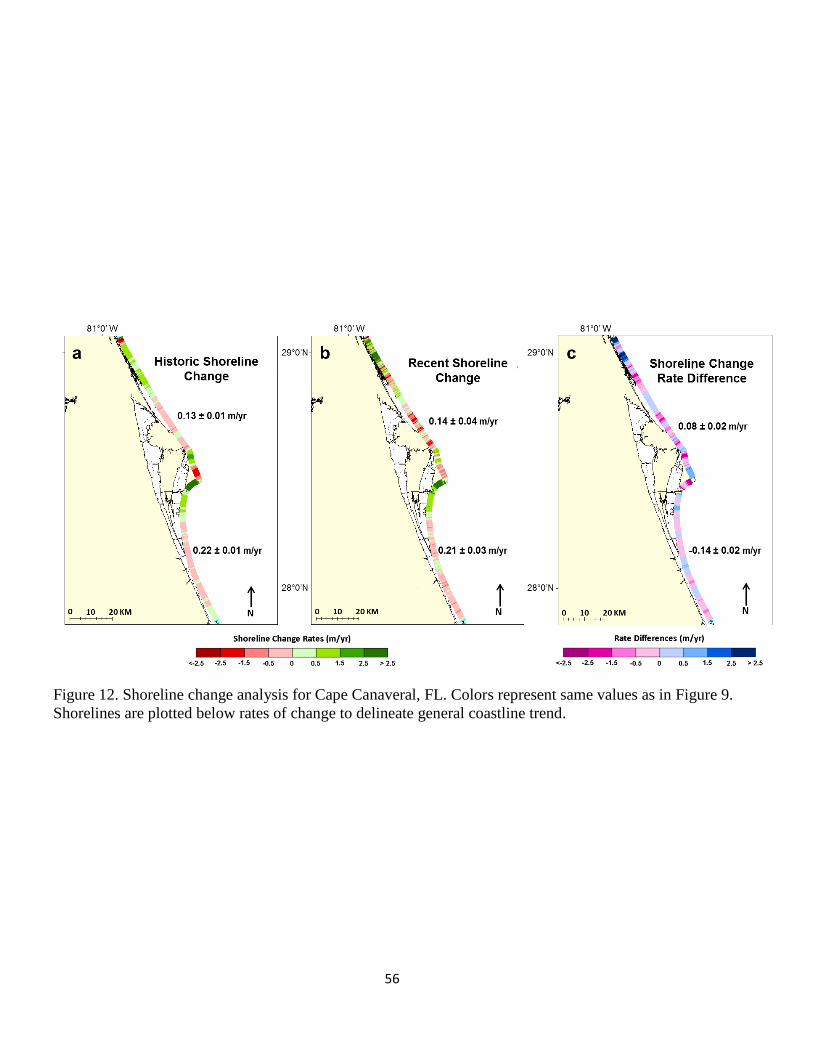
56
Figure 12. Shoreline change analysis for Cape Canaveral, FL. Colors represent same values as in Figure 9.
Shorelines are plotted below rates of change to delineate general coastline trend.
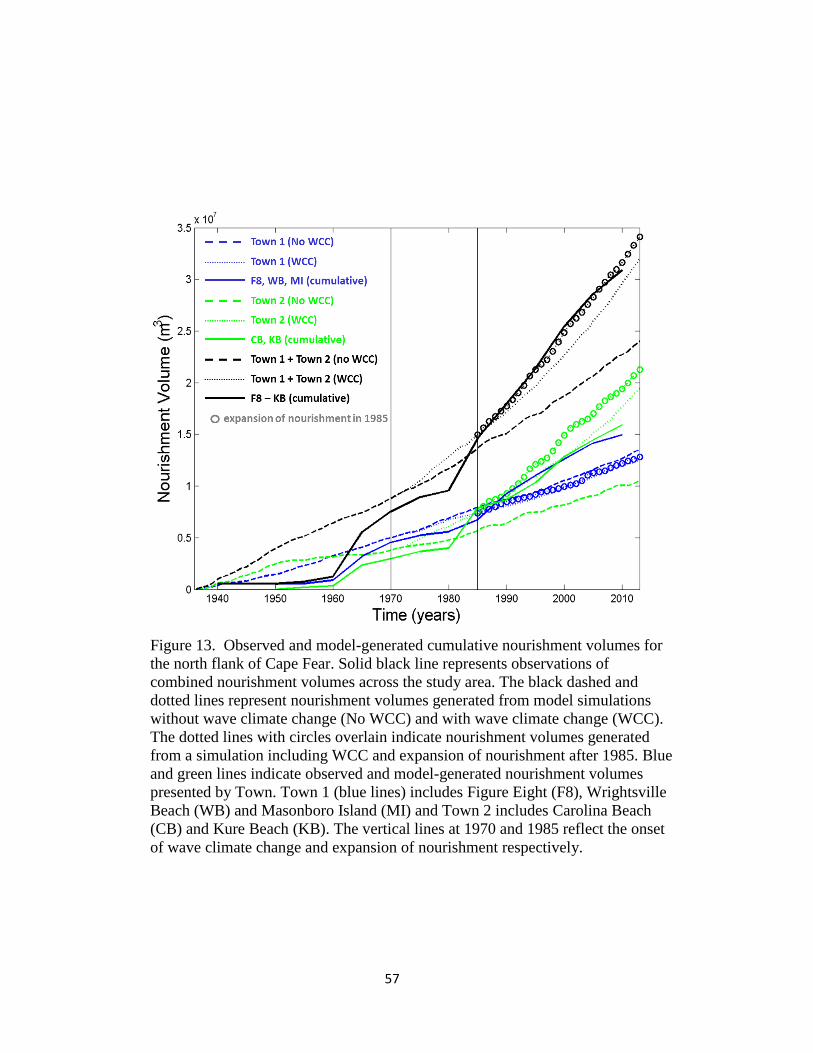
57
Figure 13. Observed and model-generated cumulative nourishment volumes for
the north flank of Cape Fear. Solid black line represents observations of
combined nourishment volumes across the study area. The black dashed and
dotted lines represent nourishment volumes generated from model simulations
without wave climate change (No WCC) and with wave climate change (WCC).
The dotted lines with circles overlain indicate nourishment volumes generated
from a simulation including WCC and expansion of nourishment after 1985. Blue
and green lines indicate observed and model-generated nourishment volumes
presented by Town. Town 1 (blue lines) includes Figure Eight (F8), Wrightsville
Beach (WB) and Masonboro Island (MI) and Town 2 includes Carolina Beach
(CB) and Kure Beach (KB). The vertical lines at 1970 and 1985 reflect the onset
of wave climate change and expansion of nourishment respectively.
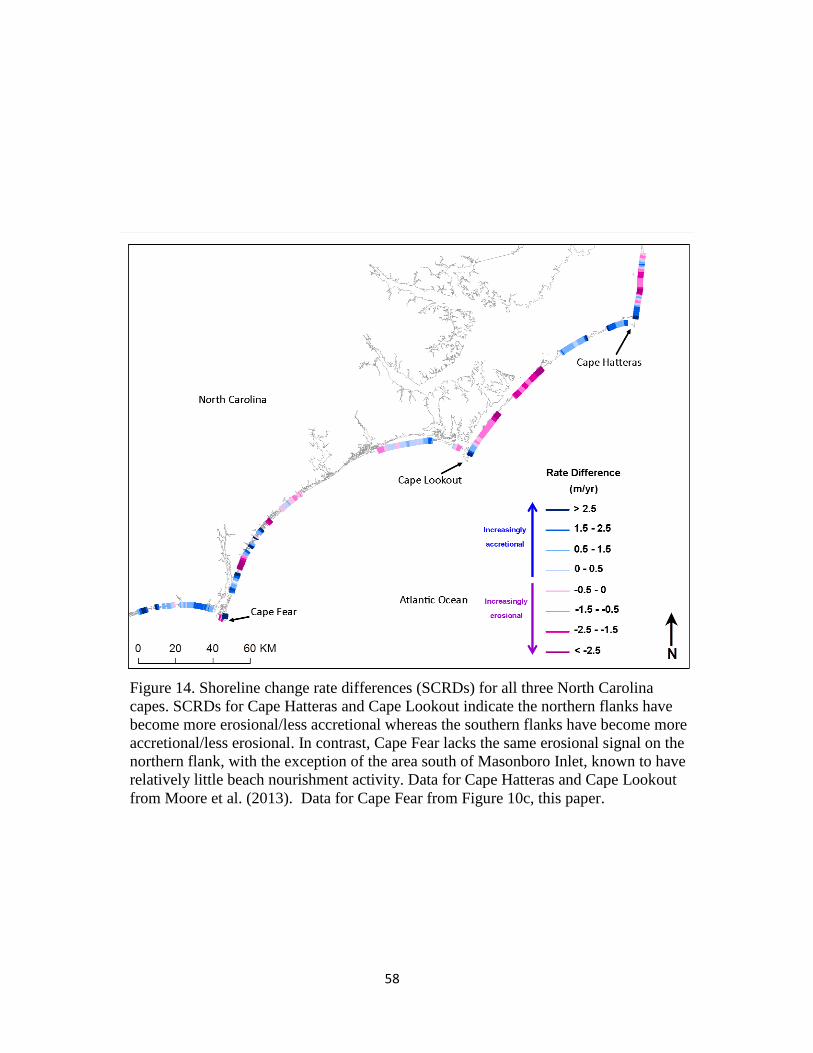
58
Figure 14. Shoreline change rate differences (SCRDs) for all three North Carolina
capes. SCRDs for Cape Hatteras and Cape Lookout indicate the northern flanks have
become more erosional/less accretional whereas the southern flanks have become more
accretional/less erosional. In contrast, Cape Fear lacks the same erosional signal on the
northern flank, with the exception of the area south of Masonboro Inlet, known to have
relatively little beach nourishment activity. Data for Cape Hatteras and Cape Lookout
from Moore et al. (2013). Data for Cape Fear from Figure 10c, this paper.