john lewandowski (ace usa) and will garland (guy carpenter) new york the d&o market: current...
TRANSCRIPT
John Lewandowski (ACE USA) and Will Garland (Guy Carpenter)New York
The D&O Market: Current Issues and Pricing ApproachesCAS Seminar on Reinsurance
June 6, 2005

Part I
Directors & Officers LiabilityOverview

3
Directors & Officers Liability – provides coverage for claims arising from the “wrongful acts” of insured persons (corporate malfeasance) while serving in their capacity as directors or officers, including any act, error or omission in their capacity as D&O.
Three types of traditional coverage: Side A – coverage for non-indemnifiable claims Side B – reimbursement coverage to companies for settlements,
judgments & defense costs Side C - coverage for securities-related claims made directly against
companies.
Coverage often includes Employment Practices Liability (excluding “professional services”).
Directors & Officers LiabilityOverview

4
Not for Profit10%For Profit
Private10%
For Profit-Public80%
By Ownership Type For Profit by Account Size
Very Large20%
Large25% Mid-
Market30%
Small25%
Small: Assets < $100MMid: $100M < Assets < $1BLarge: $1B < Assets < $10BVery Large: Assets >10B
Who Purchases D&O Coverage?
Directors & Officers LiabilityOverview

5
1997 - 2001 – Softening Market Expanded capacity/larger limits offered Consistent reductions in rate levels Expanded coverage, introduction of entity coverage brings an
end to pre-set allocation Free/automatic reinstatements Multi-year policies with significant discounts and no re-
underwriting
Directors & Officers LiabilityAn Historical Perspective

6
2002 – 2003 - Hard Market Underwriting and Pricing Reduction in limits, increased insured retentions Large rate increases - more than 150% were common (risk
dependent) Coverage restrictions – eliminate investment banking, entity
coverage, other terms and conditions Elimination of multi-year deals
Directors & Officers LiabilityAn Historical Perspective
7
2004/2005 – Eye of the Storm? Entry of new capacity Reductions in both renewal and new business rates Intense competitive pressure in mid/small market segments Demand for additional coverage – Side A
Directors & Officers LiabilityAn Historical Perspective
Part II
Current Issues in the D&O Marketplace

9
Current Issues in the D&O Marketplace
Rate adequacy
– Declining rates on excess business
– How do you benchmark a portfolio over time? Entity coverage, multi-year policies, other changes in coverage
(e.g. Side A cover)
Uncertainty of results
– Length of time to class action settlement
– Financial Institution events Mutual funds, Insurance brokers/companies, Investment banks
Claim Trends
Impact of recent legislation – Sabanes-Oxley

10
2004 saw increases in filings against foreign companies (Increase of more than 90% over 2003 & 100% over historical average)
2004 filings up 16% over 2003 and 7% over 8-year average
Sarbanes-Oxley section 404 compliance has delayed IPO’s
Sarbanes-Oxley section 404 compliance has caused the “de-listing” of some smaller public and foreign firms
PCAOB established to oversee public company audit - development of new standards
Emerging trend in settlements seeking non-financial, remedial action – composition of BOD and Audit committee
Settlements requiring independent directors to pay “out-of-pocket”
* Source : 2004 PwC Securities Litigation Study
Claim TrendsRecent Developments

11
Securities Class Actions Suits Filed through May 2005
Source : Stanford Research
Claim TrendsSecurities Class Action Activity
12
1933/34 Securities Acts D&O Liability for misrepresentations, omissions in public offerings,
statements
1995 PSLRA Intended to prevent abuses of securities class action lawsuits. Heightened Pleading Standard
2002 Sarbanes-Oxley Act Blackout trading barred CEO and CFO certifications Faster insider trading disclosure Increased Audit Committee duties and SEC review More criminal penalties and fines
Claim TrendsHistorical Legislation Impacting D&O Suits
13
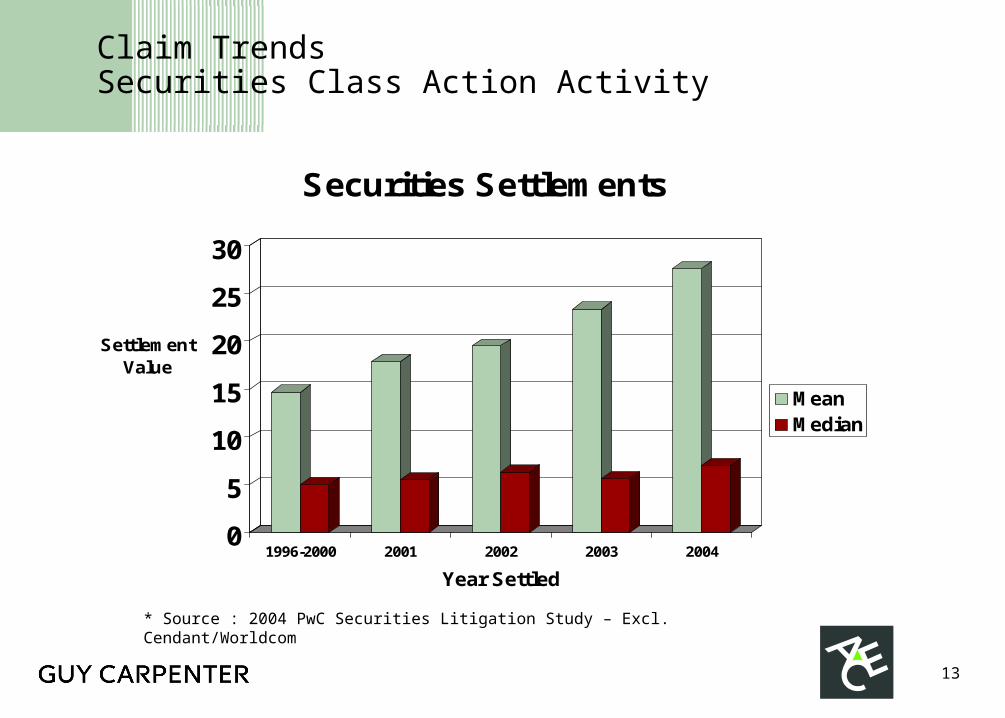
* Source : 2004 PwC Securities Litigation Study – Excl. Cendant/Worldcom
0
5
10
15
20
25
30
SettlementValue
1996-2000 2001 2002 2003 2004
Year Settled
Securities Settlements
MeanMedian
Claim TrendsSecurities Class Action Activity

14
Securities Claim SeverityLies, Statistics
Average 2005 settlement is $27m1 (+20% annual trend)
– Includes all shareholder recoveries, even those recovered from third parties
– Only non-zero settlements, i.e., no dismissals Dismissals average greater than 20% of filings
– Does not contemplate insured loss, e.g. Cendant $3.2b settlement vs. $125m D&O program
– Includes amounts uninsurable Fines, non-cash amounts (options, warrants)
– Broker disclosure: Does not include defense costs
1. Recent Trends in Shareholder Class Action Litigation, NERA, Elaine Buckberg, Ph.D, et al.

15
Securities Claim SeverityBehind the Average
Headline settlements drive average
– Top two cases = 20% - 50% of total settlement dollars since 1998
– Top three cases = 25% - 75%
Median settlement is $5.3m1 (+10% annual trend)
1. Recent Trends in Shareholder Class Action Litigation, NERA, Elaine Buckberg, Ph.D, et al.

16
Securities Claim SeverityImpact on Attachment Points
Settlements greater than $50m increasing
– Nine in 2002 and 2003 5% of settlements
– Seventeen in 2004 10% of settlements
“Bread and Butter” settlements (between $2m and $50m) exhibit stable trend
– Average about $10m 4% trend since 1996

Part III
Traditional Problems in D&O Reinsurance Pricing

18
Problems with D&O Reinsurance Pricing
No uniformity in price monitoring
– How do you monitor new business rate change?
Divergent loss development methods
– Length to settlement makes reserving difficult Primary vs. Excess Motion to Dismiss key
– Multi-year business
Differing views on trend assumptions

19
Solutions should be evident
Claims made business
– Frequency is known within 12 months
Loss information readily available from numerous credible sources
– Stanford, PWC, NERA
Reinsurers need to be consistent in the information they request from ceding companies
– Class action information Should make up 90% of D&O loss (portfolio dependent)
– Rate changes across the entire portfolio New and renewal business

20
Reinsurers Have Reacted!
Reinsurance markets have shown discipline since late 2004
– Reductions in capacity Limits offered as well as treaties supported
– Tighter terms and conditions to address uncertainty of results Lower ceding commissions Loss limitations
However, there is still work to be done!

Part IV
There are ways to price this business

22
Add More Science to the Art of D&O Underwriting
Development of exposure-based pricing model using both market cap and asset size.
Develop loss costs as a combination of Non-securities exposure – anti-trust Securities exposure – non-accounting, revenue recognition,
earnings restatement
Include impact of size, sector, insider holdings.
D&O Pricing

23
Private Securities LitigationHistorical Claim Frequency by Firm Size
0.00%
2.50%
5.00%
7.50%
<$100 m $100 - $500 m $500 m - $1 b $1 b- $ 10 b $10 b - $25 b > $ 25 b
Size Category
Fre
qu
en
cy
D&O Pricing

24
Private Securities LitigationHistorical Claim Frequency by Sector
0.00%
2.00%
4.00%
6.00%
Sector
Fre
qu
en
cy
D&O Pricing
25
Consider account-specific characteristics: Financial performance, Claim history, Corporate governance, vendor scoring, S&P credit rating, M&A activity, IPO’s
D&O Pricing Individual Risk Adjustments
26
Define authority levels – limits, price, rate
Define target market and risk appetite
Establish benchmarks for pricing
Monitor Rate achievement
Track adjust variance between market and indicated pricing
D&O Pricing Establish and Enforcement of Underwriting Guidelines

27
LEAD™ D&O Model Genesis
Loss and Exposure Analysis for D&O
Identified a need to help clients supplement existing experience-based risk selection and portfolio management
Recognized existence of available data which might portend a model that could identify the absolute and relative riskiness of U.S. publicly traded companies
Teamed with National Economic Research Associates (NERA) who possessed the technology and intellectual capital to develop a predictive model

28
LEAD™ D&O Model Potential SCAS Indicators
Examined the effects of more than 70 variables covering four distinct categories
– issuer characteristics
– financial statement items
– stock ownership
– stock trading characteristics
Analyzed the effects of variables individually and in combinations
– e.g., goodwill and goodwill as a percentage of market cap
29
LEAD™ D&O Model Methodology
Regression-based
– uses independent variables to predict the behavior of a dependent variable
– compares companies that have experienced SCAS vs. companies that have not
– looked for statistical significance above confidence levels

30
LEADTM D&O ModelTakeaways
Not an underwriting or pricing model, but ideal comparison of exposure relativities between:
– Companies you insure
– Companies you might insure
– Segments of your portfolio
No bias in model construction
Identification of potential problem areas and opportunities
Supplements ceding company and reinsurer understanding of underlying portfolios

31
Uncertainty surrounds the D&O market
D&O claim frequency and severity continue to increase
– However, statistics can be misleading
There are traditional problems in D&O reinsurance pricing
– There are solutions out there
– Reinsurers have reacted
There are ways to price this business
– Add more science to D&O pricing
Other ways to analyze D&O risk
– New models, others
Key Takeaways