john edwards trading style april 6th · a breakout above the gray cci wouldn't happen close to...
TRANSCRIPT
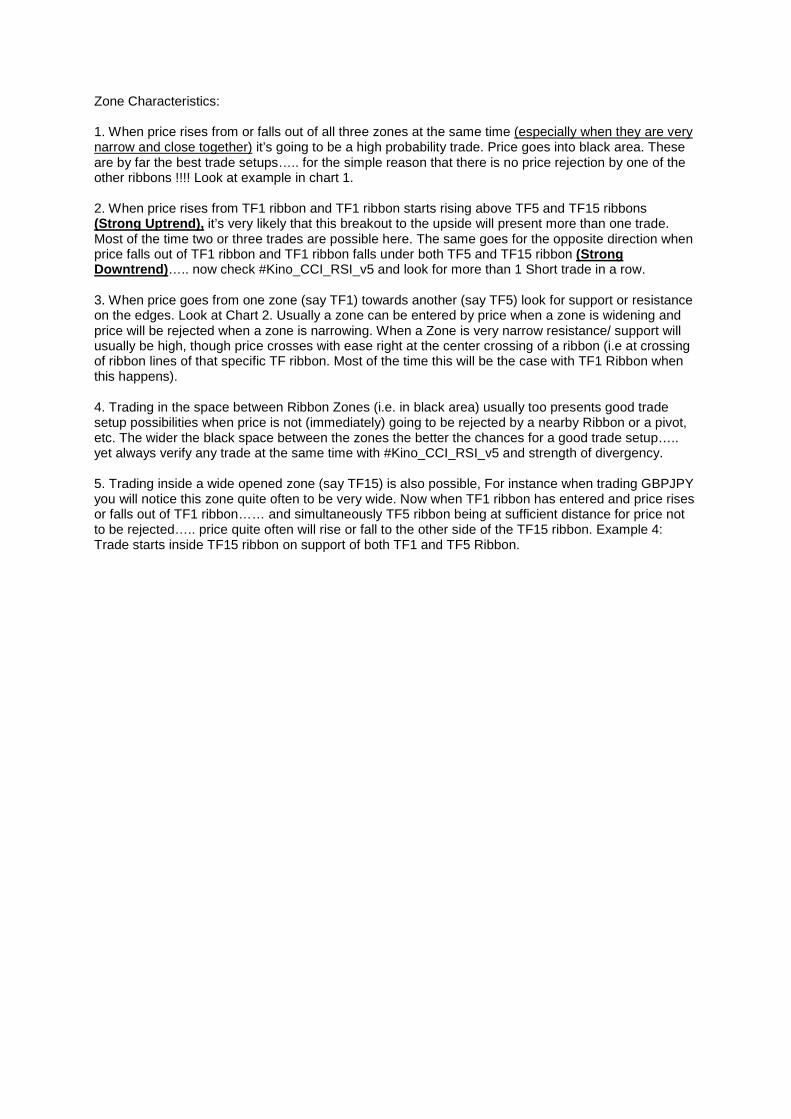
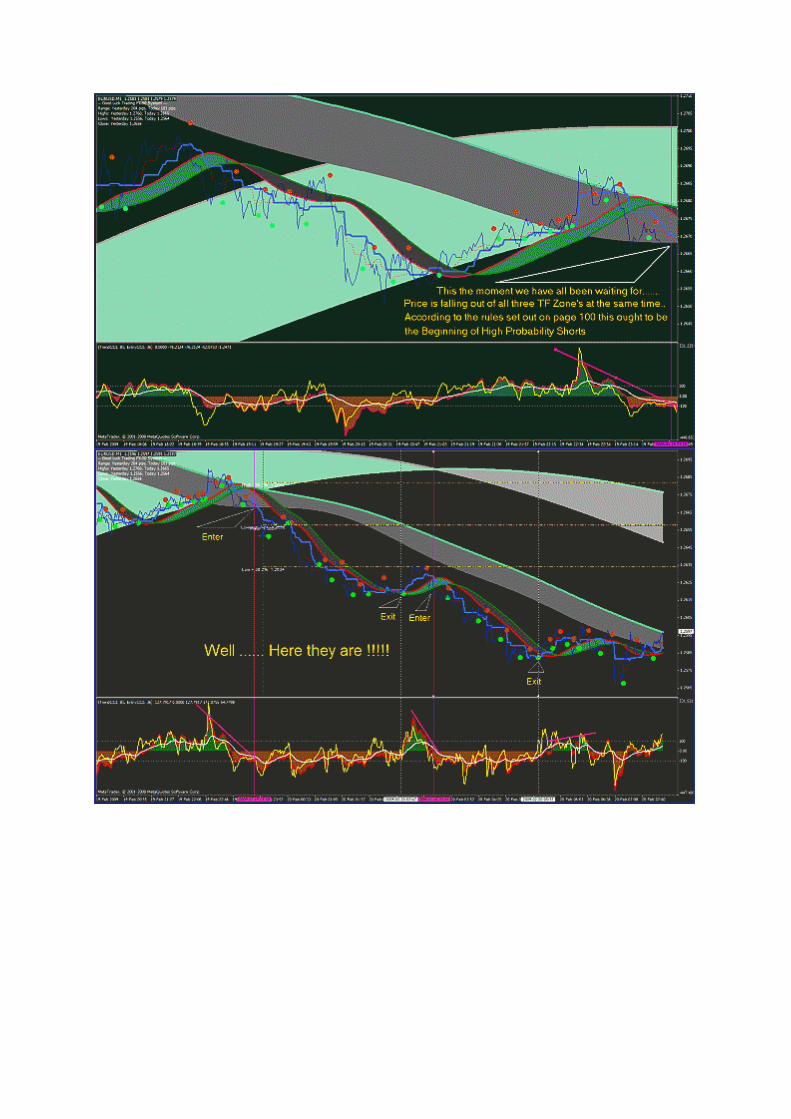
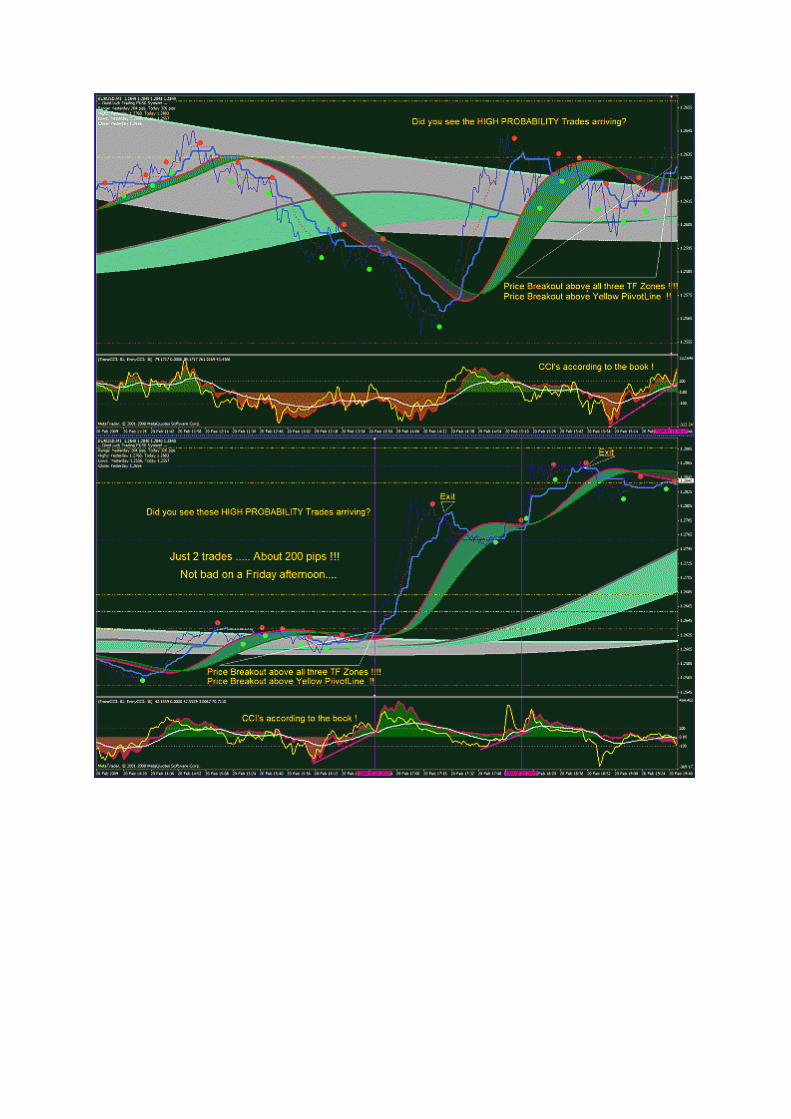
Zone Characteristics: 1. When price rises from or falls out of all three zones at the same time (especially when they are very narrow and close together) it’s going to be a high probability trade. Price goes into black area. These are by far the best trade setups….. for the simple reason that there is no price rejection by one of the other ribbons !!!! Look at example in chart 1. 2. When price rises from TF1 ribbon and TF1 ribbon starts rising above TF5 and TF15 ribbons (Strong Uptrend), it’s very likely that this breakout to the upside will present more than one trade. Most of the time two or three trades are possible here. The same goes for the opposite direction when price falls out of TF1 ribbon and TF1 ribbon falls under both TF5 and TF15 ribbon (Strong Downtrend)….. now check #Kino_CCI_RSI_v5 and look for more than 1 Short trade in a row. 3. When price goes from one zone (say TF1) towards another (say TF5) look for support or resistance on the edges. Look at Chart 2. Usually a zone can be entered by price when a zone is widening and price will be rejected when a zone is narrowing. When a Zone is very narrow resistance/ support will usually be high, though price crosses with ease right at the center crossing of a ribbon (i.e at crossing of ribbon lines of that specific TF ribbon. Most of the time this will be the case with TF1 Ribbon when this happens). 4. Trading in the space between Ribbon Zones (i.e. in black area) usually too presents good trade setup possibilities when price is not (immediately) going to be rejected by a nearby Ribbon or a pivot, etc. The wider the black space between the zones the better the chances for a good trade setup….. yet always verify any trade at the same time with #Kino_CCI_RSI_v5 and strength of divergency. 5. Trading inside a wide opened zone (say TF15) is also possible, For instance when trading GBPJPY you will notice this zone quite often to be very wide. Now when TF1 ribbon has entered and price rises or falls out of TF1 ribbon…… and simultaneously TF5 ribbon being at sufficient distance for price not to be rejected….. price quite often will rise or fall to the other side of the TF15 ribbon. Example 4: Trade starts inside TF15 ribbon on support of both TF1 and TF5 Ribbon.
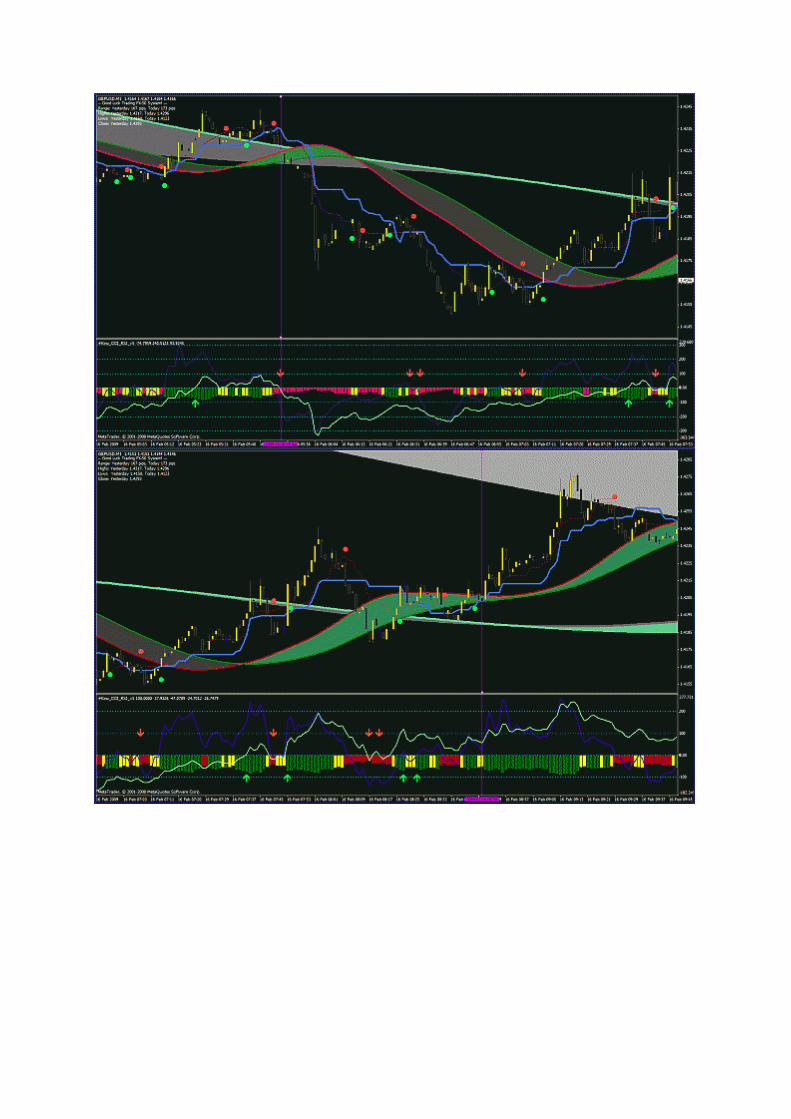
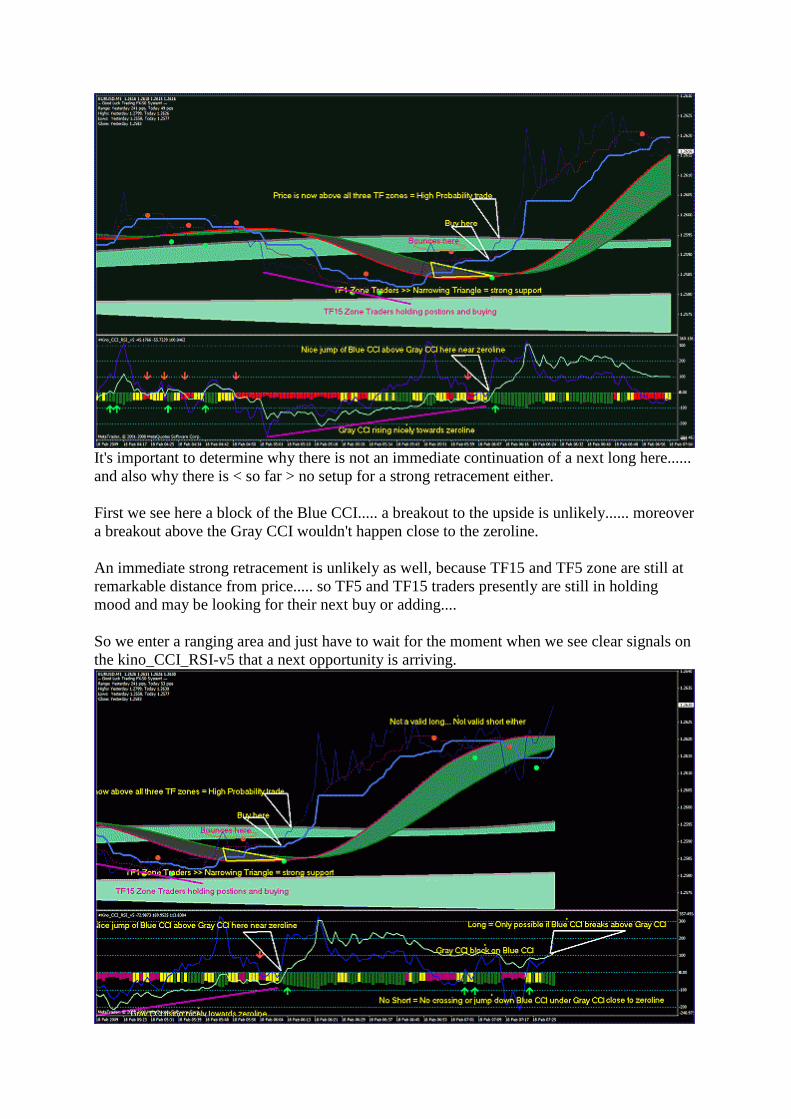
It's important to determine why there is not an immediate continuation of a next long here...... and also why there is < so far > no setup for a strong retracement either. First we see here a block of the Blue CCI..... a breakout to the upside is unlikely...... moreover a breakout above the Gray CCI wouldn't happen close to the zeroline. An immediate strong retracement is unlikely as well, because TF15 and TF5 zone are still at remarkable distance from price..... so TF5 and TF15 traders presently are still in holding mood and may be looking for their next buy or adding.... So we enter a ranging area and just have to wait for the moment when we see clear signals on the kino_CCI_RSI-v5 that a next opportunity is arriving.
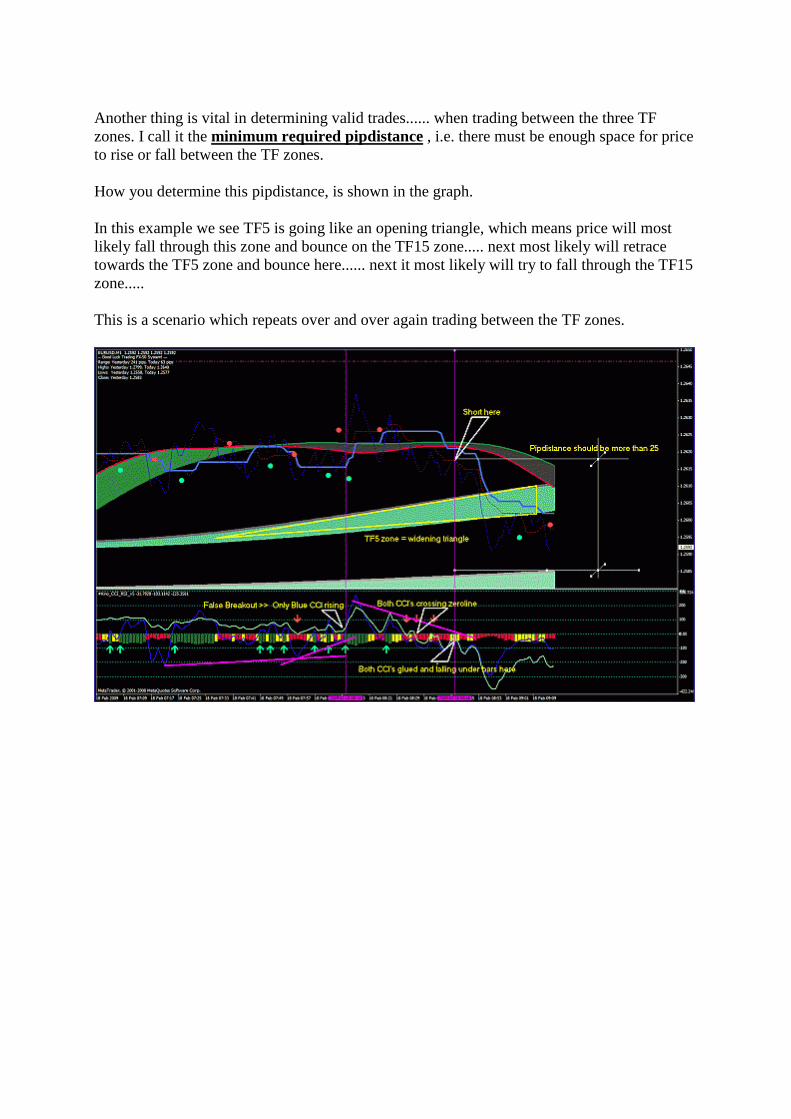
Another thing is vital in determining valid trades...... when trading between the three TF zones. I call it the minimum required pipdistance , i.e. there must be enough space for price to rise or fall between the TF zones. How you determine this pipdistance, is shown in the graph. In this example we see TF5 is going like an opening triangle, which means price will most likely fall through this zone and bounce on the TF15 zone..... next most likely will retrace towards the TF5 zone and bounce here...... next it most likely will try to fall through the TF15 zone..... This is a scenario which repeats over and over again trading between the TF zones.
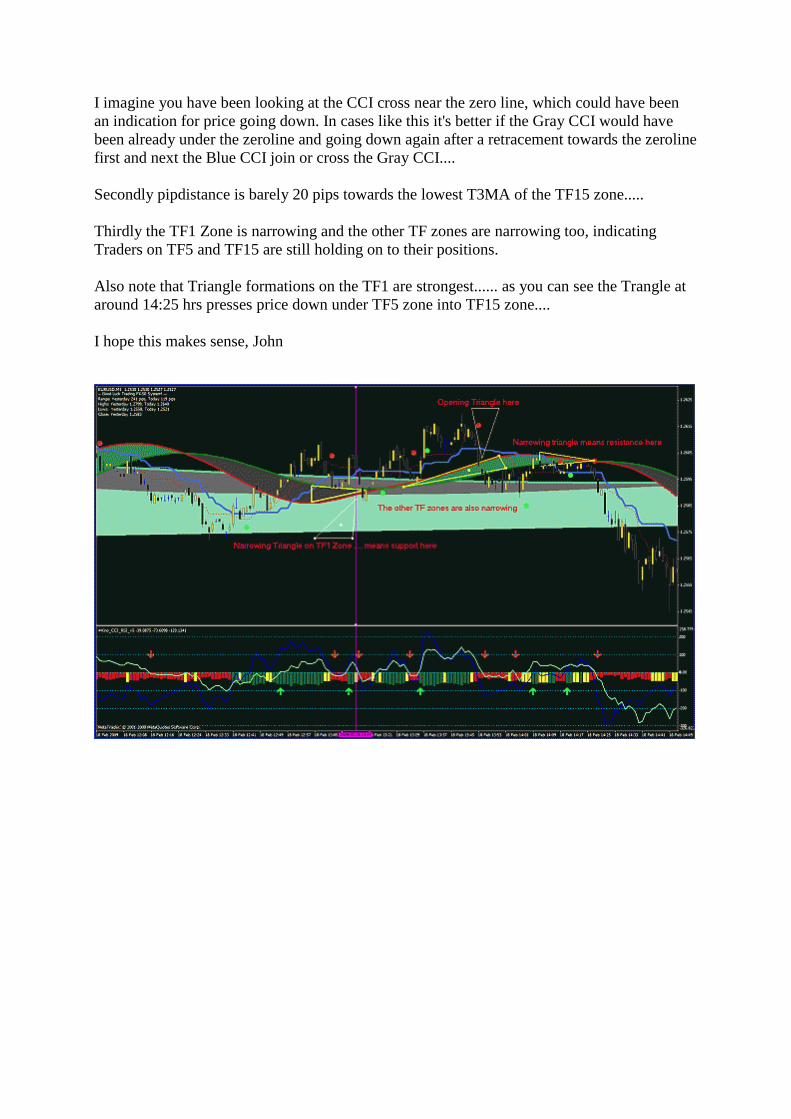
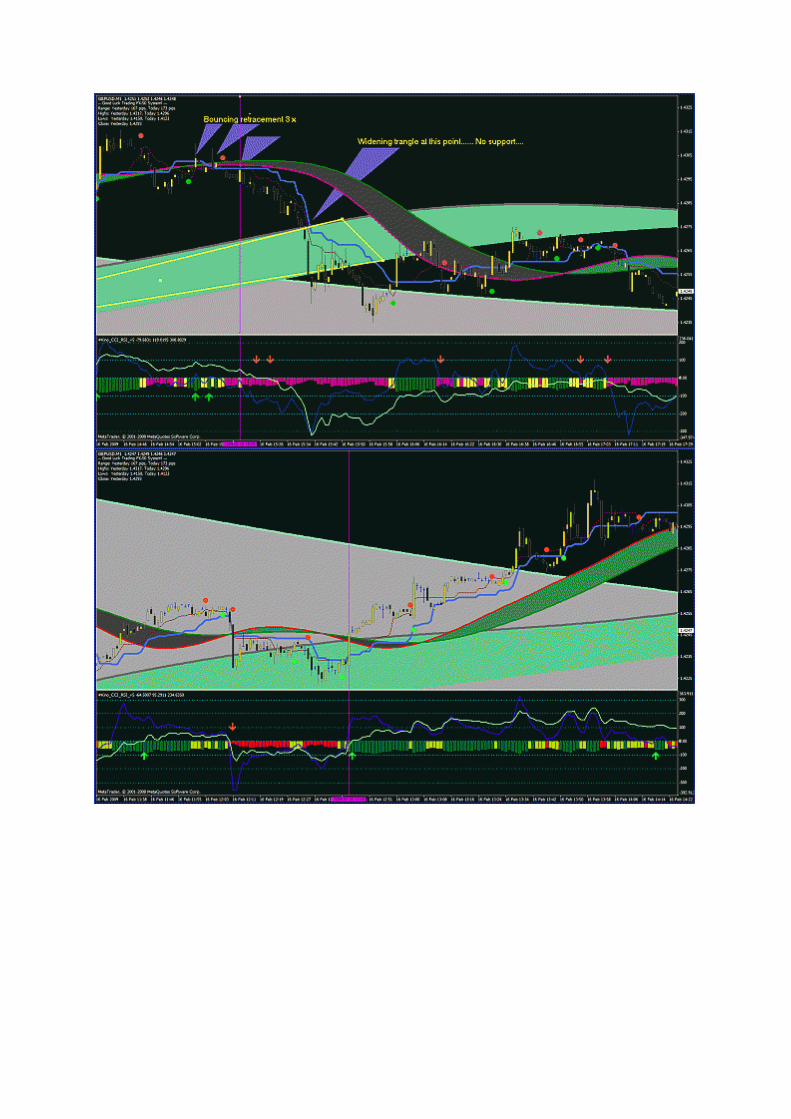
I imagine you have been looking at the CCI cross near the zero line, which could have been an indication for price going down. In cases like this it's better if the Gray CCI would have been already under the zeroline and going down again after a retracement towards the zeroline first and next the Blue CCI join or cross the Gray CCI.... Secondly pipdistance is barely 20 pips towards the lowest T3MA of the TF15 zone..... Thirdly the TF1 Zone is narrowing and the other TF zones are narrowing too, indicating Traders on TF5 and TF15 are still holding on to their positions. Also note that Triangle formations on the TF1 are strongest...... as you can see the Trangle at around 14:25 hrs presses price down under TF5 zone into TF15 zone.... I hope this makes sense, John
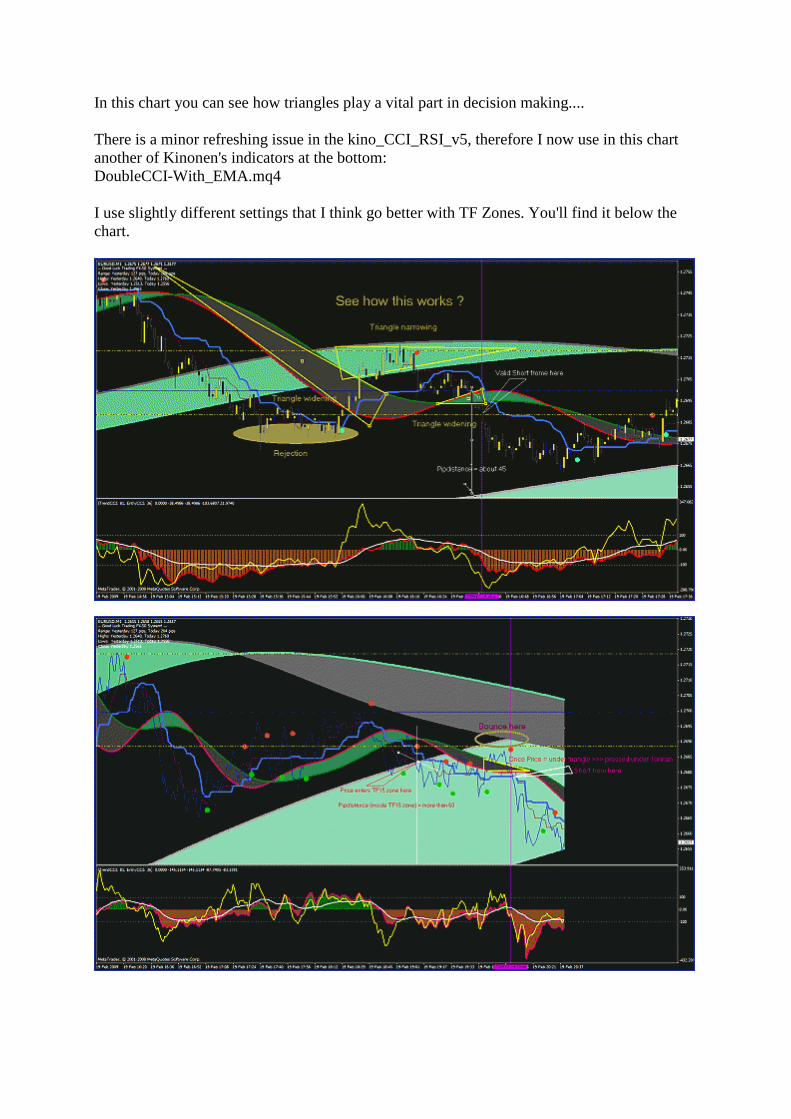
In this chart you can see how triangles play a vital part in decision making.... There is a minor refreshing issue in the kino_CCI_RSI_v5, therefore I now use in this chart another of Kinonen's indicators at the bottom: DoubleCCI-With_EMA.mq4 I use slightly different settings that I think go better with TF Zones. You'll find it below the chart.
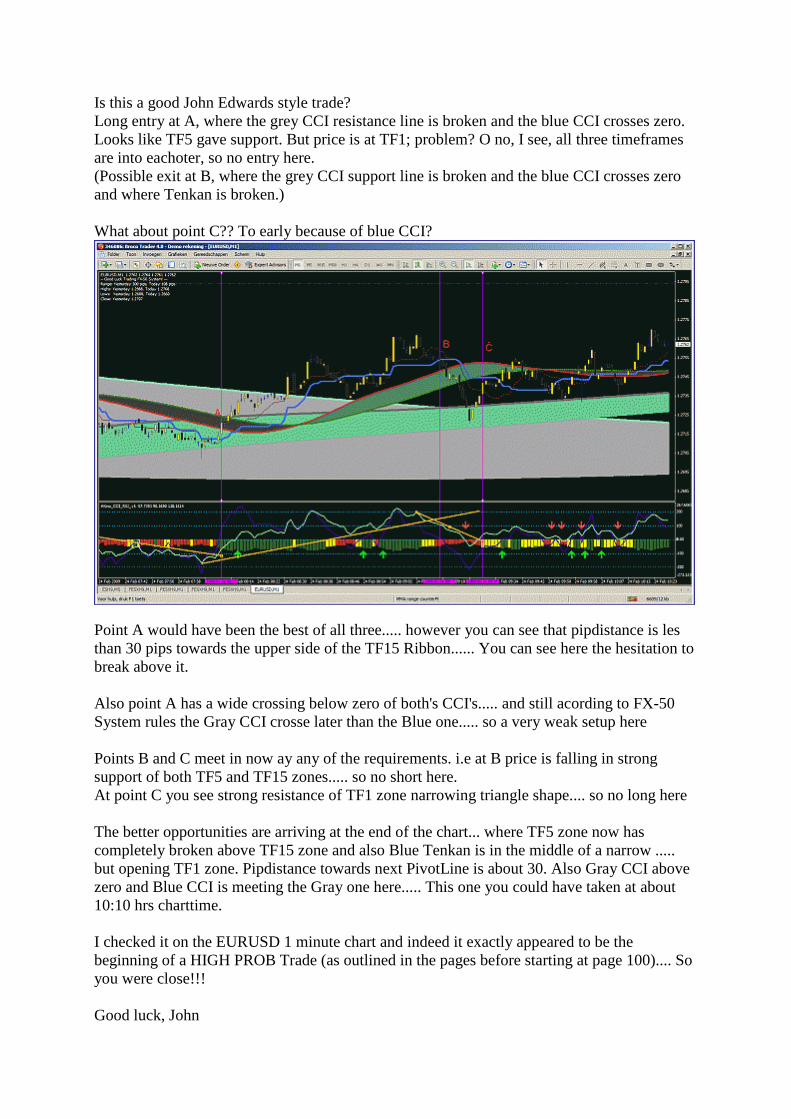
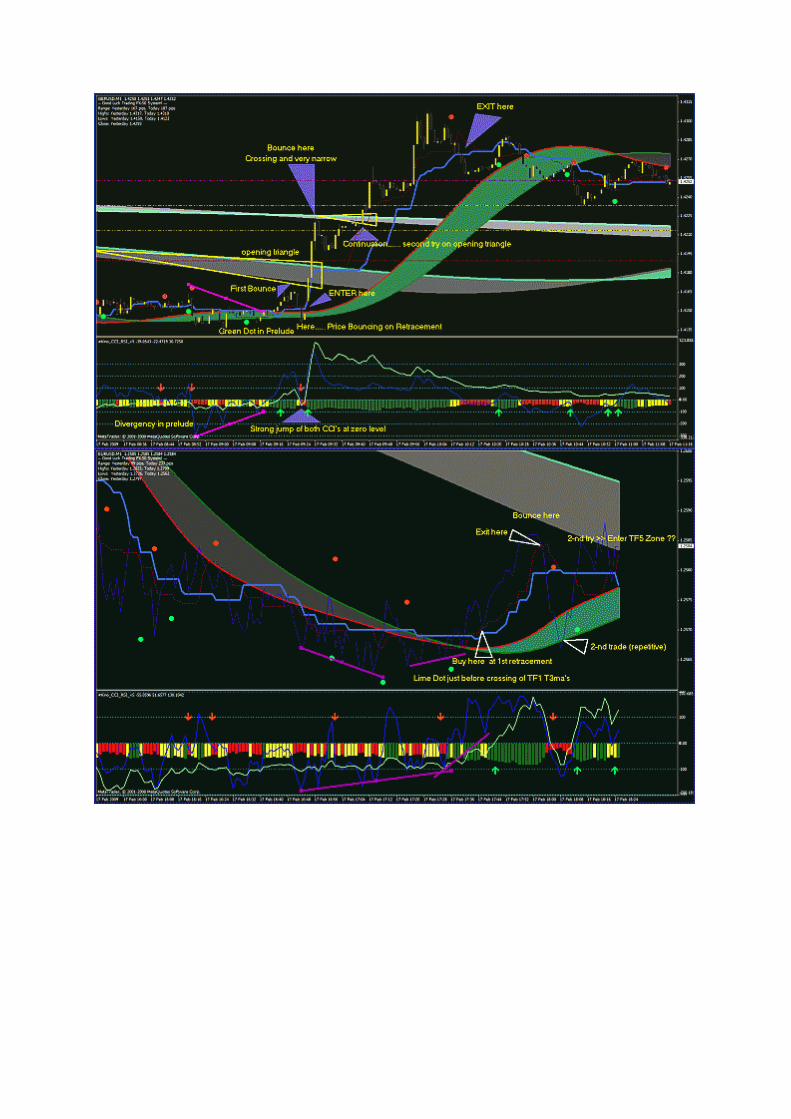
Is this a good John Edwards style trade? Long entry at A, where the grey CCI resistance line is broken and the blue CCI crosses zero. Looks like TF5 gave support. But price is at TF1; problem? O no, I see, all three timeframes are into eachoter, so no entry here. (Possible exit at B, where the grey CCI support line is broken and the blue CCI crosses zero and where Tenkan is broken.) What about point C?? To early because of blue CCI?
Point A would have been the best of all three..... however you can see that pipdistance is les than 30 pips towards the upper side of the TF15 Ribbon...... You can see here the hesitation to break above it. Also point A has a wide crossing below zero of both's CCI's..... and still acording to FX-50 System rules the Gray CCI crosse later than the Blue one..... so a very weak setup here Points B and C meet in now ay any of the requirements. i.e at B price is falling in strong support of both TF5 and TF15 zones..... so no short here. At point C you see strong resistance of TF1 zone narrowing triangle shape.... so no long here The better opportunities are arriving at the end of the chart... where TF5 zone now has completely broken above TF15 zone and also Blue Tenkan is in the middle of a narrow ..... but opening TF1 zone. Pipdistance towards next PivotLine is about 30. Also Gray CCI above zero and Blue CCI is meeting the Gray one here..... This one you could have taken at about 10:10 hrs charttime. I checked it on the EURUSD 1 minute chart and indeed it exactly appeared to be the beginning of a HIGH PROB Trade (as outlined in the pages before starting at page 100).... So you were close!!! Good luck, John
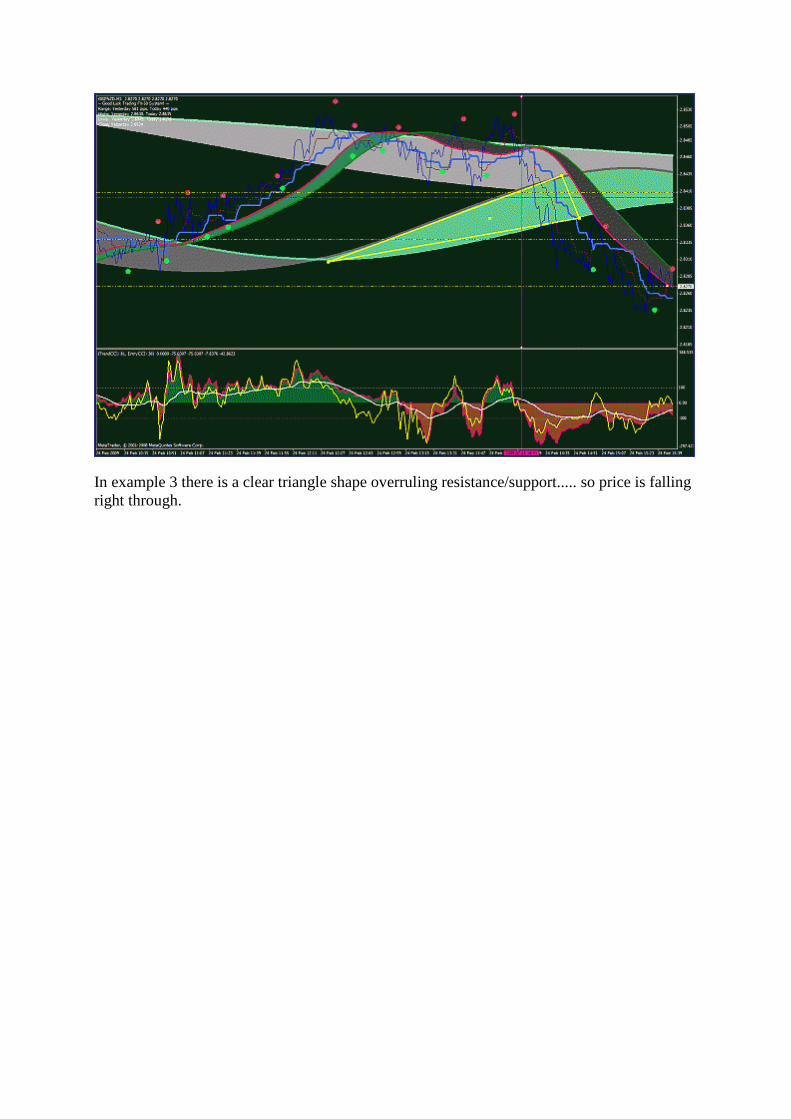
In example 3 there is a clear triangle shape overruling resistance/support..... so price is falling right through.
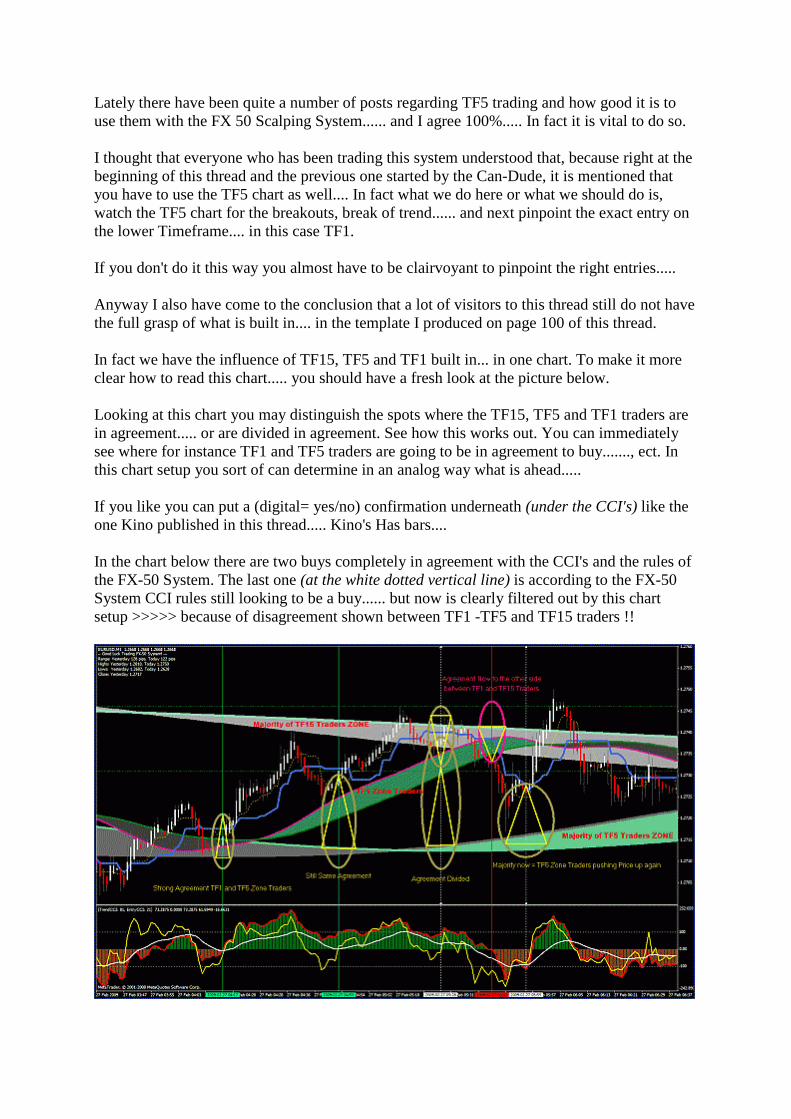
Lately there have been quite a number of posts regarding TF5 trading and how good it is to use them with the FX 50 Scalping System...... and I agree 100%..... In fact it is vital to do so. I thought that everyone who has been trading this system understood that, because right at the beginning of this thread and the previous one started by the Can-Dude, it is mentioned that you have to use the TF5 chart as well.... In fact what we do here or what we should do is, watch the TF5 chart for the breakouts, break of trend...... and next pinpoint the exact entry on the lower Timeframe.... in this case TF1. If you don't do it this way you almost have to be clairvoyant to pinpoint the right entries..... Anyway I also have come to the conclusion that a lot of visitors to this thread still do not have the full grasp of what is built in.... in the template I produced on page 100 of this thread. In fact we have the influence of TF15, TF5 and TF1 built in... in one chart. To make it more clear how to read this chart..... you should have a fresh look at the picture below. Looking at this chart you may distinguish the spots where the TF15, TF5 and TF1 traders are in agreement..... or are divided in agreement. See how this works out. You can immediately see where for instance TF1 and TF5 traders are going to be in agreement to buy......., ect. In this chart setup you sort of can determine in an analog way what is ahead..... If you like you can put a (digital= yes/no) confirmation underneath (under the CCI's) like the one Kino published in this thread..... Kino's Has bars.... In the chart below there are two buys completely in agreement with the CCI's and the rules of the FX-50 System. The last one (at the white dotted vertical line) is according to the FX-50 System CCI rules still looking to be a buy...... but now is clearly filtered out by this chart setup >>>>> because of disagreement shown between TF1 -TF5 and TF15 traders !!
Post 1672: I would like to lay down a few guidlines as I see will help others with trading this system. Using the ribbons on the screen, along with the CC indicator, here is how I am seeing the best trading scenarios and they all involve trading the lower TF ribbons into the upper TF ribbons, and usually when there is plent of space between them. Possible examples. 1M into the 5M 5M into the 15M 1M into the 15M I would not trade in this direction 5M into the 1M 15M into the 1M 15M into the 5M I would also only make these trades out in space. Which means that if you uploaded the template, I would only trade when you are moving towards blackness on your charts and definitely not when you are inside the rainbow. When you are in the rainbow it is time to get up and take a break. Now, when using the MACD and divergence, I would take a divergence trade no matter where it occurred. Here is the MACD divergence indicator I am using. Please note that I am using the smoothing lines for signals and not the histogram part. Enjoy and I will be around if you have any questions.... MACDTraditional.ex4 John Edawards, you may have not gotten the nomination, but you have given us one H%ll of a roadmap to success. cudos to you...I can't thank you enough for that. .......... I have taken JE v2 template and put it on both the 1M and 5M charts. then I take the lowest ribbon on the M5 chart and decide if price is above or below that ribbon. If price is above that ribbon, then i only trade long on the 1M chart and if it is below that ribbon on only trade short on the 1M chart. I also take no trades on the 1M chart if I am not trading into blackness I don't take the trade. Think of the blackness on the template as either the ocean or the stars. and think of the ribbons as either coral refes or meteror showers. And think of price as your subamarine or your spaceship. Would you drive your sub into a coral ref or a meteor shower on purpose? And it is always best if the ribbons are lined up in sequntial order as well. now find a way to

feel the market. If the double CCI cross does that for you then use it, if not find somthing else..... Hope that this is helpful...Damon
Okay here is the update I promised last week. On both templates FXprime_V2-JE.mq4 is being used the same way..... Upper FXprime with faster CCI settings and lower FXprime with slower CCI settings. Both are tweaked in such a way that when the dots on the lower FXprime appear this may be taken as an alert... I am not going to explain how to use FXprime for there are plenty of posts in this thread that convey all of that. The only thing to be mentioned, although quite obvious is: When the lower FXprime is red and the upper FXprime becomes Red too.... this marks possible entries for Shorts that should be examined further. The same for Longs of course: When the Lower FXprime is Green and the upper FXprime becomes Green as well this marks possible entries for Longs that should be examined further. Simultaneously we look at what price is doing: Is it coming free from the ribbons? What is the pipdistance towards the next Ribbon or to a Fibo- or Pivot-level? Simultaneously we look at the DoubleCCI-With_SMA. This one has already been published in this thread some months ago, but comes in quite handy with this setup using FXprime_V2 Final-JE.mq4 twice. As a rule when using DoubleCCI-With_SMA in this setup you may do the following: Usually good entries occur for long...... when CCI is above +67 and above SMA..... Most of the time marked by a retracement of the CCI back towards the SMA and/or +67 line. Under all circumstances look for divergencies in the prelude to an entry..... Usually good entries occur for short..... when CCI is below-67 and below SMA.... Most of the time marked by a retracement of the CCI back towards the SMA and/or -67 line. Under all circumstances look for divergencies in the prelude to an entry.... The first template has the settings of the ribbons first used and published on page 100 of this thread. B.T.W. Besides the ones you find beneath the Chartgraph....... You need all the indicators of all my posts on page 100. If you wish to use BrainTrend4Sig, MACandles or Randy Candles on the chart.... They are available in the templates as well. Right click on the chart and change the Vizualisation setting from Monthly to All Timeframes. You may also have to change the ChartOnForeground setting. To do this right click on the chart and look for this setting in the Properties window (F8). The JE-Bar_Trend.mq4 you'll find in post #1601. Some indicators may be found in post #1673 and the MACandles.mq4 is in post #1754 The second template uses slightly different settings and has another TF zone added. I.E. in this template there now are 4 TF zones..... TF1, TF5, TF15 and TF30. This has been done because the TFzones are a bit faster here and therefore we now need TF30 as well. The advantage is that exits now are marked a bit earlier as well. The Kijun-Tenkan is being used for tradeguidance. The rules for using this second template are not different from the ones published on page 100 !! The Kijun/Tenkan also helps identifying entries and exits when it exits/enters the TF1
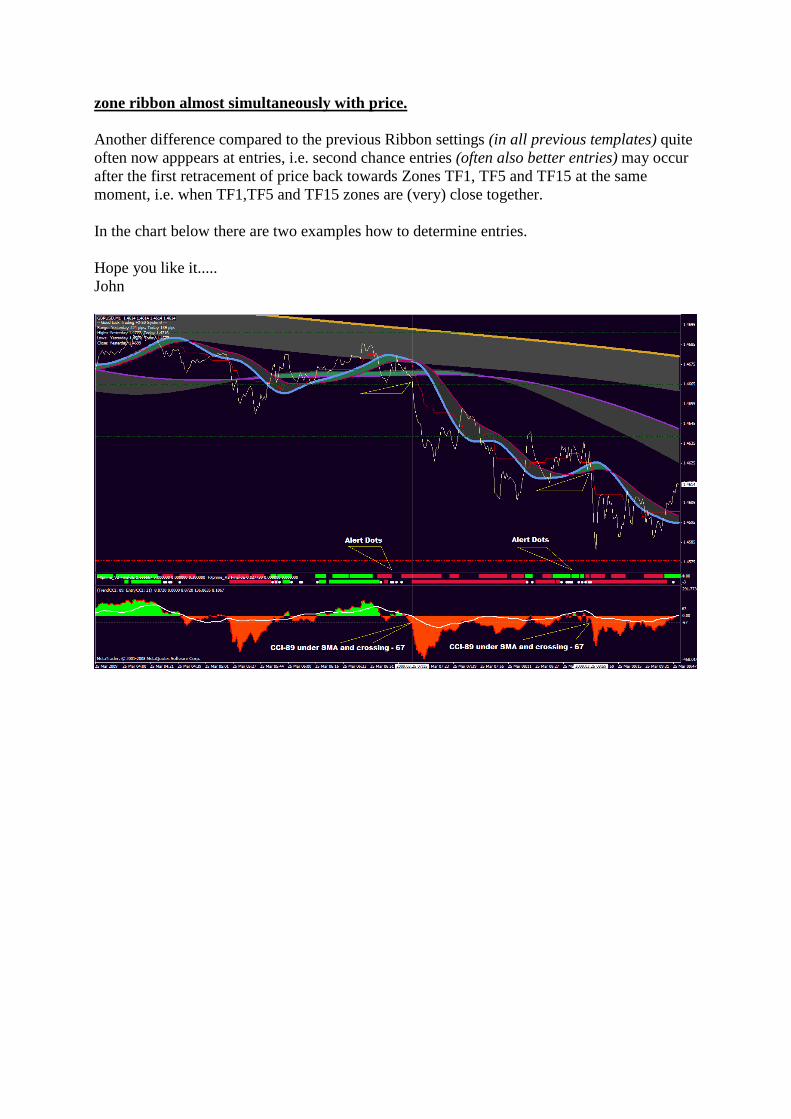
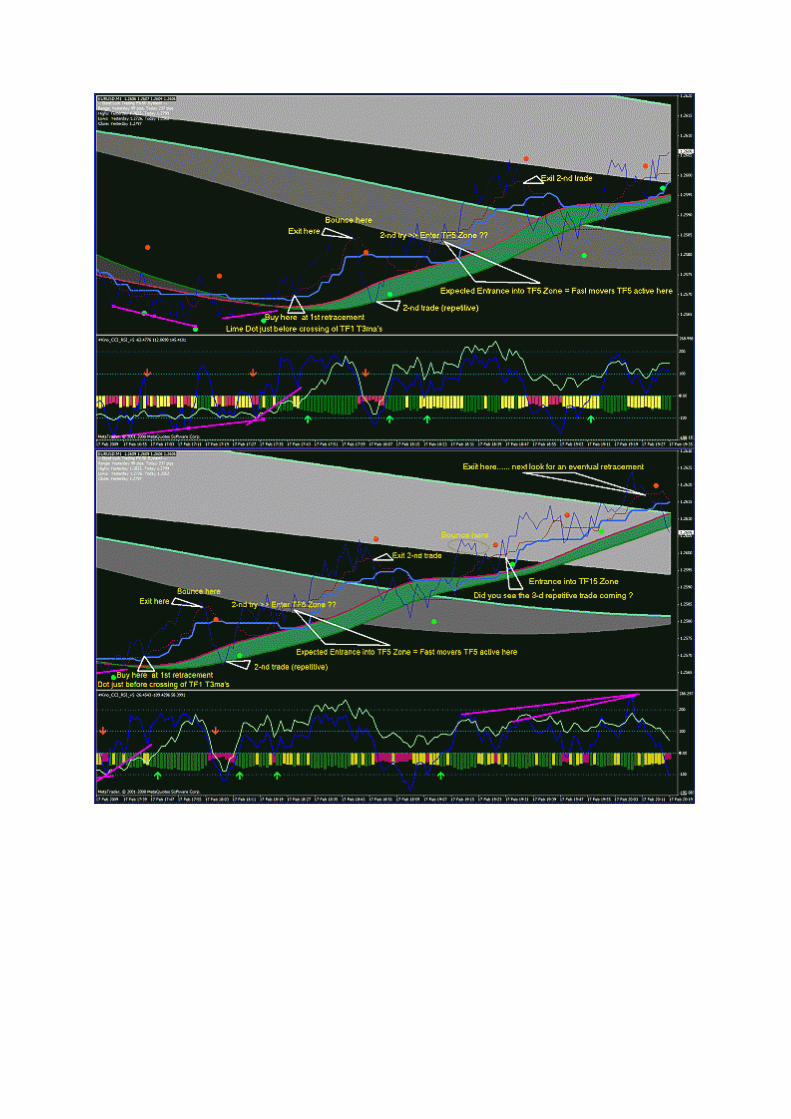
zone ribbon almost simultaneously with price. Another difference compared to the previous Ribbon settings (in all previous templates) quite often now apppears at entries, i.e. second chance entries (often also better entries) may occur after the first retracement of price back towards Zones TF1, TF5 and TF15 at the same moment, i.e. when TF1,TF5 and TF15 zones are (very) close together. In the chart below there are two examples how to determine entries. Hope you like it..... John
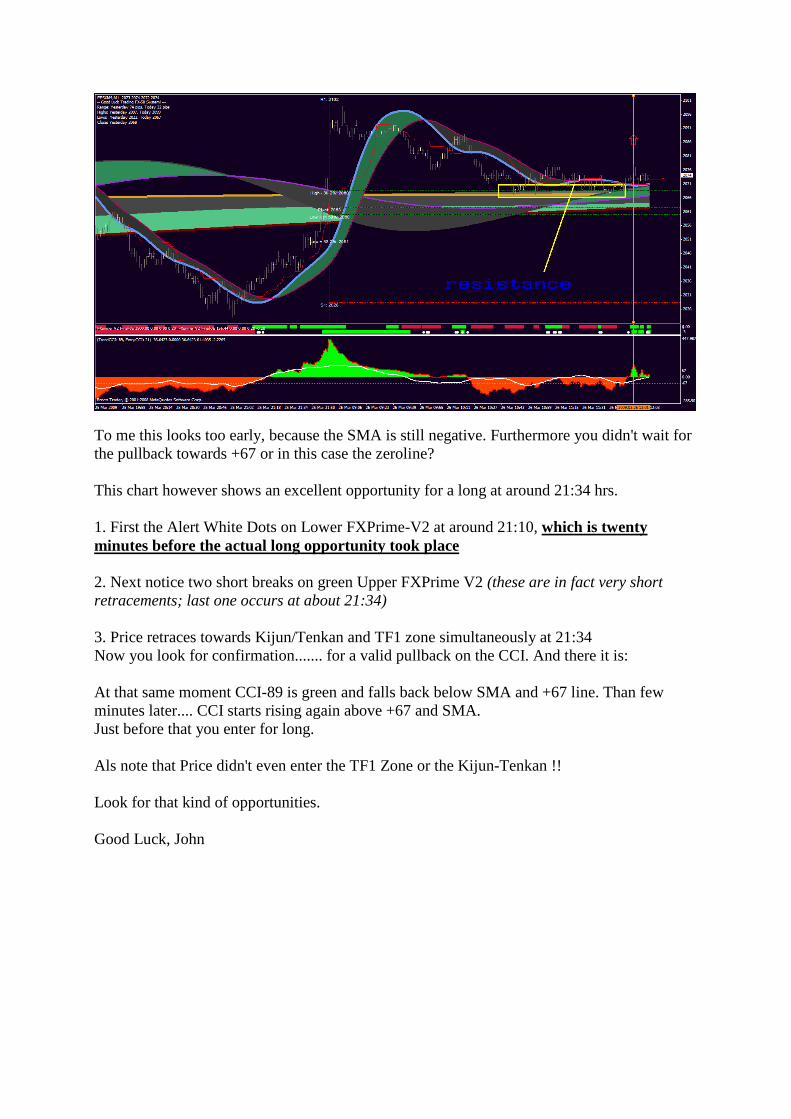
To me this looks too early, because the SMA is still negative. Furthermore you didn't wait for the pullback towards +67 or in this case the zeroline? This chart however shows an excellent opportunity for a long at around 21:34 hrs. 1. First the Alert White Dots on Lower FXPrime-V2 at around 21:10, which is twenty minutes before the actual long opportunity took place 2. Next notice two short breaks on green Upper FXPrime V2 (these are in fact very short retracements; last one occurs at about 21:34) 3. Price retraces towards Kijun/Tenkan and TF1 zone simultaneously at 21:34 Now you look for confirmation....... for a valid pullback on the CCI. And there it is: At that same moment CCI-89 is green and falls back below SMA and +67 line. Than few minutes later.... CCI starts rising again above +67 and SMA. Just before that you enter for long. Als note that Price didn't even enter the TF1 Zone or the Kijun-Tenkan !! Look for that kind of opportunities. Good Luck, John
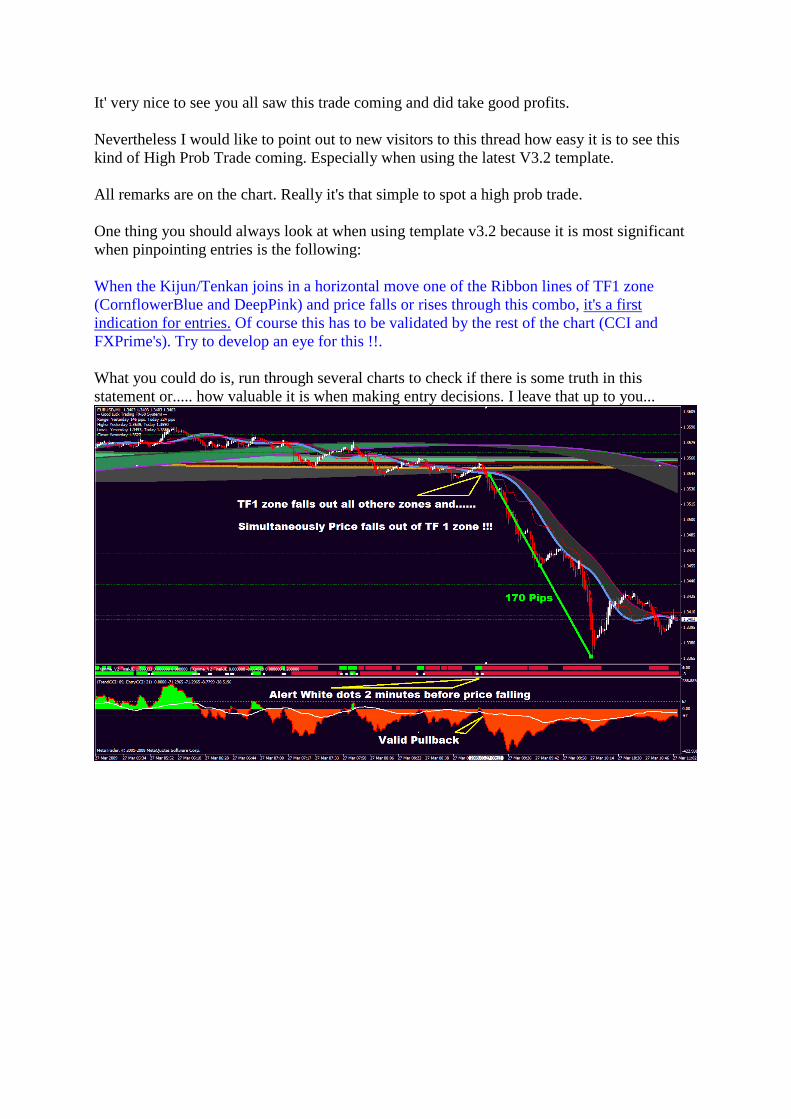
It' very nice to see you all saw this trade coming and did take good profits. Nevertheless I would like to point out to new visitors to this thread how easy it is to see this kind of High Prob Trade coming. Especially when using the latest V3.2 template. All remarks are on the chart. Really it's that simple to spot a high prob trade. One thing you should always look at when using template v3.2 because it is most significant when pinpointing entries is the following: When the Kijun/Tenkan joins in a horizontal move one of the Ribbon lines of TF1 zone (CornflowerBlue and DeepPink) and price falls or rises through this combo, it's a first indication for entries. Of course this has to be validated by the rest of the chart (CCI and FXPrime's). Try to develop an eye for this !!. What you could do is, run through several charts to check if there is some truth in this statement or..... how valuable it is when making entry decisions. I leave that up to you...
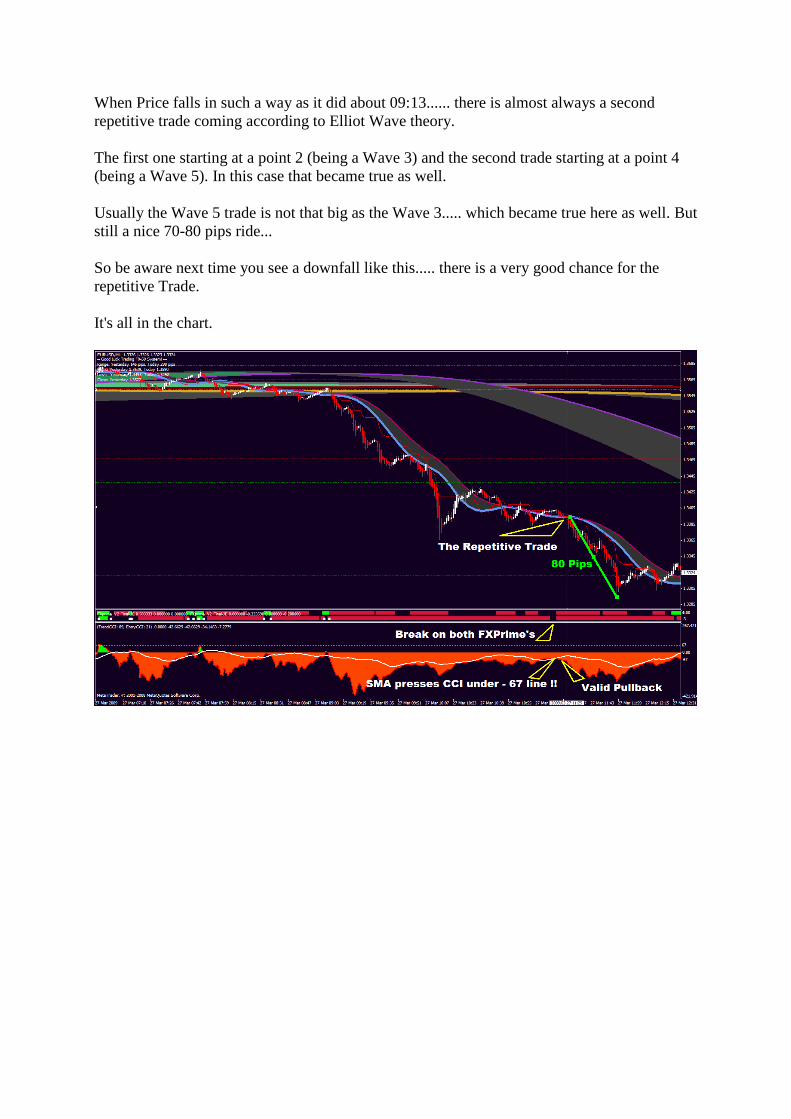
When Price falls in such a way as it did about 09:13...... there is almost always a second repetitive trade coming according to Elliot Wave theory. The first one starting at a point 2 (being a Wave 3) and the second trade starting at a point 4 (being a Wave 5). In this case that became true as well. Usually the Wave 5 trade is not that big as the Wave 3..... which became true here as well. But still a nice 70-80 pips ride... So be aware next time you see a downfall like this..... there is a very good chance for the repetitive Trade. It's all in the chart.

There are several ways to determine the exit.
Hi Pipster, On this chart there are some possibilities you may have look at: 1. The trendline on the chart, either drawn on price or drawn along side the Kijun/Tenkan. The cross provides an exit. However when you expect a possible bounce of Price (in this case made visual by Randy Candles) on the TF1 zone, you may decide to let it run. An other possibility is.... Place two short positions when beginning a High Prob Trade...... Close 1 trade when you feel unsecure at this point and .... Let the other one run and see if it develops further in your favor..... as would heave been the case here. 2. The upper FXPrime most of the time also provides good exits as you can see. 3. Another exit strategy is provided by the SMA. When Short.... SMA under the -67 line turning up from a trendline over the latest part of the SMA. You see an opening is being created with all exits. 4. Another one is provided by the blue BrainTrend4Sis dots. Your question about entering a short above a single Pivot- or Fibline only can be done when there has been a bounce of price shortly before on that Fibline. If not don't go ahead and wait until you have seen a bounce. The next retry for Price to go down usually succeeds...... at least when there is nothing else in the way (i.e. Fib- Pivotline or ribbons). Continuation of Price in the same direction as it did go before....... is especially most likely when Price now falls out of a triangle shape.... or rises up from from a triangle shape when price is rising of course. Price falling out of or rising from a triangle always has some boost power to cross ribbons, Pivot- and Fiblines. There are four examples on this chart for re-entry this way. Take care that at the narrowing point of the triangle you see at least one bounce on either side before price starts breaking out of the triangle !! Hope this helps, John
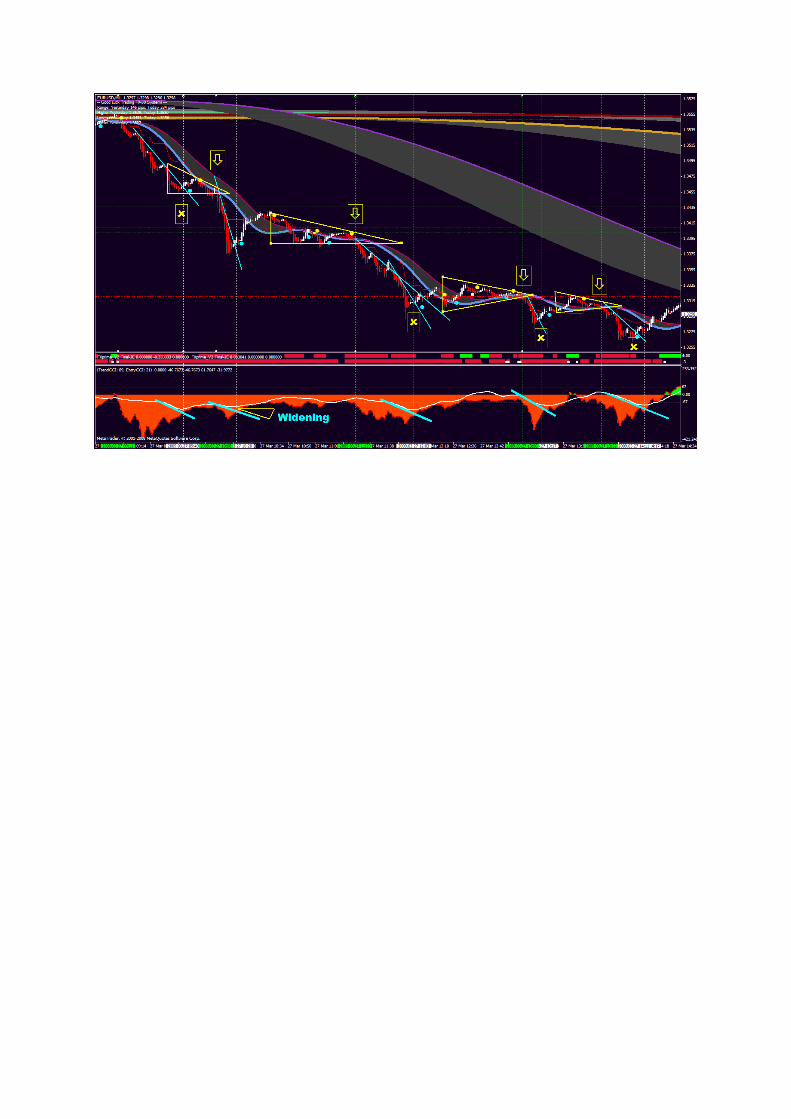
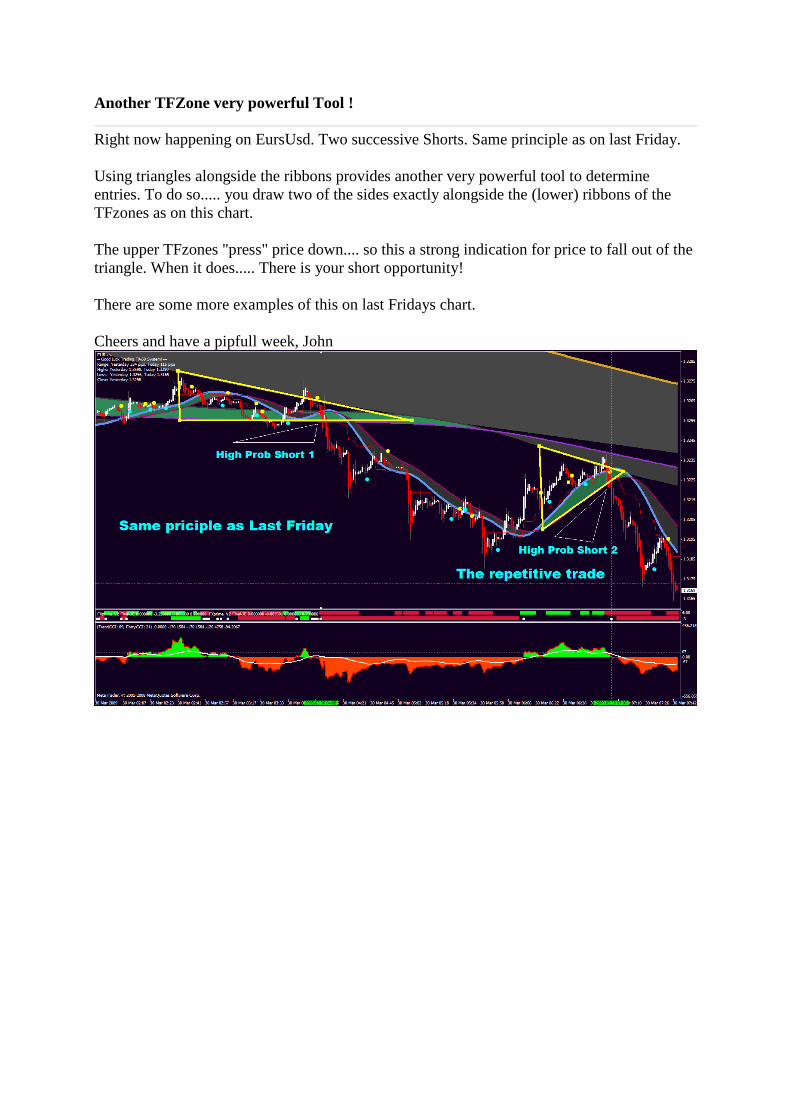
Another TFZone very powerful Tool !
Right now happening on EursUsd. Two successive Shorts. Same principle as on last Friday. Using triangles alongside the ribbons provides another very powerful tool to determine entries. To do so..... you draw two of the sides exactly alongside the (lower) ribbons of the TFzones as on this chart. The upper TFzones "press" price down.... so this a strong indication for price to fall out of the triangle. When it does..... There is your short opportunity! There are some more examples of this on last Fridays chart. Cheers and have a pipfull week, John
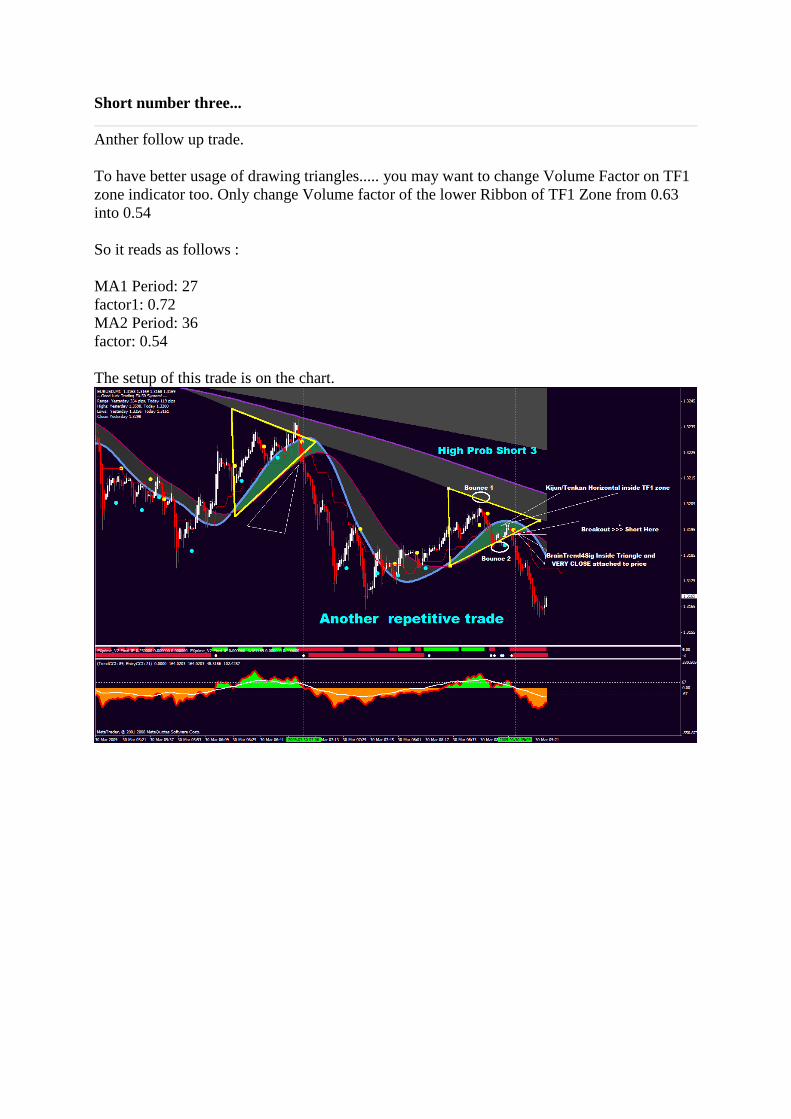
Short number three...
Anther follow up trade. To have better usage of drawing triangles..... you may want to change Volume Factor on TF1 zone indicator too. Only change Volume factor of the lower Ribbon of TF1 Zone from 0.63 into 0.54 So it reads as follows : MA1 Period: 27 factor1: 0.72 MA2 Period: 36 factor: 0.54 The setup of this trade is on the chart.
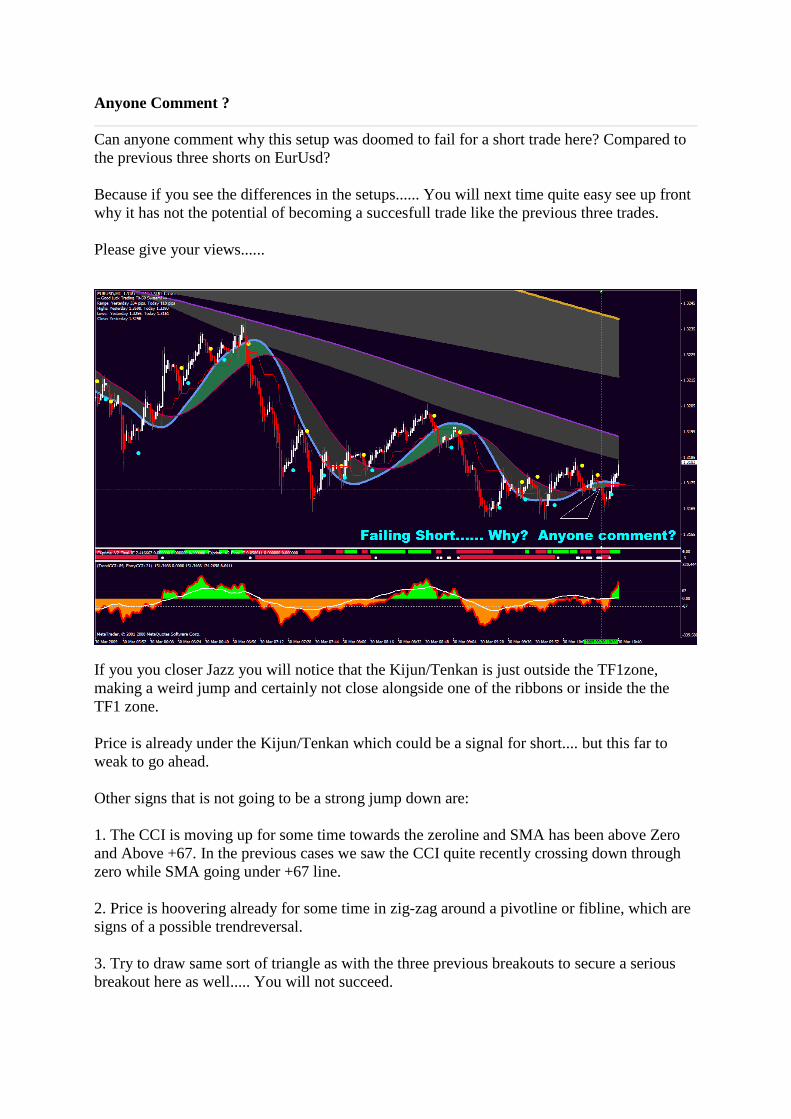
Anyone Comment ?
Can anyone comment why this setup was doomed to fail for a short trade here? Compared to the previous three shorts on EurUsd? Because if you see the differences in the setups...... You will next time quite easy see up front why it has not the potential of becoming a succesfull trade like the previous three trades. Please give your views......
If you you closer Jazz you will notice that the Kijun/Tenkan is just outside the TF1zone, making a weird jump and certainly not close alongside one of the ribbons or inside the the TF1 zone. Price is already under the Kijun/Tenkan which could be a signal for short.... but this far to weak to go ahead. Other signs that is not going to be a strong jump down are: 1. The CCI is moving up for some time towards the zeroline and SMA has been above Zero and Above +67. In the previous cases we saw the CCI quite recently crossing down through zero while SMA going under +67 line. 2. Price is hoovering already for some time in zig-zag around a pivotline or fibline, which are signs of a possible trendreversal. 3. Try to draw same sort of triangle as with the three previous breakouts to secure a serious breakout here as well..... You will not succeed.
Breaking out of a triangle shape always gives a boost to price. Lack of boost power is one of the most significant marks of a failing trade. 4. There were already three shorts in a row, which usually marks the end of a complete Elliot Wave . Have a look at my next post to see how you could have traded the breakout to upside. Cheers, John
Quote:
Originally Posted by Jazz1964 KijunTenkan is not in free area.......
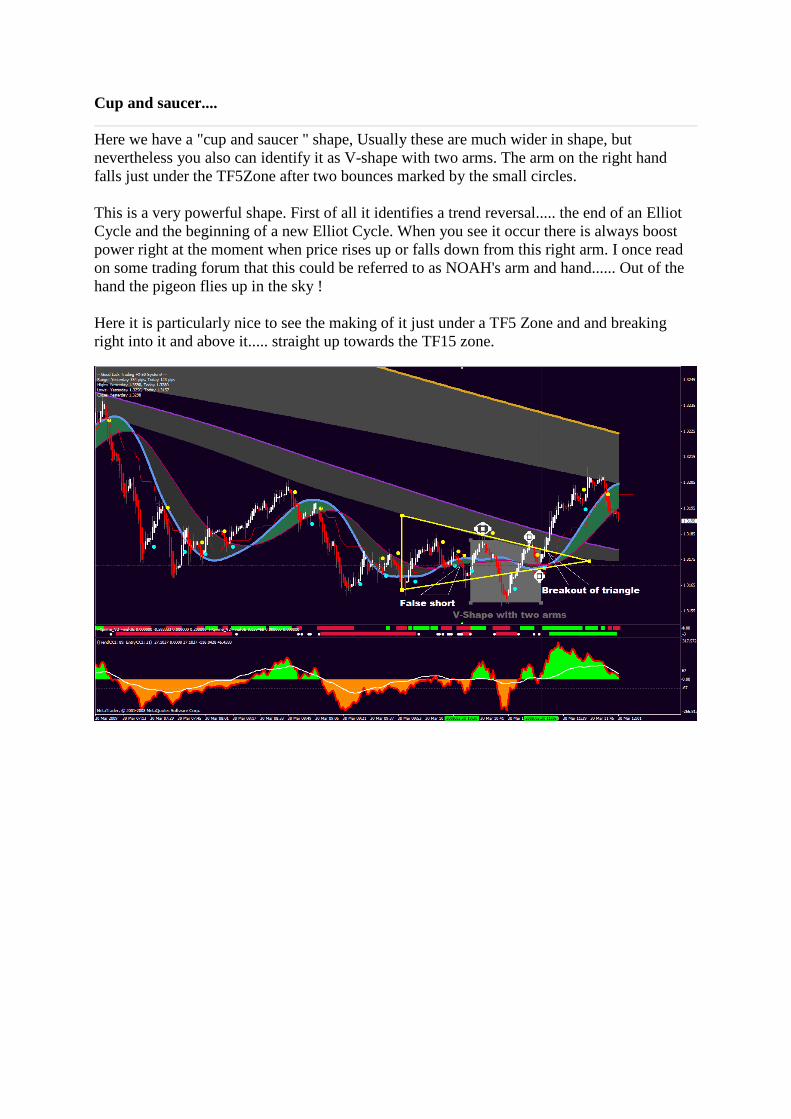
Cup and saucer....
Here we have a "cup and saucer " shape, Usually these are much wider in shape, but nevertheless you also can identify it as V-shape with two arms. The arm on the right hand falls just under the TF5Zone after two bounces marked by the small circles. This is a very powerful shape. First of all it identifies a trend reversal..... the end of an Elliot Cycle and the beginning of a new Elliot Cycle. When you see it occur there is always boost power right at the moment when price rises up or falls down from this right arm. I once read on some trading forum that this could be referred to as NOAH's arm and hand...... Out of the hand the pigeon flies up in the sky ! Here it is particularly nice to see the making of it just under a TF5 Zone and and breaking right into it and above it..... straight up towards the TF15 zone.
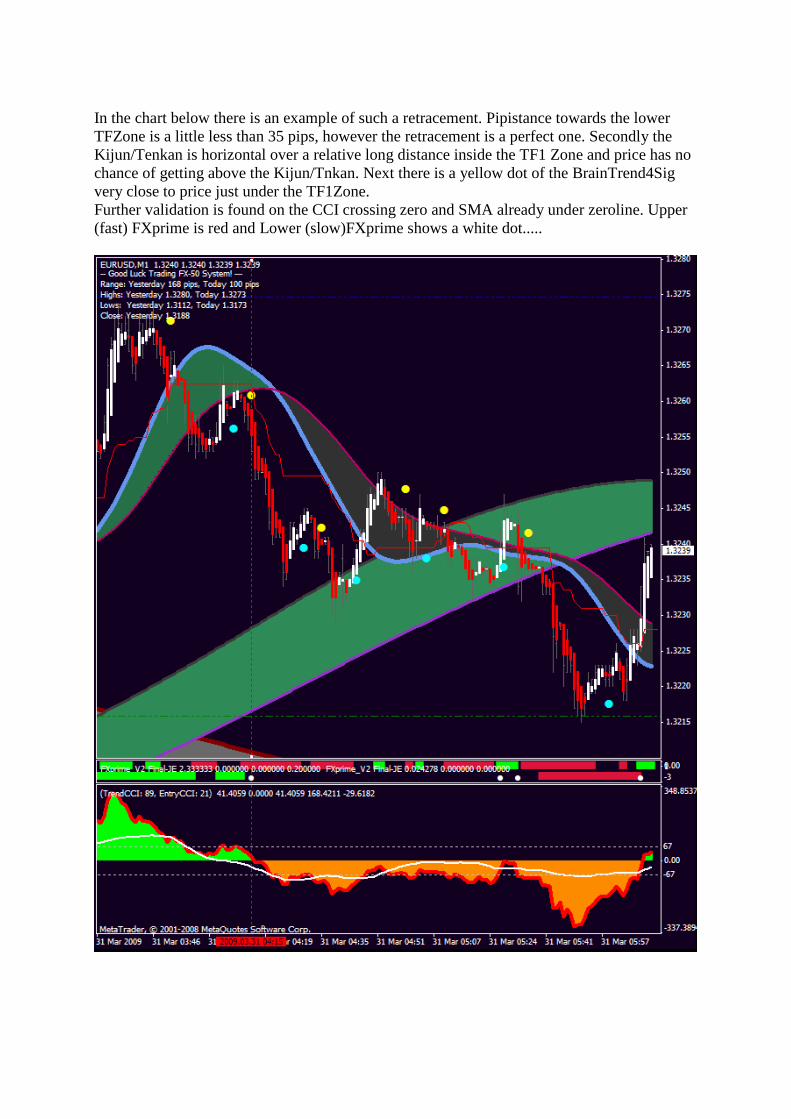
In the chart below there is an example of such a retracement. Pipistance towards the lower TFZone is a little less than 35 pips, however the retracement is a perfect one. Secondly the Kijun/Tenkan is horizontal over a relative long distance inside the TF1 Zone and price has no chance of getting above the Kijun/Tnkan. Next there is a yellow dot of the BrainTrend4Sig very close to price just under the TF1Zone. Further validation is found on the CCI crossing zero and SMA already under zeroline. Upper (fast) FXprime is red and Lower (slow)FXprime shows a white dot.....
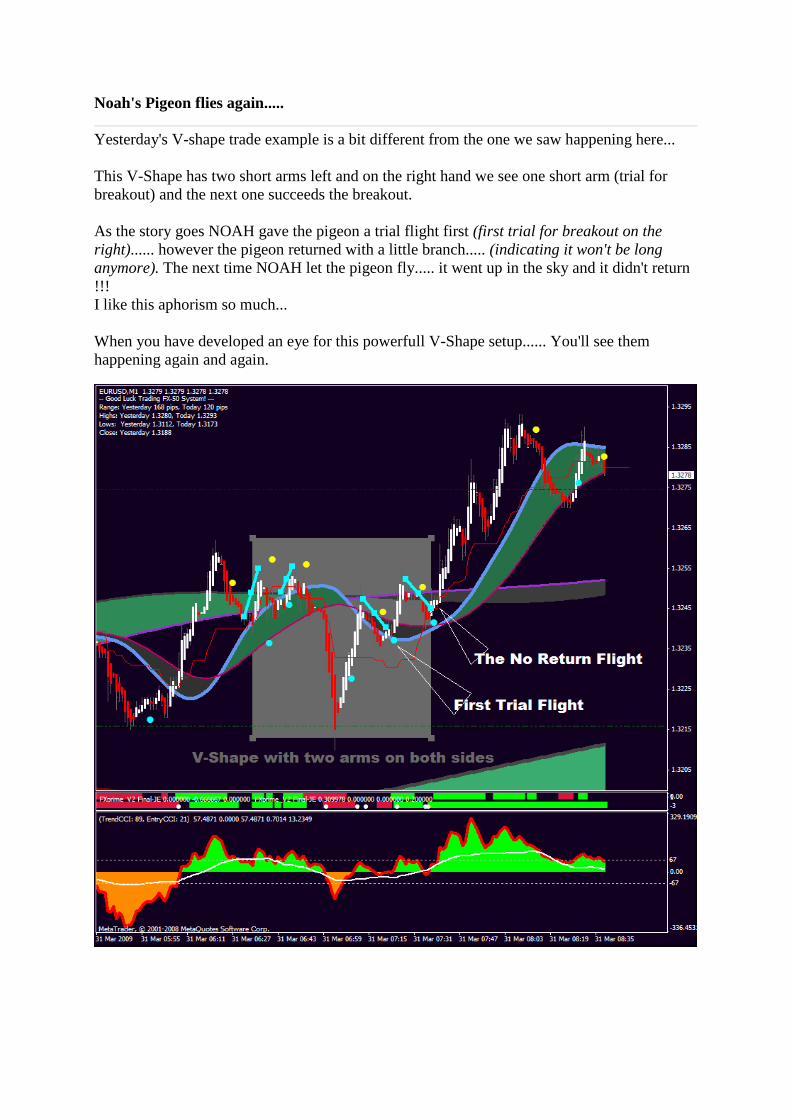
Noah's Pigeon flies again.....
Yesterday's V-shape trade example is a bit different from the one we saw happening here... This V-Shape has two short arms left and on the right hand we see one short arm (trial for breakout) and the next one succeeds the breakout. As the story goes NOAH gave the pigeon a trial flight first (first trial for breakout on the right)...... however the pigeon returned with a little branch..... (indicating it won't be long anymore). The next time NOAH let the pigeon fly..... it went up in the sky and it didn't return !!! I like this aphorism so much... When you have developed an eye for this powerfull V-Shape setup...... You'll see them happening again and again.
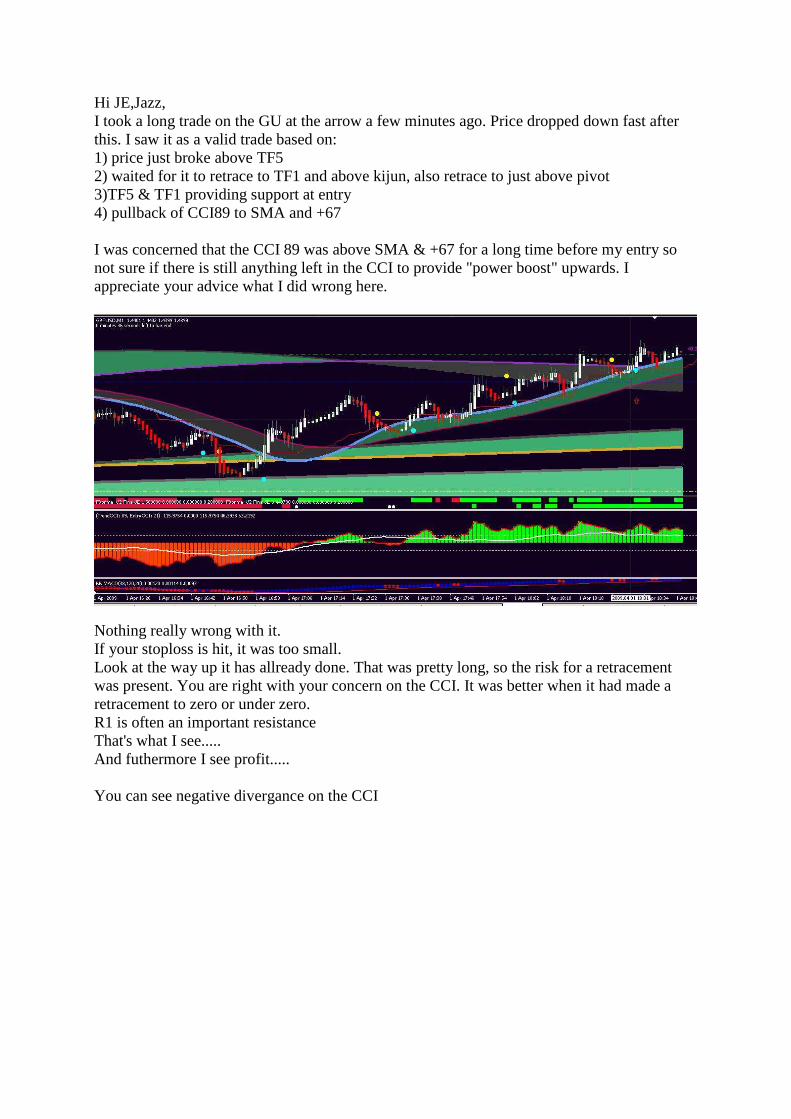
Hi JE,Jazz, I took a long trade on the GU at the arrow a few minutes ago. Price dropped down fast after this. I saw it as a valid trade based on: 1) price just broke above TF5 2) waited for it to retrace to TF1 and above kijun, also retrace to just above pivot 3)TF5 & TF1 providing support at entry 4) pullback of CCI89 to SMA and +67 I was concerned that the CCI 89 was above SMA & +67 for a long time before my entry so not sure if there is still anything left in the CCI to provide "power boost" upwards. I appreciate your advice what I did wrong here.
Nothing really wrong with it. If your stoploss is hit, it was too small. Look at the way up it has allready done. That was pretty long, so the risk for a retracement was present. You are right with your concern on the CCI. It was better when it had made a retracement to zero or under zero. R1 is often an important resistance That's what I see..... And futhermore I see profit..... You can see negative divergance on the CCI
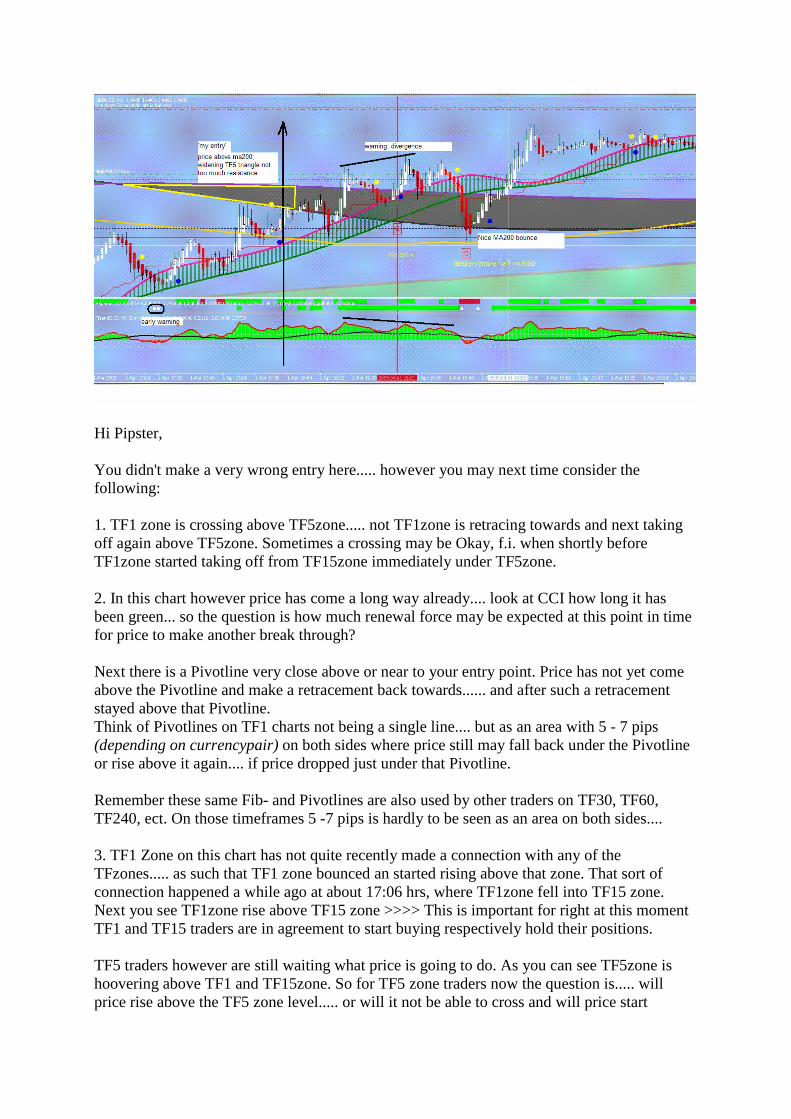
Hi Pipster, You didn't make a very wrong entry here..... however you may next time consider the following: 1. TF1 zone is crossing above TF5zone..... not TF1zone is retracing towards and next taking off again above TF5zone. Sometimes a crossing may be Okay, f.i. when shortly before TF1zone started taking off from TF15zone immediately under TF5zone. 2. In this chart however price has come a long way already.... look at CCI how long it has been green... so the question is how much renewal force may be expected at this point in time for price to make another break through? Next there is a Pivotline very close above or near to your entry point. Price has not yet come above the Pivotline and make a retracement back towards...... and after such a retracement stayed above that Pivotline. Think of Pivotlines on TF1 charts not being a single line.... but as an area with 5 - 7 pips (depending on currencypair) on both sides where price still may fall back under the Pivotline or rise above it again.... if price dropped just under that Pivotline. Remember these same Fib- and Pivotlines are also used by other traders on TF30, TF60, TF240, ect. On those timeframes 5 -7 pips is hardly to be seen as an area on both sides.... 3. TF1 Zone on this chart has not quite recently made a connection with any of the TFzones..... as such that TF1 zone bounced an started rising above that zone. That sort of connection happened a while ago at about 17:06 hrs, where TF1zone fell into TF15 zone. Next you see TF1zone rise above TF15 zone >>>> This is important for right at this moment TF1 and TF15 traders are in agreement to start buying respectively hold their positions. TF5 traders however are still waiting what price is going to do. As you can see TF5zone is hoovering above TF1 and TF15zone. So for TF5 zone traders now the question is..... will price rise above the TF5 zone level..... or will it not be able to cross and will price start
dropping from this TF5 level...... when price reaches this level? You better avoid these kind of situations. If price drops at this level it means TF5 traders are are not going ahead with TF1Zone and TF15Zone traders, but they start taking profits. If on the other hand price continues to rise it means that TF5 zone trades join the club and at least hold their positions or also start buying/adding to their positions. Usually in a situation like this you will see price continuing to rise after some hesitation, which is the case here as well. If it were the other way around... think of it as if TF5zone and TF15zone were in each others place.... it would have been much more more difficult for price to rise above TF15 level. Anyway the better trade setups arrive when TF1 zone is completing a retracement towards TF5 (or TF15) zone and both are above the other zones. Immediately when price now takes off from TF1zone and there is no Pivot- or Fibline obstrucion you enter for long. Same goes for short the other way around of course. As Jazz stated this trade could have gone the right way, but I also think you expected price to continue to rise immediately and therefore you had put in a tight stoploss or closed yourself the trade a little too early. Look at the Red Randy Candle still above the Kijun/Tenkan as your tradeguider..... and indeed next prise continued to rise. Hope this helps, John Two examples which happened today shortly afterwards the first part of my reply...... exactly fit this reply and whereas a picture tells more than a 1000 words...... here is that chart to prove it !!! For this I made use of Jazz1964 template. B.T.W. If you make two or three trades a week according to this setup..... you may say goodbeye to your boss..... Cheers, John John, I don't fully understand your advice "Look at the Red Randy Candle still above the Kijun/Tenkan as your tradeguider.....". Can you explain further? I've also noticed that the pivots and fiblines are different between your (Jazz &JE) v3.2 templates. That's why I didn't see the R1 pivot on John's template just above my entry point. It is present on Jazz's template though. Do I need to adjust any settings on the pivots for the broker I use (fxdd)? You entered on the blue dot and red arrow. Next price came down..... however the third red candle didn't go under the Kijun/Tenkan.... Next price went up again. Pivotlines are important, however they are far less strong and important than the TFZones, certainly when both are in the same area and support or resistance is being added by the TFZones. TFZones show you more than anything else how support and resistance is being built up in a chart and it does that by taking care of the influences of 5 TF's in one chart, i.e. TickZone + TF1, TF5, TF15 and TF30.
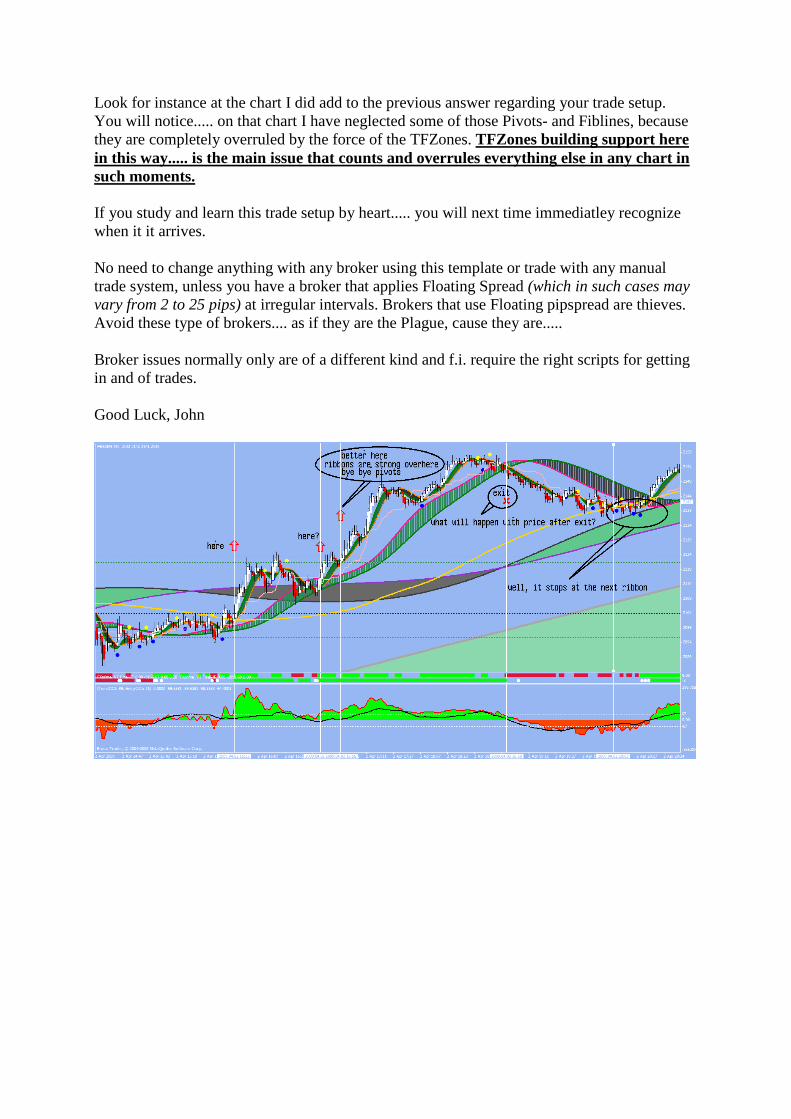
Look for instance at the chart I did add to the previous answer regarding your trade setup. You will notice..... on that chart I have neglected some of those Pivots- and Fiblines, because they are completely overruled by the force of the TFZones. TFZones building support here in this way..... is the main issue that counts and overrules everything else in any chart in such moments. If you study and learn this trade setup by heart..... you will next time immediatley recognize when it it arrives. No need to change anything with any broker using this template or trade with any manual trade system, unless you have a broker that applies Floating Spread (which in such cases may vary from 2 to 25 pips) at irregular intervals. Brokers that use Floating pipspread are thieves. Avoid these type of brokers.... as if they are the Plague, cause they are..... Broker issues normally only are of a different kind and f.i. require the right scripts for getting in and of trades. Good Luck, John