jobs, growth and governance in the middle east...
TRANSCRIPT

2003 World Bank MENA Development Reports
Jobs, Growth and Governance in the Middle East and North Africa
Mustapha K. NabliChief Economist
Middle East and North Africa RegionThe World Bank
Brussels, February 16, 2003

2
•Unlocking the Employment Potential of the Middle East and North Africa: Toward A New Social Contract
•Better Governance for Development in the Middle East and North Africa: Enhancing Inclusiveness and Accountability
•Trade, Investment and Development in the Middle East and North Africa: Engaging the World
•Gender and Development in the Middle East and North Africa:Women in the Public Sphere
The 4 reports focus on areas of central concern to policy makers, researchers and outside observers:

3
MENA’s Employment Challenge
• Creating 100 million new jobs by 2020 or doubling the current level of employment.
• In the next two decades the labor force will expand by 80 million new workers. The expansion of the labor force in the next two decades is equal to the cumulative increase over the period 1950-2000.
• Currently, the labor force is increasing by 4.2 million workers per year compared to 3.2 million in the 1990s and 2.1 in the 1980s.
• The current unemployment rate is around 15 percent affecting close to 20 million workers.

4
From Demographic Transition to Rapid Labor Growth
• MENA’s slow demographic transition has resulted in the highest and most persistent labor market pressures anywhere in the world in the past half-century.
Labor Force Growth Rates by Region, 1970-2010
0
0.5
1
1.5
2
2.5
3
3.5
4
South Asia East Asia Latin America andthe Caribbean
MENA Sub-SaharanAfrica
1970-1980 1980-1990
1990-2000 2000-2010

5
The Emergence of High Unemployment in the 1990s
• Employment growth in the 1990s fell short of labor force.
International Comparison of Unemployment Rates
0
5
10
15
20
25
30
35
OECD MENA: GCC
South Asia LatinAmerica &
theCaribbean
Europe andCentral Asia
East Asiaand thePacific
MENA: Non-GCC
Sub-Saharan
Africa
Per
cen
t
• Unemployment falls disproportionately on the youth.
• Unemployment rates tend to be higher for females.

6
Current Unemployment Rates in Arab Economies
2001
2002
2001
2001
2002
2001
2002
1999
2001
1996
2000
1997
1999
2003
1999
0
5
10
15
20
25
30
35
UAE
Kuwait
Saud
i Arab
ia
Leba
non
Egypt
OmanSyri
a
Yemen
Qatar
Bahra
inJo
rdan
Tunis
ia
Morocc
o
West B
ank a
nd G
aza
Algeri
a
Un
emp
loym
ent
(%)
Note: Data include most recent estimates available for each country; rates in GCC countries are for nationals only.Source: Compiled by World Bank staff from ILO and country sources.
High Unemployment Rates in MENA countries
7
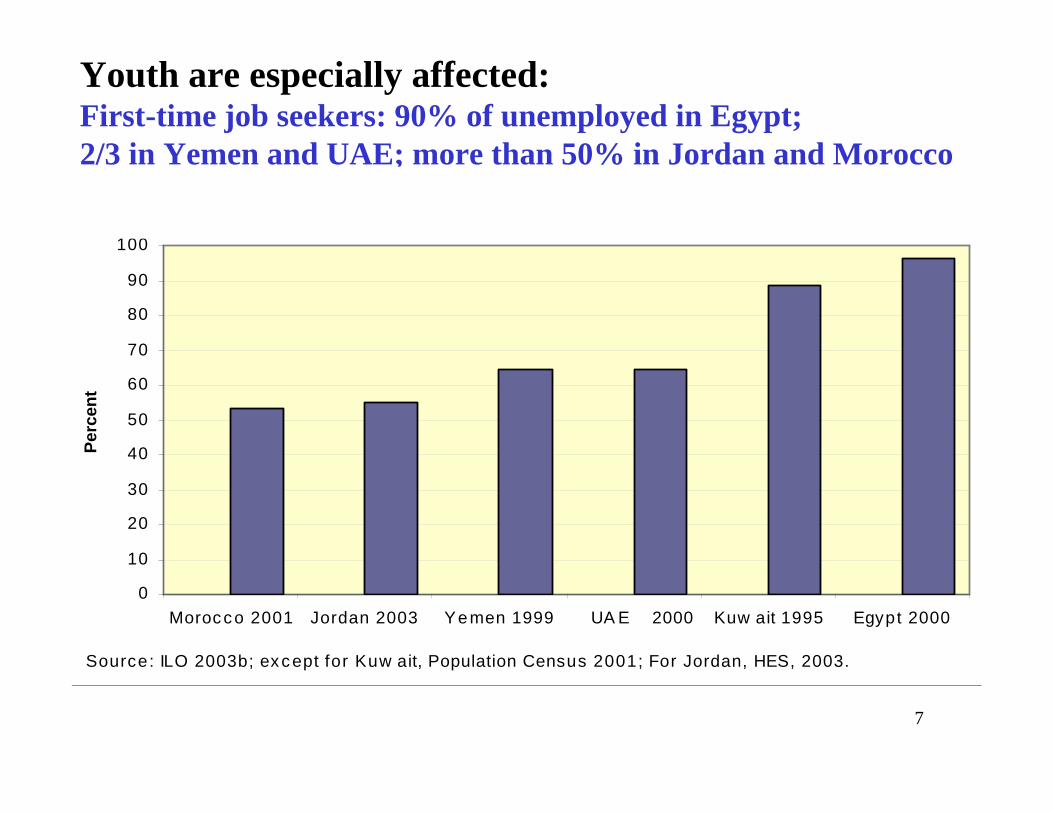
Fir s t-T im e Job Se e k e r s A m ong the Unem ploye d
0
10
20
30
40
50
60
70
80
90
100
Morocco 2001 Jordan 2003 Yemen 1999 UA E 2000 Kuw ait 1995 Egypt 2000
Per
cen
t
Source: ILO 2003b; except for Kuw ait, Population Census 2001; For Jordan, HES, 2003.
Youth are especially affected:First-time job seekers: 90% of unemployed in Egypt; 2/3 in Yemen and UAE; more than 50% in Jordan and Morocco

8
Workers are increasingly educated …and facing increasingly difficult job prospects
Figure 4.4. Dis tribution of the Unem ployed by Level of Education (percent)
0
10
20
30
40
50
60
70
80
Bahrain Oman Jordan Egypt Morocco Tunisia Algeria Djibouti
None Primary Secondary Tertiary
Sources: ILO 2002; except for Bahrain, ILO 2003a; for Egypt ELMS, 1998; for Morocco, LSMS 1999.
P e r c e n t o f t o t a l u n e m p l o y e d
D is tr i b u t i o n o f u n e m p l o y e d b y l e v e l o f e d u c a t i o n

9
Unemployment rates for women are 30% higher than for men
Unemployment Rates by Gender in Arab Countries (percent)
0
5
10
15
20
25
30
35
40
Algeria2000
WestBank and
Gaza2001
Jordan2000
Morocco1999
Tunisia1997
Bahrain2001
Qatar2002
Yemen1999
Syria 2001
Egypt2000
Lebanon1997
SaudiArabia1999
UAE 1999
Kuwait2003
Female Male
Source: For Algeria, Jordan, Syria, Egypt, West Bank and Gaza, Yemen, ILO 2003b; for Tunisia, INS 2001; for Bahrain, Qatar, Saudi Arabia , Kuwait and UAE, Girgis, Hadad-Zervose, and Coulibaly 2003; for Morocco, LSMS 1999; for Yemen, NPPS 1999.

10
Worker Productivity Growth Was Also Low in the 1990s
Average Annual Growth of GDP Per Employed Person by Region, 1990s
0
1
2
3
4
5
6
7
8
East Asia andPacific
South Asia High income /OECD
Europe andCentral Asia
Latin Americaand the
Caribbean
MENA
Per
cent
• For the MENA region, productivity was the lowest among all other regions except for Eastern Europe and Central Asia.
• As a result, real wages increased marginally in a few countries. In most, they either stagnated or fell in the 1990s.

Old modes of employment in the public sector in MENA fast dwindling
Has depended upon• Oil• Aid• Labor Remittances : diminishedopportunities to GCC and Europe
…and all financial resources declining
11

Per Capita Oil Exports, 1980–2000
0
2000
4000
6000
8000
10000
12000
1980 1982 1984 1986 1988 1990 1992 1994 1996 1998 2000
GC
C a
nd
ME
NA
0
50
100
150
200
250
300
No
n-G
CC
MENA (right axis)GCC (left axis) Non-GCC (right axis)
Per capita oil exports, 1980-2000
12

F i g u r e 1 . 5 A i d - t o - G D P r a t i o i n t h e M E N A r e g i o n , 1 9 8 0 – 2 0 0 0
0 . 0
1 . 0
2 . 0
3 . 0
4 . 0
5 . 0
6 . 0
7 . 0
8 . 0
Per
cen
t
Aid to GDP ratio in the MENA region, 1980-2000
1980 1985 1990 1995 2000
13

Worker remittances as % of GDP: Egypt and Morocco, 1970-2000
0
2
4
6
8
10
12
14
16
1970
1973
1976
1979
1982
1985
1988
1991
1994
1997
2000
Per
cen
t
Egypt
Morocco
14

15
MENA Needs a New Development Model to unlock its potential
•From public sector dominated to private-sector driven,
•From closed and passive to more open and active,
•From oil dominated and volatile to more stable and diversified.
…. the challenge of job creation requires a comprehensive approach to reform.

The private sector in MENA remains underdeveloped
Private Sector Contribution to GDP in MENA (percent)
1980
1993 19
85
1990
2000
1985
1983
1995
1990
1990
2000
1995
2002
1997
1999
1999
2002
1999
1997
2000
2001
2000
0
10
20
30
40
50
60
70
80
90
100
Lebanon Egypt Morocco Jordan Iran Palestine Syria Tunisia Yemen UAE Algeria SaudiArabia
16

Exports outside of oil have been limited…
F i g u r e 1 . 1 5 T r a d e P o te n t ia l o f n o n - o i l e x p o rts, 2 0 0 0
0
5 0
1 0 0
1 5 0
2 0 0
2 5 0
M E N A 1 0 E C A 5 E A S IA 3 L A C 4
Mill
ion
US
Dol
lars
Trade Potential of Non Oil Exports, 2000$US Million
200
150
100
50
0
MENA 10 Europe and East Asia 3 Latin AmericaCentral Asia 5 Caribbean 4
17

18
Arab Non-Oil Export Potential
0.00
0.50
1.00
1.50
2.00
2.50
3.00
3.50A
lger
ia
Egy
pt, A
rab
Rep
.
Leba
non
Syr
ian
Ara
b R
epub
lic
Ara
b9
Tun
isia
Sau
di A
rabi
a
Jord
an
Mor
occo
Iran,
Isla
mic
Rep
.
Col
ombi
a
Arg
entin
a
Bra
zil
Rus
sian
Fed
erat
ion
Sou
th A
fric
a
Tur
key
Gua
tem
ala
Pol
and
Bul
garia
El S
alva
dor
Mau
ritiu
s
Bol
ivia
Chi
le
Jam
aica
Ecu
ador
Slo
vak
Rep
ublic
Cze
ch R
epub
lic
Cos
ta R
ica
Kor
ea, R
ep.
Mex
ico
Hun
gary
Tha
iland
Phi
lippi
nes
Mal
aysi
a
Note: Regression is based on 42 countries, but values for 8 low income countries, including Yemen, are not reported because of negative values. Arab9 = Algeria, Egypt, Jordan, Lebanon, Morocco, the Republic of Yemen, Saudi Arabia, Syria, and Tunisia.
High performing countries
Weak performing countries
Non-oil exports remain largely below potential

Figure 1.2 Real oil prices and growth, 1976–99
0.0
10.0
20.0
30.0
40.0
50.0
1976
1981
1986
1991
1996
Rea
l oil
pric
e (d
olla
rs p
er b
arre
l)
-2
0
2
4
6
8
10
12
14
16
GD
P G
row
th (
perc
ent)
Real oil Price GDP growth
Real oil prices (left) and GDP growth (right)
Oil has dominated development………affecting growth but not producing jobs
19
20
These Economic Transitions Require Three
Fundamental Transformations•Reducing governance gaps in inclusiveness and accountability
•Promoting greater participation of women in economic activity, in order to utilize all their potential/talent
•Improving the quality of educational outputs which meet the needs of the new economy

21
Indicators of governance are well under potential in MENA
Figure 6.9. Governance and Per-Capita Income in MENA
-2
-1
0
1
2
6 8 10Log of Per Capita GDP
Ind
ex o
f Gove
rnan
ce Q
ual
ity
MENA
Rest of the World
MENA Trend
Rest of the World Trend
Source: Per capita GDP, WDI 2002; governance quality, World Bank 2003a.
Average MENA gap in quality of governance

22
Better Governance Can Not Wait
•A vigorous state role in improving public administration is essential to establishing the conditions that will permit economies to grow.
•Governance reforms are needed to enhance the investment climate required for the emergence of a vibrant private sector.
•Governments need the institutional and regulatory instruments to manage the difficult process of transition under conditions of vulnerability.
• Governance reforms are essential to permit governments to credibly articulate and realize a new vision of state–society relations.

23
Participation of women in economic activity is also well
below potential
0
0.2
0.4
0.6
0.8
1
1.2
1.4
1.6
1.8
2
Mor
occ
o
Kuw
ait
Tun
isia
Egy
pt
Alg
eria
Syr
ia
Iran
Bah
rain
Jord
an Iraq
MEN
A
LAC
4
Indi
a
Tur
key
EC
A2
EAP4
China
AFR
4
Act
ual / P
redi
cted
MENA 1980 MENA 2000
Non-MENA 1980
Non-MENA 2000

24
Understanding the Obstacles of the Past Is Critical
•Soft budget constraints:: External revenues cushioned the impact of economic stagnation and permitted governments to adopt limited reforms while postponing difficult decisions.
•Political challenge from radical movements meant that economic and political reforms were de-linked as governments responded by reviving political control and national security concerns.
•As a result, top-down management of Reform by Decreereplaced earlier efforts to generate support for economic reformby opening the political arena.

25
Moving the Reform Process Forward requires
From the countries of the region
• a change from the selective, top-down approach to economic reform that sidesteps the need for political change to secure the legitimacy of reform and government credibility, which is no longer adequate.
•Governments will need to revive national conversations about therestructuring of redistributive programs and a redefining of the terms of the social contract.

26
……. And from external partners
• Rethinking the response to persistent conflict in the region. Multilateral efforts are needed to resolve the Israeli–Palestinian conflict and return Iraq to a state of normalcy.
• Determined and programmatic efforts to support the wide-ranging reform agenda, going beyond the transaction specific support
• To support deeper integration of MENA into the world economy, encouraging more trade and investment, and lifting economic sanctions.