“job quality, labour market performance and well-being”_parent thirion
TRANSCRIPT

Well being at work
job quality and well being at work
Agnès Parent-Thirion
Senior Programme Manager, European Working Conditions
Survey
1
Content of my presentation
• A more “theoretical” part
The central place of job quality
Work and health over time
The quality of the research
• Some empirical results
Job quality, work and health.
• Hanging issues
Capacity to change
Key role of work organisation
2

A central role to job quality
but high interactivity with key determinants
Job quality
Company
Individual in a
household
Labour market
3
National environment : economic legal, socio-cultural

Work and health over the life
4
Adapted from La vie professionelle : Age, experience et santé à l épreuve
des conditions de travail, Molinier, Gaudart, Pueyo, ed Octares 2012

Towards evidence based policy …
• The importance of having a model to select the characteristics of work that
matter
Models to understand, to benchmark, instruments for action (to some extent copsoq)
• Influential models and association with CV, mental health and MSDs
demand control model (Karasek – Theorell), the effort reward imbalance (Siegriest), the
Job demands – resources model ( Demerouti, Bakker, Nachreiner, Schaufeli), the
predictability, leadership, organisational justice, etc
• The level and source of evidence,
Cohorts, (repeat) surveys, a system of surveys and statistics ( HH – worker- Company
different voices – administrative registers ) , specific population or national rep sample
• The challenges of the measurement and the difficulty of interpretation
‘Validated’ scales, subjective / objective, voice of workers : cheap, unique source of
evidence on some topics, integrate the variety of individuals and the conditions under
which they perform work
Risks versus resources or vitamin effects / combination / differed differentiated impact
/etc
• A clear need for interdisciplinary approach
5

Karasek’s « groups » and well being
Source ‘Health and well being, eurofound 2013
: 6
Average well being score by
Karasek’s group With Social
Support Without Social
Support Delta
(%point)
Mid-population 66.69 59.99 6.69
Low strain 70.1 66.54 3.56
Passive 69.37 62.13 7.24
Active 68.82 62.17 6.65
High strain 66.17 55.4 10.77
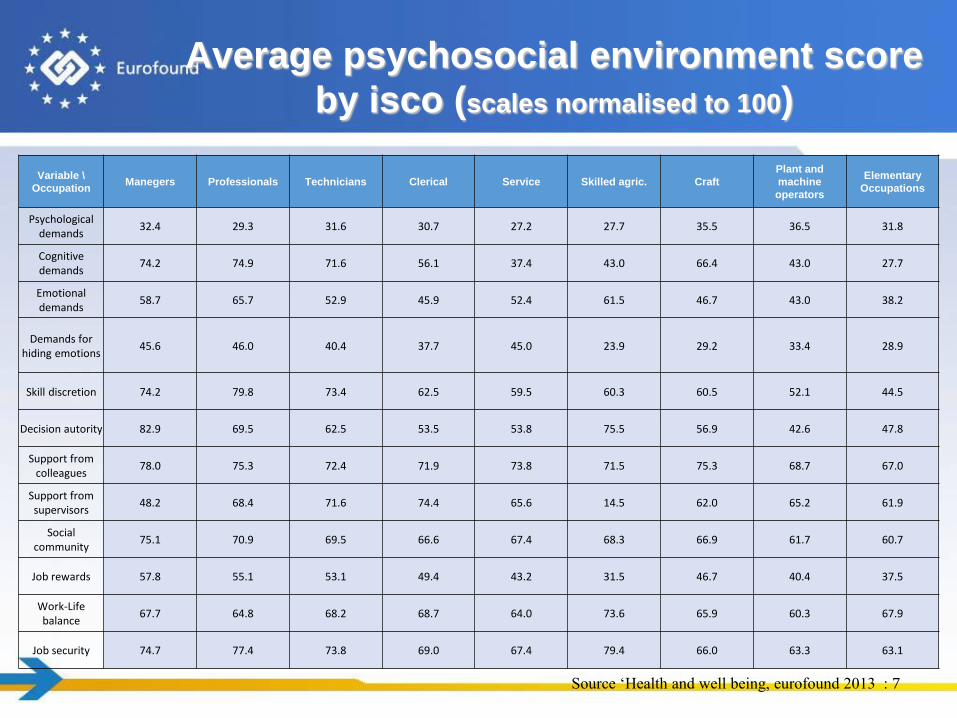
Average psychosocial environment score
by isco (scales normalised to 100)
Source ‘Health and well being, eurofound 2013 : 7
Variable \
Occupation Manegers Professionals Technicians Clerical Service Skilled agric. Craft
Plant and
machine
operators
Elementary
Occupations
Psychological demands
32.4 29.3 31.6 30.7 27.2 27.7 35.5 36.5 31.8
Cognitive demands
74.2 74.9 71.6 56.1 37.4 43.0 66.4 43.0 27.7
Emotional demands
58.7 65.7 52.9 45.9 52.4 61.5 46.7 43.0 38.2
Demands for hiding emotions
45.6 46.0 40.4 37.7 45.0 23.9 29.2 33.4 28.9
Skill discretion 74.2 79.8 73.4 62.5 59.5 60.3 60.5 52.1 44.5
Decision autority 82.9 69.5 62.5 53.5 53.8 75.5 56.9 42.6 47.8
Support from colleagues
78.0 75.3 72.4 71.9 73.8 71.5 75.3 68.7 67.0
Support from supervisors
48.2 68.4 71.6 74.4 65.6 14.5 62.0 65.2 61.9
Social community
75.1 70.9 69.5 66.6 67.4 68.3 66.9 61.7 60.7
Job rewards 57.8 55.1 53.1 49.4 43.2 31.5 46.7 40.4 37.5
Work-Life balance
67.7 64.8 68.2 68.7 64.0 73.6 65.9 60.3 67.9
Job security 74.7 77.4 73.8 69.0 67.4 79.4 66.0 63.3 63.1

Source : trends in job quality, eurofound 2012 8
Earnings Prospects
Intrinsic Job Quality
Working Time
Quality
Intrinsic Job Quality
Skill use and discretion
Social environment
Physical environment
Work intensity
Job quality: four indices Operationalisation 2012 (Green –Mostafa )
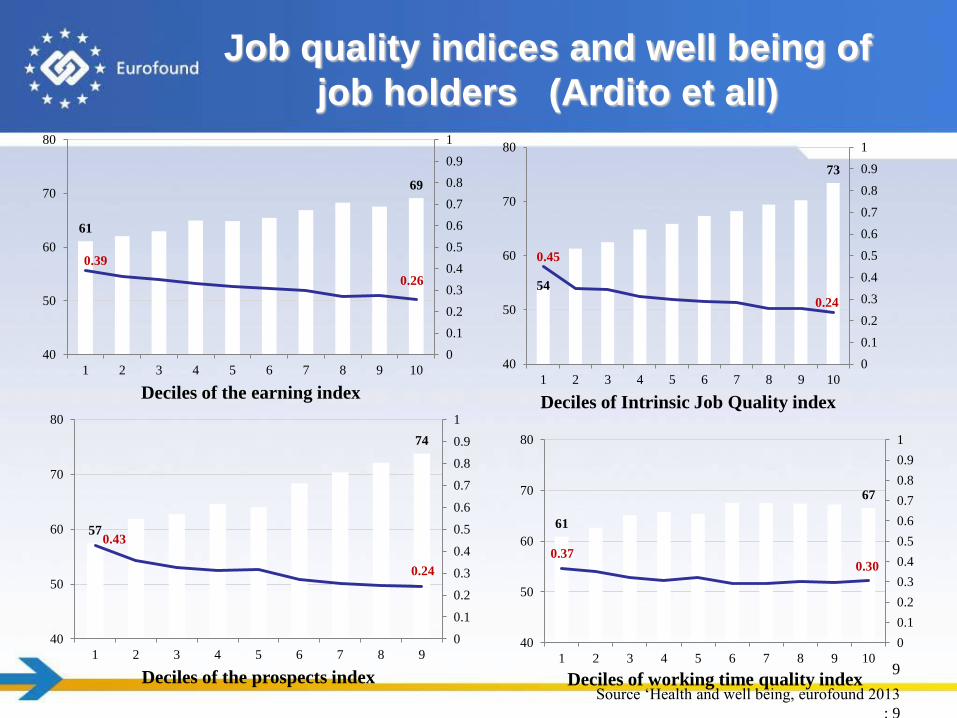
Job quality indices and well being of
job holders (Ardito et all)
9
61
69
0.39
0.26
0
0.1
0.2
0.3
0.4
0.5
0.6
0.7
0.8
0.9
1
40
50
60
70
80
1 2 3 4 5 6 7 8 9 10
Deciles of the earning index
54
73
0.45
0.24
0
0.1
0.2
0.3
0.4
0.5
0.6
0.7
0.8
0.9
1
40
50
60
70
80
1 2 3 4 5 6 7 8 9 10
Deciles of Intrinsic Job Quality index
57
74
0.43
0.24
0
0.1
0.2
0.3
0.4
0.5
0.6
0.7
0.8
0.9
1
40
50
60
70
80
1 2 3 4 5 6 7 8 9
Deciles of the prospects index
61
67
0.37 0.30
0
0.1
0.2
0.3
0.4
0.5
0.6
0.7
0.8
0.9
1
40
50
60
70
80
1 2 3 4 5 6 7 8 9 10
Deciles of working time quality index Source ‘Health and well being, eurofound 2013
: 9

Income across life stages ( Smith et al 2013)
700
900
1100
1300
1500
1700
single 18-35
living with
parents/
relatives
single <=45 no
children
couple no
children,
woman aged
<=45
couple with
children <7
years
couple with
children 7-12
years
couple with
children 13-18
years
couple no
children,
woman 46-59
couple no
children, both
partners >=60
single >=50 no
children
Inco
me
Male Female
Job quality across life stages ( Smith
et al 2013)
Source : women, men and working conditions in Europe , eurofound 2013 - 10
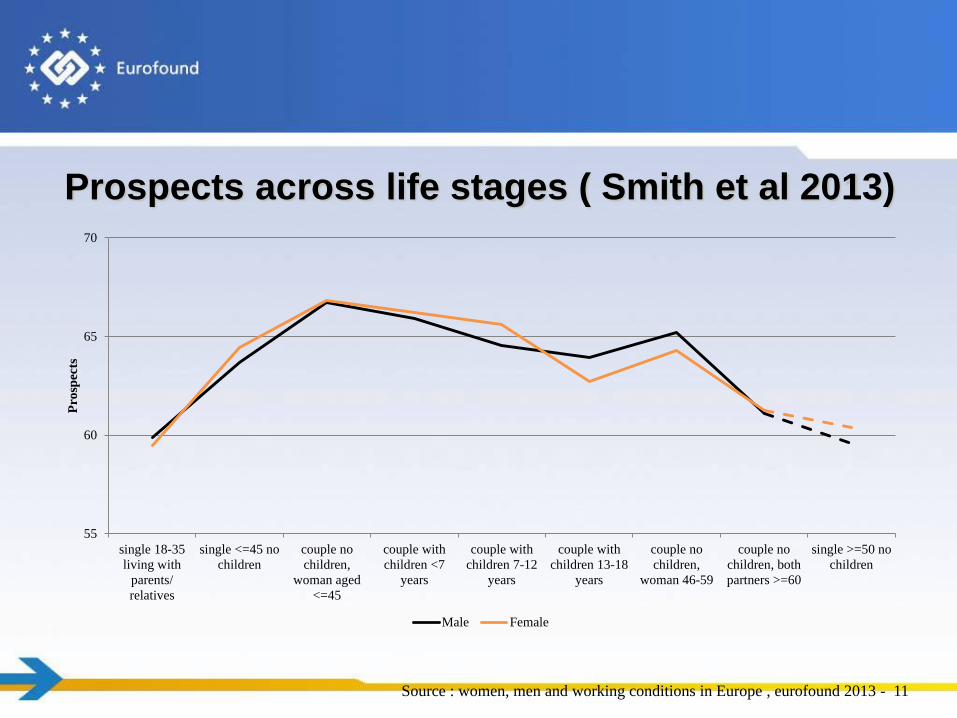
Prospects across life stages ( Smith et al 2013)
55
60
65
70
single 18-35
living with
parents/
relatives
single <=45 no
children
couple no
children,
woman aged
<=45
couple with
children <7
years
couple with
children 7-12
years
couple with
children 13-18
years
couple no
children,
woman 46-59
couple no
children, both
partners >=60
single >=50 no
children
Pro
spec
ts
Male Female
Source : women, men and working conditions in Europe , eurofound 2013 - 11

Working time quality across lifestages (Smith et
al, 2013)
50
55
60
65
70
75
single 18-35
living with
parents/
relatives
single <=45 no
children
couple no
children,
woman aged
<=45
couple with
children <7
years
couple with
children 7-12
years
couple with
children 13-18
years
couple no
children,
woman 46-59
couple no
children, both
partners >=60
single >=50 no
children
Wo
rkin
g t
ime
qu
ali
ty
Male Female
Source : women, men and working conditions in Europe , eurofound 2013 - 12
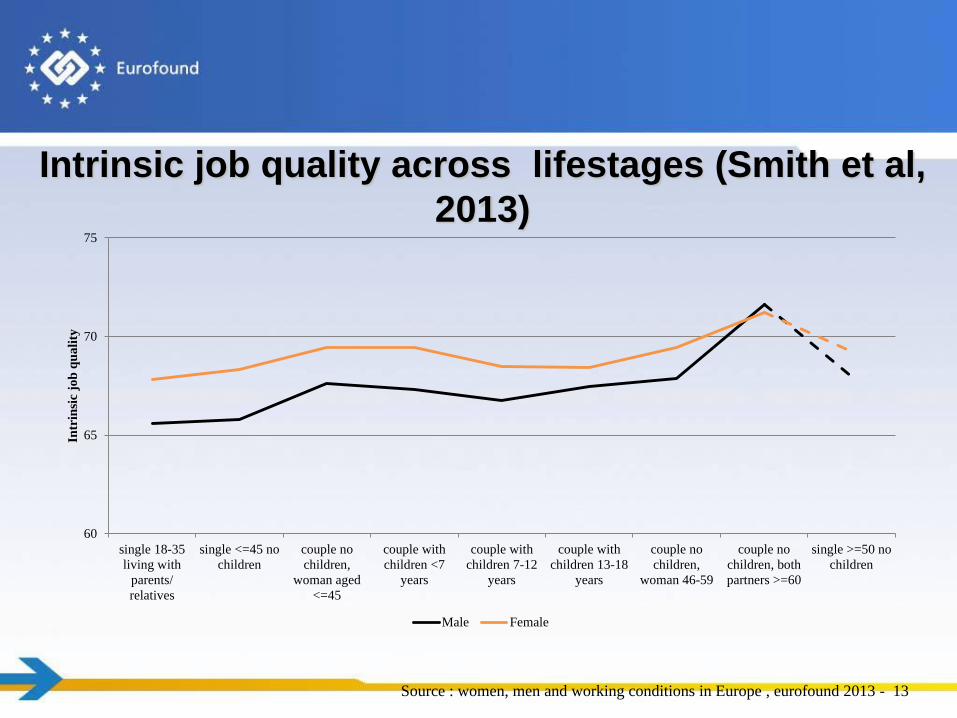
Intrinsic job quality across lifestages (Smith et al,
2013)
60
65
70
75
single 18-35
living with
parents/
relatives
single <=45 no
children
couple no
children,
woman aged
<=45
couple with
children <7
years
couple with
children 7-12
years
couple with
children 13-18
years
couple no
children,
woman 46-59
couple no
children, both
partners >=60
single >=50 no
children
Intr
insi
c jo
b q
ua
lity
Male Female
Source : women, men and working conditions in Europe , eurofound 2013 - 13

Capacity to change : Job quality indices in
EU-15 countries, 1995 – 2010
03/12/2014 14
0
10
20
30
40
50
60
70
80
90
Skills and Discretion (T) Work Intensity(T) Good Physical Environment(T) Working Time Quality(T)
1995
2000
2005
2010
Source : trends in job quality, eurofound 2012 14
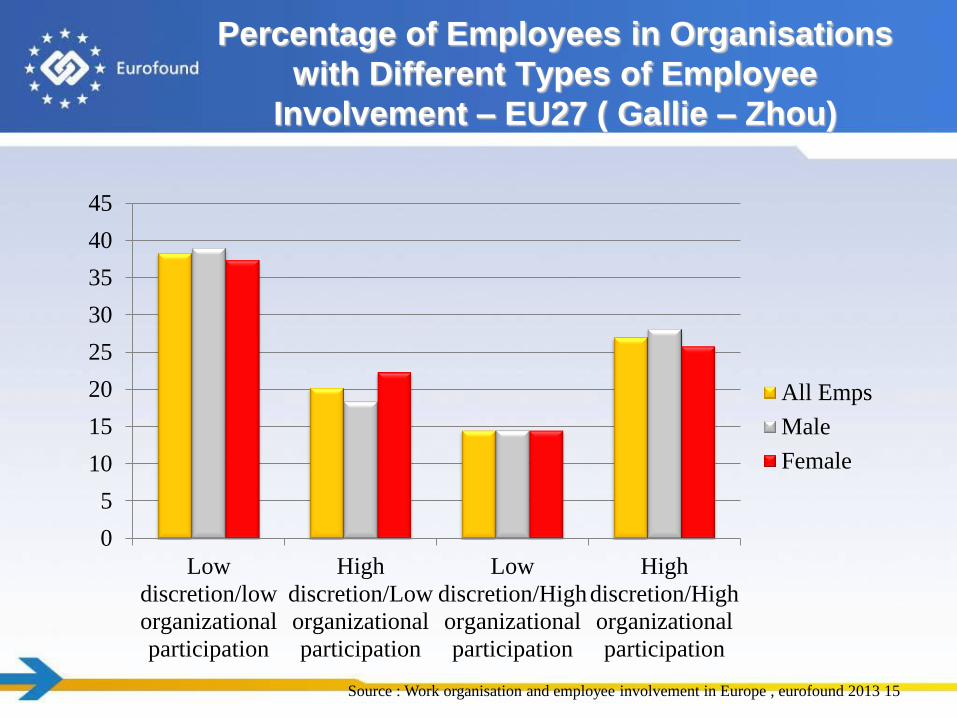
Percentage of Employees in Organisations
with Different Types of Employee
Involvement – EU27 ( Gallie – Zhou)
0
5
10
15
20
25
30
35
40
45
Low
discretion/low
organizational
participation
High
discretion/Low
organizational
participation
Low
discretion/High
organizational
participation
High
discretion/High
organizational
participation
All Emps
Male
Female
Source : Work organisation and employee involvement in Europe , eurofound 2013 15

Working Conditions by Type of
Employee Involvement
Low Inv Discret Consult High Inv
Physical Risks
General Physical Risks
Score
1.31 1.05* 1.18 0.82*
Chemical Risks Score 0.63 0.50* 0.62 0.41*
People Related Risks
Score
1.00 0.85 1.02 0.70
Work Intensity
Work Intensity Score 5 pt 1.63 1.33* 1.58* 1.39*
Work Time Flexibility
Wk time flexibility Index 2.07 2.56* 2.47* 2.93*
General
% health & safety at risk 28.5% 22.0%* 25.3%* 17.9%*
% very well informed
re Health & Safety
38.4% 38.5% 52.5%* 56.0%*
Source : Work organisation and employee involvement in Europe , eurofound 2013 16
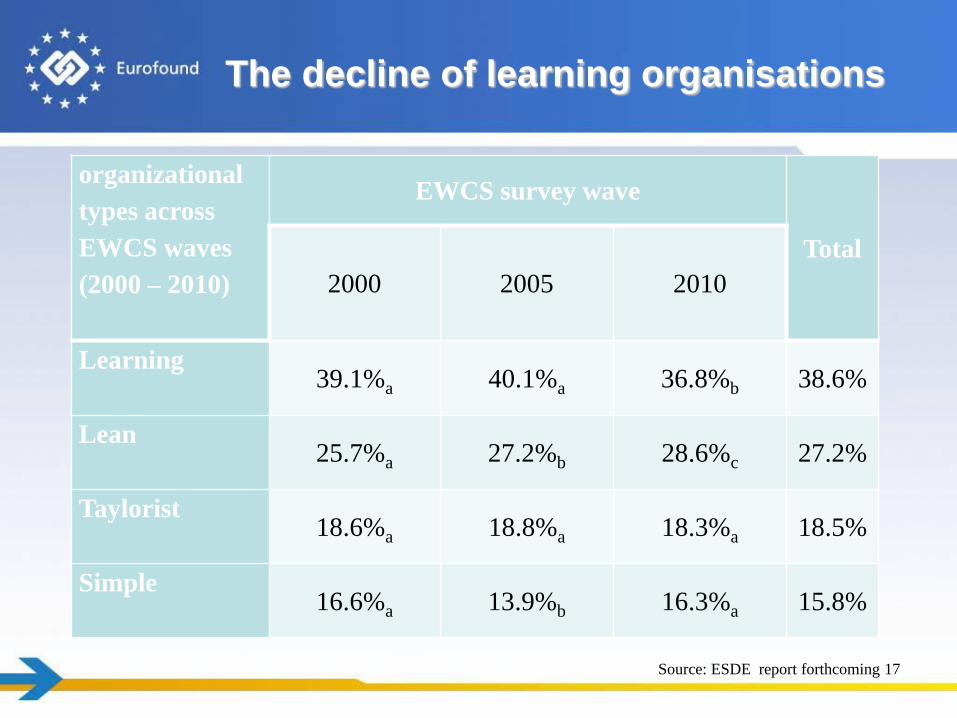
The decline of learning organisations
Source: ESDE report forthcoming 17
organizational
types across
EWCS waves
(2000 – 2010)
EWCS survey wave
Total
2000 2005 2010
Learning 39.1%a 40.1%a 36.8%b 38.6%
Lean 25.7%a 27.2%b 28.6%c 27.2%
Taylorist 18.6%a 18.8%a 18.3%a 18.5%
Simple 16.6%a 13.9%b 16.3%a 15.8%

Conclusions
• The relationships between well being and job quality and working environment are
numerous and go in different directions
• There is a clear relationship between job quality and well being.
The relationship holds for each index
Intrinsic job quality and prospects are more effective in shaping well being
Increases in job quality are associated with reductions in the variability of well
being
• Job quality is multidimensional : workers experience different compromises of job
quality features; contextualisation matters; win wins happen
• Empirical results call for efforts to address job quality issues – this implies tackling
different policy areas together, addressing different actors, groups with specific needs -
as well as reflection on instruments /policies that work at workplace levels and address
‘organisational risks’
• The later calls for worker participation and employee representation
• More to come with the results of the 6th EWCS and 3rd ECS
18

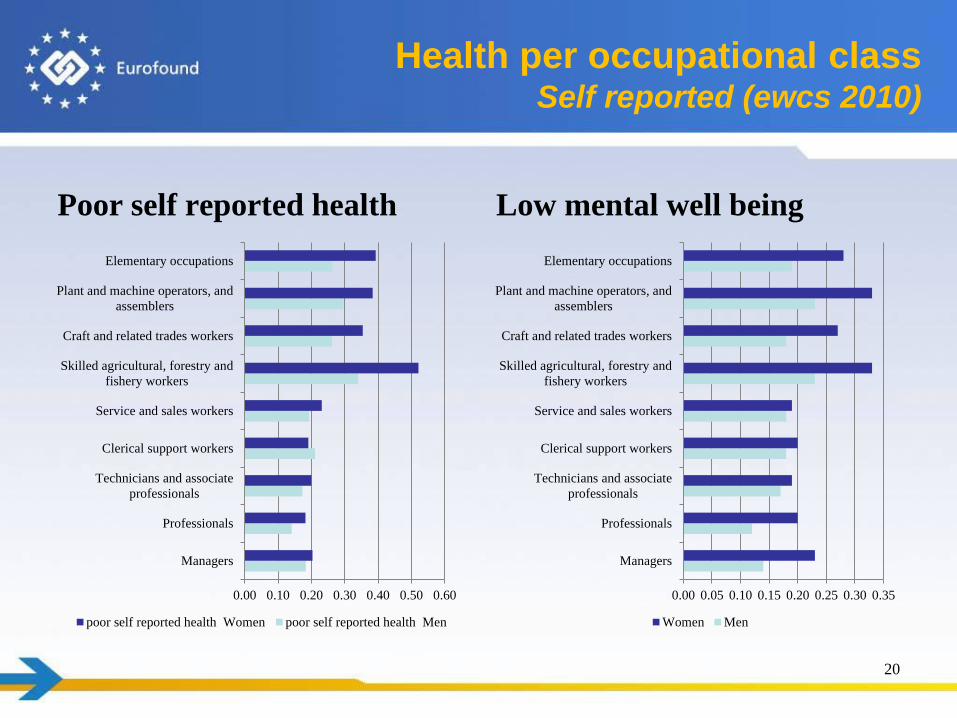
Health per occupational class Self reported (ewcs 2010)
Poor self reported health Low mental well being
0.00 0.05 0.10 0.15 0.20 0.25 0.30 0.35
Managers
Professionals
Technicians and associate
professionals
Clerical support workers
Service and sales workers
Skilled agricultural, forestry and
fishery workers
Craft and related trades workers
Plant and machine operators, and
assemblers
Elementary occupations
Women Men
0.00 0.10 0.20 0.30 0.40 0.50 0.60
Managers
Professionals
Technicians and associate
professionals
Clerical support workers
Service and sales workers
Skilled agricultural, forestry and
fishery workers
Craft and related trades workers
Plant and machine operators, and
assemblers
Elementary occupations
poor self reported health Women poor self reported health Men
20

Working lives duration
0.0
5.0
10.0
15.0
20.0
25.0
30.0
35.0
40.0
45.0
2002
2011
Working lives careers of women are
8 years shorter than men careers - Duration working life – Women,
source eurostat 21