job day airport region
DESCRIPTION
Job Day Airport RegionTRANSCRIPT

Table of contents
Participants Profile ................................
Candidates Inquiry ................................
Employers Inquiry ................................
Number of Participants
2008 4500
2009 3200
2010 3500
BRUSSELS JOB DAY AIRPORT REGION
Evaluation 2008
................................................................................................................................
................................................................................................................................
................................................................................................................................
Number of Participants Candidates Inquiry Answers
4500 207
3200 222
3500 505
BRUSSELS JOB DAY AIRPORT REGION
Evaluation 2008-2009-2010
1
................................. 2
.................................. 4
................................. 11
Candidates Inquiry Answers

Participants Profile
2008
M 63,8%
F 36,2%
2008
FR 85,3%
NL 14,7%
EN 0,0%
2008
18-25 33,4%
26-35 36,4%
36-45 20,9%
46-64 9,3%
65+ 0,0%
BRUSSELS JOB DAY AIRPORT REGION
Evaluation 2008
2009 2010
55,8% 61,3%
44,2% 38,7%
Gender
2009 2010
76,8% 72,0%
22,8% 17,8%
0,4% 10,2%
Language
2009 2010
25,8% 21,4%
42,1% 41,1%
20,4% 22,8%
11,6% 12,0%
0,1% 2,7%
Age
BRUSSELS JOB DAY AIRPORT REGION
Evaluation 2008-2009-2010
2

2008
Workers 22,2%
Students 9,2%
Job Seekers 68,6%
Primary
Secondary Low 14,0%
Secondary High 32,7%
Bachelor 23,5%
Master 25,9%
BRUSSELS JOB DAY AIRPORT REGION
Evaluation 2008
2009 2010
21,6% 18,4%
9,4% 7,8%
69,0% 73,8%
Status
2008 2009 2010
3,9% 3,2% 3,5%
14,0% 13,6% 12,6%
32,7% 31,7% 32,8%
23,5% 24,0% 22,8%
25,9% 27,5% 28,3%
Education
BRUSSELS JOB DAY AIRPORT REGION
Evaluation 2008-2009-2010
3

Candidates Inquiry
2008
Yes 77,5%
No 22,5%
Did you come to the Brussels Job Day Airport Region?
2008
Bus 34,5%
Car 44,8%
Other 20,7%
How did you come?
2008
1 3,5%
2-5 30,5%
6-10 35,5%
+10 9,5%
How many enterprises did you meet?
BRUSSELS JOB DAY AIRPORT REGION
Evaluation 2008
2009 2010
77,0% 75,8%
23,0% 24,2%
Did you come to the Brussels Job Day Airport Region?
2009 2010
34,8% 35,2%
43,9% 45,3%
21,3% 19,5%
How did you come?
2009 2010
9,1% 11,5%
45,5% 55,5%
33,8% 25,2%
11,6% 7,8%
How many enterprises did you meet?
BRUSSELS JOB DAY AIRPORT REGION
Evaluation 2008-2009-2010
4

2008
Yes 33,5%
No 66,5%
Did you have an appointment after your visit to the Brussels Job
Day Airport Region?
2008
1-2 74,7%
2+ 25,4%
In how many companies?
2008
None 73,9%
Other 2,6%
Interim 13,0%
CDI 6,7%
CDD 3,8%
Did this interview end in an employment contract?
BRUSSELS JOB DAY AIRPORT REGION
Evaluation 2008
2009 2010
36,4% 30,4%
63,6% 69,6%
Did you have an appointment after your visit to the Brussels Job
Day Airport Region?
2009 2010
81,0% 81,3%
19,0% 18,7%
In how many companies?
2009 2010
86,0% 80,0%
5,6% 6,9%
5,0% 5,4%
1,5% 3,8%
1,9% 3,9%
Did this interview end in an employment contract?
BRUSSELS JOB DAY AIRPORT REGION
Evaluation 2008-2009-2010
5

2008
Good 48,3%
Moderate 43,2%
Bad 8,5%
General organisation
2008
Good 46,5%
Moderate 43,9%
Bad 9,6%
General atmosphere
2008
Good 65,5%
Moderate 31,0%
Bad 3,5%
Selected date and time
BRUSSELS JOB DAY AIRPORT REGION
Evaluation 2008
2009 2010
58,7% 51,5%
34,2% 41,1%
7,1% 7,4%
General organisation
2009 2010
51,7% 44,7%
41,1% 45,3%
7,2% 10,0%
General atmosphere
2009 2010
70,8% 61,4%
24,3% 32,7%
4,9% 5,9%
Selected date and time
BRUSSELS JOB DAY AIRPORT REGION
Evaluation 2008-2009-2010
6
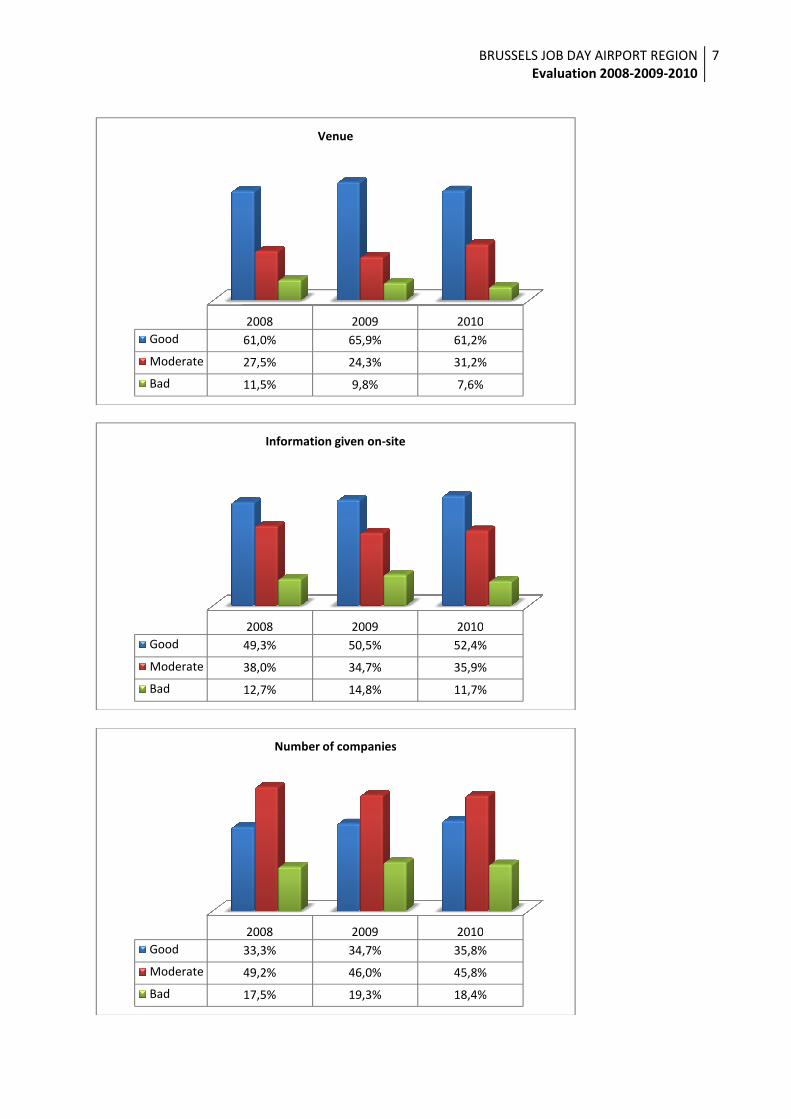
2008
Good 61,0%
Moderate 27,5%
Bad 11,5%
2008
Good 49,3%
Moderate 38,0%
Bad 12,7%
Information given on
2008
Good 33,3%
Moderate 49,2%
Bad 17,5%
Number of companies
BRUSSELS JOB DAY AIRPORT REGION
Evaluation 2008
2009 2010
65,9% 61,2%
24,3% 31,2%
9,8% 7,6%
Venue
2009 2010
50,5% 52,4%
34,7% 35,9%
14,8% 11,7%
Information given on-site
2009 2010
34,7% 35,8%
46,0% 45,8%
19,3% 18,4%
Number of companies
BRUSSELS JOB DAY AIRPORT REGION
Evaluation 2008-2009-2010
7

2008
Good 39,5%
Moderate 46,0%
Bad 14,5%
Welcome of the companies
2008
Good 26,0%
Moderate 49,5%
Bad 24,5%
Interviews with the companies
Media (radio, TV, presse)
Internet
Public transports
Employment institutions
Friends
Other
How were you informed of the Brussels Job Day Airport Region?
BRUSSELS JOB DAY AIRPORT REGION
Evaluation 2008
2009 2010
36,7% 46,9%
48,3% 36,7%
15,0% 16,4%
Welcome of the companies
2009 2010
25,5% 33,1%
51,2% 45,3%
23,3% 21,6%
Interviews with the companies
2008 2009
Media (radio, TV, presse) 14,5% 9,8%
28,0% 33,3% 32,5%
5,5% 12,2% 12,4%
Employment institutions 8,0% 5,0%
24,0% 27,5% 25,8%
14,0% 11,3%
6,0% 0,9%
How were you informed of the Brussels Job Day Airport Region?
BRUSSELS JOB DAY AIRPORT REGION
Evaluation 2008-2009-2010
8
2010
9,0%
32,5%
12,4%
9,3%
25,8%
7,6%
3,4%
How were you informed of the Brussels Job Day Airport Region?

2008
Of course 71,0%
Maybe 27,0%
Not at all 2,0%
Do you believe this event pattern employer/candidate
is useful in Brussels?
2008
Yes 83,0%
Maybe 11,2%
No 5,8%
Are you disposed to work in a Dutch environment?
2008
Yes 93,5%
Maybe 3,5%
No 3,0%
Are you disposed to improve your knowledge of Dutch?
BRUSSELS JOB DAY AIRPORT REGION
Evaluation 2008
2009 2010
62,3% 63,3%
33,3% 32,2%
4,4% 4,5%
Do you believe this event pattern employer/candidate
is useful in Brussels?
2009 2010
77,9% 74,6%
17,3% 17,2%
4,8% 8,2%
Are you disposed to work in a Dutch environment?
2009 2010
89,6% 87,4%
6,8% 7,7%
3,6% 4,9%
Are you disposed to improve your knowledge of Dutch?
BRUSSELS JOB DAY AIRPORT REGION
Evaluation 2008-2009-2010
9

2008
Yes 77,0%
Maybe 14,0%
No 9,0%
Are you disposed to work in another region?
2008
-15 1,7%
15-30 13,3%
30-60 49,0%
Doesn't matter 36,0%
How long would you take to go to your work (maximum)?
BRUSSELS JOB DAY AIRPORT REGION
Evaluation 2008
2009 2010
77,5% 73,5%
14,8% 17,4%
7,7% 9,1%
Are you disposed to work in another region?
2008 2009 2010
1,7% 1,8% 1,3%
13,3% 27,9% 27,7%
49,0% 32,9% 28,1%
36,0% 37,4% 42,7%
How long would you take to go to your work (maximum)?
BRUSSELS JOB DAY AIRPORT REGION
Evaluation 2008-2009-2010
10

Employers Inquiry
2008
Excellent 34,6%
Good 57,8%
Moderate 7,6%
Bad 0,0%
Very bad 0,0%
General organisation
2008
Excellent 20,2%
Good 62,5%
Moderate 17,3%
Bad 0,0%
Very bad 0,0%
Relationship with our team
2008
Excellent 30,7%
Good 57,6%
Moderate 11,7%
Bad 0,0%
Very bad 0,0%
BRUSSELS JOB DAY AIRPORT REGION
Evaluation 2008
2009 2010
32,0% 27,0%
63,0% 68,0%
5,0% 5,0%
0,0% 0,0%
0,0% 0,0%
General organisation
2009 2010
15,0% 36,0%
76,0% 59,0%
9,0% 5,0%
0,0% 0,0%
0,0% 0,0%
Relationship with our team
2009 2010
18,0% 36,0%
67,0% 55,0%
12,0% 9,0%
3,0% 0,0%
0,0% 0,0%
Chosen date
BRUSSELS JOB DAY AIRPORT REGION
Evaluation 2008-2009-2010
11

2008
Excellent 57,6%
Good 38,4%
Moderate 0,0%
Bad 4,0%
Very bad 0,0%
2008
Excellent 34,6%
Good 53,8%
Moderate 7,8%
Bad 3,8%
Very bad 0,0%
2008
Excellent 15,3%
Good 70,2%
Moderate 14,5%
Bad 0,0%
Very bad 0,0%
General atmosphere
BRUSSELS JOB DAY AIRPORT REGION
Evaluation 2008
2009 2010
33,0% 58,0%
61,0% 38,0%
3,0% 4,0%
3,0% 0,0%
0,0% 0,0%
Venue
2009 2010
25,0% 54,0%
56,0% 41,0%
19,0% 5,0%
0,0% 0,0%
0,0% 0,0%
Your stand
2009 2010
8,0% 28,0%
75,0% 49,0%
17,0% 23,0%
0,0% 0,0%
0,0% 0,0%
General atmosphere
BRUSSELS JOB DAY AIRPORT REGION
Evaluation 2008-2009-2010
12

2008
Excellent 15,3%
Good 53,8%
Moderate 19,2%
Bad 11,7%
Very bad 0,0%
Communication campaign
2008
Excellent 56,0%
Good 10,0%
Moderate 34,0%
Bad 0,0%
Very bad 0,0%
Number of candidates
2008
Excellent 0,0%
Good 26,8%
Moderate 43,9%
Bad 29,3%
Very bad 0,0%
Quality of candidates
BRUSSELS JOB DAY AIRPORT REGION
Evaluation 2008
2009 2010
11,0% 15,0%
54,0% 45,0%
24,0% 20,0%
11,0% 15,0%
0,0% 5,0%
Communication campaign
2009 2010
44,0% 49,0%
41,0% 46,0%
15,0% 5,0%
0,0% 0,0%
0,0% 0,0%
Number of candidates
2009 2010
0,0% 0,0%
29,0% 28,0%
44,0% 34,0%
27,0% 33,0%
0,0% 5,0%
Quality of candidates
BRUSSELS JOB DAY AIRPORT REGION
Evaluation 2008-2009-2010
13

2008
Excellent 0,0%
Good 31,8%
Moderate 41,0%
Bad 22,7%
Very bad 4,5%
Number of useful contacts
2008
Excellent 0,0%
Good 21,7%
Moderate 43,6%
Bad 21,7%
Very bad 13,0%
Their level of preparation
BRUSSELS JOB DAY AIRPORT REGION
Evaluation 2008
2009 2010
6,0% 0,0%
30,0% 32,0%
33,0% 31,0%
20,0% 23,0%
11,0% 14,0%
Number of useful contacts
2009 2010
4,0% 5,0%
23,0% 18,0%
38,0% 31,0%
23,0% 32,0%
12,0% 14,0%
Their level of preparation
BRUSSELS JOB DAY AIRPORT REGION
Evaluation 2008-2009-2010
14