job creation in the manufacturing revival · pdf filedavid dorn, and gordon h. hanson,...
TRANSCRIPT
Job Creation in the Manufacturing Revival
Marc Levinson
Section Research Manager
May 5, 2017
Congressional Research Service
7-5700
www.crs.gov
R41898
Job Creation in the Manufacturing Revival
Congressional Research Service
Summary The health of the U.S. manufacturing sector is of ongoing interest to Congress. Numerous bills
aimed at promoting manufacturing are introduced in each Congress, often with the stated goal of
creating jobs. Implicit in many of these bills is the assumption that the manufacturing sector is
uniquely able to provide well-paid employment for workers who have not pursued education
beyond high school.
U.S. manufacturing output has risen approximately 22% since the most recent low point in 2009,
but almost all of that expansion occurred prior to the end of 2014. The upswing in manufacturing
activity has resulted in only relatively modest growth of employment in the manufacturing sector.
Although a variety of forces seem likely to support further growth in domestic manufacturing
output over the next few years, including higher labor costs in the emerging economies of Asia
and increased concern about disruptions to transoceanic supply chains, evidence suggests that
such a resurgence would lead to relatively small job gains within the manufacturing sector.
Manufacturing wages are below those in many other industries and continue to decline in relative
terms. Data taking insurance, pensions, and other employee benefits into account indicate that
production workers have experienced a decline in average total compensation relative to
comparable full-time workers in other occupations over the past decade.
The past few years have seen important changes in the nature of manufacturing work. A steadily
smaller proportion of manufacturing workers is involved in physical production processes, while
larger shares are engaged in managerial and professional work. These changes are reflected in
increasing skill requirements for manufacturing workers and severely diminished opportunities
for workers without education beyond high school. Even if increased manufacturing output leads
to additional employment in the manufacturing sector, it is likely to generate little of the routine
production work historically performed by workers with lower education levels.
As manufacturing processes have changed, factories with large numbers of workers have become
much less common than they once were. This suggests that promotion of manufacturing as a tool
to stimulate local economies is likely to meet with limited success; even if newly established
factories prosper, few are likely to require large amounts of labor.
The development of large supplies of oil and natural gas from shale formations in several states
has led to considerable speculation about prospects for expanded chemical manufacturing. The
number of chemical plants in the United States has risen by nearly 9% since 2012, and numerous
companies have announced expansions of existing plants. However, total capacity in the industry
has declined over the same period as very large plants have closed or have eliminated certain
production operations. In any event, chemical plants are extremely capital-intensive, and even
large amounts of new investment are likely to result in the creation of relatively few jobs.

Job Creation in the Manufacturing Revival
Congressional Research Service
Contents
Introduction ..................................................................................................................................... 1
Employment in the Manufacturing Sector ...................................................................................... 1
The Changing Character of Manufacturing Work ........................................................................... 3
The Shrinking Wage Premium ........................................................................................................ 7
Manufacturing-Related Work in Other Sectors ............................................................................... 9
Information Technology .......................................................................................................... 10 Bundled Services ...................................................................................................................... 11 Factoryless Goods Production/Contract Manufacturing .......................................................... 11 Employment Services Firms ................................................................................................... 13
The Decline of the Large Factory .................................................................................................. 14
Start-Ups and Shutdowns .............................................................................................................. 16
Is There a Chemical Comeback? ................................................................................................... 18
Selected Policy Issues for Congress .............................................................................................. 19
Figures
Figure 1. Employment and Output in Manufacturing ..................................................................... 1
Figure 2. Growth in Employment and Output Since Cyclical Trough ............................................ 1
Figure 3. Manufacturing Employment by Occupation .................................................................... 4
Figure 4. Manufacturing Employment by Worker Education ......................................................... 6
Figure 5. Manufacturing Employment by Gender........................................................................... 7
Figure 6. Wage Trends in Selected Industries ................................................................................. 8
Figure 7. Jobs Created by Establishment Openings ...................................................................... 17
Figure 8. Jobs Lost Due to Establishment Closings ...................................................................... 17
Figure 9. Chemical Industry Employment and Establishments .................................................... 19
Figure 10. Capacity and Output..................................................................................................... 19
Tables
Table 1. Manufacturing Employment by Industry, 2001-2017 ........................................................ 3
Table 2. Manufacturing Employment Potentially Attributable to the Computer Systems
Design and Related Services (CSD) Industry, 2015 ................................................................... 10
Table 3. Characteristics of U.S. Enterprises Providing Contract Manufacturing .......................... 12
Table 4. Employees of Employment Services Firms in Production Occupations ......................... 14
Table 5. Size Distribution of Factories .......................................................................................... 15
Table 6. Factories with over 1,000 Workers by Selected Industries .............................................. 15
Table 7. Manufacturing Employment by Establishment Size ....................................................... 16

Job Creation in the Manufacturing Revival
Congressional Research Service
Contacts
Author Contact Information .......................................................................................................... 21
Job Creation in the Manufacturing Revival
Congressional Research Service 1
Introduction After rebounding from the 2007-2009 recession, U.S. manufacturing output has grown little since
the second half of 2014. Over the same period, employment in the U.S. manufacturing sector has
been flat. These trends defy expectations that forces such as higher labor costs in the emerging
economies of Asia, heightened concern about the risk of disruptions to long, complex supply
chains, and the development of inexpensive domestic supplies of natural gas would bring a surge
of factory production in the United States.
The health of U.S. manufacturing is a subject of ongoing interest in Congress. Numerous bills are
introduced in each session to encourage capital investment, support training of workers for
manufacturing jobs, increase research and development related to manufacturing, and strengthen
mandates for the use of domestic goods in federally funded projects and programs. Proponents of
such efforts often associate increased factory activity with the creation of jobs for workers
without higher education. Evidence suggests, however, that even strong growth in manufacturing
output could well have only modest impact on job creation, and is unlikely to increase demand
for workers with lower levels of education.
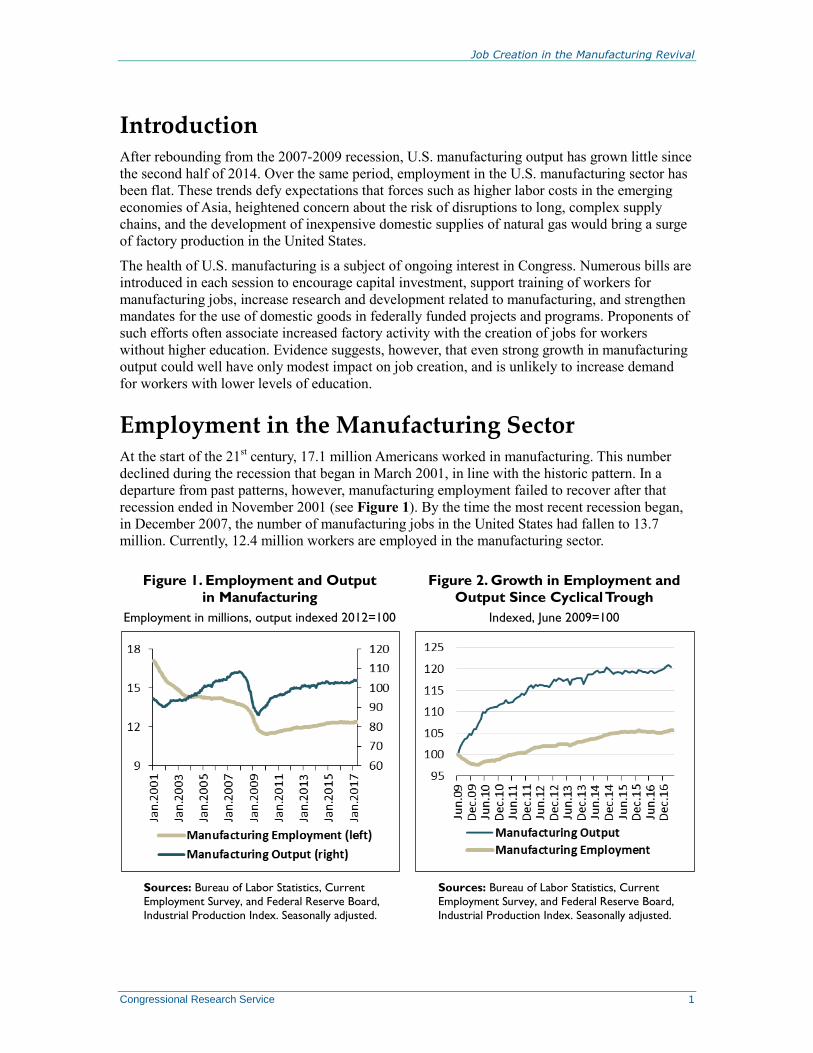
Employment in the Manufacturing Sector At the start of the 21
st century, 17.1 million Americans worked in manufacturing. This number
declined during the recession that began in March 2001, in line with the historic pattern. In a
departure from past patterns, however, manufacturing employment failed to recover after that
recession ended in November 2001 (see Figure 1). By the time the most recent recession began,
in December 2007, the number of manufacturing jobs in the United States had fallen to 13.7
million. Currently, 12.4 million workers are employed in the manufacturing sector.
Figure 1. Employment and Output
in Manufacturing
Employment in millions, output indexed 2012=100
Sources: Bureau of Labor Statistics, Current
Employment Survey, and Federal Reserve Board,
Industrial Production Index. Seasonally adjusted.
Figure 2. Growth in Employment and
Output Since Cyclical Trough
Indexed, June 2009=100
Sources: Bureau of Labor Statistics, Current
Employment Survey, and Federal Reserve Board,
Industrial Production Index. Seasonally adjusted.

Job Creation in the Manufacturing Revival
Congressional Research Service 2
The output of U.S. manufacturers hit a cyclical bottom in June 2009. Since that time, a 21%
increase in manufacturing output has been accompanied by only a 6% increase in manufacturing
employment (see Figure 2). The low point in manufacturing employment was reached in
February 2010. Since that time the manufacturing job count has risen 8%.1 The employment
recovery in manufacturing lags far behind the cyclical norm following past recessions.
There is no single cause of the weakness in manufacturing employment. A sharp increase in the
bilateral U.S. trade deficit with China following that country’s accession to the World Trade
Organization in 2001 contributed importantly to manufacturing job loss in the first half of the last
decade, but changes in the bilateral balance in goods trade since 2006 are not associated with
changes in employment of factory workers in the United States.2 Cyclical forces aside, at least
three distinct factors limit the prospects for job creation in the manufacturing sector, even if
domestic production gains market share from imports.
Some manufacturing industries, notably apparel and footwear, are tied to labor-
intensive production methods that have proven difficult to automate. With labor
costs accounting for a much higher share of value added in these industries than
in manufacturing as a whole, declining import barriers allowed imports from
low-wage countries to displace domestic production. From 1.3 million workers as
recently as 1980, U.S. employment in apparel manufacturing has fallen to
126,000. Leather manufacturing has seen a similar employment decline. Over the
same period, U.S. output of apparel fell by 84%, and output of leather products
fell by 78%.
In other industries, technological improvements have led to large increases in
labor productivity that have reduced the need for workers. Steelmaking offers
such an example: the 84,000 people working in the industry in 2016 produced
3% more steel than nearly 400,000 workers did in 1980.3
Secular shifts in demand have dimmed employment prospects in some industries
despite the general recovery in manufacturing output. Paper consumption, for
example, was once closely associated with economic growth, but no longer; as
electronic communication supplants print in many uses, paper output is down
20% from its peak in 1999, contributing to a 61% drop in industry employment
over the same period. As cigarette consumption has waned, output in tobacco
products manufacturing is down by 54% since the most recent peak in 1996,
while employment has fallen by nearly two-thirds.
1 Manufacturing output, as discussed in this section, is derived from the Federal Reserve Board Industrial Production
Indexes for manufacturing and for various manufacturing industries, seasonally adjusted,
http://www.federalreserve.gov/releases/g17/Current/default.htm. Employment figures in this section are from the
Bureau of Labor Statistics Current Employment Statistics database, http://www.bls.gov/ces/, and are seasonally
adjusted. 2 On the impact of China on manufacturing employment, see Justin R. Pierce and Peter K. Schott, “The Surprisingly
Swift Decline of U.S. Manufacturing Employment,” American Economic Review, forthcoming, and David H. Autor,
David Dorn, and Gordon H. Hanson, “The China Syndrome: Local Labor Market Effects of Import Competition in the
United States,” American Economic Review, vol. 103 (2013), pp. 2121-2168. On U.S.-China trade more generally, see
CRS Report RL33536, China-U.S. Trade Issues, by Wayne M. Morrison. 3 In 1980, an average of 398,829 employees produced 83.9 million tons of steel; see American Iron and Steel Institute,
Annual Statistical Report 1980 (Washington, DC, 1981), pp. 8, 21. U.S. steel shipments in 2016 were 86.5 million tons,
according to the Institute; see http://www.steel.org/Steel_org/document-types/news/2017/decembershipments.aspx.
BLS gives average industry employment in 2016 as 84,000.

Job Creation in the Manufacturing Revival
Congressional Research Service 3
These changes have resulted in a significant shift in the composition of manufacturing
employment even as all manufacturing industries have experienced declining employment. Food
manufacturing, which two decades ago accounted for 1 in 11 manufacturing jobs, now accounts
for 1 in 8; it is one of the few manufacturing sectors in which employment has grown.
Transportation equipment, fabricated metal products, machinery, and chemicals manufacturing
have become more important parts of manufacturing—although these sectors have not been
immune from the decline in employment. Apparel, textiles, printing, and computers and
electronic products now account for substantially smaller shares of manufacturing employment
than was formerly the case (see Table 1).
Table 1. Manufacturing Employment by Industry, 2001-2017
Shares of total manufacturing employment and thousands of workers
Industry 2001 Share
2001 Employment 2017 Share
2017 Employment
Transportation Equipment 11.64% 1,992 13.15% 1,625
Food 9.08% 1,554 12.72% 1,575
Fabricated Metal Products 10.28% 1,759 11.49% 1,420
Machinery 8.49% 1,453 8.71% 1,076
Computers and Electronic
Products
10.93% 1,871 8.39% 1,036
Chemicals 5.71% 977 6.57% 812
Plastics and Rubber 5.45% 932 5.66% 699
Misc. Durables Manufacturing 4.25% 728 4.79% 592
Printing 4.66% 798 3.57% 441
Nonmetallic Mineral Products 3.25% 556 3.35% 414
Furniture 3.96% 677 3.19% 394
Electrical Equipment 3.41% 583 3.12% 385
Primary Metals 3.55% 608 3.05% 377
Paper 3.70% 599 2.99% 369
Apparel 2.67% 457 1.02% 126
Textiles 2.13% 364 0.91% 112
Source: Bureau of Labor Statistics, Current Employment Statistics for January of respective year.
Note: Not all manufacturing industries are included.
The Changing Character of Manufacturing Work In the public mind, the word “factory” is associated with the concept of mass production, in
which large numbers of workers perform repetitive tasks. While mass production is still an
important aspect of manufacturing, routine production functions, from welding joints in truck
bodies to removing plastic parts from a molding machine, have proven susceptible to automation.
Job Creation in the Manufacturing Revival
Congressional Research Service 4
This has had important consequences for the nature of work in manufacturing establishments and
for the skill requirements of manufacturing workers.4
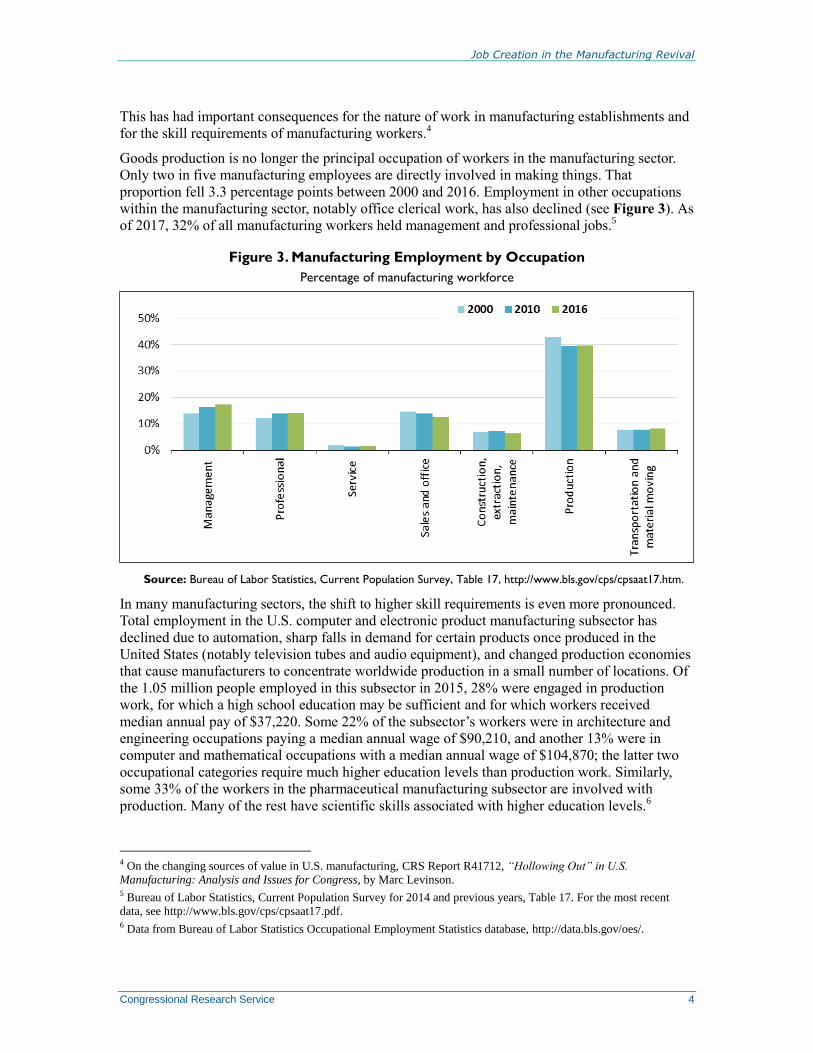
Goods production is no longer the principal occupation of workers in the manufacturing sector.
Only two in five manufacturing employees are directly involved in making things. That
proportion fell 3.3 percentage points between 2000 and 2016. Employment in other occupations
within the manufacturing sector, notably office clerical work, has also declined (see Figure 3). As
of 2017, 32% of all manufacturing workers held management and professional jobs.5
Figure 3. Manufacturing Employment by Occupation
Percentage of manufacturing workforce
Source: Bureau of Labor Statistics, Current Population Survey, Table 17, http://www.bls.gov/cps/cpsaat17.htm.
In many manufacturing sectors, the shift to higher skill requirements is even more pronounced.
Total employment in the U.S. computer and electronic product manufacturing subsector has
declined due to automation, sharp falls in demand for certain products once produced in the
United States (notably television tubes and audio equipment), and changed production economies
that cause manufacturers to concentrate worldwide production in a small number of locations. Of
the 1.05 million people employed in this subsector in 2015, 28% were engaged in production
work, for which a high school education may be sufficient and for which workers received
median annual pay of $37,220. Some 22% of the subsector’s workers were in architecture and
engineering occupations paying a median annual wage of $90,210, and another 13% were in
computer and mathematical occupations with a median annual wage of $104,870; the latter two
occupational categories require much higher education levels than production work. Similarly,
some 33% of the workers in the pharmaceutical manufacturing subsector are involved with
production. Many of the rest have scientific skills associated with higher education levels.6
4 On the changing sources of value in U.S. manufacturing, CRS Report R41712, “Hollowing Out” in U.S.
Manufacturing: Analysis and Issues for Congress, by Marc Levinson. 5 Bureau of Labor Statistics, Current Population Survey for 2014 and previous years, Table 17. For the most recent
data, see http://www.bls.gov/cps/cpsaat17.pdf. 6 Data from Bureau of Labor Statistics Occupational Employment Statistics database, http://data.bls.gov/oes/.
Job Creation in the Manufacturing Revival
Congressional Research Service 5
The increasing demand for skills in manufacturing is most visible in the diminished use of “team
assemblers”—essentially, line workers in factories and warehouses. In May 2016, employment in
this occupation, which typically requires little training and no academic qualifications, was 1.1
million, down 15% since 2000. Some 862,300 team assemblers worked in manufacturing in 2016,
representing less than 7% of manufacturing jobs. This type of job, once the core of
manufacturing, has decreased in importance to many manufacturers and warehouse operators to
the extent that 19% of all team assemblers work for employment agencies, which furnish workers
to other companies on an as-needed basis. Team assemblers working for employment agencies
earn an average of $12.43 per hour, some 21% less than those employed directly by
manufacturing companies.7
The changing occupational mix within the manufacturing sector is mirrored by changing
educational requirements. In 2000, 53% of all workers in manufacturing had no education beyond
high school. Between 2000 and 2016, that share dropped by 11 percentage points, even as the
proportion of manufacturing workers with bachelor’s degrees or graduate degrees rose by 9
percentage points, to 31%. Given that college-educated workers generally command significantly
higher pay in the labor market than high-school dropouts and high-school graduates, it is unlikely
that manufacturers would willingly hire more-educated workers unless there is a payoff in terms
of greater productivity.
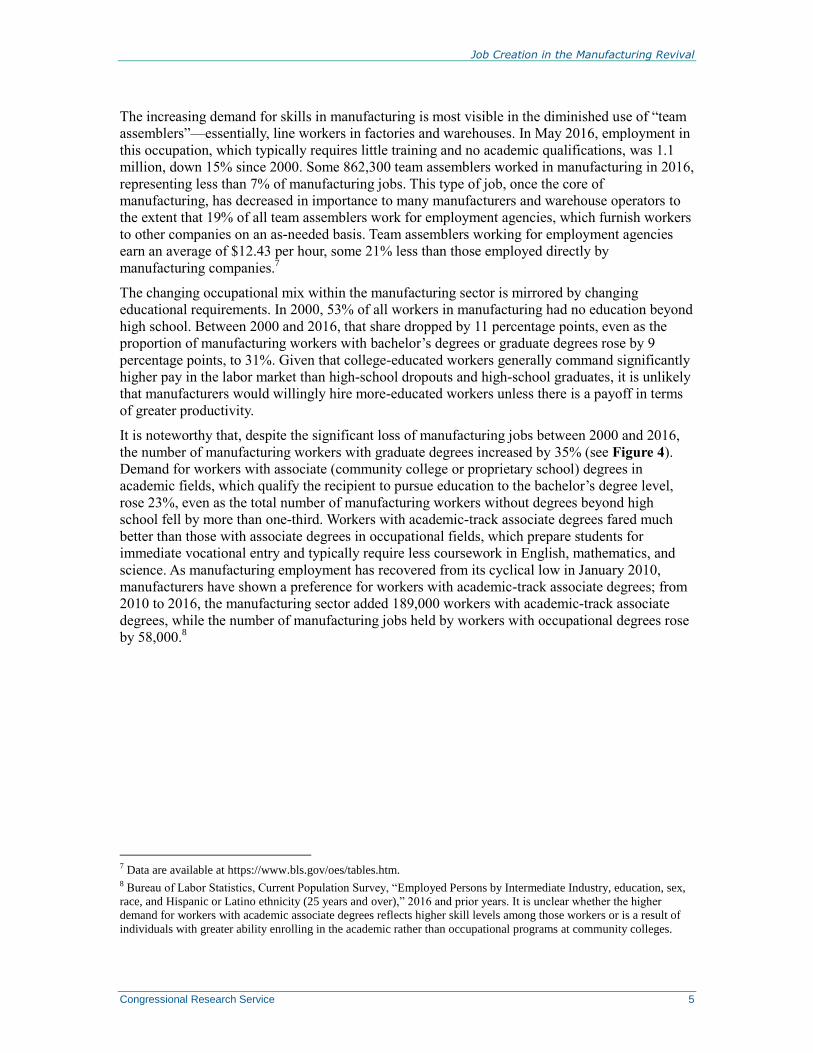
It is noteworthy that, despite the significant loss of manufacturing jobs between 2000 and 2016,
the number of manufacturing workers with graduate degrees increased by 35% (see Figure 4).
Demand for workers with associate (community college or proprietary school) degrees in
academic fields, which qualify the recipient to pursue education to the bachelor’s degree level,
rose 23%, even as the total number of manufacturing workers without degrees beyond high
school fell by more than one-third. Workers with academic-track associate degrees fared much
better than those with associate degrees in occupational fields, which prepare students for
immediate vocational entry and typically require less coursework in English, mathematics, and
science. As manufacturing employment has recovered from its cyclical low in January 2010,
manufacturers have shown a preference for workers with academic-track associate degrees; from
2010 to 2016, the manufacturing sector added 189,000 workers with academic-track associate
degrees, while the number of manufacturing jobs held by workers with occupational degrees rose
by 58,000.8
7 Data are available at https://www.bls.gov/oes/tables.htm. 8 Bureau of Labor Statistics, Current Population Survey, “Employed Persons by Intermediate Industry, education, sex,
race, and Hispanic or Latino ethnicity (25 years and over),” 2016 and prior years. It is unclear whether the higher
demand for workers with academic associate degrees reflects higher skill levels among those workers or is a result of
individuals with greater ability enrolling in the academic rather than occupational programs at community colleges.
Job Creation in the Manufacturing Revival
Congressional Research Service 6
Figure 4. Manufacturing Employment by Worker Education
Percentage change, 2000-2016
Source: Bureau of Labor Statistics, Current Population Survey.
The proportion of manufacturing workers who are female has fallen from 32% as recently as
1993 to 27% currently (see Figure 5). Women have long accounted for a large share of
employment in some of the industries that have experienced the steepest drops in employment,
notably apparel, textiles, and electrical manufacturing. The female workforce was significantly
less educated than the male workforce in manufacturing: in 2000, only 41% of female
manufacturing workers had any education beyond high school, compared with 61% of their male
counterparts.
This gender gap in education has closed since 2000, due largely to the departure of these less
educated women from the manufacturing workforce. The number of female manufacturing
workers with no education beyond high school fell 47% from 2000 to 2016. As a result, the
number of years of schooling of female manufacturing workers is now very similar to that of
males in manufacturing. Some 31% of women workers in manufacturing in 2016 held four-year
college degrees or higher degrees, whereas 11% had not completed high school.
Female employment in manufacturing has risen by approximately 400,000 jobs since 2010, even
as male employment has increased by 700,000 jobs. The main reason for this is that within the
overall manufacturing workforce, women are less likely than men to work in some of the highly
cyclical durable goods industries that have experienced the largest increases in employment, such
as fabricated metal products and transportation equipment manufacturing.

Job Creation in the Manufacturing Revival
Congressional Research Service 7
Figure 5. Manufacturing Employment by Gender
Percentage of manufacturing workforce that is female
Source: Bureau of Labor Statistics, Current Employment Statistics.
Note: Data are for January of each year and are not seasonally adjusted.
The Shrinking Wage Premium Policymakers traditionally have attached special importance to manufacturing because
manufacturers appear to pay a wage premium, compared to employers in other industries. Based
on pay, a 2012 U.S. Department of Commerce publication asserted, “manufacturing jobs are good
jobs.” According to that source, manufacturing jobs offered average hourly pay of $29.75 in
2010, compared to $27.47 for nonmanufacturing jobs. Including employer-provided benefits, the
Commerce Department reported, manufacturing workers earned 17% more per hour than workers
in other industries.9 Those other industries, it should be noted, include the low-paying retailing
and leisure and hospitality industries, which jointly account for 22% of nonfarm employment.
Such comparisons, however, are not as straightforward as they may appear. At least some of the
purported manufacturing wage premium exists because manufacturers employ far fewer young
workers than industries with lower pay. In the lowest-paid sectors of the economy, a large share
of the workforce—14% in leisure and hospitality, 7% in retailing—is under age 20, compared
with only 1% of manufacturing workers.10
Also, large numbers of workers in those two relatively
low-paid industries are employed part time; the average work week is around 25 hours in leisure
and hospitality and 30 hours in retailing, versus 42 hours in manufacturing.11
Full-time workers in
any industry are more likely to receive benefits than part-time workers.
Contrary to the popular perception, manufacturing workers, on average, earn significantly less per
hour than workers in industries that do not employ large numbers of teenagers, that have average
workweeks of similar length, and that have similar levels of worker education. For example,
9 David Langdon and Rebecca Lehrman, “The Benefits of Manufacturing Jobs,” U.S. Department of Commerce,
Economics and Statistics Administration, Issue Brief #01-12, May 2012, p. 1. 10 U.S. Bureau of Labor Statistics, Current Population Survey, Table 18b, http://www.bls.gov/cps/cpsaat18b.htm. 11 U.S. Bureau of Labor Statistics, Current Employment Statistics, http://www.bls.gov/ces/.
Job Creation in the Manufacturing Revival
Congressional Research Service 8
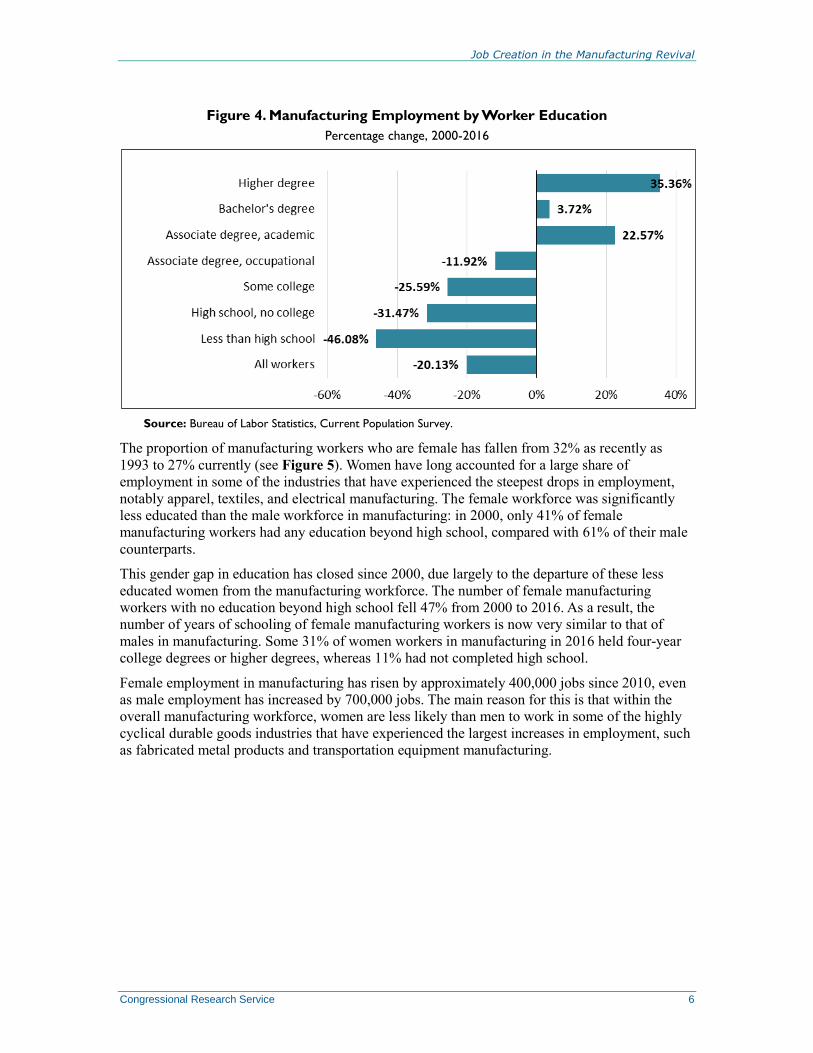
nonsupervisory workers in manufacturing earned an average hourly wage of $21.54 in 2016,
compared with $25.97 for construction workers and $37.12 for workers in the electric utility
industry. Moreover, average manufacturing wages have declined over time, compared to those in
other industries, with the exceptions of retailing and transportation (see Figure 6). In 2000, for
example, nonsupervisory workers in manufacturing earned 5.1% more, on an hourly basis, than
workers in the services sector; in 2016, they earn 4.3% less than services workers, on average.
These trends reflect both competitive pressures on employers and the diminished bargaining
power of workers in a sector with comparatively few employment opportunities.12
Figure 6. Wage Trends in Selected Industries
Relative Hourly Pay of Nonsupervisory Workers in Manufacturing
Source: Bureau of Labor Statistics, Current Employment Statistics.
According to Bureau of Labor Statistics data, 2.9% of jobs in manufacturing were unfilled in
January 2017, up from 2.7% one year earlier. The number of unfilled jobs rose by 16,000.
However, all of that increase occurred in nondurables industries, where the average wage of
production workers, $18.99 per hour, was well below the $21.64 average in durable-goods
manufacturing.13
Manufacturers responded to the rising number of openings by increasing
production workers’ wages in nondurables much faster over the year to January 2017 (3.3%) than
in durables (2.1%).
12 Ibid. 13 Nondurable goods industries include such sectors as apparel, textile, food, and paper manufacturing. Durable goods
industries include primary metals, machinery, transportation equipment, and others.
Job Creation in the Manufacturing Revival
Congressional Research Service 9
Traditionally, manufacturing employers have tended to offer more generous employee benefits
than those in other industries. This may no longer be the case. Data from the Bureau of Labor
Statistics compensation survey, which takes the cost of insurance, pensions, and other employee
benefits into account, show that manufacturing workers experienced a decline in benefits relative
to workers in other industries between 2006 and 2016.14
On balance, then, modest job creation in manufacturing has not been accompanied by an
improvement in the position of manufacturing workers, relative to those in other sectors.
Although workers in some manufacturing industries earn relatively high wages, the assertion that
manufacturing as a whole provides better jobs than the rest of the economy is increasingly
difficult to defend.
Manufacturing-Related Work in Other Sectors Under current statistical practices, whether an activity is classified as manufacturing depends
largely on where it is conducted. Government statistical agencies track most types of economic
activity at the level of the establishment—that is, a single facility or business location—rather
than at the level of a firm that may own multiple establishments or an enterprise that may own
many firms. As a general rule, if an establishment is “primarily engaged” in transforming or
assembling goods, then all output from that establishment is considered output of the
manufacturing sector, and all workers (except those employed by outside contractors) are
considered manufacturing workers.
Thus, if a firm locates its product design employees at a U.S. facility that is primarily engaged in
producing goods, those designers will likely be counted as working in a manufacturing
establishment, and their work will add to the total value added created in U.S. manufacturing. If,
however, the product designers work at a separately located design center, they will probably be
considered to work in an industrial design establishment, not a manufacturing establishment. In
that case, they will be counted as industrial design workers, and their value added will be
attributed to the professional, scientific, and technical services sector, not to the manufacturing
sector.15
The same will be true if the product designers are employed by a separate firm rather
than by the firm that owns the manufacturing establishment.
One might identify four separate groups of U.S. workers whose jobs are related to manufacturing:
Production employees of manufacturing establishments: approximately 8.6
million workers at the end of 2016.
Nonproduction employees of manufacturing establishments: approximately 3.7
million workers.
Workers producing manufactured goods but employed by nonmanufacturing
establishments: number unknown.
Workers producing services and software used in manufacturing but employed by
nonmanufacturing establishments: number unknown.
14 For data, see http://www.bls.gov/ncs. 15 Manufacturing activities fall within North American Industrial Classification System (NAICS) sectors 31-33,
whereas professional, scientific, and technical services of all sorts fall within NAICS sector 54.
Job Creation in the Manufacturing Revival
Congressional Research Service 10
Data related to the first two groups are generally captured by government statistics depicting the
manufacturing sector. Data related to the roles of workers in the last two groups are far more
tenuous.
Information Technology
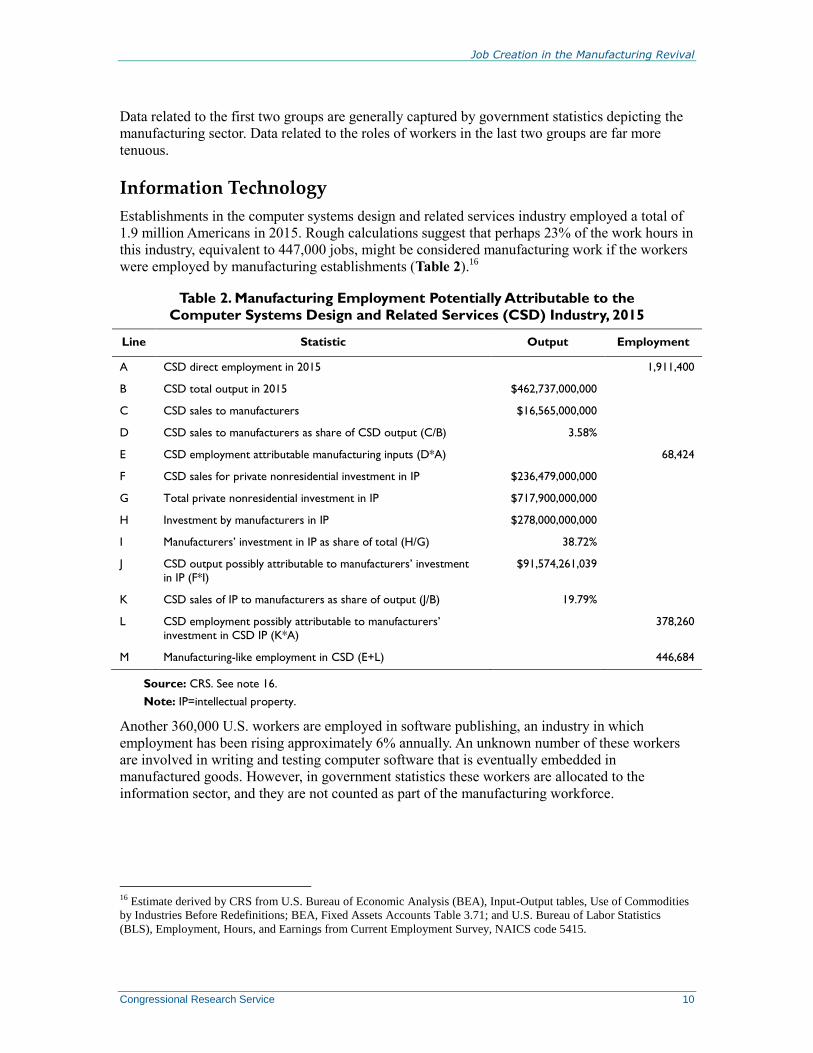
Establishments in the computer systems design and related services industry employed a total of
1.9 million Americans in 2015. Rough calculations suggest that perhaps 23% of the work hours in
this industry, equivalent to 447,000 jobs, might be considered manufacturing work if the workers
were employed by manufacturing establishments (Table 2).16
Table 2. Manufacturing Employment Potentially Attributable to the
Computer Systems Design and Related Services (CSD) Industry, 2015
Line Statistic Output Employment
A CSD direct employment in 2015 1,911,400
B CSD total output in 2015 $462,737,000,000
C CSD sales to manufacturers $16,565,000,000
D CSD sales to manufacturers as share of CSD output (C/B) 3.58%
E CSD employment attributable manufacturing inputs (D*A) 68,424
F CSD sales for private nonresidential investment in IP $236,479,000,000
G Total private nonresidential investment in IP $717,900,000,000
H Investment by manufacturers in IP $278,000,000,000
I Manufacturers’ investment in IP as share of total (H/G) 38.72%
J CSD output possibly attributable to manufacturers’ investment
in IP (F*I)
$91,574,261,039
K CSD sales of IP to manufacturers as share of output (J/B) 19.79%
L CSD employment possibly attributable to manufacturers’
investment in CSD IP (K*A)
378,260
M Manufacturing-like employment in CSD (E+L) 446,684
Source: CRS. See note 16.
Note: IP=intellectual property.
Another 360,000 U.S. workers are employed in software publishing, an industry in which
employment has been rising approximately 6% annually. An unknown number of these workers
are involved in writing and testing computer software that is eventually embedded in
manufactured goods. However, in government statistics these workers are allocated to the
information sector, and they are not counted as part of the manufacturing workforce.
16 Estimate derived by CRS from U.S. Bureau of Economic Analysis (BEA), Input-Output tables, Use of Commodities
by Industries Before Redefinitions; BEA, Fixed Assets Accounts Table 3.71; and U.S. Bureau of Labor Statistics
(BLS), Employment, Hours, and Earnings from Current Employment Survey, NAICS code 5415.
Job Creation in the Manufacturing Revival
Congressional Research Service 11
Bundled Services
Anecdotal evidence suggests that a growing proportion of manufactured goods are sold in
conjunction with after-sale services. For example, Boeing Corp., an aircraft manufacturer,
recently set a goal of $50 billion of annual revenue from services such as supplying spare parts,
modifying and repairing aircraft, training pilots, and monitoring aircraft systems during flights.17
Many other manufacturers are reshaping themselves to be service providers as well, attracted by
the prospect of continuing revenue streams from customers rather than one-time payments.18
It is possible that a manufacturer might demand a different price for a good sold as a stand-alone
product than for the same good when bundled with a service contract. In such a case, the amount
of the product’s value to attribute to the manufacturing sector rather than the “other services”
sector, which includes machinery and equipment repair and maintenance, may be arbitrary.19
Government data collectors may not be able to capture the value of the good separately from the
value of the bundled services, and may not be able to distinguish the workers involved in the
original production process from those providing related services.
Factoryless Goods Production/Contract Manufacturing
Factoryless goods producers are firms that design products to be manufactured and own the
finished goods but do not engage directly in physical transformation. The transformation or
assembly of the goods they sell is done by external suppliers, known as contract manufacturers, in
the United States or abroad, although the factoryless goods producer may be closely involved in
its contract manufacturers’ operations. Examples might include a U.S.-based footwear company
that engages other firms to produce the shoes it designs and markets,20
and a “fabless”
semiconductor company that contracts with an unrelated “foundry” to manufacture its chips.21
It is impossible to identify factoryless goods producers with certainty; responses to related
questions on government surveys are confidential, and companies’ annual reports filed with the
Securities and Exchange Commission may not provide sufficient detail to determine whether they
own manufacturing establishments. However, Alphabet Inc., parent of Google Inc., appears to
meet the definition. Alphabet generated more than 90% of its revenue in 2015 from delivering
online advertising. However, the company sells computers and telephones to consumers, and
designs and oversees production of computer servers used in its data centers. In 2012 a company
official referred to Google as “probably ... one of the largest hardware manufacturers in the
17 Dominic Gates, “Boeing goes outside for new Commercial Airplanes CEO,” Seattletimes.com, November 21, 2016. 18 As an example, United Technologies Corp., which manufactures elevators, aircraft engines, and many other
products, reported that “product sales” accounted for 71% of its $56.1 billion of sales in its FY2015, and “service sales”
accounted for 29%. Its competitor, General Electric Co., does not make a similar distinction in its financial reports
between sales of goods and sales of services. See United Technologies, 2015 Annual Report, p. 38, and General
Electric Co., Form 10-K for the fiscal year ended December 31, 2015. It is unclear how either of these companies
classifies employees and establishments in its responses to government statistical surveys. 19 “Other Services (except Public Administration)” fall within NAICS sector 81. 20 Nike Inc., based in Oregon, reports that “[v]irtually all of our footwear is manufactured outside of the United States
by independent contract manufacturers” at 146 locations, and that its apparel is made in approximately 408 factories in
39 countries. Nike Inc., 2015 Annual Report and Notice of Annual Meeting, p. 67. The company does not disclose U.S.
employment, but according to a press report it had 31,977 U.S. employees in its FY2015. See John Kell, “Majority of
Nike’s U.S. Employees Are Minorities for the First Time,” http://fortune.com/2016/05/12/nike-staff-diversity/, May 12,
2016. 21 See CRS Report R44544, U.S. Semiconductor Manufacturing: Industry Trends, Global Competition, Federal Policy,
by Michaela D. Platzer and John F. Sargent Jr.

Job Creation in the Manufacturing Revival
Congressional Research Service 12
world.” However, according to Alphabet’s 2015 annual financial report, “We rely on third parties
to manufacture many of our assemblies and finished products,” leaving the question of whether
Alphabet owns and operates its own manufacturing facilities unanswered. It is unclear whether
any Alphabet employees are categorized as manufacturing workers and whether any of the
company’s sales are registered as manufacturing output.22
According to Census Bureau estimates, at least 54,000 nonmanufacturing firms employing 3.4
million workers purchased contract manufacturing services in 2012.23
Many of the tasks
performed by the employees of the purchaser firms may be identical to those performed by
employees of manufacturing establishments in management, professional, sales, office, and
transportation occupations. However, as the facilities owned by factoryless goods producers are
usually classified as wholesale, retail, or professional, scientific, and technical service
establishments rather than manufacturing establishments, it is likely that few if any of their
workers are counted as manufacturing workers.
Most contract manufacturing services are provided by establishments in the manufacturing sector,
either in the United States or abroad. At the same time, however, more than 20,000 U.S.
enterprises whose primary business is not manufacturing reported providing contract
manufacturing services in 2012. These enterprises—an “enterprise” may own one or many
establishments or firms—collectively employed 1.5 million workers (Table 3). The number of
those 1.5 million workers who were engaged in manufacturing-related work cannot be
determined from published data.24
Table 3. Characteristics of U.S. Enterprises Providing Contract Manufacturing
Ranked by number of contract manufacturers
Sector
Number of Contract
Manufacturers in Sector
Total Employment of Contract
Manufacturers in Sector
Manufacturing 14,683 2,372,674
Professional, scientific, and
technical services
5,042 230,648
Wholesale trade 4,699 156,276
Construction 2,244 67,355
Retail trade 2,130 659,501
Accommodation and food services 1,686 73,965
Other 4,332 347,253
Source: U.S. Census Bureau, Enterprise Statistics: 2012 Enterprise Tables, Table 7.
Notes: An enterprise may have establishments in multiple sectors and may control more than one firm.
22 Cade Metz, “Where in the World Is Google Building Servers?,” Wired, July 6, 2012; Alphabet Inc., Form 10-K for
the fiscal year ended December 31, 2015, pp. 7, 12. 17, 23, and 28. 23 U.S. Census Bureau, “Enterprise Statistics: 2012 Enterprise Tables,” https://www.census.gov/econ/esp/, Table 8. In
this survey, which collected data from “enterprises” rather than establishments, each enterprise was assigned to the
economic sector with the largest share of the enterprise’s payroll (measured in dollars). Most large enterprises would
thus be expected to control establishments in more than one economic sector. Some 1.9 million enterprises with a
collective $7.7 trillion of sales did not respond to the survey, so the actual number of nonmanufacturing firms
purchasing contract manufacturing services may be considerably larger than indicated by the survey. 24 U.S. Census Bureau, “Enterprise Statistics: 2012 Enterprise Tables,” Table 7.
Job Creation in the Manufacturing Revival
Congressional Research Service 13
The definitional questions associated with factoryless goods producers have proven controversial.
In 2010, U.S. statistical agencies proposed to categorize factoryless goods producers as
manufacturers from 2017.25
This change would have greatly increased both the number of
individuals counted as manufacturing workers and the reported value added of the manufacturing
sector.26
The proposal met with strong objections. In 2014, the Office of Management and Budget
ordered the change postponed, citing the poor quality of statistical data about factoryless
producers.27
As a result, a significant amount of manufacturing-like work and value added is not
attributed to manufacturing in government statistics.
Employment Services Firms
Manufacturers make significant use of workers employed by employment services firms in
addition to their own employees. According to Bureau of Labor Statistics data, 755,650 people in
typical manufacturing production occupations worked for employment services firms in May
2015 (Table 4). That number has not changed significantly since 2000, while the number of
production and nonsupervisory workers employed by manufacturers has fallen by nearly 4
million.28
25 U.S. Census Bureau, “Economic Classification Policy Committee (ECPC) Recommendation for Classification of
Outsourcing in North American Industry Classification System (NAICS) Revisions for 2012,” http://www.census.gov/
eos/www/naics/fr2010/ECPC_Recommendation_for_Classification_of_Outsourcing.pdf. 26 The data are difficult to interpret. The Census Bureau assigned enterprises to economic sectors based in
establishment-level data about employment. So, for example, an enterprise would likely have been assigned to the retail
trade sector if the largest group of its employees worked in retail establishments, even if it owned establishments in
other sectors as well. In March 2012, 643 enterprises classified as being in the retail trade sector, with a total of 75,470
employees, reported that 100% of their operating revenue and net sales came from providing contract manufacturing
services. It is not apparent why such enterprises would have been classified as retail enterprises. For data, see U.S.
Census Bureau, “Enterprise Statistics: 2012 Enterprise Tables,” Table 7. For definitions, see U.S. Census Bureau,
“Definitions for the Enterprise Statistics Program,” https://www.census.gov/econ/esp/definitions.html. The Enterprise
Statistics Program operated from 1954 to 1992 and again from 2007 to October 2016, when it was again discontinued. 27 For background on factoryless manufacturing, see Andrew B. Bernard and Teresa C. Fort, “Factoryless Goods
Producing Firms,” American Economic Review: Papers & Proceedings 2015, vol. 105, no. 5, pp. 518-523. The
statistical issues are discussed in Maureen Doherty, “Reflecting Factoryless Goods Production in the U.S. Statistical
System,” Fariha Kamal, Brent R. Moulton, and Jennifer Ribarsky, “Measuring ‘Factoryless’ Manufacturing: Evidence
from U.S. Surveys,” and Kimberly Bayard, David Byrne, and Dominic Smith, “The Scope of U.S. ‘Factoryless
Manufacturing,’” all in Susan Houseman and Michael Mandel, eds., Measuring Globalization: Better Trade Statistics
for Better Policy, vol. 2 (Kalamazoo, MI: Upjohn Institute, 2015). Some of the objections to the change are laid out in
Robert E. Scott, “What Is Manufacturing and Where Does It Happen?,” Economic Policy Institute, July 21, 2014,
http://www.epi.org/publication/what-is-manufacturing-and-where-does-it-happen/. The postponement order appeared
as Office of Management and Budget, “2017 North American Industry Classification System (NAICS) Revision,”
Federal Register, vol. 79, no. 153, August 8, 2014, p. 46558. 28 Employment of production and nonsupervisory workers in manufacturing was 12.5 million in May 2000 and 8.7
million in May 2015. Data from BLS, Current Employment Survey, http://www.bls.gov/ces/.

Job Creation in the Manufacturing Revival
Congressional Research Service 14
Table 4. Employees of Employment Services Firms in Production Occupations
May 2015
Occupation Number of Workers
First-line supervisors of production and operating workers
5,790
Assemblers and fabricators 276,450
Food processing workers 12,120
Metal and plastic workers 92,340
Printing workers 5,910
Textile, apparel, and furnishing workers 7,770
Woodworkers 3,830
Plant and system operators 1,270
Other production occupations 350,170
Total 755,650
Source: Bureau of Labor Statistics, Occupational Employment Statistics Query System, http://data.bls.gov/oes.
It is likely that many nonproduction workers in manufacturing establishments are employed by
employment services as well. This includes workers in office, maintenance, and food service
occupations. The number of individuals in those categories who work within manufacturing
establishments as employees of employment services cannot be ascertained. Nor is it known how
much value added by the employment services sector stems from manufacturing-related work.
The Decline of the Large Factory The stereotypic U.S. manufacturing plant has thousands of employees filling a cavernous factory
hall. This stereotype is outdated. While the number of factories in all size categories has fallen in
recent decades, the decline has been steepest among factories with large employment. Of more
than 292,000 manufacturing establishments29
counted by the Census Bureau in March 2015, only
863 employed more than 1,000 workers (see Table 5). The number of large factories has risen
slightly since reaching a modern low of 795 in 2010, but remains far below the level of the 1990s.
Those large factories, the ones most prominent in public discussion of manufacturing, collectively
employ 1.8 million workers, 15% of the manufacturing workforce and slightly more than 1% of
the U.S. labor force.30
As the number of large factories has plummeted since the late 20th century, the number of small
factories, those with fewer than 100 workers, has declined far more slowly. Most of the plants in
the latter category are extremely small, with 59% of them having fewer than 10 workers. The
growing prominence of small factories contributed to a decline in mean employment in U.S.
manufacturing establishments, from 46.3 workers in 1998 to 36.2 in 2010. Since then, mean
29 An establishment is defined as “a single physical location where business is conducted or where services or industrial
operations are performed.” In the manufacturing sector, an establishment is analogous to a factory, and the terms are
used interchangeably in this section. 30 Census Bureau, Geography Area Series: County Business Patterns by Employment Size Class, Table CB1400A13.
The number of manufacturing establishments with more than 1,000 employees was 1,504 in 1998, and declined until
2013. Due to definitional changes, data for 1998 and subsequent years are not compatible with those for earlier years.

Job Creation in the Manufacturing Revival
Congressional Research Service 15
employment size has risen to 39.6 workers, due mainly to employment increases at large
establishments in aircraft and automobile manufacturing.
Table 5. Size Distribution of Factories
Number of establishments by number of employees
99 or fewer 100-249 250-499 500-999 1,000 or more
1998 330,956 22,499 7,968 3,322 1,504
2003 312,056 19,548 6,574 2,531 1,140
2008 298,223 18,694 5,957 2,340 1,002
2011 272,396 15,575 4,986 1,871 815
2014 268,096 16,295 5,293 2,013 846
2015 267,969 16,430 5,491 2,072 863
Change, 1998-2015 -19% -27% -31% -38% -43%
Source: Census Bureau, County Business Patterns, various years.
The decline in the number of large factories has been widespread across the manufacturing sector,
with the exception of the food processing industry. Four industries—chemicals, computers and
electronic products, machinery, and transportation equipment—accounted for more than half the
decline in the number of factories with more than 1,000 workers between 1998 and 2010. Since
then, the number of large factories has increased in primary metals, electrical equipment,
machinery, and transportation equipment (see Table 6).31
These are among the most cyclical
manufacturing industries, and the renewed growth in the number of large factories suggests that
existing plants have added workers as business conditions have improved. The number of food
plants with 1,000 or more workers grew in 2015 after several years of decline, but the number of
large factories in computer and electronic products manufacturing continued to fall.
Table 6. Factories with over 1,000 Workers by Selected Industries
Number of establishments
Industry 1998 2003 2008 2011 2015
Food 169 179 171 168 175
Chemicals 107 81 71 57 56
Primary Metals 71 44 42 33 34
Computers and Electronic Products 269 168 140 123 95
Electrical Equipment 66 39 28 22 31
Machinery 122 82 86 71 80
Transportation Equipment 298 260 243 177 219
Source: Census Bureau, County Business Patterns, various years.
31 Census Bureau, County Business Patterns, https://www.census.gov/programs-surveys/cbp.html.

Job Creation in the Manufacturing Revival
Congressional Research Service 16
The recent economic literature on the causes of changes in factory size is scant, but evidence
suggests two principal causes. One is automation: as firms substitute capital for labor, fewer
workers are required to produce a given quantity of output. The other is the increase in what
economists refer to as “vertical specialization,” with individual plants making a narrow range of
the components required for a finished product, and those partially finished goods, known as
“intermediate products,” being shipped from one location to another through sometimes complex
production networks before the final good is manufactured.32
Much of the growth in international
trade in recent years has involved intermediate products in international production networks, and
one logical—although undocumented—corollary of that growth would be that large factories
reduce the scope of their activities and shed workers who formerly made inputs that are now
obtained elsewhere.
Among the remaining factories with more than 1,000 workers, average employment size has held
steady since 2004. In aggregate, however, large factories account for a diminishing share of
manufacturing employment (see Table 7). Approximately 15% of manufacturing workers are
employed in plants with more than 1,000 workers, down from 19% in 1998.
Table 7. Manufacturing Employment by Establishment Size
Percentage of manufacturing employment in employment size category in given year
99 or fewer 100-249 250-499 500-999 1,000 and over
1998 30.9% 20.5% 16.2% 13.3% 19.2%
2003 33.7% 21.2% 16.0% 12.1% 17.0%
2008 34.7% 21.9% 15.7% 12.1% 15.6%
2011 36.2% 21.6% 15.6% 11.4% 15.1%
2015 34.5% 21.7% 16.3% 12.1% 15.4%
Source: CRS, computed from Census Bureau, County Business Patterns by Employment Size Class, various years.
Start-Ups and Shutdowns The employment dynamics of the factory sector differ importantly from those in the rest of the
economy. In other economic sectors, notably services, business start-ups and shutdowns account
for a large proportion of job creation and job destruction. In manufacturing, by contrast,
employment change appears to be driven largely by the expansion and contraction of existing
firms, with entrepreneurship and failure playing lesser roles. This may be due to obvious financial
factors: the large amounts of capital needed for manufacturing equipment may serve as a
deterrent to opening a factory, and the highly specialized nature of manufacturing capital may
make it difficult for owners to recover their investment if an establishment shuts down entirely
rather than reducing the scope of its production activities.
The dynamics of employment change in manufacturing can be seen in two different government
databases. The Bureau of Labor Statistics’ Business Employment Dynamics database, which is
32 For a survey of the evidence on vertical specialization, see Gary Herrigel, Manufacturing Possibilities: Creative
Action and Industrial Recomposition in the United States, Germany, and Japan (New York: Oxford University Press,
2010), ch. 4-6. The literature on the implications of vertical specialization for international trade flows, which stems
from the observation that trade in manufactured goods has grown far more rapidly than global output of manufactured
goods, is now quite large, but economists have paid much less attention to the implications of vertical specialization for
the structure of the manufacturing sector.
Job Creation in the Manufacturing Revival
Congressional Research Service 17
based on firms’ unemployment insurance filings, offers a quarterly estimate of gross employment
gains attributable to the opening of new establishments and to the expansion of existing ones, and
of the gross job losses attributable to the contraction or closure of establishments.33
In
manufacturing, BLS finds, less than 10% of gross job creation since 2005 is attributable to new
establishments, and more than 90% to the expansion of existing establishments. This is quite a
different picture from that offered by the service sector, in which openings routinely account for
more than 20% of all new jobs (see Figure 7).
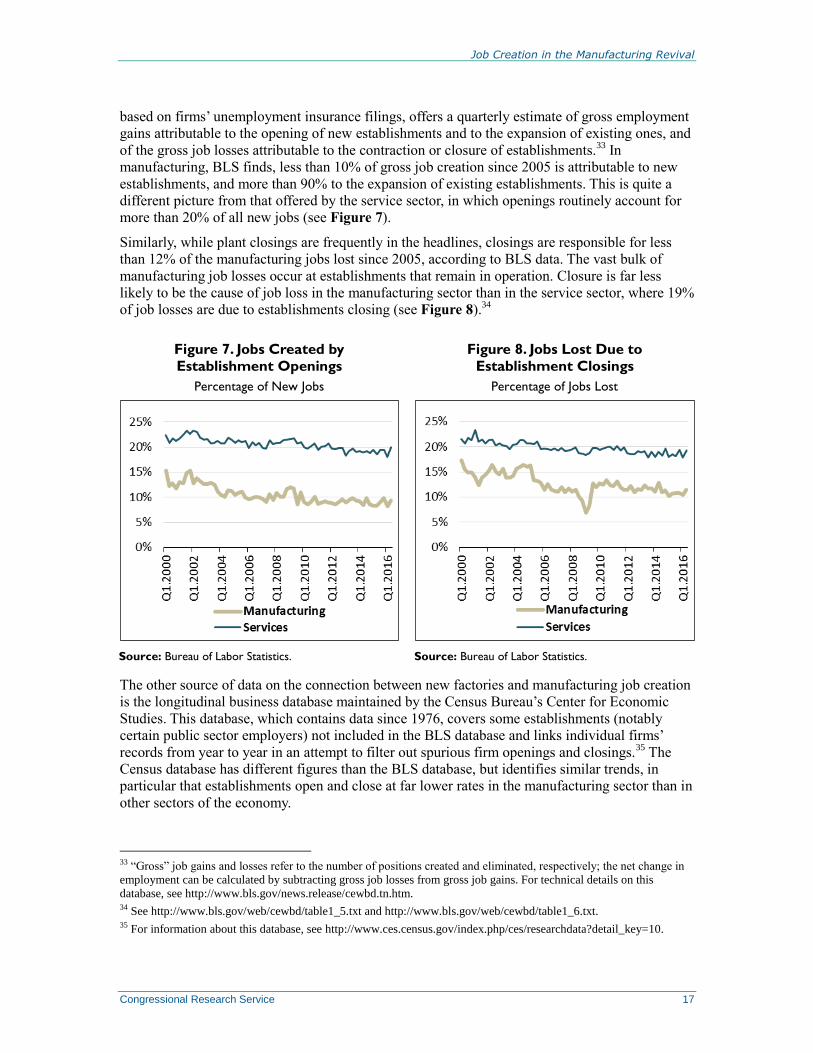
Similarly, while plant closings are frequently in the headlines, closings are responsible for less
than 12% of the manufacturing jobs lost since 2005, according to BLS data. The vast bulk of
manufacturing job losses occur at establishments that remain in operation. Closure is far less
likely to be the cause of job loss in the manufacturing sector than in the service sector, where 19%
of job losses are due to establishments closing (see Figure 8).34
Figure 7. Jobs Created by
Establishment Openings
Percentage of New Jobs
Source: Bureau of Labor Statistics.
Figure 8. Jobs Lost Due to
Establishment Closings
Percentage of Jobs Lost
Source: Bureau of Labor Statistics.
The other source of data on the connection between new factories and manufacturing job creation
is the longitudinal business database maintained by the Census Bureau’s Center for Economic
Studies. This database, which contains data since 1976, covers some establishments (notably
certain public sector employers) not included in the BLS database and links individual firms’
records from year to year in an attempt to filter out spurious firm openings and closings.35
The
Census database has different figures than the BLS database, but identifies similar trends, in
particular that establishments open and close at far lower rates in the manufacturing sector than in
other sectors of the economy.
33 “Gross” job gains and losses refer to the number of positions created and eliminated, respectively; the net change in
employment can be calculated by subtracting gross job losses from gross job gains. For technical details on this
database, see http://www.bls.gov/news.release/cewbd.tn.htm. 34 See http://www.bls.gov/web/cewbd/table1_5.txt and http://www.bls.gov/web/cewbd/table1_6.txt. 35 For information about this database, see http://www.ces.census.gov/index.php/ces/researchdata?detail_key=10.
Job Creation in the Manufacturing Revival
Congressional Research Service 18
The Census Bureau data make clear that the rate at which new business establishments of all sorts
were created fell significantly during the 2007-2009 recession.36
As of 2014, the business creation
rate had not recovered to prerecession levels. The data also show that 12,383 manufacturing
establishments employing 201,887 workers opened their doors in the year to May 2014. This
represents an increase in the number of new plants over 2013, but fewer than in any other year
since 1977, the year for which the data were first collected. The number of new manufacturing
establishments opened each year from 2010 through 2014, on average, was only 40% the annual
average during the 1980s.37
These two data sources on business dynamics thus support similar conclusions about the role of
plant openings and closings in manufacturing employment. Only a small share of the jobs that are
created in the manufacturing sector comes from new factories, largely because factories typically
expand slowly in their early years.38
The average new manufacturing establishment provides 16
jobs during its first year in operation.39
Conversely, a minority of the jobs lost come from the
closure of existing factories, perhaps because factories shrink over a period of years before
closing. The rate of job loss due to factory closures has fallen significantly over time. These facts
indicate that marginal employment change in manufacturing depends more heavily on staffing
decisions at existing factories than on the creation of new factories.
Is There a Chemical Comeback? The chemical industry figures prominently in discussions of a possible revival in U.S.
manufacturing. The production of large amounts of natural gas from shale formations in several
states has lowered the domestic price and provided some assurance of long-term availability,
making the United States a more attractive location for producing nitrogen fertilizers and other
chemical products that make intensive use of natural gas. Additionally, large-scale production of
oil from shale formations in North Dakota and Texas has raised the prospect of increased
petrochemical manufacturing.40
The chemical industry’s investment in U.S. fixed assets, such as machinery and structures,
averaged $97 billion annually from 2007 through 2012, but then moved sharply higher. In 2015,
according to government data, the industry’s fixed investment reached $124 billion.41
Many
corporate announcements and news reports have pointed to substantial new investment in the
sector. In March 2017, a report published for the American Chemistry Council, an industry group,
declared that “chemical manufacturing is on the verge of a renaissance.” The report forecast that
36 John Haltiwanger, Ron Jarmin, and Javier Miranda, Historically Large Decline in Job Creation from Startup and
Existing Firms in the 2008-09 Recession, March 2011, http://www.ces.census.gov/docs/bds/plugin-
BDS%20March%202011%20single_0322_FINAL.pdf. 37 U.S. Census Bureau, Business Dynamics Statistics, Establishment Characteristics Data Tables,
https://www.census.gov/ces/dataproducts/bds/data_estab.html. 38 Lucia Foster, John Haltiwanger, and Chad Syverson, The Slow Growth of New Plants: Learning About Demand?,
Working Paper 12-06, Census Bureau Center for Economic Studies, March, 2012,
ftp://ftp2.census.gov/ces/wp/2012/CES-WP-12-06.pdf. 39 Census Bureau, Longitudinal Business Database, http://www.census.gov/ces/dataproducts/bds/data_estab.html. 40 For background, see CRS Report R43148, An Overview of Unconventional Oil and Natural Gas: Resources and
Federal Actions, by Michael Ratner and Mary Tiemann. 41 Bureau of Economic Analysis, fixed assets accounts tables, Table 3.7ESI.

Job Creation in the Manufacturing Revival
Congressional Research Service 19
the industry’s capital spending would increase 65% by 2020, raising production capacity by 18%.
Most of the new capacity is being added in Texas and Louisiana.42
In contrast to other manufacturing industries, where the number of plants has been in decline, the
number of chemical industry establishments appears to have reached the highest level on record.43
Yet with the average chemical plant employing only 46 workers—down from 60 in 2001—
employment growth has been modest (see Figure 9). This is due principally to the shrinkage or
closure of extremely large plants producing basic chemicals, as the number of plants employing
fewer than 1,000 workers has changed little over the past two decades.
As large commodity chemical plants have closed, chemical production has generally shifted to
smaller, more specialized facilities. In consequence, the industry’s total production capacity has
shrunk. As of the first quarter of 2017, industry-wide production capacity was 13% below its
2007 peak, and industry output was just higher than at the trough of the most recent recession, in
2009 (see Figure 10). The industry had $1.18 million of plant and equipment for each employee
in 2015,44
implying that even very large capital investments will lead to comparatively little direct
employment, at least in the near term.
Figure 9. Chemical Industry
Employment and Establishments
Source: Bureau of Labor Statistics, Quarterly
Census of Employment and Wages.
Note: Annual data.
Figure 10. Capacity and Output
Index, 2001Q1=100
Source: Federal Reserve Board, Industrial
Production Index.
Note: Quarterly data, seasonally adjusted.
Selected Policy Issues for Congress In recent years, Congress has considered a large amount of legislation intended to strengthen the
manufacturing sector. Bills introduced in the 115th Congress take extremely diverse approaches,
ranging from providing financial and technical assistance to designed manufacturing communities
42 PwC, “Transporting growth: delivering a chemical manufacturing renaissance,”
https://www.americanchemistry.com/News_and_Resources/. 43 The U.S. Bureau of Labor Statistics identified 17,674 chemical manufacturing establishments as of the third quarter
of 2016. For data on the number in earlier years, see U.S. Bureau of the Census, 1972 Census of Manufactures, vol. II,
part 2 (Washington, DC, 1976), p. 28-2, and 1987 Census of Manufactures, Subject Series: General Summary
(Washington, DC, 1988), pp. 1-26. 44 Computed from Bureau of Economic Analysis, fixed assets accounts tables, Table 3.1ESI, and National Income and
Product Account data, full-time equivalent employees by industry, Table 6.5D.
Job Creation in the Manufacturing Revival
Congressional Research Service 20
(H.R. 1672; Make It In America Manufacturing Communities Act) to requiring that construction
and repairs funded by the drinking water treatment revolving loan program use only iron and steel
products made in the United States (H.R. 939; Buy America for Drinking Water Extension Act of
2017) to directing the President to appoint a Chief Manufacturing Officer (S. 399; Chief
Manufacturing Officer Act) to providing a tax credit for 25% of the cost of new manufacturing
facility built by a U.S.-based start-up company (H.R. 340; Next Generation American
Manufacturing Act of 2017).
These proposals, and many others, are typically advanced with the stated goal of job creation, and
often with the subsidiary goals of improving employment opportunities for less educated workers
or reversing employment decline in communities particularly affected by the loss of
manufacturing jobs. The available data suggest, however, that these goals may be difficult to
achieve. In particular:
Even large increases in manufacturing activity are likely to translate into
relatively modest gains in manufacturing employment due to firms’ preference to
use U.S. facilities for highly capital-intensive production. After adjusting for
inflation, U.S. manufacturers’ fixed assets per full-time-equivalent employee rose
54% from 2006 to 2015.45
With the average manufacturing worker making use of
more than $300,000 worth of fixed assets, even large investments are likely to
lead to relatively little manufacturing employment, although they may create
demand for workers in other sectors, such as construction or information
services.
The decline in energy costs due to the development of shale gas, strongly
encouraged by federal policy, is having only relatively modest effects on
manufacturing employment in the United States. The three sectors that jointly
account for about 65% of natural gas consumption in manufacturing—chemicals,
petroleum refining, and primary metals—are the three most capital-intensive
sectors of U.S. manufacturing; refineries and chemical plants produce far more
value added per employee than other manufacturing establishments. To the extent
that expansion in these industries creates jobs, those are more likely to be in
supplier industries than in their own facilities.
Changes in methods, products, and materials may transform some manufacturing
industries over the next few years. Some of these changes have been supported
by the federal government. For example, the Revitalize American Manufacturing
and Innovation Act of 2014, part of the Consolidated and Further Appropriations
Act, 2015 (P.L. 113-235, Division B, Title VII), enacted an Obama
Administration proposal to establish a Network for Manufacturing Innovation “to
improve the competitiveness of United States manufacturing and to increase the
production of goods manufactured predominantly within the United States.” The
act authorizes up to seven years of federal support for centers of manufacturing
innovation seeking to improve manufacturing technology.46
Such improvements
may lead to greater manufacturing output, but technological advances in
manufacturing are likely to further reduce the need for production workers.
45 The increase in fixed assets per employee is calculated from Bureau of Economic Analysis (BEA) fixed assets
accounts table 3.1ES and National Income and Product Accounts table 6.5D, http://www.bea.gov. 46 128 Stat. 2222.

Job Creation in the Manufacturing Revival
Congressional Research Service 21
Increases in manufacturing employment are unlikely to result in significant
employment opportunities for workers who have not continued their educations
beyond high school, as the sorts of tasks performed by manufacturing workers
increasingly require higher levels of education and training. This suggests that
government-supported training efforts, while potentially helpful in preparing
individuals for specific manufacturing jobs, should not be expected to lead to an
increase in total manufacturing employment.
To the extent that federal policies lead to the establishment of new manufacturing
facilities in the United States, those facilities are likely to provide only limited
employment opportunities in the locations where they are built. Plants with more
than 1,000 workers are much less common than they once were, and nearly three
in five manufacturing workers are employed in establishments with fewer than
250 workers. This suggests that there will be relatively few instances in which
the siting of a new plant, by itself, will suffice to revitalize a community with a
struggling economy.
Policies that promote construction of new facilities for manufacturing may be
less effective ways of preserving or creating jobs than policies aimed at existing
facilities, as new establishments appear to be relatively unimportant as drivers of
employment in manufacturing.
It is important to note that increased manufacturing activity may lead to job creation in economic
sectors other than manufacturing. For example, the professional services, information, and
finance industries provide about 8% of all inputs into manufacturing, and the transportation and
warehousing industry furnishes about 5%, so expansion of manufacturing is likely to stimulate
employment in those sectors.47
To the extent that increased domestic production of manufactured
goods supplants imports, however, any increases in ancillary employment related to domestic
manufacturing may be counterbalanced by reduced employment related to the transportation and
processing of imported goods, leaving the net employment effect uncertain.
Author Contact Information
Marc Levinson
Section Research Manager
[email protected], 7-7240
47 Estimates taken from Bureau of Economic Analysis, “Use of Commodities by Industries before Redefinitions,” 2013,
http://www.bea.gov/iTable/index_industry.cfm.