job creation and labor productivity in mauritius · 2019-06-28 · figure 1.4. contribution of...
TRANSCRIPT

Job Creation and Labor
Productivity in Mauritius
Pub
lic D
iscl
osur
e A
utho
rized
Pub
lic D
iscl
osur
e A
utho
rized
Pub
lic D
iscl
osur
e A
utho
rized
Pub
lic D
iscl
osur
e A
utho
rized


v
Table of Contents Boxes ............................................................................................................................................................................. v
Figures ........................................................................................................................................................................... v
Tables ...........................................................................................................................................................................vi
Acknowledgments ........................................................................................................................................................ix
Executive Summary ......................................................................................................................................................xi
1. Introduction ............................................................................................................................................................... 1
2. A bird’s-eye view of the Mauritian private sector ..................................................................................................... 6
3. Labor Productivity: Trends and Patterns ................................................................................................................. 20
4. Constraints to Productivity Growth ......................................................................................................................... 36
5. Which Firms Grow? Evidence from a Small Sample of Large Firms ..................................................................... 64
6. Conclusions and Policy Implications ....................................................................................................................... 72
References ................................................................................................................................................................... 74
Annex A: Data Sources ............................................................................................................................................... 75
Annex B: A Review of the Quality of Institutions Supporting SMEs ......................................................................... 80
Annex C: Statistical Annex ......................................................................................................................................... 84
Boxes Box 1.1 Definitions........................................................................................................................................................ 5
Box 2.1 Informal Sector: Low Value Added and High Employment .......................................................................... 14
Box 2.2 The end of preferential access ........................................................................................................................ 18
Box 4.1 Determinants of TFP ...................................................................................................................................... 37
Box 4.2 A Brief Institutional History .......................................................................................................................... 56
Box 4.3 SME Support Schemes ................................................................................................................................... 60
Box 5.1 Limitations of the Panel Dataset of Large Establishments ............................................................................. 65
Figures Figure 1.1. Sectoral distribution of value added, 1976-2017 ......................................................................................... 1
Figure 1.2. Average annual growth of GDP per capita, 2000-17 .................................................................................. 2
Figure 1.3. Decomposition of growth in per capita value added, 2002-13 and 2013-17 ............................................... 2
Figure 1.4. Contribution of capital, labor, and TFP to annual GDP growth, 2002-13 and 2013-17 .............................. 3
Figure 1.5. Trends of capital, labor, and TFP, 2000-17 ................................................................................................. 4
Figure 2.1. Number of establishments by employment size, 2002–13 .......................................................................... 6
Figure 2.2. Distribution of establishments by district, 2013 .......................................................................................... 7
Figure 2.3. Distribution of establishments by type of ownership, 2002-13 ................................................................... 8
Figure 2.4. Value Added and Employment Distribution by Size of Establishment, 2002-13 ....................................... 8
Figure 2.5. Change in Employment by Size of Establishment, 2002-13 ....................................................................... 9
Figure 2.6. Value Added and employment distribution by sector, 2002-13 ................................................................ 10
Figure 2.7. Changes in Value Added by sector and establishment size, 2002-13........................................................ 11
Figure 2.8. Changes in Employment by Sector and Size of Establishment, 2002-13 .................................................. 12
Figure 2.9. Distribution of small establishments by age group, 2007 .......................................................................... 13
Figure 2.10. Distribution of small establishments by age and size, 2007 .................................................................... 13
Figure 2.11. Numbers of Establishments by Formality Status and by Sector, 2007 and 2013 .................................... 14
Figure 2.12. Number of small establishments by formality status and size, 2007 and 2013 ....................................... 14
Figure 2.13. Valued Added by Formality Status, 2007 and 2013 ................................................................................ 15
Figure 2.14. Total Employment by formality status, 2007 and 2013........................................................................... 15
Figure 2.15. Number of Establishments by export status, 2007 and 13 ....................................................................... 16

vi
Figure 2.16. Value Added and Employment by export status, 2007-13 ...................................................................... 17
Figure 2.17. Mauritius export basket, 2000 and 2016 ................................................................................................. 18
Figure 3.1. Average labor productivity, 2002-13 ........................................................................................................ 21
Figure 3.2. Labor productivity levels and growth rates in Mauritius and peer countries............................................. 22
Figure 3.3. Average labor productivity by establishment size, 2002-13...................................................................... 23
Figure 3.4. Labor Productivity Annual Growth Rate, 2002-13 ................................................................................... 23
Figure 3.5. Median monthly wages by educational level and size of establishment, 2013.......................................... 24
Figure 3.6. Monthly earnings by employment category and employment types by consumption decile, 2013 .......... 25
Figure 3.7. Labor productivity by formality status and size – small establishments, 2007 and 2013 .......................... 26
Figure 3.8. Labor productivity by establishments size and sector, 2013 ..................................................................... 27
Figure 3.9. Differentials in average labor productivity by establishments size and sector, 2013 ................................ 28
Figure 3.10. Annualized growth in labor productivity by establishments size and sector, 2002-13 ............................ 29
Figure 3.11. Annual changes in value added and employment by establishment size and sector, 2002-13 ................ 30
Figure 3.12. Sectoral distribution of employment by decile of per adult equivalent household income, 2007-13 ...... 32
Figure 3.13. Distribution of educational attainment by sector of employment, 2007-13 ............................................ 33
Figure 3.14. Distribution of educational attainment by decile of per adult equivalent household income, 2007-13 ... 35
Figure 4.1. Competitiveness Gaps within and across Regions, 2017 .......................................................................... 38
Figure 4.2. Global Competitiveness Index Rankings, Mauritius and Peers, 2017 ....................................................... 38
Figure 4.3. Innovation, Mauritius and Peers, 2017 ...................................................................................................... 39
Figure 4.4. Technological Readiness, Mauritius and Peers, 2017 ............................................................................... 40
Figure 4.5. Rankings on Institutions and Infrastructure Pillars, Mauritius and Peers, 2017 ........................................ 41
Figure 4.6. Distance to Frontier Score, Doing Business report, Mauritius and Peers, 2019 ........................................ 41
Figure 4.7. Globally Competitive Industries Quality of Roads Index, Mauritius and Peers, 2017 .............................. 42
Figure 4.8. International Trade Statistics, 2005-2017 .................................................................................................. 43
Figure 4.9. Quality of Ports Index, Mauritius and Peers, 2017 .................................................................................... 43
Figure 4.10. Air Transport Infrastructure Index, Mauritius and Peers, 2017 ............................................................... 44
Figure 4.11. Quality of Electricity, Mauritius and Peers, 2017 ................................................................................... 44
Figure 4.12. Fixed Broadband Internet Subscriptions per 100 people, Mauritius and Peers, 2017 ............................. 45
Figure 4.13. World Governance Indicator Rankings, Mauritius and Peers, 2017 ....................................................... 46
Figure 4.14. Financial market development indicators, Mauritius and Peers, 2017 .................................................... 47
Figure 4.15. Indicators of credit access, Mauritius and Peers, 2019 ............................................................................ 49
Figure 4.16. Insolvency process, Mauritius and Peers, 2017 ....................................................................................... 50
Figure 4.17. Indicators of labor market development, Mauritius and Peers, 2017 ...................................................... 51
Figure 4.18. Goods market-efficiency Indicators of, Mauritius and Peers, 2017 ........................................................ 53
Figure 4.19. Business taxes, Mauritius and Peers, 2017 .............................................................................................. 54
Figure 4.20. Impact of Taxation on Investment Incentives, Mauritius and Peers, 2017 .............................................. 54
Figure 4.21. Ease of Starting a Business Indicator, Mauritius and Peers, 2019 .......................................................... 55
Figure B 1. Evaluation of the Board of Investment, Institutional Effectiveness.......................................................... 81
Figure B 2. Evaluation of Enterprise Mauritius (not existent anymore) ...................................................................... 81
Figure B 3. Evaluation of the Small and Medium Enterprises Development Authority and MyBiz (now SME
Mauritius Ltd.) ............................................................................................................................................................. 82
Figure B 4. Evaluation of National Institute for Cooperative Entrepreneurship.......................................................... 82
Figure B 5. Evaluation of National Productivity and Competitiveness Council.......................................................... 83
Figure B 6. Evaluation of National Woman Entrepreneur Council ............................................................................. 83
Figure C 1. Annual changes in value added and employment by establishment size and sector, 2002-07 and 2007-13
..................................................................................................................................................................................... 84
Tables Table 4.1. Distribution of establishments by employment size and turnover categories, 2013 ................................... 36
Table 4.2. Indicators of financial market development in Mauritius, 2012-2017 ........................................................ 48

vii
Table 4.3. Development of labor-market indicators, Mauritius, 2012-2017 ................................................................ 52
Table 4.4. Overview Ministries and Core Support Institutions ................................................................................... 57
Table 5.1. Characteristics of Panel and Cross-Sectional Establishments .................................................................... 65
Table 5.2. Surviving Large Firms, Change in Employment, 2007-2013 ..................................................................... 67
Table 5.3. Surviving Large Firms, Employment Transitions, 2007-2013 ................................................................... 68
Table 5.4. Surviving Large Firms, Change in Value Added, 2007-2013 .................................................................... 69
Table 5.5. Surviving Large Firms Mauritius, Change in Labor Productivity, 2007-2013 ........................................... 70
Table A 1: Census of Economic Activities – Data Collection Dates ........................................................................... 76
Table A 2: Census of Economic Activities – Questionnaire type and topics covered ................................................. 77
Table A 3: Additional Sources of Data ........................................................................................................................ 79
Table C 1. Employment growth, absolute and relative, 2007-2013 ............................................................................. 85
Table C 2. Surviving Large Firms Mauritius, OLS Employment Growth, 2007-2013 ............................................... 86

viii

ix
Acknowledgments This report has been prepared by a core team that included Marco Ranzani (Economist, GPV01), Friedrich
Bergmann (Consultant, GPV01), and Verena Tandrayen-Ragoobur (Consultant, GPV01).
The team would like to express its gratitude to the Ministry of Business, Enterprises, and Cooperatives, the
Registrar of Companies Corporate and Business Registration Department, the Economic Development
Board, and the Bank of Mauritius. The team gratefully acknowledges the support and collaboration of
Statistics Mauritius and, in particular, Aimée Li Fa Cheung Kai Suet (Director of Statistics), Set Fong
Cheung Tung Shing (Deputy Director of Statistics), Gangamah Appadu (Principal Statistician), Sita Bookal
(Statistician, CEA Unit), and Riaz Rujub (Senior Statistical Officer, Cartography Unit). The team gratefully
acknowledges financial support of the Research Support Grant for the compilation of the longitudinal
dataset of large establishments.
The team gratefully acknowledges the guidance and feedback of Pierella Paci (Practice Manager, GPV01),
Mark Lundell (Country Director, AFCS2), Carolin Geginat (Program Leader, AFCS2), and Erik von
Uexkull (Resident Representative, Mauritius), as well as the support of Mariella Beugue (Program
Assistant, AFMMU), Rachel Ng Cheong (Temporary, AFMMU), and Martin Buchara (Program Assistant,
GPV01).
The peer reviewers of the report are Ruth Hill (Lead Economist, GPV07) and Gabriela Inchauste (Lead
Economist, GPV04).

x

xi
Executive Summary The economy of Mauritius has experienced substantial growth, and undergone unprecedented
structural transformation since independence. In the aftermath of independence (1968), the government
was able to overcome a number of vulnerabilities, including high population growth, ethnic tensions,
substantial unemployment, and an economy greatly dependent on the production of sugar for international
markets. The economy was diversified and underwent an unprecedented structural transformation that has
made steady growth possible and has placed the country solidly among the richest in the Africa region. Per
capita gross domestic product (GDP) of US$22,356 (measured in current international dollars) in 2017 was
the third highest in Africa and placed Mauritius solidly in the upper-middle-income category.
The structural transformation of the economy has brought about significant poverty reduction, but
has also contributed to widening inequality. Measured against the US$5.50-a-day 2011 purchasing
power parity poverty line, consumption-based poverty declined from 20.3 percent in 2006/07 to 18.1
percent in 2012 and reached 12.1 percent in 2017, well below the average of 34.4 percent among upper-
middle-income countries. Economic growth has been accompanied by an increase in income inequality that
has recently started to decline. Inequality in Mauritius has widened substantially over the last 15 years. The
World Bank (2017) shows that household income inequality has increased particularly in the aftermath of
the global economic downturn and terms-of-trade shock that hit Mauritius between 2008 and 2015.
However, recent estimates reveal the start of what could be a trend reversal. As measured by the Gini index,
income inequality in Mauritius declined from 38.6 in 2012 to 36.5 in 2017. This is comparable with the
incidence of inequality in countries at a similar level of economic development and moderate compared
with the most unequal countries in the world, such as South Africa (0.63), Botswana (0.61), and Namibia
(0.59).1
Over the last decade, rising inequality in household income from labor has been the main culprit
behind the growth in overall income inequality. Skills shortages ascribable to the structural
transformation of the economy have been the single most important contributor to increasing inequality in
earnings (World Bank 2017). The economy has experienced a progressive shift from traditional and low-
skill sectors such as agriculture and textiles to services, notably professional, real estate, and financial
services. This transformation has generated a sizable rise in the demand for skilled workers that has not
been matched by an equally rapid increase in the supply of skilled workers, notwithstanding the substantial
improvement in educational attainment among the population. As a consequence, high-skilled workers
benefited from considerably larger increases in wages compared with low-skilled workers.
Raising productivity across the board, particularly among small and medium enterprises (SMEs), is
key to achieving high-income status by fostering economic growth and making growth more
inclusive. This report is aimed at achieving three main objectives: (i) describing the main features of the
nonagricultural private sector in Mauritius and how they have changed over time; (ii) depicting patterns
and trends in labor productivity and understanding what such patterns mean for inclusive growth going
forward; and (iii) identifying the main constraints to productivity growth by comparing Mauritius to a set
of aspirational peer countries. Fostering labor productivity is the stepping stone to continuing to improve
living standards. Labor productivity growth can be achieved in two main ways: (i) within economic sectors,
through capital accumulation, technological change, or the improved allocation of resources across
productive units; and (ii) through labor movements from sectors with lower productivity to sectors with
higher productivity. As economies develop, labor reallocation across sectors, also known as structural
1 The estimates are based on the latest available surveys from upper-middle-income countries. See Poverty and Equity
Data Portal (database), World Bank, Washington, DC, http://povertydata.worldbank.org/poverty/home/.

xii
transformation, becomes less important, and the first channel remains the key engine to fostering
productivity growth. The productivity indicators used in this study are revenue-based measures. They can
potentially confuse greater market concentration and efficiency gains. In the case of labor productivity,
large gaps across sectors might suggest that it would be possible to achieve efficiency by reallocating
workers to what appears as sectors with higher productivity growth. To the extent that such differences are
attributable to the rents of firms, the analysis would argue in favor of reallocating labor toward the more
highly concentrated and distorted sectors of the economy as opposed to the most productive.
Over the past 15 years, labor productivity, particularly in the services sector, has been the major
contributor to economic growth. Total factor productivity contributed about 0.8 and 1.7 percentage points
to annual growth between 2002 and 2013 and between 2013 and 2017, respectively, which is about 20 and
46 percent of total economic growth. Labor productivity has been the main contributor to annual per capita
economic growth. Its contribution has declined from 83 percent between 2002 and 2013 to 76 percent since
2013, when the more rapid increase in employment relative to the working-age population took up a larger
role (6.9 percent), together with the demographic factor (17.6 percent). Virtually all the productivity growth
has been driven by productivity gains in the services sector, which, alone, explains 77 percent of the growth
in output per worker observed between 2013 and 2017, while manufacturing has also had a positive
contribution thanks to a reduction in the number of jobs in manufacturing.
The (nonagricultural) private sector increasingly features self-employment and microenterprises. In
2013, of a total of over 127,000 establishments, over 51,800 were self-employed individuals, and over
60,800 were microfirms (two to four workers). Together, these account for about 88 percent of all
nonagricultural private sector establishments. The total number of establishments nearly doubled, from
66,400 in 2002 to 127,000 in 2013, largely thanks to a doubling in the number of the self-employed and
microfirms. By contrast, the number of large establishments remained roughly constant over the period.
Despite considerable progress, small firms are still three times less productive than large firms.
Between 2002 and 2013, productivity increased among small and large firms. However, the growth rate
was substantially higher among small firms: 5.4 percent per year compared with 2.9 percent per year among
large firms. This means that small firms reduced the productivity gap with large firms from 3.8 times in
2002 to 2.9 times in 2013. In 2013, the average labor productivity of small firms was MUR 263,000
compared with MUR 759,000 among large firms.
Over two-thirds of value added and almost half of employment in Mauritius are still generated by
large firms. Between 2002 and 2013, the contribution of large firms to nonagricultural value added
decreased from 83 percent to 69 percent. In parallel, small firms more than doubled their share in value
added, reaching 31 percent in 2013. However, as the number of small establishments had almost doubled,
this means that the growth in total value added produced by small firms is ascribable to the growth in the
number of firms as opposed to a humongous increase in value added produced by each firm. A similar
pattern is observed in terms of employment: the contribution of small firms increased from 43 percent to
56 percent, or 283,000 units, in 2013.
Firms operating in the services sector have created the most jobs and are the most productive,
regardless of size. Productivity levels are almost three times higher among small firms providing financial
and insurance services as well as professional services, compared with small firms in manufacturing and
trade. The sectoral gap is even larger among large firms. The average large financial or insurance firm is 5
times more productive than the average large firm in manufacturing or trade. Controlling for differences in
the characteristics in firms, the differences in sectoral productivity remain large. Small firms operating in
other sectors, except for food manufacturing, are up to 200 percent more productive than textile firms.

xiii
Similarly, among large firms, differences in average productivity are considerable and are as high as 600
percent in the case of firms operating in financial and insurance services relative to large firms operating in
the textile sector. Among small and large firms, productivity increases were driven by the services sector.
Employment has increased more quickly in the services sector, where productivity gains have been
the largest. Labor productivity has increased more rapidly in sectors where employment has also grown
more rapidly. This is the case of transport, professional activities, accommodation, and other services
among small firms. And it is the case of health services, real estate, and financial and administrative services
among large firms. Finally, manufacturing, particularly textiles, has gone through a substantial adjustment
along the extensive margin (closure of a large number of establishments) and the intensive margin
(reduction in employment) associated with the dismantlement of the Multi-Fibre Arrangement in 2004 and
increasing competition from low-cost production in economies such as China, India, and Bangladesh. The
growth in productivity observed there is attributable to a larger decline in employment relative to value
added associated with the restructuring of the sector.
Jobs in the high-productivity services sector require high educational attainment that low-income
Mauritians lack. As opposed to manufacturing and other secondary sectors, workers employed in services,
particularly in finance and real estate, professional and administrative activities, and health care and
education, are largely highly educated. About 50 percent of workers in finance and real estate, professional
activities, and education services had attained postsecondary or higher education in 2007. In 2013, also
thanks to a general improvement in educational attainment across the population, the services sector
employed even a larger share of highly educated individuals. However, workers from low-income
households do not possess the educational levels required to access jobs in these sectors. Despite an overall
improvement in the educational levels of the population, the educational gap between households at the
bottom and top of the distribution was still considerable in 2013. The share of workers from households in
the lowest decile with postsecondary or tertiary increased from 0.2 percent in 2007 to 4.3 percent in 2017.
In parallel, the percentage of workers from the top decile with the same educational attainment increased
from 47 to 69 percent.
Developing and attracting high skills are key to fostering innovation, increasing the productivity of
the private sector and of SMEs in particular, and promoting inclusive growth. In 2017, Mauritius
ranked 45th on the Global Competitiveness Index worldwide. While Mauritius is on par and, in many areas,
even ahead of its structural peers, a few key areas have emerged as the main challenges to fostering
productivity growth going forward. For countries such as Mauritius that aspire to become high-income
economies, the benefits of generating more value added by imitation and adaptation of existing technologies
tend to disappear. Firms, in collaboration with the academic world and other public and private partners,
should develop new technologies and move to high–value added production. This requires an environment
conducive to innovation, investments in research and development, particularly by the private sector, high-
quality research institutions that generate basic knowledge, collaboration between universities and the
private sector, and the protection of intellectual property. Innovation requires a skilled workforce in terms
of both hard and softs skills. On the one hand, upper-secondary and tertiary education should focus on skills
that are relevant for a service-oriented knowledge economy and on improving the quality of learning. In
addition to upskilling the local workforce, which will be increasingly important to ensuring that the benefits
of growth will be widely shared, Mauritius will need to attract and retain overseas talent to address the skills
mismatch and to move up the value chain in the knowledge economy. Attracting high-skilled foreign talent
will require a more open and flexible immigration policy (occupation permit system), in addition to
competitive salaries. The Mauritian diaspora could represent a solution for specific skills or sectors.

xiv
The institutional support framework for SMEs seems to be justified by the recent performance of
SMEs. However, it encompasses several institutions, does not reach out to potential users effectively,
and provides duplicated services. The existing system is fragmented across several institutional
counterparts and composed of a panoply of schemes that fail to cater for the needs of SMEs at different
stages of development. Different entities often provide the same support services, creating a lack of clarity
with respect to SMEs. The main obstacle for SMEs remains information asymmetry about such funding
schemes. Overall, the awareness of such schemes among SMEs is low; only a small proportion of
enterprises have used the services of supporting institutions, and those that have rate the quality of the
support low or very low. There is no targeted approach that leads to focused interventions by the various
institutions. As a consequence, the impact of the different support schemes on the start-up, growth, and
competitiveness of SMEs is limited.
This study is a plea for high-quality enterprise data to help in understanding the drivers of differences
in productivity and growth patterns. Existing enterprise data in Mauritius lack, for example, reliable
information on the stock of capital and investment among individual firms, price data at the enterprise level,
and information about entrepreneurs and workforce human capital, including technical, soft and cognitive
skills. Such limitations pose a challenge in measuring capital and total factor productivity (TFP) and in
deriving indicators of physical as opposed to revenue-based productivity. The latter can be a flawed
diagnostic of efficiency as it might reflect market power, which might be confused with the efficient use of
inputs if price data are not captured. Likewise, it may confuse the understanding of differences in TFP that
might be driven by management quality.

1
1. Introduction The government aspires for Mauritius to become a high-income country by 2023. Since independence
in 1968, the economy has posted steady progress in performance. This has come to be known as the
Mauritian miracle or the success of Africa. Mauritius successfully transitioned from a low-income
monocrop exporter, subject to terms-of-trade and output shocks, high population growth, and ethnic
tensions, to a diversified services-based upper-middle-income economy with low levels of poverty.
Mauritius is today one of the strongest economies in Africa and is aiming to achieve a second economic
miracle and to join the group of high-income economies by 2023.
However, economic growth has recently fallen short of expectations. The average growth in gross
domestic product (GDP) has slowed in recent years as a result of a demographic transition that is reaching
a late stage, the loss of preferential access of the country’s sugar and textile production to the European
Union (EU) and United States markets, negative terms of trade, and growing international competition in
low-cost industries. The government intends to promote economic growth by fostering considerable public
investments in infrastructure and improvements in the business environment. However, the fiscal space
remains limited, with public debt at about 65 percent of GDP, and a primary deficit of over 3 percent of
GDP.
The Mauritian economy has realized an unprecedented structural transformation since
independence. At the time of independence, the primary sector, mainly sugarcane production, accounted
for over 20 percent of the country’s GDP; by 2017, it had declined to about 4 percent, offset by a boom in
manufacturing in the 1980s and the subsequent development of the services sector (Figure 1.1). This made
steady economic growth possible, significantly reduced poverty, and placed the country solidly among the
richest in the Africa region. Over the last 20 years, the economy posted an average annual per capita growth
of about 3.9 percent, compared with 2.0 percent in Sub-Saharan Africa and 4.7 percent in middle-income
countries (Figure 1.2), as it continued a process of structural transformation from traditional and low-skill
sectors, such as agricultural and textiles, toward services. Per capita GDP of US$22,356 (measured in
current international dollars) in 2017 is the third highest in Africa and places Mauritius solidly in the upper-
middle-income category.
Figure 1.1. Sectoral distribution of value added, 1976–2017
Source: Based on data of the World Development Indicators, World Bank.
0%
10%
20%
30%
40%
50%
60%
70%
80%
90%
100%
197
6
197
8
198
0
198
2
198
4
198
6
198
8
199
0
199
2
199
4
199
6
199
8
200
0
200
2
200
4
200
6
200
8
201
0
201
2
201
4
201
6
Per
cen
t
Agriculture Industry Services

2
Figure 1.2. Average annual growth of GDP per capita, 2000–17
Source: Based on data of Statistics Mauritius and the World Development Indicators, World Bank.
Productivity growth has been the major, but declining, contributor to economic growth over the last
15 years. Productivity contributed about 83 percent to annual economic growth between 2002 and 2013,
whereas changes in employment and demographics had a limited impact (Figure 1.3, panel a). The
contribution of productivity growth has declined to 76 percent since 2013, and the more rapid increase in
employment relative to the working-age population has taken up a large role (6.9 percent), together with
the demographic factor (17.6 percent), which is attributable to the more rapid dynamic of the working-age
population relative to the total population. Virtually all the productivity growth was driven by productivity
gains within sectors as opposed to employment shifts from low- to high-productivity sectors (Figure 1.3,
panel b). Structural transformation explains about 14.5 percent of the productivity growth observed between
2002 and 2013. The size of this component halved during 2013–17, due to the fact that the process of
structural transformation of the economy has been virtually completed. The lion’s share is taken up by the
services sector, which explains 77 percent of the growth in output per worker observed between 2013 and
2017, while manufacturing also made a positive contribution thanks to a reduction in the number of jobs.
Figure 1.3. Decomposition of growth in per capita value added, 2002-13 and 2013-17
a. Aggregate productivity, employment and demographic profile of growth

3
b. Decomposition of growth in output per worker, by sector
Source: Based on data of National Accounts and Employment Historical Series, Statistics Mauritius.
After driving Mauritius’ economic growth in the first decade of the 2000s, the accumulation of
physical and human capital has slowed. Estimates based on the growth accounting model with human
capital show that physical and human capital stocks grew at an annual rate of approximately 4.5 and 2.2
percent between 2002 and 2013, respectively. At the same time, the annual growth rate of total factor
productivity (TFP) was considerably lower, at 0.8 percent. Between 2013 and 2017, TFP growth accelerated
(1.7 percent), outpaced the growth in human capital (1.1 percent), and was almost on par with the growth
in physical capital (1.9 percent). Thus, the contribution of physical and human capital to economic growth
has been on the decline since 2013, from 1.6 and 1.5 percent per year between 2002 and 2013 to 0.6 and
0.7 percent post-2013 (Figure 1.4). In parallel, the contribution of TFP has ramped up from 19 to 46 percent
as a share of total GDP growth.
Figure 1.4. Contribution of capital, labor, and TFP to annual GDP growth, 2002–13 and 2013–17
Source: Based on data of the World Development Indicators, World Bank and Barro and Lee’s database.
The reduction in private investments and therefore in the accumulation of physical capital is
ascribable to declining capital productivity. Between 2002 and 2013, a decline in capital productivity by

4
6 percent led to a reduction in private investment as a share of GDP from 27.3 percent of GDP in 2008 to
23.2 percent in 2013. Since 2013, changes in capital productivity have rebounded into positive territory;
yet, they have been modest and not sufficient to restore the pre-2002 level (Figure 1.5). By contrast, labor
productivity increased considerably between 2002 and 2013, and gains have continued, although declining,
since 2013 (Figure 1.5). TFP increased by about 13 percent between 2000 and 2013 and has since then
grown at a faster pace that has translated into a larger contribution to recent economic growth.
Figure 1.5. Trends of capital, labor, and TFP, 2000–17
Source: Based on data of the Productivity and Competitiveness Indicators 2018, Statistics Mauritius.
Adopting a development strategy based on innovation and entrepreneurship is key to escaping the
middle-income trap. Currently, the middle-income group covers a variety of countries. For the 2019 fiscal
year, the World Bank defines as middle-income economies all countries with a gross national income per
capita of between US$996 and US$12,055, and it identifies upper-middle-income countries as those with
income per capita above US$3,895. This classification covers a large number of countries. such as Brazil,
China, Colombia, Malaysia, South Africa (upper middle-income), and India, Indonesia, Sudan, and Ukraine
(lower middle-income). Some of these countries will make it to the high-income club, and others will not.
As a country develops and the gap with advanced economies narrows, imitation and the adoption of existing
technologies do not constitute a big advantage anymore, and a country must start a new growth path
grounded on innovation and entrepreneurship. Countries do not grow by making more of the same, but by
changing what they do. “So while Israel used to export oranges, now they export IPOs of high-tech firms.
Turkey used to export olive oil. Now they export cars and electronics.” (Hausmann 2015). Such a shift in
gears requires sophisticated skills, expertise, new productive capabilities, and technology. For this to
happen, policies must identify new opportunities for diversification and allocate scarce resources from
ineffective uses such as inefficient public enterprises, low–value added exports, and risky assets toward
investments in research and development and in transparent and accountable institutions.
-20
-10
0
10
20
30
40
50
60
70
Pe
rcen
t
Capital Productivity Labour Productivity Multifactor Productivity

5
Box 1.1 Definitions Establishment: An establishment is defined as a production unit engaged in one kind, or predominantly one kind of activity.
Small/large establishment: Statistics Mauritius defines small and large establishments according to the number of employees. The
threshold for small establishments is 9 workers. Therefore, production units with less than 10 persons engaged are classified as
small establishments. This definition is not shared by other institutions in Mauritius. According to the Small and Medium
Enterprises Development Authority Act 2009, small and medium enterprises (SMEs) are a production unit with a maximum annual
turnover of MUR 50 million.
Informal establishment: Establishments are classified as informal if they are household unincorporated market enterprises. More
precisely, they have to satisfy the following three conditions: (i) they are owned by a household and sell all or part of their
production, (ii) the assets used for business purposes are not separated from those of the owner, and (iii) business receipts and
expenditures are not separated from the owner’s accounts.
Export-oriented establishment: Statistics Mauritius classifies establishments as export oriented if they were previously operating
with an export processing zone certificate or if they produce goods for export and hold a registration certificate issued by the Board
of Investment. This classification is limited to establishments operating in manufacturing.
Gross output: Gross output measures the value of goods or services produced, including work in progress and production for own
use. For distributive trade, output is measured by the trade margin, which is the difference between sales value and the cost of the
goods sold. Gross output is valued at basic prices, that is, the value of the goods or services exclusive of taxes (mainly the deductible
value added tax), but includes subsidies from government.
Intermediate consumption: Intermediate consumption is the sum of expenses for services and raw materials used in the production
process. It covers nondurable goods and services, including repairs and maintenance of the capital stock.
Value added: Value added is equal to gross output at basic prices, less intermediate consumption at purchaser prices.
Labor productivity: Labor productivity measures gross value added per unit of labor input and indicates how efficiently labor is
used in production. It is calculated as the value added produced by each establishment, divided by the number of persons working
in the establishment. Thus, it does not account for the number of hours worked or for quality of labor inputs. Moreover, changes in
labor productivity are the result of a number of factors, including changes in capital and technical, organizational, and efficiency
changes within and across firms, economies of scale, varying degrees of capacity utilization, and measurement errors. Therefore,
it is difficult to isolate the contribution of each variable, and any change observed in labor productivity only partially reflects the
productivity of labor in terms of the personal capacities of workers or the intensity of their effort.
Real values (2010 prices): All monetary values are converted into real values by using sectoral deflators and 2010 as the base year.
The choice of 2010 as the base year is ascribable to a change in the structure of the National Standard Industrial Classification of
Economic Activities in that year and to the fact that Statistics Mauritius has created a new National Accounts series starting from
2006, and 2010 is the most recent year that the two series (pre-/post-2006) have in common. However, caution should be used
because, due to the revision of the National Standard Industrial Classification of Economic Activities, the composition of broad
sectors, say, manufacturing, is not constant between 2002 and 2007, and therefore the deflators used might not necessarily refer to
the same basket of 5-digits industries.
The rest of this study is organized as follows. Section 2 describes the main features of the nonagricultural
private sector in Mauritius and of how it has changed over time. Section 3 depicts trends and patterns in
labor productivity and discusses what such patterns mean for inclusive growth going forward. Section 4
describes the main constraints to productivity growth. Section 5 takes a deep dive into job creation and the
productivity dynamics of a subsample of large firms that are followed over time between 2007 and 2013.
Section 6 concludes. The main data sources used in the analysis are the most recent rounds of the census of
economic activities (CEA), namely, 2002, 2007, and 2013, conducted every five years by Statistics
Mauritius. The main objective of the CEA is to collect statistics on the characteristics and structure of all
types of operating economic activities, except agriculture. The CEAs are conducted in two phases. The first
phase, which lasts from January to December, covers small nonagricultural establishments and itinerant
units, engaging less than 10 workers. Data are collected by direct interviews from a representative sample
of small units. The second phase targets large establishments and is typically carried out for about 10 to 12
months starting in July of the year following the data collection activities for small establishments. The
definition of the main variables used throughout the analysis are reported in Box 1.1, and additional details
about the CEA and other data sources used are provided in Annex A.

6
2. A bird’s-eye view of the Mauritian private sector This section provides a general overview of the main traits of the nonagricultural private sector in Mauritius
and how these changed over 2002–13, before delving into the trends and patterns of labor productivity in
the next section.
In 2017, the private sector in Mauritius contributed about 91 percent of total value added. Between
2002 and 2013, the value added share of the private sector increased from about 87 percent to 90 percent.
Total employment reached 573,500 units in 2017, posting an increase by 18 percent between 2000 and
2017, which is significantly larger than the rise in the working-age population (+11 percent). Private sector
employment contributes 93.6 percent to total employment (Statistics Mauritius 2018).
The private sector landscape is dominated by micro and small firms. In 2013, out of a total of over
127,000 firms there were over 51,800 self-employed and over 60,800 microfirms, employing between 2
and 4 workers, that contribute about 88 percent of all nonagricultural private sector establishments (Figure
2.1). This compares with about 12,300 firms with between 5 and 9 workers and less than 2,100 with more
than 10 workers, the so-called large firms according to the definition adopted by Statistics Mauritius.
Among the latter, only about 400 firms employ more than 100 workers each. The total number of
establishments nearly doubled from 66,400 in 2002 to 127,000 in 2013. The expansion in the number of
firms is largely ascribable to a rapid growth in the number of self-employed, micro and small firms.
Between 2002 and 2013, both self-employed and microfirms approximately doubled from 24,000 to 52,000
and from 33,000 to 61,000 respectively. Small establishments with 5 to 9 workers increased from 7,600 to
12,000. Based on data from the panel component of the labor force survey conducted by Statistics
Mauritius, which follows individuals for a period of up to 16 months, the majority of self-employed at the
end of the 16-month period were self-employed at the beginning (62 percent), some 31 percent were
originally employers, that is, they hired some workers for a wage in their business, about 10 percent were
previously helping out in a family business as unpaid worker. In addition, some 5.6 and 1.9 percent were
initially unemployed and outside the labor market, respectively. By contrast, the number of large
establishments remains roughly constant over the same period.
Figure 2.1. Number of establishments by employment size, 2002–13
Source: Based on data of the Census of Economic Activities, Statistics Mauritius.

7
Virtually all firms are in the island of Mauritius and only 2.5 percent of small firms and 1 percent of
large firms are situated in Rodrigues. Most firms are geographically clustered in three districts (Figure
2.2): 56 percent of small firms and 75 percent of large firms are located in Port Louis, Plaines Wilhems and
Pamplemousses. The distribution of firms across districts has not changed substantially from 2002 to 2013.
A larger share of small firms is located in Black River and Grand Port and less in Flacq and Port Louis,
whereas in 2013 more large firms are located in Pamplemousses and Plaines Wilhems and less in Port Louis
compared with 10 years earlier.
Figure 2.2. Distribution of establishments by district, 2013
Source: Based on data of the Census of Economic Activities, Statistics Mauritius.
Note: Rodrigues is excluded for visual purposes. About 2.5 (1) percent of small (large) establishment is located in Rodrigues.
Small and large firms are established in different forms. Small firms are mostly owned by individual
proprietors (81 percent in 2013) and only a minority is established as a company (14.6 percent in 2013)
(Figure 2.3). By contrast, over 9 in 10 large firms are established as companies and only a small share is
owned by individual proprietors. Between 2002 and 2013 a rising number of small establishments have
adopted the form of a company, from 5.6 percent in 2002 up to almost 15 percent in 2013. A similar pattern
is observed among large ones with an increase in the share of companies from 74.6 to 92.4 percent.

8
Figure 2.3. Distribution of establishments by type of ownership, 2002-13
a. Small establishments b. Large establishments
Source: Based on data of the Census of Economic Activities, Statistics Mauritius.
Over two thirds of the value added and over half of employment in Mauritius is generated by large
firms. However, between 2002 and 2013 the contribution of large firms to nonagricultural value added has
decreased substantially (Figure 2.4) from 83 percent to 69 percent. In parallel, small firms have gained
importance and have more than doubled their share in value added and reached 31 percent in 2013. As the
number of large establishments remained roughly constant over the period and the number of small
establishments has almost doubled, this means that the growth in value added produced by small firms is
likely ascribable to the growth in the number of firms as opposed to an increase in value added produced
by each firm. A similar pattern is observed in terms of employment: small firms contributed about 160,000
jobs in 2002, or 43 percent of total nonagricultural private sector employment. Between 2002 and 2013,
their contribution increased considerably to reach 56 percent or 283,000 units.
Figure 2.4. Value Added and Employment Distribution by Size of Establishment, 2002-13
a. Distribution of Value Added by Size of Establishment,
2002-13
b. Distribution of Employment by Size of Establishment,
2002-13
Source: Based on data of the Census of Economic Activities, Statistics Mauritius.
9
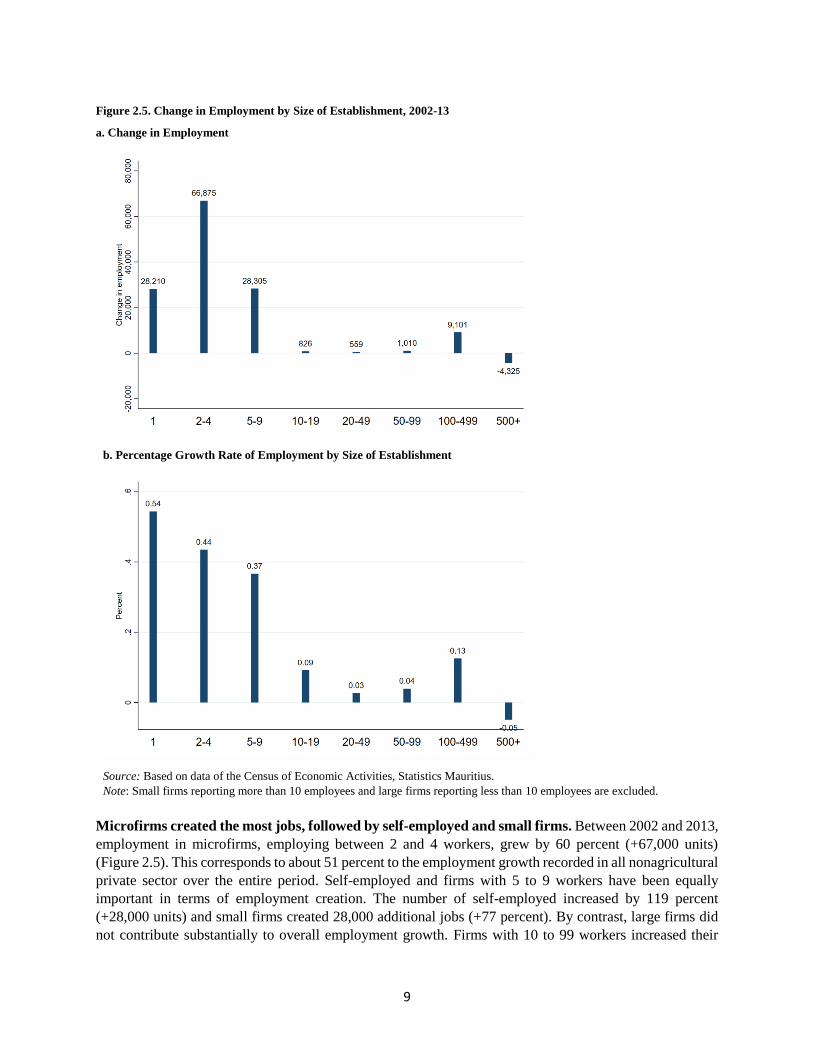
Figure 2.5. Change in Employment by Size of Establishment, 2002-13
a. Change in Employment
b. Percentage Growth Rate of Employment by Size of Establishment
Source: Based on data of the Census of Economic Activities, Statistics Mauritius.
Note: Small firms reporting more than 10 employees and large firms reporting less than 10 employees are excluded.
Microfirms created the most jobs, followed by self-employed and small firms. Between 2002 and 2013,
employment in microfirms, employing between 2 and 4 workers, grew by 60 percent (+67,000 units)
(Figure 2.5). This corresponds to about 51 percent to the employment growth recorded in all nonagricultural
private sector over the entire period. Self-employed and firms with 5 to 9 workers have been equally
important in terms of employment creation. The number of self-employed increased by 119 percent
(+28,000 units) and small firms created 28,000 additional jobs (+77 percent). By contrast, large firms did
not contribute substantially to overall employment growth. Firms with 10 to 99 workers increased their

10
employment by 4.5 percent, whereas those with 100 to 499 added about 9,000 workers representing an
increase by 14 percent. The largest firms, employing 500 or more workers, shed the number of jobs by
4,300 units over the entire period, and particularly between 2002 and 2007 when the employment loss
reached -16,700 units.
A process of structural transformation has progressed rapidly both in terms of value added and
employment. The process of structural transformation moved the Mauritian economy away from traditional
sectors such as manufacturing toward services (Figure 2.6, panel a). The overall contribution of secondary
sectors to total nonagricultural value added declined from about 40 percent in 2002 to 29 percent in 2013.
Such decline is largely ascribable to manufacturing, with its share reducing from 31.8 percent to 18.7
percent, whereas other secondary sectors hovered around 9/10 percent of value added. In parallel, the
services sector expanded substantially from 59 percent to 71 percent, largely thanks to finance, real estate
professional and administrative activities that all together make up about 38.9 percent of value added in
2013, followed by trade (14.5 percent), accommodation (9.4 percent), and transports (8.4 percent).
Such transformation measured along the output side is mirrored by changes occurred in
employment. Manufacturing has shed jobs and its share in total employment declined from 37 percent in
2002 to 21.7 percent in 2013 (Figure 2.6, panel b). This was to the benefit of services, and particularly of
trade, finance, real estate, professional and administrative activities that expanded most rapidly over the
same time period. Overall, the employment share of the services sector increased from about 50 percent in
2002 to 67 percent of total employment in 2013, with trade contributing 24.7 percent, followed by real
estate, financial, professional and administrative activities, education and health services (22.1 percent),
transports (10.5 percent) and accommodation (9.9 percent).
Figure 2.6. Value Added and employment distribution by sector, 2002-13
a. Distribution of Value Added by Sector, 2002-13 b. Distribution of Employment by Sector, 2002-13
Source: Based on data of the Census of Economic Activities, Statistics Mauritius.
Small firms have been the driver of growth in value added, particularly those operating in the services
sector. Between 2002 and 2013, overall value added increased by 71 percent from MUR 138 billion to
MUR 233 billion in 2013 (measured in 2010 prices). However, the growth rate of value added and its
sectoral patterns differ substantially between small and large firms (Figure 2.7). On the one hand, small
firms posted a value added growth of about 218 percent: value added by small firms increased by MUR

11
23.8 billion between 2002 and 2007 and by MUR 27.3 billion between 2007 and 2013 (Figure 2.7, panel
a). This increase is mainly driven by small firms operating in services, especially in retail and wholesale
trade and other services. The manufacturing sector and other secondary sectors only contributed 23 percent
of the increase in value added. On the other hand, large firms experienced a growth in value added of 38
percent over the same period (Figure 2.7, panel b). The value added of large firms increased by MUR 20.2
billion between 2002 and 2007 and by MUR 23.4 billion between 2007 and 2013. Unpacking the changes
in value added by sector shows that the subpar performance of large firms is largely ascribable to the decline
in value added of manufacturing, particularly textiles, and trade. As value added of large firms operating in
real estate and financial services, administrative and professional activities, education and health services
was posting an increase of 125 percent, manufacturing and trade reduced their value added by 10 and 1.6
percent, respectively (MUR -4,250 and -MUR 200 million over the entire 2002–13 period).
Figure 2.7. Changes in Value Added by sector and establishment size, 2002-13
a. Small Establishments: 2002-07 and 2007-13 b. Large Establishments: 2002-07 and 2007-13
Source: Based on data of the Census of Economic Activities, Statistics Mauritius.
Small firms also spearheaded the creation of new jobs. Overall, the nonagricultural private sector added
about 130,000 jobs between 2002 and 2013, corresponding to an increase of about 35 percent to reach
500,000 units in 2013. Of the 131,000 additional jobs created, 124,000 (or 95 percent of all jobs) were
created by small firms and a meagre 7,000 were generated by large firms (Figure 2.8). This is equivalent to
an increase of 78 percent in small firms that employ some 283,000 workers in 2013, and increase of 3.4
percent in large firms that contribute a total of 217,000 workers in 2013. Moreover, 88 percent of the
additional jobs created by small firms are in services, with accommodation (+206 percent), other services
(+111 percent), and trade (+99 percent) being the fastest growing sectors (Figure 2.8, panel a). By contrast,
manufacturing and other secondary sectors increased their employment by 24 percent overall. As observed
in terms of changes in value added, the poor employment performance of large firms is mainly ascribable
to the employment dynamic in manufacturing. While large firms operating in services added about 42,000
jobs over the 2002-13 period, mainly in trade and other services, manufacturing firms shed 38,000 jobs
(Figure 2.8, panel b).

12
Figure 2.8. Changes in Employment by Sector and Size of Establishment, 2002-13
a. Small Establishments b. Large Establishments
Source: Based on data of the Census of Economic Activities, Statistics Mauritius.
About 1 in 4 small firms is less than 5 years old and over half of small firms older than 10 years.
Unfortunately, the Census of Economic Activities captures the year in which each establishment starts
operating only for small establishments in 2007 and 2013. However, due to data entry issues in 2013, only
the 2007 round can be used to characterize small firms according to their age. Small firms are relatively
young: about 1 in 4 is less than 5 years old and about 44 percent is less than 10 years old (Figure 2.9). There
are also some 56 percent small firms that are at least 10 years old: 33 percent are between 10 and 20 years
old and 23 percent are at least 20 years old. The age distribution of small firms does not appear to be
correlated with size (Figure 2.10): it is possible that small firms do not expand their workforce over time
and that seems to be corroborated by the similar age distribution of self-employed and microfirms (2 to 4
workers). In addition, although the number of small firms and particularly of self-employed exploded
between 2002 and 2013, the average life of such businesses seems to be rather short as confirmed by the
high number of businesses that closed, about 9,400, between the 2007 and the 2013 census rounds according
to a register maintained by Statistics Mauritius.

13
Figure 2.9. Distribution of small establishments by age group, 2007
Source: Based on data of the Census of Economic Activities, Statistics Mauritius.
Figure 2.10. Distribution of small establishments by age and size, 2007
Source: Based on data of the Census of Economic Activities, Statistics Mauritius.
About 1 in 2 new firms are informal. The number of informal firms increased by 15,300 units from 17,000
in 2007 to 32,300 in 2013, which translated into an increase in their share from 18 percent in 2007 to 25.3
percent in 2013 (Figure 2.11, panel a). About 58 percent of informal firms are self-employed, 39 percent
are microbusinesses with two to four workers and 3 percent employ 5 to 9 workers. The number of informal
firms has roughly doubled regardless of firms’ employment size (see Box 2.1). Over the same time period,
the total number of firms increased by 32,700 units: over half of firms’ creation can be ascribed to the
informal sector. Informal firms typically operate in transports, trade, and manufacturing (around 72 percent)
with modest changes over time (Figure 2.11, panel b). Between 2007 and 2013 the share of informal firms
operating in trade increased by 5 percent, while the share in manufacturing remained constant and the share
in transport declined.
12 - 4
5 - 9
0
2
4
6
8
10
12
14
16
18
1 2 - 5 6 - 9 10 - 19 20+
Size
Per
cen
t
Age

14
Figure 2.11. Numbers of Establishments by Formality Status and by Sector, 2007 and 2013
a. Share of informal firms on all firms, 2007 and 2013 b Distribution of informal firms by sector, 2007 and 2013
Source: Based on data of the Census of Economic Activities, Statistics Mauritius.
Box 2.1 Informal Sector: Low Value Added and High Employment The size of the informal sector is on the rise in Mauritius. The rapid growth of the informal sector has been equally distributed
across firms of different size. Between 2007 and 2012, the number of informal firms roughly doubled regardless of firm size. For
example, the number of informal self-employed increased from about 9,000 to 19,000, the number of informal microfirms doubled
to reach 12,000 units in 2013. Similarly, the number of small (with 5 to 9 workers) informal firms increased from 359 to 751 units,
and they clearly represent a small share of the informal sector.
Figure 2.12. Number of small establishments by formality status and size, 2007 and 2013
Source: Based on data of the Census of Economic Activities, Statistics Mauritius.
However, the contribution of informal firms to value added is negligible. Informal firms produced about 2.2 percent of total value
added in 2007 and 3.5 percent in 2013 (Figure 2.13, panel a). This corresponds to a value added of the informal sector of roughly
MUR 8.4 billion in 2013 (Figure 2.13, panel b). Small formal firms posted a growth of 50 percent in their value added, from MUR
43.0 billion to MUR 66.0 billion. Over the same time period, the value added generated by the informal sector increased by 112
percent, from almost MUR 4.0 billion to MUR 8.4 billion.

15
Figure 2.13. Valued Added by Formality Status, 2007 and 2013
a. Distribution of value added by formality status among all
firms, 2007 and 2013
b. Total value added by formality status of small firms, 2007
and 2013
Source: Based on data of the Census of Economic Activities, Statistics Mauritius.
The informal sector contributed considerably to job creation. In 2007, informal firms contributed 7 percent to total employment
and their share increased to 10.5 percent in 2013 (Figure 2.14, panel a). While employment in small formal firms increased by 26
percent from 183,300 to 230,600 units, in the informal sector employment recorded a growth of +86 percent from 28,200 to 52,500
units (Figure 2.14, panel b).
Figure 2.14. Total Employment by formality status, 2007 and 2013
a. Distribution of total employment by formality status
among all firms, 2007 and 2013
b. Total employment by formality status of small firms, 2007
and 2013
Source: Based on data of the Census of Economic Activities, Statistics Mauritius.
Following the loss of preferential access, manufacturing has lost steam, particularly in terms of job
creation. After the end of the sugar protocol in 2009, the abolishment of EU sugar-import quotas from
African, Caribbean and Pacific states in 2017, and of the Multi-Fiber Agreement in 2004 (Box 2.2), the
Mauritian manufacturing sector has faced tough challenges. In 2007, there were a total of 320 export-

16
oriented manufacturing firms, representing 7.7 percent of all firms (Figure 2.15, panel a). The number
reduced by over 100 units to reach a total of 213 establishments in 2013 (and a share of 4.8 percent). The
decline is largely ascribable to textiles that saw the closure of over 180 establishments. In 2017, export-
oriented firms represented 42 percent of all manufacturing firms and contributed 11 percent of total value
added (MUR 39 billion). In 2013, their share declined to 36 percent of all manufacturing firms and their
value added contribution decreased to 8 percent (Figure 2.16, panel b). In terms of employment, export-
oriented firms accounted for virtually all the job losses in the manufacturing sector between 2007 and 2013.
Employment in export-oriented firms dropped by 11,000 from 63,500 to 52,500 units to reach about 10
percent of total employment (Figure 2.15, panel c). Over the same time period, the manufacturing sector
overall shed about 14,000 jobs, from 87,000 to 73,000 workers.
Figure 2.15. Number of Establishments by export status, 2007 and 13
a. Share of Export Oriented Establishments among all firms,
2007 and 2013
b. Share of Export Oriented Establishments among large
manufacturing firms, 2007 and 2013
Source: Based on data of the Census of Economic Activities, Statistics Mauritius.

17
Figure 2.16. Value Added and Employment by export status, 2007-13
a. Distribution of value added by export status among all
firms, 2007 and 2013
b. Total value added by export status among large
manufacturing firms, 2007 and 2013
c. Distribution total employment by export status
among all firms, 2007 and 2013
d. Total employment by export status among large
manufacturing firms, 2007 and 2013
Source: Based on data of the Census of Economic Activities, Statistics Mauritius.
18
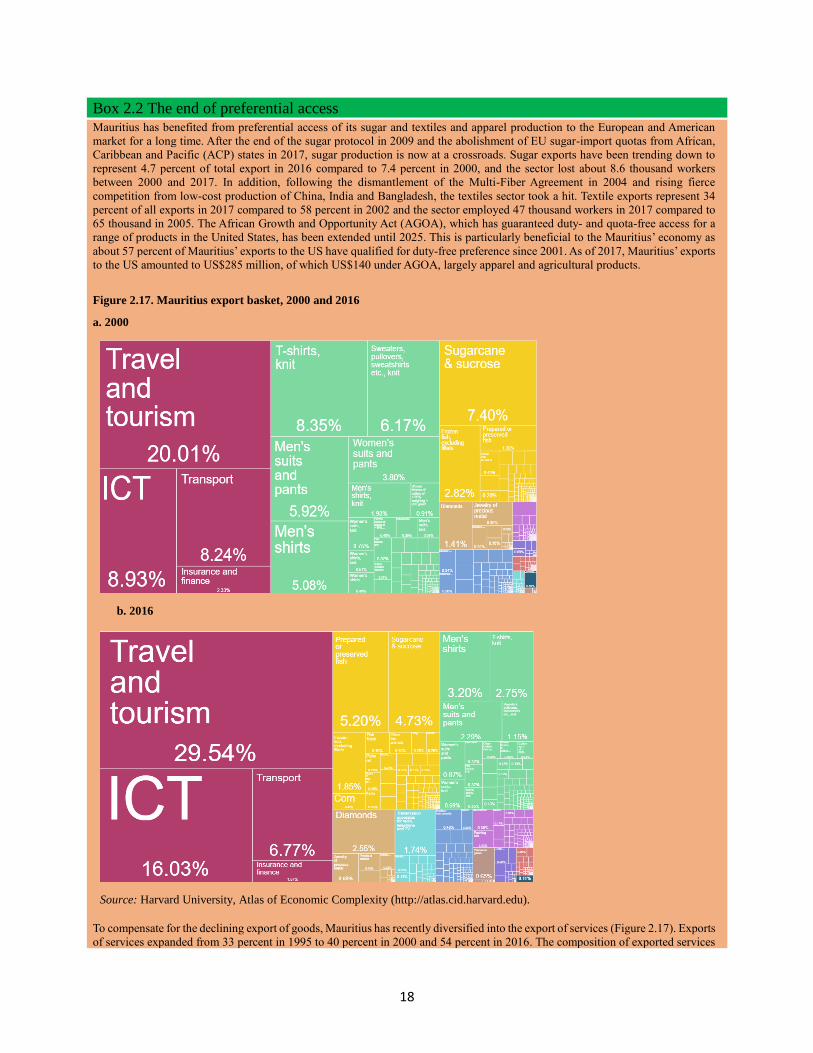
Box 2.2 The end of preferential access Mauritius has benefited from preferential access of its sugar and textiles and apparel production to the European and American
market for a long time. After the end of the sugar protocol in 2009 and the abolishment of EU sugar-import quotas from African,
Caribbean and Pacific (ACP) states in 2017, sugar production is now at a crossroads. Sugar exports have been trending down to
represent 4.7 percent of total export in 2016 compared to 7.4 percent in 2000, and the sector lost about 8.6 thousand workers
between 2000 and 2017. In addition, following the dismantlement of the Multi-Fiber Agreement in 2004 and rising fierce
competition from low-cost production of China, India and Bangladesh, the textiles sector took a hit. Textile exports represent 34
percent of all exports in 2017 compared to 58 percent in 2002 and the sector employed 47 thousand workers in 2017 compared to
65 thousand in 2005. The African Growth and Opportunity Act (AGOA), which has guaranteed duty- and quota-free access for a
range of products in the United States, has been extended until 2025. This is particularly beneficial to the Mauritius’ economy as
about 57 percent of Mauritius’ exports to the US have qualified for duty-free preference since 2001. As of 2017, Mauritius’ exports
to the US amounted to US$285 million, of which US$140 under AGOA, largely apparel and agricultural products.
Figure 2.17. Mauritius export basket, 2000 and 2016
a. 2000
b. 2016
Source: Harvard University, Atlas of Economic Complexity (http://atlas.cid.harvard.edu).
To compensate for the declining export of goods, Mauritius has recently diversified into the export of services (Figure 2.17). Exports
of services expanded from 33 percent in 1995 to 40 percent in 2000 and 54 percent in 2016. The composition of exported services

19
has also changed and is increasingly toward travel and tourism and information and communication technology services, whereas
traditional textile and sugar exports are on the decline and contributed less than 5 and 15 and percent of total exports in 2016,
respectively.
As the shield offered by preferential access will be gradually lifted, Mauritius will have to shift to higher value added exports, to
increase export diversification into close markets, thus taking advantage of its unique position next to the African continent.2
2 According to a study by USAID-COMPETE, “US Apparel End Market Analysis” (2011), Mauritius sells jeans at
US$6.61 compared to China’s US$6.66 but only because China pays 16 percent duty. Without duty, China would land
its jeans at a price 13 percent cheaper than a Mauritian pair of jeans. In addition, Mauritius is disadvantaged in terms
of local transportation costs, and also pays more to ship by sea than Cambodia.

20
3. Labor Productivity: Trends and Patterns The previous section provides a snapshot of the Mauritian nonagricultural private sector that is dominated
by small enterprises (less than 10 workers), whose number has nearly doubled between 2002 and 2013 to
reach 125,000 units, about 98 percent of all businesses, while the number of large ones has remained
roughly constant. Most of small firms are individually owned and those operating in the informal sector
have doubled between 2007 and 2013. While less than 20 percent of total value added is generated by small
firms, they generate over 50 percent of employment. Between 2002 and 2013, most of the jobs were created
by small firms, particularly firms with between 2 and 4 workers (+67,000 workers or 51 percent of the
employment growth). By contrast, large firms increased employment by less than 5 percent, and the largest
among them contributed negatively to employment growth. This is largely the by-product of the
abolishment of the Multi-Fiber Agreement in 2004 and the loss of significant market shares of the export-
oriented textiles sector that shed over 10,000 jobs. Both large and small firms underwent a process of
structural transformation. The value added share of the services sector increased from 59 percent to 71
percent, while the contribution of manufacturing and other secondary sectors decreased to 29 percent. A
similar pattern is observed in terms of employment: the share of services raised from about 1 in 2 employed
to 2 in 3 in 2013. This section describes trends and patterns of labor productivity from 2002 to 2013 with
the objective of identifying best performs along the size and sectoral dimension.
“Productivity is about `working smarter’ rather than `working harder’” (OECD 2016). Total factor
productivity captures firms’ ability to generate more output by combining available inputs more efficiently.
Such process is made possible by new ideas, technological change, process and organizational changes, and
new business models. As argued by Cusolito and Maloney (2018), traditionally productivity has been
measured in terms of revenue TFP, which does not separate out the effect of prices and of quantities
produced, and it is different from physical TFP that is free of price effects and can only be obtained if firm-
level prices are captured. This is important since firm-level prices can drive changes observed in revenue-
based productivity. The price variation can be further decomposed into differences in input prices,
differences in market power, and differences in quality and other factors affecting demand for the product.
The reader is therefore invited to bear in mind that what follows is based on revenue-based productivity
and can potentially confuse increasing market concentration with efficiency gains. In the case of labor
productivity, large gaps across sectors might suggest that it would be possible to achieve efficiency by
reallocating workers to what appears as sectors with higher productivity growth. To the extent that such
differences are attributable to firms’ rents, then the analysis would argue in favor of reallocating labor
toward the more concentrated and distorted sectors of the economy as opposed to the most productive.
This section investigates patterns and trends in labor productivity between 2002 and 2013. Labor
productivity, which is defined in this report as value added per employed, is clearly affected by the use of
the other input, that is, capital. Therefore, changes observed in labor productivity only partially reflects the
productivity of labor in terms of the personal capacities of workers or the intensity of their effort. The ratio
between output and labor input depends to a large degree on the presence of other inputs. However, labor
productivity growth is key to raise living standards and labor productivity growth can be achieved in two
main ways: (i) within economic sectors, through capital accumulation, technological change, or the
improved allocation of resources across plants, and (ii) through labor movements from sectors with lower
productivity to sectors with higher productivity. As economies develop, labor reallocation across sectors,

21
also known as structural transformation, becomes less and less important to raise labor productivity and the
first channel remain the key engine to foster productivity growth.3
Growth of average labor productivity has trended upward between 2002 and 2013. In 2002, labor
productivity of the private nonagricultural sector was about MUR 379,000 (2010 prices) or US$24,145
(2011 purchasing power parity) (Figure 3.1). About 10 years later, in 2013, productivity had grown by 26
percent (or 2.1 percent per year) to reach a level of MUR 478,000 or US$30,465 (2011 purchasing power
parity). Economy-wide average hides substantial differences by establishment’s size, sector, formality
status, and export-orientation that will be discussed in the following.
Figure 3.1. Average labor productivity, 2002-13
Source: Based on data of the Census of Economic Activities, Statistics Mauritius.
Labor productivity in Mauritius is higher than in structural peer countries and still well below its
aspirational peers.4 In 2017, labor productivity in Mauritius is measured at about US$42,000 (2011
purchasing power parity) relative to in peer countries such as Albania, Costa Rica, Bosnia and Herzegovina,
and Montenegro (Figure 3.2, panel b). As an upper-middle-income country, the productivity level in
3 Productivity gaps discussed in this study refer to average productivity. However, it is marginal productivity gaps that
matter and that are expected to decrease as economies develop. Marginal labor productivity equals average
productivity multiplied by the share of labor input under the assumption of a Cobb-Douglas production function.
Therefore, comparisons of average labor productivity are meaningful only in the absence of large differences in labor
shares across sectors. 4 For structural peers, countries were initially selected based on similarity in terms of level of economic development
as measured by current level of per capita gross national income. At a second stage the following additional criteria
were applied: similar economic per capita annual growth over the last decade, similar population size, similar
economic structure (composition of value added by broad sector), similar degree of openness (exports as a share of
GDP), similar dependence on natural resources (as a share of GDP). For aspiration peers, the selection was carried
out among currently high-income economies based on a similar population size (compared to the threshold used for
structural peers, the upper limit has been further relaxed from 5 to 7,5 million), economic structure (agriculture
contributing less than 5 percent to value added and services making up over 65 percent), and degree of dependence
on natural resources less than 2 percent of GDP). Finally, based on Systematic Country Diagnostic (World Bank
20015), Denmark was replaced by Iceland.

22
Mauritius is well below that of its aspirational peers, that is, high-income economies, including Cyprus;
Hong Kong SAR, China; Iceland; and Singapore (Figure 3.2, panel a). At 4.3 percent per year over the last
decade, the growth rate of labor productivity in Mauritius has been on par with the average growth rate
recorded in peer economies and between 1 and 2 percentage points higher than in aspirational peers.
Figure 3.2. Labor productivity levels and growth rates in Mauritius and peer countries
a. Labor productivity, circa 2017 b. Labor productivity growth, circa 2007-17
Source: Based on data of World Development Indicators, World Bank.
Although the gap is declining, small firms are still three times less productive than large firms. In
2013, the average labor productivity of small firms was MUR 263,000 compared with MUR 759,000 of
large firms (Figure 3.3, panel a). In other words, the average output per worker employed in small firms is
about 3 times smaller than the average output per worker employed in a large firm. Between 2002 and 2013,
productivity increased both among small and large firms. However, the growth rate was substantially higher
among small firms: 5.4 percent per year among small firms compared with 2.9 percent per year among
large firms. Firms with 5 to 9 workers posted the largest increase in productivity, followed by self-employed
and firms with 2 to 4 workers that started from a low base (Figure 3.4). This means that small firms have
reduced the productivity gap with large firms from 3.8 times in 2002 to 2.9 times in 2013. Self-employed
and microfirms (2 to 4 workers) have similar productivity levels, whereas small firms (5 to 9 workers) are
1.7 times more productive compared with microfirms, and medium-sized firms (10 to 19 workers) are 2
times more productive compared with small ones (Figure 3.3, panel b). Firms employing between 20 and
49 workers have been consistently the most productive since 2007.

23
Figure 3.3. Average labor productivity by establishment size, 2002-13
a. Small and large establishments b. By establishment size
Source: Based on data of the Census of Economic Activities, Statistics Mauritius.
Figure 3.4. Labor Productivity Annual Growth Rate, 2002-13
Source: Based on data of the Census of Economic Activities, Statistics Mauritius.
Differences in labor productivity translates into different living standards. Conditional on workers’
educational level, employees working in small firms get paid less compared with their counterparts in large
firms. For example, in 2013 a wage worker with complete primary education makes about MUR 6,500 per
month in a small firm relative to almost MUR 11,000 per month in a large firm (Figure 3.5). Similar
differences hold for workers with different educational attainment. This gap is confirmed by estimates of
wage equations that control for a large set of individual and firms’ characteristics. Between 2005 and 2015,
workers employed in firm with 10 or more employees are paid on average 21 percent more per hour worked

24
relative to similar workers employed in firms with less than 5.5 In addition, self-employed earn less than
wage workers and employers, that is, individuals who manage a small business and employ at least one
wage workers, at any level of education (Figure 3.6, panel a). The differences are amplified in the case of
informal self-employed. In other words, they could be better off if they could find a dependent job.
However, the educational levels of wage workers and employers are typically higher compared with those
of self-employed. For example, in 2013 about 62 percent of wage workers and 56 percent of employers
have upper secondary or higher education relative to only 39 percent of self-employed. This suggests that
self-employment is more a last resort option for many individuals that do not have the skills demanded by
employers in the labor market. Finally, as labor income is the main source of income for most households
in Mauritius (World Bank 2017), lower earnings translate into lower living standards as captured by
household consumption levels. Self-employed are overrepresented in the lowest consumption deciles:
almost 50 percent of self-employed belong to the bottom 40 percent of the consumption distribution as
opposed to 32 percent of wage workers and 18 percent of employers (Figure 3.6, panel b).
Figure 3.5. Median monthly wages by educational level and size of establishment, 2013
Source: Based on data of the Continuous Multipurpose Household Survey, Statistics Mauritius.
Note: Monthly wages are expressed in 2017 prices.
5 Regression analysis controls for age, gender, educational level, cohorts of birth, location, tenure, occupational level,
sector of employment (public/private), industrial sector and size of establishment.
-
2,000
4,000
6,000
8,000
10,000
12,000
14,000
16,000
18,000
20,000
small large
MU
R
No education/pre-primary Complete Primary Secondary/Tertiary

25
Figure 3.6. Monthly earnings by employment category and employment types by consumption decile, 2013
a. Average monthly earnings by employment category b. Household consumption distribution
Source: Based on data of the Continuous Multipurpose Household Survey, Statistics Mauritius.
Note: Monetary values are expressed in 2017 prices.
Informal firms constitute a drag on productivity growth of the entire small firm sector. The number
of informal firms almost doubled between 2007 and 2013, however their contribution to value added
remains negligible at about 3.5 percent, and the total number of jobs in the informal sector stands at about
10.5 percent of the total (Box 2.1). The humongous increase in the number of informal firms generated an
increase in their value added and employment that outpaced the growth among formal firms. Yet,
productivity levels remain low compared with formal firms. In 2007, labor productivity in formal firms was
about MUR 235,600, that is, 67 percent higher compared with the average productivity of informal firms
(MUR 140,800) (Figure 3.7, panel a). The productivity gap has increased over time due to a more rapid
productivity growth among formal firms (21.5 percent versus 14 percent between 2007 and 2013).
Precisely, informal self-employed performed slightly better than their formal counterparts, whereas
informal microfirms were on par with formal ones. This means it was the group of informal firms with 5 to
9 workers that determined the overall underperformance of the informal sector as they experienced a decline
in productivity by 40 percent between 2007 and 2013 (Figure 3.7, panel b).
As opposed to what is observed in the formal sector, average labor productivity of informal firms
declines with firms’ size. The productivity of formal firms increases monotonically with the number of
workers. Self-employed have an average productivity level of MUR 228,000 in 2013, which compares with
MUR 240,000 among microfirms and MUR 391,000 among small firms (Figure 3.7, panel b). By contrast,
informal enterprises are more productive the smaller they are. In 2013, informal self-employed have a
productivity level of MUR 181,000, which is 1.1 and 2.4 times higher than the productivity level of informal
micro and small firms, respectively (Figure 3.7, panel b).
-
5,000
10,000
15,000
20,000
25,000
30,000
35,000
MU
R
Wage worker Employer Self-employed
0.0
5.0
10.0
15.0
20.0
25.0
Poorest 2 3 4 5 6 7 8 9 Richest
Per
cen
t
Deciles of household consumption
Wage worker Employer Self-employed

26
Figure 3.7. Labor productivity by formality status and size – small establishments, 2007 and 2013
a. By formality status b. By formality status and size of establishment
Source: Based on data of the Census of Economic Activities, Statistics Mauritius.
Firms operating in services, particularly financial and insurance services, are the most productive
regardless of their size. Average productivity levels differ considerably across sectors. For example, in
2013 small firms in manufacturing had an average productivity per worker of about MUR 234,000, and
those operating in trade an average of MUR 226,000 (Figure 3.8, panel a). This compares with productivity
levels almost three times higher among small firms providing financial and insurance services as well as
professional services. The sectoral gap is even larger among large firms: the average financial/insurance
large firm had a productivity level of MUR 2.9 million in 2013, which is 5 times higher than the average
productivity level of a large firm operating in manufacturing or trade (Figure 3.8, panel b). Controlling for
differences in firms’ characteristics, differences in sectoral productivity are confirmed (Figure 3.9).6 Taking
as a reference the textiles sector, small firms operating in any other sector, except for food manufacturing
are between 18 percent and 200 percent more productive (Figure 3.9, panel a). Similarly, among large firms,
differences in average productivity are considerable and are as high as 600 percent in the case of firms
operating in financial and insurance services relative to large firms operating in the textiles sector (Figure
3.9, panel b).
6 Differences in estimated productivity levels across sectors might be the result of differences in input price variations
or quality of outputs as well as output prices attributable to mark-ups associated with market power in certain sectors.

27
Figure 3.8. Labor productivity by establishments size and sector, 2013
a. Small establishments
b. Large establishments
Source: Based on data of the Census of Economic Activities, Statistics Mauritius.
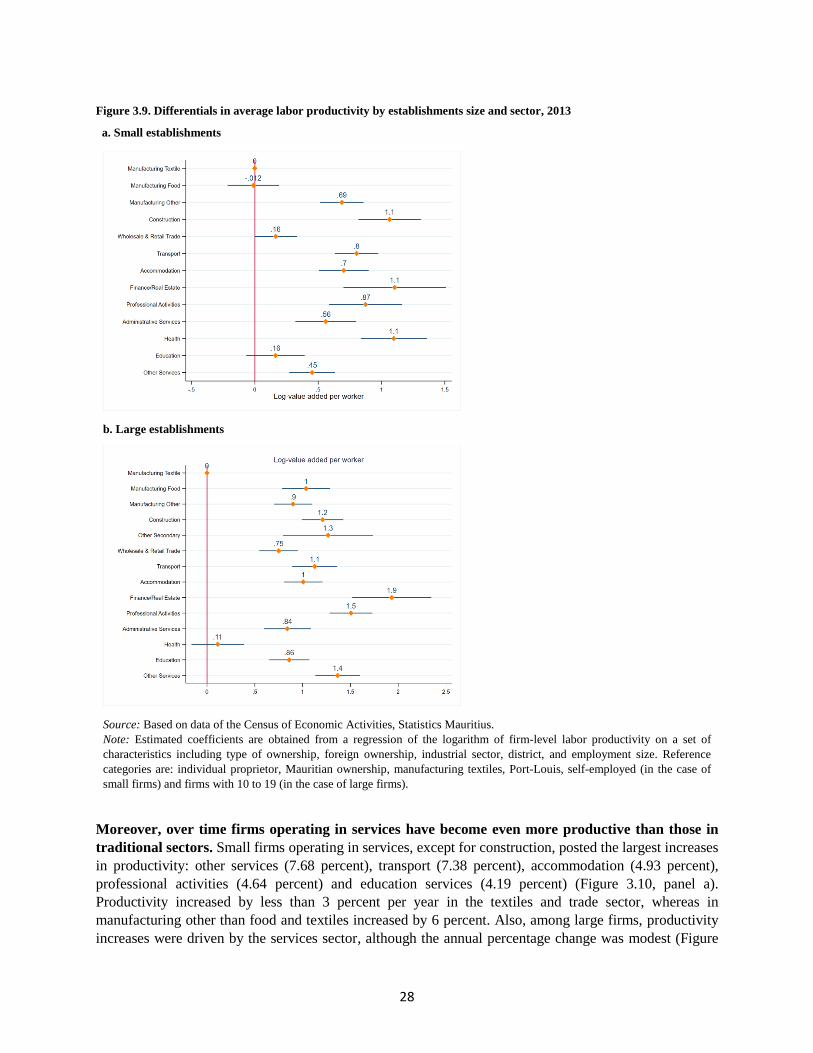
28
Figure 3.9. Differentials in average labor productivity by establishments size and sector, 2013
a. Small establishments
b. Large establishments
Source: Based on data of the Census of Economic Activities, Statistics Mauritius.
Note: Estimated coefficients are obtained from a regression of the logarithm of firm-level labor productivity on a set of
characteristics including type of ownership, foreign ownership, industrial sector, district, and employment size. Reference
categories are: individual proprietor, Mauritian ownership, manufacturing textiles, Port-Louis, self-employed (in the case of
small firms) and firms with 10 to 19 (in the case of large firms).
Moreover, over time firms operating in services have become even more productive than those in
traditional sectors. Small firms operating in services, except for construction, posted the largest increases
in productivity: other services (7.68 percent), transport (7.38 percent), accommodation (4.93 percent),
professional activities (4.64 percent) and education services (4.19 percent) (Figure 3.10, panel a).
Productivity increased by less than 3 percent per year in the textiles and trade sector, whereas in
manufacturing other than food and textiles increased by 6 percent. Also, among large firms, productivity
increases were driven by the services sector, although the annual percentage change was modest (Figure

29
3.10, panel b). The health sector posted the highest annual growth rate of 5.39 percent, followed by transport
(3.59 percent), other services (3.12 percent), education (2.48 percent), and textiles (2.14 percent). The
productivity increased by less than 2 percent in finance and real estate, administrative services, food and
other manufacturing. By contrast, it declined modestly in the accommodation sector (-0.24% percent) and
considerably in trade (-3.54 percent).
Figure 3.10. Annualized growth in labor productivity by establishments size and sector, 2002-13
a. Small establishments
b. Large establishments
Source: Based on data of the Census of Economic Activities, Statistics Mauritius.
Employment has increased faster in sectors with the largest productivity gains. As described above,
between 2002 and 2013 small firms posted considerable productivity gains across the board, with the
exception of those operating in manufacturing of food products, providing administrative and financial
services, and operating in real estate (Figure 3.11, panel a).7 However, these sectors make up a small share
7 Figure 3.11 allows to easily identify sectors characterized by a decline in productivity through the 45-degrees line:
bubbles lying above the line indicate sectors with an increase in average productivity attributable to the fact that the
growth (or the decline) in value added is larger (smaller) than the growth (decline) in employment.

30
of total employment among small firms. Large firms, by contrast, have recorded much smaller increases in
productivity and even a decline in employment, particularly in the textiles sector (Figure 3.11, panel b).
Among both small and large firms, between 2002 and 2013 labor productivity has increased faster in sectors
where employment has also grown more rapidly. This is the case of transports, professional activities,
accommodation, and other services among small firms. And it is the case of health services, real estate,
financial and administrative services among large firms. Finally, as discussed earlier, manufacturing,
particularly textiles, has gone through a substantial adjustment along the extensive (closure of a large
number of establishments) and intensive margin (reduction in employment) associated with the
dismantlement of the Multi-Fiber Agreement in 2004 and increasing competition from low-cost production
in economies such as China, India and Bangladesh. The growth in productivity observed therein is
attributable to a larger decline in employment relative to value added associated with the restructuring of
the sector.
Figure 3.11. Annual changes in value added and employment by establishment size and sector, 2002-13
a. Small establishments
b. Large establishments

31
Source: Based on data of the Census of Economic Activities, Statistics Mauritius.
Note: The size of bubble reflects the employment size of each sector in 2013. Sectors located above the 45-degree line experience
an increase in labor productivity, those below the diagonal post a decline in productivity.
The bottom 40 percent of the employed population is largely employed in traditional sectors.
Individuals belonging to households in the bottom 40 percent of the income distribution are mainly
employed in traditional sectors such as agriculture, manufacturing, construction, trade, transports and
tourism. In 2007, over 8 in 10 workers in the bottom 40 percent are employed in these sectors as opposed
to 4 in 10 workers in the top 10 percent (Figure 3.12, panel a). Particularly striking is the gap in the share
of workers employed in services such as financial, real estate, professional and administrative activities as
well as in the public administration at the bottom and at the top of the distribution of household income. In
2007 about 5 percent of workers in the poorest decile were employed in one of these sectors compared with
over 38 percent of workers belonging to the richest decile. Even larger is the gap in the case of the public
administration: 1 percent among the poorest decile and 14 percent at the top. In 2013, the gap has declined
modestly: workers in the bottom decile are still about 5 times less likely than those at the top to work in
financial, real estate, professional and administrative activities (Figure 3.12, panel b).

32
Figure 3.12. Sectoral distribution of employment by decile of per adult equivalent household income, 2007-13
a. 2007
b. 2013
Source: Based on data of the Continuous MultiPurpose Household Survey, Statistics Mauritius.

33
Jobs in high-productivity sectors requires high educational attainment. Jobs in agriculture and
traditional sectors require lower educational attainment compared with jobs in the services sector. In 2007,
between 30 and 50 percent of workers in manufacturing, construction, trade, transports and accommodation
had up to complete primary education, between 50 and 60 percent had either lower or upper secondary and
only between 3 and 10 percent had postsecondary or tertiary education (Figure 3.13, panel a). The opposite
is observed among workers employed in services such as finance and real estate, professional and
administrative activities, health and education. About 50 percent of workers in finance and real estate,
professional activities and education services had postsecondary or higher education in 2007. In 2013, also
thanks to a general improvement of educational attainment across the population, the services sector
employed even a larger share of high-educated individuals. For example, in finance and real estate and
professional services 61 and 67 percent of workers held a postsecondary education or a university degree
(Figure 3.13, panel b).
Figure 3.13. Distribution of educational attainment by sector of employment, 2007-13
a. 2007
b. 2013

34
Source: Based on data of the Continuous MultiPurpose Household Survey, Statistics Mauritius.
Workers from low-income households do not own the educational levels demanded to have access to
high-productivity sectors. Working in the services sector, where productivity is higher and both
productivity and employment have grown faster requires secondary or tertiary education. This is an
important constraint to the likelihood of rapidly improving earnings and living standards of the bottom 40
percent since workers from low-income households do not hold the adequate educational requirements to
get access to these sectors. In 2007, almost 7 in 10 workers from household in the bottom 40 percent of the
household income distribution had some primary or complete primary education, while the remaining 30
percent had secondary education (Figure 3.14, panel a). The educational gradient changes gradually moving
along the income distribution. Workers from households that belong to the middle of the income
distribution are more likely to have secondary education (about 51 percent) relative to some primary
education (47 percent). High-income households instead are more likely to have workers with
postsecondary or tertiary education: about 47 percent of them as opposed to less than 6 percent with up to
complete primary education. Despite an overall improvement in the educational levels of the population, in
2013 the educational gap between households at the bottom and top of the distribution was still
considerable. The share of workers from households in the lowest decile with postsecondary or tertiary
education increased from 0.2 to 4.3 percent (Figure 3.14, panel b). In parallel, the percentage of workers
from the top decile with the same educational attainment increased from 47 to 69 percent. However, the
ratio of workers with high educational attainment from the richest and the poorest households, according
to the distribution of household income, reduced considerably to about 16 times from over 200 times 5
years earlier.

35
Figure 3.14. Distribution of educational attainment by decile of per adult equivalent household income, 2007-13
a. 2007
b. 2013
Source: Based on data of the Continuous MultiPurpose Household Survey, Statistics Mauritius.

36
4. Constraints to Productivity Growth Section 3 has characterized trends and patterns of labor productivity. Despite considerable progress due to
a more rapid growth in output per worker, small firms are still substantially less productive than large firms.
In addition, the expansion of the informal sector constitutes a drag on productivity growth as their
productivity levels remain low compared with formal firms and the distance has widened over time.
Productivity levels are higher among small and large firms providing financial and insurance services as
well as professional services compared with firms in manufacturing and trade. Moreover, employment has
increased faster in the services sector, where productivity gains were the largest. This is the case of
transports, professional activities, accommodation, and other services among small firms. And it is the case
of health services, real estate, financial and administrative services among large firms. This means that
services sector firms manage to use their inputs more efficiently and translate higher employment in higher
output per worker.
This section looks at factors that are considered constraints to productivity growth and compares
Mauritius to a set of comparator countries. The objective is to identify among the areas that matter for
productivity growth those that represent challenges in Mauritius compared to a set of aspirational peer
countries. In addition, the last part of the section looks at the strategy designed by the government of
Mauritius to foster the growth of small and medium enterprises (SMEs) to achieve the objectives of Vision
2030: “maintaining the pace of progress so that Mauritius can join the league of high-income countries by
2023 with a per capita gross national income of US$13,550 and to firmly anchor Mauritius on a rising
income path to a gross national income of some US$19,000 by 2030.” The definition of SMEs adopted by
the government is different from the one adopted by Statistics Mauritius and used in the previous sections.
In particular, the adoption of a rather high turnover threshold (MUR 50 million per year) as opposed to an
employment size one (10 employees) implies that a good part of establishments that are classified as large
by Statistics Mauritius are actually considered part of the SME sector by the government of Mauritius. In
other words, in addition to small establishments a sizable share of establishments with up 100 employees
are part of the SME sector that is at the center of the government strategy for the future of Mauritius (Table
4.1).
Table 4.1. Distribution of establishments by employment size and turnover categories, 2013
Source: Based on data of the Census of Economic Activities, Statistics Mauritius.
Innovation has the largest impact on TFP. Total factor productivity is the residual share of output that
cannot be explained by other inputs used in the production process. It is a measure of the overall efficiency
level of firms in the combined use of labor and capital inputs to produce goods and services. A recent study

37
(Loyaza and Kim 2017) shows that, among the determinants of TFP growth, innovation is the most
important factor followed by quantity and quality of physical infrastructure, education level of the
workforce, market efficiency, and quality of the institutional framework (Box 4.1).
Box 4.1 Determinants of TFP Loyaza and Kim (2017) conduct a literature review to identify the factors that have been studied as determinants of TFP. Based on
their literature review, determinants of productivity are categorized into five components: innovation, education, market efficiency,
physical infrastructure, and institutional infrastructure. From Loyaza and Kim (2017):
“Innovation: Creating new technologies leads to the development of high value added activities and improves the performance of
existing economic activities. Historically, a small number of countries have created new technologies, while many other countries
have adopted the new technologies through adaptation, trade, and foreign direct investment (Coe, Helpman, and Hoffmaister 1997;
de Mello 1999).
Education: Advancing knowledge and skills, with strong basic foundation and sufficient specialization, is necessary for adopting,
attaining, and spreading new and better technologies, production processes, and outputs (Benhabib and Spiegel 1994; Erosa,
Koreshkova, and Restuccia 2010).
Physical infrastructure: Transport, paved roads, telecommunication, stable electricity supply, access to improved water and
sanitation, and other tangible infrastructure provide timely and cost-effective access to markets, and good physical environments
for overall economic activities (Straub 2008; Galiani, Gertler, and Schargrodsky 2005).
Institutional infrastructure: High-quality institutions provide friendly environments and policies that lead to economic
development. Governance and economic institutions are important components of institutions and their quality is generally
associated with productivity (Hall and Jones 1999; Easterly and Levine 2003; Acemoglu, Johnson, and Robinson 2004; Rodrik,
Subramanian, and Trebbi 2004).”
Market efficiency: Timely and effective allocation of human and physical capital enhances overall productivity, as inefficient firms
exit markets, efficient firms grow, and new firms emerge (Hsieh and Klenow 2009). The nature and quality of regulations are often
related to efficiency. Rigid regulations reduce flexibility in resource allocation in markets and decrease productivity (Nicoletti and
Scarpetta 2003).
Mauritius ranks higher than all structural peers in the Global Competitiveness Index. The Global
Competitiveness Index published yearly by the World Economic Forum is the average of 12 pillars and
provides a comparative overview of the economic and business potential of 138 countries.8 This index
allows for an overview of competitiveness in individual sectors and the economy as a whole. In 2017
Mauritius ranks 45 and gained 9 positions since 2012 (when it ranked 54) (Figure 4.1). Mauritius belongs
to the top 30 percent of countries and is leading compared with south African economies that ranked 61 in
2017 (Figure 4.2). The best performing structural peer is Costa Rica that ranks 47th, while Bosnia and
Herzegovina ranks 103. Most of the aspirational peers perform considerably better and only Cyprus’ rank
is lower than Mauritius.
8 The pillars of competitiveness are the following: Institutions, Infrastructure, Macroeconomic environment, Health
and primary education, Higher education and training, Goods market efficiency, Labor market efficiency, Financial
market development, Technological readiness, Market size, Business sophistication, Innovation.

38
Figure 4.1. Competitiveness Gaps within and across Regions, 2017
Source: Schwab 2018.
Figure 4.2. Global Competitiveness Index Rankings, Mauritius and Peers, 2017
Source: Based on data from Schwab 2018.
Innovation and Skills
Mauritius performs poorly in innovation relative to the peers. Innovation is of paramount importance
for countries as they move from middle to high-income status and they approach the frontiers of knowledge.
At this stage of development, the benefits of generating more value added by imitation and adaptation of
existing technologies tends to disappear. In countries aspiring to move up along the income distribution,
firms in collaboration with the academic world and other public and private partners should develop new
technologies and move to high value added production. This requires an environment conducive to
innovation, investments in research and development, particularly by the private sector, high-quality
research institutions that generate basic knowledge, collaboration between universities and private sector,
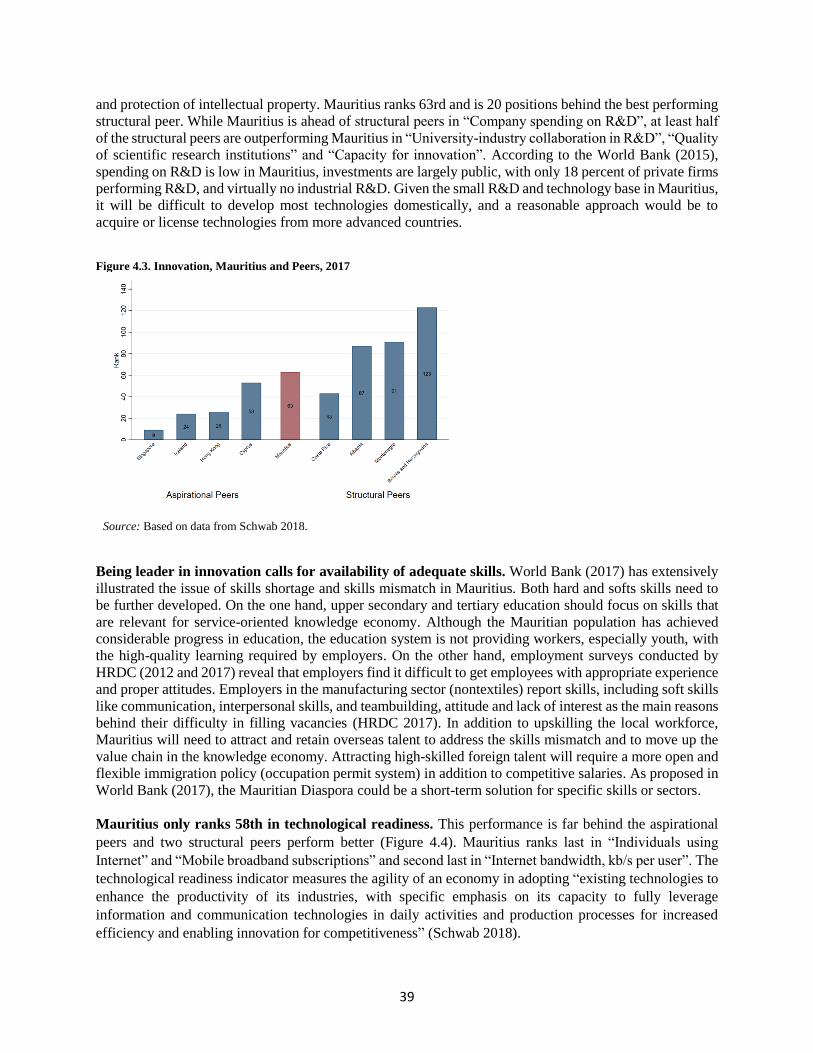
39
and protection of intellectual property. Mauritius ranks 63rd and is 20 positions behind the best performing
structural peer. While Mauritius is ahead of structural peers in “Company spending on R&D”, at least half
of the structural peers are outperforming Mauritius in “University-industry collaboration in R&D”, “Quality
of scientific research institutions” and “Capacity for innovation”. According to the World Bank (2015),
spending on R&D is low in Mauritius, investments are largely public, with only 18 percent of private firms
performing R&D, and virtually no industrial R&D. Given the small R&D and technology base in Mauritius,
it will be difficult to develop most technologies domestically, and a reasonable approach would be to
acquire or license technologies from more advanced countries.
Figure 4.3. Innovation, Mauritius and Peers, 2017
Source: Based on data from Schwab 2018.
Being leader in innovation calls for availability of adequate skills. World Bank (2017) has extensively
illustrated the issue of skills shortage and skills mismatch in Mauritius. Both hard and softs skills need to
be further developed. On the one hand, upper secondary and tertiary education should focus on skills that
are relevant for service-oriented knowledge economy. Although the Mauritian population has achieved
considerable progress in education, the education system is not providing workers, especially youth, with
the high-quality learning required by employers. On the other hand, employment surveys conducted by
HRDC (2012 and 2017) reveal that employers find it difficult to get employees with appropriate experience
and proper attitudes. Employers in the manufacturing sector (nontextiles) report skills, including soft skills
like communication, interpersonal skills, and teambuilding, attitude and lack of interest as the main reasons
behind their difficulty in filling vacancies (HRDC 2017). In addition to upskilling the local workforce,
Mauritius will need to attract and retain overseas talent to address the skills mismatch and to move up the
value chain in the knowledge economy. Attracting high-skilled foreign talent will require a more open and
flexible immigration policy (occupation permit system) in addition to competitive salaries. As proposed in
World Bank (2017), the Mauritian Diaspora could be a short-term solution for specific skills or sectors.
Mauritius only ranks 58th in technological readiness. This performance is far behind the aspirational
peers and two structural peers perform better (Figure 4.4). Mauritius ranks last in “Individuals using
Internet” and “Mobile broadband subscriptions” and second last in “Internet bandwidth, kb/s per user”. The
technological readiness indicator measures the agility of an economy in adopting “existing technologies to
enhance the productivity of its industries, with specific emphasis on its capacity to fully leverage
information and communication technologies in daily activities and production processes for increased
efficiency and enabling innovation for competitiveness” (Schwab 2018).

40
Figure 4.4. Technological Readiness, Mauritius and Peers, 2017
Source: Based on data from Schwab 2018.
Physical and Intangible Infrastructures
Physical and intangible infrastructures are key drivers of productivity and economic growth. Physical
infrastructures comprise all the physical structures that allow enterprises to stock up inputs and to provide
their goods and services to consumers and includes transportation, telecommunications, and energy-supply
systems. Intangible infrastructures refer to the quality of public institutions and the stability of the
macroeconomic environment. Infrastructures can affect productivity and economic growth through two
channels (World Bank 2018). First, infrastructure investment contributes directly to physical capital
formation, and the output of public capital is a component of GDP. Second, infrastructures can contribute
to TFP growth as they reduce unit costs of production and transportation. The following types of
infrastructure are discussed in the chapter: transport; logistics; telecommunications; electricity and water;
institutional.
Mauritius is outperforming structural peers in physical infrastructure and institutional quality. The
physical infrastructure pillar summarizes the quality of roads, rails, ports, air transport, and electricity
supply. Mauritius ranks 40th behind Singapore; Hong Kong SAR, China; and Iceland and is leading the
group of structural peers (Figure 4.5). The institutional pillar describes quality of the legal and
administrative framework in which firms, individuals and the government interact. In more detail, the pillar
summarizes the efficiency and transparency of the public administration, protection of property rights, the
independence of the judiciary, irregular payments and bribes, security, and corporate governance. Mauritius
ranks 37th in institutional quality and performs better than all structural peers with Costa Rica being the
second highest (48) and Bosnia and Herzegovina being the last (126). Among the aspirational peers,
Singapore; Hong Kong SAR, China; and Iceland are substantially higher up in the international ranking
relative to Mauritius.
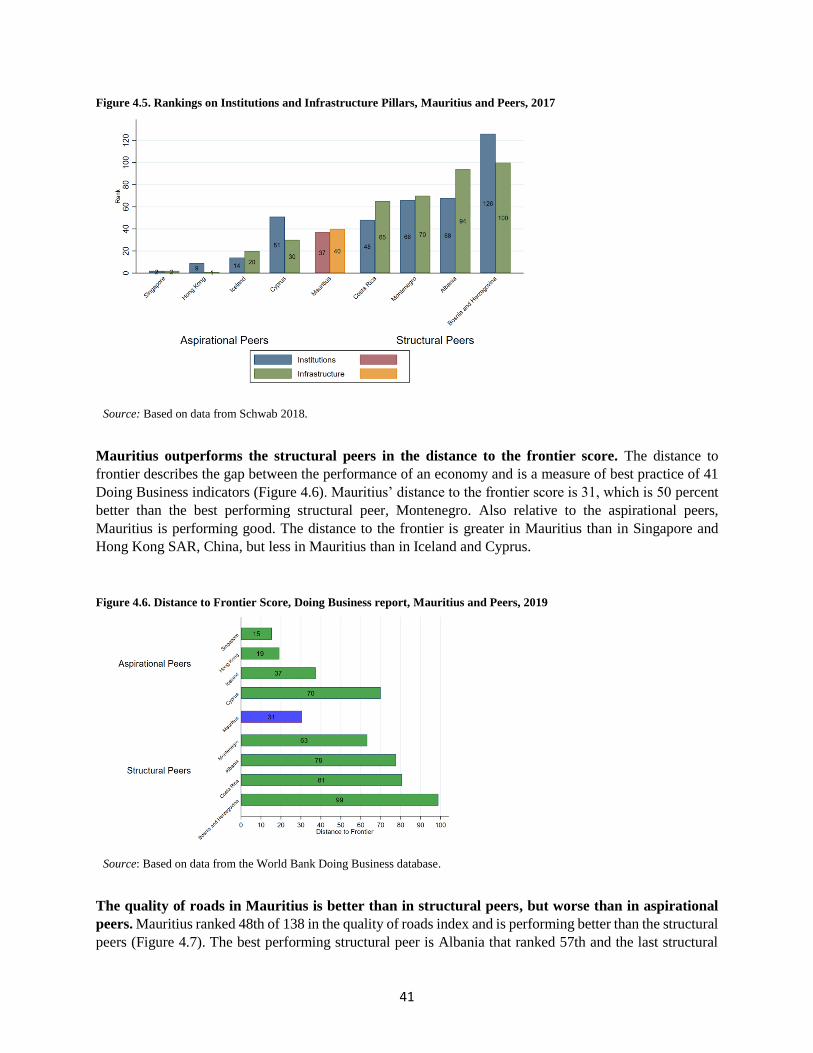
41
Figure 4.5. Rankings on Institutions and Infrastructure Pillars, Mauritius and Peers, 2017
Source: Based on data from Schwab 2018.
Mauritius outperforms the structural peers in the distance to the frontier score. The distance to
frontier describes the gap between the performance of an economy and is a measure of best practice of 41
Doing Business indicators (Figure 4.6). Mauritius’ distance to the frontier score is 31, which is 50 percent
better than the best performing structural peer, Montenegro. Also relative to the aspirational peers,
Mauritius is performing good. The distance to the frontier is greater in Mauritius than in Singapore and
Hong Kong SAR, China, but less in Mauritius than in Iceland and Cyprus.
Figure 4.6. Distance to Frontier Score, Doing Business report, Mauritius and Peers, 2019
Source: Based on data from the World Bank Doing Business database.
The quality of roads in Mauritius is better than in structural peers, but worse than in aspirational
peers. Mauritius ranked 48th of 138 in the quality of roads index and is performing better than the structural
peers (Figure 4.7). The best performing structural peer is Albania that ranked 57th and the last structural

42
peer is Costa Rica that ranked 123. However, Mauritius ranks last compared to the aspirational peers. It is
worth mentioning that the government of Mauritius have started important road decongestion projects,
namely Metro Express, Jumbo-Phoenix Roundabouts, and A1-M1 Bridge (Vision 2030, Three-year
Strategic Plan 2017). In addition, the Bus Modernization Scheme has been enhanced to allow bus operators
to replace their existing bus fleet with eco-friendly buses. Between 2018/19 and 2020/21, investment plans
in public infrastructures amount to MUR 26.6 billion for road and land transportation, in addition to MUR
11.0 billion for port and airport (Vision 2030, Three-year Strategic Plan 2017).
Figure 4.7. Globally Competitive Industries Quality of Roads Index, Mauritius and Peers, 2017
Source: Based on data from Schwab 2018.
The quality of Mauritius’ ports is low relative to its aspirational peers. Ports and airports are key
elements of logistics infrastructure of all countries, and particularly of island states like Mauritius. The
massive increase in the value of international trade (65 percent between 2005 and 2017) is logistically
handled by the port rather than the airport (Figure 4.8). Post financial crisis, the number of shipped
containers increased by 57 percent from 325,600 in 2011 to 511,000 in 2017. While air freight volume
fluctuated but remained relatively constant between 2007 and 2017 (posting a 10 percent increase from
178,132 in 2011 to 196,047 in 2017).9 In terms of quality of ports, Mauritius only ranks 65th globally (Figure
4.9). The best performing structural peer is Albania that ranked 67th, while Bosnia and Herzegovina is last
(129). The quality of ports in aspirational countries is much higher, and even the worst performing peer,
Cyprus, ranks 19 positions higher. Iceland, Honk Kong, and Singapore rank 57, 62 and 63 positions higher.
Port Louis is the sole maritime gateway of the country, handling 99 percent of the total volume of external
trade and contributing 2 percent to GDP. There has been progress recently. The Mauritius Container
Terminal berths have been extended to 800 meters and strengthened to establish Port-Louis as a full-fledged
container transshipment hub in the region. The navigational channel has been dredged to 16.5 meters,
making Port Louis the deepest port in the region capable of accommodating the largest mother vessels of
12,000 Twenty-foot Equivalent Units (TEU). The capacity of the Mauritius Container Terminal has been
increased to 750,000 TEU (from 550,000 TEU) allowing Port Louis to handle more transshipment traffic.
Total cargo traffic has increased by 3 percent to reach 7.5 million tons in June 2018. The total number of
vessels that took bunker at Port-Louis increased by almost 12 percent to reach 2,011 in 2017. The
9 Air freight captures freight, express, and diplomatic bags carried on each flight stage measured in metric tons times
kilometers traveled.

43
government plans to increase container terminal capacity to 1 million TEU by 2020 and to 2,5 million TEU
by 2030 with the coming into operation of the Island Container Terminal.
Figure 4.8. International Trade Statistics, 2005-2017
Source: Based on data from Statistics Mauritius.
Figure 4.9. Quality of Ports Index, Mauritius and Peers, 2017
Source: Schwab 2018.
The quality of Mauritius’ air transport infrastructure is relatively high. In 2017, the quality of
Mauritius’ airport was ranked 50th (Figure 4.10). The structural peers perform not as good with Costa Rica
ranking 64th, Montenegro 72th, Albania 83th, and Bosnia and Herzegovina 129th. However, the distance
to the aspirational peers is sizable. Cyprus is 23 positions better; Iceland 43; Hong Kong SAR, China 48;
and Singapore 49.

44
Figure 4.10. Air Transport Infrastructure Index, Mauritius and Peers, 2017
Source: Based on data from Schwab 2018.
The quality of electricity in Mauritius is among the top 40 percent countries worldwide. The quality
of the electrical grid is of crucial importance for the development of an economy. An insufficient provision
with electricity limits the quality of social services and public safety and hinders human resource
development. Moreover, the economic production, growth and commerce can be seriously constrained
insufficient provision with electricity. In 2017, the quality of electricity in Mauritius ranked 52th out of 138
(Figure 4.11). Only Costa Rica is the structural peer that performs better (37th), while Bosnia and
Herzegovina ranks 74th, Albania 81th, and Montenegro 83rd. The quality of electricity in aspirational peers
is significantly higher than in Mauritius. Three of them belong to the top 11 worldwide and Cyprus is on
rank 45.
Figure 4.11. Quality of Electricity, Mauritius and Peers, 2017
Source: Based on data from Schwab 2018.
The number of fixed broadband internet subscriptions per 100 people is high in Mauritius. The
internet penetration connection is an essential fundament for economic growth via Import, Export and
Foreign Direct Investment. Freund and Weinhold (2002) find that a 10 percent increase in Internet

45
penetration in a foreign country is associated with a 1.7 percent increase in exports and a 1.1 percent
increase in imports The number of fixed broadband subscriptions in Mauritius has decreased over time but
is still relatively high compared to peer countries (Figure 4.12). The structural peers Montenegro (49) and
Bosnia and Herzegovina (50) perform slightly better than Mauritius (52), followed by Costa Rica (65) and
Albania (78).
Figure 4.12. Fixed Broadband Internet Subscriptions per 100 people, Mauritius and Peers, 2017
Source: Based on data from Schwab 2018.
Mauritius’ institutional framework is superior compared to structural peers but must catch up with
the level of aspirational peers. Enterprises costs can be separated into transformation costs (production)
and transaction costs (measuring and enforcing contracts). Improving institutional foundations, like rule of
law, lowers the transaction costs and consequently increases productivity. Mauritius’ strong rankings in all
governance indicators testify for a good quality of the institutional framework (Figure 4.13). Mauritius is
ahead of structural peers in virtually all governance indicators, and particularly in political stability and
absence, government effectiveness and rule of law. However, Mauritius is behind aspirational peers in
virtually all indicators. The gap is especially sizable in control of corruption followed by rule of law and
government effectiveness. Control of corruption describes the perception of the extent to which public
power is exploited for private gain and the extent to which the public power is controlled by private
interests. The rule of law indicator captures the perception of the extent to which agents have confidence in
and abide by the rules of society like contract enforcement, property rights, police and court. The perception
of government effectiveness captures perceptions of the quality of public services, the quality of the civil
service and the degree of its independence from political pressures, the quality of policy formulation and
implementation, and the credibility of the government's commitment to such policies. The indicator is ranks
Mauritius 78th on par with Cyprus and behind the other aspirational peers by only around 10 ranks.

46
Figure 4.13. World Governance Indicator Rankings, Mauritius and Peers, 2017
a. Control of corruption, government effectiveness, regulatory quality
b. Political stability, rule of law, voice and accountability
Source: Based on data from the World Governance Indicators (WGI).
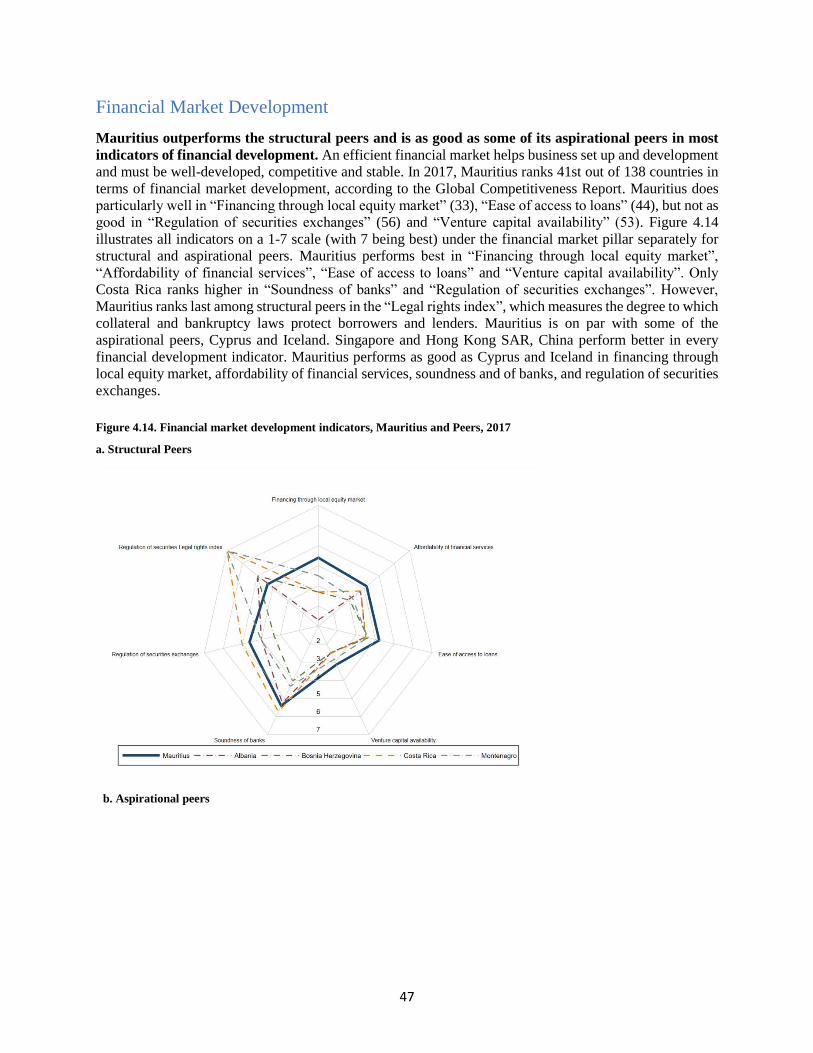
47
Financial Market Development
Mauritius outperforms the structural peers and is as good as some of its aspirational peers in most
indicators of financial development. An efficient financial market helps business set up and development
and must be well-developed, competitive and stable. In 2017, Mauritius ranks 41st out of 138 countries in
terms of financial market development, according to the Global Competitiveness Report. Mauritius does
particularly well in “Financing through local equity market” (33), “Ease of access to loans” (44), but not as
good in “Regulation of securities exchanges” (56) and “Venture capital availability” (53). Figure 4.14
illustrates all indicators on a 1-7 scale (with 7 being best) under the financial market pillar separately for
structural and aspirational peers. Mauritius performs best in “Financing through local equity market”,
“Affordability of financial services”, “Ease of access to loans” and “Venture capital availability”. Only
Costa Rica ranks higher in “Soundness of banks” and “Regulation of securities exchanges”. However,
Mauritius ranks last among structural peers in the “Legal rights index”, which measures the degree to which
collateral and bankruptcy laws protect borrowers and lenders. Mauritius is on par with some of the
aspirational peers, Cyprus and Iceland. Singapore and Hong Kong SAR, China perform better in every
financial development indicator. Mauritius performs as good as Cyprus and Iceland in financing through
local equity market, affordability of financial services, soundness and of banks, and regulation of securities
exchanges.
Figure 4.14. Financial market development indicators, Mauritius and Peers, 2017
a. Structural Peers
b. Aspirational peers

48
Source: Based on data from Schwab 2018.
Between 2012 and 2017 the overall development of the financial market has declined in Mauritius,
despite improvements in some indicators. The indicator of overall financial market development has
marginally decreased from 4.6 in 2012 to 4.4 in 2017. Four in 10 indicators improved between 2012 and
2017: these are “Financing through local equity market” (10 percent), “Ease of access to loans” (24 percent)
and “Venture capital availability” by 11 percent. The indicators “Financial services meeting business
needs”, “Affordability of financial services” and “Legal rights index” remained unchanged in that period.
Two of the ten indicators have decreased, that is “Soundness of banks” (-13%) and “Regulation of securities
exchanges” (-13%).
Table 4.2. Indicators of financial market development in Mauritius, 2012-2017
year
Overall
Financial
market
development
Financial
services
meeting
business
needs
Affordability
of financial
services
Financing
through
local
equity
market
Ease of
access to
loans
Venture
capital
availability
Soundness
of banks
Regulation
of
securities
exchanges
Legal
rights
index
2012 4.6 - - 4.0 3.4 2.8 6.2 5.3 6.0
2013 4.7 - - 4.1 3.5 3.0 6.1 5.3 6.0
2014 4.7 - - 4.2 3.5 3.1 6.1 5.2 6.0
2015 4.4 - - 4.0 3.5 2.8 5.5 4.7 6.0
2016 4.3 4.6 4.2 4.1 4.3 3.0 5.2 4.4 6.0
2017 4.4 4.5 4.2 4.4 4.2 3.1 5.4 4.6 6.0
Source: Based on data from Schwab, ed. Global Competitiveness Report, 2013–18.
Note: All values are expressed on a 1–7 scale, on which 7 is best.
Mauritius performs poorly in terms of “getting credit” indicator relatively to structural peers and
aspirational peers. The “Getting Credit” indicator covers two aspects of access to finance: the strength of

49
legal rights index and the depth of credit information index.10 Mauritius has a score of 65 and ranks 60th
worldwide. Bosnia and Herzegovina is on par with Mauritius, while all the other structural peers perform
better. Mauritius is performing better than the aspirational peers Cyprus (rank 73) and Iceland (rank 73),
but worse than Hong Kong SAR, China (rank 32) and Singapore (rank 32).
Figure 4.15. Indicators of credit access, Mauritius and Peers, 2019
Source: Based on data from the World Bank Doing Business database.
Note: 0-100 scale.
In Mauritius the costs of insolvency are high, processing time is low, but the recovery rate of
investment is high. A high developed financial market requires a well-designed system of insolvencies.
The reallocation of labor, capital and skills to other firms might be costly, but helps to improve the
productivity of the economy. In Mauritius an insolvency costs 14.5 percent of the value of the estate (Figure
4.16). An insolvency in peer countries is on average cheaper: the average structural peer pays only 10.4
percent and the aspirational peer pays only 5.8 percent. It takes 1.7 years to shut down a business in
Mauritius. Structural peers except for Montenegro (1.4) perform worse: Albania (2), Bosnia and
Herzegovina (3.3), and Costa Rica (3). In all the aspirational peers, less time is required to close a business.
In Singapore and Hong Kong SAR, China, firms can close their business in 50 percent of the time required
in Mauritius. Finally, creditors of Mauritian enterprises that go out of business are able to recover 67 cents
on each dollar invested. Mauritius performs exceptional well compared to structural peers that can only
recover 35,6 cents on average. All aspirational peers are able to recover a higher share than Mauritius.
Singapore recovers 89 percent, followed by Hong Kong SAR, China (87 percent), Iceland (85 percent), and
Cyprus (73 percent).
10 The strength of legal rights index measures the degree to which collateral and bankruptcy laws protect the rights of
borrowers and lenders and thus facilitate lending. The depth of credit information index measures rules and practices
affecting the coverage, scope and accessibility of credit information available through either a credit bureau or a credit
registry.

50
Figure 4.16. Insolvency process, Mauritius and Peers, 2017
Source: Based on data from the World Bank Doing Business database, 2017.11
Labor markets
Mauritius labor market performs well compared to structural peers but is behind aspirational peers.
Efficient labor markets can be a productivity growth enabler since they can facilitate reallocation of labor
from less to more productive sectors. Efficient labor markets also generate incentives to human-capital
accumulation. In 2017, Mauritius ranks 52nd in overall labor market efficiency. Figure 4.17 illustrates all
indicators under the labor market pillar of the Global Competitive Indicators. Compared to the structural
peers Mauritius performs well. Mauritius efficiency indicators are particularly good in terms of “hiring and
firing practices”, “country capacity to attract talent” and “effect of taxation on incentives”. Mauritius
performs poorly in “redundancy costs” and ranks last in “flexibility of wage determination”. Aspirational
peers perform better than Mauritius in most indicators, but Mauritius does fairly well in “redundancy costs”
and “effect of taxation on incentives”.
11 Time: Time for creditors to recover their credit is recorded in calendar years (table 1). The period of time measured
by Doing Business is from the company’s default until the payment of some or all of the money owed to the bank.
Potential delay tactics by the parties, such as the filing of dilatory appeals or requests for extension, are taken into
consideration. Cost: The cost of the proceedings is recorded as a percentage of the value of the debtor’s estate. The
cost includes court fees and government levies; fees of insolvency administrators, auctioneers, assessors and lawyers;
and all other fees and costs. Recovery rate: The recovery rate is recorded as cents on the dollar recovered by secured
creditors through judicial reorganization. Based on the time, cost and outcome of insolvency proceedings. Realized
outcome of insolvency – costs – time costs= recovery rate.

51
Figure 4.17. Indicators of labor market development, Mauritius and Peers, 2017
a. Structural Peers
b. Aspirational peers
Source: Based on data from Schwab 2018.
Note: All values are expressed on a 1-7 scale with 7 being best.
The overall labor market efficiency in Mauritius did not improve between 2012 and 2017. However,
only one of the indicators in the labor market efficiency pillar remained constant, while all other indicators
improved slightly. The largest improvement occurred in terms of “Hiring and firing practices”, followed
by “Pay and productivity”, “Reliance on professional management”, “Effect of taxation on incentives to
work”, “Cooperation in labor-employer relations”, and “Flexibility of wage determination”. In countries
characterized by flexible and efficient labor markets, key to the economic growth and development is the
capacity to innovate not by imitation of existing technologies but by contributing to push forward the
technological frontier. In this respect, a country characterized by rapid population ageing and emigration

52
of some of its young educated population needs to step up and improve significantly its capacity to attract
and retain talents.
Table 4.3. Development of labor-market indicators, Mauritius, 2012-2017
year Labor
market
efficiency
Cooperation
in labor-
employer
relations
Flexibility of
wage
determination
Hiring
and
firing
practices
Redundancy
costs, weeks
of salary
Effect of
taxation
on
incentives
to work
Pay and
productivity
Reliance on
professional
management
Country
capacity
to retain
talent
Country
capacity
to
attract
talent
Women
in labor
force,
ratio to
men
2012 4.4 4.6 4.4 3.9 10.6 - 3.9 4.4
0.6
2013 4.5 4.8 4.6 4.0 10.6 4.9 4.0 4.5 3.1 3.9 0.6
2014 4.3 4.9 4.7 4.2 10.6 5.1 4.2 4.4 3.2 3.9 0.6
2015 4.3 4.8 4.6 4.2 10.6 5.2 4.2 4.3 3.4 4.0 0.6
2016 4.4 4.8 4.5 4.3 10.6 5.0 4.3 4.5 3.8 4.0 0.6
2017 4.4 4.8 4.5 4.3 10.6 5.1 4.2 4.6 3.7 4.0 0.6
Source: Based on data from Schwab, ed. Global Competitiveness Report, 2013–18.
Note: All values reflect the Global Competitiveness Report score for each indicator unless otherwise noted.
Output markets
Competition of output markets for goods and services is of paramount importance to ensure the most
productive firms survive on the market. The Competition Commission of Mauritius is the statutory body
established in 2009 following the Competition Act 2007 with the objective of investigating possible
anticompetitive behavior. In its nearly 10 years of existence, the CCM has conducted numerous
investigations across the different sectors of Mauritius including: media and information and
communications technologies; food and beverages; insurance; banking and finance; and construction and
property development.
Mauritius is ahead of structural peers in almost all indicators of output market competition. The
distance to the structural peers is especially high in “total tax rate”, “trade tariffs” and “number of days to
start a business” (Figure 4.18). Mauritius ranks second in terms of “prevalence of foreign ownership”,
“business impact of rules on FDI” and “agricultural policy costs”. While Mauritius is outperformed in most
indicators, it is competitive with respect to aspirational peers in terms of “prevalence of foreign ownership”,
“business impact of rules on FDI”, “effect of taxation on incentives to invest”, and “tax rate”.

53
Figure 4.18. Goods market-efficiency Indicators of, Mauritius and Peers, 2017
a. Structural Peers
b. Aspirational peers
Source: Based on data from Schwab 2018.
Note: All values are expressed on a 1-7 scale with 7 being best/highest respectively for percentages and numbers.
Compared to structural and aspirational peers, the tax rate is low in Mauritius. The average tax rate,
measured as the amount of taxes and mandatory contributions payable by a business in the second year of
operation as a share of commercial profits, is 35 percent in structural peers. Businesses in Mauritius and
Montenegro pay 22 percent of their profits, 23 percent in Bosnia and Herzegovina, 37 percent in Albania
and 58 percent in Costa Rica. In Singapore the tax rate is 19 percent, in Hong Kong SAR, China 23 percent,
in Cyprus 25 percent and in Iceland 30 percent.

54
Figure 4.19. Business taxes, Mauritius and Peers, 2017
Source: Based on data from Schwab 2018.
Mauritius performs well in impact of taxation on investment incentive. Out of 138 countries, Mauritius
ranks 8th in terms of impact of taxation on investment incentive (Figure 4.20). Mauritius outperforms all
structural peers. The best performing structural peer, Montenegro, is 38 spots behind Mauritius on rank 46.
Followed by Costa Rica (102), Albania (123) and Bosnia and Herzegovina (128). Mauritius even
outperforms half of the aspirational peers in impact of taxation on investment incentive. While Iceland (36)
and Cyprus (13) perform worse than Mauritius, Singapore (5), and Hong Kong SAR, China (3) perform
better.
Figure 4.20. Impact of Taxation on Investment Incentives, Mauritius and Peers, 2017
Source: Based on data from Schwab 2018.
Compared to the peers, starting a business is exceptionally easy in Mauritius. The “ease of starting a
business indicator” combines four elements, the number of procedures involved, the time necessary, the
costs and the minimum capital requirement to start a new firm. Mauritius has a score of 94.3 and ranks 21st
globally (Figure 4.21). Compared with structural peers, Mauritius is by far the best performing country.
Albania ranks 50th, followed by Montenegro (90th), Costa Rica (142th) and Bosnia and Herzegovina
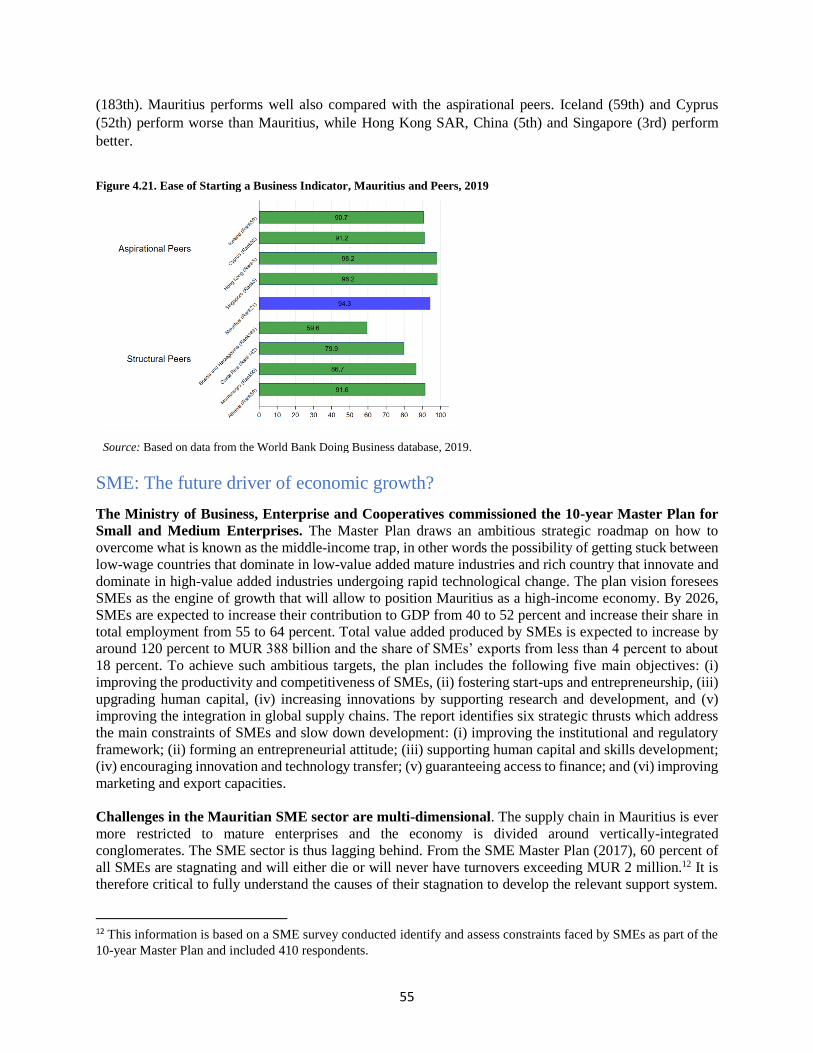
55
(183th). Mauritius performs well also compared with the aspirational peers. Iceland (59th) and Cyprus
(52th) perform worse than Mauritius, while Hong Kong SAR, China (5th) and Singapore (3rd) perform
better.
Figure 4.21. Ease of Starting a Business Indicator, Mauritius and Peers, 2019
Source: Based on data from the World Bank Doing Business database, 2019.
SME: The future driver of economic growth?
The Ministry of Business, Enterprise and Cooperatives commissioned the 10-year Master Plan for
Small and Medium Enterprises. The Master Plan draws an ambitious strategic roadmap on how to
overcome what is known as the middle-income trap, in other words the possibility of getting stuck between
low-wage countries that dominate in low-value added mature industries and rich country that innovate and
dominate in high-value added industries undergoing rapid technological change. The plan vision foresees
SMEs as the engine of growth that will allow to position Mauritius as a high-income economy. By 2026,
SMEs are expected to increase their contribution to GDP from 40 to 52 percent and increase their share in
total employment from 55 to 64 percent. Total value added produced by SMEs is expected to increase by
around 120 percent to MUR 388 billion and the share of SMEs’ exports from less than 4 percent to about
18 percent. To achieve such ambitious targets, the plan includes the following five main objectives: (i)
improving the productivity and competitiveness of SMEs, (ii) fostering start-ups and entrepreneurship, (iii)
upgrading human capital, (iv) increasing innovations by supporting research and development, and (v)
improving the integration in global supply chains. The report identifies six strategic thrusts which address
the main constraints of SMEs and slow down development: (i) improving the institutional and regulatory
framework; (ii) forming an entrepreneurial attitude; (iii) supporting human capital and skills development;
(iv) encouraging innovation and technology transfer; (v) guaranteeing access to finance; and (vi) improving
marketing and export capacities.
Challenges in the Mauritian SME sector are multi-dimensional. The supply chain in Mauritius is ever
more restricted to mature enterprises and the economy is divided around vertically-integrated
conglomerates. The SME sector is thus lagging behind. From the SME Master Plan (2017), 60 percent of
all SMEs are stagnating and will either die or will never have turnovers exceeding MUR 2 million.12 It is
therefore critical to fully understand the causes of their stagnation to develop the relevant support system.
12 This information is based on a SME survey conducted identify and assess constraints faced by SMEs as part of the
10-year Master Plan and included 410 respondents.

56
SMEs, support institutions, the private sector and the government shall adopt a new approach to integrate
SMEs in the supply chain and adapt to the changing and competitive global environment. The challenges
faced by SME sector are many which thus increase their vulnerabilities. The main constraints faced by
SMEs are a fragmented institutional support framework, lack of market intelligence and visibility on
potential export markets, inadequate training, skills mismatch and access to technology, financial literacy
and information gap on incentives and financing schemes available, to name a few.
The institutional support framework for SMEs encompasses several institutions which provide
duplicated services. The system is so fragmented with a diverse panoply of schemes which fail to cater for
the needs of SMEs at different stages of their development (Box 4.3). With different bodies providing the
same support services, this creates a lack of clarity on part of SMEs. There is no targeted approach which
leads to unfocused interventions by the various institutions. As a consequence, the impact of the different
support schemes on start-up, growth and competitiveness of SMEs is limited (SME Master Plan 2017).
These institutions are also not adequately structured with limited technical capabilities to provide quality
and specialized support services. There is a need to set up a monitoring and evaluation mechanism to allow
for a systematic impact assessment of all these schemes and services provided across the different
institutions. By evaluating these schemes, more information will be available to policy makers on the
effectiveness and needs of the different support services.
Though, different financing schemes have been set up by the government and the private sector, the
main obstacle for SMEs remains information asymmetry about these schemes. SMEs are not aware of
such schemes so much that the most common financing options are still traditional debt instruments (family
loans, bank loans, overdrafts and credit lines) and asset-based financing (leasing and factoring) (see Annex
B for details by scheme). However, with these options, SMEs face strict conditions compared to larger
companies. Alternative financing via online platforms for equity crowdfunding and peer-to-peer lending
have been proposed as well as providing tax incentives to Angel investors and partial protection against
loss (SME Master Plan 2017). Though, financial services are essential for the effectiveness, profitability
and expansion of SMEs, the main issue remains the financial awareness and understanding of these
schemes. Lack of financial literacy among SME owners and managers accentuates the problem further.
There seems to be an information gap or a lack of understanding on the diverse incentives and complicated
arrays of schemes available. There is a strong need to enhance SMEs’ financial literacy and awareness of
financial resources and support programs available to them.
Box 4.2 A Brief Institutional History In 1964 the British colonial authorities introduced the Development Certificate Scheme based on the import substitution
industrialization policy. To reduce the dependency on imported products and support domestic companies tariff barriers for imports
were implemented.
After Mauritius achieved independence, the first industrialization strategy was adopted by creating an export processing zone in
1971. To attract foreign investment in export-oriented sectors, new firms received a ten-year tax holiday and imports of raw materials
were duty-free. Theses incentives were successful mainly in the textiles sector and supported small enterprises that obtained
subcontracted work.
In 1983, the Small Industry Development Organisation was set up within the Ministry of Industry and Commerce to offer general
guidance to small enterprises. Furthermore, the Mauritius Export Development and Investment Authority was established to promote
export-oriented firms.
In 1993, the Industrial Expansion Act was ratified and the Small and Medium Industries Development Organization Act was
established as the prime institution to support small and medium manufacturers with a production value of less than MUR 5 million.
In 1998, the second Small and Medium Industries Development Organization Act increased the maximum level of value production
from MUR 5 million to MUR 10 million.
Facing the increasing liberalization process of world trade, the government shifted the industrialization strategy toward a globally
competitive industries development strategy. Therefore, the Small and Medium Industries Development Organization Act was

57
replaced by the Small Enterprises and Handicraft Development Act. To rationalize the institutional support of enterprises, a new
apex body was created (the Small Enterprises and Handicraft Development Authority) by merging the Small and Medium Industries
Development Organization and the National Handicraft Promotion Agency in 2005. Furthermore, the competencies of the Mauritius
Export Development and Investment Authority and the Export Processing Zones Development Authority were merged and a new
institution, Enterprise Mauritius, was created.
In 2008 the Ministry of Business, Enterprise and Cooperatives was established to support SMEs and cooperatives. In 2009 the Small
and Medium Enterprises Development Authority Act was promulgated to replace the Small Enterprises and Handicraft Development
Authority Act. Consequently, the maximum turnover that identifies SMEs was adjusted to MUR 50 million.
In 2015, the authority launched MyBiz to improve the support provided to SMEs by grouping all services and facilities under one
roof. In 2017, the authority was replaced by SME Mauritius Ltd, a private company owned by the Mauritian government. The same
year, the Economic Development Board Act was ratified. The new Economic Development Board merges the competencies of the
Board of Investment, Enterprise Mauritius, and the Financial Services Promotion agency. Its main objective is to create a sustainable
high-income economy with opportunities for each and every citizen through economic planning and promotion.
In total, five key ministries are involved in the support of enterprises in Mauritius. The Ministry of Finance and Economic
Development and the Ministry of Industry, Commerce and Consumer Protection fosters investments and exports through the
Economic Development Board.
Table 4.4. Overview Ministries and Core Support Institutions
Source: Based on “10 - Year Master Plan For The SME Sector in Mauritius”, Ministry of Business, Enterprise and Cooperatives.
The Ministry of Business, Enterprise, and Cooperatives provides a large range of support services, including registration, licensing,
and various schemes and training to SMEs and cooperatives. Services are provided by SME Mauritius and the National Institute for
Cooperative Entrepreneurship. The Ministry of Financial Services and Good Governance, through the National Productivity and
Competitiveness Council, aims at stimulating productivity growth by providing consultancy services, technical and soft skills
programs, and collecting and disseminating information and knowledge related to productivity and competitiveness. The Ministry
of Gender Equality, Child Development and Family Welfare promotes female entrepreneurship through the National Women
Entrepreneur Council.
SMEs are deeply rooted in the local ecosystem and they lack entrepreneurship expertise and formal
training in various areas. Among the most important weaknesses, there are management, bookkeeping,
business plan, leadership abilities, knowledge of how to secure a bank loan, management of cash flow, and
customer service. SME owners and managers lack the knowledge and ability to choose either the best loan
options, calculate loan repayments, or select the right financial products. This constrains their ability to
manage their business effectively. Tailored skills training is key in boosting entrepreneurship and
maintaining business viability over time. The 10 - Year Master Plan for the SME Sector in Mauritius (2017)
Strategy
Formulat
ion Level
(1)
Ministry of
Finance and
Economic
Development
(2)
Ministry of
Industry,
Commerce and
Consumer
Protection
(4)
Ministry of
Financial Services
and Good
Governance
(5)
Ministry of Gender
Equality, Child
Development and
Family Welfare
Impleme
ntation
Level
SME Mauritius
Limited
MyBiz
National Institute
for Cooperative
Entrepreneurship
(no sure whether
they still exist)
National
Productivity and
Competitivness
Council
National Women
Entrepreneur
Council
Role/
Area of
Intervent
ion
Apex Body for
SMEsCooperatives
Productivity and
Competitivness
National Women
Entrepreneur
Council
Economic Development Board
(Enterprise Mauritius should be out of
business but still exists)
Investment Promotion, Export
Promotion
5 Ministries
Core Public Support Institutions
(3)
Ministry of Business, Enterprise and
Cooperatives

58
emphasizes on the necessity to foster an attitude of entrepreneurship by setting up incubators which offer
start-ups an opportunity to learn from other entrepreneurs, mentors and potential investors.
Mauritian entrepreneurs are risk averse and are not ready to accept external investors. Many SMEs
have a core family ownership structure. They are not only reluctant to allow nonfamily members enter the
capital of the company, but they also often fail to exploit alternative sources of capital. Entrepreneurs in
Mauritius are generally risk averse and have not yet cultivated the attitude to embark on risky but high-
growth business activities. They are also resistant to modern risk management approach which is imperative
if they wish to increase their chances of survival and success. Risk-taking and competitive aggressiveness
have a significant impact on the management of SMEs and may ensure long-term sustainability.
Entrepreneurs with high risk tolerance, innovativeness and willingness to use new technologies are more
successful in generating profits.
Productivity levels are low in many Mauritian SMES. SMEs are penalized with higher purchasing
prices, due to low order quantities. Enabling SMEs to innovate and scale up is essential to boost aggregate
productivity and foster more inclusive and sustainable growth. This, however, depends to a large extent on
the ability of SMEs to seize the opportunities of digitalization and globalization. Digital technologies
facilitate the emergence of "born global" small firms and offer new opportunities for established SMEs to
scale up, enhance productivity and become global players (OECD Observer 2018). Many SMEs are still
struggling to innovate and adopt new technologies to better access markets and achieve stronger
productivity. To enable SMEs to spur productivity and catch up, investments in skills, organizational
change, process innovation, new systems and business models are needed.
Subsistence or necessity entrepreneurship are most common and there is an over reliance on owner
manager. The majority of SMEs in Mauritius are led by subsistence or necessity-driven entrepreneurs who
are mainly focused on their survival. Their businesses are likely to remain small and unlikely to expand and
create new jobs. They lag behind in terms are of innovative capacity, job creation, productivity, and
competitiveness. There is also an over reliance on the owner, who despite being technically good, lacks
several entrepreneurial traits to make the business prosper. This is worsened by the fact that SMEs suffer
from middle management gap (SME Master Plan 2017). There is a need to help subsistence entrepreneurs
in becoming transformational business persons by eliminating a number of bottlenecks at the levels of both
the enterprise and support institutions. For the latter, distinguishing across the different types of
entrepreneurs is pivotal in designing successful strategies and implementing programs supporting
entrepreneurs.
SMEs face skill mismatch coupled with versatility requirements. SMEs encounter distinct challenges
which require an adequately educated, skilled and experienced workforce. From the latest Human Research
Development Report (HRDC 2017), inadequate skills provision makes it challenging for the sector to
achieve its target. Attributes that affect skills and talent management in SMEs are communication,
teamwork, problem solving, initiative and enterprise, planning and organization, self-management,
learning, and technology. It is, however, difficult for them to recruit workers that match their requirements
in terms of the right set of skills, experience, attitude toward work and work ethics. There is a shortage of
adequately skilled employees and in many cases, workers are not well-matched with their current jobs.
Lack of technical skills, wrong attitude toward work, education system that does not meet the market
demands and unwillingness to work on shift were among the main constraints faced by entrepreneurs
(HRDC 2017).
SMEs are also less likely to invest sufficient resources in training. SMEs fear poaching of trained
employees, incomplete or asymmetric information on the quality of training and the return on training
investment, high transaction costs in purchasing training services and the nonavailability of services.
Though, there are various training schemes provided by different support institutions, SMEs are either not
59
taking advantage of same or these training programs may not respond to their needs. This mind-set among
SMEs to train their workers results in skill stagnations, poor productivity and lack of innovations. Skills
policies must thus support employers in making better use of the talent available to them. Mechanisms that
help managers to identify skill gaps must be emphasized. These include enhancing training delivery systems
and practices that make the best use of the existing skills base. The latest HRDC report (2017) recommends
an incentive voucher system for SMEs to encourage them to link with universities, public and private
providers for problem-solving purposes. A clustering approach for SMEs is also proposed in terms of
analysis of skills needs; development/conducting skill development programs and funding amongst others.
This could be done by institutions like the HRDC and sectoral associations through a coordinating
mechanism.
SMEs still use basic production technologies and lag behind in terms of innovation and productivity.
SMEs trail behind in the adoption of technology, namely, information and communication technology, e-
commerce amongst other innovative practices, and the production of high value added goods and services.
Since they are a heterogeneous population of firms, innovative practices are wide ranging and include not
only research and development based new products and services, but also improved designs and processes
and the adoption of new technologies. However, many SMEs are limited by their size, have low capital
base and productivity, and concentrate all functions among a few persons. Further, they lack the spending
power and knowledge required for effective research and development. Diseconomies of scale and
inadequate exposure to the international environment also hinder access to technology and innovation.
Many SMEs are thus at crossroads between ‘business as usual’ (operate in the traditional way) and
developing new ways of doing business. In today’s highly competitive market, innovation safeguards the
sustainability of enterprises. The Master Plan confirms the need to create high-tech and innovative SMEs
by creating technology diffusion clinics and awareness sessions for start-ups, optimizing the Intellectual
Property framework (cost, procedures and time) to enable SMEs to protect their creations and intellectual
rights and encouraging technology transfer through a structured network among industry, universities and
technology institutes. The SME Master Plan recommends that SMES be encouraged to switch to green
production methods which is considered as an important growth factor for the enterprise and the economy.
Most SMEs rely largely on the domestic market and have low export ability and capacity. This limits
their prospects for sustained growth. SMEs tend to be under-represented in international trade and their
export potential remains vastly untapped. Though, they cover a wide diversity of activities, mostly in the
retail business; they rarely serve external markets. Mauritian entrepreneurs are still domestic market
oriented and new ventures tend to take market shares away from existing operators rather than exploit new
untapped market opportunities (SME Master Plan 2017). Domestic markets in some sectors are also locked
by large conglomerates and their affiliates and SMEs fail to find a place. SMEs and particularly start-ups
do not have the necessary internal competencies and abilities to export for instance they are unable to devise
and implement a branding and marketing strategy. Participation in global markets and value chains thus
remains a challenge for Mauritian SMEs. They are also unaware of the prospects in potential exports
markets, in particular with the different regional trading groups like COMESA and SADC and especially
on the African continent. They also lack knowledge of the regulations and procedures in prospective export
markets as well as the international and regional market trends. The lack of internal capacity, innovation,
digital technologies, market intelligence and also visibility on possible markets remain a major concern
which hinders export potential. As per the SME Master Plan, Mauritian SMEs must regroup to tap growing
export opportunities, notably in neighboring African countries. They must actively explore collaborative
modes to pool and to leverage on their know-how and competencies in relevant areas to overcome their
respective weaknesses.

60
Box 4.3 SME Support Schemes
The Mauritian government has set up around 40 different schemes to support local companies. The schemes are managed by the
corresponding ministries and are implemented by their support institutions. The most important schemes are implemented by
SME Mauritius and the Economic Development Board.
Economic Development Board
Type (1) Export Promotion
Speed to market Scheme:
To account for the remote location of Mauritius, the Economic Development Board offers the Speed to Market Scheme.
Manufacturing enterprises that produce textiles, jewelry or medical devices and export to the European market, are entitled to a
refund of 40% on the Air Freight costs. For the Financial Year 2018/19 (as at February 2019), the Economic Development Board
processed 2,374 claims from 94 beneficiaries and the amount disbursed was MUR 61 million. The table below shows the number
of beneficiaries and amount disbursed by the Economic Development Board on the Speed-To-Market Scheme for Europe from
2016 to 2019.
Fiscal years No. of beneficiaries No. of claims Amount disbursed (MUR)
2016/17 11 164 5,123,146
2017/18 (a) 154 3455 73,457,596
2018/19 (b) 94 2374 60,986,457
Total 259 5993 139,567,199
a. The No. of beneficiaries includes 95 planters in the agro sector. b.The No. of beneficiaries includes 43 planters in the agro
sector.
Freight Rebate Scheme:
The Freight Rebate Scheme is an export support scheme to the African Market. Enterprises can apply for refund of 25 percent of
the basic freight cost up to US$300 for 20-foot container and a maximum of US$600 for a 40-foot container. For the Financial
Year 2018-19 (as at February), the Economic Development Board has processed 831 claims from 35 companies, amounting to
MUR 10.3 million. The Table below shows number of companies benefiting from the scheme and the total amount disbursed
from 2014 to 2019.
Fiscal years No. of beneficiaries No. of claims Amount disbursed (MUR)
2014/15 25 286 5,662,448
2015/16 30 648 8,973,828
2016/17 29 1130 17,535,436
2017/18 29 1905 12,930,919
2018/19 35 831 10,327,993
Total 148 4800 55,430,624
Export Credit Guarantee Insurance Scheme:
The Credit Guarantee Insurance Scheme is a refund scheme to subsidize the premium paid by enterprises exporting to Africa and
taking an insurance policy to protect them against none payment. The refund is equivalent to 50 percent of the premium paid up
to a maximum of 0.2 percent of the insurable turnover. As from 16 January 2018, the Scheme has been extended to duly
registered manufacturing SMEs and Cooperative Societies on the following terms and conditions: to cover all insurable exports
worldwide, and the refund will be 50 percent of premium up to 0.4 percent of insurable turnover which will be paid directly to
insurer. As at date, an amount of MUR. 1,901,715 has been disbursed as shown below:
Fiscal years No. of beneficiaries No. of claims Amount disbursed (MUR)
2016/17 3 3 590,799
2017/18 2 2 212,625
2018/19 5 5 1,098,291
Total 10 10 1,901,7151,901,715
Participation in International Fairs SMEs Refund Scheme:
The scheme was previously managed by SME Mauritius (ex-Small and Medium Enterprises Development Authority) and, since
July 1, 2018, has been under the responsibility of the Economic Development Board. As at February 2019, an amount of MUR
7,606,817 has been disbursed to 95 companies.

61
Fiscal years No. of beneficiaries No. of claims Amount disbursed (MUR)
Period 2018-2019 95 112 7,606,817
Type (2) Investment Promotion
To guarantee the access to working capital registered private banks and the Bank of Mauritius provide the SME Financing
Scheme. Individuals with a turnover of less than MUR 2 million and entities with less MUR 50 million can apply for financing
up to MUR 2 million with an annual percentage rate of 5.5 percent.
SME Mauritius
Certification Scheme:
SME Mauritius offers a Certification Scheme to promote the marketability of products and services, standardize inputs and
processes. The scheme will provide technical assistance for accreditation to international standards and other certificates. SMEs
that have a turnover of less than MUR 50 million and produce products and services that could be exported, can apply for a grant
of 80 percent up to MUR 0.2 million of the certification costs.
Productivity Improvement Scheme:
Scheme to increase efficiency and improve internal processes. In the first phase of the scheme an audit of the internal functions
takes place, followed by an in plant improvement proposal. In the second phase the improvement proposal is implemented and
monitored by SME Mauritius. Enterprises with less than MUR 50 million can apply for a grant of 20 percent of the costs of the
productivity improvement program.
Access to market barcode scheme:
This scheme is designed to encourage enterprises to adopt the barcode certification and use barcodes for their products.
Enterprises with a turnover of less than MUR 20 million receive a 1005 reimbursement of the registration of a barcode and
training the associated training fees.
Green Energy Promotion – Solar Photovoltaic (Pv) Rebate:
The scheme helps SMEs to produce electricity using solar photovoltaic technology. SMEs face various barriers that deter them
from adopting energy efficiency measures such as lack of time and resources to explore energy efficiency options, and lack of
information about where and how energy is used in their companies. They also do not have internal capacity to develop and
implement energy efficiency projects, and rarely view efficiency as a priority, especially during the early SME development
phase. A recent survey (Straconsult 2019) estimates that about 2 percent of overall electricity consumption in the SME and
Industry Sector was due to air conditioning over 2015–17 and a further 5–6 percent was due to refrigeration and related usages.
Thus, the scheme allows eligible SMEs to produce electricity for their own consumption. It is also in line with the government’s
long-term energy strategy to increase the share of renewable energy to 35 percent in the national energy mix by 2025 and
maintained at 35 percent until horizon 2030.
Mentoring and Hand-Holding Program:
The programme strengthens SMEs through hand-holding, mentoring and coaching activities. It supports innovation and share
knowledge with industry experts. As at date, 24 companies have benefited from this scheme whereby mentors/industry-experts
share their lifelong acquired experience, knowledge, skills, abilities and long-term perspective in the specific areas of
intervention including Financial and Accounting, Marketing, Operational management, Information Technology: IT tools and
online presence and visibility with the aim to foster the sustainable growth of SMEs.
Communication and Visibility – Online Presence:
It assists SMEs in developing and implementing the various tools and means for online presence and marketing. For instance,
SMEs are assisted in designing and developing their website, social media page, links for all social media networks and video
marketing, amongst others. The grant for acquiring the technical assistance of service providers for the above mentioned areas of
intervention represents 80 percent of cost of the project up to a maximum amount of MUR 40,000.
Technology and Skills Transfer – Inclusive Business
It encourages and stimulates best business practices for achieving higher productivity and competitiveness and accelerate the
democratisation of the economy by creating additional business opportunities for start-ups and other small businesses.
Mauritius Research Council – National SME Incubator Scheme
Innovation Scheme
The National SME Incubator Scheme is a special public private partnership set up in 2017 to foster an innovation-driven
entrepreneurial ecosystem in Mauritius. Under the framework, government and private sector incubators provide training and
mentoring, cofinancing opportunities, office space and other relevant resources to nurture: (i) innovative ideas, (ii) early business

62
start-ups and (iii) SMEs willing to expand their activities and explore new markets. The scheme adopts a holistic approach geared
toward providing a new thrust to the SME sector in terms of creation of Innovative businesses. There are currently 4 accredited
incubators and 78 incubatees with a total project value of approximately MUR 28.2 million. There are also 51 projects in the pre-
incubation phase; 26 projects in the incubation phase, and 1 project in the acceleration phase.
Building Export Capabilities of SMEs
Various schemes have been put in place to assist SMEs to boost domestic exports. In 2017/18, 8 SMEs have successfully entered
the export market and around 25 are expected to export their products by 2020/21. In line with building their export capabilities,
SMEs have been assisted to professionalize their services and operations through Business Diagnosis Schemes and in 2017/18,
40 SMEs were assisted and the target is to reach out to 175 by 2020/21. Under the Lease Equipment Modernization Schemes that
provide affordable finance to SMEs to shore up their productivity and competitiveness, 9 SMEs have been assisted in technology
upgrading in 2017/18 and it is expected that 100 SMEs could benefit from same by 2020/21.
MauBank
In 2016, MauBank Ltd which is a wholly owned state company came into operation to offer retail, SME and corporate banking
business services locally and internationally. The MauBank SME Financing Scheme is as from 2.5 percent interest rate and
applies to different sectors, namely, information and communication technology and other export services, manufacturing, bio-
farming, agribusiness activities, renewal and green energy, handicraft, aquaculture and other value added ocean economy related
activities.
Development Bank of Mauritius
The Development Bank of Mauritius SME Financing Scheme also provides a maximum loan amount of MUR 3 million at an
interest rate of 3 percent per year for the first 4 years. The financing covers up to 90 percent of the project cost and targets sectors
such as manufacturing, service, tourism, agribusiness, and information and communication technology. The government has put
in place several schemes aimed at maintaining the flow of credit to SMEs and improving their access to capital markets, namely
the Credit financing scheme, SME Financing Schemes (for SMEs with turnover less than MUR 10 million and those with
turnover more than MUR 10 million but not exceeding MUR 50 million), Equity Participation in enterprises, Import Loan
Facility, SME Partnership Fund, the Development Bank of Mauritius – Booster Micro Credit Loan Scheme, the Development
Bank of Mauritius – Quasi-Equity Financing Scheme, the Development Bank of Mauritius – Business Development Scheme, and
the Development Bank of Mauritius – Normal Scheme for the Agricultural Sector. In March 2019, the Development Bank of
Mauritius launched a new Entrepreneur Scheme for women. Women starting a business will benefit from an unsecured loan up to
MUR 500,000 at a preferential interest rate of 3 percent per annum.
Main Financing Schemes from the Private Sector
A number of financing schemes are made available to SMEs by the private sector. The wide range of schemes range from
renewals of existing credit facilities, new term loans, working capital excluding restructured facilities, finance lease, working
capital facilities include overdraft, letters of credit, import/export loans or bills discounting and avalizing. The Table below shows
total amount of credit facilities approved under the SME Financing Scheme across the main banks in Mauritius from December
2011 to July 2018. The number of applications for these schemes has been increasing over the years.
Credit Facilities under the SME Financing Scheme -
December 2011 to July 2018
Applications
Received
Applications
Rejected
Total Credit Facilities
Approved (MUR million)
The Mauritius Commercial Bank Limited 2918 69 4,452
Barclays Bank Mauritius Limited 247 4 616.2
The Hong Kong and Shanghai Banking Corporation Limited 211 0 329.1
Bank of Baroda 87 0 215.8
Habib Bank Limited 19 1 32.7
SBM Bank (Mauritius) Limited 1876 65 1,931.1
MauBank Limited 628 103 777.4
Bank des Mascareignes Ltee 237 41 232.9
AfrAsia Bank Limited 14 1 99.6
Bank One Limited 174 3 270.3
SBI (Mauritius) Ltd 115 3 168.1
ABC Banking Corporation Ltd 78 5 108.1
Total 6604 295 9,233
Source: Bank of Mauritius 2019.

63
64
5. Which Firms Grow? Evidence from a Small Sample of Large Firms Existing studies using longitudinal firm-level data in developing countries seem to agree that new
firms account for the bulk of job creation, while incumbent firms create few jobs. For example,
Shiferaw and Bedi (2009) use a panel data of Ethiopian manufacturing establishments over the period 1996-
2007 and find that job reallocation is relatively higher in industries dominated by smaller and younger
establishments. Small firms create jobs mainly at the point of market-entry and play a limited role in terms
of contributing to manufacturing employment through post-entry expansion. Using the Tunisian registry of
firms for the period 1996–2010, Rijkers et al. (2014) find a similar pattern among Tunisian firms, whereby
young firms tend to grow more rapidly and contribute the most to net job creation, although they are
characterized by higher exit rates. Post-entry, large firms consistently outperform small firms in terms of
job creation. Churning is limited, especially for larger firms, and few firms manage to grow. Productive
firms' and profitable firms' employment grows significantly faster, but the relationship between
productivity, profitability and employment creation is weak. Using 2011 and 2014 Rwanda Establishment
Census data, World Bank (2016) indicates that employment creation is mainly a matter of firm entry: over
half of employment was created by young firms, and almost 30 percent by new firms. A recent World Bank
report makes use of longitudinal datasets from 11 developing countries, namely Cote d’Ivoire, Brazil,
Ethiopia, Hungary, India, Indonesia, Mexico, South Africa, Thailand, Tunisia, and Turkey (World Bank
2018). The report finds that high growth firms are a small group, but they are powerful engines of jobs and
output growth. Over half of all new jobs and sales are created by such firms and net employment and output
growth would have been negative without them.
This section takes advantage of a longitudinal dataset of large establishments compiled by a World
Bank team to investigate which large firms create most jobs and generate more value added. In
collaboration with Statistics Mauritius, a World Bank team has compiled a longitudinal dataset of large
establishments surviving between 2007 and 2013 using data from the Census of Economic Activities
(Annex C illustrates the details of the procedures). The cross-sectional analysis in section 2 shows that
microfirms created the most jobs, followed by self-employed and small firms. Between 2002 and 2013,
employment in microfirms grew by +67,000 units, which makes up about 51 percent of employment growth
recorded in all nonagricultural private sector over the period. The number of self-employed increased by
+28,000 units and small firms created 28,000 additional jobs. By contrast, large firms did not contribute
substantially to employment growth. Firms with 100 to 499 added about 9,000 workers and the largest
firms, employing 500 or more workers, shed 4,300 jobs, particularly between 2002 and 2007.
Any evidence presented here is based on a selected sample of surviving large firms and does not apply
to the entire universe of large firms in Mauritius. Net employment (value added) growth between two
time periods is the by-product of three factors: (i) job creation due to firm entry, (ii) job destruction due to
firm exit, and (iii) net job growth among surviving firms. This section focuses on the last term: net job and
value added dynamics in a sample of large establishments that existed in 2007 and survived until 2013 (and
were matched). The 2007 and 2013 Censuses of Economic Activities were designed as cross-sectional
databases without identifiers to link firms over time. A matching exercise of individual establishment
observations has been carried out based on establishment names, sector of activity, and geographical
location (Municipal Ward–Village Council Area) starting with the sample of about 900 respondents in the
2007 CEA. The result is a panel dataset comprising 232 large establishments.13 Although the results of the
analysis cannot be readily generalized to the universe of large firms operating in Mauritius, it will provide
13 The full matched dataset comprises 313 large establishments. However, to verify the quality of the matched dataset,
a cap of 20 percent to annualized changes in employment and value added has been applied and has led to 260 matched
observations.

65
novel insights. The rest of the section (i) describes jobs and value added dynamics in the matched sample
and disaggregates those dynamics by a number of the characteristics of firms; (ii) takes a close look at
differences in terms of observable characteristics between firms that grew and those that shed jobs; (iii)
investigates the correlates of employment growth.
Box 5.1 Limitations of the Panel Dataset of Large Establishments The panel dataset of large establishments is the results of a complex matching exercise of establishment-level observations across
the 2007 and 2013 census of economic activities in absence of identifiers that could track observations over time. The exercise was
scattered by a number of challenges ranging from the destruction of personal information that would have made matching
observations over time much easier (such as business name, business address, business registration number, value added tax
number, and telephone number) to changes in industry and geographical location classifications between the two rounds of the
census of economic activities. In the universe of 2,088 large establishments in 2007, 1,229 could thus be tracked over time.
However, because of the high nonresponse rate, only 542 of the 1,229 matched establishments (44 percent) responded in at least
one year. Of these 542 establishments, 229 (42 percent) responded in only one year, while 313 (58 percent) responded in both years.
This means that the biggest loss in terms of observations is ascribable to the nonresponse rate rather than the lack of information
to match establishments over time. The matching process indicates that the rate of perfect matches based on name, the National
Standard Industrial Classification of Economic Activities code group, and the Municipal Ward–Village Council Area code group
was 34 percent of the initial universe of large establishments. This was raised to 59 percent by allowing for relocations and changes
in economic activity among establishments. However, the matching rate decreased dramatically, to around 15 percent, because of
nonresponse.
The low matching rate is likely to lead to considerable sample selection. Table 5.1 compares the characteristics of the establishments
in the panel dataset with the attributes of the establishments in the initial universe. The average matched establishment is twice the
average size of establishments in the initial universe (181 compared with 97 employees). The value added of the former is also
considerably greater (MUR 127 million compared with MUR 63 million). This is reflected in the employment size distribution.
Thus, panel establishments are more likely to be in the 5–99 and 100–499 employee groups relative to the initial universe, which
included a larger share of establishments with 10–19 and 20–49 employees. They are also likely to be located in the Port Louis
District and less likely to have the status of a company. The sectoral distribution shows some differences. Thus, panel establishments
are more likely to be operating in the finance, insurance, and real estate, while the initial universe shows a higher prevalence of
establishments in manufacturing.
Table 5.1. Characteristics of Panel and Cross-Sectional Establishments
Characteristic Panel 2007, % Cross-section 2007, %
Industry
Manufacturing, utilities, mining 33 37
Construction 2 2
Wholesale and retail trade 17 17
Transportation and storage 5 4
Accommodation 5 7
Information and communication 3 5
Finance, insurance, real estate 17 7
Professional administrative services 7 9
Education, health care, arts, other services 11 12
Employment, size
Less than 10 4 4
10–19 20 34
20–49 24 29
50–99 22 16
100–499 24 14
500+ 6 3
Average 181.7 97.5
Value added, average (MUR, millions) 127 63
District
Port Louis 50 41
Pamplemousses 7 10
Rivière du Rempart 2 4
Flacq 2 4
Grand Port 3 3
Savanne 1 1

66
Plaines Wilhems 26 27
Moka 7 7
Black River 2 3
Ownership type
Company 71 81
Individual proprietor 5 7
Other 24 12
Source: Based on data of Statistics Mauritius 2011, 2017.
Modest growth in employment, mainly driven by trade
On average surviving firms expanded employment by 0.85 percent per year. Total employment in the
matched sample of 292 firms increased by 2,944 units representing an annual percentage change in
employment of 0.85 percent from 2007 to 2013 (Table 5.2). From the data, the average firm in the sample
added a little more than 10 workers over the period of study. Firms in Moka added the highest number of
jobs (1,537 jobs in 21 firms), accounting for over 52 percent of the total increase in employment in the
sample, followed by Black River (47 percent) and Port-Louis (35.5 percent). Firms in the Western part of
the island (Black River) grew faster with a growth rate of 22 percent followed by firms in Savanne (9.8
percent) and Moka (8.2 percent).
The bulk of job creation came from the wholesale and retail trade sector, followed by finance, real
estate and transport. Wholesale and retail trade added 3,316 jobs with an employment growth rate of 10
percent (Table 5.2). With 14 firms in the survey, the transport sector added on average around 79 workers
during the period of study, followed by wholesale and retail firms with around 64 workers and finance/real
estate with 37 workers. Sectors with a fall in annual percentage change in employment are administrative
services which registered a decline of 17.9 percent followed by professional activities, accommodation and
manufacturing textiles. The latter faced a large decline of 2,177 jobs.

67
Table 5.2. Surviving Large Firms, Change in Employment, 2007-2013
Total
Firms
Change in
Employment
(Level)
Annual
Change in
Employment
(%)
Region
Port Louis 136 1,046 1.12
Pamplemousses 21 -643 -1.73
Riviere du Rempart 7 -33 -2.49
Flacq 5 1 0.02
Grand Port 10 -288 -4.61
Savanne 4 76 9.80
Plaines Wilhems 83 -143 -0.08
Moka 21 1,537 8.23
Black River 5 1,391 22.01
Sector
Manufacturing food 26 344 1.14
Manufacturing textiles 33 -2,177 -1.76
Manufacturing other 37 28 0.20
Construction 6 -9 -0.14
Other secondary 6 77 0.46
Wholesale & retail trade 52 3,316 10.01
Transport 14 1,111 3.28
Accommodation 15 -289 -2.62
Finance/real estate 36 1,336 4.70
Professional activities 10 -65 -3.68
Administrative services 12 -1,136 -17.91
Health 17 217 2.29
Education 11 143 3.51
Other services 17 48 0.20
Initial Employment Size
10-19 59 -47 -0.91
20-49 75 -188 -1.40
50-99 67 -417 -1.50
100-499 72 1,373 1.42
500+ 19 2,223 1.10
Export Status
Export Oriented (Manufacturing) 36 -1,628 -1.19
Not Export Oriented (Manufacturing) 64 -752 -2.16
Others 192 5,324 3.08
Total 292 2,944 0.85
Source: Based on data of the Census of Economic Activities (CEA), Statistics Mauritius.
The largest firms (100+ workers) created jobs, both in absolute number and in percentage. Firms with
less than 100 workers faced a decline in the level of employment. and recorded a decline in the annual
percentage change in employment ranging between -0.9 and -1.5 percent (Table 5.2). Firms that had

68
between 100 and 499 workers had the highest growth rate in employment of 1.4 percent with 1,373 jobs
being created, while firms with 500 and more workers created around 2,223 jobs over the period of study.
The largest firms added an average of 117 workers compared to 19 for those firms employing between 100
and 499 workers. Both export and non–export-oriented manufacturing firms registered a fall in the level of
employment and a decline in the employment growth rate of 1.2 percent and 2.2 percent, respectively.
Growing and shrinking firms: A closer look at the dynamic
Limited dynamism characterizes large establishments between 2007 and 2013. Between 60 and 84
percent of large establishments does not change employment category over a period of 5 years. About 7 in
10 firms with size of 10 to 19 in 2007 are still in the same employment category in 2013 and the remaining
29 percent expanded. Firms with a baseline size of 20 to 49 workers were also more likely to grow (22
percent) than shrink (15 percent). A similar picture is noted for firms with a baseline size of 50 to 99 workers
where 24 percent managed to graduate to the next category compared to 18 percent which decreased in
size. In contrast, the transition matrix between firm size categories shows that firms with a baseline size of
100 to 499 workers were more likely to shrink (10 percent) than expand (8 percent). Around 84 percent of
firms with more than 500 employees were static between 2007 and 2013 while 16 percent trended in the
opposite direction and moved in the category of 100 to 499 workers.
Firms operating in the textiles and accommodation sectors were significantly more likely to shrink
than grow. The opposite is true for firms in wholesale and retail trade, finance/real estate, administrative
services and health. Firms having less than 500 workers (with the exception of those in the size of 20 to 49
workers) were significantly more likely to grow rather than to shrink. Apart from those firms with 500 or
more workers, firms that grew were also significantly bigger at baseline than static firms.
Table 5.3. Surviving Large Firms, Employment Transitions, 2007-2013
Employment 2013
Employment 2007 10-19 20-49 50-99 100-499 500+ Total
10-19 42 13 3 1 0 59
71% 22% 5% 2% 0% 100%
20-49 11 47 15 1 1 75
15% 63% 20% 1% 1% 100%
50-99 4 9 38 16 0 67
6% 12% 58% 24% 0% 100%
100-499 0 2 5 59 6 72
0% 3% 7% 82% 8% 100%
500+ 0 0 0 3 16 19
0% 0% 0% 16% 84% 100%
Total 57 70 61 80 23 292
20% 24% 21% 27% 8% 100%
Source: Based on data of the Census of Economic Activities (CEA), Statistics Mauritius.
Growth in value added larger in health, finance/real estate and transport sectors and
in large firms
Overall growth in value added stood at 3 percent across surviving establishments. Firms in the western
region of the island (Black-River) had the highest annual percentage change in value added (Table 5.4).

69
Though, there were only 5 firms surveyed in that region, a direct correlation could be noted between growth
in employment and growth in value added.
From a sectoral perspective, health, finance/real estate and transport had the highest growth in value
added relative to other sectors in the economy. Sectoral employment growth is broadly in line with
sectoral growth in value added. Overall, output growth in these sectors was associated with relatively fast
job creation. Though, the wholesale and retail sector showed a positive annual growth in employment, its
annual growth in value added fell by 5 percent.
Table 5.4. Surviving Large Firms, Change in Value Added, 2007-2013
Total
Firms
Change in Value
Added (Level)
Annual
Change in
Value
Added (%)
Region
Port Louis 136 3,987,346,111 3
Pamplemousses 21 (1,325,506,447) -8
Riviere du Rempart 7 25,153,247 8
Flacq 5 18,939,737 1
Grand Port 10 (10,401,619) 0
Savanne 4 20,225,009 5
Plaines Wilhems 83 3,189,398,218 4
Moka 21 669,655,238 7
Black River 5 1,152,328,013 25
Sector
Manufacturing food 26 (417,647,760) -2
Manufacturing textiles 33 (377,081,449) -1
Manufacturing other 37 33,107,093 0
Construction 6 36,766,027 1
Other secondary 6 1,372,266,120 6
Wholesale & retail trade 52 (1,288,603,367) -5
Transport 14 1,303,272,687 7
Accommodation 15 (204,185,651) -3
Finance/real estate 36 6,831,610,863 10
Professional activities 10 (136,899,474) -7
Administrative services 12 (276,319,278) -10
Health 17 282,787,115 11
Education 11 60,537,047 4
Other services 17 507,527,533 1
Employment
10-19 59 118,284,581 3
20-49 75 (417,816,148) -3
50-99 67 851,075,049 4
100-499 72 1,800,454,058 2
500+ 19 5,375,139,965 4
Export Status
Export Oriented (Manufacturing) 36 (826,018,326) -2
Not Export Oriented
(Manufacturing) 64 (308,206,763) -1
Others 192 8,861,362,596 5
Total 292 7,727,137,506 3
Source: Based on data of the Census of Economic Activities (CEA), Statistics Mauritius.

70
Growth in value added is higher across relatively large firms with an annual rise of 4 percent. Firms
with 20 to 49 workers registered a fall of 3 percent in value added while establishments in the other size
categories recorded a rise ranging between 2 to 4 percent. Across both export oriented and non–export-
oriented manufacturing, there had been a fall in value added of 2 percent and 1 percent respectively. This
was in line with the loss in employment in the manufacturing sector.
Table 5.5. Surviving Large Firms Mauritius, Change in Labor Productivity, 2007-2013 Total
Firms
Change in Labor
Productivity
(Level)
Annual
Change in
Labor
Productivity
(%)
Region
Port Louis 136 150611 1.63
Pamplemousses 21 -171460 -6.70
Riviere du Rempart 7 155249 10.55
Flacq 5 26956 0.69
Grand Port 10 264106 4.65
Savanne 4 -151734 -4.57
Plaines Wilhems 83 111560 3.64
Moka 21 -48240 -1.48
Black River 5 117975 2.78
Sector
Manufacturing food 26 -142028 -2.65
Manufacturing textiles 33 17970 0.88
Manufacturing other 37 4325 0.09
Construction 6 37546 1.56
Other secondary 6 451679 5.48
Wholesale & retail trade 52 -696724 -13.32
Transport 14 124954 4.05
Accommodation 15 -28018 -0.88
Finance/real estate 36 738658 5.27
Professional activities 10 -237510 -3.73
Administrative services 12 282466 9.96
Health 17 138481 8.72
Education 11 13371 0.62
Other services 17 107444 1.08
Employment
10-19 59 180781 3.87
20-49 75 -95555 -1.45
50-99 67 264882 5.16
100-499 72 21706 0.34
500+ 19 115712 3.00
Export Status
Export Oriented (Manufacturing) 36 -10057 -0.46
Not Export Oriented
(Manufacturing) 64 78310 1.30
Others 192 102417 1.56
Total 292 92756 1.94
Source: Based on data of the Census of Economic Activities (CEA), Statistics Mauritius.

71
When considering employment creation, ownership structure and access to the internet matter. A
simple multivariate analysis of the characteristics of large surviving firms that created jobs in Mauritius
between 2007 and 2013 focuses on the role of firm size, export orientation, ownership structure, innovation,
debt status and organizational, district and industry characteristics. Mauritian owned enterprises and joint
Mauritian/foreign owned firms have lower growth rate in employment relative to foreign firms. Firms with
access to the Internet also have a positive employment growth rate compared to those without internet
access. Firm size does not have statistically significant effect, denoting lack of correlation between size of
the establishment and growth of employment growth when controlling for other factors (Table C 1).

72
6. Conclusions and Policy Implications The (nonagricultural) private sector is populated by an increasing number of self-employed and
microenterprises. The total number of establishments almost doubled from 66,400 units in 2002 to 127,000
units in 2013, largely thanks to a rapid increase in the number of self-employed and microfirms. By contrast,
the number of large establishments has remained roughly constant over the same period.
While small firms have spearheaded the creation of new jobs and of value added, large firms still
contribute the lion’s share. Of the 131,000 jobs added between 2002 and 2013, 95 percent were created
by small firms and a meagre 7,000 were generated by large firms. This is equivalent to an increase of 78
percent in small firms that employ some 283,000 workers in 2013, and an increase of 3.4 percent in large
firms that contribute a total of 217,000 workers in 2013. Similarly, overall value added increased by 71
percent, with small firms posting a growth of about 218 percent compared with 38 percent of large firms.
However, over two thirds of value added and almost half of employment in Mauritius is generated by large
firms.
Despite considerable progress, small firms are three times less productive than large firms and the
growth of the informal sector might be a rising constraint on their average level of productivity.
Between 2002 and 2013, productivity increased both among small and large firms. However, the growth
rate was substantially higher among small firms: 5.4 percent per year among small compared with 2.9
percent per year among large firms. This means that small firms have reduced the productivity gap with
large firms from 3.8 times in 2002 to 2.9 times in 2013. In 2013, the average labor productivity of small
firms was MUR 263,000 compared with MUR 759,000 of large firms.
The structural transformation of the economy has made firms operating in the services sector more
productive, notwithstanding rising employment in the sector. Productivity levels are almost three times
higher among small firms providing financial and insurance services as well as professional services
compared with small firms in manufacturing and trade. The sectoral gap is even larger among large firms:
the average financial/insurance large firm is 5 times more productive than average large firm in
manufacturing or trade. Labor productivity has increased faster in sectors where employment has also
grown more rapidly. This is the case of transports, professional activities, accommodation, and other
services among small firms. And it is the case of health services, real estate, financial and administrative
services among large firms.
Developing and attracting high skills are key challenges to foster innovation, make growth more
inclusive, and help Mauritius in its journey to high-income status. The analysis of the constraints to
productivity growth shows that Mauritius performs well overall and in certain dimensions as good as the
aspirational peers. Yet, fostering innovation and the introduction of new technologies will allow to position
Mauritius in high value added productions and will be key to complete the transition toward a high-income
economy. This requires an environment conducive to innovation, investments in research and development,
particularly by the private sector, high-quality research institutions that generate basic knowledge,
collaboration between universities and private sector, and protection of intellectual property. Innovation
requires a skilled workforce that Mauritius has not been able to produce or attract. Skills shortage and
mismatch have been indicated by previous studies as the major driver of rising inequality, but they are also
a constraint to productivity growth. On the one hand, a comprehensive assessment of current and future
needs of firms in terms of skills is needed and can help inform education curricula for the coming generation
of workers. Training systems can help those who are already working adapt to the new demands of the
labor market. In addition to upskilling the local workforce, which will be key to make growth more inclusive
going forward, Mauritius will need to attract and retain overseas talent to address the skills mismatch and

73
to move up the value chain in the knowledge economy. Attracting high-skilled foreign talent will require a
more open and flexible immigration policy (with a revision of the occupation permit system) in addition to
competitive salaries. The Mauritian Diaspora could also contribute to mitigate the need for specific skills
or sectors.
The institutional support framework for SMEs encompasses several institutions, does not reach out
potential users effectively, and provide duplicated services. The government has identified SMEs as the
future driver of growth in Mauritius and provides a large number of schemes to support and develop
entrepreneurial activity. However, the existing system is fragmented across several institutional
counterparts and composed of panoply of schemes which fail to cater for the needs of SMEs at different
stages of their development. Different bodies often provide the same support services and this creates a lack
of clarity on part of SMEs. The main obstacle for SMEs remains information asymmetry about such funding
schemes. Overall, the awareness of such schemes is low; only a small proportion of enterprises have used
such services of supporting institutions; and those that have rate the quality of the support low or very low.
There is a need for rationalizing and consolidating existing schemes, possibly bringing them under one
institution, and ensuring adequate communication is provided to potential beneficiaries. In addition, lack
of adequate data and evaluation mechanisms makes it difficult to assess the effectiveness of such schemes.

74
References Hausmann, Ricardo. 2015. “What Are the Challenges of Economic Growth?” Growth Lab, Center for
International Development, Harvard University, Cambridge, MA.
HRDC (Human Resource Development Council). 2012a. A Study on Labour Shortage in the Agricultural
Sector in Mauritius. Ebène Cybercity, Mauritius: HRDC.
———. 2012b. A Study on Labour Shortage in the Financial Intermediation sector in Mauritius. Ebène
Cybercity, Mauritius: HRDC.
———. 2012c. A Study on Labour Shortage in the ICT/BPO sector in Mauritius. Ebène Cybercity,
Mauritius: HRDC.
———. 2012d. A Study on Labour Shortage in the Manufacturing sector in Mauritius. Ebène Cybercity,
Mauritius: HRDC.
———. 2017. Skills Study for the Manufacturing sector. Ebène Cybercity, Mauritius: HRDC.
Ministry of Business, Enterprises and Cooperatives. 2017. The 10 Year Master Plan for the SME sector in
Mauritius. Ministry of Business, Enterprises and Cooperatives.
Organization for Economic Cooperation and Development. 2018. Observer, Paris.
Schwab, Klaus, ed. 2018. Insight Report: The Global Competitiveness Report 2018. Geneva: World
Economic Forum.
http://www3.weforum.org/docs/GCR2018/05FullReport/TheGlobalCompetitivenessReport2018.pdf.
Statistics Mauritius. 2009. CENSUS OF ECONOMIC ACTIVITIES - 2007, PHASE I – Small
Establishments, June.
———. 2011. CENSUS OF ECONOMIC ACTIVITIES - 2007, PHASE II – Large Establishments,
February.
———. 2015. CENSUS OF ECONOMIC ACTIVITIES - 2013, PHASE I – Small Establishments,
September.
———. 2017. CENSUS OF ECONOMIC ACTIVITIES - 2013, PHASE II – Large Establishments, May.
———. 2018a. Digest of Labor Statistics 2017, Port-Louis.
———. 2018b. Productivity and Competitiveness Indicators 2018, Port-Louis.
World Bank. 2015. Systematic Country Diagnostic, Washington DC.
———. 2017. “Mauritius: Addressing Inequality through More Equitable Labor Markets.” World Bank,
Washington, DC.
———. 2018. Malaysia Productivity unplugged, Washington DC.

75
Annex A: Data Sources Census of Economic Activities
Statistics Mauritius carried out the first census of production in 1964. However, this first exercise together
with the one carried out in 1968 was restricted to the manufacturing sector. The following one, known as
the Census of Economic Activities (CEA), was conducted only 17 years later in 1985 and covered all sectors
except agriculture. Since 1992, the CEA is being carried out every five years: the third CEA in 1997, then
again in 2002, 2007, and 2013. The 2018 CEA is currently in the field.
The main objective of the CEA is to collect statistics on the characteristics and structure of all types of
operating economic activities, except agriculture, undertaken in the Republic of Mauritius. The CEAs are
conducted in two phases. The first phase, which lasts from January to December, covers small
nonagricultural establishments and itinerant units, engaging less than 10 workers. Data are collected by
direct interviews from a representative sample of ‘small’ units. The second phase targets ‘large’
establishments and is typically carried out for about 10 to 12 months starting in July of the year following
the data collection activities for `small’ establishments (Table 1).
The unit of enquiry, known as the production unit, is either the establishment or the owner/proprietor of an
itinerant unit. An establishment is defined as a production unit engaged in one kind, or predominantly one
kind of activity at a fixed physical location.14 An itinerant unit refers to a mobile production unit that does
not operate at a fixed location.15
The response rate for the last two CEAs of large establishments are at 42 and 38 percent in 2007 and 2013,
respectively. Respondents cover 55 and 50 percent of large establishments’ total employment as well as 57
ad 56 percent in terms of large establishments’ total gross output in 2007 and 2013, respectively.
Large establishments usually have different accounting periods. Although the reference period is the
calendar year (2007 and 2013), respondents are allowed to provide data according to their accounting
period, which could be any 12-months period between July and June.
Unlike small establishments, which were requested to record their monthly transactions in a diary, data are
collected from large establishments through mail questionnaires, since they are usually well-structured and
keep records of their transactions.16
14 Many large firms could not provide separate data on an establishment basis, as their accounts are prepared at the
enterprise level. Such multi-establishment units were classified in the industrial group of their main activity,
determined by the product or service which accounted for the largest share of their turnover. 15 The target population excludes: (a) Agricultural activities: These activities have not been covered as different
methodologies and measurement techniques are needed in the collection and compilation of data for the agricultural
sector compared to the other sectors.
(b) Domestic services: These services cannot be appropriately covered by an establishment survey.
(c) Illegal transactions such as drug trafficking: These activities are difficult to
measure. 16 In case of low response rate at the date limit fixed for end of November, two reminders are sent during the following
two months. Thereafter, field visits are organized and intensified during the period March to June for contacting
nonrespondents as well as for settling queries.

76
Table A 1: Census of Economic Activities – Data Collection Dates
Year CEA Data Collection Dates Target Population
2002 CEA January 2002 – June 2004
Small Establishments January – December 2002 3,200
Large Establishments July 2003 – June 2004 2,109
2007 CEA January 2007 – April 2009
Small Establishments January – December 2007 3,400
Large Establishments July 2008 – April 2009 2,337
2013 CEA January 2013 – April 2015
Small Establishments January – December 2013 3,626
Large Establishments July 2014 – April 2015 2,400
Source: Statistics Mauritius 2009, 2011, 2015, 2017.
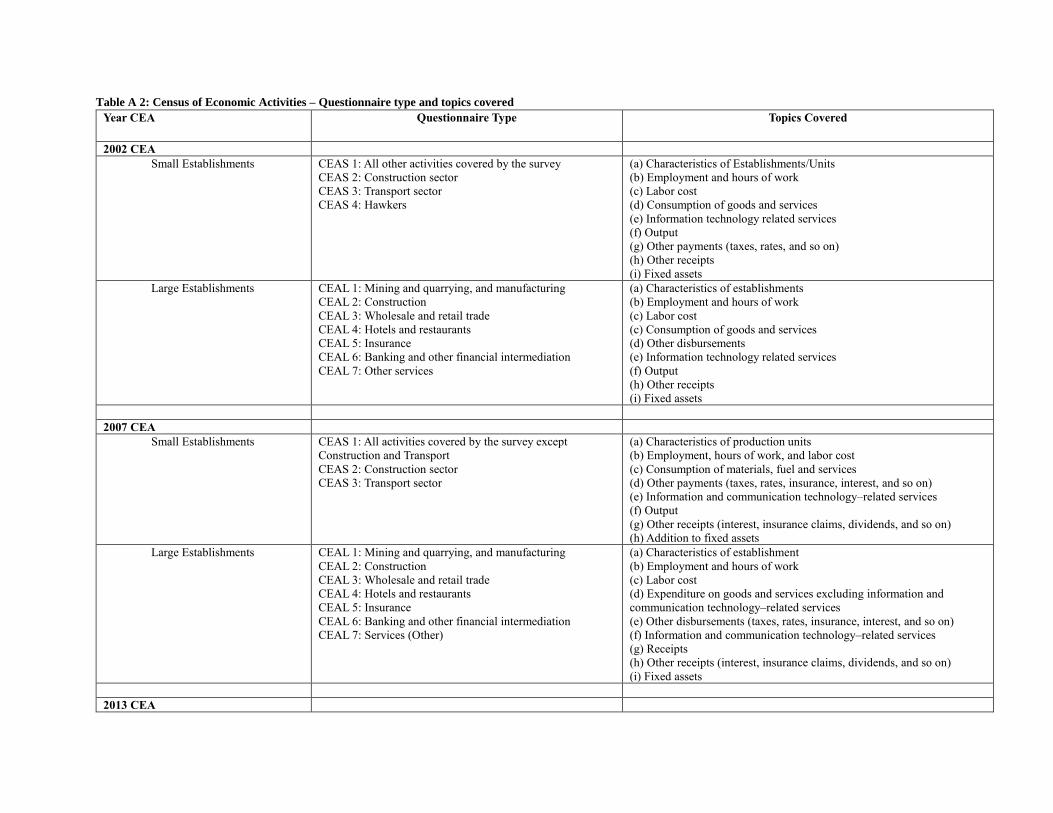
Table A 2: Census of Economic Activities – Questionnaire type and topics covered
Year CEA Questionnaire Type Topics Covered
2002 CEA
Small Establishments CEAS 1: All other activities covered by the survey
CEAS 2: Construction sector
CEAS 3: Transport sector
CEAS 4: Hawkers
(a) Characteristics of Establishments/Units
(b) Employment and hours of work
(c) Labor cost
(d) Consumption of goods and services
(e) Information technology related services
(f) Output
(g) Other payments (taxes, rates, and so on)
(h) Other receipts
(i) Fixed assets
Large Establishments CEAL 1: Mining and quarrying, and manufacturing
CEAL 2: Construction
CEAL 3: Wholesale and retail trade
CEAL 4: Hotels and restaurants
CEAL 5: Insurance
CEAL 6: Banking and other financial intermediation
CEAL 7: Other services
(a) Characteristics of establishments
(b) Employment and hours of work
(c) Labor cost
(c) Consumption of goods and services
(d) Other disbursements
(e) Information technology related services
(f) Output
(h) Other receipts
(i) Fixed assets
2007 CEA
Small Establishments CEAS 1: All activities covered by the survey except
Construction and Transport
CEAS 2: Construction sector
CEAS 3: Transport sector
(a) Characteristics of production units
(b) Employment, hours of work, and labor cost
(c) Consumption of materials, fuel and services
(d) Other payments (taxes, rates, insurance, interest, and so on)
(e) Information and communication technology–related services
(f) Output
(g) Other receipts (interest, insurance claims, dividends, and so on)
(h) Addition to fixed assets
Large Establishments CEAL 1: Mining and quarrying, and manufacturing
CEAL 2: Construction
CEAL 3: Wholesale and retail trade
CEAL 4: Hotels and restaurants
CEAL 5: Insurance
CEAL 6: Banking and other financial intermediation
CEAL 7: Services (Other)
(a) Characteristics of establishment
(b) Employment and hours of work
(c) Labor cost
(d) Expenditure on goods and services excluding information and
communication technology–related services
(e) Other disbursements (taxes, rates, insurance, interest, and so on)
(f) Information and communication technology–related services
(g) Receipts
(h) Other receipts (interest, insurance claims, dividends, and so on)
(i) Fixed assets
2013 CEA

Small Establishments CEAS 1: All activities covered by the survey except
Construction and Transport
CEAS 2: Construction sector
CEAS 3: Land transport sector
(a) Characteristics of production units
(b) Employment, hours of work, and labor cost
(c) Consumption of materials, fuel and services
(d) Other payments (taxes, insurance, interest, and so on)
(e) Expenses on purchases of hardware and software equipment
(f) Output
(g) Other receipts (interest, insurance claims, dividends, and so on)
(h) Capital assets
(i) Energy and water use and savings, measures and environment
protection measures.
Large Establishments CEAL 1: Manufacturing
CEAL 2: Construction
CEAL 3: Wholesale and retail trade
CEAL 4: Hotels and restaurants
CEAL 5: Banking and other financial intermediation
CEAL 6: Insurance
CEAL 7: Pension funding
CEAL 8: Other Services
(a) Characteristics of establishment
(b) Employment and labor cost
(c) Expenditure on goods and services
(d) Other disbursements
(e) Receipts
(g) Capital assets
(i) Miscellaneous (debt repayment and outstanding debt; foreign assets
and liabilities, whether associated to or incorporated to global business;
energy and water use and saving measures; and environment protection
measures)
Source: Statistics Mauritius 2009, 2011, 2015, 201

Additional Data Sources
Table A 3: Additional Sources of Data
World Governance Indicators – World
Bank
The WGI consists of six composite indicators of broad dimensions of governance covering over 200 countries since 1996: Voice and accountability,
political stability and absence of violence/terrorism, government effectiveness, regulatory quality, rule of law, and control of corruption. These
indicators are based on several hundred variables obtained from 31 different data sources, capturing governance perceptions as reported by survey respondents, nongovernmental organizations, commercial business information providers, and public sector organizations worldwide.
Global Competitiveness Index – World
Economic Forum
A countries’ competitiveness is separated into 12 distinct areas, or pillars, which we group into three subindexes. These are “basic requirements”
which comprise institutions, infrastructure, macroeconomic environment and health and primary education. These are basic because these pillars
tend to be those that countries at earlier stages of development tackle first. Next comes the efficiency enhancers subindex. Essentially we’re looking
at markets – whether it is the functioning of goods, labor or financial markets – but we also consider higher education and training, and technological
readiness, which measures how well economies are prepared for the transition into more advanced, knowledge-based economies. Our last pillar,
innovation and sophistication, consists of two pillars: business sophistication and innovation. These are more complex areas of competitiveness that require an economy to be able to draw on world-class businesses and research establishments, as well as an innovative, supportive government.
Countries that score highly in these pillars tend to be advanced economies with high gross domestic product per capita.
Doing Business - World Bank The Doing Business project provides objective measures of business regulations and their enforcement across 190 economies and selected cities at the subnational and regional level. The Doing Business project looks at domestic SMEs and measures the regulations applying to them through their
life cycle. Doing Business measures regulations affecting 11 areas of the life of a business. Ten of these areas are included in the most recent ranking
on the ease of doing business: starting a business, dealing with construction permits, getting electricity, registering property, getting credit, protecting minority investors, paying taxes, trading across borders, enforcing contracts and resolving insolvency. Doing Business also measures labor market
regulation, which is not included in the most recent ranking.

Annex B: A Review of the Quality of Institutions Supporting SMEs The 10-year master plan was developed by a private company, Empretec Mauritius under close supervision
of the Ministry of Business, Enterprise and Cooperatives. Empretec conducted national survey with 73
different questions. The sample was designed to cover all major sectors of the economy and was designed
to represent formal and informal enterprises. The response rate was 91.1 percent and in total 410 enterprises
participated.
The survey questionnaire included questions to evaluate the performance of the institutions intended to
support enterprises in Mauritius. Enterprises were asked whether they are aware of the existence of each
institution and they were asked whether they have used a service of that institution. Overall, the awareness
is low. Only every second enterprise knows the Board of Investment and the Small and Medium Enterprises
Development Authority and only every third knows about Enterprise Mauritius. The National Institute for
Cooperative Entrepreneurship, the National Productivity and Competitiveness Council and the National
Woman Entrepreneur Council are only known by every fourth or fifth enterprise.
Only a small proportion of the surveyed enterprises have actually used a service of the supporting
institutions. The Small and Medium Enterprises Development Authority is not only the most known
institution but also that provided most services. 22 percent of the enterprises used a service provided by the
authority. Each of the other institutes provided was only used by less than 10 percent of the other enterprises.
Those enterprises that used a service were asked to rate the service on a scale from 1 to 5, where 1 is
substandard and 5 is excellent. The services of the Board of Investment, the Small and Medium Enterprises
Development Authority, and Enterprise Mauritius were rated poorly, at 3. The National Institute for
Cooperative Entrepreneurship, the National Productivity and Competitiveness Council, and the National
Woman Entrepreneur Council received scores of 2.

81
Figure B 1. Evaluation of the Board of Investment, Institutional Effectiveness
Source: 10 Year Master Plan for The SME Sector in Mauritius, Ministry of Business, Enterprise and Cooperatives.
Figure B 2. Evaluation of Enterprise Mauritius (not existent anymore)
Source: 10 Year Master Plan for The SME Sector in Mauritius, Ministry of Business, Enterprise and Cooperatives.

82
Figure B 3. Evaluation: the Small and Medium Enterprises Development Authority and MyBiz (now SME Mauritius Ltd.)
Source: 10 Year Master Plan for The SME Sector in Mauritius, Ministry of Business, Enterprise and Cooperatives.
Figure B 4. Evaluation of National Institute for Cooperative Entrepreneurship
Source: 10 Year Master Plan for The SME Sector in Mauritius, Ministry of Business, Enterprise and Cooperatives.

83
Figure B 5. Evaluation of National Productivity and Competitiveness Council
Source: 10 Year Master Plan for The SME Sector in Mauritius, Ministry of Business, Enterprise and Cooperatives.
Figure B 6. Evaluation of National Woman Entrepreneur Council
Source: 10 Year Master Plan for The SME Sector in Mauritius, Ministry of Business, Enterprise and Cooperatives.

84
Annex C: Statistical Annex
Figure C 1. Annual changes in value added and employment by establishment size and sector, 2002-07 and 2007-13
a. Small establishments, 2002-07 b. Small establishments, 2007-13
c. Large establishments, 2007-13 d. Large establishments, 2007-13
Source: Based on data of the Census of Economic Activities, Statistics Mauritius.
Note: The size of bubble reflects the employment size of each sector in 2013. Sectors located above the 45-degree line experience
an increase in labor productivity, those below the diagonal post a decline in productivity. Other Secondary sector is excluded
from panel (a) for visual purposes.

85
Table C 1. Employment growth, absolute and relative, 2007-2013
Growing
Firms
Static Firms Shrinking
Firms
Mean
Difference
Sector
Manufacturing food 0.05 0.00 0.03 0.02
Manufacturing textiles 0.04 0.00 0.08 -0.04*
Manufacturing other 0.06 0.01 0.05 0.01
Construction 0.01 0.00 0.01 0
Other secondary 0.01 0.00 0.01 0
Wholesale & retail trade 0.12 0.00 0.05 0.07***
Transport 0.03 0.00 0.01 0.02
Accommodation 0.01 0.01 0.04 -0.03**
Finance/real estate 0.10 0.00 0.02 0.08***
Professional activities 0.01 0.00 0.02 -0.01
Administrative services 0.04 0.00 0.00 0.04***
Health 0.04 0.00 0.02 0.02*
Education 0.02 0.00 0.01 0.01
Other services 0.02 0.00 0.03 -0.01
Employment Category
10-19 0.11 0.03 0.06 0.05**
20-49 0.13 0.01 0.12 0.02
50-99 0.14 0.00 0.09 0.05*
100-499 0.15 0.00 0.10 0.05*
500+ 0.03 0.00 0.03 0
Export Orientation
Export Oriented (Manufacturing) 0.05 0.00 0.07 -0.02
Not Export Oriented (Manufacturing) 0.11 0.01 0.10 0
Other Sectors 0.41 0.02 0.22 0.19***
Source: Based on data of the Census of Economic Activities (CEA), Statistics Mauritius.

86
Table C 2. Surviving Large Firms Mauritius, OLS Employment Growth, 2007-2013
Setting I Setting II Setting III
Employment Category
10-19 - - -
20-49 -0.148 -0.133 -0.137 (0.213) (0.212) (0.212)
50-99 -0.186 -0.171 -0.177 (0.198) (0.197) (0.198)
100-499 -0.204 -0.182 -0.193 (0.187) (0.186) (0.187)
500+ -0.223 -0.187 -0.197 (0.188) (0.187) (0.189)
Export Orientation
Export Oriented (Manufacturing) - - -
Not Export Oriented
(Manufacturing)
0.140 0.122 0.124
(0.0907) (0.0905) (0.0911)
Others 0.293*** 0.241*** 0.579 (0.0611) (0.0652) (0.463)
Ownership
Foreign owned - - -
Joint Mauritian and foreign -0.391*** -0.427*** -0.428*** (0.0999) (0.101) (0.101)
Mauritian owned -0.448*** -0.466*** -0.466*** (0.0833) (0.0832) (0.0834)
Innovation
No Internet Access - - -
Internet Access 0.129* 0.119* 0.115* -0.0691 -0.0688 -0.0693
Debt Status
No Debt - - -
Positive Debt -0.00563 -0.0226 -0.0256 (0.0519) (0.0521) (0.0529)
Constant 0.426** 0.412** 0.424** (0.200) (0.199) (0.200)
Dummies Organizational Form Yes Yes Yes
Dummies District No Yes Yes
Dummies Industry No No Yes
Observations 292 292 292
R-squared 0.204 0.217 0.218
Standard errors in parentheses, *** p<0.01, ** p<0.05, * p<0.1
Note: Dependent, Continuous Growth rate following Davis-Haltiwanger-
Schuh, weighted by initial employment in 2007, Organizational Form three
categories (Company, Individual Proprietor, Other), District (Port Louis vs
Others), Industry (Manufacturing, Other Secondary, Retail, Other Services))
Source: Based on data of the Census of Economic Activities (CEA), Statistics Mauritius.