jkh interim september 2014.pdf
TRANSCRIPT
John Keells Holdings PLC l Six months ended 30th September 2014Interim condensed financial statements
Integrated

“When the architect of the Waterfront Integrated Resort Cecil Balmond first visited the site, he visualised a property that represented the vigour of John Keells Holdings and the spirit of a new Sri Lanka. His first impression, on the left, transformed over the next few months into an iconic structure that stands majestic against the Colombo skyline, as shown in the artist’s impressions above.”
“For a growing major city and its main building project, an icon has to stamp a contemporary mark that projects to the future. The strong backdrop and cantilever forms of the Waterfront Integrated Resort provide that dynamic and powerful ambition, that JKH and Sri Lanka subscribe to.”
- Cecil Balmond
1 l John Keells Holdings PLC l www.keells.com Interim condensed financial statements l 1
Chairman’s Message Financial Information
Chairman’s Message
Dear Stakeholder,
The Group profit before tax (PBT) at Rs.3.68 billion in the second quarter of the financial year 2014/15 was an increase of 39 per cent over the Rs.2.65 billion recorded in the corresponding period of the previous financial year. The cumulative PBT for the first half of the financial year 2014/15 at Rs.6.74 billion was an increase of 39 per cent over the PBT of Rs.4.85 billion recorded in the same period of the previous financial year.
The profit attributable to equity holders for the second quarter at Rs.2.65 billion reflects an increase of 29 per cent over the previous year, while the first half performance at Rs.4.79 billion reflects an increase of 32 per cent over the corresponding period of the previous financial year.
The revenue at Rs.22.16 billion in the second quarter of the financial year 2014/15 was an increase of 6 per cent over the Rs.20.88 billion recorded in the second quarter of the previous financial year. The cumulative revenue for the first half of the financial year 2014/15 at Rs.43.45 billion was an increase of 7 per cent over the revenue of Rs.40.73 billion recorded in the same period of the previous financial year.
The Company PBT for the second quarter of the financial year 2014/15 at Rs.1.09 billion was an increase of 481 per cent over the PBT of Rs.188 million recorded during the same period last year, while the PBT for the first half of the financial year at Rs.4.06 billion was an increase of 65 per cent over the previous financial year.
The Land (Restrictions on Alienation) Act recently passed by Parliament poses several challenges to business in general. Impacts to the Group, if any will be assessed once the specifics in the Act are interpreted and understood.
TransportationThe Transportation industry group PBT of Rs.589 million in the second quarter of 2014/15 was a decrease of 21 per cent over the second quarter of the previous financial year [2013/14 Q2: Rs.745 million]. The decline in profitability is mainly attributable to the lower contribution from the Bunkering business, where, in spite of maintaining market share, margins contracted on account of an increasingly competitive operating environment. The performance of the Port business was in line with expectations, as volumes stabilised and the continuous focus on cost management further contributed towards profitability. DHL Keells witnessed an improvement in its performance aided by the continued growth in its active customer base.
Leisure The Leisure industry group PBT of Rs.1.15 billion in the second quarter of 2014/15 was a marginal increase over the second quarter of the previous financial year [2013/14 Q2: Rs.1.14 billion]. The associate, ‘Cinnamon Red’, a select service business hotel, commenced operations during the quarter under review and has recorded encouraging occupancies to date. The Sri Lankan Resorts sector witnessed an increase in occupancies, aided by the growth in tourist arrivals, whilst higher average room rates and successful management of costs further strengthened profitability. The performance of the City Hotel sector was negatively impacted during the quarter under review on account of lower volumes generated primarily through the corporate and MICE segments. The performance of the Destination Management business was in line with expectations primarily driven by a significant improvement in volumes generated from China which was augmented by the commencement of a weekly charter.
Property The Property industry group PBT of Rs.341 million in the second quarter of 2014/15 was a significant increase over the second quarter of the previous financial year [2013/14 Q2: Negative Rs.45 million]. The improved performance was mainly on account of higher revenue recognition at the ‘OnThree20’ and ‘7th Sense’ on Gregory’s Road residential apartment projects, which have sold 96 per cent and 83 per cent of apartment units to date respectively. Construction of the ‘Waterfront Project’ is in progress with demand for both the residential and commercial spaces continuing to be promising.
Consumer Foods and Retail The Consumer Foods and Retail industry group PBT of Rs.496 million in the second quarter of 2014/15 was an increase of 96 per cent over the second quarter of the previous financial year [2013/14 Q2: Rs.253 million]. Both the Frozen Confectionary and Beverage businesses benefited as a result of a growth in volumes emanating from the improving consumer sentiment and an evolving product portfolio. Keells Food Products recorded a growth in volumes compared to the second quarter of the previous financial year with its performance being in line with expectations. The Retail sector recorded a significant improvement in performance as it continued to benefit from year-on-year growth in same store sales due to a notable increase in footfall.
Financial Services The Financial Services industry group PBT of Rs.460 million in the second quarter of 2014/15 was an increase
2 l John Keells Holdings PLC l www.keells.com
Chairman’s Message
of 51 per cent over the second quarter of the previous financial year [2013/14 Q2: Rs.305 million]. Nations Trust Bank was the primary contributor to the improved performance as it benefited from a marginal pick up in credit volumes coupled with an increased focus on operational cost management and investment in IT infrastructure. The performance of the Insurance business was in line with expectations. The life business maintained its market share while the general business focused on managing underwriting results in an increasingly competitive industry coupled with a low interest rate environment. The Stock Broking business recorded strong results in the quarter under review driven by the higher revenue on account of the improved daily market turnover levels and the execution of a few large transactions.
Information Technology The Information Technology industry group PBT of Rs.112 million in the second quarter of 2014/15 was an increase of 162 per cent over the second quarter of the previous financial year [2013/14 Q2: Rs.43 million]. The improved performance was driven by the Office Automation business and the Software Services business, which realised a gain of Rs.41 million on the sale of its hotel reservation software ‘Zhara HS’. The Office Automation business benefited from the growing demand for smart phones, whilst greater emphasis on managing margins further enhanced profitability. Growth from existing clients had a positive impact on the Group’s Business Process Outsourcing (BPO) operations.
Other, Including PlantationsOther, including Plantation Services and the Corporate Centre recorded a PBT of Rs.531 million in the second quarter of 2014/15, which was an increase of 154 per cent over the second quarter of the previous financial year [2013/14: Rs.209 million]. The improved performance is mainly on account of an increase in the finance income.
Sustainability InitiativesThe Group’s carbon footprint increased marginally in the quarter under review to an estimated 19,065MT from 18,889 MT in the corresponding quarter last year, with the volume of water withdrawn during the quarter increasing by approximately 5 per cent to 450,560 cubic meters. This is largely due to increases in operational activity in the Consumer Foods and Retail industry group. However the carbon footprint per million rupees of revenue reduced by 4 per cent to 0.86 MT, while the water withdrawn per million rupees of revenue reduced by 1 per cent to 20.33 cubic meters. In addition, total waste generated by the Group reduced by 2 per cent to an estimated 1,968 MT.
Occupational injuries were recorded at 48 incidences during the quarter, while the total number of training hours provided to Group employees was approximately 92,925 hours, amounting to approximately 7 hours of training per employee in the quarter.
Corporate Social Responsibility The pre-intermediate and intermediate level courses of the John Keells English Language Scholarship Programme 2014/15 commenced during the quarter under review, attracting over 400 registrations. Two new initiatives `English for Pre-Teens’ and `English for Youth’ were inaugurated during the quarter at the Ratmalana School for the Deaf, aimed at enhancing educational opportunities and social integration of hearing impaired children and youth.
Under the Neighbourhood Schools Development Project, a 6-month vocational training programme commenced at the city hotels and supermarkets. Meanwhile, the school development programme was extended to include three additional disadvantaged schools in Colombo, for which prioritised water and sanitation needs were completed.
During the quarter under review, merit and need based scholarships were awarded under the English Immersion Programme to the students at the Transport and Logistics Management faculty of the University of Moratuwa, while the mentoring programme, open for all undergraduate students in the faculty was also initiated.
During the quarter under review, a total of 4,962 persons were educated under the John Keells HIV and AIDS Awareness Campaign. The John Keells Vision Project conducted 7 eye camps, resulting in 433 registered patients and a total of 386 cataract operations.
Under the Village Adoption Programme, a stock of fishing equipment and seedlings were provided as livelihood support to deserving villagers in the Trincomalee district.
During the quarter, the John Keells Foundation initiated a new programme, ‘Project WAVE’ (Working Against Violence through Education), which is aimed at combatting gender based violence and child abuse.
Susantha RatnayakeChairman
04 November 2014
Chairman’s Message Financial Information
2 l John Keells Holdings PLC l www.keells.com Interim condensed financial statements l 3
Consolidated Income Statement
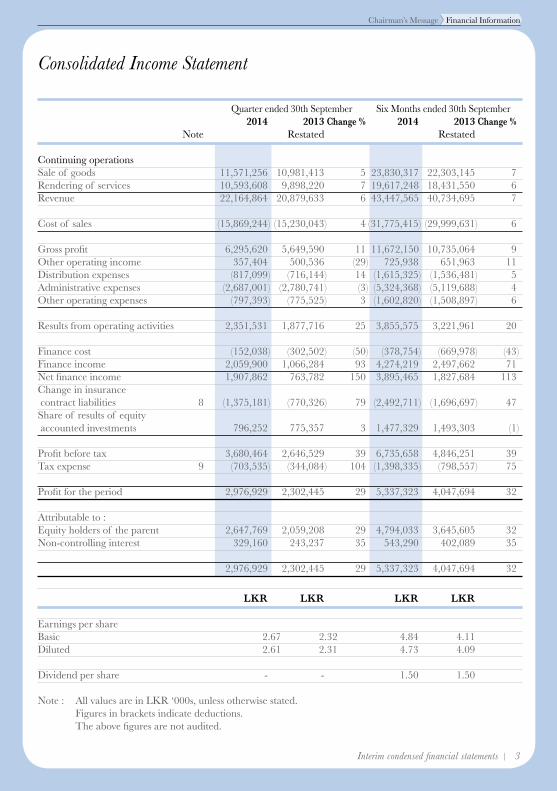
Quarter ended 30th September Six Months ended 30th September 2014 2013 Change % 2014 2013 Change % Note Restated Restated Continuing operations Sale of goods 11,571,256 10,981,413 5 23,830,317 22,303,145 7 Rendering of services 10,593,608 9,898,220 7 19,617,248 18,431,550 6 Revenue 22,164,864 20,879,633 6 43,447,565 40,734,695 7 Cost of sales (15,869,244) (15,230,043) 4 (31,775,415) (29,999,631) 6 Gross profit 6,295,620 5,649,590 11 11,672,150 10,735,064 9 Other operating income 357,404 500,536 (29) 725,938 651,963 11 Distribution expenses (817,099) (716,144) 14 (1,615,325) (1,536,481) 5 Administrative expenses (2,687,001) (2,780,741) (3) (5,324,368) (5,119,688) 4 Other operating expenses (797,393) (775,525) 3 (1,602,820) (1,508,897) 6 Results from operating activities 2,351,531 1,877,716 25 3,855,575 3,221,961 20 Finance cost (152,038) (302,502) (50) (378,754) (669,978) (43)Finance income 2,059,900 1,066,284 93 4,274,219 2,497,662 71 Net finance income 1,907,862 763,782 150 3,895,465 1,827,684 113 Change in insurance contract liabilities 8 (1,375,181) (770,326) 79 (2,492,711) (1,696,697) 47 Share of results of equity accounted investments 796,252 775,357 3 1,477,329 1,493,303 (1) Profit before tax 3,680,464 2,646,529 39 6,735,658 4,846,251 39 Tax expense 9 (703,535) (344,084) 104 (1,398,335) (798,557) 75 Profit for the period 2,976,929 2,302,445 29 5,337,323 4,047,694 32 Attributable to : Equity holders of the parent 2,647,769 2,059,208 29 4,794,033 3,645,605 32 Non-controlling interest 329,160 243,237 35 543,290 402,089 35 2,976,929 2,302,445 29 5,337,323 4,047,694 32
LKR LKR LKR LKR
Earnings per share Basic 2.67 2.32 4.84 4.11 Diluted 2.61 2.31 4.73 4.09 Dividend per share - - 1.50 1.50
Note : All values are in LKR ‘000s, unless otherwise stated. Figures in brackets indicate deductions. The above figures are not audited.
4 l John Keells Holdings PLC l www.keells.com
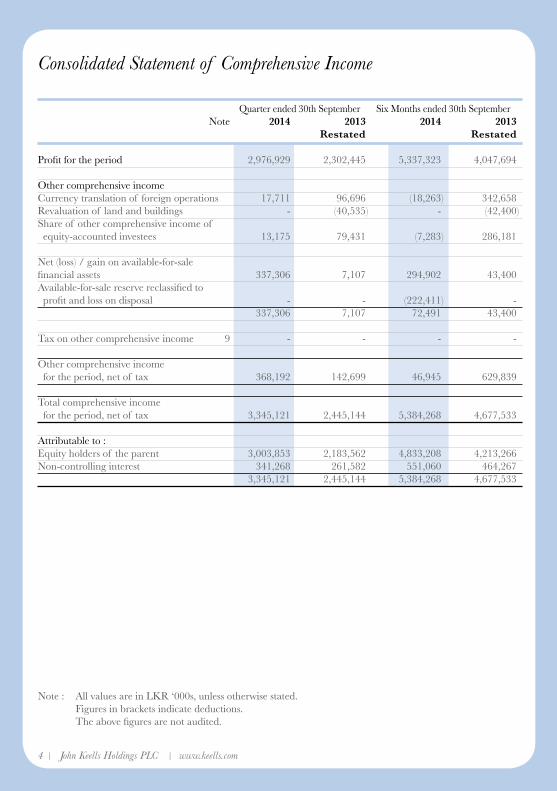
Consolidated Statement of Comprehensive Income
Quarter ended 30th September Six Months ended 30th September Note 2014 2013 2014 2013 Restated Restated Profit for the period 2,976,929 2,302,445 5,337,323 4,047,694 Other comprehensive income Currency translation of foreign operations 17,711 96,696 (18,263) 342,658 Revaluation of land and buildings - (40,535) - (42,400)Share of other comprehensive income of equity-accounted investees 13,175 79,431 (7,283) 286,181 Net (loss) / gain on available-for-sale financial assets 337,306 7,107 294,902 43,400 Available-for-sale reserve reclassified to profit and loss on disposal - - (222,411) - 337,306 7,107 72,491 43,400 Tax on other comprehensive income 9 - - - - Other comprehensive income for the period, net of tax 368,192 142,699 46,945 629,839 Total comprehensive income for the period, net of tax 3,345,121 2,445,144 5,384,268 4,677,533 Attributable to : Equity holders of the parent 3,003,853 2,183,562 4,833,208 4,213,266 Non-controlling interest 341,268 261,582 551,060 464,267 3,345,121 2,445,144 5,384,268 4,677,533
Note : All values are in LKR ‘000s, unless otherwise stated. Figures in brackets indicate deductions. The above figures are not audited.
Chairman’s Message Financial Information
4 l John Keells Holdings PLC l www.keells.com Interim condensed financial statements l 5
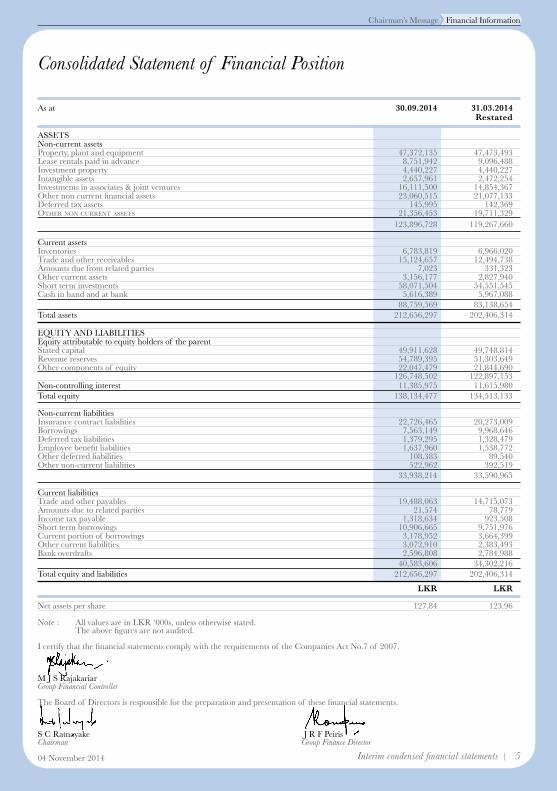
Consolidated Statement of Financial Position
As at 30.09.2014 31.03.2014 Restated ASSETS Non-current assets Property, plant and equipment 47,372,135 47,473,493 Lease rentals paid in advance 8,751,942 9,096,488 Investment property 4,440,227 4,440,227 Intangible assets 2,657,961 2,472,254 Investments in associates & joint ventures 16,111,500 14,854,367 Other non current financial assets 23,060,515 21,077,133 Deferred tax assets 145,995 142,369 Other nOn current assets 21,356,453 19,711,329 123,896,728 119,267,660
Current assets Inventories 6,783,819 6,966,020 Trade and other receivables 15,124,657 12,494,738 Amounts due from related parties 7,023 331,323 Other current assets 3,156,177 2,827,940 Short term investments 58,071,504 54,551,545 Cash in hand and at bank 5,616,389 5,967,088 88,759,569 83,138,654 Total assets 212,656,297 202,406,314 EQUITY AND LIABILITIES Equity attributable to equity holders of the parent Stated capital 49,911,628 49,748,814 Revenue reserves 54,789,395 51,303,649 Other components of equity 22,047,479 21,844,690 126,748,502 122,897,153 Non-controlling interest 11,385,975 11,615,980 Total equity 138,134,477 134,513,133
Non-current liabilities Insurance contract liabilities 22,726,465 20,273,009 Borrowings 7,563,149 9,968,646 Deferred tax liabilities 1,379,295 1,328,479 Employee benefit liabilities 1,637,960 1,538,772 Other deferred liabilities 108,383 89,540 Other non-current liabilities 522,962 392,519 33,938,214 33,590,965
Current liabilities Trade and other payables 19,488,063 14,715,073 Amounts due to related parties 21,574 78,779 Income tax payable 1,318,634 923,508 Short term borrowings 10,906,665 9,751,976 Current portion of borrowings 3,178,952 3,664,399 Other current liabilities 3,072,910 2,383,493 Bank overdrafts 2,596,808 2,784,988 40,583,606 34,302,216 Total equity and liabilities 212,656,297 202,406,314
LKR LKR
Net assets per share 127.84 123.96 Note : All values are in LKR ‘000s, unless otherwise stated. The above figures are not audited. I certify that the financial statements comply with the requirements of the Companies Act No.7 of 2007.
M J S Rajakariar Group Financial Controller The Board of Directors is responsible for the preparation and presentation of these financial statements.
S C Ratnayake J R F Peiris Chairman Group Finance Director 04 November 2014
6 l John Keells Holdings PLC l www.keells.com
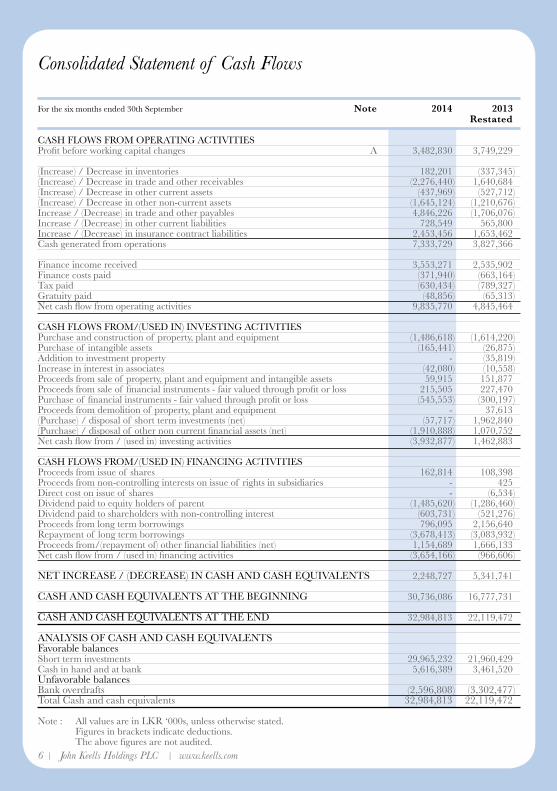
Consolidated Statement of Cash Flows
For the six months ended 30th September Note 2014 2013 Restated CASH FLOWS FROM OPERATING ACTIVITIES Profit before working capital changes A 3,482,830 3,749,229 (Increase) / Decrease in inventories 182,201 (337,345)(Increase) / Decrease in trade and other receivables (2,276,440) 1,640,684 (Increase) / Decrease in other current assets (437,969) (527,712)(Increase) / Decrease in other non-current assets (1,645,124) (1,210,676)Increase / (Decrease) in trade and other payables 4,846,226 (1,706,076)Increase / (Decrease) in other current liabilities 728,549 565,800 Increase / (Decrease) in insurance contract liabilities 2,453,456 1,653,462 Cash generated from operations 7,333,729 3,827,366 Finance income received 3,553,271 2,535,902 Finance costs paid (371,940) (663,164)Tax paid (630,434) (789,327)Gratuity paid (48,856) (65,313)Net cash flow from operating activities 9,835,770 4,845,464 CASH FLOWS FROM/(USED IN) INVESTING ACTIVITIES Purchase and construction of property, plant and equipment (1,486,618) (1,614,220)Purchase of intangible assets (165,441) (26,875)Addition to investment property - (35,819)Increase in interest in associates (42,080) (10,558)Proceeds from sale of property, plant and equipment and intangible assets 59,915 151,877 Proceeds from sale of financial instruments - fair valued through profit or loss 215,505 227,470 Purchase of financial instruments - fair valued through profit or loss (545,553) (300,197) Proceeds from demolition of property, plant and equipment - 37,613(Purchase) / disposal of short term investments (net) (57,717) 1,962,840 (Purchase) / disposal of other non current financial assets (net) (1,910,888) 1,070,752 Net cash flow from / (used in) investing activities (3,932,877) 1,462,883 CASH FLOWS FROM/(USED IN) FINANCING ACTIVITIES Proceeds from issue of shares 162,814 108,398 Proceeds from non-controlling interests on issue of rights in subsidiaries - 425Direct cost on issue of shares - (6,534)Dividend paid to equity holders of parent (1,485,620) (1,286,460)Dividend paid to shareholders with non-controlling interest (603,731) (521,276)Proceeds from long term borrowings 796,095 2,156,640 Repayment of long term borrowings (3,678,413) (3,083,932)Proceeds from/(repayment of) other financial liabilities (net) 1,154,689 1,666,133 Net cash flow from / (used in) financing activities (3,654,166) (966,606) NET INCREASE / (DECREASE) IN CASH AND CASH EQUIVALENTS 2,248,727 5,341,741 CASH AND CASH EQUIVALENTS AT THE BEGINNING 30,736,086 16,777,731 CASH AND CASH EQUIVALENTS AT THE END 32,984,813 22,119,472 ANALYSIS OF CASH AND CASH EQUIVALENTS Favorable balances Short term investments 29,965,232 21,960,429 Cash in hand and at bank 5,616,389 3,461,520 Unfavorable balances Bank overdrafts (2,596,808) (3,302,477)Total Cash and cash equivalents 32,984,813 22,119,472 Note : All values are in LKR ‘000s, unless otherwise stated. Figures in brackets indicate deductions. The above figures are not audited.
Chairman’s Message Financial Information
6 l John Keells Holdings PLC l www.keells.com Interim condensed financial statements l 7
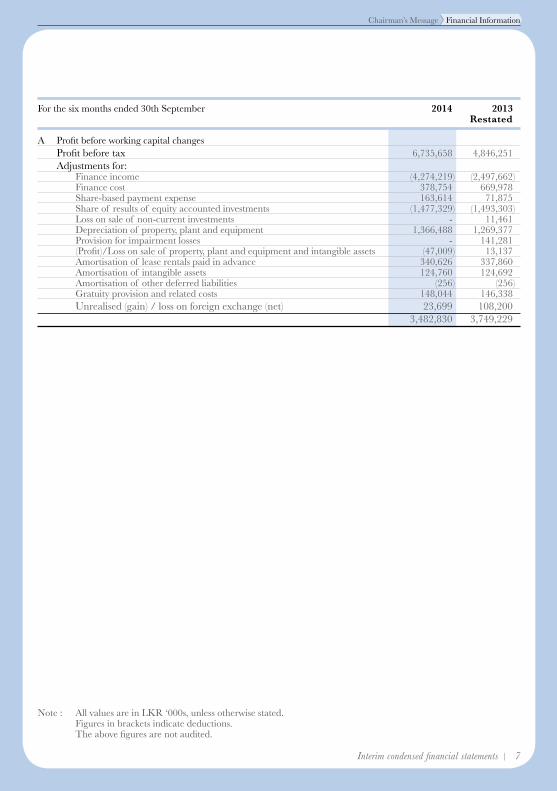
For the six months ended 30th September 2014 2013 Restated A Profit before working capital changes Profit before tax 6,735,658 4,846,251 Adjustments for: Finance income (4,274,219) (2,497,662) Finance cost 378,754 669,978 Share-based payment expense 163,614 71,875 Share of results of equity accounted investments (1,477,329) (1,493,303) Loss on sale of non-current investments - 11,461 Depreciation of property, plant and equipment 1,366,488 1,269,377 Provision for impairment losses - 141,281 (Profit)/Loss on sale of property, plant and equipment and intangible assets (47,009) 13,137 Amortisation of lease rentals paid in advance 340,626 337,860 Amortisation of intangible assets 124,760 124,692 Amortisation of other deferred liabilities (256) (256) Gratuity provision and related costs 148,044 146,338 Unrealised (gain) / loss on foreign exchange (net) 23,699 108,200 3,482,830 3,749,229
Note : All values are in LKR ‘000s, unless otherwise stated. Figures in brackets indicate deductions. The above figures are not audited.
8 l John Keells Holdings PLC l www.keells.com
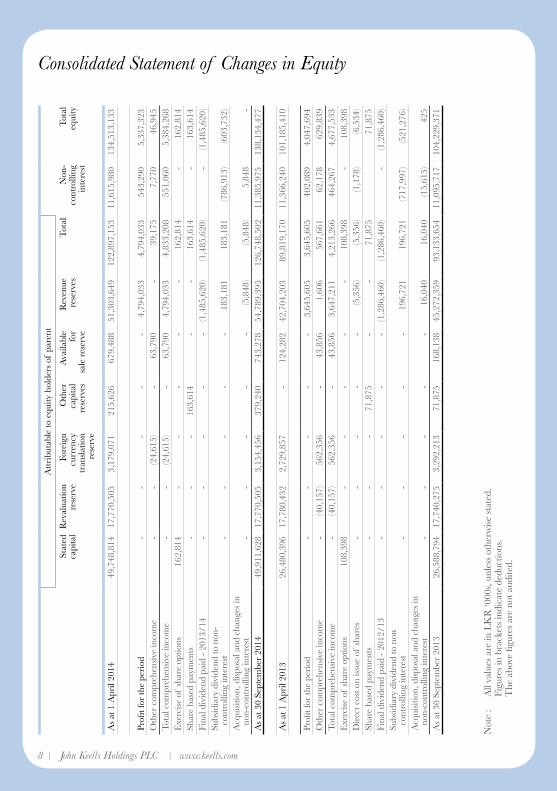
Consolidated Statement of Changes in EquityA
ttri
buta
ble
to e
quity
hol
ders
of
pare
nt
Sta
ted
cap
ital
Rev
alua
tion
res
erve
F
orei
gn
curr
ency
tr
ansla
tion
res
erve
Oth
er
cap
ital
res
erve
s
Ava
ilabl
e fo
r s
ale
rese
rve
Rev
enue
r
eser
ves
Tot
al
Non
-co
ntro
lling
in
tere
st
Tot
al
equ
ity
As
at 1
Apr
il 20
14 4
9,74
8,81
4 17
,770
,505
3
,179
,071
2
15,6
26
679
,488
5
1,30
3,64
9 1
22,8
97,1
53
11,
615,
980
134
,513
,133
Profi
t for
the
peri
od -
- -
- -
4,7
94,0
33
4,7
94,0
33
543
,290
5
,337
,323
O
ther
com
preh
ensi
ve in
com
e -
- (2
4,61
5) -
63,
790
- 3
9,17
5 7
,770
4
6,94
5 T
otal
com
preh
ensi
ve in
com
e -
- (2
4,61
5) -
63,
790
4,7
94,0
33
4,8
33,2
08
551
,060
5
,384
,268
E
xerc
ise
of s
hare
opt
ions
162
,814
-
- -
- -
162
,814
-
162
,814
Sh
are
base
d pa
ymen
ts -
- -
163
,614
-
- 1
63,6
14
- 1
63,6
14
Fina
l div
iden
d pa
id -
2013
/14
- -
- -
- (1
,485
,620
) (1
,485
,620
) -
(1,4
85,6
20)
Subs
idia
ry d
ivid
end
to n
on-
con
trol
ling
inte
rest
- -
- -
- 1
83,1
81
183
,181
(7
86,9
13)
(603
,732
)A
cqui
sitio
n, d
ispo
sal a
nd c
hang
es in
non
-con
trol
ling
inte
rest
- -
- -
- (5
,848
) (5
,848
) 5
,848
-
As
at 3
0 Se
ptem
ber
2014
49,
911,
628
17,7
70,5
05
3,1
54,4
56
379
,240
7
43,2
78
54,
789,
395
126
,748
,502
1
1,38
5,97
5 1
38,1
34,4
77
As
at 1
Apr
il 20
1326
,480
,396
17
,780
,432
2
,729
,857
-
124
,282
4
2,70
4,20
3 8
9,81
9,17
0 1
1,36
6,24
0 1
01,1
85,4
10
Profi
t for
the
peri
od -
- -
- -
3,6
45,6
05
3,6
45,6
05
402
,089
4
,047
,694
O
ther
com
preh
ensi
ve in
com
e -
(40,
157)
562
,356
-
43,
856
1,6
06
567
,661
6
2,17
8 6
29,8
39
Tot
al c
ompr
ehen
sive
inco
me
- (4
0,15
7) 5
62,3
56
- 4
3,85
6 3
,647
,211
4
,213
,266
4
64,2
67
4,6
77,5
33
Exe
rcis
e of
sha
re o
ptio
ns 1
08,3
98
- -
- -
- 1
08,3
98
- 1
08,3
98
Dir
ect c
ost o
n is
sue
of s
hare
s -
- -
- -
(5,3
56)
(5,3
56)
(1,1
78)
(6,5
34)
Shar
e ba
sed
paym
ents
- -
- 7
1,87
5 -
- 7
1,87
5 7
1,87
5 Fi
nal d
ivid
end
paid
- 20
12/1
3 -
- -
- -
(1,2
86,4
60)
(1,2
86,4
60)
- (1
,286
,460
)Su
bsid
iary
div
iden
d to
non
con
trol
ling
inte
rest
- -
- -
- 1
96,7
21
196
,721
(7
17,9
97)
(521
,276
)A
cqui
sitio
n, d
ispo
sal a
nd c
hang
es in
n
on-c
ontr
ollin
g in
tere
st -
- -
- -
16,
040
16,
040
(15,
615)
425
A
s at
30
Sept
embe
r 20
13 2
6,58
8,79
4 17
,740
,275
3,
292,
213
71,
875
168
,138
4
5,27
2,35
9 9
3,13
3,65
4 1
1,09
5,71
7 1
04,2
29,3
71
Not
e :
All
valu
es a
re in
LK
R ‘0
00s,
unle
ss o
ther
wis
e st
ated
.
Figu
res
in b
rack
ets
indi
cate
ded
uctio
ns.
T
he a
bove
figu
res
are
not a
udite
d.

Chairman’s Message Financial Information
8 l John Keells Holdings PLC l www.keells.com Interim condensed financial statements l 9
Company Income Statement
Quarter ended 30th September Six months ended 30th September
Note 2014 2013 Change % 2014 2013 Change %
Continuing operations
Rendering of services 219,307 200,991 9 428,659 382,678 12
Revenue 219,307 200,991 9 428,659 382,678 12
Cost of sales (114,633) (99,238) 16 (230,691) (198,246) 16
Gross profit 104,674 101,753 3 197,968 184,432 7
Dividend income 614,879 96,452 537 2,827,624 2,288,050 24
Other operating income 51,776 10,609 388 55,635 12,959 329
Administrative expenses (338,892) (301,236) 13 (661,961) (596,489) 11
Other operating expenses (8,291) (7,664) 8 (18,568) (17,238) 8
Results from operating activities 424,146 (100,086) 524 2,400,698 1,871,714 28
Finance cost 9,104 (39,053) (123) (56,533) (130,012) (57)
Finance income 660,740 327,285 102 1,712,298 712,007 140
Net finance income 669,844 288,232 132 1,655,765 581,995 184
Profit before tax 1,093,990 188,146 481 4,056,463 2,453,709 65
Tax expense 9 (159,440) (101,324) 57 (273,812) (133,856) 105
Profit for the period 934,550 86,822 976 3,782,651 2,319,853 63
LKR LKR LKR LKR
Dividend per share - - 1.50 1.50
Note : All values are in LKR ‘000s, unless otherwise stated. Figures in brackets indicate deductions. The above figures are not audited.
10 l John Keells Holdings PLC l www.keells.com
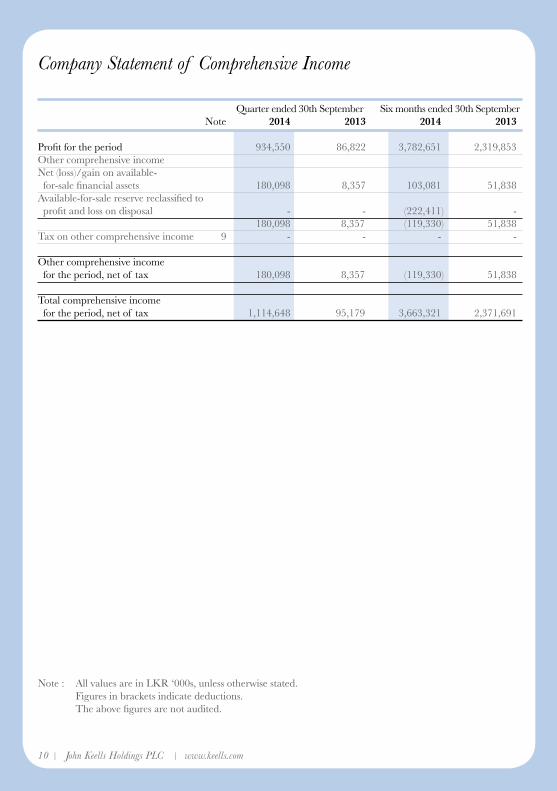
Company Statement of Comprehensive Income
Quarter ended 30th September Six months ended 30th September Note 2014 2013 2014 2013
Profit for the period 934,550 86,822 3,782,651 2,319,853 Other comprehensive income Net (loss)/gain on available- for-sale financial assets 180,098 8,357 103,081 51,838 Available-for-sale reserve reclassified to profit and loss on disposal - - (222,411) - 180,098 8,357 (119,330) 51,838Tax on other comprehensive income 9 - - - -
Other comprehensive income for the period, net of tax 180,098 8,357 (119,330) 51,838
Total comprehensive income for the period, net of tax 1,114,648 95,179 3,663,321 2,371,691
Note : All values are in LKR ‘000s, unless otherwise stated. Figures in brackets indicate deductions. The above figures are not audited.
Chairman’s Message Financial Information
10 l John Keells Holdings PLC l www.keells.com Interim condensed financial statements l 11
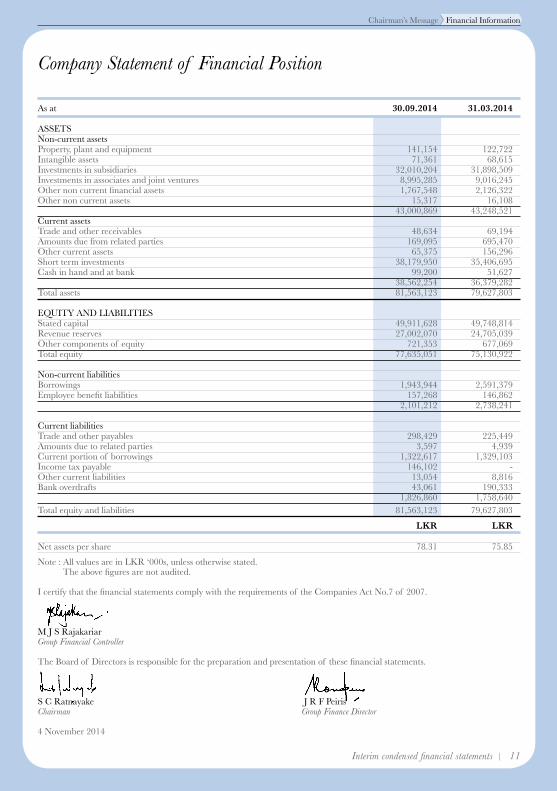
Company Statement of Financial Position
As at 30.09.2014 31.03.2014 ASSETS Non-current assets Property, plant and equipment 141,154 122,722 Intangible assets 71,361 68,615 Investments in subsidiaries 32,010,204 31,898,509 Investments in associates and joint ventures 8,995,285 9,016,245 Other non current financial assets 1,767,548 2,126,322 Other non current assets 15,317 16,108 43,000,869 43,248,521 Current assets Trade and other receivables 48,634 69,194 Amounts due from related parties 169,095 695,470 Other current assets 65,375 156,296 Short term investments 38,179,950 35,406,695 Cash in hand and at bank 99,200 51,627 38,562,254 36,379,282 Total assets 81,563,123 79,627,803 EQUITY AND LIABILITIES Stated capital 49,911,628 49,748,814 Revenue reserves 27,002,070 24,705,039 Other components of equity 721,353 677,069 Total equity 77,635,051 75,130,922 Non-current liabilities Borrowings 1,943,944 2,591,379 Employee benefit liabilities 157,268 146,862 2,101,212 2,738,241 Current liabilities Trade and other payables 298,429 225,449 Amounts due to related parties 3,597 4,939 Current portion of borrowings 1,322,617 1,329,103 Income tax payable 146,102 - Other current liabilities 13,054 8,816 Bank overdrafts 43,061 190,333 1,826,860 1,758,640 Total equity and liabilities 81,563,123 79,627,803 LKR LKR
Net assets per share 78.31 75.85 Note : All values are in LKR ‘000s, unless otherwise stated. The above figures are not audited. I certify that the financial statements comply with the requirements of the Companies Act No.7 of 2007.
M J S Rajakariar Group Financial Controller The Board of Directors is responsible for the preparation and presentation of these financial statements.
S C Ratnayake J R F Peiris Chairman Group Finance Director 4 November 2014
12 l John Keells Holdings PLC l www.keells.com
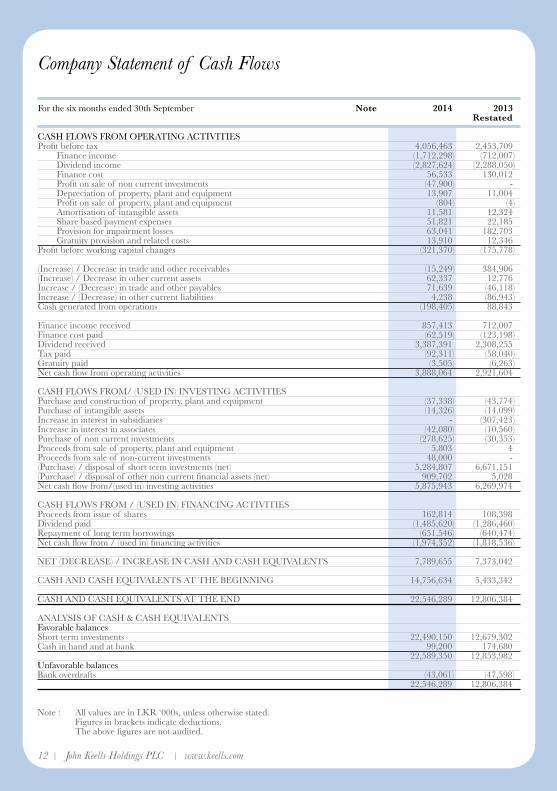
Company Statement of Cash Flows
For the six months ended 30th September Note 2014 2013 Restated CASH FLOWS FROM OPERATING ACTIVITIES Profit before tax 4,056,463 2,453,709 Finance income (1,712,298) (712,007) Dividend income (2,827,624) (2,288,050) Finance cost 56,533 130,012 Profit on sale of non current investments (47,900) - Depreciation of property, plant and equipment 13,907 11,004 Profit on sale of property, plant and equipment (804) (4) Amortisation of intangible assets 11,581 12,324 Share based payment expenses 51,821 22,185 Provision for impairment losses 63,041 182,703 Gratuity provision and related costs 13,910 12,346 Profit before working capital changes (321,370) (175,778) (Increase) / Decrease in trade and other receivables (15,249) 384,906 (Increase) / Decrease in other current assets 62,337 12,776 Increase / (Decrease) in trade and other payables 71,639 (46,118) Increase / (Decrease) in other current liabilities 4,238 (86,943)Cash generated from operations (198,405) 88,843 Finance income received 857,413 712,007 Finance cost paid (62,519) (123,198)Dividend received 3,387,391 2,308,255 Tax paid (92,311) (58,040)Gratuity paid (3,505) (6,263)Net cash flow from operating activities 3,888,064 2,921,604 CASH FLOWS FROM/ (USED IN) INVESTING ACTIVITIES Purchase and construction of property, plant and equipment (37,338) (43,774)Purchase of intangible assets (14,326) (14,099)Increase in interest in subsidiaries - (307,423)Increase in interest in associates (42,080) (10,560) Purchase of non current investments (278,625) (30,353)Proceeds from sale of property, plant and equipment 5,803 4 Proceeds from sale of non-current investments 48,000 - (Purchase) / disposal of short term investments (net) 5,284,807 6,671,151 (Purchase) / disposal of other non current financial assets (net) 909,702 5,028 Net cash flow from/(used in) investing activities 5,875,943 6,269,974 CASH FLOWS FROM / (USED IN) FINANCING ACTIVITIES Proceeds from issue of shares 162,814 108,398 Dividend paid (1,485,620) (1,286,460)Repayment of long term borrowings (651,546) (640,474)Net cash flow from / (used in) financing activities (1,974,352) (1,818,536) NET (DECREASE) / INCREASE IN CASH AND CASH EQUIVALENTS 7,789,655 7,373,042 CASH AND CASH EQUIVALENTS AT THE BEGINNING 14,756,634 5,433,342 CASH AND CASH EQUIVALENTS AT THE END 22,546,289 12,806,384 ANALYSIS OF CASH & CASH EQUIVALENTS Favorable balances Short term investments 22,490,150 12,679,302 Cash in hand and at bank 99,200 174,680 22,589,350 12,853,982 Unfavorable balances Bank overdrafts (43,061) (47,598) 22,546,289 12,806,384
Note : All values are in LKR ‘000s, unless otherwise stated. Figures in brackets indicate deductions. The above figures are not audited.
Chairman’s Message Financial Information
12 l John Keells Holdings PLC l www.keells.com Interim condensed financial statements l 13
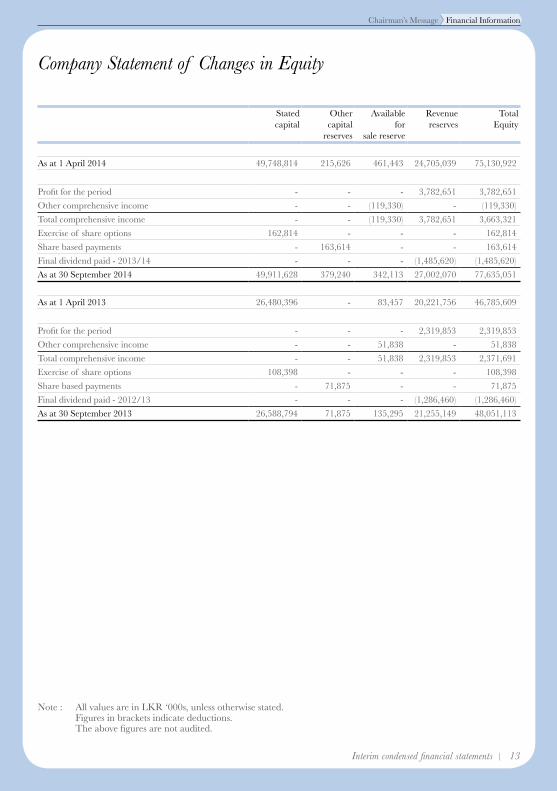
Company Statement of Changes in Equity
Stated capital
Other capitalreserves
Available for
sale reserve
Revenue reserves
Total Equity
As at 1 April 2014 49,748,814 215,626 461,443 24,705,039 75,130,922
Profit for the period - - - 3,782,651 3,782,651
Other comprehensive income - - (119,330) - (119,330)
Total comprehensive income - - (119,330) 3,782,651 3,663,321
Exercise of share options 162,814 - - - 162,814
Share based payments - 163,614 - - 163,614
Final dividend paid - 2013/14 - - - (1,485,620) (1,485,620)
As at 30 September 2014 49,911,628 379,240 342,113 27,002,070 77,635,051
As at 1 April 2013 26,480,396 - 83,457 20,221,756 46,785,609
Profit for the period - - - 2,319,853 2,319,853
Other comprehensive income - - 51,838 - 51,838
Total comprehensive income - - 51,838 2,319,853 2,371,691
Exercise of share options 108,398 - - - 108,398
Share based payments - 71,875 - - 71,875
Final dividend paid - 2012/13 - - - (1,286,460) (1,286,460)
As at 30 September 2013 26,588,794 71,875 135,295 21,255,149 48,051,113
Note : All values are in LKR ‘000s, unless otherwise stated. Figures in brackets indicate deductions. The above figures are not audited.
14 l John Keells Holdings PLC l www.keells.com
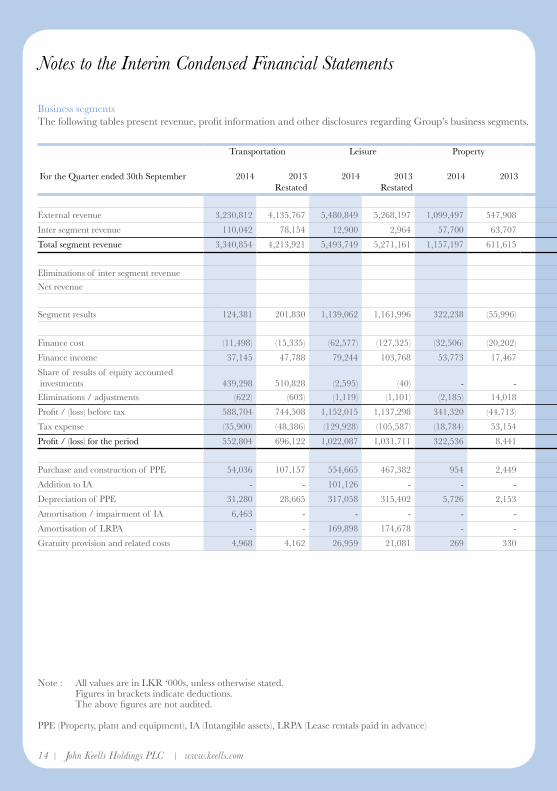
Notes to the Interim Condensed Financial Statements
Business segmentsThe following tables present revenue, profit information and other disclosures regarding Group’s business segments.
Transportation Leisure Property Consumer Foods & Retail
Financial Services Information Technology Others Group Total
For the Quarter ended 30th September 2014 2013Restated
2014 2013Restated
2014 2013 2014 2013 2014 2013 2014 2013Restated
2014 2013 2014 2013Restated
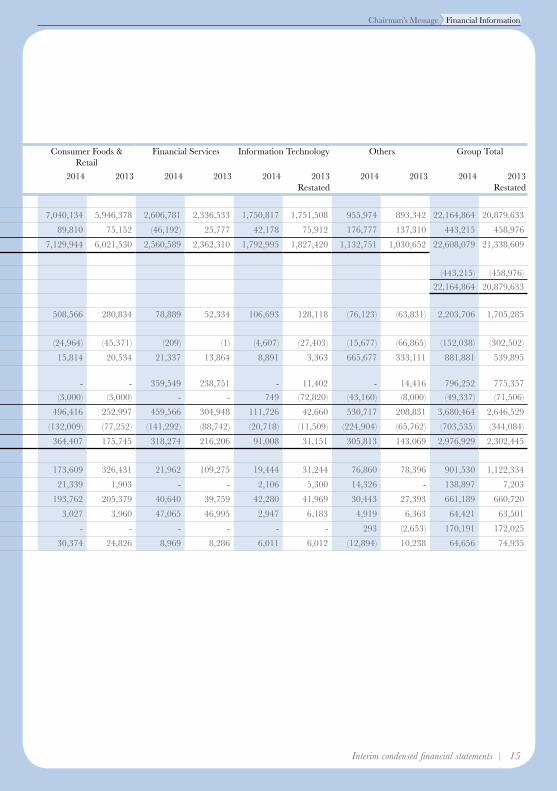
External revenue 3,230,812 4,135,767 5,480,849 5,268,197 1,099,497 547,908 7,040,134 5,946,378 2,606,781 2,336,533 1,750,817 1,751,508 955,974 893,342 22,164,864 20,879,633
Inter segment revenue 110,042 78,154 12,900 2,964 57,700 63,707 89,810 75,152 (46,192) 25,777 42,178 75,912 176,777 137,310 443,215 458,976
Total segment revenue 3,340,854 4,213,921 5,493,749 5,271,161 1,157,197 611,615 7,129,944 6,021,530 2,560,589 2,362,310 1,792,995 1,827,420 1,132,751 1,030,652 22,608,079 21,338,609
Eliminations of inter segment revenue (443,215) (458,976)
Net revenue 22,164,864 20,879,633
Segment results 124,381 201,830 1,139,062 1,161,996 322,238 (55,996) 508,566 280,834 78,889 52,334 106,693 128,118 (76,123) (63,831) 2,203,706 1,705,285
Finance cost (11,498) (15,335) (62,577) (127,325) (32,506) (20,202) (24,964) (45,371) (209) (1) (4,607) (27,403) (15,677) (66,865) (152,038) (302,502)
Finance income 37,145 47,788 79,244 103,768 53,773 17,467 15,814 20,534 21,337 13,864 8,891 3,363 665,677 333,111 881,881 539,895
Share of results of equity accounted investments 439,298 510,828 (2,595) (40) - - - - 359,549 238,751 - 11,402 - 14,416 796,252 775,357
Eliminations / adjustments (622) (603) (1,119) (1,101) (2,185) 14,018 (3,000) (3,000) - - 749 (72,820) (43,160) (8,000) (49,337) (71,506)
Profit / (loss) before tax 588,704 744,508 1,152,015 1,137,298 341,320 (44,713) 496,416 252,997 459,566 304,948 111,726 42,660 530,717 208,831 3,680,464 2,646,529
Tax expense (35,900) (48,386) (129,928) (105,587) (18,784) 53,154 (132,009) (77,252) (141,292) (88,742) (20,718) (11,509) (224,904) (65,762) (703,535) (344,084)
Profit / (loss) for the period 552,804 696,122 1,022,087 1,031,711 322,536 8,441 364,407 175,745 318,274 216,206 91,008 31,151 305,813 143,069 2,976,929 2,302,445
Purchase and construction of PPE 54,036 107,157 554,665 467,382 954 2,449 173,609 326,431 21,962 109,275 19,444 31,244 76,860 78,396 901,530 1,122,334
Addition to IA - - 101,126 - - - 21,339 1,903 - - 2,106 5,300 14,326 - 138,897 7,203
Depreciation of PPE 31,280 28,665 317,058 315,402 5,726 2,153 193,762 205,379 40,640 39,759 42,280 41,969 30,443 27,393 661,189 660,720
Amortisation / impairment of IA 6,463 - - - - - 3,027 3,960 47,065 46,995 2,947 6,183 4,919 6,363 64,421 63,501
Amortisation of LRPA - - 169,898 174,678 - - - - - - - - 293 (2,653) 170,191 172,025
Gratuity provision and related costs 4,968 4,162 26,959 21,081 269 330 30,374 24,826 8,969 8,286 6,011 6,012 (12,894) 10,238 64,656 74,935
Note : All values are in LKR ‘000s, unless otherwise stated. Figures in brackets indicate deductions. The above figures are not audited.
PPE (Property, plant and equipment), IA (Intangible assets), LRPA (Lease rentals paid in advance)
Chairman’s Message Financial Information
14 l John Keells Holdings PLC l www.keells.com Interim condensed financial statements l 15
Business segmentsThe following tables present revenue, profit information and other disclosures regarding Group’s business segments.
Transportation Leisure Property Consumer Foods & Retail
Financial Services Information Technology Others Group Total
For the Quarter ended 30th September 2014 2013Restated
2014 2013Restated
2014 2013 2014 2013 2014 2013 2014 2013Restated
2014 2013 2014 2013Restated
External revenue 3,230,812 4,135,767 5,480,849 5,268,197 1,099,497 547,908 7,040,134 5,946,378 2,606,781 2,336,533 1,750,817 1,751,508 955,974 893,342 22,164,864 20,879,633
Inter segment revenue 110,042 78,154 12,900 2,964 57,700 63,707 89,810 75,152 (46,192) 25,777 42,178 75,912 176,777 137,310 443,215 458,976
Total segment revenue 3,340,854 4,213,921 5,493,749 5,271,161 1,157,197 611,615 7,129,944 6,021,530 2,560,589 2,362,310 1,792,995 1,827,420 1,132,751 1,030,652 22,608,079 21,338,609
Eliminations of inter segment revenue (443,215) (458,976)
Net revenue 22,164,864 20,879,633
Segment results 124,381 201,830 1,139,062 1,161,996 322,238 (55,996) 508,566 280,834 78,889 52,334 106,693 128,118 (76,123) (63,831) 2,203,706 1,705,285
Finance cost (11,498) (15,335) (62,577) (127,325) (32,506) (20,202) (24,964) (45,371) (209) (1) (4,607) (27,403) (15,677) (66,865) (152,038) (302,502)
Finance income 37,145 47,788 79,244 103,768 53,773 17,467 15,814 20,534 21,337 13,864 8,891 3,363 665,677 333,111 881,881 539,895
Share of results of equity accounted investments 439,298 510,828 (2,595) (40) - - - - 359,549 238,751 - 11,402 - 14,416 796,252 775,357
Eliminations / adjustments (622) (603) (1,119) (1,101) (2,185) 14,018 (3,000) (3,000) - - 749 (72,820) (43,160) (8,000) (49,337) (71,506)
Profit / (loss) before tax 588,704 744,508 1,152,015 1,137,298 341,320 (44,713) 496,416 252,997 459,566 304,948 111,726 42,660 530,717 208,831 3,680,464 2,646,529
Tax expense (35,900) (48,386) (129,928) (105,587) (18,784) 53,154 (132,009) (77,252) (141,292) (88,742) (20,718) (11,509) (224,904) (65,762) (703,535) (344,084)
Profit / (loss) for the period 552,804 696,122 1,022,087 1,031,711 322,536 8,441 364,407 175,745 318,274 216,206 91,008 31,151 305,813 143,069 2,976,929 2,302,445
Purchase and construction of PPE 54,036 107,157 554,665 467,382 954 2,449 173,609 326,431 21,962 109,275 19,444 31,244 76,860 78,396 901,530 1,122,334
Addition to IA - - 101,126 - - - 21,339 1,903 - - 2,106 5,300 14,326 - 138,897 7,203
Depreciation of PPE 31,280 28,665 317,058 315,402 5,726 2,153 193,762 205,379 40,640 39,759 42,280 41,969 30,443 27,393 661,189 660,720
Amortisation / impairment of IA 6,463 - - - - - 3,027 3,960 47,065 46,995 2,947 6,183 4,919 6,363 64,421 63,501
Amortisation of LRPA - - 169,898 174,678 - - - - - - - - 293 (2,653) 170,191 172,025
Gratuity provision and related costs 4,968 4,162 26,959 21,081 269 330 30,374 24,826 8,969 8,286 6,011 6,012 (12,894) 10,238 64,656 74,935
Note : All values are in LKR ‘000s, unless otherwise stated. Figures in brackets indicate deductions. The above figures are not audited.
PPE (Property, plant and equipment), IA (Intangible assets), LRPA (Lease rentals paid in advance)
16 l John Keells Holdings PLC l www.keells.com
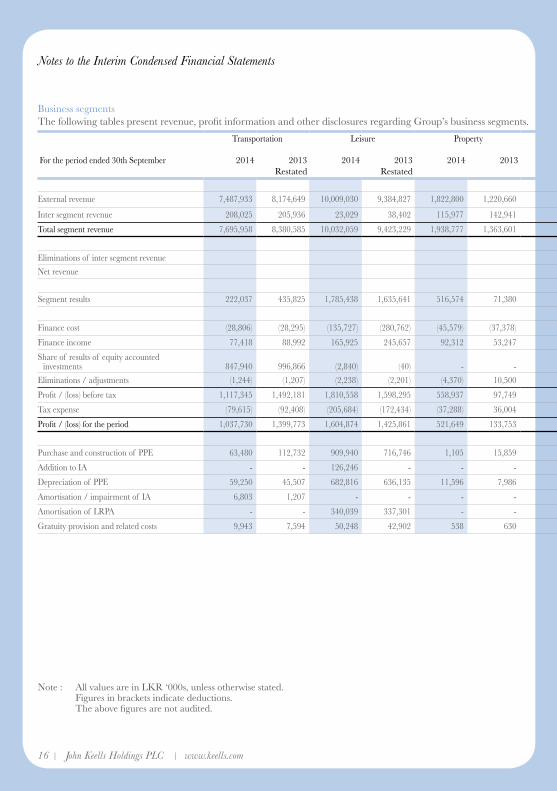
Notes to the Interim Condensed Financial Statements
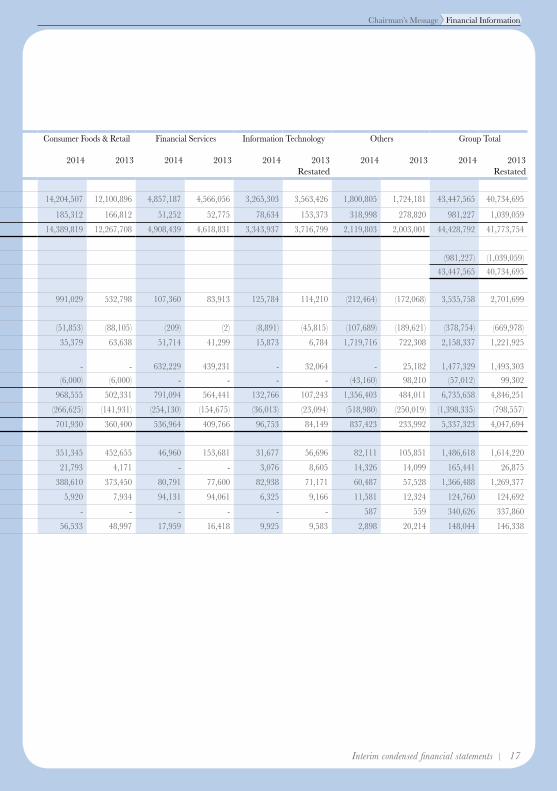
Business segmentsThe following tables present revenue, profit information and other disclosures regarding Group’s business segments.
Transportation Leisure Property Consumer Foods & Retail Financial Services Information Technology Others Group Total
For the period ended 30th September 2014 2013Restated
2014 2013Restated
2014 2013 2014 2013 2014 2013 2014 2013Restated
2014 2013 2014 2013Restated
External revenue 7,487,933 8,174,649 10,009,030 9,384,827 1,822,800 1,220,660 14,204,507 12,100,896 4,857,187 4,566,056 3,265,303 3,563,426 1,800,805 1,724,181 43,447,565 40,734,695
Inter segment revenue 208,025 205,936 23,029 38,402 115,977 142,941 185,312 166,812 51,252 52,775 78,634 153,373 318,998 278,820 981,227 1,039,059
Total segment revenue 7,695,958 8,380,585 10,032,059 9,423,229 1,938,777 1,363,601 14,389,819 12,267,708 4,908,439 4,618,831 3,343,937 3,716,799 2,119,803 2,003,001 44,428,792 41,773,754
Eliminations of inter segment revenue (981,227) (1,039,059)
Net revenue 43,447,565 40,734,695
Segment results 222,037 435,825 1,785,438 1,635,641 516,574 71,380 991,029 532,798 107,360 83,913 125,784 114,210 (212,464) (172,068) 3,535,758 2,701,699
Finance cost (28,806) (28,295) (135,727) (280,762) (45,579) (37,378) (51,853) (88,105) (209) (2) (8,891) (45,815) (107,689) (189,621) (378,754) (669,978)
Finance income 77,418 88,992 165,925 245,657 92,312 53,247 35,379 63,638 51,714 41,299 15,873 6,784 1,719,716 722,308 2,158,337 1,221,925
Share of results of equity accounted investments 847,940 996,866 (2,840) (40) - - - - 632,229 439,231 - 32,064 - 25,182 1,477,329 1,493,303
Eliminations / adjustments (1,244) (1,207) (2,238) (2,201) (4,370) 10,500 (6,000) (6,000) - - - - (43,160) 98,210 (57,012) 99,302
Profit / (loss) before tax 1,117,345 1,492,181 1,810,558 1,598,295 558,937 97,749 968,555 502,331 791,094 564,441 132,766 107,243 1,356,403 484,011 6,735,658 4,846,251
Tax expense (79,615) (92,408) (205,684) (172,434) (37,288) 36,004 (266,625) (141,931) (254,130) (154,675) (36,013) (23,094) (518,980) (250,019) (1,398,335) (798,557)
Profit / (loss) for the period 1,037,730 1,399,773 1,604,874 1,425,861 521,649 133,753 701,930 360,400 536,964 409,766 96,753 84,149 837,423 233,992 5,337,323 4,047,694
Purchase and construction of PPE 63,480 112,732 909,940 716,746 1,105 15,859 351,345 452,655 46,960 153,681 31,677 56,696 82,111 105,851 1,486,618 1,614,220
Addition to IA - - 126,246 - - - 21,793 4,171 - - 3,076 8,605 14,326 14,099 165,441 26,875
Depreciation of PPE 59,250 45,507 682,816 636,135 11,596 7,986 388,610 373,450 80,791 77,600 82,938 71,171 60,487 57,528 1,366,488 1,269,377
Amortisation / impairment of IA 6,803 1,207 - - - - 5,920 7,934 94,131 94,061 6,325 9,166 11,581 12,324 124,760 124,692
Amortisation of LRPA - - 340,039 337,301 - - - - - - - - 587 559 340,626 337,860
Gratuity provision and related costs 9,943 7,594 50,248 42,902 538 630 56,533 48,997 17,959 16,418 9,925 9,583 2,898 20,214 148,044 146,338
Note : All values are in LKR ‘000s, unless otherwise stated. Figures in brackets indicate deductions. The above figures are not audited.
Chairman’s Message Financial Information
16 l John Keells Holdings PLC l www.keells.com Interim condensed financial statements l 17
Business segmentsThe following tables present revenue, profit information and other disclosures regarding Group’s business segments.
Transportation Leisure Property Consumer Foods & Retail Financial Services Information Technology Others Group Total
For the period ended 30th September 2014 2013Restated
2014 2013Restated
2014 2013 2014 2013 2014 2013 2014 2013Restated
2014 2013 2014 2013Restated
External revenue 7,487,933 8,174,649 10,009,030 9,384,827 1,822,800 1,220,660 14,204,507 12,100,896 4,857,187 4,566,056 3,265,303 3,563,426 1,800,805 1,724,181 43,447,565 40,734,695
Inter segment revenue 208,025 205,936 23,029 38,402 115,977 142,941 185,312 166,812 51,252 52,775 78,634 153,373 318,998 278,820 981,227 1,039,059
Total segment revenue 7,695,958 8,380,585 10,032,059 9,423,229 1,938,777 1,363,601 14,389,819 12,267,708 4,908,439 4,618,831 3,343,937 3,716,799 2,119,803 2,003,001 44,428,792 41,773,754
Eliminations of inter segment revenue (981,227) (1,039,059)
Net revenue 43,447,565 40,734,695
Segment results 222,037 435,825 1,785,438 1,635,641 516,574 71,380 991,029 532,798 107,360 83,913 125,784 114,210 (212,464) (172,068) 3,535,758 2,701,699
Finance cost (28,806) (28,295) (135,727) (280,762) (45,579) (37,378) (51,853) (88,105) (209) (2) (8,891) (45,815) (107,689) (189,621) (378,754) (669,978)
Finance income 77,418 88,992 165,925 245,657 92,312 53,247 35,379 63,638 51,714 41,299 15,873 6,784 1,719,716 722,308 2,158,337 1,221,925
Share of results of equity accounted investments 847,940 996,866 (2,840) (40) - - - - 632,229 439,231 - 32,064 - 25,182 1,477,329 1,493,303
Eliminations / adjustments (1,244) (1,207) (2,238) (2,201) (4,370) 10,500 (6,000) (6,000) - - - - (43,160) 98,210 (57,012) 99,302
Profit / (loss) before tax 1,117,345 1,492,181 1,810,558 1,598,295 558,937 97,749 968,555 502,331 791,094 564,441 132,766 107,243 1,356,403 484,011 6,735,658 4,846,251
Tax expense (79,615) (92,408) (205,684) (172,434) (37,288) 36,004 (266,625) (141,931) (254,130) (154,675) (36,013) (23,094) (518,980) (250,019) (1,398,335) (798,557)
Profit / (loss) for the period 1,037,730 1,399,773 1,604,874 1,425,861 521,649 133,753 701,930 360,400 536,964 409,766 96,753 84,149 837,423 233,992 5,337,323 4,047,694
Purchase and construction of PPE 63,480 112,732 909,940 716,746 1,105 15,859 351,345 452,655 46,960 153,681 31,677 56,696 82,111 105,851 1,486,618 1,614,220
Addition to IA - - 126,246 - - - 21,793 4,171 - - 3,076 8,605 14,326 14,099 165,441 26,875
Depreciation of PPE 59,250 45,507 682,816 636,135 11,596 7,986 388,610 373,450 80,791 77,600 82,938 71,171 60,487 57,528 1,366,488 1,269,377
Amortisation / impairment of IA 6,803 1,207 - - - - 5,920 7,934 94,131 94,061 6,325 9,166 11,581 12,324 124,760 124,692
Amortisation of LRPA - - 340,039 337,301 - - - - - - - - 587 559 340,626 337,860
Gratuity provision and related costs 9,943 7,594 50,248 42,902 538 630 56,533 48,997 17,959 16,418 9,925 9,583 2,898 20,214 148,044 146,338
Note : All values are in LKR ‘000s, unless otherwise stated. Figures in brackets indicate deductions. The above figures are not audited.
18 l John Keells Holdings PLC l www.keells.com
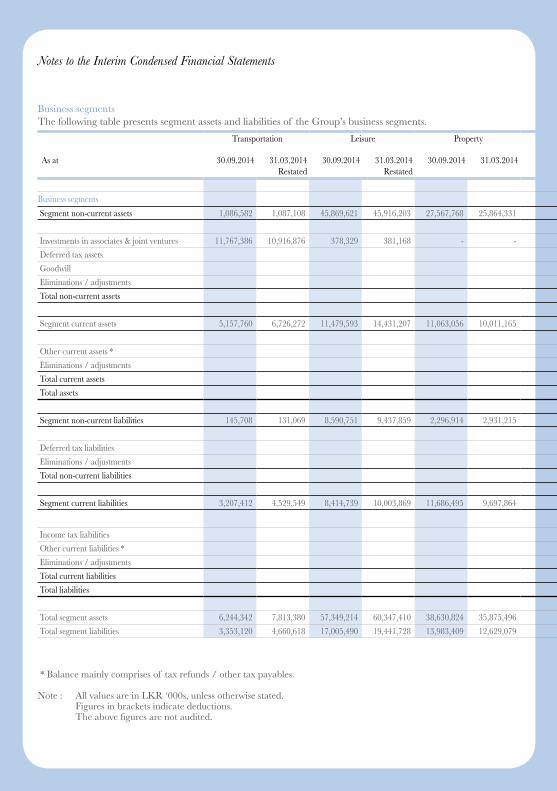
Notes to the Interim Condensed Financial Statements
Business segmentsThe following table presents segment assets and liabilities of the Group’s business segments.
Transportation Leisure Property Consumer Foods & Retail Financial Services Information Technology Others Group Total
As at 30.09.2014 31.03.2014Restated
30.09.2014 31.03.2014Restated
30.09.2014 31.03.2014 30.09.2014 31.03.2014 30.09.2014 31.03.2014 30.09.2014 31.03.2014Restated
30.09.2014 31.03.2014 30.09.2014 31.03.2014Restated
Business segments
Segment non-current assets 1,086,582 1,087,108 45,869,621 45,916,203 27,567,768 25,864,331 7,412,443 7,374,589 22,516,243 20,211,147 394,590 503,647 6,010,432 6,485,657 110,857,679 107,442,682
Investments in associates & joint ventures 11,767,386 10,916,876 378,329 381,168 - - - - 3,965,785 3,556,323 - - - - 16,111,500 14,854,367
Deferred tax assets 145,995 142,369
Goodwill 950,884 950,884
Eliminations / adjustments (4,169,330) (4,122,642)
Total non-current assets 123,896,728 119,267,660
Segment current assets 5,157,760 6,726,272 11,479,593 14,431,207 11,063,056 10,011,165 4,742,769 4,876,636 16,247,390 10,647,628 2,866,472 3,718,748 39,301,904 37,392,777 90,858,944 87,804,433
Other current assets * 3,156,177 2,827,940
Eliminations / adjustments (5,255,552) (7,493,719)
Total current assets 88,759,569 83,138,654
Total assets 212,656,297 202,406,314
Segment non-current liabilities 145,708 131,069 8,590,751 9,437,859 2,296,914 2,931,215 902,569 951,150 22,941,584 20,485,312 147,663 165,287 2,210,780 2,843,992 37,235,969 36,945,884
Deferred tax liabilities 1,379,295 1,328,479
Eliminations / adjustments (4,677,050) (4,683,398)
Total non-current liabilities 33,938,214 33,590,965
Segment current liabilities 3,207,412 4,529,549 8,414,739 10,003,869 11,686,495 9,697,864 4,308,323 4,523,464 10,504,330 5,499,273 1,102,486 1,271,843 2,156,361 2,161,300 41,380,146 37,687,162
Income tax liabilities 1,318,634 923,508
Other current liabilities * 3,072,910 2,383,493
Eliminations / adjustments (5,188,084) (6,691,947)
Total current liabilities 40,583,606 34,302,216
Total liabilities 74,521,820 67,893,181
Total segment assets 6,244,342 7,813,380 57,349,214 60,347,410 38,630,824 35,875,496 12,155,212 12,251,225 38,763,633 30,858,775 3,261,062 4,222,395 45,312,336 43,878,434 201,716,623 195,247,115
Total segment liabilities 3,353,120 4,660,618 17,005,490 19,441,728 13,983,409 12,629,079 5,210,892 5,474,614 33,445,914 25,984,585 1,250,149 1,437,130 4,367,141 5,005,292 78,616,115 74,633,046
* Balance mainly comprises of tax refunds / other tax payables.
Note : All values are in LKR ‘000s, unless otherwise stated. Figures in brackets indicate deductions. The above figures are not audited.
Chairman’s Message Financial Information
18 l John Keells Holdings PLC l www.keells.com Interim condensed financial statements l 19
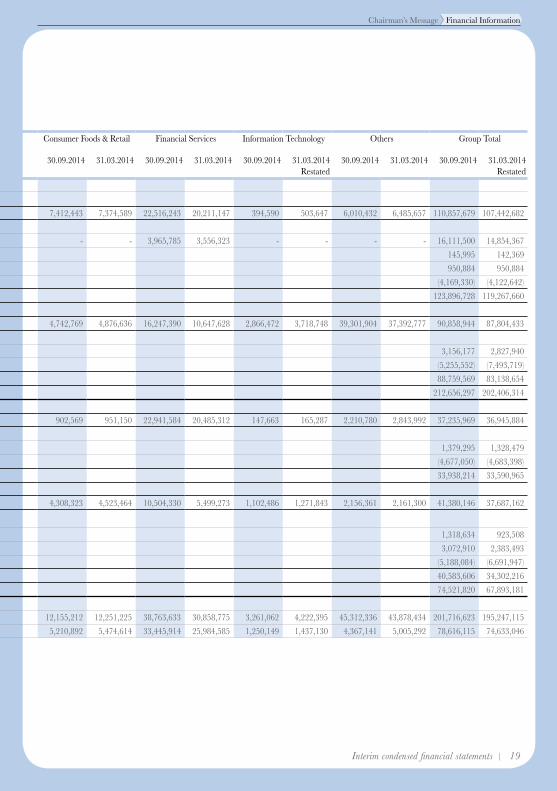
Business segmentsThe following table presents segment assets and liabilities of the Group’s business segments.
Transportation Leisure Property Consumer Foods & Retail Financial Services Information Technology Others Group Total
As at 30.09.2014 31.03.2014Restated
30.09.2014 31.03.2014Restated
30.09.2014 31.03.2014 30.09.2014 31.03.2014 30.09.2014 31.03.2014 30.09.2014 31.03.2014Restated
30.09.2014 31.03.2014 30.09.2014 31.03.2014Restated
Business segments
Segment non-current assets 1,086,582 1,087,108 45,869,621 45,916,203 27,567,768 25,864,331 7,412,443 7,374,589 22,516,243 20,211,147 394,590 503,647 6,010,432 6,485,657 110,857,679 107,442,682
Investments in associates & joint ventures 11,767,386 10,916,876 378,329 381,168 - - - - 3,965,785 3,556,323 - - - - 16,111,500 14,854,367
Deferred tax assets 145,995 142,369
Goodwill 950,884 950,884
Eliminations / adjustments (4,169,330) (4,122,642)
Total non-current assets 123,896,728 119,267,660
Segment current assets 5,157,760 6,726,272 11,479,593 14,431,207 11,063,056 10,011,165 4,742,769 4,876,636 16,247,390 10,647,628 2,866,472 3,718,748 39,301,904 37,392,777 90,858,944 87,804,433
Other current assets * 3,156,177 2,827,940
Eliminations / adjustments (5,255,552) (7,493,719)
Total current assets 88,759,569 83,138,654
Total assets 212,656,297 202,406,314
Segment non-current liabilities 145,708 131,069 8,590,751 9,437,859 2,296,914 2,931,215 902,569 951,150 22,941,584 20,485,312 147,663 165,287 2,210,780 2,843,992 37,235,969 36,945,884
Deferred tax liabilities 1,379,295 1,328,479
Eliminations / adjustments (4,677,050) (4,683,398)
Total non-current liabilities 33,938,214 33,590,965
Segment current liabilities 3,207,412 4,529,549 8,414,739 10,003,869 11,686,495 9,697,864 4,308,323 4,523,464 10,504,330 5,499,273 1,102,486 1,271,843 2,156,361 2,161,300 41,380,146 37,687,162
Income tax liabilities 1,318,634 923,508
Other current liabilities * 3,072,910 2,383,493
Eliminations / adjustments (5,188,084) (6,691,947)
Total current liabilities 40,583,606 34,302,216
Total liabilities 74,521,820 67,893,181
Total segment assets 6,244,342 7,813,380 57,349,214 60,347,410 38,630,824 35,875,496 12,155,212 12,251,225 38,763,633 30,858,775 3,261,062 4,222,395 45,312,336 43,878,434 201,716,623 195,247,115
Total segment liabilities 3,353,120 4,660,618 17,005,490 19,441,728 13,983,409 12,629,079 5,210,892 5,474,614 33,445,914 25,984,585 1,250,149 1,437,130 4,367,141 5,005,292 78,616,115 74,633,046
* Balance mainly comprises of tax refunds / other tax payables.
Note : All values are in LKR ‘000s, unless otherwise stated. Figures in brackets indicate deductions. The above figures are not audited.
20 l John Keells Holdings PLC l www.keells.com
Notes to the Interim Condensed Financial Statements
1 Corporate information John Keells Holdings PLC. is a public limited company incorporated and domiciled in Sri Lanka and
listed on the Colombo Stock Exchange. Ordinary shares of the company are listed on the Colombo Stock
Exchange and Global Depository Receipts (GDRs) are listed on the Luxembourg Stock Exchange.
2 Interim condensed financial statements The financial statements for the period ended 30 September 2014, includes “the Company” referring to
John Keells Holdings PLC., as the holding company and “the Group” referring to the companies whose
accounts have been consolidated therein.
3 Approval of fianancial statements The interim condensed financial statements of the Group and the Company for the 6 months ended 30
September 2014 were authorised for issue by the Board of Directors on 4 November 2014.
4 Basis of preparation The interim condensed financial statements have been prepared in compliance with Sri Lanka Accounting
Standard LKAS 34 - Interim Financial Reporting. These interim condensed financial statements should be
read in conjunction with the annual financial statements for the year ended 31 March 2014.
The interim condensed financial statements are presented in Sri Lankan Rupees (LKR) and all values are
rounded to the nearest thousand except when otherwise indicated.
5 Changes in accounting policies SLFRS 10 Consolidated Financial Statements
SLFRS 10 establishes a single control model that applies to all entities including special purpose
entities. SLFRS 10 replaces the parts of previously existing LKAS 27 Consolidated and
Separate Financial Statements that dealt with consolidated financial statements and SIC-12
Consolidation – Special Purpose Entities. SLFRS 10 changes the definition of control such that
an investor controls an investee, has exposure or rights to variable returns from its involvement
with the investee and has the ability to affect those returns through its power over the investee.
To meet the definition of control in SLFRS 10, all three criteria must be met, including:
(a) an investor has power over an investee;
(b) the investor has exposure, or rights, to variable returns from its involvement with the investee; and
(c) the investor has the ability to use its power over the investee to affect the amount of the investor’s returns.
SLFRS 10 has had no impact on the consolidation of investments held by the Group.
Chairman’s Message Financial Information
20 l John Keells Holdings PLC l www.keells.com Interim condensed financial statements l 21
SLFRS 11 Joint Arrangements
SLFRS 11 replaces LKAS 31 Interests in Joint Ventures and SIC-13 Jointly-controlled Entities — Non-
monetary Contributions by Venturers. SLFRS 11 removes the option to account for jointly controlled
entities (JCEs) using proportionate consolidation. Instead, JCEs that meet the definition of a joint venture
under SLFRS 11 must be accounted for using the equity method.
The application of this new standard impacted the financial position of the Group by replacing proportionate
consolidation of the joint ventures with the equity method of accounting.
SLFRS 11 is effective for annual periods beginning on or after 1 January 2014. The effect of SLFRS 11 is
described in more detail in Note 7, which includes quantification of the effect on the financial statements.
SLFRS 12 Disclosure of Interests in Other Entities
SLFRS 12 sets out the requirements for disclosures relating to an entity’s interests in subsidiaries, joint
arrangements, associates and structured entities. None of these disclosure requirements are applicable
for interim condensed consolidated financial statements, unless significant events and transactions in the
interim period requires that they are disclosed. Accordingly, the Group has not made such disclosures.
SLFRS 13 Fair Value Measurement
SLFRS 13 establishes a single source of guidance under SLFRS for all fair value measurements.
SLFRS 13 does not change when an entity is required to use fair value, but rather provides guidance on how
to measure fair value under SLFRS when fair value is required or permitted. The application of SLFRS 13
has not materially impacted the fair value measurements carried out by the Group.
6 Operating Segments For management purposes, the Group is organised into business units based on their products and services
and has seven reportable operating segments as follows:
Transportation
Leisure
Property
Consumer Foods & Retail
Financial Services
Information Technology
Others
22 l John Keells Holdings PLC l www.keells.com
Notes to the Interim Condensed Financial Statements
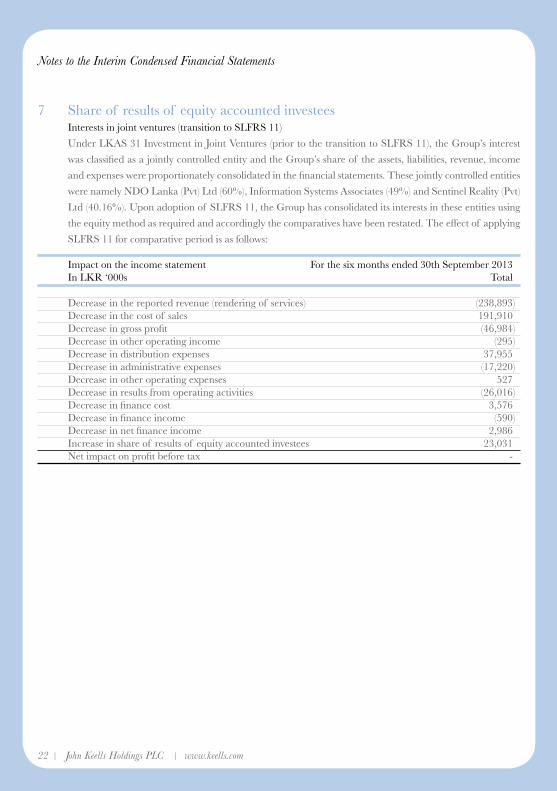
7 Share of results of equity accounted investees Interests in joint ventures (transition to SLFRS 11)
Under LKAS 31 Investment in Joint Ventures (prior to the transition to SLFRS 11), the Group’s interest
was classified as a jointly controlled entity and the Group’s share of the assets, liabilities, revenue, income
and expenses were proportionately consolidated in the financial statements. These jointly controlled entities
were namely NDO Lanka (Pvt) Ltd (60%), Information Systems Associates (49%) and Sentinel Reality (Pvt)
Ltd (40.16%). Upon adoption of SLFRS 11, the Group has consolidated its interests in these entities using
the equity method as required and accordingly the comparatives have been restated. The effect of applying
SLFRS 11 for comparative period is as follows:
Impact on the income statement For the six months ended 30th September 2013 In LKR ‘000s Total
Decrease in the reported revenue (rendering of services) (238,893) Decrease in the cost of sales 191,910 Decrease in gross profit (46,984) Decrease in other operating income (295) Decrease in distribution expenses 37,955 Decrease in administrative expenses (17,220) Decrease in other operating expenses 527 Decrease in results from operating activities (26,016) Decrease in finance cost 3,576 Decrease in finance income (590) Decrease in net finance income 2,986 Increase in share of results of equity accounted investees 23,031 Net impact on profit before tax -
Chairman’s Message Financial Information
22 l John Keells Holdings PLC l www.keells.com Interim condensed financial statements l 23
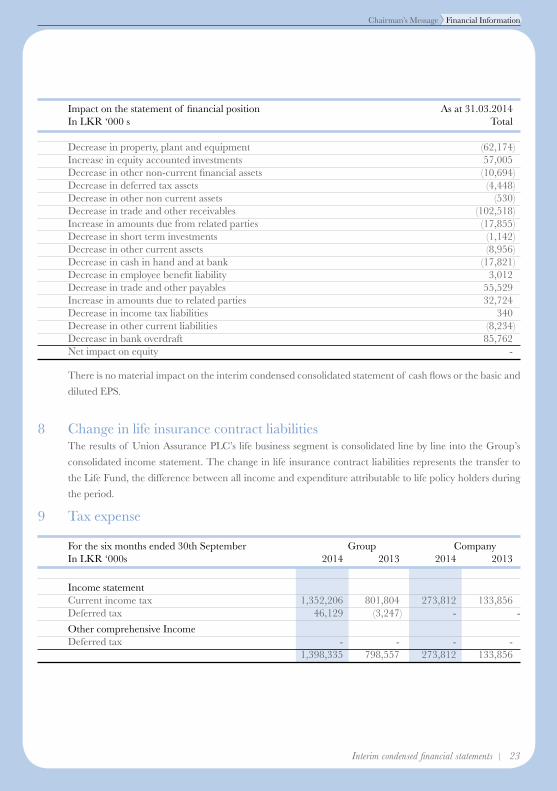
Impact on the statement of financial position As at 31.03.2014 In LKR ‘000 s Total
Decrease in property, plant and equipment (62,174) Increase in equity accounted investments 57,005 Decrease in other non-current financial assets (10,694) Decrease in deferred tax assets (4,448) Decrease in other non current assets (530) Decrease in trade and other receivables (102,518) Increase in amounts due from related parties (17,855) Decrease in short term investments (1,142) Decrease in other current assets (8,956) Decrease in cash in hand and at bank (17,821) Decrease in employee benefit liability 3,012 Decrease in trade and other payables 55,529 Increase in amounts due to related parties 32,724 Decrease in income tax liabilities 340 Decrease in other current liabilities (8,234) Decrease in bank overdraft 85,762 Net impact on equity -
There is no material impact on the interim condensed consolidated statement of cash flows or the basic and
diluted EPS.
8 Change in life insurance contract liabilities The results of Union Assurance PLC’s life business segment is consolidated line by line into the Group’s
consolidated income statement. The change in life insurance contract liabilities represents the transfer to
the Life Fund, the difference between all income and expenditure attributable to life policy holders during
the period.
9 Tax expense
For the six months ended 30th September Group Company In LKR ‘000s 2014 2013 2014 2013
Income statement Current income tax 1,352,206 801,804 273,812 133,856 Deferred tax 46,129 (3,247) - -
Other comprehensive Income Deferred tax - - - - 1,398,335 798,557 273,812 133,856
24 l John Keells Holdings PLC l www.keells.com
Notes to the Interim Condensed Financial Statements
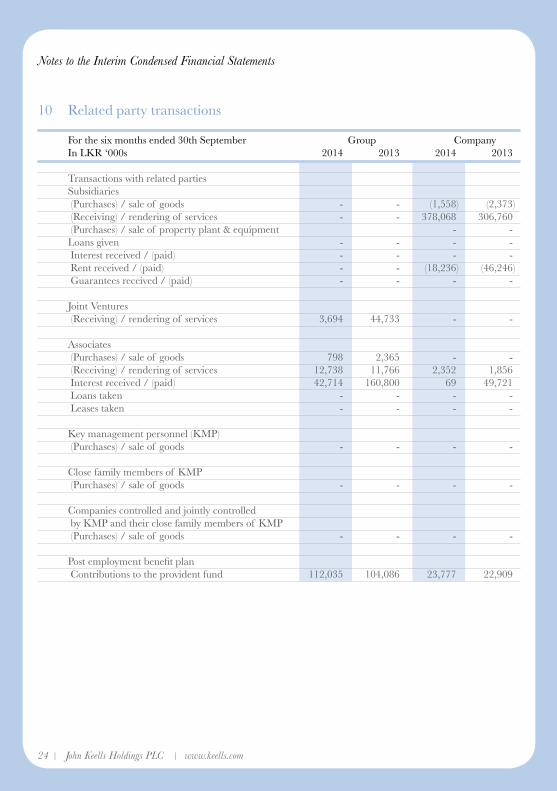
10 Related party transactions
For the six months ended 30th September Group Company In LKR ‘000s 2014 2013 2014 2013
Transactions with related parties Subsidiaries (Purchases) / sale of goods - - (1,558) (2,373) (Receiving) / rendering of services - - 378,068 306,760 (Purchases) / sale of property plant & equipment - - Loans given - - - - Interest received / (paid) - - - - Rent received / (paid) - - (18,236) (46,246) Guarantees received / (paid) - - - - Joint Ventures (Receiving) / rendering of services 3,694 44,733 - - Associates (Purchases) / sale of goods 798 2,365 - - (Receiving) / rendering of services 12,738 11,766 2,352 1,856 Interest received / (paid) 42,714 160,800 69 49,721 Loans taken - - - - Leases taken - - - - Key management personnel (KMP) (Purchases) / sale of goods - - - - Close family members of KMP (Purchases) / sale of goods - - - - Companies controlled and jointly controlled by KMP and their close family members of KMP (Purchases) / sale of goods - - - - Post employment benefit plan Contributions to the provident fund 112,035 104,086 23,777 22,909
Chairman’s Message Financial Information
24 l John Keells Holdings PLC l www.keells.com Interim condensed financial statements l 25
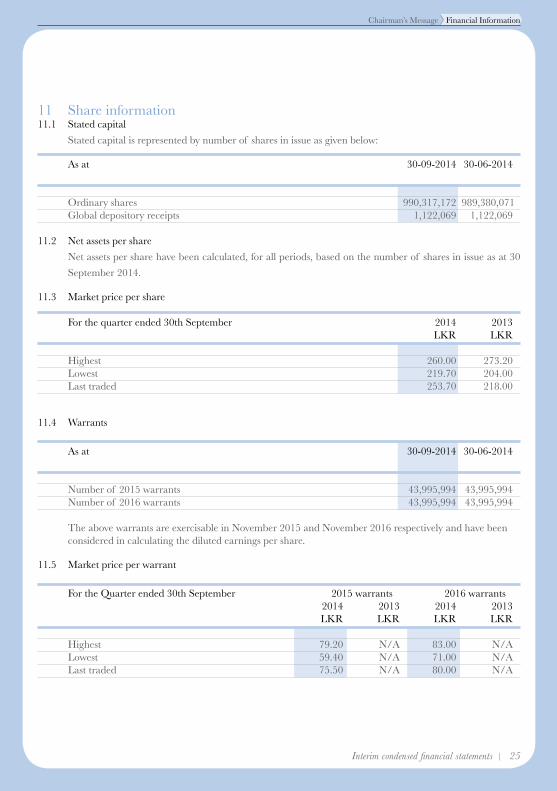
11 Share information11.1 Stated capital
Stated capital is represented by number of shares in issue as given below:
As at 30-09-2014 30-06-2014
Ordinary shares 990,317,172 989,380,071 Global depository receipts 1,122,069 1,122,069
11.2 Net assets per share
Net assets per share have been calculated, for all periods, based on the number of shares in issue as at 30
September 2014.
11.3 Market price per share
For the quarter ended 30th September 2014 2013 LKR LKR
Highest 260.00 273.20 Lowest 219.70 204.00 Last traded 253.70 218.00
11.4 Warrants
As at 30-09-2014 30-06-2014
Number of 2015 warrants 43,995,994 43,995,994 Number of 2016 warrants 43,995,994 43,995,994
The above warrants are exercisable in November 2015 and November 2016 respectively and have been considered in calculating the diluted earnings per share.
11.5 Market price per warrant
For the Quarter ended 30th September 2015 warrants 2016 warrants 2014 2013 2014 2013 LKR LKR LKR LKR
Highest 79.20 N/A 83.00 N/A Lowest 59.40 N/A 71.00 N/A Last traded 75.50 N/A 80.00 N/A
26 l John Keells Holdings PLC l www.keells.com
Notes to the Interim Condensed Financial Statements
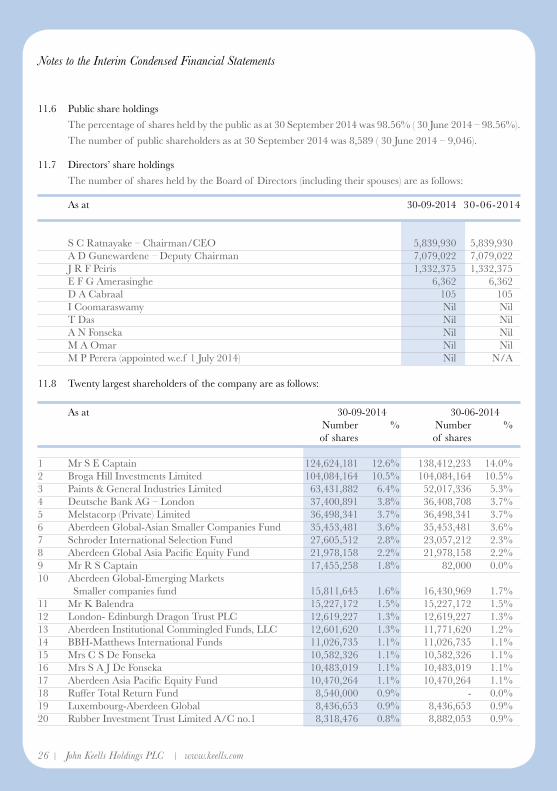
11.6 Public share holdings
The percentage of shares held by the public as at 30 September 2014 was 98.56% ( 30 June 2014 – 98.56%).
The number of public shareholders as at 30 September 2014 was 8,589 ( 30 June 2014 – 9,046).
11.7 Directors’ share holdings
The number of shares held by the Board of Directors (including their spouses) are as follows:
As at 30-09-2014 30-06-2014
S C Ratnayake – Chairman/CEO 5,839,930 5,839,930 A D Gunewardene – Deputy Chairman 7,079,022 7,079,022 J R F Peiris 1,332,375 1,332,375 E F G Amerasinghe 6,362 6,362 D A Cabraal 105 105 I Coomaraswamy Nil Nil T Das Nil Nil A N Fonseka Nil Nil M A Omar Nil Nil M P Perera (appointed w.e.f 1 July 2014) Nil N/A
11.8 Twenty largest shareholders of the company are as follows:
As at 30-09-2014 30-06-2014 Number % Number % of shares of shares
1 Mr S E Captain 124,624,181 12.6% 138,412,233 14.0%2 Broga Hill Investments Limited 104,084,164 10.5% 104,084,164 10.5%3 Paints & General Industries Limited 63,431,882 6.4% 52,017,336 5.3%4 Deutsche Bank AG – London 37,400,891 3.8% 36,408,708 3.7%5 Melstacorp (Private) Limited 36,498,341 3.7% 36,498,341 3.7%6 Aberdeen Global-Asian Smaller Companies Fund 35,453,481 3.6% 35,453,481 3.6%7 Schroder International Selection Fund 27,605,512 2.8% 23,057,212 2.3%8 Aberdeen Global Asia Pacific Equity Fund 21,978,158 2.2% 21,978,158 2.2%9 Mr R S Captain 17,455,258 1.8% 82,000 0.0%10 Aberdeen Global-Emerging Markets Smaller companies fund 15,811,645 1.6% 16,430,969 1.7%11 Mr K Balendra 15,227,172 1.5% 15,227,172 1.5%12 London- Edinburgh Dragon Trust PLC 12,619,227 1.3% 12,619,227 1.3%13 Aberdeen Institutional Commingled Funds, LLC 12,601,620 1.3% 11,771,620 1.2%14 BBH-Matthews International Funds 11,026,735 1.1% 11,026,735 1.1%15 Mrs C S De Fonseka 10,582,326 1.1% 10,582,326 1.1%16 Mrs S A J De Fonseka 10,483,019 1.1% 10,483,019 1.1%17 Aberdeen Asia Pacific Equity Fund 10,470,264 1.1% 10,470,264 1.1%18 Ruffer Total Return Fund 8,540,000 0.9% - 0.0%19 Luxembourg-Aberdeen Global 8,436,653 0.9% 8,436,653 0.9%20 Rubber Investment Trust Limited A/C no.1 8,318,476 0.8% 8,882,053 0.9%
Chairman’s Message Financial Information
26 l John Keells Holdings PLC l www.keells.com Interim condensed financial statements l 27
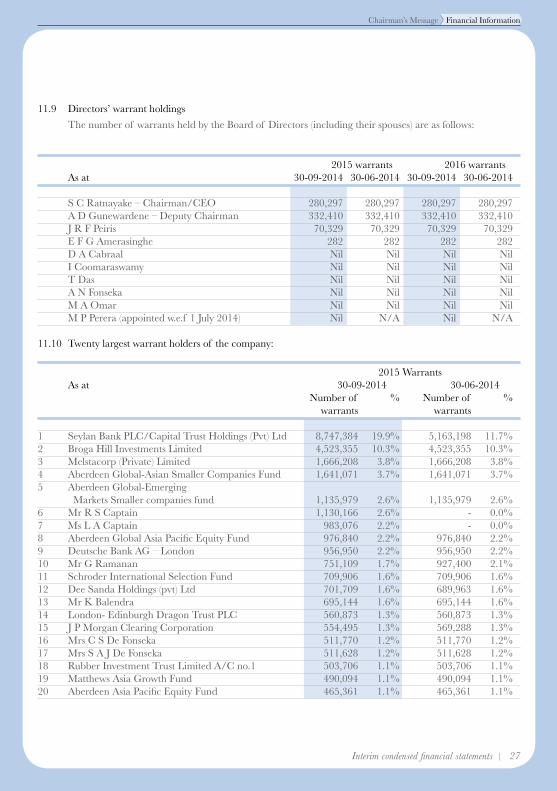
11.9 Directors’ warrant holdings
The number of warrants held by the Board of Directors (including their spouses) are as follows:
2015 warrants 2016 warrants As at 30-09-2014 30-06-2014 30-09-2014 30-06-2014
S C Ratnayake – Chairman/CEO 280,297 280,297 280,297 280,297 A D Gunewardene – Deputy Chairman 332,410 332,410 332,410 332,410 J R F Peiris 70,329 70,329 70,329 70,329 E F G Amerasinghe 282 282 282 282 D A Cabraal Nil Nil Nil Nil I Coomaraswamy Nil Nil Nil Nil T Das Nil Nil Nil Nil A N Fonseka Nil Nil Nil Nil M A Omar Nil Nil Nil Nil M P Perera (appointed w.e.f 1 July 2014) Nil N/A Nil N/A
11.10 Twenty largest warrant holders of the company:
2015 Warrants As at 30-09-2014 30-06-2014 Number of % Number of % warrants warrants
1 Seylan Bank PLC/Capital Trust Holdings (Pvt) Ltd 8,747,384 19.9% 5,163,198 11.7%2 Broga Hill Investments Limited 4,523,355 10.3% 4,523,355 10.3%3 Melstacorp (Private) Limited 1,666,208 3.8% 1,666,208 3.8%4 Aberdeen Global-Asian Smaller Companies Fund 1,641,071 3.7% 1,641,071 3.7%5 Aberdeen Global-Emerging Markets Smaller companies fund 1,135,979 2.6% 1,135,979 2.6%6 Mr R S Captain 1,130,166 2.6% - 0.0%7 Ms L A Captain 983,076 2.2% - 0.0%8 Aberdeen Global Asia Pacific Equity Fund 976,840 2.2% 976,840 2.2%9 Deutsche Bank AG – London 956,950 2.2% 956,950 2.2%10 Mr G Ramanan 751,109 1.7% 927,400 2.1%11 Schroder International Selection Fund 709,906 1.6% 709,906 1.6%12 Dee Sanda Holdings (pvt) Ltd 701,709 1.6% 689,963 1.6%13 Mr K Balendra 695,144 1.6% 695,144 1.6%14 London- Edinburgh Dragon Trust PLC 560,873 1.3% 560,873 1.3%15 J P Morgan Clearing Corporation 554,495 1.3% 569,288 1.3%16 Mrs C S De Fonseka 511,770 1.2% 511,770 1.2%17 Mrs S A J De Fonseka 511,628 1.2% 511,628 1.2%18 Rubber Investment Trust Limited A/C no.1 503,706 1.1% 503,706 1.1%19 Matthews Asia Growth Fund 490,094 1.1% 490,094 1.1%20 Aberdeen Asia Pacific Equity Fund 465,361 1.1% 465,361 1.1%
28 l John Keells Holdings PLC l www.keells.com
Notes to the Interim Condensed Financial Statements
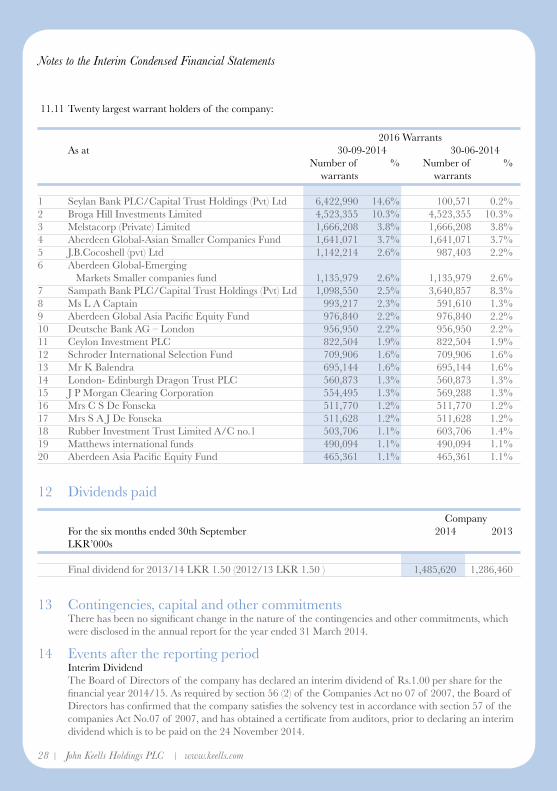
11.11 Twenty largest warrant holders of the company:
2016 Warrants As at 30-09-2014 30-06-2014 Number of % Number of % warrants warrants
1 Seylan Bank PLC/Capital Trust Holdings (Pvt) Ltd 6,422,990 14.6% 100,571 0.2%2 Broga Hill Investments Limited 4,523,355 10.3% 4,523,355 10.3%3 Melstacorp (Private) Limited 1,666,208 3.8% 1,666,208 3.8%4 Aberdeen Global-Asian Smaller Companies Fund 1,641,071 3.7% 1,641,071 3.7%5 J.B.Cocoshell (pvt) Ltd 1,142,214 2.6% 987,403 2.2%6 Aberdeen Global-Emerging Markets Smaller companies fund 1,135,979 2.6% 1,135,979 2.6%7 Sampath Bank PLC/Capital Trust Holdings (Pvt) Ltd 1,098,550 2.5% 3,640,857 8.3%8 Ms L A Captain 993,217 2.3% 591,610 1.3%9 Aberdeen Global Asia Pacific Equity Fund 976,840 2.2% 976,840 2.2%10 Deutsche Bank AG – London 956,950 2.2% 956,950 2.2%11 Ceylon Investment PLC 822,504 1.9% 822,504 1.9%12 Schroder International Selection Fund 709,906 1.6% 709,906 1.6%13 Mr K Balendra 695,144 1.6% 695,144 1.6%14 London- Edinburgh Dragon Trust PLC 560,873 1.3% 560,873 1.3%15 J P Morgan Clearing Corporation 554,495 1.3% 569,288 1.3%16 Mrs C S De Fonseka 511,770 1.2% 511,770 1.2%17 Mrs S A J De Fonseka 511,628 1.2% 511,628 1.2%18 Rubber Investment Trust Limited A/C no.1 503,706 1.1% 603,706 1.4%19 Matthews international funds 490,094 1.1% 490,094 1.1%20 Aberdeen Asia Pacific Equity Fund 465,361 1.1% 465,361 1.1%
12 Dividends paid
Company For the six months ended 30th September 2014 2013 LKR’000s
Final dividend for 2013/14 LKR 1.50 (2012/13 LKR 1.50 ) 1,485,620 1,286,460
13 Contingencies, capital and other commitments There has been no significant change in the nature of the contingencies and other commitments, which
were disclosed in the annual report for the year ended 31 March 2014.
14 Events after the reporting period Interim Dividend The Board of Directors of the company has declared an interim dividend of Rs.1.00 per share for the
financial year 2014/15. As required by section 56 (2) of the Companies Act no 07 of 2007, the Board of Directors has confirmed that the company satisfies the solvency test in accordance with section 57 of the companies Act No.07 of 2007, and has obtained a certificate from auditors, prior to declaring an interim dividend which is to be paid on the 24 November 2014.
Corporate Information
Name of CompanyJohn Keells Holdings PLC
Legal FormPublic Limited Liability CompanyIncorporated in Sri Lanka in 1979Ordinary Shares listed on theColombo Stock ExchangeGDRs listed on the LuxembourgStock Exchange
Company Registration No.PQ 14
DirectorsS C Ratnayake – ChairmanA D Gunewardene – Deputy ChairmanJ R F PeirisE F G AmerasingheD A CabraalI CoomaraswamyT DasA N FonsekaM A OmarM P Perera
Senior Independent DirectorE F G Amerasinghe
Audit CommitteeA N Fonseka - ChairmanD A CabraalI Coomaraswamy M P Perera
Human Resources and Compensation CommitteeE F G Amerasinghe – ChairmanI CoomaraswamyA N FonsekaM A Omar
Nominations CommitteeT Das – ChairmanE F G AmerasingheD A CabraalM A OmarM P PereraS C Ratnayake
Related Party Transactions Review CommitteeA N Fonseka – ChairmanE F G AmerasingheD A CabraalJ R F PeirisM P PereraS C Ratnayake
BankersBank of CeylonCitibank N.ACommercial BankDeutsche Bank A.GDFCC BankDFCC Vardhana BankHatton National BankHongkong & Shanghai BankingCorporationMuslim Commercial BankNations Trust BankNational Savings BankPan Asia Banking CorporationPeople’s BankSampath BankSeylan BankStandard Chartered Bank
Depository for GDRsCitibank N.ANew York
Registered office of the Company117, Sir Chittampalam A GardinerMawatha, Colombo 2, Sri LankaInternet: www.keells.comEmail: [email protected]
Secretaries and RegistrarsKeells Consultants (Pvt) Limited117, Sir Chittampalam A GardinerMawatha,Colombo 2, Sri LankaTelephone : +94 11 230 6245Facsimile : +94 11 243 9037
Investor RelationsJohn Keells Holdings PLC117, Sir Chittampalam A GardinerMawatha, Colombo 2, Sri LankaTelephone : +94 11 230 6165 +94 11 230 6000Facsimile : +94 11 230 6160Email: [email protected]
Group Sustainability and Enterprise Risk ManagementJohn Keells Holdings PLC117, Sir Chittampalam A GardinerMawatha, Colombo 2, Sri LankaTelephone : +94 11 230 6182Facsimile : +94 11 230 6249Email: [email protected]
Contact for Media Corporate Communications DivisionJohn Keells Holdings PLC117, Sir Chittampalam A GardinerMawatha, Colombo 2, Sri LankaTelephone : +94 11 230 6191Email: [email protected]
AuditorsErnst & YoungChartered AccountantsP.O. Box 101Colombo, Sri Lanka

www.keells.com