jj--:x/ - nasa · jj--:x/ nasa technical ... period of about 30 years a number of specific flyover...
TRANSCRIPT

j J--:x/
NASA Technical Memorandum 110289
Comparisons of Methods for PredictingCommunity Annoyance Due to SonicBooms
Harvey H. Hubbard
NASA Distinguished Research Associate
Langley Research Center, Hampton, Virginia
Kevin P. Shepherd
Langley Research Center, Hampton, Virginia
November 1996
National Aeronautics and
Space AdministrationLangley Research CenterHampton, Virginia 23681-0001
https://ntrs.nasa.gov/search.jsp?R=19970010460 2018-05-31T22:24:08+00:00Z


A BS TRA CT
Two approaches to the prediction of community response to sonic boom exposure
are examined and compared. The first approach is based on the wealth of data
concerning community response to common transportation noises coupled with
results of a sonic boom/aircraft noise comparison study. The second approach is
based on limited field studies of community response to sonic booms. Substantial
differences between indoor and outdoor listening conditions are observed. Rea-
sonable agreement is observed between predicted community responses and
available measured responses.
INTRODUCTION
Continued interest in future supersonic transport developments has stimulated
concern for the associated sonic booms and their effects on communities. Over a
period of about 30 years a number of specific flyover tests have been conducted
and some additional overflight experience has been accumulated regarding com-
munity reactions to sonic booms (refs. 1-10).
A much larger number of related community noise response studies have been
performed to assess transportation noises and high-energy impulsive noises. The
purposes of this paper are to summarize the subjective reaction data available from
sonic boom overflight tests and from other related studies; and to present methods
of predicting community responses based on both A-weighted and C-weighted
metrics for comparison.

ANNOYANCE CRITERIA
The opportunity is taken to evaluate two different approaches to the assessment of
annoyance in communities due to sonic booms from overflying supersonic aircraft.
The first approach is to make use of the very large data base of community
response data collected by Schultz (ref. 11) relative to noises from subsonic air-
craft, road traffic, and railroads. A subsequent effort (ref. 12) updates the original
Schultz findings with data from additional social surveys conducted since the publi-
cation of ref. 11. Although the total number of data points more than tripled for this
new study, it was concluded that the original relationship formulated by Schultz
provides a reasonable fit to all of the available transportation noise data. These
results are summarized in Figure 1, which shows the percentage of the population
highly annoyed by subsonic transportation noise as a function of noise level. The
primary descriptor is day-night average A-weighted sound level (Ldn).
The second approach is supported by documentation in refs. 13 and 14, and can
be described with the aid of Figure 2. Figure 2 is based on the tabulated values
from Appendix B of Ref. 14. The percentage of the population highly annoyed is
shown as a function of Lcd n, which is defined as day-night average C-weighted
sound level. C-weighting is proposed as a more appropriate metric for assessing
high-energy sounds such as sonic booms, quarry blasting, and artillery sounds,
which can excite noticeable vibrations in buildings and other structures and can
induce secondary auditory effects such as house rattling. These vibrations-related
phenomena are widely recognized as being significant in the responses of sonic
boom listeners who are located indoors.
2

With regard to the two assessment approaches described above, the Ldnmetric
should be appropriate for out-of-doors listening, whereas the Lc_nshould be more
appropriate for in-doors listening. Human response data from refs. 1 and 2 are in a
form that permits the testing of the above hypotheses.
AVAILABLE SONIC BOOM DATA BASES
The most comprehensive study of subjective reaction to individual sonic booms
was conducted during the flight tests at Edwards Air Force Base, as reported in
refs. 1 and 2. Additional significant field data are available from the Oklahoma City
flight tests (refs. 3 and 4), the St. Louis flight tests (refs. 7 and 8), the Edwards
community survey (refs. 1 and 2), the British exercise Westminster (refs. 5 and 6),
and the French community surveys (refs. 9 and 10).
The sonic boom test results that are used as a basis for the development of the
proposed community response prediction method were obtained in a series of
overflight studies conducted at Edwards AFB during the period of June 1966-
January 1967 (refs. 1 and 2). The general test layout is shown schematically in
Figure 3. The human subjects were arranged into indoor and outdoor juries in a
test area remote from normal military operations. Supersonic aircraft at relatively
high altitudes and subsonic aircraft at relatively low altitudes were vectored over
the test area in a planned sequence and on a tight schedule. Measurements of air-
craft noise, sonic booms, and associated building vibration responses (ref. 15)
were made for all test flights for correlation with the subjective results.
A total of 300 human test subjects were used in indoor and outdoor listening situa-
tions. The indoor listeners were deployed in houses specially constructed to be
3

representative of typical midwestem U.S.A. houses from the 1970s, and were in the
near vicinity of the outdoor listeners. About 100 of the subjects were from the
Edwards AFB area, where they had previous exposure over an average period of
2-1/2 years to about four to eight sonic booms per day. The other test subjects
were from communities that were not routinely exposed to sonic booms. Test
noises were presented in pairs consisting of two booms, two flyover noises, or one
of each.
The subjects judged the relative acceptability of the sounds from each pair of vec-
tored flights and also rated the first of each pair of sounds on a numerical scale
from very acceptable to unacceptable. As an example, the previously exposed
persons judged the boom from either a F-104, B-58, or XB-70 of about 1.7 psf to be
about as acceptable as the flyover noise from a subsonic jet aircraft at a maximum
level of 109 PNdB when exposed outdoors. These results are comparable to those
from Project Westminster (refs. 6 and 16), in which 1.7-psf booms from a Lightning
aircraft were judged to be equal to 110 PNdB when judged indoors and 105 PNdB
when judged outdoors.
The naive subjects, under the Edwards test conditions, judged comparable noise
levels to be higher by 8-10 PNdB indoors and 5-8 PNdB outdoors. Thus, to these
naive subjects, the booms were markedly less acceptable than they were to the
more experienced subjects.
All sonic boom data presented in the following figures are from the experienced
subjects. They were chosen in order to represent the long-term, steady-state con-
ditions, which are also implicit in the community response data of refs. 11 and 14.
4

They obviously do not properly represent the initial reactions to sonic booms by
naive subjects with little previous exposure experience.
In the paired comparison tests (refs. 1 and 2), aircraft sounds were presented in
pairs with approximately 1 to 2 minutes between the members of each pair and a
minimum interval between pairs of 4 to 5 minutes. Each experimental condition
was repeated four times, twice with sound A of the pair given first and twice with
sound B of the pair given first. The subjects' task was to indicate on an answer
sheet which sound of each pair would be the more acceptable if it were to be heard
in or near their homes.
Figure 4 shows some sample results from one of the boom evaluation tests. Note
that three data points are included for both the outdoor and indoor listening situa-
tions. They represent an average response from the listeners as to whether the
particular sonic boom presented (Apo = 2.8 psf) was preferable to the various com-
parison aircraft flyover noises. The 50-percent point on each diagram is assumed
to be at the airplane noise level which is equivalent in acceptability to the example
sonic boom having an overpressure of 2.8 psf. Other similar paired comparisons at
different overpressure levels were made, from which the equivalence data of
Figure 5 were obtained.
The results of Figure 5 suggest that there is a linear relationship between the
maximum recorded flyover noise levels and the log of the measured sonic boom
overpressures for equal acceptability for either the indoor or the outdoor listening
situation. This linear relationship is fortuitous and facilitates our desired extrapola-
tion to lower and higher sonic boom overpressures in Figures 6 and 9. It can be
seen that the slopes are different for the indoor and outdoor situations. A doubling
5
of the sonic boom overpressure is associated with a 9.5-dB increase in perceived
noise levels for the indoor subjects. On the other hand, the corresponding increase
for the outdoor subjects is about 14 dB. This higher slope for outdoor listening
conditions may possibly be attributed to the shorter rise times generally ascribed to
the higher z_po values. Shorter rise time signatures have more high-frequency
content and, hence, are usually observed as being louder (ref. 17). Outdoor sub-
jects would be affected directly, whereas the building structures would attenuate
the high frequencies for indoor subjects. On the other hand, indoor subjects are
exposed to induced vibrations and secondary auditory effects.
A general result of the above tests is that the equivalent perceived noise levels
were always higher for the indoor subjects than for the outdoor subjects for any
given sonic boom overpressure (measured outside) within the test range.
EXAMPLE ANNOYANCE PREDICTIONS
Methods are presented for predicting community responses to sonic booms based
on both A-weighted and C-weighted metrics. The results are compared with avail-
able data.
Outdoor Subjects
The "outdoor subjects" line of Figure 5 is carried over to Figure 6 as an aid in dis-
playing the equivalent noise exposure level for different sonic boom exposure
scenarios, and is identified with a one-boom-per-day exposure rate. Data for one-
boom-per-day are extrapolated to other boom repetition rates by assuming a 3-
PNdB increase for each doubling of the boom repetition rate. The curves of
6

Figure 6 for exposure rates from 1 to 64 booms per day are used later in this paper
as a basis for prediction of community response.
Also shown on Figure 6, on the right hand side, is an equivalent day-night average
sound level (Ldn) scale for aircraft flyover noises. The relationship between the
maximum value of perceived noise level and Ldn is estimated from the appropriate
information on pages 136 and 137 of ref. 18. For single events occurring during
daylight hours, the Ldn value of flyover noise is noted to be 47 dB lower than the
corresponding maximum value of perceived noise level. Based on the jury tests
equating perceived noise levels and sonic boom overpressures, their equivalence
with the metric Ldn, as indicated in Figure 6, is assumed to also be valid. This is a
useful result, because it provides the mechanism for producing the curves of Figure
7 from the data of Figures 1 and 6. For the purposes of this paper in the develop-
ment of the sonic boom annoyance prediction method proposed for out-of-doors
listeners, the Schultz curve is selected. It is recognized as the best currently avail-
able estimate of community annoyance due to subsonic aircraft and surface trans-
portation noises. Furthermore, it is based on a very large data sample.
Predicted annoyance due to sonic booms is shown in Figure 7. Percentage of the
population highly annoyed is plotted as a function of sonic boom overpressure for
various boom repetition rates. The individual curves are constructed from the
information included in Figures 1 and 6, and they will be referred to as Kryter-
Schultz curves. For a given sonic boom level and repetition rate, the equivalent Ldn
value was obtained from Figure 6. This value, in tum, was used to derive the
percentage highly annoyed from Figure 1.
7

The resulting prediction curves of Figure 7 indicate the expected community
response in terms of percentage highly annoyed for a range of sonic boom over-
pressures and repetition rates. As an example, 10 percent of the population is
predicted to be highly annoyed by exposure to 64 booms per day at an overpres-
sure of 0.83 psf or to one boom per day at an overpressure of 2.0 psf.
An obvious question is: How realistic are the predictions of Figure 7? In order to
answer that question, the data of Figure 8 are presented. Predictions for 16 booms
per day, based on Kryter-Schultz (Fig. 7), are compared in Figure 8 with independ-
ently obtained results of the Edwards jury tests (refs. 1 and 2). In these tests, the
subjects were asked to give an absolute rating to the first of each pair of airplane
noises or sonic booms heard during the tests. They were asked to note whether or
not that particular noise would be acceptable if heard at home 10-15 times each
day. The results of these jury tests are indicated by the square data points in
Figure 8. Each data point indicates the percentage of the jury who said that outside
booms of a particular overpressure were unacceptable if experienced 10-15 times
each day.
Also included is a curve of short dashes, which has been faired through the Okla-
homa City interview results, as tabulated in Table 2 of ref. 18, and which represents
the serious annoyance of persons exposed to eight booms per day. Assuming that
the terms "serious annoyance," "highly annoyed," and "unacceptable" are roughly
equivalent, the three sets of data can be compared and are seen to be generally
consistent.
8

Indoor Subjects
Similar human reaction results are available for subjects exposed to sonic booms
while inside of house structures. Two sets of data are presented.
Kryter-Schultz. The first set of data is that from the indoor subjects of Figure 5.
These data were obtained simultaneously with those of the outdoor subjects that
have been presented in Figures 6, 7, and 8. The indoor curve of Figure 5 is carried
over to Figure 9, is extrapolated to both higher and lower values, and is labeled "1
boom per day." The higher order exposure curves of Figure 9 were constructed in
the same manner as those in Figure 6 and are used in connection with Figure 1 to
produce the prediction curves of Figure 10. Note that a comparison of Figures 6
and 10 indicates a consistently higher percentage of highly annoyed persons for
the indoor listeners compared to the outdoor listeners, for the same nominal sonic
boom exposures.
ANSI. The National Research Council CHABA Committee (ref. 13) and subse-
quent ANSI standard (ref. 14) proposed an altemate method for assessment of
high-energy impulsive sounds with respect to residential communities. This
method, based on "C"-weighted sound level, is illustrated in Figure 2. The
Edwards data did not contain any "C"-weighted metrics. These quantities have,
however, been retroactively estimated for the Edwards tests based on results of
recent overflight measurements for aircraft operations similar to those of the
Edwards study (ref. 19). These latter results, which are shown not to be sensitive to
different sizes and types of aircraft, suggest that day-night average C-weighted
sound levels are empirically related to peak sound pressure levels. Conversions
are based on the following analysis:
9

Lc_,dn = Lce + 10LogN - 49.4, dB
where Lee is C-weighted sound exposure level in dB and N is the number of
events per day.
Thus, when N = 1 daylight flight,
Lcd n -" Lce - 49.4 dB
Lce = Lpk - C, d B
where Lpk is peak sound pressure level and C has been evaluated empiri-
cally to be 26.6 dB in ref. 19.
Shown graphically in Figure 11 is the relationship between Lcd n and I.._, as well as
the equal energy concept. Note that no subjective response data are included in
Figure 11. The data of Figures 2 and 11 are used to produce the set of ANSI
curves of Figure 12 for predicting the response of indoor listeners. Predictions of
"highly annoyed" are given for a range of sonic boom overpressures and for differ-
ent repetition rates. As an example, a 10-percent highly annoyed response would
be predicted for 64 booms per day at an overpressure of 0.29 psf, or for 1 boom per
day at an overpressure of 2.2 psf.
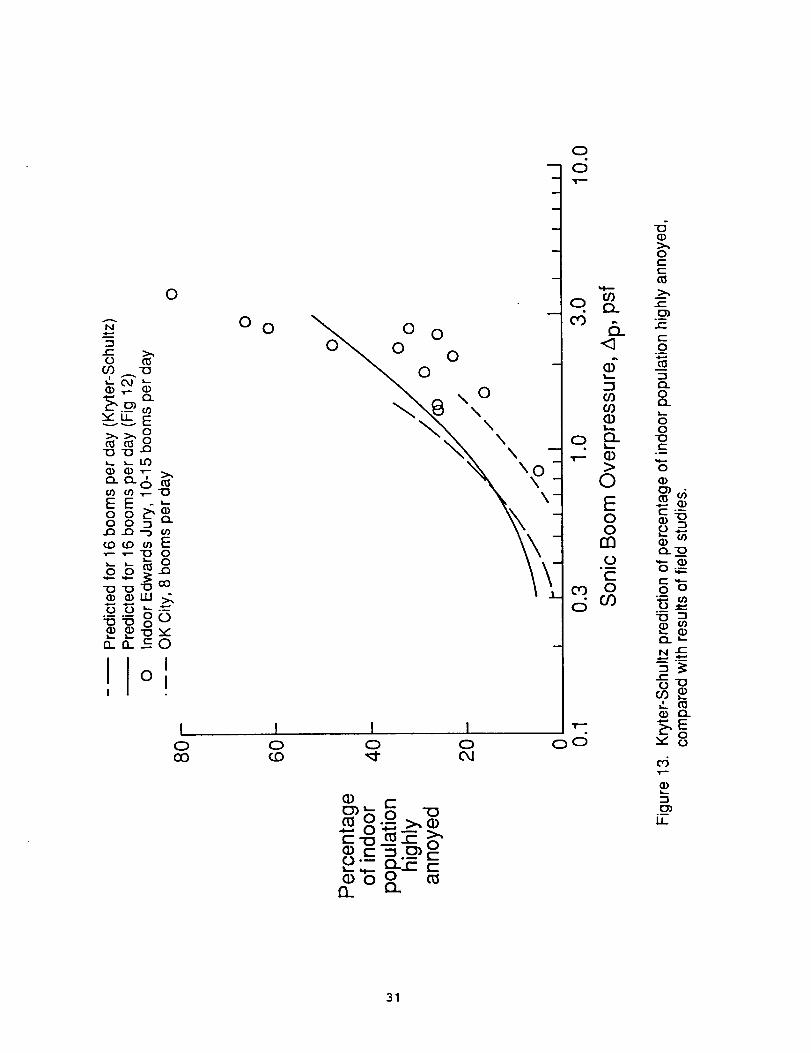
The indoor prediction results of Figure 12 are compared with other similar data sets
in Figure 13. As in the discussion of Figure 8, the terms "highly annoyed,"
"unacceptable," and "seriously annoyed" are assumed to be roughly equivalent.
The 16 booms per day ANSI and Kryter-Schultz curves are shown along with the
10

indoor Edwards jury results for 10-15 booms per day and the Oklahoma City data
for 8 booms per day for comparison. There is more scatter than for the outdoor
data of Figure 8. The predictions are, however, generally consistent with the
Oklahoma City data and the Edwards jury data.
In comparing the indoor results of Figure 13 with the outdoor results of Figure 8, it
can be seen that for the same outdoor exposure, the indoor subjects are relatively
more annoyed. It should be noted that the Oklahoma City data line is the same in
Figures 8 and 13, and is defined by a mixture of indoor and outdoor observations.
Thus, it would be expected to fall relatively high on Figure 8 and relatively low on
Figure 12.
COMPARISONS WITH OTHER OVERFLIGHT DATA
The general consistency of the data sets of Figures 8 and 13 suggests that useful
comparisons may also be made with other data sets and observations from a
number of independent field studies involving supersonic aircraft flyovers, as
shown in Figures 14 and 15. Available data are grouped together for comparison
with predicted curves of 13 percent and 25 percent highly annoyed, respectively,
for both inside and outside observers. In each case, the figure legends give the
sources and associated community responses.
The triangle data point in Figure 13 and the hatched area in Figure 14 come from a
series of French community surveys in regions where Concorde and military
operations were conducted (refs. 9 and 10). Nearly 4,000 interviews of people 20
years of age or older were accomplished by the Institute Francais d'Opinion Pub-
lique in November 1970.
11

Residents of Edwards AFB were asked in mail questionnaires to rate the noise
conditions present when about 10 booms per day were experienced during the
subjective tests and also for the preceding period when the boom exposure rate
was estimated to be four to eight booms per day. These results, from refs. 1 and 2,
are represented by the hatched area on Figure 14 and the circle data point on
Figure 15. Likewise, the cross-hatched areas in both figures represent the abso-
lute judgment results of the Edwards jury tests involving 120 respondents located
indoors and outdoors. These latter results are taken from the data shown in Fig-
ures 8 and 13, and are points on a faired curve through those data (refs. 1 and 2).
The Oklahoma City, Oklahoma, area was repeatedly exposed to sonic booms dur-
ing simulated supersonic transport overflights conducted at a rate of eight per day
for a 6-month period (refs. 3 and 4). Data were collected along the ground track
and at various lateral distances from it. Overpressure values varied from 0.65 psf
to 1.60 psf. Nearly 3,000 local residents were personally interviewed three times
during the 6-month period to determine the nature and extent of their reactions to
the sonic booms. Interpretations of the results of the above tests in terms of per-
centages of the population who were highly annoyed are provided in ref. 18 and
are presented in Figures 14 and 15 as the square data points. Other interpreta-
tions of the Oklahoma City data are provided in ref. 20 and are plotted as the dia-
mond data points.
The speckled areas in both figures represent results of community reaction flight
experiments over the city of St. Louis, Missouri. A series of special military flights in
a 2-month period (refs. 7 and 8) was conducted to supplement routine military
supersonic traffic over the area. The frequency of boom exposures in the test area
varied over a 5-month period from a low of four per month to a high of six per day.
12

One set of interviews was conducted for 1,145 persons, and 1,011 of them were
re-interviewed about a month later to assess their reactions to both exposures.
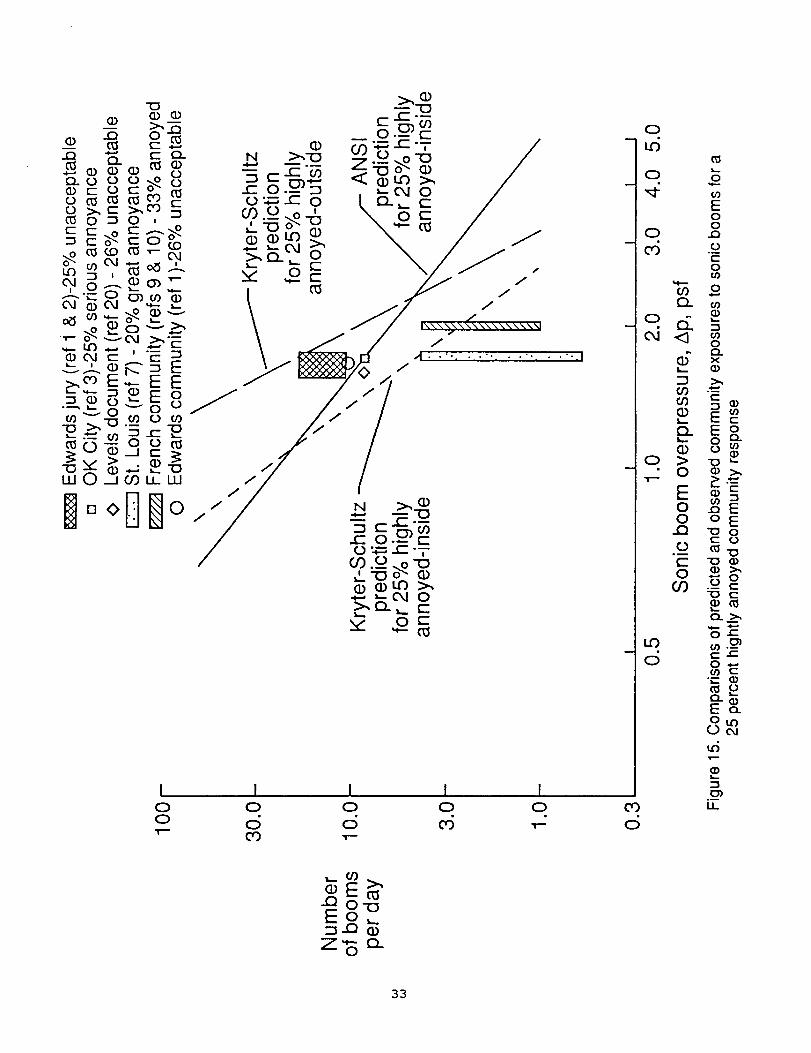
The various data sets shown in Figures 14 and 15 all relate to actual supersonic
flyovers of people and communities. The methodology varied from one study to
another and the terminology used to describe the results also varied. As is indi-
cated in the legends of Figures 14 and 15, the terms "serious annoyance," "highly
annoyed," "unacceptable," and "great annoyance" are assumed to be comparable
for purposes of the figures. The term "annoyed" from the French tests is believed,
however, to represent a less negative reaction than do the other terms noted
above.
Based on the above assumptions, the available field results seem to be in reason-
able agreement with the Kryter-Schultz and the ANSI predictions for 13 percent
highly annoyed in Figure 14. A notable exception is the French data point, which
falls relatively low on the plot, probably for the reason stated above. Reasonable
agreement is also seen in Figure 15, although the French data and the St. Louis
data fall relatively low. They are, however, roughly consistent with the other data
sets.
Note that the ANSI and Kryter-Schultz prediction lines have markedly different
slopes in Figures 14 and 15. The Kryter-Schultz predictions give the more conser-
vative results at high values of sonic boom overpressure for which the startle and
loudness effects may be the most significant. The greater slopes of the Kryter-
Schultz lines arise from the greater-than-unity slopes of both the inside and outside
response lines of Figure 5. On the other hand, the ANSI predictions are more
conservative at the lower sonic boom overpressures, which are likely to be in the
13

operating range of some future supersonic aircraft. The ANSI line is consistent with
the equal energy hypothesis expressed in Ap or Lcdn, i.e. 3 dB per doubling of
number of booms per day.
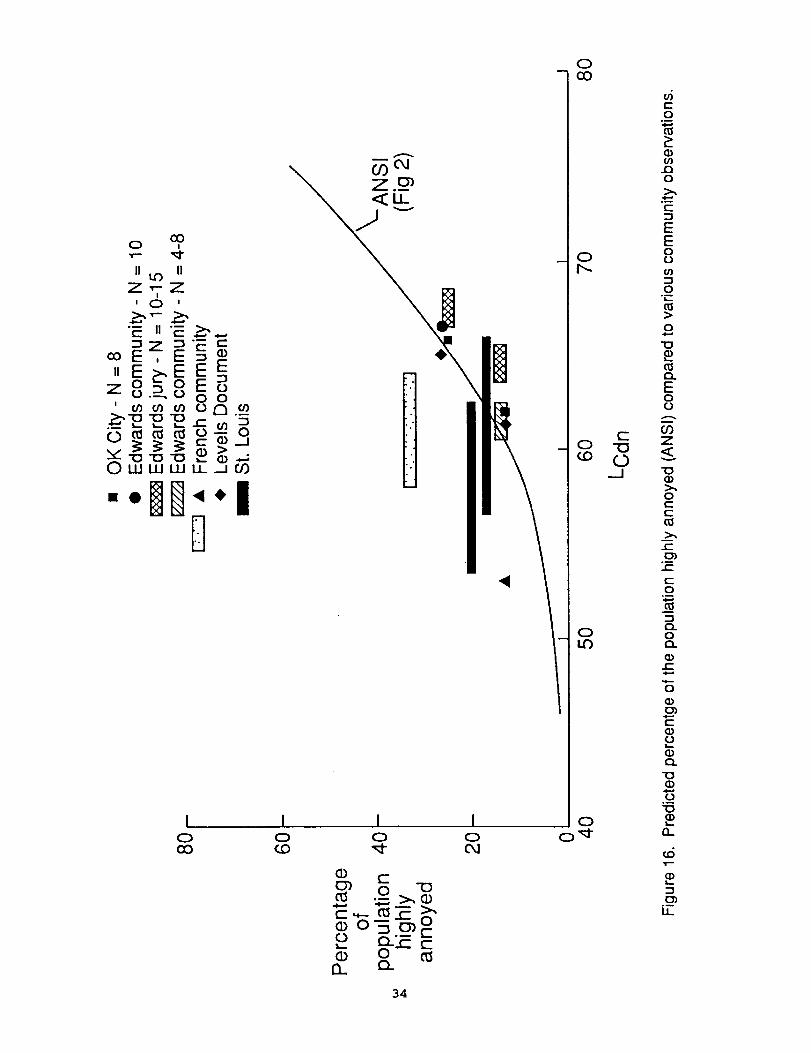
The data of Figures 14 and 15 are compared with the ANSI curve in a different
format in Figure 16. All flyover data are converted to Lcdn units and appropriate
adjustments are made for numbers of booms per day. Generally good agreement
is seen in Figure 16 with the flyover data, which tends to scatter about the ANSI
curve.
COMPARISONS WITH OTHER PREDICTIONS
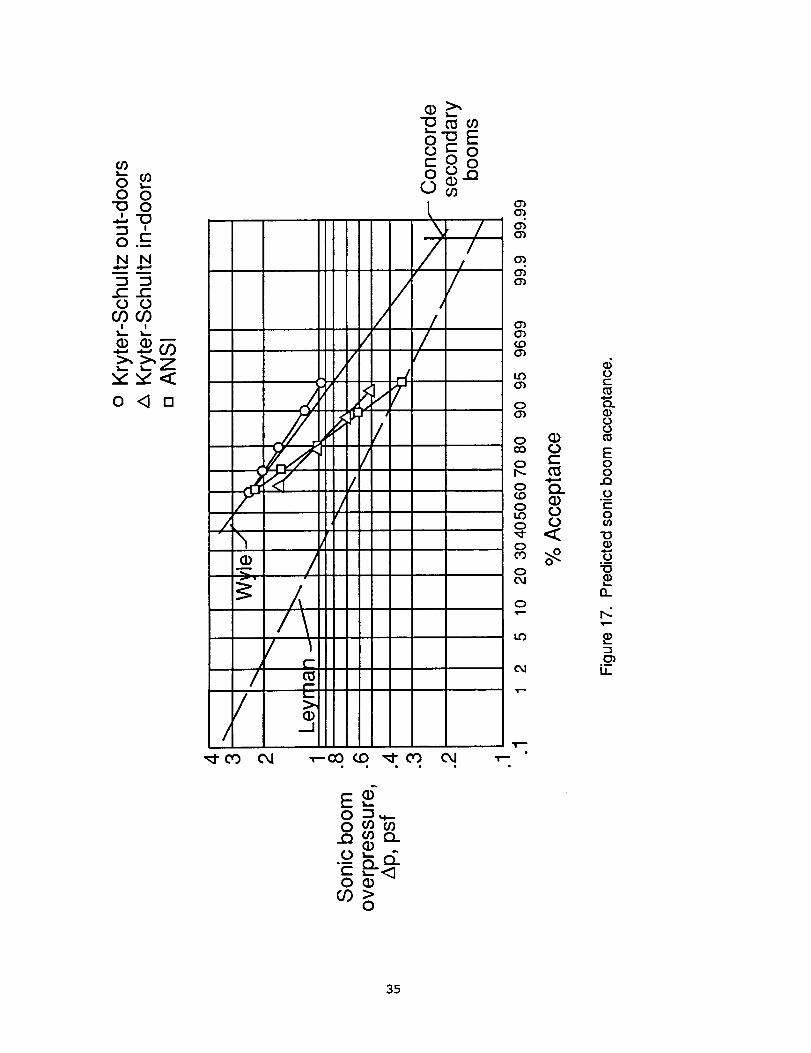
Further comparisons of available estimates of community reaction to sonic booms
are presented in Figure 17 from references 21 and 22. Percentage acceptance on
a probability scale is shown for a range of sonic boom overpressure levels. The
straight lines marked "Leyman" (ref. 21) and "Wyle" (ref. 22) are two interpretations
of the available data with particular emphasis on the Edwards AFB results (refs. 1
and 2). Based on the assumption that "percentage acceptance" is equivalent to the
inverse of "highly annoyed" in Figures 8 and 12, the lines marked Kryter-Schultz
outdoors, Kryter-Schultz indoors, and ANSI are included for comparison.
The Kryter-Schultz outdoors line, which represents a 16-boom-per-day exposure
rate, is nearly coincident with the Wyle line. The Ansi and Kryter-Schultz indoors
lines are in close agreement. They have markedly different slopes, and for sonic
boom exposure levels less than 2 psf, predict a lower rate of acceptance than do
the Wyle and Kryter-Schultz outdoors lines.
14

CONCLUDING REMARKS
Methodology for predicting the percentage of the population that would be highly
annoyed by sonic booms has been formulated. It encompasses indoor-outdoor
responses for steady-state flight conditions and includes the effects of sonic boom
overpressures and repetition rates. It is based on the results of Kryter's sonic boom
flyover tests for experienced subjects, the synthesis of available community noise
data by Schultz for aircraft, highway, and railway noise sources, and the Ansi
approach to the assessment of high-energy impulsive sounds, which may induce
house vibrations. Reasonable agreement is shown between the predicted per-
centages of highly annoyed persons and the interpreted results from several indi-
vidual community surveys involving supersonic overflights.
REFERENCES
. National Sonic Boom Evaluation Office: Sonic Boom Experiments at Edwards
Air Force Base. NSBEO 1-67, Contract AF 49(638)-1758, Stanford Res. Inst.,
July 1967.
. Kryter, Karl D., Johnson, D.J. and Young, J.R.: Psychological Experiments on
Sonic Booms Conducted at Edwards Air Force Base. Contract AF 49 (638)-
1758, Stanford Res. Inst., August 1968.
. Borsky, Paul N.: Community Reactions to Sonic Booms in the Oklahoma City
Area. AMRLTR-GS-37, U.S. Air Force, February 1965.
15

. Hilton, D.A., Huckel, V., Steiner, R., and Maglieri, O.J.: Sonic Boom Exposures
During FAA-Community-Response Studies Over a 6-Month Period in the
Oklahoma City Area. NASA TN D-2539, December 1964.
o Webb D.R.B., and Warren, C.H.E.: Physical Characteristics of the Sonic
Bangs and Other Events at Exercise Westminster. British RAE TR-65248,
November 1965.
. Webb, D.R.B., and Warren, C.H.E.: An Investigation of the Effect of Bangs on
the Subjective Reaction of a Community. British RAE, TR-66072, March 1966.
o Nixon, Charles W., and Hubbard, Harvey H.: Results of USAF-NASA-FAA
Flight Program to Study Community Responses to Sonic Booms in the Greater
St. Louis Area. NASA TND-2705, May 1965.
. Borsky, Paul N.: Community Reactions to Sonic Booms. NASA CR-57022,
August 1962.
° Bremond, J.: Reaction of the French Population to the Supersonic Bang.
NASA TM-75487, May 1980.
10. Anonymous: Attitudes of the People of France Toward the Sonic Bang.
NASA TM-76581, May 1981.
11. Schultz, Theodore J.: Synthesis of Social Surveys on Noise Annoyance,
Jour. Acous. Soc. of Amer., Vol. 64, No. 2, August 1978.
16

12. Fidell, Sanford, Barber, David S., and Schultz, Theodore J.: Updating a
Dosage-effect Relationship for the Prevalence of Annoyance Due to General
Transportation Noise. Jour. Acous. Soc. of America, Vol. 89, No. 1, January
1991.
13. Anonymous: Assessment of Community Response to High-energy Impulsive
Sounds. Report of working group 84, CHABA, National Academy Press,
Washington, DC, 1981.
14. Anonymous: American Standard Method for Assessment of High Energy
Impulsive Sounds with Respect to Residential Communities. ANSI $12.4-
1986.
15. Hubbard, Harvey H.: Vibration Responses of Two House Structures During
the Edwards Air Force Base Phase of the National Sonic Boom Program.
NASA CR 182089, August 1990.
16. Kryter, Karl D.: Sonic Booms From Supersonic Transport. Science, Vol. 163,
pp. 359-367. January 24, 1969.
17. Plotkin, Kenneth J., Sutherland, Louis C., and Molino, John: Environmental
Noise Assessment for Military Aircraft Training Routes. Vol I1: Recommended
noise metric. Report AAMRL-TR-87-001, 1987.
18. Bennett, Ricarda L., and Pearsons, Karl S.: Handbook of Aircraft Noise Met-
rics. NASA CR 3406, March 1981.
17

19. Elmer, K.R., and Joshi, M.C.: Variability of Measured Sonic Boom Signatures.
NASA CR 191483, Vol. I m Technical Report; Vol. IIm Data Report, January
1994.
20. Anonymous: Information on Levels of Environmental Noise Requisite to
Protect Public Health and Welfare with an Adequate Margin of Safety. U.S.
Environmental Protection Agency Report 550/9-74-004, March 1974.
21. Smith, M.J.T., Lowrie, B.W., Brooks, J.R., and Bushell, K.W.: Future Super-
sonic Transport Noise-lessons from the Past. AIAA preprint AIAA 88,2989,
1988.
22. Brown, David, and Sutherland, L.C.: Sonic Boom (Human Response and
Atmospheric Effects) Outdoor-To-Indoor Response. Proceedings of the First
Annual High-Speed Research Workshop, NASA CP 10087, Part 3, April 1992,
pp. 1345-1363.
18

19

I I I I
0 0 0 0CO CO _" C_J
(I) CCn 0
c_- _.T::::o o'5._ °
g_
"6
6
-_-
.E_
0
_ .
"_x::c-._0 _
0 _a_o _
t-- I__'_
n -o
e,i
0 _
Ii
2O

\
\
\
\
\\\
\
\
\\
\\
\\\
\\
\\\
\\
\\
(3imt-o
L_
'-s(/)
o
=mc-o
..Q
-oc
v
\ "o'-s
\ 0J
\ _- _=\_ °Q_
\ C_ x
oo
..Q
m""-. \-_ IJ_
\\ "" \ U._
._-:_............_ a)(/)
\\
(I)R)
"0a)
°_IJ_
(I)L
{3)IJ-
\\\\\\\\\
21

00
I
e-°_
ct)°_
00
"0
0
I I ,
i_. I._ o4
0")c'-
o_
°_m
00
0
o °o
-_ _0o o o_
0 -_'_
.-. __.- _-_
O0 t- ._,0
I
I
I
I
I _
I
I I
0 U'_ 0
0c_
m
._J0 c-eJ I_.
Q
o Q°_
•r- 0e...
o0 ._0 0
0
°mX
0GO
"oe-
Ct)
0
°_r.-o
°_
c-O
.m
o..E00
o_¢IoLL
W
r-
E
if)
E
xw
_3
o_u_
22

I0
T"
U_
0
03
00"0
0
0_
0
.0
CO
00"0c-
l/)
°
0 "_ 0
_-- jD. 0
T-- _ "0 f-
o _o _
-__os _o_-_
23

rn
I I I I I0 0 0 0 0
_-_o o_m__,"0 _._
1"1 °-"
o i_
_ •
e-- I_
_ _-_<-_
_og _.__
C_ 0 07-
.__ ene-LL
"_ "6 _o
e--l__._m
24

I IO O00 CO
CO "_I" _-
z,.6 o_
I IO O
O4
O- d
T"--
Oe5 ,.-
00O_
o0
oO
EO
.8
.oCO
O3
COO
.
O o
Ec
o-c-"
b
£-
Eo
.8"_ el_
"*"- C0 0cNO_
C
_ r"
0C Yr- r-"
c_°_
8-8
o0..
5_
0 _
C_
t,z
25

[]
[] IDE_] OO_
? _
._o g,--Z-oo
!I [] ,
I ! I I !0 0 0 0 00 CO (.D '_ 0_1
0")0_o°_
0
-o
5o _ -_
o & g
C _
• 0 0
0") _ m
N I-
I--
0v o
.--
U_
26

CO
0 0 C) 0i",- CO L(")
I i i i
27

I000
..013-
..0
\
I I I0 0 0 0(.0 CY
-8
Od•T-- "7
0
>
"7
0 _ _'-
O_ o
oc_.0 q)
c__ _c
o -oN
._ __: Or-- _'8O ....
• c-O on
12)
._ O
-.8O
_ c
d
'-n
IF_
28

C)CO
29

(D C
m_ n_cD_
c5
if)
o c-¢.D
l:::co oo_.ID
c- --
ou)_Zo<C c-
O o
o i1)
(I)
-I_ u)(I)e-_0
c- 0c_
c-
.-_ _,c- (g
o I,-
_-Eoo
_.121oo o-o._ _
o.._mE
c" if)
o o
cd
u_
30
o °o
_, ---_-5___ ___" 0_0000 0 -
o_.___ ",
>_ _ o __\\\\ 0
EE_-$
00_CJ
.o_._o_ _5nn_=O
I'o I!
I I I I0 0 0 0CO CO _1" 0,1
(1) C_ao "_
-._ >., (D
'5_E
(DO_ 0 (_13_
0
o
8Eooo
co'_c_00
0t-t--
>,¢-O3
.--
t--
t-O
0O_
00
30c'-
0
,'_-o
¢- ,...O O
°_
e'_ _-
N !--
t--O" o
_..EO
"I O
05
LI_
31

==
t-- 0 C o-_-_ C_ a3 L'__C _,_-
I I I I I I
0 0 0 0 0 03
o _5 _5 o5 ,-- o
o o-
c
oL.
O_O 03
c_
_kO b
04E
O oo
4c4o
03 c
__o143
-- _ o<_
_" Oo..
0 60 x- Or)
O. c
E> E0 o
o
o
O O "_ °°__ _-
O') -_._0) c
_sE_Eo..o
oO't21m _c _O Oif) c-
-c- c
E_
,4
o--
IJ_
32
I I I I IO O O O O
o c5 (5 05 _-
0
0
0
-od
0
0
O3
0
Or)c_
o. cSc_
o"
O9O0(D
c_0>0
Eoo
..O
O
c-O
o
Eoo
oco
O
o
X
>,
E _Eo8 _
o
OE"_ ot- o
o
o c=
Om_•_- _
OmOequd
°__
33
O00
II IIU')
Z ,,-'-Z' C_ '
"F::" "F: >"
,,oE ,E =Eo.=_,8 o°
,,,,,,,,,Lt°,_
I0CO
I0
I0
Q-'F C0
13._
004
34
o
0I.C)
(--
0...J
(4t-O-I--'
(If
o0_.C}o
(-
EE0o(/)
0"r_
o
"10
ffl.Eo0
O3Z<
"0
0t--l--
r--
c-
o
o_o
0
o
f'l
"O
o°_
"O
_d
°_
tl..
O_
0 I...0 0
"1_ 0.,z, -o
N N
(- _-.O 0
0900! !
-__
.Q Cn 0_
°oo_
o_(h>
o
8gO
Om
0c-
oo
E00
.Q0c-o
"0q_o
"0
13_
b:
.__LI_
35

REPORT DOCUMENTATION PAGE FormApprovedOMB No. 0704-0188
Public reporting bur0an for this comect¢_ of information is estimated to Iversge I hour per respoclse, including the time tot mvie_ instructions, mmrchmg existing dstl sources,gathering and rnsinlainmg _nedata needed, and COml:4etJngand _ the _ of r_'nafion. Sen0 comments regarding this _rden es_m_xe Or any o_norut3ect of ftiscollection of information, including st_gestion_ for reducing this bur0en, to Washington Heaclqulners Senaoms, Dimclorlte for Information OpemtJor_ and _. 1215 Jelfi_son DavisHightwly, Suite 1204, Adir_lon, VA 222024302. and to Itm Office of Management _ Budget. PI_ Reduction Pro)ect (0704-0188), Wash_on, DC 20603.
1. AGENCY USE ONLY (Leave blamk) 2. REPORT DATE 3. REPORT TYPE AND DATES COVERED
November 1996 Technical Memorandum
4. TITLE AND SUBTITLE 5. FUNDING NUMBERS
Comparisons of Methods for Predicting Community Annoyance Due to WU 537-09-21-04Sonic Booms
6. AUTHOR(S)
Harvey H. Hubbard and Kevin P. Shepherd
7. PERFORMINGORGANIZATIONNAME(S)ANDADDRESS(ES)
National Aeronautics and Space AdministrationLangley Research Center
Hampton, VA 23681-0001
!9. SPONSOPJNG I MONITORING AGENCY NAME(S) AND ADDRESS(ES)
National Aeronautics and Space Administration
Washington, DC 20546-0001
_1. SUPPLEMENTARY NOTES
8. PERFORMING ORGANIZATION
REPORT NUMBER
10. SPONSOFUNG I MONI'rORINGAGENCY REPORT NUMBER
NASA TM-110289
Hubbard: NASA Distinguished Research Associate, Langley Research Center
Shepherd: Langley Research Center
121. DISTRIBUTION/AVAILABILITY STATEMENT
Unclassified - Unlimited
Subject Category 71
12b. DISTRIBUTION CODE
13. ABSTRACT (MaJdmum 200 words)
Two approaches to the prediction of community response to sonic boom exposure are examined and compared.The first approach is based on the wealth of data conceming community response to common transportation
noises coupled with results of a sonic boom/aircraft noise comparison study. The second approach is based onlimited field studies of community response to sonic booms. Substantial differences between indoor and outdoorlistening conditions are observed. Reasonable agreement is observed between predicted community responsesand available measured responses.
14. SUBJECT TERMS
Sonic Boom; Noise; Community Noise
17, SECURn'Y CLASSIFICATION
OF REPORT
Unclassified
18. SECURITY CLASSIFICATIONOF THIS PAGE
Unclassified
NSN 7540-01-280-5500
19. SECURITY CLASSlRCATION
OF ABSTRACT
Unclassified
15. NUMBER OFPAGES
36
16. PRICE CODE
A03
20. LIMITATION OF ABSTRACT
Standard Form 298 (Rev. 2.49)PrM, ctibeclby ANSI Std Z39-18298-102