jiang_et_al-2014-the_structural_design_of_tall_and_special_buildings.pdf
TRANSCRIPT
THE STRUCTURAL DESIGN OF TALL AND SPECIAL BUILDINGSStruct. Design Tall Spec. Build. 23, 334–349 (2014)Published online 30 August 2012 in Wiley Online Library (wileyonlinelibrary.com/journal/tal). DOI: 10.1002/tal.1040
Study on seismic performance of a super-tall steel–concretehybrid structure
Huanjun Jiang1,2, Bo Fu1,2*,†, Laoer Liu3 and Xiaowei Yin1,2
1State Key Laboratory of Disaster Reduction in Civil Engineering, Tongji University, Shanghai 200092, China2Research Institute of Structural Engineering and Disaster Reduction, Tongji University, Shanghai 200092, China
3C&D Real Estate Group Limited Company, Xiamen 361001, China
SUMMARY
Many steel–concrete hybrid buildings have been built in China. The seismic performance of such hybridsystem is much more complicated than that of steel structure or reinforced concrete (RC) structure.A steel–concrete hybrid frame-tube super-tall building structure with new type of shear walls to be builtin a district of seismic intensity 8 in China was studied for its structural complexity and irregularity. Bothmodel test and numerical simulation were applied to obtain the detailed knowledge of seismic performancefor this structure. First, a 1/30 scaled model structure was tested on the shaking table under different levelsof earthquakes. The failure process and mechanism of the model structure are presented here. Nonlineartime-history analysis of the prototype structure was then conducted by using the software PERFORM-3D.The dynamic characteristics, inter-story drift ratios and energy dissipation conditions are introduced. Onthe basis of the comparison between the deformation demand and capacity of main structural componentsat individual performance level under different earthquake level, the seismic performance at the memberlevel was also evaluated. Despite the structural complexity and code-exceeding height, both experimentaland analytical results indicate that the overall seismic performance of the structure meet the requirementsof the Chinese design code. Copyright © 2012 John Wiley & Sons, Ltd.
Received 18 June 2012; Accepted 30 July 2012
KEY WORDS: steel–concrete hybrid structure; shaking table test; seismic performance; super-tall building; PERFORM-3D;nonlinear time-history analysis
1. INTRODUCTION
In recent years, a huge number of high-rise buildings have been constructed in Mainland China. A greatproportion of these tall buildings applied steel–concrete hybrid structure system such as steel frame-concrete core tube because of its unique priority in reducing construction cost and saving constructiontime. However, since they are composed of components with different materials, steel–concrete hybridstructures bring engineers and researchers new challenges in evaluating their performances underearthquakes, especially for those with very complex structural system or that are extremely tall. To ensurethe safety and achieve performance-based seismic design of such structures, in-depth and systematicalinvestigation of their seismic performance is thus necessary (Tall Buildings Initiative, 2010).At present, model test and numerical simulation are two principal and effective approaches to
predict the seismic performance of steel–concrete hybrid structures. It is universally acknowledged thatshaking table test has been an effective way to investigate the seismic performance of various structures,including steel–concrete hybrid high-rise structures. Some shaking table tests have been carried out tostudy the seismic performance of this type of structure in recent years. Liu and Qiu (2008) studied the
*Correspondence to: Bo Fu, Research Institute of Structural Engineering and Disaster Reduction, Tongji University,Shanghai 200092, China.†E-mail: [email protected]
Copyright © 2012 John Wiley & Sons, Ltd.

SEISMIC PERFORMANCE OF A SUPER-TALL STEEL–CONCRETE HYBRID STRUCTURE 335
seismic performance of a steel RC frame-shear wall tall building with steel transfer trusses located at ahigher level on the basis of shaking table test of a 1/25 scaled model. Han et al. (2009) conductedshaking table tests of two 1/20 scaled 30-story structure consisted of composite frames and RC shearwalls. In the two composite frames, concrete-filled steel tubular (CFST) columns with circular andsquare sections were used respectively. Zhou and Li (2010) carried out a 1/20 scaled model of a 25-storysteel–concrete composite high-rise building structure composed of steel frame and concrete tube. Onthe other hand, significant progress has also been made in the development and application of nonlinearanalysis programs for evaluating the seismic performance of steel–concrete hybrid structures.In this study, a steel–concrete hybrid frame-tube super-tall building structure with new type of shear
walls, whose height exceeds the current Chinese design code, was used as the target hybrid structure.At first, a 1/30 scaled shaking table test was conducted. A thorough numerical simulation andnonlinear time-history analysis was then performed by PERFORM-3D (Computer and StructuresInc., 2006). The seismic performance of this structure was evaluated accordingly. The purpose of thisstudy is to provide a two-level, that is, structural level and member level, seismic performanceevaluation of this complex hybrid structure with new structural members through model test andnumerical analysis. Moreover, this paper aims to present elaborate and dependable steps aboutnumerical simulation of this type of structure.
2. STRUCTURE DESCRIPTION
Beijing Wealth Center (phase II) is a 61-story office building located in Chaoyang district, Beijing,with a total structural height of 264m (as shown in Figure 1). The building employs three parallelstructural systems, i.e. the steel-reinforced concrete (SRC) core tube, the SRC peripheral frame andthe outrigger steel trusses, which create interactions between the core tube and the outer frame, to resistvertical and lateral loads. To strengthen the lateral stiffness of the X direction with much shorterdimension, four steel outrigger trusses and two U-shaped steel belt trusses are installed at the 28thand 44th floors, respectively. Circular CFST columns and steel beams compose the peripheral frame.Without any big openings, floor plates form rigid diaphragms, linking the core tube and the outerframe. The structural plan layouts of the typical floors and the strengthened floors are shown inFigure 2. In the core tube walls, steel plates and steel braces are embedded below the 20th floor,and RC trusses are arranged above the 20th floor. Steel beams and columns are embedded at the edges
Figure 1. Perspective view of the prototype structure.
Copyright © 2012 John Wiley & Sons, Ltd. Struct. Design Tall Spec. Build. 23, 334–349 (2014)DOI: 10.1002/tal

X
Y
(a) (b)
Figure 2. Structural plan layout of floor: (a) typical floor and (b) strengthened floor.
336 H. JIANG ET AL.
of steel plates to effectively restrain the plates, which make the bearing capacity of steel plates fullydeveloped. The plan layout of steel plates and columns in the core tube is shown in Figure 3. Theembedded edge steel columns increase the flexural carrying capacity of the shear wall significantlyas well. In the X direction, since most of the shear walls are solid without openings, the strength ofresisting lateral force is enhanced considerably.
Figure 3. Plan layout of steel plates and columns in core tube.
Copyright © 2012 John Wiley & Sons, Ltd. Struct. Design Tall Spec. Build. 23, 334–349 (2014)DOI: 10.1002/tal

SEISMIC PERFORMANCE OF A SUPER-TALL STEEL–CONCRETE HYBRID STRUCTURE 337
The main characteristics of this structure are summarized as follows:
(1) The structural height of the building is 264m, which is beyond the height limits specified inTechnical Specification for Concrete Structures of Tall Building (JGJ3-2002) (CMC, 2002).
(2) The strengthened floors result in vertical irregularity stipulated in Code for Seismic Design ofBuildings (GB50011-2010) (CMC, 2010).
(3) The new SRC shear walls reinforced by steel plate and steel truss are applied in the core tube.
Taking these irregularities and complexities into account, a thorough study of its seismic perform-ance is required according to the Chinese design code. Shaking table model test was recommendedby the peer review committee to study the structural behavior and check the seismic performance ofthe structure directly.
3. SHAKING TABLE TEST OF MODEL STRUCTURE
3.1. Model material
To meet the requirement of similitude theory, the model material is required to have relative low elasticmodulus and high density. In addition, the constitutive relationship of model material ought to be, to agreat extent, similar to the prototype material. Thus, on the basis of the above consideration and pastexperiences, fine-aggregate concrete with fine wires was selected to simulate the RC components andcopper plates were chosen to model the steel members.
3.2. Model design
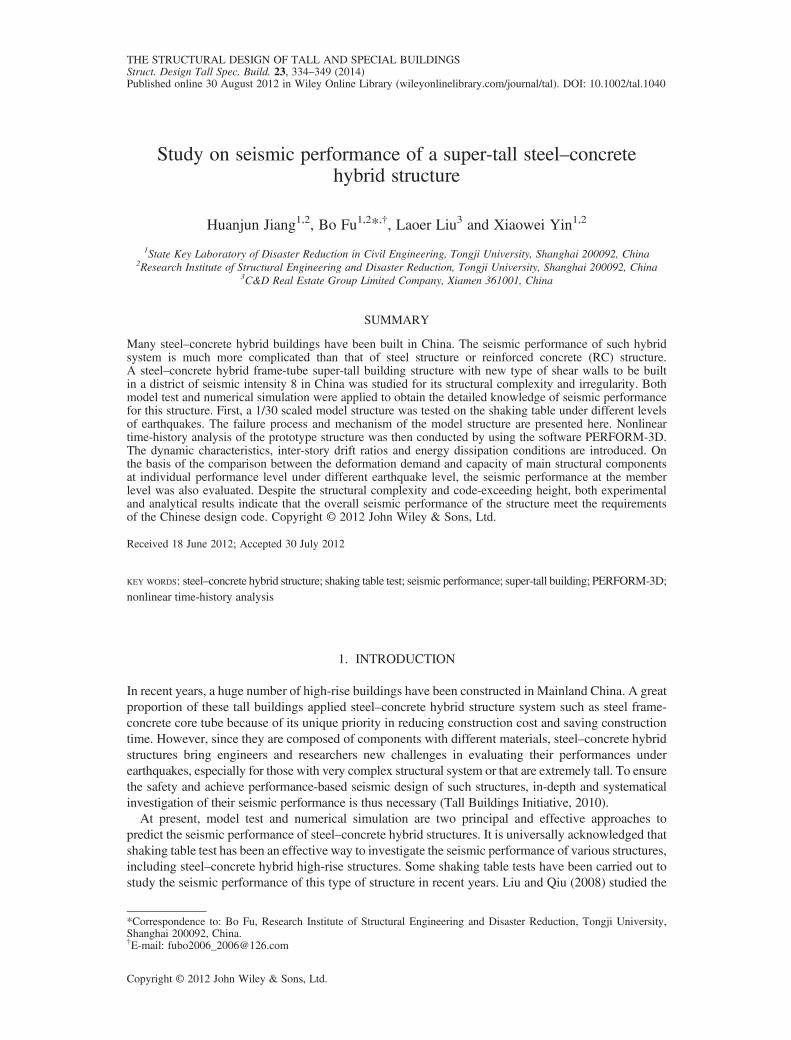
Based on the dynamic similitude theory, there are three controlling scaling factors, which are independ-ent with each other. In addition, there are some other subordinate scaling factors, which can be derivedfrom the controlling factors. In this model test, the scaling factors of dimension, stress and accelerationwere selected to be the controlling factors. Considering the size and capacity of the shaking table, thescaling factor of dimension Sl in this model was firstly chosen to be 1/30. The model was thus built witha height of 9.1m (Figure 4). Then, according to the test results of model material, the stress scalingfactor Ss was determined to be 0.22. Finally, the scaling factor of acceleration Sa was assigned to be3.00. After the three controlling factors were defined, other typical scaling factors were obtained bysimilitude relationship (as shown in Table 1).
Figure 4. Perspective view of model structure.
Copyright © 2012 John Wiley & Sons, Ltd. Struct. Design Tall Spec. Build. 23, 334–349 (2014)DOI: 10.1002/tal
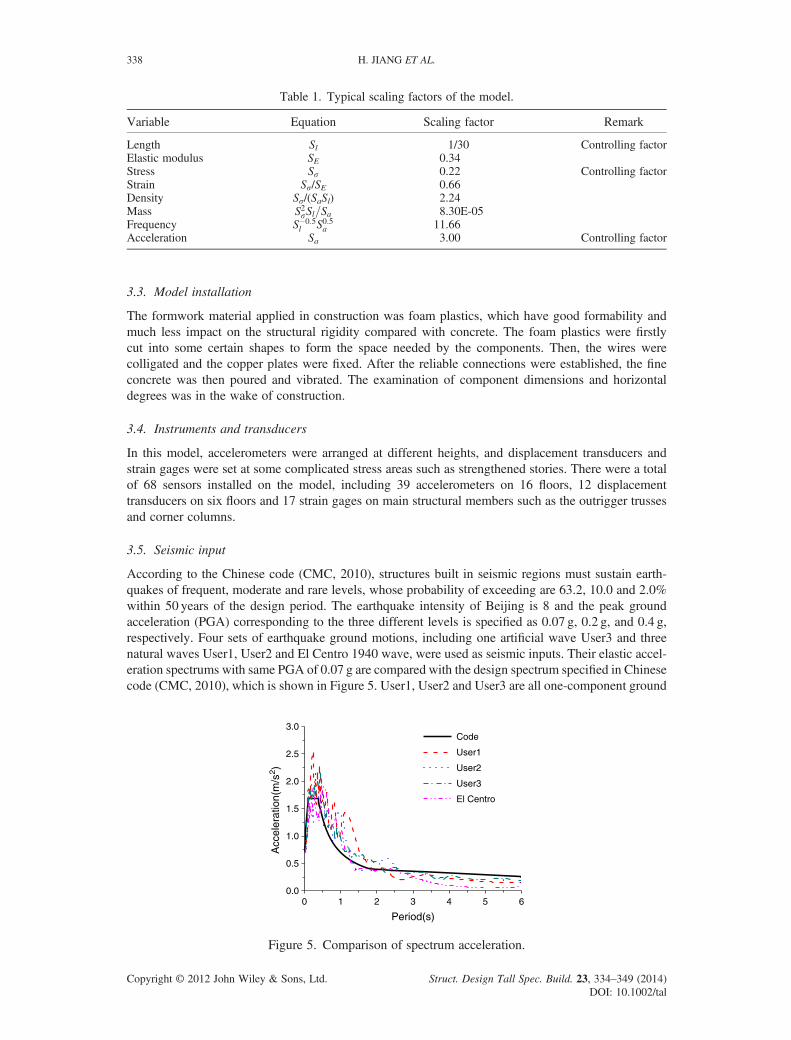
Table 1. Typical scaling factors of the model.
Variable Equation Scaling factor Remark
Length Sl 1/30 Controlling factorElastic modulus SE 0.34Stress Ss 0.22 Controlling factorStrain Ss/SE 0.66Density Ss/(SaSl) 2.24Mass S2sSl=Sa 8.30E-05Frequency S�0:5
l S0:5a 11.66Acceleration Sa 3.00 Controlling factor
338 H. JIANG ET AL.
3.3. Model installation
The formwork material applied in construction was foam plastics, which have good formability andmuch less impact on the structural rigidity compared with concrete. The foam plastics were firstlycut into some certain shapes to form the space needed by the components. Then, the wires werecolligated and the copper plates were fixed. After the reliable connections were established, the fineconcrete was then poured and vibrated. The examination of component dimensions and horizontaldegrees was in the wake of construction.
3.4. Instruments and transducers
In this model, accelerometers were arranged at different heights, and displacement transducers andstrain gages were set at some complicated stress areas such as strengthened stories. There were a totalof 68 sensors installed on the model, including 39 accelerometers on 16 floors, 12 displacementtransducers on six floors and 17 strain gages on main structural members such as the outrigger trussesand corner columns.
3.5. Seismic input
According to the Chinese code (CMC, 2010), structures built in seismic regions must sustain earth-quakes of frequent, moderate and rare levels, whose probability of exceeding are 63.2, 10.0 and 2.0%within 50 years of the design period. The earthquake intensity of Beijing is 8 and the peak groundacceleration (PGA) corresponding to the three different levels is specified as 0.07 g, 0.2 g, and 0.4 g,respectively. Four sets of earthquake ground motions, including one artificial wave User3 and threenatural waves User1, User2 and El Centro 1940 wave, were used as seismic inputs. Their elastic accel-eration spectrums with same PGA of 0.07 g are compared with the design spectrum specified in Chinesecode (CMC, 2010), which is shown in Figure 5. User1, User2 and User3 are all one-component ground
0 1 2 3 4 5 60.0
0.5
1.0
1.5
2.0
2.5
3.0
Acc
eler
atio
n(m
/s2 )
Period(s)
Code
User1
User2
User3
El Centro
Figure 5. Comparison of spectrum acceleration.
Copyright © 2012 John Wiley & Sons, Ltd. Struct. Design Tall Spec. Build. 23, 334–349 (2014)DOI: 10.1002/tal

SEISMIC PERFORMANCE OF A SUPER-TALL STEEL–CONCRETE HYBRID STRUCTURE 339
motions and were inputted in X or Y direction. The two-component El Centro wave was inputted in Xand Y directions simultaneously.
3.6. Test program
The test was conducted with three phases, representing frequent, moderate and rare earthquake of intensity8, respectively. In each phase of the test, User1, User2, User3 and El Centro wave were successively inputin one or two directions. The duration of the ground motions was reduced into the 1/11.66 of the originalones according to the similitude relationship. A summary of test wave inputs is listed in Table 2.
3.7. Damage condition
Under frequent earthquakes, no visible damage occurred. Under moderate earthquakes, there was still novisual damage on the model. Under rare earthquakes, in the Y direction, the flanges of some steel beamsbuckled, and cracks occurred at the two ends of a few coupling beams (as shown in Figure 6). At the endof the tests, in the X direction, the natural frequency of the model remained unchanged, whereas in the Ydirection, it was decreased by 19.4%, which indicates that no damages occurred in the members in the Xdirection whereas damages occurred in the members in the Y direction. The different damage conditionand variation of natural frequency between the X and Y directions could be due to the effect of new SRCshear walls. Because of the different layout of core walls in the X and Y directions, the strength resistingthe lateral force in the X direction is enhanced much more significantly than that in the Y direction.Even under rare earthquakes, the lateral stiffness as well as strength in the X direction did not deteriorate.Furthermore, the seismic performance of the new SRC shear wall was proved to be good.
Table 2. Test program.
Test Phase Input
Peak ground acceleration (g)
Principaldirection
Direction X Direction Y
Design Achieve Design Achieve
W1 White noise — 0.050 0.050F8G1X Frequent 8 User 1 X 0.210 0.244F8G1Y User 1 Y 0.210 0.268F8G2X User 2 X 0.210 0.198F8G2Y User 2 Y 0.210 0.299F8G3X User 3 X 0.210 0.208F8G3Y User 3 Y 0.210 0.237F8EXY El Centro X 0.210 0.199 0.180 0.196F8EYX El Centro Y 0.180 0.160 0.210 0.238W2 White noise — 0.050 0.050B8G1X Moderate 8 User 1 X 0.600 0.773B8G1Y User 1 Y 0.600 0.722B8G2X User 2 X 0.600 0.637B8G2Y User 2 Y 0.600 0.638B8G3X User 3 X 0.600 —B8G3Y User 3 Y 0.600 0.582B8EXY El Centro X 0.600 0.583 0.510 0.620B8EYX El Centro Y 0.510 0.408 0.600 0.704W3 White noise — 0.050 0.050R8G1X Rare 8 User 1 X 1.200 1.134R8G1Y User 1 Y 1.200 0.956R8G2X User 2 X 1.200 1.132R8G2Y User 2 Y 1.200 1.158R8G3X User 3 X 1.200 1.241R8G3Y User 3 Y 1.200 0.989R8EXY El Centro X 1.200 1.225 1.020 0.768R8EYX El Centro Y 1.020 1.080 1.200 1.057W4 White noise — 0.050 0.050
Copyright © 2012 John Wiley & Sons, Ltd. Struct. Design Tall Spec. Build. 23, 334–349 (2014)DOI: 10.1002/tal

(a) (b)
Figure 6. Damage patterns under rare earthquakes: (a) flanges bulking of steel beam and (b) cracks onthe end of coupling beam.
340 H. JIANG ET AL.
4. NONLINEAR SIMULATION OF PROTOTYPE STRUCTURE
4.1. Constitutive relationship of constituent material
The structure is mainly made up of steel and concrete, whose constitutive relationships used inPERFORM-3D is expatiated as follows:
(1) For the steel plate and reinforcement rebar, the simplified bilinear constitutive relationship wasadopted. The post-yielding stiffness ratio was taken as 0.01. The bilinear kinematic model wasselected to simulate their hysteretic behavior.
(2) The proposed constitutive relationships of concrete nowadays are relatively complicated; thus,it is quite necessary to simplify them especially for bulky structures. Concrete used in thisstructure can be classified into two categories: core concrete in circular CFST columns andother common concrete. On one hand, it is universally acknowledged that the confining effecton the compressive behavior of core concrete in circular CFST columns is very significant,making its constitutive model special. The constitutive model as shown in Figure 7(a) proposedby Han (2000), which was developed by fitting the experimental data, was thus adopted. Dueto the limit of PERFORM-3D program, the constitutive relationship curves have to be firstconverted into piecewise linear lines as shown in Figure 7(b) according to the conservationof energy principle, so as to acquire the parameters of corresponding key points needed inthe procedure. On the other hand, the constitutive relationship given by Mander et al. (1988)was applied here for the common concrete. To achieve more accurate analysis results, the
0
10
20
30
40
50
60
70
Str
ess(
MP
a)
Strain
ξ=0.554
ξ=0.637
ξ=0.689
ξ=0.912
ξ=1.038
ξ=1.056
ξ=1.134
ξ=1.330
0.000 0.005 0.010 0.015 0.020 0.025 0.000 0.005 0.010 0.015 0.020 0.0250
10
20
30
40
50
60
Str
ess(
MP
a)
Strain
Actual
Simplified
(a) (b)
Figure 7. Constitutive relationships of core concrete: (a) under different confining factors and(b) simplified one.
Copyright © 2012 John Wiley & Sons, Ltd. Struct. Design Tall Spec. Build. 23, 334–349 (2014)DOI: 10.1002/tal

SEISMIC PERFORMANCE OF A SUPER-TALL STEEL–CONCRETE HYBRID STRUCTURE 341
confined concrete constitutive relationship as shown in Figure 8(a) is adopted for the concreterestrained by stirrup applied whereas the unconstrained concrete model as shown in Figure 8(b)is for the remainder. The principle of simplification is identical with the concrete of circularCFST columns.
4.2. Member modeling
The structure mainly consists of four types of members, beam, column, truss member and shear wall.The detailing modeling information of them is as follows:
(1) For steel and RC beams with relative large span-to-depth ratio, flexural deformation is thecontrolling factor, thus only the nonlinear behavior of bending was considered and theshearing behavior was regarded as elastic. Therefore, beams were simulated by plastic hingemodel and the assumption that flexural plastic hinges occur only at the two ends of memberswas adopted. For the coupling beams with the span-to-depth ratio less than 2.5, shear hingeswere added in order to simulate the nonlinear shear behavior simultaneously.
(2) With the same forming mechanism of plastic hinge of beams, columns were simulated byplastic hinge model as well. There are generally two ways to define plastic hinges inPERFORM-3D. In the first method, the cross-section is simulated by the fiber model, andthe force–deformation relationship at the cross-section level is derived automatically by theprogram on the basis of the constitutive law for the constituent material. P-M-M interactioncan be considered for columns. In the second method, the force–deformation skeleton curveof the member is obtained with the aid of section designer program named Xtract and thentransformed into bilinear curve (as shown in Figure 9). The characteristic parameters of theskeleton curve are recommended by FEMA356 (FEMA, 2000). It will cost much morecalculation efforts for the first method than the second one. In this study the first methodwas applied for columns and the second method for beams.
(3) The truss members were simulated by nonlinear axial bars. Trilinear skeleton curve withdescending segment was applied.
(4) The core tubes were modeled by shear wall element specified in PERFORM-3D. Generally,the shear wall element consists of vertical fibers and concrete shear layer. The fiber layerswere used to model the bending and axial loading behavior, and the concrete shear layertakes the contribution of concrete to the shear strength into account. Moreover, there are alsoshear walls with steel plates and braces in this structure. In order to simulate these compositemembers, different solutions were applied. For the shear walls with steel plates, the effect ofsteel plate was reflected by increasing the steel ratio and the inclusion of shear material. Forthe shear walls with braces, the brace was simulated by the nonlinear axial bar.
0
10
20
30
40
50
60
Str
ess(
MP
a)
Strain
Actual
Simplified
0.000 0.003 0.006 0.009 0.012 0.015 0.000 0.001 0.002 0.003 0.004 0.005 0.0060
10
20
30
40
50
RX
LU
Str
ess(
MP
a)
Strain
Actual
Simplified
Y
(a) (b)
Figure 8. Constitutive relationships of common concrete: (a) confined concrete and (b) unconfinedconcrete.
Copyright © 2012 John Wiley & Sons, Ltd. Struct. Design Tall Spec. Build. 23, 334–349 (2014)DOI: 10.1002/tal

0.00 0.02 0.04 0.06 0.080
300
600
900
1200
1500
Mom
ent(
kN⋅m
)Curvature(1/m)
Actural
Bilinearization
Figure 9. Simplified moment–curvature relationship.
342 H. JIANG ET AL.
4.3. Hysteretic model
For flexural hinges and shear hinges, the Clough model considering the degradation of unloadingstiffness was adopted. The unloading stiffness is determined by the following equation:
Kr ¼ arKy ¼ Δm=Δy
��
���aKy (1)
where Ky refers to the initial stiffness; Δm and Δy represent the maximum deformation and yieldingdeformation, respectively; Kr is the unloading stiffness corresponding to Δm; a is the reduction factorof unloading stiffness, which was generally taken as 0.4 for RC members. To reflect the main charac-teristics of shear behavior accurately, the modified Takeda model (Tohma and Hwang, 1987) wasapplied for shear material.In PERFORM-3D, the hysteretic model is obtained by adjusting the energy degradation factor and
unloading stiffness coefficient. By the definition specified in PERFORM-3D, the energy degradationfactor of every key point is calculated. The shape of the hysteretic curve is simulated by modifyingthe unloading stiffness coefficient. The comparison of original hysteretic model with the modifiedone used in PERFORM-3D is shown in Figure 10. Although the modified hysteretic curve cannotagree exactly with the original one, they are equal in terms of energy dissipation.
4.4. Performance level of structural components
Deformation limits of structural components at different performance level were determined accordingto FEMA356. The typical force–deformation skeleton curve of a structural component is shown in
D
PERFORM-3D Clough
F PERFORM-3D
Modified Takeda
F
D
(a) (b)
Figure 10. Comparison of hysteretic model: (a) Clough model and (b) modified Takeda model.
Copyright © 2012 John Wiley & Sons, Ltd. Struct. Design Tall Spec. Build. 23, 334–349 (2014)DOI: 10.1002/tal

SEISMIC PERFORMANCE OF A SUPER-TALL STEEL–CONCRETE HYBRID STRUCTURE 343
Figure 11, where IO, LS and CP represent immediate occupancy, life safety and collapse prevention,respectively. Table 3 lists the plastic deformation limits of flexural hinge for CFST columns. Table 4lists the plastic deformation limits of other structural components.
4.5. Whole structural model
The elastoplastic analytic model, which employs rigid floor assumption and lumped-mass method,was constructed by PERFORM-3D (as shown in Figure 12). The coupling beams of the first floor,strengthened floors and the floors below the strengthened floors, with relative large depth, weresimulated by general wall element whereas the other coupling beams were modeled by beam element.As the two ends of secondary beam are hinged and mainly resist vertical load, they were regarded aselastic. P-Δ effect was also included in the nonlinear time-history analysis.
4.6. Dynamic characteristics
The dynamic characteristics of the target structure are shown in Table 5. The mode shapes of the firstfour translational modes are shown in Figure 13. Both Table 5 and Figure 13 indicate that thenumerical analysis and the experimental results are in good agreement. In general, the period obtainedby numerical analysis is larger than the test result. According to the Chinese code (CMC, 2002), theperiod ratio between the first torsional mode and the first translational mode should not be larger than0.85 so as to prevent excessive structural torsion. Both numerical and experimental results demonstratethat the period ratio of this structure meets this requirement.
a
bcA
BC
DE
F/Fy
D
IOLS
CP1.0
Figure 11. Force–deformation skeleton curve.
Table 3. Plastic deformation limits of flexural hinge for circular CFST columns (rad).
Section IO LS CP
D1500 0.004 0.006 0.007D1400 0.004 0.006 0.008D1300 0.004 0.006 0.009
Table 4. Plastic deformation limit of other components (rad).
Component type IO LS CP
Flexural hinge of profile steel beam 0.25θy 2θy 3θyFlexural hinge of RC beam 0.01 0.02 0.025Flexural hinge of coupling beam 0.0075 0.015 0.022Shear hinge of coupling beam 0.006 0.015 0.02Compressive bar (square steel tube-hollow) 0.25ΔC 1ΔC 2ΔC
Compressive bar (square steel tube-concrete filled) 0.25ΔC 4ΔC 6ΔC
Compressive bar (I-shaped) 0.25ΔC 5ΔC 7ΔC
Tensile bar 0.25ΔT 7ΔT 9ΔT
Flexural deformation of wall panel 0.003 0.006 0.009Shear deformation of wall panel 0.004 0.006 0.0075
θy is the corresponding rotational angle when steel beam yields; ΔC is the corresponding deformation when thebrace compressively buckles; and ΔT is the corresponding deformation when brace yields under tension.
Copyright © 2012 John Wiley & Sons, Ltd. Struct. Design Tall Spec. Build. 23, 334–349 (2014)DOI: 10.1002/tal
(a) (b) (c) (d)
Figure 12. Analytic model by PERFORM-3D: (a) axonometric view, (b) core tube, (c) front view and(d) side view.
Table 5. Characteristics of the first six natural vibration modes.
Mode number 1 2 3 4 5 6
Period by PERFORM-3D (s) 5.319 4.355 3.264 1.431 1.386 1.062Period by test (s) 5.128 4.098 2.571 1.712 1.323 1.208Vibration form Translation in
X directionTranslation inY direction
Torsion Translation inY direction
Translation inX direction
Torsion
0
10
20
30
40
50
60
70
Sto
ry
Amplitude
Test PERFORM-3D
0
10
20
30
40
50
60
70
Sto
ry
Amplitude
Test PERFORM-3D
0
10
20
30
40
50
60
70
Sto
ry
Amplitude
Test PERFORM-3D
0.0 0.5 1.0 0.0 0.5 1.0 -1.0 -0.5 0.0 0.5 1.0 -1.0 -0.5 0.0 0.5 1.00
10
20
30
40
50
60
70
Sto
ry
Amplitude
Test PERFORM-3D
(a) (b) (c) (d)
Figure 13. Mode shapes: (a) first mode, (b) second mode, (c) fourth mode and (d) fifth mode.
344 H. JIANG ET AL.
4.7. Performance evaluation
After the modeling of the prototype structure, nonlinear time-history analysis was conducted with theaid of PERFORM-3D. The seismic inputs used in the numerical analysis were identical with the
Copyright © 2012 John Wiley & Sons, Ltd. Struct. Design Tall Spec. Build. 23, 334–349 (2014)DOI: 10.1002/tal

SEISMIC PERFORMANCE OF A SUPER-TALL STEEL–CONCRETE HYBRID STRUCTURE 345
shaking table tests. In this study, the seismic performance of the target structure is evaluated at twolevels, structure level and member level.First, the performance at the structure level was studied. As inter-story drift ratio is a significant and
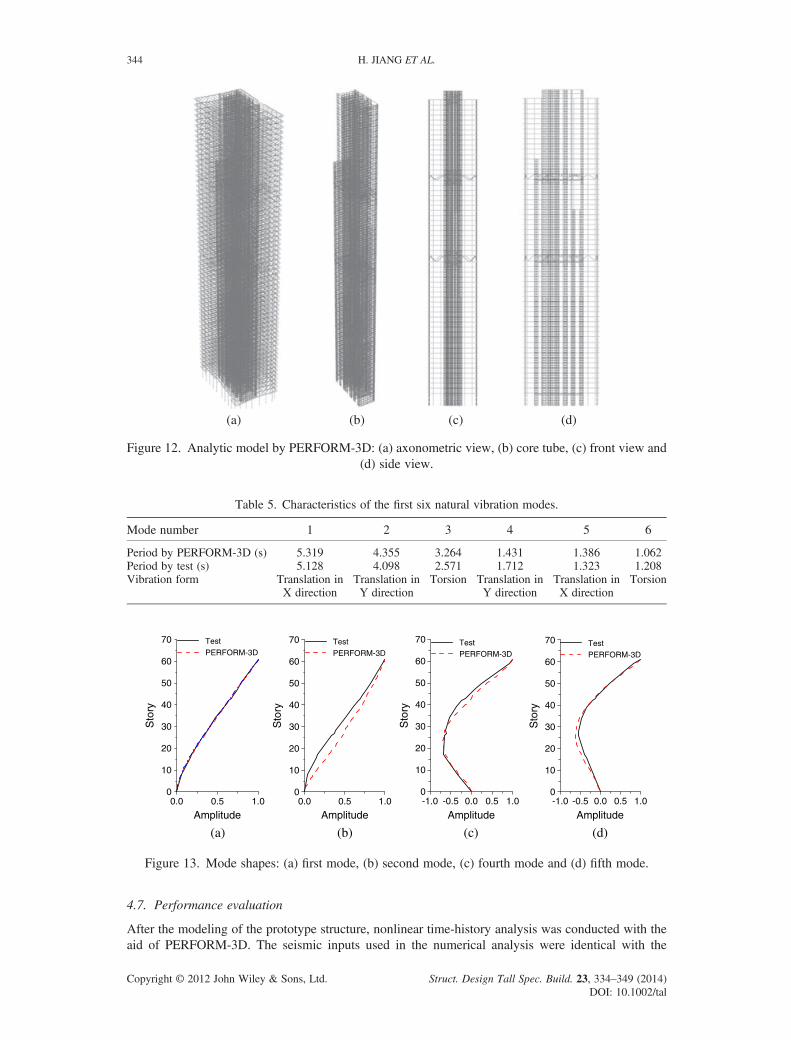
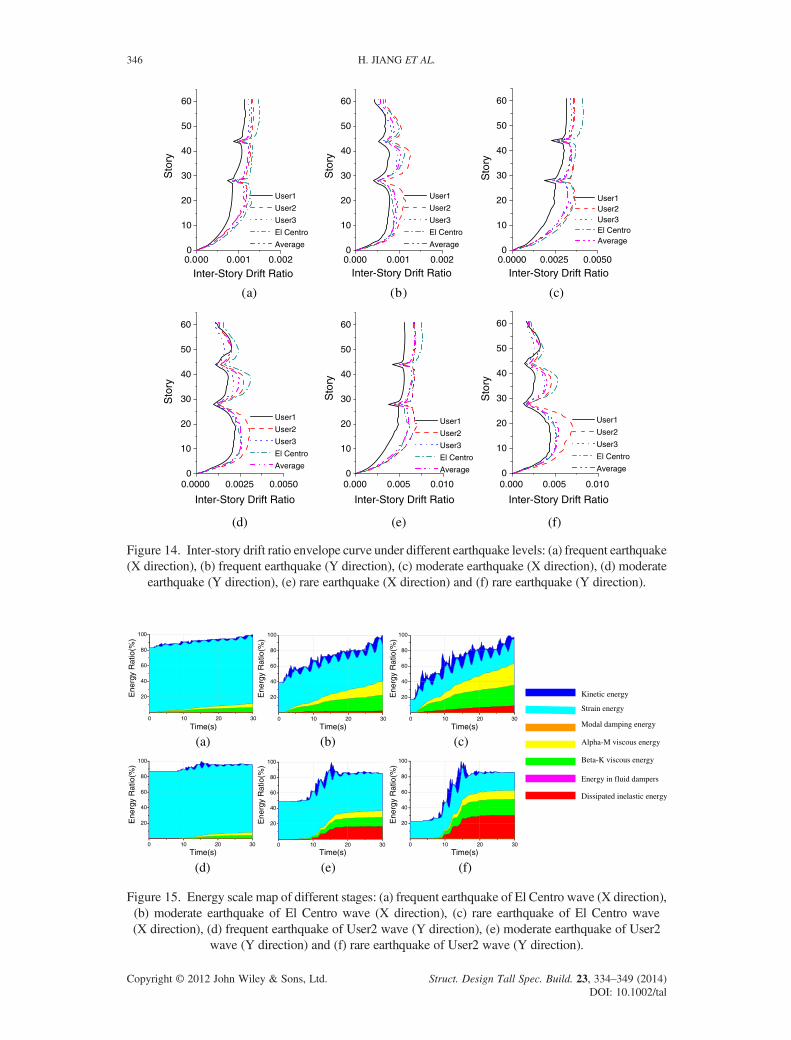
commonly used index in evaluating the seismic performance of structures, Tables 6 and 7 present themaximum inter-story drift ratios of the structure under different ground motions. The results show thatthe maximum inter-story drift ratio of the four ground motions is 1/665 in X direction and 1/790 in Ydirection under frequent earthquakes. Both of them are less than the maximum allowable limit of 1/500specified in the Chinese code (CMC, 2010). Similarly, under rare earthquakes, the maximuminter-story drift ratio in X and Y directions is 1/131 and 1/144, respectively, which are within the limitof 1/100. Figure 14 shows the inter-story drift ratio envelope curves under different earthquake levels.The calculated results indicate that inter-story drift ratios of most floors change smoothly, whereasthose of the floors close to strengthened layers change sharply.The numerical analysis results demonstrate that the responses of the structure in the X direction are
the largest under El Centro wave and the responses in the Y direction are the largest under User2wave. Figure 15 shows energy scale maps of the structure, which can directly provide the informationof energy dissipation and indirectly indicate the seismic performance of the structure at the structurelevel. Under frequent earthquakes, the dissipated energy consists of strain energy and dampingenergy, which indicates that the structure is still in elastic phrase. Under moderate earthquakes, theinelastic energy in the X direction is 2.5% of the total dissipated energy and in the Y direction16.1%, which indicates that the nonlinear responses in the Y direction are much larger than in theX direction. Under rare earthquakes, the inelastic energy in the X direction is 9.1% of the totaldissipated energy and in the Y direction 28.8%, which indicates that the structure is slightly damagedin the X direction and is moderately damaged in the Y direction. The analytical results agree well withthe experimental results as shown above. It can be concluded that the structure has a good seismicperformance at the structural level.Second, the behavior of components was analyzed. The maximum demand-to-capacity ratio of each
type of structural component is listed in Table 8. Under frequent and moderate earthquakes, all thecomponents excluding some coupling beams in the core tube are still at IO stage. Some couplingbeams in Y direction come into the stage of LS under moderate earthquakes. Under rare earthquakes,some coupling beams in Y direction reach at CP stage; some beams in the peripheral frame in Xdirection arrive at LS stage and some beams in Y direction develop into CP stage; some members inthe truss in X direction step into LS stage, and all the CFST columns and shear walls remain at IOstage. It also can be concluded that the input seismic energy is mainly dissipated by couplingbeams and steel beams in the peripheral frame when the structure goes into inelastic stage. There isconsiderable safety margin for the structure to prevent collapse under rare earthquakes.
Table 6. Maximum inter-story drift ratio in X direction.
Seismic wave Frequent Moderate Rare
El Centro 1/665 1/241 1/131User1 1/867 1/315 1/178User2 1/741 1/274 1/144User3 1/795 1/290 1/144Average 1/760 1/277 1/148
Table 7. Maximum inter-story drift ratio in Y direction.
Seismic wave Frequent Moderate Rare
El Centro 1/885 1/319 1/189User1 1/1273 1/449 1/224User2 1/790 1/329 1/144User3 1/1019 1/389 1/197Average 1/961 1/365 1/184
Copyright © 2012 John Wiley & Sons, Ltd. Struct. Design Tall Spec. Build. 23, 334–349 (2014)DOI: 10.1002/tal
0
10
20
30
40
50
60
Sto
ry
Inter-Story Drift Ratio
User1
User2
User3
El Centro
Average0
10
20
30
40
50
60
Sto
ry
Inter-Story Drift Ratio
User1
User2
User3
El Centro
Average0
10
20
30
40
50
60
Sto
ry
Inter-Story Drift Ratio
User1 User2 User3 El Centro Average
0
10
20
30
40
50
60
Sto
ry
Inter-Story Drift Ratio
User1
User2
User3
El Centro
Average0
10
20
30
40
50
60S
tory
Inter-Story Drift Ratio
User1
User2
User3
El Centro
Average
0.000 0.001 0.002 0.000 0.001 0.002 0.0000 0.0025 0.0050
0.0000 0.0025 0.0050 0.000 0.005 0.010 0.000 0.005 0.0100
10
20
30
40
50
60
Sto
ryInter-Story Drift Ratio
User1
User2
User3
El Centro
Average
(a) (b) (c)
(d) (e) (f)
Figure 14. Inter-story drift ratio envelope curve under different earthquake levels: (a) frequent earthquake(X direction), (b) frequent earthquake (Y direction), (c) moderate earthquake (X direction), (d) moderate
earthquake (Y direction), (e) rare earthquake (X direction) and (f) rare earthquake (Y direction).
0
20
40
60
80
100
Ene
rgy
Rat
io(%
)
Time(s)
20
40
60
80
100
Ene
rgy
Rat
io(%
)
Time(s)
20
40
60
80
100
Ene
rgy
Rat
io(%
)
Time(s)
Beta-K viscous energy
Strain energy
Modal damping energy
Alpha-M viscous energy
Energy in fluid dampers
Dissipated inelastic energy
Kinetic energy
0
20
40
60
80
100
Ene
rgy
Rat
io(%
)
Time(s)0
20
40
60
80
100
Ene
rgy
Rat
io(%
)
Time(s)
0 10 20 3 0 10 20 30 0 10 20 30
0 10 20 3 0 10 20 3 0 10 20 30
20
40
60
80
100
Ene
rgy
Rat
io(%
)
Time(s)
(a)
(d) (e)
(b) (c)
(f)
Figure 15. Energy scale map of different stages: (a) frequent earthquake of El Centro wave (X direction),(b) moderate earthquake of El Centro wave (X direction), (c) rare earthquake of El Centro wave(X direction), (d) frequent earthquake of User2 wave (Y direction), (e) moderate earthquake of User2
wave (Y direction) and (f) rare earthquake of User2 wave (Y direction).
346 H. JIANG ET AL.
Copyright © 2012 John Wiley & Sons, Ltd. Struct. Design Tall Spec. Build. 23, 334–349 (2014)DOI: 10.1002/tal

Table
8.Maxim
umdeform
ationdemand-to-capacity
ratio
sof
maincomponents.
Directio
nof
inpu
tground
motion
CFST
column
Beam
inperipheral
fram
eTruss
mem
ber
Couplingbeam
Shear
wall
Flexural
hinge
Shearing
hinge
Flexural
deform
ation
Shear
deform
ation
IOIO
LS
CP
IOLS
IOLS
IOLS
CP
IOIO
Xdirection
Frequent
0.082
0.203
——
0.204
—0.064
—0.036
——
0.080
0.070
Moderate
0.205
0.551
——
0.569
—0.072
—0.053
——
0.147
0.199
Rare
0.365
—0.669
——
0.975
0.224
—0.326
——
0.267
0.350
Ydirection
Frequent
0.049
0.234
——
0.144
—0.063
—0.048
——
0.122
0.185
Moderate
0.106
0.595
——
0.266
—0.509
——
0.428
—0.284
0.358
Rare
0.201
——
0.797
0.450
——
0.693
——
0.857
0.668
0.444
SEISMIC PERFORMANCE OF A SUPER-TALL STEEL–CONCRETE HYBRID STRUCTURE 347
Copyright © 2012 John Wiley & Sons, Ltd. Struct. Design Tall Spec. Build. 23, 334–349 (2014)DOI: 10.1002/tal

348 H. JIANG ET AL.
5. CONCLUSIONS
Beijing Wealth Center (phase II) is a super-tall building adopting the steel–concrete hybrid structurewith new type of shear walls and code-exceeding height. To ensure its safety under earthquake, bothshaking table test and nonlinear time-history analysis were carried out. A series of ground motionssimulating frequent, moderate and rare earthquakes of intensity 8 were adopted to investigate theseismic performance of the structure. The following conclusions can be drawn:
(1) The maximum inter-story drift ratios of the structure under frequent earthquakes and rareearthquakes are less than the allowable limits specified in Chinese seismic design code.
(2) The nonlinear responses as well as the damage in the Y direction are much larger than those inthe X direction, mainly because of the different layout of core walls in the X and Y directionsand the effect of new type of shear walls.
(3) The nonlinear analysis results show that when the structure is subjected to rare earthquakes, theinput seismic energy is mainly dissipated through the plastic deformation of coupling beamsand steel beams in the peripheral frame. The primary vertical members, CFST columns and corewalls, are still at the performance level of immediate occupancy under rare earthquakes. Themechanism of energy dissipation is satisfactory.
(4) The overall seismic performance of the target structure is good and meets the requirementspecified by Chinese seismic design code.
(5) Although the seismic performance of the new type of shear wall is proved to be good by thisstudy, as there are few studies on the new type of shear wall with embedded steel plate andtruss, the design of such members in this structure is relatively conservative and the shearwall in this structure has such large strength as well as stiffness that it cannot fully develop itscapacity under rare earthquakes. The seismic performance of this type of SRC shear wall shouldbe further studied.
ACKNOWLEDGEMENTS
The authors are grateful for the support from National Natural Science Foundation of China undergrant no. 51078272, the Fundamental Research Funds for the Central Universities, the owner of thebuilding and MCC Capital Engineering & Research Incorporation Limited.
REFERENCES
CMC (China Ministry of Construction). 2002. Technical Specification for Concrete Structures of Tall Building (JGJ3–2002).China Architecture & Building Press: Beijing, China. (in Chinese).
CMC (China Ministry of Construction). 2010. Code for Seismic Design of Buildings (GB50011-2010). China Architecture &Building Press: Beijing, China. (in Chinese).
Computer and Structures, Inc. 2006. Perform-3D, Nonlinear Analysis and Performance Assessment for 3D Structure User Guide,Version 4. Computers and Structures, Inc.: Berkeley, CA.
Federal Emergency Management Agency (FEMA). 2000. Pre-standard and Commentary for the Seismic Rehabilitation ofBuildings. FEMA 356: Washington, D.C.
Han LH. 2000. Concrete Filled Steel Tube Structure (First edition). Science Press: Beijing. (in Chinese).Han LH, Li W, Yang YF. 2009. Seismic behavior of concrete-filled steel tubular frame to RC shear wall high-rise mixed
structures. Journal of Constructional Steel Research 65(5): 1249–1260. DOI: 10.1016/j.jcsr.2008.12.005Liu JS, Qiu T. 2008. Experimental study on seismic performance of tall building with steel transfer trusses located at a higher
level. Journal of Shanghai Jiaotong University (Science) 13(2): 181–183. DOI: 10.1007/s12204-008-0181-xMander JB, Priestley MJN, Park R. 1988. Theoretical stress–strain model for confined concrete. Journal of Structural
Engineering ASCE 114: 1804–1826.Tall Buildings Initiative. 2010. Guidelines for performance-based seismic design of tall buildings. Pacific Earthquake Engineering
Research Center.Tohma J, Hwang H. 1987. Hysteretic model for reinforced concrete containment. Transactions of the 9th International
Conference on Structural Mechanics in Reactor Technology, Lausanne, Switzerland, 251–256.Zhou XM, Li GQ. 2010. Shaking table model test of a steel-concrete composite high-rise building. Journal of Earthquake
Engineering 14(4): 601–625. DOI: 10.1080/13632460903193949
Copyright © 2012 John Wiley & Sons, Ltd. Struct. Design Tall Spec. Build. 23, 334–349 (2014)DOI: 10.1002/tal

SEISMIC PERFORMANCE OF A SUPER-TALL STEEL–CONCRETE HYBRID STRUCTURE 349
AUTHORS’ BIOGRAPHIES
Huanjun Jiang is a professor in Structural Engineering at Research Institute of Structural Engineeringand Disaster Reduction, Tongji University. He received his Ph.D. in Structural Engineering fromTongji University in China in 1999. His research interests include reinforced concrete structures,steel-concrete composite structures, and performance-based seismic design of building structures.
Bo Fu is a PhD candidate of Research Institute of Structural Engineering and Disaster Reduction, TongjiUniversity. His research interests include seismic performance assessment of high-rise buildings.
Laoer Liu received his Master degree in structural engineering from Tongji University in China in 2011.His research interests include seismic performance assessment of high-rise buildings.
Xiaowei Yin is a PhD candidate of Research Institute of Structural Engineering and Disaster Reduction,Tongji University. Her research interests include seismic performance assessment of high-rise buildings.
Copyright © 2012 John Wiley & Sons, Ltd. Struct. Design Tall Spec. Build. 23, 334–349 (2014)DOI: 10.1002/tal