jfc ar2014 inside · mang inasal ended 2014 with another record performance, reflecting the...
TRANSCRIPT

San Pin Wang
Jollibee Foods CORPORATION

TABLE OF CONTENTS
1 Serving the Best!2 Chairman’s Message6 CEO’s Message10 Continuously Serving Generations of Filipinos the Alagang Jollibee Way12 Increasing its Foothold on the International Market14 The Coolest Chapter Yet16 Wow for The Win18 Breaking New Ground20 Maintaining Excellence in Quality22 Shattering Records24 Spreading Sweet Family Moments Everyday26 Delivering Great Value28 Nothing but The Best30 A Record Year32 Making Great Progress34 10 Years of Spreading Joy36 Board of Directors and Corporate Management Team37 Financial Statements

1
Jollibee Foods CORPORATION
This annual report showcases the flagship products of each of our brands. These are the products that our customers buy most, remember most and come back most for!

2 CHAIRMAN’S MESSAGE
Capitalizing on our Strengths to Achieve our Vision

3
To My Fellow Stockholders,
Over the past three decades, Jollibee Foods Corporation (JFC) has been a witness to so many changes in economic and business environments. We have seen how globalization has transformed the competitive landscape, how technology and social media have dramatically changed the way business is conducted and even altered everyone’s way of life. Changes continue to occur at a very rapid pace.
JFC’s evolution from a single-brand to a company with multiple brands is one of our ways of adapting to the changes we have witnessed. We have taken advantage of opportunities as they have arisen. With all of our brands, we always try to deliver on our mission of bringing the joy of eating to everyone, through our great tasting food. This is our underlying business strategy that pervades all our brands—great tasting food and value.
Our mission embodies a set of values that we have adopted and that we try to live every day in our organization. We seek to continually satisfy our customers, which is the driving force towards providing excellence in our products, services and relationships. Our employees work together and strive to achieve excellence in everything they do.
The core strategies that have guided us in the past continue to guide us in the present and the future. As business opportunities emerge, we continue to aggressively pursue them in line with our goal to enhance long-term growth and profitability.
We continue to expand organically, both in the Philippines and in other countries, and we look for acquisitions and joint ventures that will provide us with outstanding opportunities for geographic growth and transformation in Asia and the United States, creating substantial sources of value creation.
As the most recent example, JFC through its wholly-owned subsidiary Jollibee Worldwide Pte. Ltd. entered into a joint venture agreement with Jasmine Asset Holding Ltd. to form a company that will own and operate Dunkin’ Donuts restaurants in the People’s Republic of China. The joint venture will have the exclusive right to develop Dunkin’ Donuts in various territories in the People’s Republic of China, such as: Hong Kong, Macau, Fujian, Hunan,
“Our mission embodies a set of values that we have adopted and that we try to live every day in our organization. We seek to continually satisfy our customers, which is the driving force towards providing excellence in our products, services and relationships. Our employees work together and strive to achieve excellence in everything they do.”

4 CHAIRMAN’S MESSAGE
Jianxi, Guangdong, Hainan, Guanxi, Beijing, Tianjin, Hebei, Shangxi, Chongqing, Guizhou, Sichuan, Yunnan, Heilongjiang and Jilin. The joint venture will open and operate a minimum of 1,459 shops in the People’s Republic of China based on an agreed development schedule.
We continue to invest in the expansion and modernization of our commissary facilities to address our need for increased capacity and improvement in operating efficiency and production costs in the manufacturing, warehousing and distribution infrastructure.
We continue to invest in information systems to support our long-term growth as we pursue our goal of becoming one of the largest QSRs in the world.
These multiple opportunities for growth support our vision of becoming one of the Top 5 Quick Service Restaurants in the world in terms of market capitalization. As we all work to achieve our vision, we must continue to capitalize on our strengths: solid brands, superior product taste and quality, large store network, operational efficiencies, focused and efficient management, and core competence in quick service restaurant management. Most importantly, we must invest in our people, the ultimate source of our competitive advantage.
As JFC continues to grow, so does our potential for reaching and helping more people in more ways through the Jollibee Group Foundation which we established in 2004.
The main focus of the Jollibee Group Foundation is to be a partner of communities aspiring for better lives in the way Jollibee knows how. Through our Jollibee Group Foundation, we are able to help and give back to society in areas such as education, agriculture and environment.
Our Busog, Lusog, Talino or BLT School Feeding Program that we started seven years ago to provide lunch daily to help pupils stay in school and learn better has already benefited 145,000 pupils nationwide.
Through the efforts of partners, teachers and parents in BLT schools across the country, year-on-year, 85% of pupils gained normal nutritional status after the feeding cycle, which contributed to improved attendance.
“Looking forward, I am confident that we can achieve the goals we have set for ourselves and our Company. We have the discipline to manage our businesses and the opportunistic spirit that drives us to be bigger and better. We expect to be an even larger global QSR with substantial earnings and sales growths to ensure the best long-term value creation for you, our shareholders. “

5
Our Farmer Entrepreneurship Program (FEP) continued to enable smallholder farmers to become entrepreneurs and directly supply fresh produce to institutional markets, including JFC. In 2014, FEP assisted more than 900 farmers from 27 farmer groups nationwide. Records show that farmers delivering to JFC can earn up to five times more compared to when they sell to local markets.
As a leading model for inclusive business, FEP was featured in various forums including the Harvard Asia Business Conference in Boston, CSR Asia Summit in Hong Kong, and Partnerships for Disaster and Climate Resilience in Manila.
Following the disaster relief initiatives in response to Typhoon Yolanda, a special school feeding program was implemented in the first quarter of 2014, nourishing more than 49,000 pupils in 134 schools in Aklan, Iloilo, Negros Occidental, Capiz, Western Samar and Leyte. The Farmer Livelihood Recovery Program was implemented to help farmers grow food for their family’s consumption and generate additional income. The program provided financing, training and marketing assistance to 702 smallholder farmers from Iloilo, Antique, Aklan and Cebu.
Looking forward, I am confident that we can achieve the goals we have set for ourselves and our Company. We have the discipline to manage our businesses and the opportunistic spirit that drives us
TONY TAN CAKTIONGChairman of the Board
to be bigger and better. We expect to be an even larger global QSR with substantial earnings and sales growths to ensure the best long-term value creation for you, our shareholders.
On behalf of the Board of Directors, I wish to express our heartfelt gratitude to the JFC management and employees for their dedication to ensuring the continued growth and success of JFC. As we enter 2015, I welcome another year of growth and achievement.

6 CEO’s MESSAGE
Another Year of Strong Growth

7
To my Fellow Stockholders,
For the first time, I’m addressing you as the CEO of Jollibee Foods Corporation. I am pleased to report that 2014 was another strong year for our Company.
JFC revenues, which include sales of company-owned stores, commissary sales to franchised stores, franchised fees and royalty fees increased by 12.9% to Php90.7 billion. System wide sales in 2014 grew by 13.3% to Php117.9 billion. The Philippine business grew by 13.2%, with all brands growing in the double digits. The foreign business grew by 13.7%, with Southeast Asia and the Middle East growing by 25.9%, US 12.2% and China 11.1%. System wide sales measure all sales to consumers both from company-owned and franchised stores. The sales growth for the year was driven by an 8.0% same store sales growth (for the Philippines and worldwide) and a 5.4% growth in store network. Same store sales growth pertains to restaurants that were already open for at least 15 months. It excludes sales growth from new store opening.
The Jollibee Group opened a total of 234 new stores in 2014, of which 169 were in the Philippines and 65 were in foreign operations.
All our businesses performed remarkably well in 2014. In the Philippines, the growth of our brands remained strong throughout the year.
Jollibee maintained strong leadership in its market segment with consistent profitability. Notwithstanding the ever-competitive burger-chicken segment, Jollibee delivered high same store sales
growth. Expansion of the store network continued with a net addition of 47 stores.
Chowking continued to be a significant contributor to JFC’s sales and profit. As it remained focused on delivering the best of its food, its people and its brand to delight its guests, its system wide sales grew robustly, supported by strong same store sales growth and a 2.5% growth in store network.
Greenwich delivered and even exceeded expectations in terms of product offering, product quality, customer service and brand innovation. As a result, its growth, both in sales and profit continued to be impressive. Greenwich’s system wide sales growth was supported by a consistent strong growth in same store sales and a net store addition of 12.
Red Ribbon made itself more accessible to its customers with the opening of 48 new stores. This, and the strong performance of its flagship products — Butter Mamon, Black Forest, Triple Chocolate Roll, and Chocolate Dedication Cake drove the growth in Red Ribbon’s system wide sales.
Mang Inasal ended 2014 with another record performance, reflecting the Company’s success in meeting the taste preferences of the Filipino consumer. System wide sales grew at a robust rate, practically coming from same store sales, while profit grew by 25%.
Burger King posted the highest system wide sale growth among JFC’s domestic brands for 2014 and the third highest sales growth

8
Processing Pte. Ltd.). Despite a very challenging year for the Chinese quick service restaurant (QSR) industry due to food safety issues, our system wide sales grew double-digits. All these we achieved through high quality products and raw materials, affordable price points and quality stores driven by an even stronger organization.
It was likewise a strong year for our businesses in the United States, Southeast Asia and the Middle East. The growth in the US business’ system wide sales was driven by strong same store sales growth and a net addition of 6 stores. Our business in Southeast Asia and the Middle East (SAME) delivered robust sales growth, driven by Jollibee Vietnam, Jollibee Middle East and Chowking Middle East. Our SAME business ended 2014 with a network of 121 stores — strongly positioned in key markets in Vietnam (62), Middle East (44), Brunei (12), Singapore (2) and Hong Kong (1).
Our brands’ healthy sales growth translated to strong profit growth for the Company. JFC’s net income attributable to equity holders of the Parent reached Php5.4 billion in 2014, 14.8% higher than the amount generated in 2013. Earnings per share grew by 14.0% to Php5.08. Our Philippine business achieved a double digit profit growth rate while all foreign regions: the United States, China, the Middle East and Southeast Asia contributed profit to the JFC Group in 2014. These were achieved despite raw material cost increases in 2014 that brought pressure on our gross profit margin. JFC also incurred significant increase in the cost of supporting information technology associated with the change in our enterprise platform resulting in operating income
“Our brands’ healthy sales growth translated to strong profit growth for the Company. JFC’s net income attributable to equity holders of the Parent reached Php5.4 billion in 2014, 14.8% higher than the amount generated in 2013. Earnings per share grew by 14.0% to Php5.08. Our Philippine business achieved a double digit profit growth rate while all foreign regions: the United States, China, the Middle East and Southeast Asia contributed profit to the JFC Group in 2014.”
in the Burger King Asia Pacific region for the second half of 2014. Burger King opened nine new stores, bringing its total stores at end of 2014 to 43, the largest restaurant network Burger King has ever had in the Philippines. Key outlets also got much-needed renovation works to the delight of Burger King guests. By the end of 2014, 70% of the restaurant network sported Burger King’s latest design concept.
In China, we made significant progress over the past year. We achieved a huge turnaround in overall profit driven by Hong Zhuang Yuan, San Pin Wang and the China commissary (Happy Bee Foods
CEO’s MESSAGE

9
margin contraction. We view these investments in information management as key investments for our long term growth and expect these rising overhead costs to be more than offset by higher rates of business growth in the years ahead.
In 2014, we invested Php5.6 billion in capital expenditures on new stores and store renovations, commissaries and information systems. We will continue accelerating our investments in building our organization capability primarily in store network expansion and in information technology. We made the biggest information systems change in JFC’s history with the implementation of the SAP system in August, 2014. It covered 11 modules including financial accounting, material management, warehouse management, sales and distribution, human capital management, etc. with interfaces with 8 non SAP systems including our store systems that will henceforth show much greater information to our people at the stores to aid them in their work. Our investment in this new enterprise platform amounted to at least half a billion pesos.
We continued to create value for our shareholders. The JFC stock price grew by 24.2% in 2014, outperforming the market. JFC’s stock price to earnings ratio rose to 42.4 times. We declared a regular cash dividend of Php1.64, representing a 32.3% payout of profit. Total shareholder return, the combination of stock price appreciation and cash dividends, for 2014 was 25.2%. Based on data from Bloomberg, JFC reached the number 10 slot in terms of market capitalization among publicly-listed quick service restaurants in the world.
We are cautiously optimistic about the year ahead, despite challenges in the markets where we operate. By continuing to deliver on our strategic commitments, we will drive operational performance and create value for our shareholders.
In closing, I would like to thank all our employees, franchisees and their teams around the world for their contribution throughout the year. Thank you for working very hard to deliver consistent strong results every year. I would also like to extend my thanks to my fellow Board members for your continued advice and contributions and all our business partners, associates, bankers, suppliers and shareholders for your continuing support.
ERNESTO TANMANTIONGChief Executive Officer

CHICKENJOY10

11
2014 was a challenging year for Jollibee but this did not deter the resolve of the JFC Group’s flagship brand to prepare the pathway for accelerated business growth and continue serving customers in its trademark Alagang Jollibee way.
Total system wide sales reached Php56.4 billion in 2014, 11.4% higher than 2013.
In line with its mission of further spreading the langhap-sarap goodness to as many families as possible, 56 new stores were opened, bringing the total store count to 858 by the end of the year.
Jollibee went back to basics and put in significant efforts and investments behind its three flagship products – Chickenjoy, Jolly Spaghetti and Yumburger.
For Chickenjoy, Jollibee implemented a price-off promo with its spaghetti bundle, launched a thematic campaign that captured the most enjoyable fried chicken experience via the pasarap nang pasarap nang pasarap tagline, offered exciting and deliciously filling bucket treats and came out with a Christmas thematic campaign
featuring Sarah Geronimo and her protégés in The Voice Kids Philippines Darren Espanto and Lyca Gairanod.
The launch of the new Cheesy Bacon Mushroom Yum in June significantly helped in growing Jollibee’s total mid-premium Yumburger segment. The widely-received TVC featuring Nadine Lustre, in particular, helped widen our lead in the beef burger market, cementing our dominant leadership vs. McDo.
The brand tapped the well-loved and well-respected celebrity Legaspi family to promote Jolly Spaghetti. This aimed to expand positioning of the product to not only target kids but extend it to all members of the family. This TVC garnered Excellent Branded Cut Through (BCT) score at 16.9% among Moms in Q2 2014. Family Pan Meals were also launched to drive group consumption of the product. The full year campaign helped in increasing total spaghetti by 12% vs. SPLY.
Jollibee also continued to introduce exciting products giving customers more reasons to keep
coming back, such as the Garlic Pepper Beef, Ultimate Burger Steak, and Amazing Aloha Champ. We also brought back the Pancake Sandwich.
The official Jollibee Facebook page was able to reach a milestone in 2014 when it breached the 1-Million likes from Facebook users. The brand also achieved digital success when it produced heartwarming made-for-digital videos to mark special occasions such as Grandparents Day and Independence Day.
Championing the promotion of Filipino values was religiously continued with its 4th Jollibee Family Values Awards where a new OFW category was added to honor Global Filipinos. Its annual CSR program Maaga ang Pasko celebrated its milestone 20th year with the longest Christmas celebration that kicked off with carols, store launches and capped with an MTV featuring 20 celebrities.
For the past 35 years, Jollibee has hinged its success on its long standing relationship with generations of Filipino families and it will continue to do so as it remains the brand’s greatest source of inspiration and fulfillment.
Continuously Serving Generations of Filipinos the Alagang Jollibee Way
OPERATIONAL HIGHLIGHTS

YUM WITH CHEESE12

13
2014 saw a more aggressive expansion plan for Jollibee’s international operations, with a total of 29 new stores opened, compared to 18 in the previous year. This was largely driven by the robust Vietnam market that set the stage for the opening of 24 new stores, further cementing the fastfood chain’s presence in the country. Across all markets, system wide sales grew – reaching as high as 53.6%, bolstered by the focus on Jollibee’s flagship products.
Jollibee Singapore opened a second store in 2014, to answer the clamor from customers for their favorite Jollibee products. It sustained its healthy growth, registering a 34.4% increase in system wide sales which was aided by the increasing number of Singaporeans patronizing the brand.
Jollibee Hong Kong continues its steady growth with 18.7% increase in system wide sales through the patronage of our Global Pinoys in the market. The store, which underwent renovation in 2013, focused on operational improvements and new promos and offerings to provide better
customer experience and keep patrons loyal to the brand.
In Brunei, Jollibee was able to register a modest growth despite the aggressive efforts of competitors and even without opening a new store. Continuous value offerings and flagship product initiatives helped drive increase sales in the market.
Jollibee USA registered Php2.8 billion system wide sales, with campaigns on Chickenjoy and Jolly Spaghetti resulting in considerable increase in ADQ for the two flagship products. It introduced new Chickenjoy Bucket Treat bundles in July and launched a Chickenjoy Bucket campaign in Q4 encouraging big orders, growing total Chickenjoy Buckets volume by 27.0%. It also opened 3 new stores, upping the total store count to 32.
In KSA, Jollibee opened 1 new store as system wide sales grew by 22.3%. This was driven by yearlong promotions for Chickenjoy and Yumburger. Total store network increased to ten by yearend.
2014 was another banner year for Jollibee Vietnam as it closed the year with a total of 62 stores, with a 53.6% growth in system wide sales, which was the highest among all international markets.
Jollibee Qatar’s system wide sales grew 25.0% despite not opening a new store in 2014. The 3 Jollibee stores were able to sustain the growth with timely product and promo offerings that helped attract new customers and increased frequency of visit from loyal patrons.
Jollibee Kuwait also sustained its strong performance, with system wide sales growth of 45.8%. This was aided by successful campaigns on the company’s flagship products and other year-long promotions.
Jollibee continues to bank on its signature flagship products to drive growth and attract new customers in different markets. With its well-loved, Everyday Delicious food offerings, the company is poised to successfully push forward with its aggressive expansion plans, inching closer to its goal of becoming a global QSR brand.
Increasing its Foothold on the International Market
OPERATIONAL HIGHLIGHTS

ULTIMATE OVERLOAD PIZZA14

15
In 2014, Greenwich continued to write another big chapter in its ever growing story, leaping steps ahead of its biggest competitors. Efforts in marketing, store and product development enabled the company to reach more Filipinos with a more best-tasting and best-value menu and more authentic dining experience. Customers continued to come back, sharing and discussing their best Greenwich moments with friends and family. As a result, the company posted an even bigger double-digit growth rate of 17.6% in 2014, eclipsing the already impressive rate of 13.1% from the previous year.
One of the biggest growth contributors was the aggressive store expansion. Fourteen new stores were opened, seven of which were under the new “Pizzeria” concept that provided patrons the modern and warm ambience of the world’s most beloved neighborhood pizza places. The revamped look not only boosted the dining experience, it also became a stronger brand
identity statement: Greenwich is the pizza-and-pasta place of choice for the young, trendy, and sociable.
The extensive communications campaigns for both flagship and core categories, as well as for the new stores, were also major factors of Greenwich growth in 2014. Leveraging on the superior taste, quality, and value of its offerings, as well as on brand attributes that have been proven to resonate with the target barkada crowd, Greenwich was able to keep brand conversation going with its customers via traditional and digital media, merchandising, and sampling initiatives. It was also successful in influencing diners to choose Greenwich foremost.
Flagship products Ultimate Hawaiian Overload Pizza, Ultimate Overload Pizza, and Lasagna Supreme received significantly superior scores versus its closest competitors in acceptability and preference rankings, driving sales to record levels!
New products like Pizza Thins also received a higher preference rating versus its challengers, while Creamy Carbonara - with its now creamier sauce - increased in average daily sales by a phenomenal 50%.
The enjoyment of Greenwich’s patrons did not go unnoticed, even earning for the brand the Number 2 spot in a widely-read Huffington Post Taste article on the world’s best pizza chains. Greenwich was the only Asian company to make it, finding itself in the company of brands from Spain, Canada, the UK, and Norway.
Greenwich will continue to grow in these directions this 2015: serving its very best by launching new stores that will give all barkada everywhere a place for bonding over delightful pizzeria treats, and by engaging the young and young-at-heart through exciting and even more delicious initiatives.
The Coolest Chapter Yet
OPERATIONAL HIGHLIGHTS

CHINESE-STYLE FRIED CHICKEN16

17
Chowking Philippines continued a streak of profitable and balanced growth in 2014. It was indeed a WOW performance with growth and profit wins from all regional business units in Luzon, Visayas and Mindanao. The business continued to be guided by three priorities: to elevate the brand, grow its flagship products and achieve excellence in the restaurant.
To elevate the brand, Chowking introduced a new ambassador, popular talk show host and actress Ms. Kris Aquino. She was instrumental in making Chowking and its Chinese food offerings modern and relatable to everyone. The credibility of her endorsement increased exponentially when she personally invested in her own Chowking franchise before the year ended.
Chowking invested primarily in growing its flagship products as these delivered growth, profit and fame for the brand. As always, it was
a priority to ensure consistent, high quality food in all restaurants every day starting from the commissaries to improving store capability in terms of people and equipment.
The team worked to achieve excellence in all restaurants starting with its strategic locations. Chowking opened new well-located restaurants and implemented renovations at existing restaurants. A new, exciting and very modern store concept was introduced in select locations. The day-to-day operations of the stores to meet food, service and cleanliness standards were also reinforced. These initiatives certainly wowed the numerous guests who visited the stores every day.
Truly, 2014 was a WOW for the WIN for Chowking! It will ride on this momentum to STEP UP on delivering the best of its food and service in 2015.
Wow for The Win
OPERATIONAL HIGHLIGHTS

PORK CHAO FAN18

19
Chowking International Operations (IO) continued to drive excellence in all its undertakings in 2014. The introduction of new and improved products, the opening of new stores and upgrading of existing stores and the top-notch services it provided its customers helped Chowking IO propel to new heights in the past year.
Chowking USA aimed to build its flagship products. With this in mind, Chowking re-engineered one of its flagship products, the Beef Wonton Noodles that helped reinforce customers’ perception of patronizing affordable and quality meals. The introduction of the Chinese-Style Fried Chicken also marked another milestone for Chowking USA. Accompanied with aggressive product promotions, the Chinese-Style Fried Chicken became an instant hit to consumers bringing in strong incremental sales to the brand.
Gold standard training was aggressively rolled-out in all Chowking USA stores to ensure that all products that come out of the kitchen
are of high standards. A complete menu board overhaul was also implemented that provided customers a better and fresher menu communication, which highlighted its best-selling products.
Chowking Middle East (ME) launched several new initiatives in 2014. It ended the year with a network of 28 stores - strongly positioned in key cities in the United Arab Emirates (UAE) (20), Qatar (5), Oman (2) and Kuwait (1).
2014 saw the first ever Chowking restaurant in Kuwait where Filipinos along with Kuwaitis had their first experience of the brand’s famous products like Lauriat, Chao Fan and Siopao. It also marked the first-ever launch of the brand’s flagship product in the Philippines, the Chinese Style Fried Chicken, in the Middle East market. Chowking Kuwait used the latest restaurant design concept in its store, which enhanced the customers’ dining experience.
With the new store openings together with the present Chowking stores in the region,
sales continued to grow at a robust rate in 2014. Total store sales grew by 24.9% over the same period last year - with UAE sales growing by 19.2% driven by increased transaction count and one new store opening. Oman grew by 170.2% and Qatar grew by 21.7% - with store network expansion driving the growth for both markets.
As a step towards aligning FSC standards in the Middle East with JFC Corporate Quality Management, FSC systems were successfully installed in Qatar. Chowking also started with mystery shoppers visits in the UAE. These moves were executed as part of the brand’s efforts to show a strong commitment towards consistently delivering Gold Standard Products to all of its guests in the Middle East.
All these 2014 milestones serve as a springboard for an even more aggressive and exciting 2015 for Chowking International Operations as it promises that it will continuously aim for excellence and serve only the best to its customers.
Breaking New Ground
OPERATIONAL HIGHLIGHTS

2020 YOUTIAO

2121
2014 was a challenging year for the Chinese quick service restaurant (QSR) industry as sales from high-end and western QSR restaurants declined due to food safety issues.
In spite of this, Yonghe King (YHK) managed to consistently maintain its strong performance. Its total sales growth for 2014 was by 11.6% and comparable sales growth ranking was among the best.
This outstanding performance of Yonghe King was attributed to the company’s effort to constantly improve and enhance the taste and food safety procedures for all of its products. The brand worked its efforts on its “Taiwan-inspired” brand positioning, launching a series of tasty products with strong Taiwan imprint. such as the new braised snack series and tofu pudding shaved ice series. YHK also upgraded and improved its existing flagship products, such as the Dawang minced pork rice.
Moreover, Yonghe King comprehensively implemented Gold Standard Training across all stores and conducted frequent audits in order to guarantee food safety procedures and quality processes.
Yonghe King was also able to strengthen and elevate the visibility and awareness of the brand in the government, media and consumers’ minds by focusing the brand’s image on food safety, which consequently was ingrained in the public’s consciousness. This led to Yonghe King winning the Top Brand in Chinese Quick Service Restaurant Industry of C-BPI (China Brand Power Index) award for four consecutive years; the Seven Star Awards for Outstanding Contribution in Food Safety & Public Health for three consecutive years and the Sincerity Service and Satisfactory Brand Award on March 15, 2014 (dubbed as The Consumer Day) for three consecutive years.
In addition, Yonghe King was included in the top 100 most valuable Chinese brand for two consecutive years, as ranked by WPP, the largest communication group around the world. YHK was the only Chinese Quick Service Restaurant brand in the group.
2014 was the year where YHK focused a lot of its initiatives for its employees. The brand extensively promoted Jollibee’s Eight Values in the organization by launching a series of
culture-building events such as staff activities, staff forums, and the Dawang Award where it recognized employees promoting the company’s core values and best practices at work.
Yonghe King also continued with its Corporate Social Responsibility (CSR) activities. In the past two years, YHK actively supported the “I Wanna Attend School” activity conducted by Music Radio, the largest broadcast radio in China, helping those underprivileged children to study and go to school.
2015 will be a milestone year for Yonghe King as it will be celebrating its 20th anniversary. YHK will continue to focus its priorities on “Food Safety, Product Taste and People Culture” as it believes this will bring a brighter future ahead where Yonghe King will soon become not just the leading quick service restaurant in China but also the most favorite.
Maintaining Excellence in Quality
OPERATIONAL HIGHLIGHTS

BLACK FOREST22

23
2014 was another red banner year for Red Ribbon. The company ended the year with an impressive 20% system wide sales growth. This was made possible by the strong performance of its flagship products – Butter Mamon, Black Forest, Triple Chocolate Roll, and Chocolate Dedication Cake – which registered remarkable double-digit growth rates. With strong focus on its core competency in baked goods, Red Ribbon grew its four major categories beyond the Php1 billion mark, with notable sales growth across all the regions, especially in the provinces. The tireless efforts to make the brand synonymous with the Filipino value of celebrating special occasions also enabled the achievement of record-breaking performance during red-letter days.
Red Ribbon painted the Philippines red with the opening of 48 new stores in 2014. With a total of more than 300 stores nationwide, more customers are now able to gain access to the brand’s delicious cakes, breads & pastries. Red
Ribbon also pushed for delightful and attractive stores with the renovation of 20 stores across the country. With all the stores complying with the strictest standards on quality and service, Red Ribbon was rewarded with the highest rating in its history and the highest across all JFC SBUs on food, safety, cleanliness, and conditions. This is truly a testament to Red Ribbon’s commitment to everyday excellence.
Supporting these achievements by our stores was the aggressive improvement in Red Ribbon’s commissary capacity. More than 40% increase in commissary capacity was achieved by the commissioning of the new Santolan facility and the expansion in the Tarlac, Cebu and Davao commissaries. The opening of icing facilities in selected provinces also allowed Red Ribbon to serve the stores in far-flung areas more efficiently. With these investments in infrastructure, Red Ribbon was able to serve the ever increasing demand for its products. Beyond these expansions were the unwavering
commitment and attention to quality, as proven by the recognition and award for high Good Manufacturing Practice of the commissaries by the Food and Drug Administration.
Indeed, 2014 was a year when Red Ribbon took the lead as it not only achieved its goals, it also shattered records. Red Ribbon is ready to make its purpose of making every moment sweeter real in 2015.
Shattering Records
OPERATIONAL HIGHLIGHTS

BUTTER MAMON24

25
Red Ribbon Bakeshop continued to soar and spread sweet family moments in the United States in 2014. The brand impressively managed to grow same store sales by 5.6% and exceeded profitability targets by double digits despite aggressive competition, rising commodity and labor costs.
Red Ribbon USA continued to build on its flagship products Butter Mamon and Mango Cake, as it launched advertising & product sampling efforts to induce trial and repeat purchase for these key products.
The re-engineering & improvement of the top-selling product Ensaimada – renamed Cheesy Ensaimada - helped grew its sales by an astounding 38% versus same period last year thanks to a full advertising support.
An aggressive advertising campaign for the Ube Overload Cake was also pushed where it was positioned as the cake overflowing with real ube. This helped its sales grew by an impressive 74% versus same period last year.
The introduction of several new products also helped grow the business and solidified
Red Ribbon’s USA’s identity as a high-quality bakeshop. One of these is the Coconut Macaroons, which exceeded target sales by double digit. Together with this product, the brand also launched a Corporate Social Responsibility (CSR) effort, in partnership with Apl.De.Ap Foundation and Franklin Baker Company, to help build schools in the Philippines.
The year also gave us successful new store openings that totaled to six (6) stores in 2014. The store opening of Red Ribbon in the Lone-Star state of Texas last October was of great significance as it had a record breaking opening day sales of almost $29,000. Customers from as far as Oklahoma and Florida visited Houston for the sweet treats. Three new stores were also opened in California - Chino, San Jose and Irvine - plus two more stores set up shop on the island of Oahu, Hawaii (Waipahu and Honolulu). These brought Red Ribbon USA’s total store network to 35 stores with strong presence in eight states truly capitalizing on the brand’s mission to spread sweet family moments every day.
In terms of operational excellence, 100% of Red Ribbon’s stores were recognized as FSC Certified Stores of which 75% were Gold Stars.
With all these major accomplishments, Red Ribbon USA is more inspired to continue spreading sweet family moments everyday by delivering high-quality products coupled with excellent service in all its stores in the region. This will surely make the Red Ribbon brand name a strong bakeshop name in the US for the years to come.
Spreading Sweet Family Moments Everyday
OPERATIONAL HIGHLIGHTS

LEAN PORK & PRESERVED EGG CONGEE26

27
The Hong Zhuang Yuan (HZY) business continued its turnaround in 2014. By end of year, it was ahead of its target for net operating income. HZY punched in more customers, more spending and hence, more profitable growth for the restaurants. It even strengthened its position – HZY is the only Chinese neighborhood restaurant that “feels like home,” offering delicious, everyday good value for money “comfort food” from memories of childhood and Beijing, as well as delightful, comfortable eating experience.
In growing its flagship products, HZY sourced growth from strengthening key existing products such as Congee & Hot dishes. Lean Pork & Preserved Egg Congee, Five Black Congee, Kungbao Chicken, and Sautéed Assorted Vegetable served with Pancake are potential additions to HZY’s flagship products. To ensure consistent, high quality food in all restaurants every day, HZY implemented the golden quality standard program. The central
kitchen improved and standardized HZY’s raw materials and cooking sauces. This was followed through with an effort to equip all restaurants with standardized operating processes for each individual dish.
HZY also launched full new menu twice during the year (Spring & Summer, Autumn & Winter) with over 40 new products, providing customers with high quality, great-tasting food at affordable prices and strengthening HZY’s tagline — “Congee, and Much More.”
HZY renovated some of its restaurants to give it a more revitalized look, with a new façade carrying HZY’s new logo design & tag line. The day-to-day operations of the restaurant worked to meet high levels of food, service and cleanliness standards.
With the momentum of 2014, Hong Zhuang Yuan is more than ready to be on the top of its industry. HZY is poised to maintain its unique identity and consistently deliver great value to its customers.
Delivering Great Value
OPERATIONAL HIGHLIGHTS

CHICKEN INASAL28

29
After 11 years, Mang Inasal continues to set the bar in the Pinoy branded eat-out scene and show why it is the Filipinos’ preferred place for delicious chicken inasal and other Filipino food favorites.
The year 2014 marked a new milestone for Mang Inasal as it surpassed goals and paved the way for a bigger and brighter 2015.
Recognizing that a business’ success is built on its people and business partners, the company reinforced its organizational strength through values integration and enhancement workshops and business partners’ assemblies for increased franchise engagement. Among other initiatives, Mang Inasal formally gave recognition to outstanding employees as well as top-performing agents through the Mang Inasal Service Excellence Awards. These efforts resulted in an impressive employee engagement score which showed a marked improvement from 2012.
To boost operational excellence, Mang Inasal implemented a rigorous area managers audit calibration and feedback management system. In its bid for continuing improvement that translated to better customer satisfaction, it
installed the new 1-tonner marination tumbler for increased capacity, and the check weigher to ensure quality. Moreover, the company focused on FSC (Food, Service, Cleanliness and Conditions) improvement in the stores, which resulted to growth of FSC-certified stores from 50 percent (2013) to 78 percent (2014) and Gold-Certified Stores, from 8 percent to 25 percent. This commitment to quality has kept Mang Inasal a well-loved brand, a commitment it continues to live up to year after year.
Through massive and high-impact advertising and in-store marketing campaigns with actress Angel Locsin as celebrity endorser, the flagship product Chicken Inasal achieved a record-breaking volume growth, proof of how it continues to win the hearts and taste preference of many Filipinos. While maintaining its “2-in-1 sa laki” brand promise, it also introduced its “nuot sa sarap” attribute, evincing mouthwatering images of the marinade seeping deeply into the chicken that makes it the best-tasting branded inasal.
Meanwhile, the company launched the PinoySangkap, Creamy Sarap campaign to create
more widespread consumer awareness of its well-received halo-halo. As a result, Mang Inasal’s Pinoy Halo-Halo emerged as the dominant market leader in its category, with top value share in the third quarter of 2014 in Metro Manila. Refusing to rest on their laurels, Mang Inasal rolled out the Gold Standard training across the country to ensure the consistent taste superiority of the Pinoy Halo Halo.
Also in 2014, Mang Inasal reinforced the afternoon snacks line-up with the improved Pansit Bihon profile and the introduction of the delightfully irresistible Palabok.
Throughout the country, 2014 hit a robust P10.7B in system wide sales, with growth marked at 17.4 percent growth versus the previous year. To top it off, Mang Inasal successfully completed 49 renovations and added 16 new stores, thus ending the year with 456 stores nationwide. As of today, Mang Inasal remains to be the number one Pinoy branded outlet in Metro Manila.
As a new business year unfolds, bigger challenges await, but as Mang Inasal has consistently proven, nothing can keep it from serving only the best to food-loving Filipinos.
Nothing but The Best
OPERATIONAL HIGHLIGHTS

WHOPPER30

31
In 2014, Burger King proved that focus and discipline lead to strong brand and business growth. A focus on its flagship products, new store openings in key cities and market places, and driving operational excellence all led to a record year for the brand.
Burger King Philippines ended 2014 with 43 restaurants, the largest restaurant network the brand has ever had in the Philippines. A total of nine new branches were opened, the most number of openings in one year in recent history. 2014 also marked the first ever restaurant outside of Luzon. Last November, Cebuanos got their first taste of the world-famous Whopper as Burger King opened its doors in Ayala Cebu. Apart from the numerous openings, four restaurants were also renovated to adopt the new design concept. Banner outlets such as SM Pampanga, SM North EDSA, Alabang Town Center, and Glorietta got their much needed facelift. By the end of 2014, 70% of the restaurant network sported the latest design concept bringing the “best burger experience” promise of the brand to life.
In 2014, the brand re-aligned its efforts to focus on its flagship product, the Whopper. The brand re-launched the product to highlight the Whopper’s taste superiority over competition – it being the only flame-grilled burger amongst all fast food brands – and likewise, its value for money superiority through an aggressive price correction on its value meals.
This was executed through a high cut-through media strategy that resulted in its first ever nationwide-airing TV campaign. The campaign was supported in multiple media touchpoints, like Radio, Outdoor and Digital Media. The Classic Whopper also got a strong boost with a new variant, the 4-Cheese Whopper, which provided incremental lift from cheese-loving burger eaters. Meat lovers also got their fill with the new Monster Bacon Angus Steak variant. All these resulted in the highest Whopper volume, sales and profit in Burger King Philippines’ history.
World-class operations also proved to be a key differentiator for the brand in 2014. With
relentless focus on addressing key issues surfaced in GuestTrac, the proprietary Burger King tool in monitoring guest experience and feedback, the Philippine operations was able to rank No. 1 in the Asia Pacific region. The region now looks up to the Philippines as the benchmark in QSC.
2014 also marked another milestone for Burger King Philippines as the company recorded its highest total of new hires for its restaurants and main office support as it readied itself to achieve the brand’s aggressive growth targets.
All these efforts led to the Philippine franchise getting the third highest sales growth in the Burger King Asia Pacific region for the second half of 2014, and an impressive double-digit total sales growth for the entire year. All these limit-defying achievements in 2014 serve as a stepping stone for another breakthrough year in 2015, wherein Burger King Philippines aims to be the benchmark of excellence in the fast food Industry.
A Record Year
OPERATIONAL HIGHLIGHTS

BEEF RICE NOODLE32

33
San Pin Wang (SPW) made great progress in its operational performance and organizational structure in 2014.
San Pin Wang’s system wide sales grew by 18% driven by an 11% growth in store network and a 6% growth in comparative sales. Strong sales and prudent management of store and main office expenses led to a significant profit growth, its highest since the start of the joint venture in 2010.
Five franchised stores and two company- owned stores were opened during the year, the highlight of which was the opening of a new store at the airport which gave customers the opportunity to try and experience dining at San Pin Wang. San Pin Wang ended 2014 with 50 stores.
QSC&V (Quality, Service, Cleanliness and Value) achieved a significant breakthrough in 2014 as three San Pin Wang restaurants received Class A rating from official auditors based in Manila. This mirrors SPW’s efforts in upgrading the quality of its products and services.
San Pin Wang continued to focus on strengthening its flagship products -- the Original Soup Beef Rice Noodle, Pickled Vegetable Beef Rice Noodle and Spiral Snail Rice Noodle. These products, which accounted for 70% of San Pin Wang’s sales, drove the strong sales growth.
The improvement in the quality of San Pin Wang’s beef products led to increased customer visits to the stores. An average of 50,000 customers per day visited San Pin Wang stores. For 2014, about 18,000,000 people dined at San Pin Wang stores. San Pin Wang imports beef from New Zealand.
The numerous accomplishments that SPW made this year were achieved through the dedication and hard work of its employees. In 2014, SPW employees numbered to more than 800.
For the next five years, SPWs strategic goals are very clear. These are to make SPW a strong regional brand in the catering industry, expand the number of stores in Guangxi, China and steadily develop the franchising business model.
In 2015, SPW will upgrade its central processing plant to ensure that stringent food safety measures are implemented. SPW will also continue to focus on improving its Beef Rice Noodle and launch a higher-priced and better quality version of this product to meet the varying demands and preferences of its discerning customers.
San Pin Wang will also use the digital platform to introduce more convenient and faster ways to connect and provide its products and services to its customers. San Pin Wang is committed to make even greater progress in 2015!
Making Great Progress
OPERATIONAL HIGHLIGHTS
San Pin Wang

BLT and FEP each received the 2014 Asian Corporate Social Responsibility Award besting 109 other entries from 12 countries.
34

35
The promotion of BLT’s School Feeding standards on Food Safety and Quality, Accountability and Community Ownership (FAC) reached a new milestone with the launching the BLT Excellence Awards for partner schools in 2014. The Awards aim to ensure the assessment of BLT’s quality implementation and recognition of exemplary performance.
Farmer Entrepreneurship Program (FEP)
FEP continued to enable smallholder farmers to become entrepreneurs and directly supply fresh produce to institutional markets. In 2014, FEP assisted more than 900 farmers from 27 farmer groups nationwide.
Farmer clusters were accredited as JFC suppliers for onions, tomatoes, bell peppers, chili peppers, and calamansi leading to increased incomes. Records show that farmers delivering to JFC can earn up to five times more compared to when they sell to local markets.
As a leading model for inclusive business, FEP was featured in various forums including the Harvard Asia Business Conference in Boston, CSR
2014 marks the 10th year of Jollibee Group Foundation (JGF). As the social responsibility arm of JFC, the flagship programs of the Foundation are inspired by the company’s mission of spreading the joy of eating to everyone. Through the principle of Creating Shared Value, the Foundation capitalizes on the business objectives and core competencies of JFC and implements programs that create valuable and meaningful impact in the community.
Busog, Lusog, Talino (BLT) School Feeding Program
For SY 2013-2014, BLT was implemented in 1,043 public schools in 191 cities and municipalities across the country, feeding 37,000 undernourished pupils. The program has reached 145,000 pupils since 2007. BLT provides lunch daily to help pupils stay in school and learn better.
Through the efforts of partners, teachers and parents in BLT schools across the country, year-on-year, 85% of pupils gained normal nutritional status after the feeding cycle, which contributed to improved attendance.
Asia Summit in Hong Kong, and Partnerships for Disaster and Climate Resilience in Manila.
Jollibee Group FoodAID
Following the disaster relief initiatives in response to Typhoon Yolanda, a special school feeding program was implemented in the first quarter of 2014, nourishing more than 49,000 pupils in 134 schools in Aklan, Iloilo, Negros Occidental, Capiz, Western Samar, and Leyte. The Farmer Livelihood Recovery Program was implemented to help farmers grow food for their family’s consumption and generate additional income. The program provided financing, training and marketing assistance to 702 smallholder farmers from Iloilo, Antique, Aklan and Cebu.
Ten years since its establishment, JGF continues to render excellent service to communities, thus ensuring that JFC’s success in business creates inclusive success in its communities.
10 Years of Spreading Joy
OPERATIONAL HIGHLIGHTS

36 BOARD OF DIRECTORS AND CORPORATE MANAGEMENT TEAM Jollibee Foods Corporation and Subsidiaries
DIRECTORS
ANG NGO CHIONG† Chairman Emeritus
TONY TAN CAKTIONGChairman of the Board
WILLIAM TAN UNTIONG Director / Corporate Secretary
ERNESTO TANMANTIONG Director / President / CEO
JOSEPH C. TANBUNTIONG Director / Treasurer
ANG CHO SIT Director
ANTONIO CHUA POE ENG Director
MONICO V. JACOB Director
CEZAR P. CONSING Director
(RET) CHIEF JUSTICE ARTEMIO V. PANGANIBANDirector
WASHINGTON Z. SYCIP Independent Adviser
1 ATTY. VALERIE F. AMANTE Assistant Corporate Secretary and VP and Head - Corporate Legal
CORPORATE OFFICERS1
TONY TAN CAKTIONGChairman of the Board
ERNESTO TANMANTIONG President / Chief Executive Officer
YSMAEL V. BAYSA Chief Financial Officer
WILLIAM TAN UNTIONG Chief Real Estate Executive
DANIEL RAFAEL RAMON Z. GOMEZ III Chief Marketing Officer
HEADS OF LOCAL UNITS
JOSEPH C. TANBUNTIONG President, Jollibee Philippines
JOSE MA. A. MINANA, JR. Group President, JFC
FERNANDO S. YU, JR.President, Chowking Philippines
ALBERT C. CUADRANTEGeneral Manager, Greenwich Business
ZINNIA CARMENCITA RIVERAGeneral Manager, Red Ribbon Philippines
JUSTO S. ALANO IIIGeneral Manager, Mang Inasal Business
JOAN FRANCIS K. AQUINOGeneral Manager, Burger King Philippines
HEADS OF INTERNATIONAL UNITS
CHIN SENG YUEChief Human Resources Advisor
DR. POLLY YANGVP - Corporate Research and Development
RAYMOND SU*President, Yonghe King Business
LAWRENCE YIN**General Manager, Hong Zhuang Yuan Business
FRANKIE TANPresident, Happy Bee Foods Processing Pte., Ltd.***
DU HANPresident, Guangxi San Pin Wang Food and Beverage Management Co., Ltd.
FRANCIS ALDWIN E. FLORESVP - International Mainstream Markets
DENNIS M. FLORESVP - International Filipino Markets
TRAN THI LAN ANHGeneral Manager, Jollibee Vietnam
MARIBETH DELA CRUZGeneral Manager, US Operations
HEADS OF CORPORATE UNITS
JOSE MA. A. MINANA, JR. Head, Network Development Group
WILLIAM S. LORENZANA, JR. President - Zenith Foods Corporation and VP - Corporate Supply Chain
ANASTACIA S. MASANCAY****VP - Corporate Audit and Other Businesses
SUSANA K. TANMANTIONG Chief Procurement Officer
LAURO C. MATIASChief Information Officer
LIWAYWAY T. MATEOVP - Corporate Quality Management
ERLINDA F. CASTROHead, FA/HR Shared Services
JOLLIBEE GROUP FOUNDATION, INC.
GRACE A. TAN CAKTIONGPresident
**** Effective April 1, 2015, Mr. Carl Bryan A. Tancaktiong
is President of Yonghe King business.
**** Effective April 1, 2015, Adam Zhou is General
Manager of Hong Zhuang Yuan business.
**** Formerly Jollibee Foods Processing Pte. Ltd., change
in name effective October 1, 2014.
**** Effective January 1, 2015, Ms. Masancay is Vice
President - Special Projects and Ms. Lorna Atun is
Head, Corporate Audit.
As of March 31, 2015

37
38Selected Financial Data
39 Statement of Management’s Responsibility for Financial Statements
40Independent Auditors’ Report
41Consolidated Statements of Financial Position
42Consolidated Statements of Comprehensive Income
43Consolidated Statements of Changes In Equity
44Consolidated Statements of Cash Flows
46Notes to Consolidated Financial Statements
FINANCIAL STATEMENTS CONTENT

38 SELECTED FINANCIAL DATA
(in P’000, except Number of Stores, Personnel, Ratios, Per Share Data and Outstanding Shares)
FOR THE YEAR 2012 2013 2014
Consolidated Systemwide Sales 92,271,200 104,090,057 117,897,939 Gross Revenues 71,059,039 80,282,769 90,671,238 Net Income 3,711,996 4,722,807 5,488,942 Net Income (Attributable to Equity Holders of the Parent) 3,727,084 4,671,559 5,361,979 Payroll and Benefits 11,056,054 12,504,376 14,293,625 Personnel 42,090 40,958 39,929 Number of Stores
Jollibee* 872 912 983 Greenwich 202 199 211 Chowking* 430 446 457 Red Ribbon* 244 309 358 Yonghe King 297 314 310 Hong Zhuang Yuan 46 43 42 Mang Inasal 465 459 456 Burger King 29 34 43 Jinja Bar 3 3 3 San Pin Wang 40 45 50
* Domestic and International
AT YEAR-END
Total Assets 41,768,131 46,026,634 54,118,680 Total Property & Equipment 11,059,464 11,772,441 13,363,567 Total Equity 21,731,303 23,360,940 28,078,022 Current Ratio 0.94 1.18 1.26 Debt Ratio 0.49 0.50 0.49
PER SHARE DATA
Basic Earnings Per Share 3.58 4.45 5.08 Diluted Earnings Per Share 3.51 4.36 4.96 Cash Dividend 2.20 3.36 1.64 Book Value 20.75 22.20 26.37
SHARE INFORMATION
Outstanding Shares (net of Treasury Shares) 1,047,412,219 1,052,161,335 1,064,592,974

39STATEMENT OF MANAGEMENT’S RESPONSIBILITY FOR FINANCIAL STATEMENTS
The management of JOLLIBEE FOODS CORPORATION AND SUBSIDIARIES (the Company) is
responsible for the preparation and fair presentation of the consolidated financial statements
for the years ended December 31, 2014, 2013 and 2012, including the additional components
attached therein, in accordance with the prescribed financial reporting framework indicated
therein. This responsibility includes designing and implementing internal controls relevant to the
preparation and fair presentation of consolidated financial statements that are free from material
misstatement, whether due to fraud or error, selecting and applying appropriate accounting
policies, and making accounting estimates that are reasonable in the circumstances.
The Board of Directors reviews and approves the consolidated financial statements and submit
the same to the stockholders.
SyCip Gorres Velayo & Co., the independent auditors, appointed by the stockholders for the years
ended December 31, 2014, 2013 and 2012, has examined the consolidated financial statements
of the Company in accordance with Philippine Standards on Auditing, and in its report to the
stockholders, has expressed its opinion on the fairness of presentation upon completion of such
examination.
Signed under oath by the following:
TONY TAN CAKTIONG ERNESTO TANMANTIONG
Chairman of the Board President and Chief Executive Officer
YSMAEL V. BAYSA MARILOU N. SIBAYAN
Vice-President for Corporate Finance Vice President and Comptroller - Worldwide
and Chief Finance Officer
REPUBLIC OF THE PHILIPPINES )
CITY OF PASIG )S.S
Before me, a notary public in and for the city named above, personally appeared the following:
Name Competent Evidence of Identity
Tony Tan Caktiong SSS Number: 03-5003942-0
Ernesto Tanmantiong SSS Number: 03-6292699-0
Ysmael V. Baysa SSS Number: 03-4228219-1
Marilou N. Sibayan SSS Number: 03-9964176-9
Who are personally known to me and to me known to be the same persons who presented the
foregoing instrument and signed the instrument in my presence, and who took on oath before
me as to such instrument.
Witness my hand and seal this April 08, 2015.
Doc. No. 325
Page No. 66
Book No. 3
Series of 2015

40 INDEPENDENT AUDITORS’ REPORT
The Stockholders and the Board of Directors
Jollibee Foods Corporation
We have audited the accompanying consolidated financial statements of Jollibee Foods
Corporation and its subsidiaries, which comprise the consolidated statements of financial
position as at December 31, 2014 and 2013, and the consolidated statements of comprehensive
income, statements of changes in equity and statements of cash flows for each of the three years
in the period ended December 31, 2014, and a summary of significant accounting policies and
other explanatory information.
Management’s Responsibility for the Consolidated Financial Statements
Management is responsible for the preparation and fair presentation of these consolidated
financial statements in accordance with Philippine Financial Reporting Standards, and for
such internal control as management determines is necessary to enable the preparation of
consolidated financial statements that are free from material misstatement, whether due to
fraud or error.
Auditors’ Responsibility
Our responsibility is to express an opinion on these consolidated financial statements based
on our audits. We conducted our audits in accordance with Philippine Standards on Auditing.
Those standards require that we comply with ethical requirements and plan and perform the
audit to obtain reasonable assurance about whether the consolidated financial statements are
free from material misstatement.
An audit involves performing procedures to obtain audit evidence about the amounts and
disclosures in the consolidated financial statements. The procedures selected depend on
the auditor’s judgment, including the assessment of the risks of material misstatement of the
consolidated financial statements, whether due to fraud or error. In making those risk assessments,
the auditor considers internal control relevant to the entity’s preparation and fair presentation of
the consolidated financial statements in order to design audit procedures that are appropriate
in the circumstances, but not for the purpose of expressing an opinion on the effectiveness of
the entity’s internal control. An audit also includes evaluating the appropriateness of accounting
policies used and the reasonableness of accounting estimates made by management, as well as
evaluating the overall presentation of the consolidated financial statements.
We believe that the audit evidence we have obtained is sufficient and appropriate to provide a
basis for our audit opinion.
Opinion
In our opinion, the consolidated financial statements present fairly, in all material respects, the
financial position of Jollibee Foods Corporation and its subsidiaries as at December 31, 2014
and 2013, and their financial performance and their cash flows for each of the three years in the
period ended December 31, 2014 in accordance with Philippine Financial Reporting Standards.
SYCIP GORRES VELAYO & CO.
Marydith C. Miguel
Partner
CPA Certificate No. 65556
SEC Accreditation No. 0087-AR-3 (Group A),
January 18, 2013, valid until January 17, 2016
Tax Identification No. 102-092-270
BIR Accreditation No. 08-001998-55-2012,
February 27, 2015, valid until February 26, 2018
PTR No. 4751303, January 5, 2015, Makati City
April 7, 2015
Marydith C Miguel

41CONSOLIDATED STATEMENTS OF FINANCIAL POSITION
December 31
2014 2013
ASSETS
Current Assets
Cash and cash equivalents (Notes 6, 30 and 31) P7,618,473,267 P9,903,877,068
Receivables (Notes 7, 30 and 31) 7,621,193,252 3,082,872,678
Inventories (Note 8) 5,971,813,991 3,560,432,134
Other current assets (Note 9) 2,809,910,944 1,836,995,105
Total Current Assets 24,021,391,454 18,384,176,985
Noncurrent Assets
Available-for-sale financial assets (Notes 10, 30 and 31) 21,479,461 21,479,461
Interests in and advances to joint ventures, co-venturers and an
associate (Note 11) 3,388,902,606 3,322,393,765
Property, plant and equipment (Note 12) 13,363,567,166 11,772,440,510
Investment properties (Note 13) 1,025,645,035 751,767,041
Goodwill and other intangible assets (Note 14) 9,385,110,293 9,103,636,848
Operating lease receivables (Notes 29, 30 and 31) 21,089,606 21,267,251
Deferred tax assets - net (Note 24) 751,965,318 756,196,860
Other noncurrent assets (Notes 15, 30 and 31) 2,139,528,661 1,893,275,392
Total Noncurrent Assets 30,097,288,146 27,642,457,128
P54,118,679,600 P46,026,634,113
LIABILITIES AND EQUITY
Current Liabilities
Trade payables and other current liabilities (Notes 16, 30 and 31) P16,295,665,174 P14,249,926,021
Income tax payable 181,829,126 154,744,537
Short-term debt (Notes 18, 30 and 31) 1,865,000,000 −
Current portion of:
Long-term debt (Notes 18, 30 and 31) 715,520,000 1,106,275,244
Liability for acquisition of businesses (Notes 11, 30 and 31) 32,906,018 107,666,875
Total Current Liabilities 19,090,920,318 15,618,612,677
Noncurrent Liabilities
Noncurrent portion of:
Long-term debt (Notes 18, 30 and 31) P4,428,012,970 P4,062,970,500
Liability for acquisition of businesses (Notes 11, 30 and 31) 101,064,311 129,007,932
Provisions (Note 17) 30,500,639 30,500,639
Derivative liability (Notes 18, 30 and 31) 1,545,472 4,532,600
Pension liability (Note 25) 832,390,250 932,841,109
Operating lease payables (Notes 29, 30 and 31) 1,544,846,191 1,569,071,461
Deferred tax liabilities - net (Note 24) 11,377,928 318,157,118
Total Noncurrent Liabilities 6,949,737,761 7,047,081,359
Total Liabilities 26,040,658,079 22,665,694,036
Equity Attributable to Equity Holders of the Parent Company
(Note 30)
Capital stock (Note 19) 1,063,862,430 1,051,430,791
Additional paid-in capital 4,452,162,323 3,640,716,729
Cumulative translation adjustments of foreign subsidiaries, joint
ventures and an associate (25,789,376) 38,306,710
Remeasurement loss on net defined benefit plan - net of tax (219,900,060) (472,054,212)
Comprehensive loss on derivative liability (Note 18) (2,395,155) (3,411,504)
Excess of cost over the carrying value of non-controlling interests
acquired (Note 19) (542,764,486) (542,764,486)
Retained earnings (Note 19):
Appropriated for future expansion 10,200,000,000 10,200,000,000
Unappropriated 12,445,662,470 8,817,166,243
27,370,838,146 22,729,390,271
Less cost of common stock held in treasury (Note 19) 180,511,491 180,511,491
27,190,326,655 22,548,878,780
Non-controlling Interests (Note 11) 887,694,866 812,061,297
Total Equity 28,078,021,521 23,360,940,077
P54,118,679,600 P46,026,634,113
See accompanying Notes to Consolidated Financial Statements.
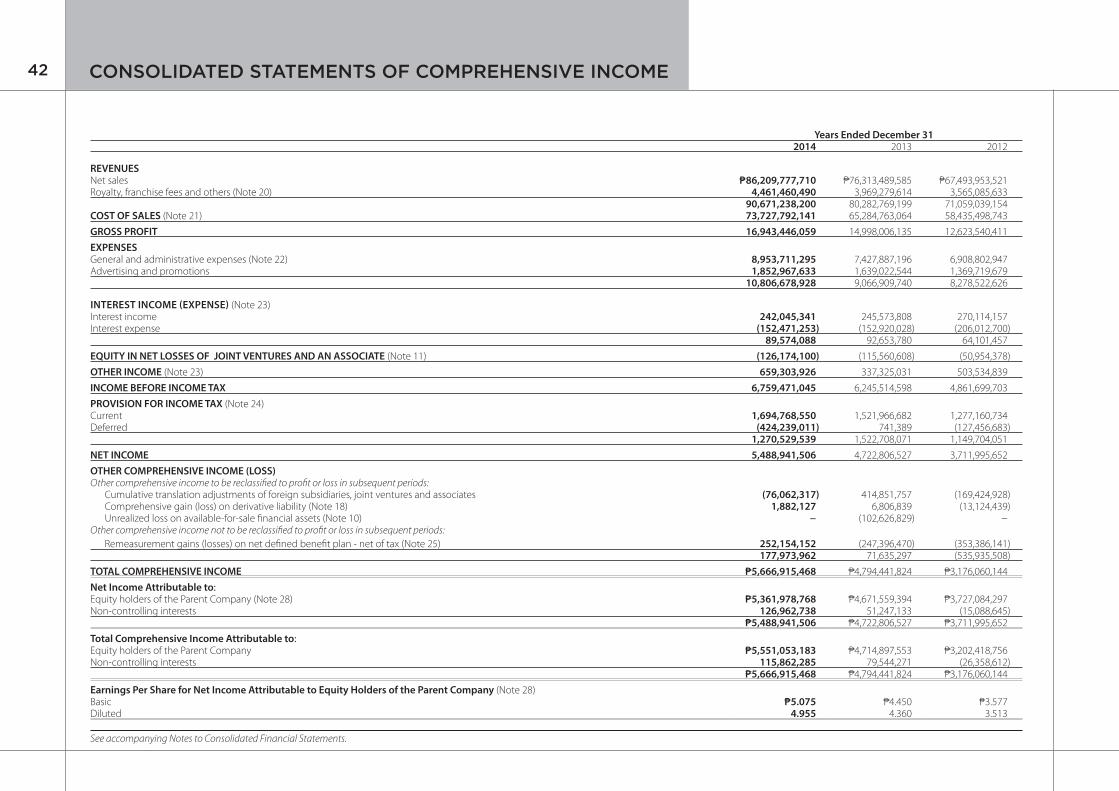
42 CONSOLIDATED STATEMENTS OF COMPREHENSIVE INCOME
Years Ended December 312014 2013 2012
REVENUESNet sales P86,209,777,710 P76,313,489,585 P67,493,953,521Royalty, franchise fees and others (Note 20) 4,461,460,490 3,969,279,614 3,565,085,633
90,671,238,200 80,282,769,199 71,059,039,154COST OF SALES (Note 21) 73,727,792,141 65,284,763,064 58,435,498,743
GROSS PROFIT 16,943,446,059 14,998,006,135 12,623,540,411
EXPENSES General and administrative expenses (Note 22) 8,953,711,295 7,427,887,196 6,908,802,947Advertising and promotions 1,852,967,633 1,639,022,544 1,369,719,679
10,806,678,928 9,066,909,740 8,278,522,626
INTEREST INCOME (EXPENSE) (Note 23)Interest income 242,045,341 245,573,808 270,114,157 Interest expense (152,471,253) (152,920,028) (206,012,700)
89,574,088 92,653,780 64,101,457
EQUITY IN NET LOSSES OF JOINT VENTURES AND AN ASSOCIATE (Note 11) (126,174,100) (115,560,608) (50,954,378)
OTHER INCOME (Note 23) 659,303,926 337,325,031 503,534,839
INCOME BEFORE INCOME TAX 6,759,471,045 6,245,514,598 4,861,699,703
PROVISION FOR INCOME TAX (Note 24)Current 1,694,768,550 1,521,966,682 1,277,160,734Deferred (424,239,011) 741,389 (127,456,683)
1,270,529,539 1,522,708,071 1,149,704,051
NET INCOME 5,488,941,506 4,722,806,527 3,711,995,652
OTHER COMPREHENSIVE INCOME (LOSS)Other comprehensive income to be reclassified to profit or loss in subsequent periods: Cumulative translation adjustments of foreign subsidiaries, joint ventures and associates (76,062,317) 414,851,757 (169,424,928) Comprehensive gain (loss) on derivative liability (Note 18) 1,882,127 6,806,839 (13,124,439) Unrealized loss on available-for-sale financial assets (Note 10) − (102,626,829) −Other comprehensive income not to be reclassified to profit or loss in subsequent periods:
Remeasurement gains (losses) on net defined benefit plan - net of tax (Note 25) 252,154,152 (247,396,470) (353,386,141)177,973,962 71,635,297 (535,935,508)
TOTAL COMPREHENSIVE INCOME P5,666,915,468 P4,794,441,824 P3,176,060,144
Net Income Attributable to:Equity holders of the Parent Company (Note 28) P5,361,978,768 P4,671,559,394 P3,727,084,297Non-controlling interests 126,962,738 51,247,133 (15,088,645)
P5,488,941,506 P4,722,806,527 P3,711,995,652
Total Comprehensive Income Attributable to:Equity holders of the Parent Company P5,551,053,183 P4,714,897,553 P3,202,418,756Non-controlling interests 115,862,285 79,544,271 (26,358,612)
P5,666,915,468 P4,794,441,824 P3,176,060,144
Earnings Per Share for Net Income Attributable to Equity Holders of the Parent Company (Note 28)Basic P5.075 P4.450 P3.577Diluted 4.955 4.360 3.513
See accompanying Notes to Consolidated Financial Statements.
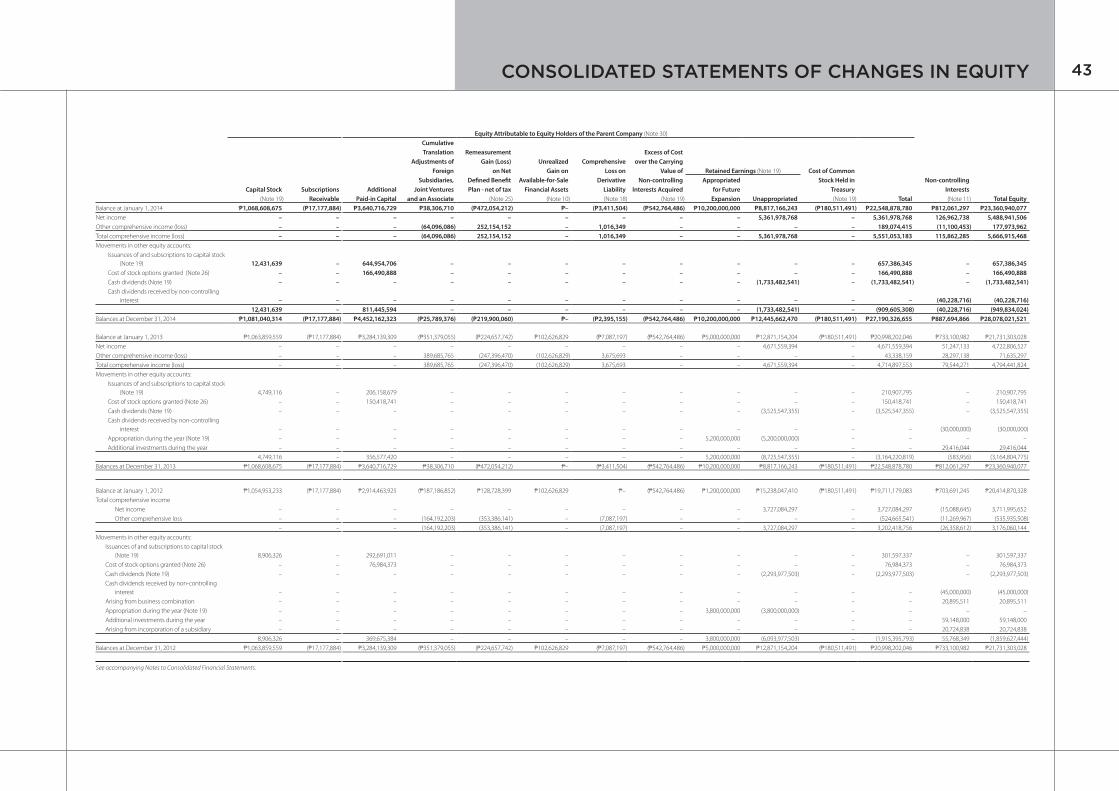
43
Equity Attributable to Equity Holders of the Parent Company (Note 30)
Cumulative
Translation Remeasurement Excess of Cost
Adjustments of Gain (Loss) Unrealized Comprehensive over the Carrying
Foreign on Net Gain on Loss on Value of Retained Earnings (Note 19) Cost of Common
Subsidiaries, Defined Benefit Available-for-Sale Derivative Non-controlling Appropriated Stock Held in Non-controlling
Capital Stock Subscriptions Additional Joint Ventures Plan - net of tax Financial Assets Liability Interests Acquired for Future Treasury Interests
(Note 19) Receivable Paid-in Capital and an Associate (Note 25) (Note 10) (Note 18) (Note 19) Expansion Unappropriated (Note 19) Total (Note 11) Total Equity
Balance at January 1, 2014 P1,068,608,675 (P17,177,884) P3,640,716,729 P38,306,710 (P472,054,212) P– (P3,411,504) (P542,764,486) P10,200,000,000 P8,817,166,243 (P180,511,491) P22,548,878,780 P812,061,297 P23,360,940,077
Net income – – – – – – – – – 5,361,978,768 – 5,361,978,768 126,962,738 5,488,941,506
Other comprehensive income (loss) – – – (64,096,086) 252,154,152 – 1,016,349 – – – – 189,074,415 (11,100,453) 177,973,962
Total comprehensive income (loss) – – – (64,096,086) 252,154,152 – 1,016,349 – – 5,361,978,768 – 5,551,053,183 115,862,285 5,666,915,468
Movements in other equity accounts:
Issuances of and subscriptions to capital stock
(Note 19) 12,431,639 – 644,954,706 – – – – – – – – 657,386,345 – 657,386,345
Cost of stock options granted (Note 26) – – 166,490,888 – – – – – – – – 166,490,888 – 166,490,888
Cash dividends (Note 19) – – – – – – – – – (1,733,482,541) – (1,733,482,541) – (1,733,482,541)
Cash dividends received by non-controlling
interest – – – – – – – – – – – – (40,228,716) (40,228,716)
12,431,639 – 811,445,594 – – – – – – (1,733,482,541) – (909,605,308) (40,228,716) (949,834,024)
Balances at December 31, 2014 P1,081,040,314 (P17,177,884) P4,452,162,323 (P25,789,376) (P219,900,060) P– (P2,395,155) (P542,764,486) P10,200,000,000 P12,445,662,470 (P180,511,491) P27,190,326,655 P887,694,866 P28,078,021,521
Balance at January 1, 2013 P1,063,859,559 (P17,177,884) P3,284,139,309 (P351,379,055) (P224,657,742) P102,626,829 (P7,087,197) (P542,764,486) P5,000,000,000 P12,871,154,204 (P180,511,491) P20,998,202,046 P733,100,982 P21,731,303,028
Net income – – – – – – – – – 4,671,559,394 – 4,671,559,394 51,247,133 4,722,806,527
Other comprehensive income (loss) – – – 389,685,765 (247,396,470) (102,626,829) 3,675,693 – – – – 43,338,159 28,297,138 71,635,297
Total comprehensive income (loss) – – – 389,685,765 (247,396,470) (102,626,829) 3,675,693 – – 4,671,559,394 – 4,714,897,553 79,544,271 4,794,441,824
Movements in other equity accounts:
Issuances of and subscriptions to capital stock
(Note 19) 4,749,116
– 206,158,679 – – – – – – – – 210,907,795 – 210,907,795
Cost of stock options granted (Note 26) – – 150,418,741 – – – – – – – – 150,418,741 – 150,418,741
Cash dividends (Note 19) – – – – – – – – – (3,525,547,355) – (3,525,547,355) – (3,525,547,355)
Cash dividends received by non-controlling
interest – – – – – – – – – – – – (30,000,000) (30,000,000)
Appropriation during the year (Note 19) – – – – – – – – 5,200,000,000 (5,200,000,000) – – – –
Additional investments during the year – – – – – – – – – – – – 29,416,044 29,416,044
4,749,116 – 356,577,420 – – – – – 5,200,000,000 (8,725,547,355) – (3,164,220,819) (583,956) (3,164,804,775)
Balances at December 31, 2013 P1,068,608,675 (P17,177,884) P3,640,716,729 P38,306,710 (P472,054,212) P– (P3,411,504) (P542,764,486) P10,200,000,000 P8,817,166,243 (P180,511,491) P22,548,878,780 P812,061,297 P23,360,940,077
Balance at January 1, 2012 P1,054,953,233 (P17,177,884) P2,914,463,925 (P187,186,852) P128,728,399 P102,626,829 P– (P542,764,486) P1,200,000,000 P15,238,047,410 (P180,511,491) P19,711,179,083 P703,691,245 P20,414,870,328
Total comprehensive income
Net income – – – – – – – – – 3,727,084,297 – 3,727,084,297 (15,088,645) 3,711,995,652
Other comprehensive loss – – – (164,192,203) (353,386,141) – (7,087,197) – – – – (524,665,541) (11,269,967) (535,935,508)
– – – (164,192,203) (353,386,141) – (7,087,197) – – 3,727,084,297 – 3,202,418,756 (26,358,612) 3,176,060,144
Movements in other equity accounts:
Issuances of and subscriptions to capital stock
(Note 19) 8,906,326 – 292,691,011 – – – – – – – – 301,597,337 – 301,597,337
Cost of stock options granted (Note 26) – – 76,984,373 – – – – – – – – 76,984,373 – 76,984,373
Cash dividends (Note 19) – – – – – – – – – (2,293,977,503) – (2,293,977,503) – (2,293,977,503)
Cash dividends received by non-controlling
interest – – – – – – – – – – – – (45,000,000) (45,000,000)
Arising from business combination – – – – – – – – – – – – 20,895,511 20,895,511
Appropriation during the year (Note 19) – – – – – – – – 3,800,000,000 (3,800,000,000) – – – –
Additional investments during the year – – – – – – – – – – – – 59,148,000 59,148,000
Arising from incorporation of a subsidiary – – – – – – – – – – – – 20,724,838 20,724,838
8,906,326 – 369,675,384 – – – – – 3,800,000,000 (6,093,977,503) – (1,915,395,793) 55,768,349 (1,859,627,444)
Balances at December 31, 2012 P1,063,859,559 (P17,177,884) P3,284,139,309 (P351,379,055) (P224,657,742) P102,626,829 (P7,087,197) (P542,764,486) P5,000,000,000 P12,871,154,204 (P180,511,491) P20,998,202,046 P733,100,982 P21,731,303,028
See accompanying Notes to Consolidated Financial Statements.
CONSOLIDATED STATEMENTS OF CHANGES IN EQUITY
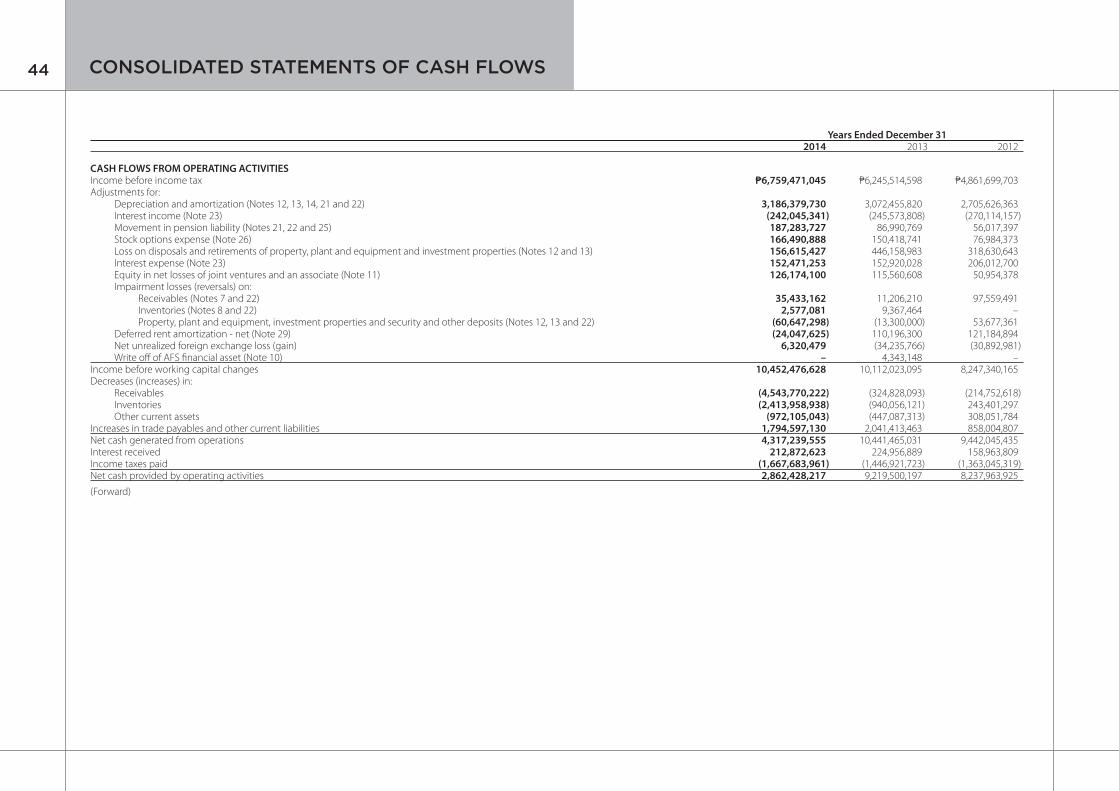
44 CONSOLIDATED STATEMENTS OF CASH FLOWS
Years Ended December 312014 2013 2012
CASH FLOWS FROM OPERATING ACTIVITIESIncome before income tax P6,759,471,045 P6,245,514,598 P4,861,699,703Adjustments for: Depreciation and amortization (Notes 12, 13, 14, 21 and 22) 3,186,379,730 3,072,455,820 2,705,626,363 Interest income (Note 23) (242,045,341) (245,573,808) (270,114,157) Movement in pension liability (Notes 21, 22 and 25) 187,283,727 86,990,769 56,017,397 Stock options expense (Note 26) 166,490,888 150,418,741 76,984,373 Loss on disposals and retirements of property, plant and equipment and investment properties (Notes 12 and 13) 156,615,427 446,158,983 318,630,643 Interest expense (Note 23) 152,471,253 152,920,028 206,012,700 Equity in net losses of joint ventures and an associate (Note 11) 126,174,100 115,560,608 50,954,378 Impairment losses (reversals) on: Receivables (Notes 7 and 22) 35,433,162 11,206,210 97,559,491 Inventories (Notes 8 and 22) 2,577,081 9,367,464 – Property, plant and equipment, investment properties and security and other deposits (Notes 12, 13 and 22) (60,647,298) (13,300,000) 53,677,361 Deferred rent amortization - net (Note 29) (24,047,625) 110,196,300 121,184,894 Net unrealized foreign exchange loss (gain) 6,320,479 (34,235,766) (30,892,981) Write off of AFS financial asset (Note 10) – 4,343,148 –Income before working capital changes 10,452,476,628 10,112,023,095 8,247,340,165Decreases (increases) in: Receivables (4,543,770,222) (324,828,093) (214,752,618) Inventories (2,413,958,938) (940,056,121) 243,401,297 Other current assets (972,105,043) (447,087,313) 308,051,784Increases in trade payables and other current liabilities 1,794,597,130 2,041,413,463 858,004,807Net cash generated from operations 4,317,239,555 10,441,465,031 9,442,045,435Interest received 212,872,623 224,956,889 158,963,809Income taxes paid (1,667,683,961) (1,446,921,723) (1,363,045,319)Net cash provided by operating activities 2,862,428,217 9,219,500,197 8,237,963,925
(Forward)

45CONSOLIDATED STATEMENTS OF CASH FLOWS
Years Ended December 312014 2013 2012
CASH FLOWS FROM INVESTING ACTIVITIESAcquisitions of: Property, plant and equipment (Note 12) (P5,045,474,419) (P3,907,875,891) (P3,755,906,880) Intangible assets (Note 14) (318,736,601) (267,270,178) – Investment property (Note 13) (277,484,623) – – Interest in a joint venture (Note 11) (74,998,875) (103,608,000) (98,040,000) Subsidiaries - net of cash acquired (Note 11) – – (127,585,219) Available-for-sale financial assets (Note 10) – (300,000) (7,500,000)Advances to a joint venture (101,577,556) (170,125,640) (105,179,193)Proceeds from disposals of property, plant and equipment and investment properties 291,195,603 50,662,989 41,766,889Recovery from a joint venture (Note 11) – – 2,403,795Decrease (increase) in other noncurrent assets (270,947,498) 109,573,188 166,332,173Net cash used in investing activities (5,798,023,969) (4,288,943,532) (3,883,708,435)
CASH FLOWS FROM FINANCING ACTIVITIESPayments of: Cash dividends (Note 19) (1,560,657,861) (3,232,637,120) (2,274,367,485) Long-term debt (Note 18) (1,096,987,500) (3,149,351,766) (728,863,892) Liability for acquisition of businesses (Note 11) (109,920,000) (149,814,984) (108,696,000) Short-term debt (Note 18) – – (900,000,000)Proceeds from: Short-term debt (Note 18) 1,865,000,000 – – Long-term debt (Note 18) 1,053,535,000 2,582,580,000 1,700,800,000 Issuances of and subscriptions to capital stock 657,386,344 210,907,795 301,597,337Interest paid (123,473,583) (141,263,440) (194,335,697)Dividends paid to non-controlling interests (40,228,716) (30,000,000) (45,000,000)Contributions from non-controlling interests – 29,416,042 79,872,838Net cash provided by (used in) financing activities 644,653,684 (3,880,163,473) (2,168,992,899)NET INCREASE (DECREASE) IN CASH AND CASH EQUIVALENTS (2,290,942,068) 1,050,393,192 2,185,262,591EFFECT OF EXCHANGE RATE CHANGES ON CASH AND CASH EQUIVALENTS 5,538,267 4,892,292 8,016,118CASH AND CASH EQUIVALENTS AT BEGINNING OF YEAR 9,903,877,068 8,848,591,584 6,655,312,875CASH AND CASH EQUIVALENTS AT END OF YEAR (Note 6) P7,618,473,267 P9,903,877,068 P8,848,591,584
See accompanying Notes to Consolidated Financial Statements.

46 NOTES TO CONSOLIDATED FINANCIAL STATEMENTS
1. CORPORATE INFORMATION
Jollibee Foods Corporation (the Parent Company) was incorporated in the Philippines. The Parent Company and its subsidiaries (collectively referred to as “the Jollibee Group”) are involved primarily in the development, operation and franchising of quick service restaurants (QSR) under the trade names “Jollibee”, “Chowking”, “Greenwich”, “Red Ribbon”, “Yong He King”, “Hong Zhuang Yuan”, “Mang Inasal”, “Burger King”, “San Pin Wang” and “12 Hotpot”. The other activities of the Jollibee Group include manufacturing and property leasing in support of the quick service restaurant systems and other business activities (see Notes 2 and 5).
The common shares of the Parent Company were listed and have been traded in the Philippine Stock Exchange (PSE) beginning July 14, 1993.
The registered office address of the Parent Company is 10/F Jollibee Plaza Building, 10 F. Ortigas Jr. Ave., Ortigas Center, Pasig City.
The consolidated financial statements as at December 31, 2014 and 2013 and for each of the three years in the period ended December 31, 2014 were reviewed and recommended for approval by the Audit Committee as well as approved and authorized for issuance by the Board of Directors (BOD) on April 7, 2015.
2. BASIS OF PREPARATION, STATEMENT OF COMPLIANCE, CHANGES IN ACCOUNTING POLICIES AND BASIS OF CONSOLIDATION
Basis of PreparationThe consolidated financial statements of the Jollibee Group have been prepared on a historical cost basis, except for the derivative liability and certain available-for-sale (AFS) financial assets, which are measured at fair value. The consolidated financial statements are presented in Philippine peso, which is the Parent Company’s functional and presentation currency.
Statement of ComplianceThe accompanying financial statements have been prepared in compliance with Philippine Financial Reporting Standards (PFRS).
Changes in Accounting PoliciesThe accounting policies adopted are consistent with those of the previous financial year, except for the adoption of the following new PFRSs and amendments to existing PFRS and Philippine Auditing Standards (PAS) which became effective on January 1, 2014:
Amendments to PFRS 10, PFRS 12 and PAS 27, Investment Entities
These amendments provide an exception to the consolidation requirement for entities that meet the definition of an investment entity under PFRS 10. The exception to consolidation requires investment entities to account for subsidiaries at fair value through profit or loss. The amendments must be applied retrospectively, subject to certain transition relief. These amendments have no impact to the Jollibee Group, since none of the entities within the Jollibee Group qualifies to be an investment entity under PFRS 10.
Amendments to PAS 32, Financial Instruments: Presentation - Offsetting Financial Assets and Financial Liabilities
These amendments clarify the meaning of ‘currently has a legally enforceable right to set-off’ and the criteria for non-simultaneous settlement mechanisms of clearing houses to qualify for offsetting and are applied retrospectively. These amendments have no impact on the Jollibee Group, since none of the entities in the Jollibee Group has any offsetting arrangements.
Amendments to PAS 39, Financial Instruments: Recognition and Measurement - Novation of Derivatives and Continuation of Hedge Accounting
These amendments provide relief from discontinuing hedge accounting when novation of a derivative designated as a hedging instrument meets certain criteria and retrospective application is required. These amendments have no impact on the Jollibee Group as the Jollibee Group has not novated its derivatives during the current or prior periods.
Philippine Interpretation International Reporting Interpretations Committee (IFRIC 21), Levies
IFRIC 21 clarifies that an entity recognizes a liability for a levy when the activity that triggers payment, as identified by the relevant legislation, occurs. For a levy that is triggered upon reaching a minimum threshold, the interpretation clarifies that no liability should be anticipated before the specified minimum threshold is reached. Retrospective application is required for IFRIC 21. The interpretation has no impact on the Jollibee Group as it has applied the recognition under PAS 37, Provision, Contingent Liabilities and Contingent Assets, consistent with the requirement of IFRIC 21 in prior years.
Annual Improvements to PFRSs (2010-2012 cycle)
In the 2010-2012 annual improvements cycle, seven amendments to six standards were issued, which included an amendment to PFRS 13, Fair Value Measurement. The amendment to PFRS 13 is effective immediately and it clarifies that short-term receivables and payables with no stated interest rates can be measured at invoice amounts when the effect of discounting is immaterial. This amendment has no significant impact on the Jollibee Group.
Annual Improvements to PFRSs (2011-2013 cycle)
In the 2011-2013 annual improvements cycle, four amendments to four standards were issued, which included an amendment to PFRS 1, First-time Adoption of Philippine Financial Reporting Standards-First-time Adoption of PFRS. The amendment to PFRS 1 is effective immediately. It clarifies that an entity may choose to apply either a current standard or a new standard that is not yet mandatory, but permits early application, provided either standard is applied consistently throughout the periods presented in the entity’s first PFRS financial statements. This amendment has no impact on the Jollibee Group as it is not a first time PFRS adopter.
New Accounting Standards, Interpretations and Amendments to Existing Standards Effective Subsequent to December 31, 2014The Jollibee Group will adopt the following revised standards, interpretations and amendments when these become effective.

47
Effective January 1, 2015
Amendments to PAS 19, Employee Benefits - Defined Benefit Plans: Employee Contributions
PAS 19 requires an entity to consider contributions from employees or third parties when accounting for defined benefit plans. Where the contributions are linked to service, they should be attributed to periods of service as a negative benefit. These amendments clarify that, if the amount of the contributions is independent of the number of years of service, an entity is permitted to recognize such contributions as a reduction in the service cost in the period in which the service is rendered, instead of allocating the contributions to the periods of service. This amendment is effective for annual periods beginning on or after January 1, 2015. It is not expected that this amendment would be relevant to the Jollibee Group, since none of the entities within the Jollibee Group has defined benefit plans wherein employees or third parties make contributions.
Annual Improvements to PFRSs (2010-2012 cycle)
The Annual Improvements to PFRSs (2010-2012 Cycle) are effective for annual periods beginning on or after January 1, 2015 and except as otherwise stated, are not expected to have a material impact on the Jollibee Group. They include:
PFRS 2, Share-based Payment - Definition of Vesting Condition
This improvement is applied prospectively and clarifies various issues relating to the definitions of performance and service conditions which are vesting conditions, including:
A performance condition must contain a service conditionA performance target must be met while the counterparty is rendering serviceA performance target may relate to the operations or activities of an entity, or to those of another entity in the same groupA performance condition may be a market or non-market conditionIf the counterparty, regardless of the reason, ceases to provide service during the vesting period, the service condition is not satisfied.
PFRS 3, Business Combinations - Accounting for Contingent Consideration in a Business Combination
The amendment is applied prospectively for business combinations for which the acquisition date is on or after July 1, 2014. It clarifies that a contingent consideration that is not classified as equity is subsequently measured at fair value through profit or loss whether or not it falls within the scope of PAS 39, Financial Instruments: Recognition and Measurement (or PFRS 9, Financial Instruments, if early adopted). The Jollibee Group shall consider this amendment for any future business combination.
PFRS 8, Operating Segments - Aggregation of Operating Segments and Reconciliation of the Total of the Reportable Segments’ Assets to the Entity’s Assets
The amendments are applied retrospectively and clarify that:An entity must disclose the judgments made by management in applying the aggregation criteria in the standard, including a brief description of operating
segments that have been aggregated and the economic characteristics (e.g., sales and gross margins) used to assess whether the segments are ‘similar’.The reconciliation of segment assets to total assets is only required to be disclosed if the reconciliation is reported to the chief operating decision maker, similar to the required disclosure for segment liabilities.
PAS 16, Property, Plant and Equipment, and PAS 38, Intangible Assets - Revaluation Method - Proportionate Restatement of Accumulated Depreciation and Amortization
The amendment is applied retrospectively and clarifies in PAS 16 and PAS 38 that the asset may be revalued by reference to the observable data on either the gross or the net carrying amount. In addition, the accumulated depreciation or amortization is the difference between the gross and carrying amounts of the asset.
PAS 24, Related Party Disclosures - Key Management Personnel
The amendment is applied retrospectively and clarifies that a management entity, which is an entity that provides key management personnel services, is a related party subject to the related party disclosures. In addition, an entity that uses a management entity is required to disclose the expenses incurred for management services.
Annual Improvements to PFRSs (2011-2013 Cycle)
The Annual Improvements to PFRSs (2011-2013 Cycle) are effective for annual periods beginning on or after January 1, 2015 and are not expected to have a material impact on the Jollibee Group. They include:
PFRS 3, Business Combinations - Scope Exceptions for Joint Arrangements
The amendment is applied prospectively and clarifies the following regarding the scope exceptions within PFRS 3:
Joint arrangements, not just joint ventures, are outside the scope of PFRS 3; andThis scope exception applies only to the accounting in the financial statements of the joint arrangement itself.
PFRS 13, Fair Value Measurement - Portfolio Exception
The amendment is applied prospectively and clarifies that the portfolio exception in PFRS 13 can be applied not only to financial assets and financial liabilities, but also to other contracts within the scope of PAS 39.
PAS 40, Investment Property
The amendment is applied prospectively and clarifies that PFRS 3, and not the description of ancillary services in PAS 40, is used to determine if the transaction is the purchase of an asset or business combination. The description of ancillary services in PAS 40 only differentiates between investment property and owner-occupied property (i.e., property, plant and equipment).

48 NOTES TO CONSOLIDATED FINANCIAL STATEMENTS
Effective January 1, 2016
PAS 16, Property, Plant and Equipment, and PAS 38, Intangible Assets - Clarifications of Acceptable Methods of Depreciation and Amortization
The amendments clarify the principle in PAS 16 and PAS 38 that revenue reflects a pattern of economic benefits that are generated from operating a business (of which the asset is part) rather than the economic benefits that are consumed through use of the asset. As a result, a revenue-based method cannot be used to depreciate property, plant and equipment and may only be used in very limited circumstances to amortize intangible assets. The amendments are effective prospectively for annual periods beginning on or after January 1, 2016, with early adoption permitted. These amendments are not expected to have any impact to the Jollibee Group given that the Jollibee Group has not used a revenue-based method to depreciate its non-current assets.
PAS 16, Property, Plant and Equipment, and PAS 41, Agriculture - Bearer Plants
The amendments change the accounting requirements for biological assets that meet the definition of bearer plants. Under the amendments, biological assets that meet the definition of bearer plants will no longer be within the scope of PAS 41. Instead, PAS 16 will apply. After initial recognition, bearer plants will be measured under PAS 16 at accumulated cost (before maturity) and using either the cost model or revaluation model (after maturity). The amendments also require that produce that grows on bearer plants will remain in the scope of PAS 41 measured at fair value less costs to sell. For government grants related to bearer plants, PAS 20, Accounting for Government Grants and Disclosure of Government Assistance, will apply. The amendments are retrospectively effective for annual periods beginning on or after January 1, 2016, with early adoption permitted. These amendments are not expected to have any impact to the Jollibee Group as the Jollibee Group does not have any bearer plants.
PAS 27, Separate Financial Statements - Equity Method in Separate Financial Statements
The amendments will allow entities to use the equity method to account for investments in subsidiaries, joint ventures and associates in their separate financial statements. Entities already applying PFRS and electing to change to the equity method in its separate financial statements will have to apply that change retrospectively. For first-time adopters of PFRS electing to use the equity method in its separate financial statements, they will be required to apply this method from the date of transition to PFRS. The amendments are effective for annual periods beginning on or after January 1, 2016, with early adoption permitted. These amendments will not have any impact on the Jollibee Group’s consolidated financial statements.
PFRS 10, Consolidated Financial Statements and PAS 28, Investments in Associate and Joint Ventures - Sale or Contribution of Assets between an Investor and its Associate or Joint Venture
These amendments address an acknowledged inconsistency between the requirements in PFRS 10 and those in PAS 28 (2011) in dealing with the sale or contribution of assets between an investor and its associate or joint venture. The amendments require that a full gain or loss is recognized when a transaction involves a business (whether it is housed in a subsidiary
or not). A partial gain or loss is recognized when a transaction involves assets that do not constitute a business, even if these assets are housed in a subsidiary. These amendments are effective from annual periods beginning on or after January 1, 2016. These amendments are not expected to have significant impact to the Jollibee Group.
PFRS 11, Joint Arrangements - Accounting for Acquisitions of Interest in Joint Operations
The amendments to PFRS 11 require that a joint operator accounting for the acquisition of an interest in a joint operation, in which the activity of the joint operation constitutes a business must apply the relevant PFRS 3 principles for business combinations accounting. The amendments also clarify that a previously held interest in a joint operation is not remeasured on the acquisition of an additional interest in the same joint operation while joint control is retained. In addition, a scope exclusion has been added to PFRS 11 to specify that the amendments do not apply when the parties sharing joint control, including the reporting entity, are under common control of the same ultimate controlling party.
The amendments apply to both the acquisition of the initial interest in a joint operation and the acquisition of any additional interests in the same joint operation and are prospectively effective for annual periods beginning on or after January 1, 2016, with early adoption permitted. These amendments are not expected to have any impact to the Jollibee Group.
PFRS 14, Regulatory Deferral Accounts
PFRS 14 is an optional standard that allows an entity, whose activities are subject to rate-regulation, to continue applying most of its existing accounting policies for regulatory deferral account balances upon its first-time adoption of PFRS. Entities that adopt PFRS 14 must present the regulatory deferral accounts as separate line items on the statement of financial position and present movements in these account balances as separate line items in the statement of profit or loss and other comprehensive income. The standard requires disclosures on the nature of, and risks associated with, the entity’s rate-regulation and the effects of that rate-regulation on its financial statements. PFRS 14 is effective for annual periods beginning on or after January 1, 2016. Since the Jollibee Group is an existing PFRS preparer, this standard would not apply.
Annual Improvements to PFRSs (2012-2014 Cycle)
The Annual Improvements to PFRSs (2012-2014 Cycle) are effective for annual periods beginning on or after January 1, 2016 and are not expected to have significant impact on the Jollibee Group. They include:
PFRS 5, Non-current Assets Held for Sale and Discontinued Operations - Changes in Methods of Disposal
The amendment is applied prospectively and clarifies that changing from a disposal through sale to a disposal through distribution to owners and vice-versa should not be considered to be a new plan of disposal, rather it is a continuation of the original plan. There is, therefore, no interruption of the application of the requirements in PFRS 5. The amendment also clarifies that changing the disposal method does not change the date of classification.

49
PFRS 7, Financial Instruments: Disclosures - Servicing Contracts
PFRS 7 requires an entity to provide disclosures for any continuing involvement in a transferred asset that is derecognized in its entirety. The amendment clarifies that a servicing contract that includes a fee can constitute continuing involvement in a financial asset. An entity must assess the nature of the fee and arrangement against the guidance in PFRS 7 in order to assess whether the disclosures are required. The amendment is to be applied such that the assessment of which servicing contracts constitute continuing involvement will need to be done retrospectively. However, comparative disclosures are not required to be provided for any period beginning before the annual period in which the entity first applies the amendments.
PFRS 7, Applicability of the Amendments to PFRS 7 to Condensed Interim Financial Statements
This amendment is applied retrospectively and clarifies that the disclosures on offsetting of financial assets and financial liabilities are not required in the condensed interim financial report unless they provide a significant update to the information reported in the most recent annual report.
PAS 19, Employee Benefits - regional market issue regarding discount rate
This amendment is applied prospectively and clarifies that market depth of high quality corporate bonds is assessed based on the currency in which the obligation is denominated, rather than the country where the obligation is located. When there is no deep market for high quality corporate bonds in that currency, government bond rates must be used. Government bond rates are currently used to calculate the present value of the Jollibee Group’s defined benefit obligation due to the absence of a local market for high quality corporate bonds.
PAS 34, Interim Financial Reporting - disclosure of information ‘elsewhere in the interim financial report’
The amendment is applied retrospectively and clarifies that the required interim disclosures must either be in the interim financial statements or incorporated by cross-reference between the interim financial statements and wherever they are included within the greater interim financial report (e.g., in the management commentary or risk report).
Effective January 1, 2018
PFRS 9, Financial Instruments - Hedge Accounting and amendments to PFRS 9, PFRS 7 and PAS 39 (2013 version)
PFRS 9 (2013 version) already includes the third phase of the project to replace PAS 39 which pertains to hedge accounting. This version of PFRS 9 replaces the rules-based hedge accounting model of PAS 39 with a more principles-based approach. Changes include replacing the rules-based hedge effectiveness test with an objectives-based test that focuses on the economic relationship between the hedged item and the hedging instrument, and the effect of credit risk on that economic relationship; allowing risk components to be designated as the hedged item, not only for financial items but also for non-financial items,
provided that the risk component is separately identifiable and reliably measurable; and allowing the time value of an option, the forward element of a forward contract and any foreign currency basis spread to be excluded from the designation of a derivative instrument as the hedging instrument and accounted for as costs of hedging. PFRS 9 also requires more extensive disclosures for hedge accounting.
PFRS 9 (2013 version) has no mandatory effective date. The mandatory effective date of January 1, 2018 was eventually set when the final version of PFRS 9 was adopted by the Financial Reporting Standard Council (FRSC). The adoption of the final version of PFRS 9, however, is still for approval by the Board of Accountancy.
The Jollibee Group is currently assessing the impact of adopting this standard and expects that the adoption of PFRS 9 will have an effect on the classification and measurement of the Jollibee Group’s financial assets but will have no impact on the classification and measurement of the Jollibee Group’s financial liabilities. The adoption will also have an effect on the Jollibee Group’s application of hedge accounting.
PFRS 9, Financial Instruments (2014 or final version)
In July 2014, the final version of PFRS 9, Financial Instruments, was issued. PFRS 9 reflects all phases of the financial instruments project and replaces PAS 39, Financial Instruments: Recognition and Measurement, and all previous versions of PFRS 9. The standard introduces new requirements for classification and measurement, impairment, and hedge accounting. PFRS 9 is effective for annual periods beginning on or after January 1, 2018, with early application permitted. Retrospective application is required, but comparative information is not compulsory. Early application of previous versions of PFRS 9 is permitted if the date of initial application is before February 1, 2015.
The Jollibee Group is currently assessing the impact of adopting this standard and expects that the adoption of PFRS 9 will have an effect on the classification and measurement of the Group’s financial assets and impairment methodology for financial assets, but will have no impact on the classification and measurement of the Jollibee Group’s financial liabilities. The adoption will also have an effect on the Jollibee Group’s application of hedge accounting.
The following new standard issued by the International Accounting Standards Board (IASB) has not yet been adopted by the Financial Reporting Standards Council
IFRS 15, Revenue from Contracts with Customers
IFRS 15 was issued in May 2014 and establishes a new five-step model that will apply to revenue arising from contracts with customers. Under IFRS 15 revenue is recognized at an amount that reflects the consideration to which an entity expects to be entitled in exchange for transferring goods or services to a customer. The principles in IFRS 15 provide a more structured approach to measuring and recognizing revenue. The new revenue standard is applicable to all entities and will supersede all current revenue recognition requirements under IFRS. Either a full or modified retrospective application is required for annual periods beginning on or after January 1, 2017 with early adoption permitted. The Jollibee Group is currently assessing the impact of IFRS 15 and plans to adopt the new standard on the required effective date once adopted locally.

50 NOTES TO CONSOLIDATED FINANCIAL STATEMENTS
With Deferred Effective Date
Philippine Interpretation IFRIC 15, Agreements of Construction of Real Estate
This interpretation covers accounting for revenue and associated expenses by entities that undertake the construction of real estate directly or through subcontractors. The SEC and the FRSC have deferred the effectivity of this interpretation until the final Revenue standard is issued by the IASB and an evaluation of the requirements of the final Revenue standard against the practices of the Philippine real estate industry is completed. Adoption of the interpretation when it becomes effective will not have any impact on the financial statements of the Jollibee Group as it is not into the business of construction of real estate.
Basis of ConsolidationThe consolidated financial statements comprise the financial statements of the Parent Company and its subsidiaries as at December 31, 2014 and 2013 and for each of the three years in the period ended December 31, 2014, 2013 and 2012.
Control is achieved when the Jollibee Group is exposed, or has rights, to variable returns from its involvement with the investee and has the ability to affect those returns through its power over the investee. Specifically, the Jollibee Group controls an investee if and only if the Jollibee Group has:
Power over the investee (i.e., existing rights that give it the current ability to direct the relevant activities of the investee);Exposure, or rights, to variable returns from its involvement with the investee; andThe ability to use its power over the investee to affect its returns.
When the Jollibee Group has less than a majority of the voting or similar rights of an investee, the Jollibee Group considers all relevant facts and circumstances in assessing whether it has power over an investee, including:
The contractual arrangement with the other vote holders of the investee;Rights arising from other contractual arrangements; orThe Jollibee Group’s voting rights and potential voting rights.
The Jollibee Group re-assesses whether or not it controls an investee if facts and circumstances indicate that there are changes to one or more of the three elements of control. Consolidation of a subsidiary begins when the Jollibee Group obtains control over the subsidiary and ceases when the Jollibee Group loses control of the subsidiary. Assets, liabilities, income and expenses of a subsidiary acquired or disposed of during the year are included in the consolidated financial statements from the date the Jollibee Group gains control until the date the Jollibee Group ceases to control the subsidiary.
Profit or loss and each component of Other Comprehensive Income (OCI) are attributed to the equity holders of the Parent Company and to the non-controlling interests, even if this results in the non-controlling interests having a deficit balance. When necessary, adjustments are made to the financial statements of subsidiaries to bring their accounting policies into line with the Jollibee Group’s accounting policies. All intra-group assets and liabilities, equity, income, expenses and cash flows relating to transactions between members of the Jollibee Group are eliminated in full on consolidation. The reporting dates of the Parent Company and the associate or joint ventures are identical and the latter’s accounting policies conform to those used by the Parent Company for like transactions and events in similar circumstances.
A change in the ownership interest of a subsidiary, without a loss of control, is accounted for as an equity transaction. If the Jollibee Group loses control over a subsidiary, it:
Derecognizes the assets (including goodwill) and liabilities of the subsidiary;Derecognizes the carrying amount of any non-controlling interests;Derecognizes the cumulative translation differences recorded in equity;Recognizes the fair value of the consideration received;Recognizes the fair value of any investment retained;Recognizes any surplus or deficit in profit or loss; andReclassifies the parent’s share of components previously recognized in OCI to profit or loss or retained earnings, as appropriate, as would be required if the Jollibee Group had directly disposed of the related assets or liabilities.
Non-controlling interests represent the interests in the subsidiaries not held by the Parent Company, and are presented separately in the consolidated statement of income and within equity in the consolidated statement of financial position, separately from equity attributable to holders of the Parent Company.
An increase or decrease in ownership interest in a subsidiary that does not result in a loss of control is accounted for as an equity transaction. The carrying amounts of the controlling and non-controlling interests are adjusted to reflect the changes in the Jollibee Group’s relative interests in the subsidiary. The Jollibee Group recognizes directly in equity any difference between the amount by which the non-controlling interests are adjusted and the fair value of the consideration paid or received, and attribute it to the equity holders of the Parent Company. These increases or decreases in the ownership interest in a subsidiary do not result in the recognition of a gain or loss.
The consolidated financial statements include the accounts of the Parent Company and the following wholly-owned and majority-owned subsidiaries as at December 31, 2014 and 2013:
2014 2013
Country of
Incorporation
Principal
Activities
Direct
Ownership
Indirect
Ownership
Direct
Ownership
Indirect
Ownership
Fresh N’ Famous Foods, Inc. (Fresh N’
Famous): Philippines Food service 100 – 100 –
Chowking Food Corporation USA United States of
America (USA) Holding company – 100 – 100
Zenith Foods Corporation (Zenith) Philippines Food service 100 – 100 –
Freemont Foods Corporation (Freemont) Philippines Food service 100 – 100 –
RRB Holdings, Inc. (RRBHI): Philippines Holding company 100 – 100 –
Red Ribbon Bakeshop, Inc. (RRBI) Philippines Food service – 100 – 100
Red Ribbon Bakeshop, Inc. USA (RRBI USA) USA Food service – 100 – 100
Mang Inasal Philippines Inc. (Mang Inasal) Philippines Food service 70 – 70 –
Grandworth Resources Corporation
(Grandworth): Philippines Leasing 100 – 100 –
Adgraphix, Inc. (Adgraphix) Philippines Digital printing – 100 – 100
IConnect Multi Media Network, Inc.
(IConnect) Philippines Advertising – 60 – 60
JC Properties & Ventures Co. Philippines Inactive – 50 – 50
Honeybee Foods Corporation (Honeybee) USA Food service 100 – 100 –
Tokyo Teriyaki Corporation (TTC) USA Food service – 100 – 100
Jollibee Worldwide Pte. Ltd. (JWPL): Singapore Holding company 100 – 100 –
Regional Operating Headquarters of JWPL
(JWS)
Philippines Financial
accounting,
human resources
and logistics
services – 100 – 100
(Forward)

51
2014 2013
Country of
Incorporation
Principal
Activities
Direct
Ownership
Indirect
Ownership
Direct
Ownership
Indirect
Ownership
Golden Plate Pte., Ltd. (GPPL) Singapore Holding company – 100 – 100
• Golden Beeworks Pte. Ltd. Singapore Food service – 60 – 60
Golden Cup Pte. Ltd. Singapore Holding company – 60 – –
Beijing New Hongzhuangyuan Food and Beverage Management Co., Ltd. (Hong Zhuang Yuan) PRC Food service – 100 – 100
Southsea Binaries Ltd. (Southsea)British Virgin Island
(BVI) Holding company – 100 – 100
Shanghai Yong He King Food and Beverage Co., Ltd. (a) PRC Food service – – – 100
Beijing Yong He King Food and Beverage Co., Ltd. PRC Food service – 100 – 100
Shenzhen Yong He King Food and Beverage Co., Ltd. PRC Food service – 100 – 100
Hangzhou Yongtong Food and Beverage Co., Ltd. PRC Food service – 100 – 100
Hangzhou Yong He King Food and Beverage Co., Ltd. PRC Food service – 100 – 100
Wuhan Yong He King Food and Beverage Co., Ltd. PRC Food service – 100 – 100
Tianjin Yong He King Food and Beverage Co., Ltd. PRC Food service – 100 – 100
Guangxi San Pin Wang Food and Beverage Management Company Limited (San Pin Wang) PRC Food service – 55 – 55
Happy Bee Foods Processing Co. Ltd. (JFPPL) Singapore Holding company – 70 – 70
- Jollibee Foods Processing (Anhui) Co. Ltd. (d) PRC Food service – 100 – 100
JSF Investments Pte. Ltd. (JSF) Singapore Holding company – 99 – 99
Chow Fun Holdings LLC (Chow Fun) USA Food service – 81 – 81
Jollibee (China) Food & Beverage Management Co. Ltd. (JFCC and formerly Shanghai Chunlv Co. Ltd) (a)
PRC Management company – 100 – 100
Jollibee International (BVI) Ltd. (JIBL): BVI Holding company – 100 – 100
- Jollibee Vietnam Corporation Ltd. Vietnam Food service – 100 – 100
- PT Chowking Indonesia Indonesia Food service – 100 – 100
- PT Jollibee Indonesia Indonesia Dormant – 100 – 100
- Jollibee (Hong Kong) Limited and Subsidiaries Hong Kong Dormant – 85 – 85
- Belmont Enterprises Ventures Limited (Belmont): BVI Holding company – 100 – 100
• Shanghai Belmont Enterprises Management and Adviser Co., Ltd. (SBEMAC) PRC
Business management service – 100 – 100
• Yong He Holdings Co., Ltd. BVI Holding company – 100 – 100
Centenary Ventures Ltd. BVI Holding company – 100 – 100
Chanceux, Inc. Philippines Holding company 100 – 100 –
BKTitans, Inc. (BKTitans) Philippines Holding company – 54 – 54
- PFN Holdings Corporation Philippines Holding company – 53 – 53
• Perf Restaurants, Inc.(b) Philippines Food service – 53 – 53
Donut Magic Phils., Inc. (Donut Magic)(c) Philippines Dormant 100 – 100 –
Ice Cream Copenhagen Phils., Inc. (ICCP)(c) Philippines Dormant 100 – 100 –
Mary’s Foods Corporation (Mary’s)(c) Philippines Dormant 100 – 100 –
QSR Builders, Inc. Philippines Inactive 100 – 100 –
Jollibee USA USA Dormant 100 – 100 –
(a) Merged in 2014 with JFCC as the surviving entity. (b) Perf Restaurants, Inc. also holds shares in Perf Trinoma and Perf MOA.(c) On June 18, 2004, the stockholders of the Jollibee Group approved the Plan of Merger of the three dormant companies. The application is pending
approval from the SEC as at December 31, 2014.(d) Changed its legal name to Happy Bee Foods Processing (Anhui) Co. Ltd. effective on February 28, 2015.
3. SIGNIFICANT ACCOUNTING POLICIES
Current versus Noncurrent ClassificationThe Jollibee Group presents assets and liabilities in the consolidated statement of financial position based on current/noncurrent classification. An asset is classified as current when it is:
Expected to be realized or intended to be sold or consumed in normal the operating cycle;Held primarily for the purpose of trading;Expected to be realized within twelve months after the reporting period; orCash or cash equivalent unless restricted from being exchanged or used to settle a liability for at least twelve months after the reporting period.
All other assets are classified as noncurrent. A liability is classified as current when:It is expected to be settled in the normal operating cycle;It is held primarily for the purpose of trading;It is due to be settled within twelve months after the reporting period; orThere is no unconditional right to defer the settlement of the liability for at least twelve months after the reporting period.
The Jollibee Group classifies all other liabilities as noncurrent. Deferred tax assets and liabilities are classified as noncurrent assets and liabilities.
Fair Value MeasurementFair value is the price that would be received to sell an asset or paid to transfer a liability in an orderly transaction between market participants at the measurement date. The fair value measurement is based on the presumption that the transaction to sell the asset or transfer the liability takes place either:
In the principal market for the asset or liability; orIn the absence of a principal market, in the most advantageous market for the asset or liability.
The principal or the most advantageous market must be accessible by the Jollibee Group.
The fair value of an asset or a liability is measured using the assumptions that market participants would use when pricing the asset or liability, assuming that market participants act in their economic best interest. A fair value measurement of a non-financial asset takes into account a market participant’s ability to generate economic benefits by using the asset in its highest and best use or by selling it to another market participant that would use the asset in its highest and best use.
The fair value for financial instruments traded in active markets at the reporting date is based on their quoted price or binding dealer price quotations, without any deduction for transaction costs. Where the Jollibee Group has financial assets and financial liabilities with offsetting positions in market risks or counterparty credit risk, it has elected to use the measurement exception to measure the fair value of its net risk exposure by applying the bid or ask price to the net open position as appropriate. For all other financial instruments not traded in an active market, the fair value is determined by using valuation techniques deemed to be appropriate in the circumstances. Valuation techniques include the market approach (i.e., using recent arm’s length market transactions adjusted as necessary and reference to the current market value of another instrument that is substantially the same) and the income approach (i.e., discounted cash flow analysis and option pricing models making as much use of available an supportable market data as possible). The Jollibee Group uses valuation techniques that are appropriate in the circumstances and for which sufficient data are available to measure fair value, maximizing the use of relevant observable inputs and minimizing the use of unobservable inputs. All assets and liabilities for which fair value is measured or disclosed in the consolidated financial

52 NOTES TO CONSOLIDATED FINANCIAL STATEMENTS
statements are categorized within the fair value hierarchy, described, as follows, based on the lowest-level input that is significant to the fair value measurement as a whole:
Level 1 - Quoted (unadjusted) market prices in active markets for identical assets or liabilitiesLevel 2 - Valuation techniques for which the lowest-level input that is significant to the fair value measurement is directly or indirectly observableLevel 3 - Valuation techniques for which the lowest-level input that is significant to the fair value measurement is unobservable
For assets and liabilities that are recognized in the consolidated financial statements on a recurring basis, the Jollibee Group determines whether transfers have occurred between levels in the hierarchy by reassessing categorization (based on the lowest-level input that is significant to the fair value measurement as a whole) at the end of each reporting period.
The Jollibee Group’s management determines the policies and procedures for both recurring fair value measurement and non-recurring measurement. At each reporting date, the management analyzes the movements in the values of assets and liabilities which are required to be remeasured or reassessed as per the Jollibee Group’s accounting policies. For this analysis, the management verifies the major inputs applied in the latest valuation by agreeing the information in the valuation computation to contracts and other relevant documents.
For the purpose of fair value disclosures, the Jollibee Group has determined classes of assets and liabilities based on the nature, characteristics and risks of the asset or liability and the level of the fair value hierarchy as explained above.
Cash and Cash EquivalentsCash includes cash on hand and in banks. Cash equivalents are short-term, highly liquid investments that are readily convertible to known amounts of cash with original maturities of three months or less from the date of acquisition and are subject to an insignificant risk of change in value.
Financial Instruments
Date of Recognition. The Jollibee Group recognizes a financial asset or a financial liability in the consolidated statement of financial position when it becomes a party to the contractual provisions of an instrument. In the case of a regular way purchase or sale of financial assets, recognition and derecognition, as applicable, is done using trade date accounting. A regular way purchase or sale is a purchase or sale of a financial asset under a contract whose terms require delivery of the asset within the time frame established generally by regulation or convention in the market place concerned.
Financial instruments are classified as liability or equity in accordance with the substance of the contractual arrangement. Interest, dividends, gains or losses relating to financial instruments or a component that is financial liability are reported as expense or income. Distribution to holders of financial instruments classified as equity is charged directly to equity, net of any related income tax benefits.
Initial Recognition and Measurement. Financial instruments are recognized initially at fair value, which is the fair value of the consideration given (in case of an asset) or received (in case of a liability). Transaction costs that are directly attributable to the acquisition or issue of the financial instruments are included in the initial measurement of all financial assets and liabilities, except for financial assets and liabilities measured at fair value through profit or loss (FVPL), which include transaction costs.
Subsequent to initial recognition, the Jollibee Group classifies its financial instruments in the following categories: financial assets and financial liabilities at FVPL, loans and receivables, held-to-maturity (HTM) investments, AFS financial assets, other financial liabilities and derivatives designated as hedging instruments in an effective hedge. The classification depends on the purpose for which the instruments are acquired and as liabilities were incurred whether they are quoted in an active market. Management determines the classification of its financial instruments at initial recognition and, where allowed and appropriate, re-evaluates this classification at every reporting date.
For all other financial instruments not traded in an active market, the fair value is determined using appropriate valuation techniques. Valuation techniques include net present value techniques, comparison to similar instruments for which observable market prices exist, option pricing models and other relevant valuation models for which sufficient data are available to measure fair value, maximizing the use of relevant observable inputs and minimizing the use of unobservable inputs.
Determination of Amortized Cost. The amortized cost of financial instruments is computed using the effective interest rate (EIR) method less any allowance for impairment. The calculation takes into account any premium or discount on acquisition and includes transaction costs and fees that are integral part of the effective interest.
“Day 1” Difference. Where the transaction price in a non-active market is different from the fair value of other observable current market transactions in the same instrument or based on a valuation technique whose variables include only data from observable market, the Jollibee Group recognizes the difference between the transaction price and fair value (a “Day 1” difference) in profit or loss unless it qualifies for recognition as some other type of asset or liability. In cases where unobservable data is used, the difference between the transaction price and model value is only recognized in profit or loss when the inputs become observable or when the instrument is derecognized. For each transaction, the Jollibee Group determines the appropriate method of recognizing the “Day 1” difference amount.
Financial Assets
Financial Assets at FVPL. Financial assets at FVPL include financial assets held-for-trading and financial assets designated as at FVPL upon initial recognition.
Financial assets are classified as held-for-trading if they are acquired for the purpose of selling in the near term. Gains or losses on investments held-for-trading are recognized in profit or loss.
Financial assets may be designated as at FVPL at initial recognition if the following criteria are met:
the designation eliminates or significantly reduces the inconsistent treatment that would otherwise arise from measuring the assets or recognizing gains or losses on them on a different basis;
the assets are part of a group of financial assets which are managed and their performance evaluated on a fair value basis, in accordance with a documented risk management strategy; or
the financial asset contains an embedded derivative, unless the embedded derivative does not significantly modify the cash flows or it is clear, with little or no analysis, that it would not be separately recorded.
The Jollibee Group has no financial assets at FVPL as at December 31, 2014 and 2013.

53
Loans and Receivables. Loans and receivables are non-derivative financial assets with fixed or determinable payments that are not quoted in an active market. They are not entered into with the intention of immediate or short-term resale and are not classified or designated as AFS financial assets or financial assets at FVPL. After initial measurement, such financial assets are subsequently measured at amortized cost using the effective interest method, less any impairment in value. Amortized cost is calculated by taking into account any discount or premium on acquisition and fees or costs that are an integral part of EIR. Gains and losses are recognized in profit or loss when the loans and receivables are derecognized or impaired, as well as through the amortization process.
The Jollibee Group’s cash and cash equivalents, receivables, operating lease receivables, security and other deposits and employee car plan receivables are classified under this category.
HTM Investments. Non-derivative financial assets with fixed or determinable payments and fixed maturity are classified as HTM when there is a positive intention and ability to hold to maturity. Financial assets intended to be held for an undefined period are not included in this category. HTM investments are subsequently measured at amortized cost. This cost is computed as the amount initially recognized minus principal repayments, plus or minus the cumulative amortization using the effective interest method of any difference between the initially recognized amount and the maturity amount less allowance for impairment. Gains and losses are recognized in profit or loss when the financial assets are derecognized or impaired, as well as through the amortization process.
The Jollibee Group has no HTM investments as at December 31, 2014 and 2013.
AFS Financial Assets. AFS financial assets are non-derivative financial assets that are designated in this category or are not classified in any of the other categories. AFS financial assets include equity and debt securities. Equity investments classified as AFS are those which are intended to be held for an indefinite period of time and are neither classified as held-for-trading nor designated as at FVPL. Debt securities are those which are intended to be held for an indefinite period of time and which may be sold in response to needs of liquidity or in response to changes in market conditions.
After initial measurement, AFS financial assets are subsequently measured at fair value with unrealized gains or losses recognized as “Unrealized gain (loss) on available-for-sale financial assets” account in other comprehensive income until the financial asset is derecognized or determined to be impaired at which time the accumulated gains or losses previously reported in OCI are included in profit or loss. Interest earned while holding AFS financial asset is reported as interest income using EIR method. If the fair value cannot be measured reliably, AFS financial assets are measured at cost, being the fair value of the consideration paid for the acquisition of the investment, less any impairment in value. All transaction costs directly attributable to the acquisition are also included in the cost of investment.
The Jollibee Group evaluates whether the ability and intention to sell its AFS financial assets in the near term is still appropriate. When in rare circumstances, the Jollibee Group is unable to trade these financial assets due to inactive markets; the Jollibee Group may elect to reclassify these financial assets if the management has the ability and intention to hold the assets for foreseeable future or until maturity.
For a financial asset reclassified from AFS category, the fair value carrying amount at the date of reclassification becomes its new amortized cost and any previous gain or loss on the asset that has been recognized in equity is amortized to profit or loss over the remaining life of the investment using effective interest rate method. Any difference between the new amortized cost and the maturity amount is also amortized over the remaining life of the asset using the EIR. If the asset is subsequently determined to be impaired, then the amount recorded in equity is reclassified to profit or loss.
The Jollibee Group’s investments in joy and leisure club shares are classified under this category as at December 31, 2014 and 2013.
Financial Liabilities
Financial Liabilities at FVPL. Financial liabilities at FVPL include financial liabilities that are held-for-trading and financial liabilities designated as at FVPL upon initial recognition.
Financial liabilities are classified as held-for-trading if acquired for the purpose of repurchasing in the near term. Gains or losses on liabilities held-for-trading are recognized in profit or loss.
The Jollibee Group has no financial liability classified under this category as at December 31, 2014 and 2013.
Derivative Financial Instruments and Hedge Accounting. The Jollibee Group uses currency swaps to manage its foreign exchange and interest rate risk exposures on its United States Dollar (USD) denominated variable rate loan. Accruals of interest on the receive-and pay-legs of the cross-currency swap are recorded as interest expense in the consolidated statement of comprehensive income.
Derivative financial instruments are initially recognized at fair value on the date on which a derivative contract is entered into and are subsequently measured at fair value. Derivatives are carried as assets when the fair value is positive and as liabilities when the fair value is negative. Any gains or losses arising from changes in fair value on derivatives that do not qualify for hedge accounting are taken directly to profit or loss.
For the purpose of hedge accounting, derivatives can be designated as cash flow hedges or fair value hedges, depending on the type of risk exposure.
At the inception of a hedge relationship, the Jollibee Group formally designates and documents the hedge relationship to which the Jollibee Group wishes to apply hedge accounting and the risk management objective and strategy for undertaking the hedge. The documentation includes identification of the hedging instrument, the hedged item or transaction, the nature of the risk being hedged and how the entity will assess the hedging instrument’s effectiveness in offsetting the exposure to changes in the hedged item’s fair value or cash flows attributable to the hedged risk. Such hedges are expected to be highly effective in achieving offsetting changes in fair value or cash flows and are assessed on an ongoing basis to determine that they actually have been highly effective throughout the financial reporting periods for which they were designated.
The Jollibee Group accounts for its cross-currency swaps as cash flow hedges of foreign exchange and interest rate exposure on its outstanding floating rate USD-denominated loan of PERF (see Note 18).
Cash Flow Hedge. Cash flow hedges are hedges on the exposure to variability of cash flows that are attributable to a particular risk associated with a recognized asset, liability or a highly probable forecast transaction and could affect profit or loss. The effective portion of the gain or loss on the hedging instrument is recognized in the consolidated statement of comprehensive income and directly in equity, while the ineffective portion is recognized immediately in profit or loss.
Amounts taken to equity are transferred to the profit or loss when the hedged transaction affects profit or loss, such as when hedged financial income or expense is recognized or when a forecast sale or

54 NOTES TO CONSOLIDATED FINANCIAL STATEMENTS
purchase occurs. Where the hedged item is the cost of a nonfinancial asset or liability, the amounts taken to equity are transferred to the initial carrying amount of the nonfinancial asset or liability.
If the forecast transaction is no longer expected to occur, amounts previously recognized in equity are transferred to the consolidated statement of comprehensive income. If the hedging instrument expires or is sold, terminated or exercised without replacement or rollover, or if its designation as a hedge is revoked, amounts previously recognized in equity remain in equity until the forecast transaction occurs. If the related transaction is not expected to occur, the amount is recognized in the profit or loss.
Other Financial Liabilities. This category pertains to financial liabilities that are not held-for-trading or not designated as at FVPL upon the inception of the liability where the substance of the contractual arrangements results in the Jollibee Group having an obligation either to deliver cash or another financial asset to the holder, or to exchange financial assets or financial liabilities with the holder under conditions that are potentially unfavorable to the Jollibee Group. These include liabilities arising from operations or borrowings.
Other financial liabilities are recognized initially at fair value and are subsequently carried at amortized cost, taking into account the impact of applying the effective interest method of amortization (or accretion) for any related premium, discount and any directly attributable transaction costs. Gains and losses are recognized in profit or loss when the liabilities are derecognized, as well as through the amortization process.
This category includes short-term and long-term debt, liability for acquisition of businesses (including current portion), trade payables and other current liabilities (excluding local and other taxes, and unearned revenue from gift certificates) and operating lease payable.
The components of issued financial instruments that contain both liability and equity elements are accounted for separately, with the equity component being assigned the residual amount after deducting from the instrument as a whole the amount separately determined as the fair value of the liability component on the date of issue.
Debt Issue CostsDebt issue costs are deducted against long-term debt and are amortized over the terms of the related borrowings.
Impairment of Financial AssetsThe Jollibee Group assesses at each reporting date whether a financial asset or a group of financial assets is impaired. A financial asset or a group of financial assets is deemed to be impaired if there is objective evidence of impairment as a result of one or more events that occurred after the initial recognition of the asset (an incurred loss event) and that the loss event has an impact on the estimated future cash flows of the financial asset or a group of financial assets that can be reliably estimated. Objective evidence of impairment may include indications that the borrower or a group of borrowers is experiencing significant financial difficulty, default or delinquency in interest or principal payments, the probability that they will enter bankruptcy or other financial reorganization and where observable data indicate that there is measurable decrease in the estimated future cash flows, such as changes in arrears or economic conditions that correlate with defaults.
Loans and Receivables. The Jollibee Group first assesses whether objective evidence of impairment exists individually for financial assets that are individually significant or collectively for financial assets that are not individually significant. If it is determined that no objective evidence of impairment exists for
an individually assessed financial asset, whether significant or not, the asset is included in a group of financial assets with similar credit risk characteristics and that group of financial assets is collectively assessed for impairment. Factors considered in individual assessment are payment history, past-due status and term, development affecting companies and specific issues with respect to the accounts. The collective assessment would require the Jollibee Group to group its receivables based on the credit risk characteristics (customer type, payment history, past-due status and term) of the customers. Changes in circumstances may cause future assessment of credit risk to be materially different from current assessments, which could require an increase or decrease in the allowance account. The Jollibee Group also considers factors, such as, the type of assets, the financial condition or near term prospect of the related company or account, and the intent and ability to hold on the assets long enough to allow any anticipated recovery. Assets that are individually assessed for impairment and for which an impairment loss is, or continues to be recognized, are not included in the collective assessment of impairment.
If there is objective evidence that an impairment loss on loans and receivables has been incurred, the amount of loss is measured as the difference between the asset’s carrying amount and the present value of estimated future cash flows (excluding future credit losses that have not been incurred) discounted at the financial asset’s original effective interest rate (i.e., the effective interest rate computed at initial recognition). If a loan has a variable interest rate, the discount rate for measuring any impairment loss is the current effective interest rate. The carrying amount of the asset is reduced through the use of an allowance account and the amount of loss is recognized in profit or loss under “General and administrative expenses” account. Interest income continues to be recognized based on the original effective interest rate of the asset. Loans and receivables, together with the associated allowance, are written off when there is no realistic prospect of future recovery.
If, in a subsequent year, the amount of the estimated impairment loss decreases because an event occurring after the impairment was recognized, the previously recognized impairment loss is reversed. Any subsequent reversal of an impairment loss is recognized in profit or loss, to the extent that carrying value of asset does not exceed its amortized cost at the reversal date.
Quoted AFS Equity Investments. In the case of equity investments classified as AFS financial assets, an objective evidence of impairment would include a significant or prolonged decline in the fair value of the investments below its cost. ‘Significant’ is to be evaluated against the original cost of the investment and ‘prolonged’ against the period in which the fair value has been below its original cost. When there is evidence of impairment, the cumulative loss which is measured as the difference between the acquisition cost and the current fair value, less any impairment loss on that financial asset previously recognized in other comprehensive income under “Unrealized gain (loss) on available-for-sale financial assets” account, is removed from equity and recognized in the profit or loss. Impairment losses on equity investments are not reversed through profit or loss; increases in fair value after impairment are recognized directly as OCI.
Derecognition of Financial Assets and Liabilities
Financial Assets. A financial asset (or, where applicable a part of a financial asset or part of a group of similar financial assets) is derecognized when:
(a) the rights to receive cash flows from the asset have expired;
(b) the Jollibee Group retains the right to receive cash flows from the asset, but has assumed an obligation to pay them in full without material delay to a third party under a “pass-through” arrangement; or

55
(c) the Jollibee Group has transferred its rights to receive cash flows from the asset and either (i) has transferred substantially all the risks and rewards of the asset, or (ii) has neither transferred nor retained substantially all the risks and rewards of the asset, but has transferred control of the asset.
When the Jollibee Group has transferred its rights to receive cash flows from the asset or has entered into a “pass-through” arrangement, and neither transferred nor retained substantially all the risks and rewards of the asset nor transferred control of the asset, the asset is recognized to the extent of the Jollibee Group’s continuing involvement in the asset. In that case, the Jollibee Group also recognizes an associated liability. The transferred asset and the associated liability are measured on a basis that reflects the rights and obligations that the Jollibee Group has retained.
Continuing involvement that takes the form of a guarantee over the transferred asset is measured at the lower of the original carrying amount of the asset and the maximum amount of the consideration that the Jollibee Group could be required to pay.
Financial Liabilities. A financial liability is derecognized when the obligation under the liability is discharged, cancelled or has expired.
When an existing financial liability is replaced by another from the same lender on substantially different terms, or the terms of an existing liability are substantially modified, such an exchange or modification is treated as a derecognition of the original liability and the recognition of a new liability, and the difference in the respective carrying amounts is recognized in profit or loss.
Offsetting Financial InstrumentsFinancial assets and financial liabilities are offset and the net amount is reported in the consolidated statement of financial position if, and only if, there is a currently enforceable legal right to offset the recognized amounts and there is an intention to settle on a net basis, or to realize the asset and settle the liability simultaneously.
InventoriesInventories are valued at the lower of cost and net realizable value. Costs are accounted for as follows:
Processed inventories - Standard costing, which is reviewed on a
quarterly basis and revised as necessary to
approximate current costs. Cost includes
direct materials, labor and a proportion of
manufacturing overhead costs based on
normal operating capacity.
Food supplies, packaging, store and
other supplies, and novelty items
- Standard costing, which is reviewed on a
quarterly basis and revised as necessary to
approximate current costs.
Net realizable value of processed inventories is the estimated selling price in the ordinary course of business, less estimated costs of completion and the estimated costs necessary to make the sale.
Net realizable value of food supplies, packaging, store and other supplies is the current replacement cost.
Net realizable value of novelty items is the estimated selling price in the ordinary course of business, less the estimated costs necessary to make the sale.
Other Current AssetsOther current assets include deposits which pertain to advance payments to suppliers to be applied for future purchases, prepaid expenses which are paid in advance and recorded as asset before these are utilized; and creditable withholding taxes, which will be applied in the following year against corporate income tax or be claimed for refund with the Bureau of Internal Revenue.
Property, Plant and EquipmentProperty, plant and equipment, except land, are stated at cost less accumulated depreciation and amortization and any accumulated impairment in value. Such cost includes the cost of replacing part of property, plant and equipment at the time that cost is incurred, if the recognition criteria are met, and excludes the costs of day-to-day servicing. Land is stated at cost less any impairment in value.
The initial cost of property, plant and equipment consists of its purchase price, including import duties and nonrefundable taxes and any other costs directly attributable in bringing the asset to its working condition and location for its intended use. Expenditures incurred after the property, plant and equipment have been put into operation, such as repairs and maintenance, are normally charged to income in the year in which the costs are incurred. In situations where it can be clearly demonstrated that the expenditures have resulted in an increase in the future economic benefits expected to be obtained from the use of an item of property, plant and equipment beyond its originally assessed standard of performance, the expenditures are capitalized as additional costs of property, plant and equipment.
Depreciation and amortization are calculated on a straight-line basis over the following estimated useful lives of the assets:
Land improvements 5 yearsPlant, buildings, condominium units and improvements 5 - 40 yearsLeasehold rights and improvements 2 - 10 years or term of the lease,
whichever is shorterOffice, store and food processing equipment 1 - 15 yearsFurniture and fixtures 3 - 5 yearsTransportation equipment 3 - 5 years
An item of property, plant and equipment is derecognized upon disposal or when no future economic benefits are expected from its use or disposal. Any gain or loss arising on derecognition of the asset (calculated as the difference between the disposal proceeds and the carrying amount of the asset) is included in profit or loss in the period the asset is derecognized.
The residual values, if any, useful lives and depreciation and amortization method of the assets are reviewed and adjusted, if appropriate, at the end of each financial period.
Fully depreciated assets are retained in the accounts until they are disposed or retired.
Construction in progress represents assets under construction and is stated at cost less any impairment in value. This includes the cost of construction and other direct costs. Cost also includes interest on borrowed funds incurred during the construction period. Construction in progress is not depreciated until such time that the relevant assets are completed and readily for use.

56 NOTES TO CONSOLIDATED FINANCIAL STATEMENTS
Investment PropertiesInvestment properties consist of land and buildings and building improvements held by the Jollibee Group for capital appreciation and rental purposes. Investment properties, except land, are carried at cost, including transaction costs, less accumulated depreciation and amortization and any impairment in value. Cost also includes the cost of replacing part of an existing investment property at the time that cost is incurred if the recognition criteria are met; and excludes the costs of day-to-day servicing of an investment property. Land is carried at cost less any impairment in value.
The depreciation of buildings and building improvements are calculated on a straight-line basis over the estimated useful lives of the assets which are five (5) to twenty (20) years.
The residual values, if any, useful lives and method of depreciation and amortization of the assets are reviewed and adjusted, if appropriate, at each financial year-end.
Investment property is derecognized when either it has been disposed of or when the investment property is permanently withdrawn from use and no future economic benefit is expected from its disposal. Any gains or losses on the retirement or disposal of an investment property are recognized in profit or loss in the year of retirement or disposal.
Transfers to investment property are made only when there is a change in use, evidenced by ending of ownership-occupation, or commencement of an operating lease to another party. Transfers from investment property are made only when there is a change in use, evidenced by commencement of owner-occupation or commencement of development with a view to sell.
Business CombinationsBusiness combinations are accounted for using the acquisition method. Applying the acquisition method requires the (a) determination whether the Jollibee Group will be identified as the acquirer, (b) determination of the acquisition-date, (c) recognition and measurement of the identifiable assets acquired, liabilities assumed and any non-controlling interest in the acquiree and (d) recognition and measurement of goodwill or a gain from a bargain purchase.
When the Jollibee Group acquires a business, it assesses the financial assets and liabilities assumed for appropriate classification and designation in accordance with the contractual terms, economic circumstances and pertinent conditions as at acquisition date.
The cost of an acquisition is measured as the aggregate of the (a) consideration transferred by the Jollibee Group, measured at acquisition-date fair value, (b) amount of any non-controlling interest in the acquiree and (c) acquisition-date fair value of the Jollibee Group’s previously held equity interest in the acquiree in a business combination achieved in stages. Acquisition costs incurred are expensed and included in “General and administrative expenses” account in the consolidated statement of comprehensive income.
Initial Measurement of Non-controlling Interest. For each business combination, the Jollibee Group measures the non-controlling interest in the acquiree using the proportionate share of the acquiree’s identifiable net assets.
Business Combination Achieved in Stages. In a business combination achieved in stages, the Jollibee Group remeasures its previously held equity interests in the acquiree at its acquisition-date fair value and recognizes the resulting gain or loss, if any, in profit or loss.
Measurement Period. If the initial accounting for a business combination is incomplete by the end of the reporting period in which the combination occurs, the Jollibee Group reports in its consolidated financial statements provisional amounts for the items for which the accounting is incomplete. The measurement period ends as soon as the Jollibee Group receives the information it was seeking about facts and circumstances that existed as at the acquisition-date or learns that more information is not obtainable. The measurement period does not exceed one year from the acquisition-date.
Contingent Consideration or Earn-out. Any contingent consideration or earn-out in relation to a business combination is recognized at fair value at the acquisition date. Subsequent changes to the fair value of the contingent consideration which is deemed to be an asset or liability, is recognized either in profit or loss or as a change to OCI. If the contingent consideration is classified as equity, it should not be remeasured until it is finally settled within equity.
Goodwill or Gain on a Bargain Purchase
Initial Measurement of Goodwill or Gain on a Bargain Purchase. Goodwill is initially measured by the Jollibee Group at cost being the excess of the total consideration transferred over the net identifiable assets acquired and liabilities assumed. If this consideration is lower than the fair value of the net assets of the subsidiary acquired, the difference is recognized in profit or loss as gain on a bargain purchase. Before recognizing a gain on a bargain purchase, the Jollibee Group determines whether it has correctly identified all of the assets acquired and all of the liabilities assumed and recognize any additional assets or liabilities that are identified in that review.
Subsequent Measurement of Goodwill. Following initial recognition, goodwill is measured at cost less any accumulated impairment losses.
Impairment Testing of Goodwill. For the purpose of impairment testing, goodwill acquired in a business combination is, from the acquisition-date, allocated to each of the Jollibee Group’s CGU, or groups of CGUs, that are expected to benefit from the synergies of the combination, irrespective of whether other assets or liabilities of the acquiree are assigned to those units or groups of units. Each unit or group of units to which the goodwill is allocated:
represents the lowest level within the Jollibee Group at which the goodwill is monitored for internal management purposes; and
is not larger than an operating segment as defined in PFRS 8, Operating Segments, before aggregation.
Frequency of Impairment Testing. Irrespective of whether there is any indication of impairment, the Jollibee Group tests goodwill acquired in a business combination for impairment annually as at December 31 and more frequently when circumstances indicate that the carrying amount is impaired.
Allocation of Impairment Loss. An impairment loss is recognized for a CGU if the recoverable amount of the unit or group of units is less than the carrying amount of the unit or group of units. The impairment loss is allocated to reduce the carrying amount of the assets of the unit or group of units first to reduce the carrying amount of goodwill allocated to the CGU or group of units and then to the other assets of the unit or group of units pro rata on the basis of the carrying amount of each asset in the unit or group of units.

57
Intangible Assets Intangible assets acquired separately are measured at cost on initial recognition. Following initial recognition, intangible assets are carried at cost less any accumulated amortization and any accumulated impairment loss. The useful lives of intangible assets are assessed at the individual asset level as either finite or indefinite.
Intangible assets with finite lives are amortized over the useful economic life using the straight-line method and assessed for impairment whenever there is an indication that the intangible assets may be impaired. At a minimum, the amortization period and the amortization method for an intangible asset with a finite useful life are reviewed at least at each financial year-end. Changes in the expected useful life or the expected pattern of consumption of future economic benefits embodied in the asset are accounted for by changing the amortization period or method, as appropriate, and treated as changes in accounting estimates.
Intangible assets with indefinite useful lives are tested for impairment annually either individually or at the CGU level. Such intangible assets are not amortized. The useful life of an intangible asset with an indefinite life is reviewed annually to determine whether the indefinite life assessment continues to be supportable. If not, the change in the useful life assessment from indefinite to finite is made on a prospective basis.
The estimated useful lives used in amortizing computer software and other intangible assets are disclosed in Note 14.
Gains or losses arising from derecognition of an intangible asset are measured as the difference between the net disposal proceeds and the carrying amount of the asset, and are recognized in profit or loss when the asset is derecognized.
Interests in and Advances to Joint Ventures, Co-venturers and an Associate
An associate is an entity over which the Company has significant influence. Significant influence is the power to participate in the financial and operating policy decisions of the investee, but is not control or joint control over those policies.
A joint venture is a type of joint arrangement whereby the parties that have joint control of the arrangement have rights to the net assets of the joint venture. Joint control is the contractually agreed sharing of control of an arrangement, which exists only when decisions about the relevant activities require unanimous consent of the parties sharing control.
The Jollibee Group’s investments in its associate and joint ventures are accounted for using the equity method based on the percentage share of ownership and capitalization. Interests in joint ventures are accounted for under the equity method from the date the joint control is obtained.
Under the equity method, the investment in an associate or joint ventures are carried in the consolidated statement of financial position at cost plus the Jollibee Group’s share in post-acquisition changes in the net assets of an associate or joint ventures, less any impairment in value. Goodwill relating to the associate or joint ventures is included in the carrying amount of the investment and is not amortized. The consolidated statement of comprehensive income include the Jollibee Group’s share in the financial performance of the associate or joint ventures. The Jollibee Group’s share in profit or loss of the associate is shown on the face of the consolidated statement of comprehensive income as “Equity in net losses of joint ventures and an associate”, which is the profit or loss attributable to equity holders of the joint ventures and an associate.
When the Jollibee Group’s share of losses in the associate or joint ventures equals or exceeds its interest, including any other unsecured receivables, the Jollibee Group does not recognize further losses, unless it has incurred obligations or made payments on behalf of the associate or joint ventures. Where there has been a change recognized directly in the equity of the associate or joint venture, the Jollibee Group recognizes its share in any changes and discloses this, when applicable, in the consolidated statement of changes in equity.
The reporting dates of the Parent Company and the associate or joint ventures are identical and the latter’s accounting policies conform to those used by the Parent Company for like transactions and events in similar circumstances. Unrealized gains arising from transactions with the associate or joint ventures are eliminated to the extent of the Jollibee Group’s interests in the associate or joint ventures against the related investments. Unrealized losses are eliminated similarly but only to the extent that there is no evidence of impairment in the asset transferred.
The Jollibee Group ceases to use the equity method of accounting on the date from which it no longer has joint control in the joint ventures, no longer has significant influence over an associate, or when the interest becomes held for sale.
Upon loss of significant influence over the associate or joint control over the joint ventures, the Jollibee Group measures and recognizes its remaining investment at its fair value. Any difference between the carrying amount of the associate or former jointly controlled entities upon loss of significant influence or joint control, and the fair value of the remaining investment and proceeds from disposal is recognized in profit or loss. When the remaining interest in joint ventures constitutes significant influence, it is accounted for as interest in an associate.
Impairment of Nonfinancial AssetsThe carrying values of interests in and advances to joint ventures, co-venturers and an associate, property, plant and equipment, investment properties, goodwill and other intangible assets are reviewed for impairment when events or changes in circumstances indicate that the carrying value may not be recoverable. If any such indication exists, and if the carrying value exceeds the estimated recoverable amount, the assets or CGU are written down to their recoverable amounts. The recoverable amount of the asset is the greater of fair value less costs to sell or value in use. The fair value less costs to sell is the amount obtainable from the sale of an asset in an arm’s-length transaction between knowledgeable, willing parties, less costs of disposal. In assessing value in use, the estimated future cash flows are discounted to their present value using a pre-tax discount rate that reflects current market assessments of the time value of money and the risks specific to the asset. For an asset that does not generate largely independent cash inflows, the recoverable amount is determined for the CGU to which the asset belongs. Impairment losses are recognized in profit or loss in those expense categories consistent with the function of the impaired asset.
For nonfinancial assets, excluding goodwill, an assessment is made at each reporting date as to whether there is any indication that previously recognized impairment losses may no longer exist or may have decreased. If such indication exists, the recoverable amount is estimated. A previously recognized impairment loss is reversed only if there has been a change in the estimates used to determine the asset’s recoverable amount since the last impairment loss was recognized. If that is the case, the carrying amount of the asset is increased to its recoverable amount. That increased amount cannot exceed the carrying amount that would have been determined, net of depreciation and amortization, had no impairment loss been recognized for the asset in prior years.

58 NOTES TO CONSOLIDATED FINANCIAL STATEMENTS
Such reversal is recognized in profit or loss. After such a reversal, the depreciation charge is adjusted in future periods to allocate the asset’s revised carrying amount, less any residual value on a systematic basis over its remaining useful life.
Equity
Capital Stock and Additional Paid-in Capital. Capital stock is measured at par value for all shares issued. Proceeds and/or fair value of considerations received in excess of par value, if any, are recognized as additional paid-in capital. Incremental costs incurred directly attributable to the issuance of new shares are shown in equity as a deduction from proceeds, net of tax.
Subscriptions Receivable. Subscriptions receivable represents common stock subscribed and issued by the Parent Company but payment from the shareholders has not yet been received.
Retained Earnings. Retained earnings represent the Jollibee Group’s accumulated earnings, net of dividends declared.
Dividends. The Jollibee Group recognizes a liability to make cash distribution to its equity holders when the distribution is authorized and the distribution is no longer at the discretion of the Group. A corresponding amount is recognized directly in the equity. Dividends for the year that are approved after the financial reporting date are dealt with as an event after the reporting period.
Treasury Shares. Acquisitions of treasury shares are recorded at cost. The total cost of treasury shares is shown in the consolidated statement of financial position as a deduction from the total equity. Upon re-issuance or resale of the treasury shares, cost of common stock held in treasury account is credited for the cost of the treasury shares determined using the simple average method. Gain on sale is credited to additional paid-in capital. Losses are charged against additional paid-in capital but only to the extent of previous gain from original issuance, sale or retirement for the same class of stock. Otherwise, losses are charged to retained earnings.
RevenueRevenue is recognized to the extent that it is probable that the economic benefits associated with the transaction will flow to the Jollibee Group and the amount of revenue can be reliably measured, regardless of when the collection was made. Revenue is measured at the fair value of the consideration received or receivable, taking into account contractually defined terms of payment and excluding discounts, rebates, sales taxes and duties. The Jollibee Group assesses its revenue arrangements against specific criteria in order to determine if it is acting as principal or agent. The Jollibee Group has concluded that it is acting as a principal in all of its revenue arrangements since it is the primary obligor in all the revenue arrangements, has pricing latitude, and is also exposed to credit risks.
The following specific recognition criteria must also be met before revenue is recognized:
Sale of Goods. Revenue from sale of goods is recognized when the significant risks and rewards of ownership of the goods have passed to the customers, which is normally upon delivery. Sales returns and sales discounts are deducted from sales to arrive at net sales shown in the consolidated statement of comprehensive income.
Royalty Fees. Revenue from royalty fees is recognized as the royalty accrues in accordance with the terms of the agreement calculated as a percentage of the franchisees’ net sales.
Franchise Fees. Revenue from franchise fees is recognized when all services or conditions relating to a transaction have been substantially performed.
Service Fees. Revenue is recognized in the period in which the service has been rendered.
Rent Income. Rent income from operating leases is recognized on a straight-line basis over the lease terms.
Interest Income. Interest income is recognized as the interest accrues, taking into account the effective yield on the asset.
Other Income. Other income is recognized when there is an incidental economic benefit, other than the usual business operations, that will flow to the Jollibee Group through an increase in asset or reduction in liability and that can be measured reliably.
Cost and ExpensesCost and expenses are decreases in economic benefits during the accounting period in the form of outflows or decrease of assets or incurrence of liabilities that result in decreases in equity, other than those relating to distributions to equity participants. Cost and expenses are recognized as incurred. Advertising and promotions expenses include costs incurred for advertising schemes and promotional activities for new products. The amount of expenses incurred by the Jollibee Group is reduced by the network advertising and promotional costs reimbursed by the Jollibee Group’s franchisees and subsidiaries.
Borrowing CostsBorrowing costs directly attributable to the acquisition, construction or production of an asset that necessarily takes a substantial period of time to get ready for its intended use or sale are capitalised as part of the cost of the asset. All other borrowing costs are expensed in the period in which they occur. Borrowing costs consist of interest and other costs that an entity incurs in connection with the borrowing of funds.
Pension BenefitsThe pension liability or asset is the aggregate of the present value of the defined benefit obligation at the end of the reporting period reduced by the fair value of plan assets (if any), adjusted for any effect of limiting a net defined benefit asset to the asset ceiling. The asset ceiling is the present value of any economic benefits available in the form of refunds from the plan or reductions in future contributions to the plan.
The cost of providing benefits under the defined benefit plans is actuarially determined using the projected unit credit method.
Defined benefit costs comprise the following:Service costNet interest on the net defined benefit liability or assetRemeasurements of net defined benefit liability or asset
Service costs which include current service costs, past service costs and gains or losses on non-routine settlements are recognized as in profit or loss. Past service costs are recognized when plan amendment or curtailment occurs. These amounts are calculated periodically by independent qualified actuaries.
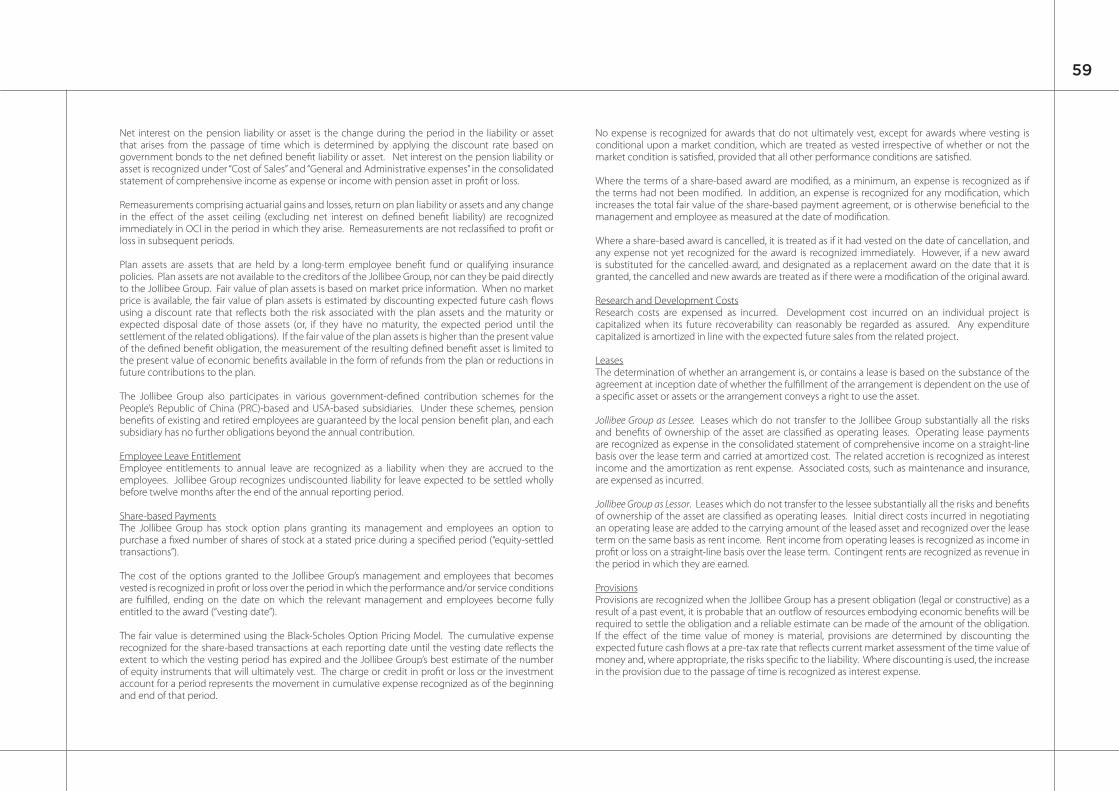
59
Net interest on the pension liability or asset is the change during the period in the liability or asset that arises from the passage of time which is determined by applying the discount rate based on government bonds to the net defined benefit liability or asset. Net interest on the pension liability or asset is recognized under “Cost of Sales” and “General and Administrative expenses” in the consolidated statement of comprehensive income as expense or income with pension asset in profit or loss.
Remeasurements comprising actuarial gains and losses, return on plan liability or assets and any change in the effect of the asset ceiling (excluding net interest on defined benefit liability) are recognized immediately in OCI in the period in which they arise. Remeasurements are not reclassified to profit or loss in subsequent periods.
Plan assets are assets that are held by a long-term employee benefit fund or qualifying insurance policies. Plan assets are not available to the creditors of the Jollibee Group, nor can they be paid directly to the Jollibee Group. Fair value of plan assets is based on market price information. When no market price is available, the fair value of plan assets is estimated by discounting expected future cash flows using a discount rate that reflects both the risk associated with the plan assets and the maturity or expected disposal date of those assets (or, if they have no maturity, the expected period until the settlement of the related obligations). If the fair value of the plan assets is higher than the present value of the defined benefit obligation, the measurement of the resulting defined benefit asset is limited to the present value of economic benefits available in the form of refunds from the plan or reductions in future contributions to the plan.
The Jollibee Group also participates in various government-defined contribution schemes for the People’s Republic of China (PRC)-based and USA-based subsidiaries. Under these schemes, pension benefits of existing and retired employees are guaranteed by the local pension benefit plan, and each subsidiary has no further obligations beyond the annual contribution.
Employee Leave EntitlementEmployee entitlements to annual leave are recognized as a liability when they are accrued to the employees. Jollibee Group recognizes undiscounted liability for leave expected to be settled wholly before twelve months after the end of the annual reporting period.
Share-based PaymentsThe Jollibee Group has stock option plans granting its management and employees an option to purchase a fixed number of shares of stock at a stated price during a specified period (“equity-settled transactions”).
The cost of the options granted to the Jollibee Group’s management and employees that becomes vested is recognized in profit or loss over the period in which the performance and/or service conditions are fulfilled, ending on the date on which the relevant management and employees become fully entitled to the award (“vesting date”).
The fair value is determined using the Black-Scholes Option Pricing Model. The cumulative expense recognized for the share-based transactions at each reporting date until the vesting date reflects the extent to which the vesting period has expired and the Jollibee Group’s best estimate of the number of equity instruments that will ultimately vest. The charge or credit in profit or loss or the investment account for a period represents the movement in cumulative expense recognized as of the beginning and end of that period.
No expense is recognized for awards that do not ultimately vest, except for awards where vesting is conditional upon a market condition, which are treated as vested irrespective of whether or not the market condition is satisfied, provided that all other performance conditions are satisfied.
Where the terms of a share-based award are modified, as a minimum, an expense is recognized as if the terms had not been modified. In addition, an expense is recognized for any modification, which increases the total fair value of the share-based payment agreement, or is otherwise beneficial to the management and employee as measured at the date of modification.
Where a share-based award is cancelled, it is treated as if it had vested on the date of cancellation, and any expense not yet recognized for the award is recognized immediately. However, if a new award is substituted for the cancelled award, and designated as a replacement award on the date that it is granted, the cancelled and new awards are treated as if there were a modification of the original award.
Research and Development CostsResearch costs are expensed as incurred. Development cost incurred on an individual project is capitalized when its future recoverability can reasonably be regarded as assured. Any expenditure capitalized is amortized in line with the expected future sales from the related project.
LeasesThe determination of whether an arrangement is, or contains a lease is based on the substance of the agreement at inception date of whether the fulfillment of the arrangement is dependent on the use of a specific asset or assets or the arrangement conveys a right to use the asset.
Jollibee Group as Lessee. Leases which do not transfer to the Jollibee Group substantially all the risks and benefits of ownership of the asset are classified as operating leases. Operating lease payments are recognized as expense in the consolidated statement of comprehensive income on a straight-line basis over the lease term and carried at amortized cost. The related accretion is recognized as interest income and the amortization as rent expense. Associated costs, such as maintenance and insurance, are expensed as incurred.
Jollibee Group as Lessor. Leases which do not transfer to the lessee substantially all the risks and benefits of ownership of the asset are classified as operating leases. Initial direct costs incurred in negotiating an operating lease are added to the carrying amount of the leased asset and recognized over the lease term on the same basis as rent income. Rent income from operating leases is recognized as income in profit or loss on a straight-line basis over the lease term. Contingent rents are recognized as revenue in the period in which they are earned.
ProvisionsProvisions are recognized when the Jollibee Group has a present obligation (legal or constructive) as a result of a past event, it is probable that an outflow of resources embodying economic benefits will be required to settle the obligation and a reliable estimate can be made of the amount of the obligation. If the effect of the time value of money is material, provisions are determined by discounting the expected future cash flows at a pre-tax rate that reflects current market assessment of the time value of money and, where appropriate, the risks specific to the liability. Where discounting is used, the increase in the provision due to the passage of time is recognized as interest expense.

60 NOTES TO CONSOLIDATED FINANCIAL STATEMENTS
Foreign Currency Transactions and TranslationsThe consolidated financial statements are presented in Philippine peso, which is the Parent Company’s functional and presentation currency. Each entity in the Jollibee Group determines its own functional currency and items included in the financial statements of each entity are measured using that functional currency. The functional currency of subsidiaries domiciled and operating in the Philippines are also determined to be the Philippine Peso. Where the functional currency is the Philippine Peso, transactions in foreign currencies are recorded in Philippine peso using the exchange rate at the date of the transaction. Monetary assets and liabilities denominated in foreign currencies are restated using the closing rate of exchange at reporting date. All differences are recognized in profit or loss. Non-monetary items that are measured in terms of historical cost in a foreign currency are translated using the exchange rates as at the dates of the initial transactions.
The functional currencies of the Jollibee Group’s foreign operations are US dollar (USD), PRC Renminbi (RMB), Indonesia rupiah, Vietnam dong and Hong Kong dollar. As of the reporting date, the assets and liabilities of foreign subsidiaries are translated into the presentation currency of the Parent Company at the rate of exchange ruling at the reporting date while the income and expense accounts are translated at the weighted average exchange rates for the year. The resulting translation differences are included in the consolidated statement of changes in equity under the account “Cumulative translation adjustments of foreign subsidiaries, joint ventures and an associate” and in OCI. On disposal of a foreign subsidiary, the accumulated exchange differences are recognized in profit or loss.
Taxes
Current Tax. Current tax liabilities for the current and prior periods are measured at the amount expected to be paid to the tax authority. The tax rates and tax laws used to compute the amount are those that are enacted or substantively enacted at reporting date.
Current income tax relating to items recognized directly in equity is recognized in equity and not in the profit or loss. Management periodically evaluates positions taken in the tax returns with respect to situations in which applicable tax regulations are subject to interpretation and establishes provisions where appropriate.
Deferred Tax. Deferred tax is provided using balance sheet liability method, on all temporary differences at reporting date between the tax bases of assets and liabilities and their carrying amounts for financial reporting purposes.
Deferred tax assets are recognized for all deductible temporary differences and carryforward benefits of unused tax credits from excess of minimum corporate income tax (MCIT) over regular corporate income tax (RCIT) and net operating loss carryover (NOLCO), to the extent that it is probable that taxable profit will be available against which the deductible temporary differences and carryforward benefits of excess of MCIT over RCIT and NOLCO can be utilized except:
where the deferred tax asset relating to the deductible temporary difference arises from the initial recognition of an asset or liability in a transaction that is not a business combination and, at the time of the transaction, affects neither the accounting profit nor taxable profit; andin respect of deductible temporary differences associated with investments in subsidiaries and interest in a joint venture, deferred tax assets are recognized only to the extent that it is probable that the temporary differences will reverse in the foreseeable future and taxable profit will be available against which the temporary differences can be utilized.
The carrying amount of deferred tax assets is reviewed at each reporting date and reduced to the extent that it is no longer probable that sufficient taxable profit will be available to allow all or part of the deferred tax assets to be utilized. Unrecognized deferred tax assets are reassessed at each reporting date and are recognized to the extent that it has become probable that future taxable profit will allow the deferred tax assets to be recovered.
Deferred tax liabilities are recognized for all taxable temporary differences, except:where the deferred tax liability arises from the initial recognition of goodwill or of an asset or liability in a transaction that is not a business combination and, at the time of the transactions, affects neither the accounting profit nor taxable profit; andin respect of taxable temporary differences associated with investments in subsidiaries and interest in a joint venture, where the timing of the reversal of the temporary differences can be controlled and it is probable that the temporary differences will not reverse in the foreseeable future.
Deferred tax assets and liabilities are measured at the tax rates that are expected to apply to the year when the asset is realized or the liability is settled, based on tax rates and tax laws that have been enacted or substantially enacted at the reporting date.
Deferred tax relating to items recognized outside profit or loss is recognized outside profit or loss. Deferred tax items are recognized in correlation to the underlying transaction either in OCI or directly in equity.
Tax benefits acquired as part of a business combination, but not satisfying the criteria for separate recognition at that date, are recognized subsequently if new information about facts and circumstances change. The adjustment is either treated as reduction in goodwill, as long as it does not exceed goodwill, if it was incurred during the measurement period or recognize in profit or loss.
Deferred tax assets and liabilities are offset, if a legally enforceable right exists to set off current tax assets against current tax liabilities and the deferred taxes relate to the same taxable entity and the same taxation authority.
Value Added Tax (VAT). Revenue, expenses and assets are recognized net of the amount of tax, except:where the tax incurred on a purchase of assets or services is not recoverable from the taxation authority, in which case the tax is recognized as part of the cost of acquisition of the asset or as part of the expense item as applicable; and
receivables and payables that are stated with the amount of tax included.
The net amount of tax recoverable from, or payable to, the taxation authority is included as part of “Other current assets” or “Trade payables and other current liabilities” accounts in the consolidated statement of financial position.
Earnings per Share (EPS) Attributable to Equity Holders of the Parent CompanyBasic EPS is calculated by dividing the net income for the year attributable to the equity holders of the Parent Company by the weighted average number of common shares outstanding during the year, after considering the retroactive effect of stock dividend declaration, if any.
Diluted EPS is computed by dividing the net income for the year attributable to the equity holders of the Parent Company by the weighted average number of common shares outstanding during the period, adjusted for any potential common shares resulting from the assumed exercise of outstanding

61
stock options. Outstanding stock options will have dilutive effect under the treasury stock method only when the average market price of the underlying common share during the period exceeds the exercise price of the option.
Where the EPS effect of the shares to be issued to management and employees under the stock option plan would be anti-dilutive, the basic and diluted EPS would be stated at the same amount.
ContingenciesContingent liabilities are not recognized in the consolidated financial statements but are disclosed in the notes to financial statements unless the possibility of an outflow of resources embodying economic benefits is remote. Contingent assets are not recognized in the consolidated financial statements but are disclosed when an inflow of economic benefits is probable.
Business SegmentsThe Jollibee Group is organized and managed separately according to the nature of operations and geographical locations of businesses. The three major operating businesses of the Jollibee Group are food service, franchising and leasing while geographical segments are segregated to Philippine businesses and international businesses. These operating and geographical businesses are the basis upon which the Jollibee Group reports its primary segment information presented in Note 5.
Events after the Reporting PeriodPost year-end events that provide additional information about the Jollibee Group’s financial position at reporting date (adjusting events) are reflected in the Jollibee Group’s consolidated financial statements. Post year-end events that are not adjusting events are disclosed in the notes to consolidated financial statements when material.
4. SIGNIFICANT ACCOUNTING JUDGMENTS, ESTIMATES AND ASSUMPTIONS
The preparation of the consolidated financial statements requires management to make judgments, estimates and assumptions that affect the reported amounts on the consolidated financial statements and related notes at the end of the reporting period. However, uncertainty about these assumptions and estimates could result in outcomes that could require a material adjustment to the carrying amount of the affected asset or liability in the future. The Jollibee Group believes the following represents a summary of these significant judgments, estimates and assumptions and the related impact and associated risks on the Jollibee Group’s consolidated financial statements.
JudgmentsIn the process of applying the Jollibee Group’s accounting policies, management has made the following judgments, apart from those involving estimations, which have the most significant effect on the amounts recognized in the consolidated financial statements.
Functional Currency. Management has determined that the functional and presentation currency of the Parent Company and its Philippine-based subsidiaries is the Philippine peso, being the currency of the primary environment in which the Parent Company and its major subsidiaries operate. The functional currencies of its foreign operations are determined as the currency in the country where the subsidiary operates. For consolidation purposes, the foreign subsidiaries’ balances are translated to Philippine peso which is the Parent Company’s functional and presentation currency.
Operating Lease Commitments - Jollibee Group as Lessee. The Jollibee Group has entered into commercial property leases for its QSRs and offices as a lessee. Management has determined, based on an evaluation of the terms and condition of the arrangements that all the significant risks and benefits of ownership of these properties, which the Jollibee Group leases under various lease arrangements, remain with the lessors. Accordingly, the leases are accounted for as operating leases.
Rent expense amounted to P7,072.7 million, P6,287.3 million and P5,895.9 million in 2014, 2013 and 2012, respectively (see Notes 21, 22 and 29).
Operating Lease Commitments - Jollibee Group as Lessor. The Jollibee Group has entered into commercial property leases on its investment property portfolio and various sublease agreements. Management has determined, based on an evaluation of the terms and conditions of the arrangements, that the Jollibee Group retains all the significant risks and benefits of ownership of the properties which are leased out. Accordingly, the leases are accounted for as operating leases.
Rent income amounted to P90.6 million, P97.5 million and P93.6 million in 2014, 2013 and 2012, respectively (see Notes 20 and 29).
Assessing Joint Control of an Arrangement and the Type of Arrangement. Joint control is the contractually agreed sharing of control of an arrangement which exists only when decisions about the relevant activities require the unanimous consent of the parties sharing control. The Jollibee Group assessed that it has joint control in all joint arrangements by virtue of a contractual agreement with other stockholders. The Jollibee Group’s joint ventures have separate legal entity and the shareholders have right to their net assets (see Note 11).
Material Partly-Owned SubsidiariesThe consolidated financial statements include additional information about subsidiaries that have non-controlling interests that are material to the Jollibee Group (see Note 11). Management determined material partly-owned subsidiaries as those with balance of non-controlling interest greater than 5% of non-controlling interests and those subsidiaries which type of activities they engage in is important to the group as at end of the year.
Material Associates and Joint VenturesThe consolidated financial statements include additional information about associates and joint ventures that are material to the Jollibee Group (see Note 11). Management determined material associates as those associates where the Company’s carrying amount of investment is greater than 5% of the total investments in associates and interest in joint ventures as at end of the year.
Estimates and AssumptionsThe key estimates and assumptions concerning the future and other key sources of estimation uncertainty at reporting date that has a significant risk of causing a material adjustment to the carrying amounts of assets and liabilities within the next financial year are discussed below. The Jollibee Group based its assumptions and estimates on parameters available when the consolidated financial statements were prepared. Existing circumstances and assumptions about future developments, however, may change due to changes on market circumstances arising beyond the control of the Jollibee Group. Such changes are reflected in the assumptions when they occur.
Impairment Loss on Receivables. The Jollibee Group maintains an allowance for impairment losses at a level considered adequate to provide for potential uncollectible receivables. The level of allowance is evaluated on the basis of factors that affect the collectability of the accounts. These factors include, but

62 NOTES TO CONSOLIDATED FINANCIAL STATEMENTS
are not limited to, the length of the Jollibee Group’s relationship with the customers and counterparties, average age of accounts and collection experience. The Jollibee Group performs a regular review of the age and status of these accounts, designed to identify accounts with objective evidence of impairment and provide the appropriate allowance for impairment losses. The review is done quarterly and annually using a combination of specific and collective assessments. The amount and timing of recorded expenses for any period would differ if the Jollibee Group made different judgments or utilized different methodologies. An increase in allowance account would increase general and administrative expenses and decrease current assets.
Provision for impairment loss on receivables in 2014, 2013 and 2012 amounted to P36.3 million, P34.0 million and P97.6 million, respectively, resulting from specific and collective assessments. The carrying amount of receivables amounted to P7,621.2 million and P3,082.9 million as at December 31, 2014 and 2013, respectively (see Notes 7 and 22).
Net Realizable Value of Inventories. The Jollibee Group writes down inventories to net realizable value, through the use of an allowance account, whenever the net realizable value of inventories becomes lower than the cost due to damage, physical deterioration, obsolescence, changes in price levels or other causes.
The estimates of net realizable value are based on the most reliable evidence available at the time the estimates are made of the amounts the inventories are expected to be realized. These estimates take into consideration fluctuations of prices or costs directly relating to events occurring after reporting date to the extent that such events confirm conditions existing at reporting date. The allowance account is reviewed on a regular basis to reflect the accurate valuation in the financial records.
The Jollibee Group assessed that the net realizable value for some inventories is lower than cost, hence, it recognized provision for inventory obsolescence amounting to P11.1 million, P9.4 million and P2.2 million in 2014, 2013 and 2012, respectively (see Note 22). In addition, reversals of previously recognized provisions amounting to P8.5 million and P13.3 million were recognized in 2014 and 2012, respectively, while no reversal was recognized in 2013 (see Note 22). The Jollibee Group also wrote off allowance for inventory obsolescence amounting to P4.4 million in 2012. No write-offs were made in 2014 and 2013. The carrying amount of inventories amounted to P5,971.8 million and P3,560.4 million as at December 31, 2014 and 2013, respectively (see Note 8).
Estimation of Useful Lives of Property, Plant and Equipment and Investment Properties. The Jollibee Group estimates the useful lives of property, plant and equipment and investment properties based on the period over which the property, plant and equipment and investment properties are expected to be available for use and on the collective assessment of the industry practice, internal technical evaluation and experience with similar assets. The estimated useful lives of property, plant and equipment and investment properties are reviewed periodically and updated if expectations differ from previous estimates due to physical wear and tear, technical or commercial obsolescence and legal or other limits in the use of property, plant and equipment and investment properties. However, it is possible that future financial performance could be materially affected by changes in the estimates brought about by changes in the factors mentioned above. The amount and timing of recording the depreciation and amortization for any period would be affected by changes in these factors and circumstances. A reduction in the estimated useful lives of property, plant and equipment and investment properties would increase the recorded depreciation and amortization and decrease noncurrent assets.
There was no change in the estimated useful lives of property, plant and equipment and investment properties in 2014, 2013 and 2012.
Impairment of Goodwill and Other Intangible Assets. The Jollibee Group determines whether goodwill and other intangible assets with indefinite useful life is impaired at least on an annual basis or more frequently if events or changes in circumstances indicate that the carrying value may be impaired. This requires an estimation of the value in use of the CGU to which the goodwill is allocated. Estimating the value in use requires the Jollibee Group to make an estimate of the expected future cash flows from the CGU and also to choose a suitable discount rate in order to calculate the present value of those cash flows.
Management has determined that goodwill and other intangible assets are not impaired. The carrying amount of goodwill and other intangible assets amounted to P9,385.1 million and P9,103.6 million as at December 31, 2014 and 2013, respectively (see Note 14).
Impairment of Property, Plant and Equipment, Investment Properties, Interests in and Advances to Joint Ventures, Co-venturers and an Associate. The Jollibee Group performs impairment review of property, plant and equipment, investment properties, interests in and advances to joint ventures, co-venturers and an associate when certain impairment indicators are present. Determining the fair value of assets, which requires the determination of future cash flows expected to be generated from the continued use and ultimate disposition of such assets, requires the Jollibee Group to make estimates and assumptions that can materially affect the consolidated financial statements. Future events could cause the Jollibee Group to conclude that the assets are impaired. Any resulting impairment loss could have a material adverse impact on the Jollibee Group’s financial position and performance.
Reversal of impairment loss amounted to P62.6 million, P13.3 million and nil in 2014, 2013 and 2012, respectively, while provision for impairment loss amounted to P2.0 million, nil and P29.5 million in 2014, 2013 and 2012, respectively (see Note 22). The aggregate carrying values of property, plant and equipment, investment properties, interests in and advances to joint ventures, co-venturers and an associate amounted to P17,778.1 million and P15,846.6 million as at December 31, 2014 and 2013, respectively (see Notes 11, 12 and 13).
Realizability of Deferred Tax Assets. The carrying amounts of deferred tax assets at each reporting date is reviewed and reduced to the extent that there are no longer sufficient taxable profits available to allow all or part of the deferred tax assets to be utilized. The Jollibee Group’s assessment on the recognition of deferred tax assets is based on the forecasted taxable income. This forecast is based on past results and future expectations on revenue and expenses.
The carrying amount of deferred tax assets amounted to P1,535.0 million and P1,316.6 million as at December 31, 2014 and 2013, respectively (see Note 24).
Present Value of Defined Benefit Obligation. The pension expense as well as the present value of the defined benefit obligation are determined using actuarial valuations. The actuarial valuation involves making various assumptions. These include the determination of the discount rates and the future salary increases. Due to the complexity of the valuation, the underlying assumptions and its long-term nature, defined benefit obligations are highly sensitive to changes in these assumptions. All assumptions are reviewed at each reporting date.
In determining the appropriate discount rate, management considers the interest rates of government bonds that are denominated in the currency in which the benefits will be paid, with extrapolated maturities corresponding to the expected duration of the defined benefit obligation.
The carrying amount of pension liability amounted to P832.4 million and P932.8 million as at December 31, 2014 and 2013, respectively (see Note 25).

63
Share-based Payments. The Parent Company measures the cost of its equity-settled transactions with management and employees by reference to the fair value of the equity instruments at the grant date. Estimating fair value for share-based payment transactions requires determining the most appropriate valuation model, which is dependent on the terms and conditions of the grant. The estimate also requires determining the most appropriate inputs to the valuation model including the expected life of the share option, volatility and dividend yield and making assumptions about these inputs. The fair value of the share option is being determined using the Black-Scholes Option Pricing Model. The expected life of the stock options is based on the expected exercise behavior of the stock option holders and is not necessarily indicative of the exercise patterns that may occur. The volatility is based on the average historical price volatility which may be different from the expected volatility of the shares of the Parent Company.
Total expense arising from share-based payment recognized by the Jollibee Group amounted to P166.5 million, P150.4 million and P77.0 million in 2014, 2013 and 2012, respectively (see Notes 22 and 26).
Fair Value of Financial Assets and Liabilities. When the fair values of financial assets and financial liabilities recorded or disclosed in the parent company statement of financial position cannot be measured based on quoted prices in active markets, their fair value is measured using valuation techniques, including the discounted cash flow model. The inputs to these models are taken from observable markets where possible, but where this is not feasible, a degree of judgment is required in establishing fair values. Judgments include considerations of inputs such as liquidity risk, credit risk and volatility. Changes in assumptions about these factors could affect the reported fair value of financial instruments.
The fair value of financial assets and liabilities are discussed in Note 31.
Contingent Consideration or Earn-out. The Jollibee Group has an existing joint venture agreement with contingent consideration or earn-out provisions. This requires the estimation of payout associated with the probability-weighted discounted cash flow model, taking into consideration the specific conditions outlined in the purchase agreement that must be met to satisfy the contingency.
Provisions. The Jollibee Group recognizes a provision for an obligation resulting from a past event when it has assessed that it is probable that an outflow of resources will be required to settle the obligation and a reliable estimate can be made of the amount of the obligation. These assessments are made based on available evidence, including the opinion of experts. Future events and developments may result in changes in these assessments which may impact the financial condition and results of operations.
There were no additional provisions recorded in 2014, 2013 and 2012. Total outstanding provisions amounted to P30.5 million as at December 31, 2014 and 2013 (see Note 17).
Contingencies. The Jollibee Group is currently involved in litigations, claims and disputes which are normal to its business. The estimate of the probable costs for the resolution of these claims has been developed in consultation with the Jollibee Group’s legal counsels and based upon an analysis of potential results (see Note 29).
5. SEGMENT INFORMATION
For management purposes, the Jollibee Group is organized into segments based on the nature of the products and services offered and geographical locations. The Executive Management Committee monitors the operating results of its segments separately for resource allocation and performance assessment. Segment results are evaluated based on operating profit or loss and is measured consistently with operating profit or loss in the consolidated financial statements.
Business SegmentsThe Jollibee Group’s operating businesses are organized and managed separately according to the nature of the products and services provided, with each segment representing a strategic business unit that offers different products and serves different markets.
The food service segment is involved in the operations of QSRs and the manufacture of food products to be sold to Jollibee Group-owned and franchised QSR outlets.
The franchising segment is involved in the franchising of the Jollibee Group’s QSR store concepts.
The leasing segment leases store sites mainly to the Jollibee Group’s independent franchisees.
The following tables present certain information on revenues, expenses, assets and liabilities and other segment information of the different business segments as at and for the years ended December 31, 2014 and 2013 and 2012:
2014 Food Service Franchising Leasing Eliminations Consolidated
(In Thousands)Revenues from external customers P86,508,256 P3,986,141 P176,841 P– P90,671,238Inter-segment revenues 27,496,871 766,560 3,680,420 (31,943,851) –Segment revenues 114,005,127 4,752,701 3,857,261 (31,943,851) 90,671,238Segment expenses (111,886,809) (766,560) (3,847,589) 31,943,851 (84,557,107)Net reversal of provisions for
impairment losses on property,
plant and equipment,
investment properties,
receivables and inventories 22,637 – – – 22,637Equity in net loss of joint ventures
and an associate (126,174) – – – (126,174)Other segment income 653,783 – 5,521 – 659,304Segment result P2,668,564 P3,986,141 P15,193 P– 6,669,898
Interest income 242,045Interest expense (152,471)Income before income tax 6,759,472Provision for income tax (1,270,530)Net income P5,488,942
Assets and LiabilitiesSegment assets P52,993,539 P– P373,176 P– P53,366,715Deferred tax assets – net 743,530 – 8,435 – 751,965Consolidated assets 53,737,069 – 381,611 – 54,118,680
Segment liabilities P20,605,297 P– P98,621 P– P20,703,918Deferred tax liabilities – net 11,378 – – – 11,378Long-term debt - including current
portion 5,143,533 – – – 5,143,533Income tax payable 178,872 – 2,957 – 181,829Consolidated liabilities P25,939,080 P– P101,578 P– P26,040,658
Other Segment InformationCapital expenditures P5,641,696 P– P– P– 5,641,696Depreciation and amortization 3,179,208 – 7,172 – 3,186,380

64 NOTES TO CONSOLIDATED FINANCIAL STATEMENTS
2013 Food Service Franchising Leasing Eliminations Consolidated
(In Thousands)Revenues from external customers P76,595,268 P3,503,960 P183,541 P– P80,282,769Inter-segment revenues 23,891,327 665,299 3,130,550 (27,687,176) –Segment revenues 100,486,595 4,169,259 3,314,091 (27,687,176) 80,282,769Segment expenses (98,060,904) (665,299) (3,281,467) 27,687,176 (74,320,494)Impairment losses on property,
plant and equipment,
investment properties,
receivables, inventory and
contingencies (31,178) – – – (31,178)Equity in net loss of joint ventures
and an associate (115,561) – – – (115,561)Other segment income 329,816 – 7,509 – 337,325Segment result P2,608,768 P3,503,960 P40,133 P– 6,152,861
Interest income 245,574Interest expense (152,920)Income before income tax 6,245,515Provision for income tax (1,522,708)Net income P4,722,807
Assets and LiabilitiesSegment assets P44,909,353 P– P361,084 P– P45,270,437Deferred tax assets – net 740,289 – 15,908 – 756,197Consolidated assets P45,649,642 P– P376,992 P– P46,026,634
Segment liabilities P16,913,356 P– P110,190 P– P17,023,546Deferred tax liabilities – net 315,170 – 2,987 – 318,157Long-term debt - including current
portion 5,169,246 – – – 5,169,246Income tax payable 152,387 – 2,358 – 154,745Consolidated liabilities P22,550,159 P– P115,535 P– P22,665,694
Other Segment InformationCapital expenditures P4,175,146 P– P– P– P4,175,146Depreciation and amortization 3,063,998 – 8,458 – 3,072,456
2012 Food Service Franchising Leasing Eliminations Consolidated
(In Thousands)Revenues from external customers P67,751,942 P3,143,620 P163,477 P– P71,059,039Inter-segment revenues 21,173,546 559,947 1,889,953 (23,623,446) –Segment revenues 88,925,488 3,703,567 2,053,430 (23,623,446) 71,059,039Segment expenses (87,603,459) (559,947) (2,120,384) 23,623,446 (66,660,344)Impairment losses on property,
plant and equipment,
investment properties
and security deposit (53,677) – – – (53,677)Equity in net loss of joint ventures
and an associate (50,954) – – – (50,954)Other segment income 488,029 – 15,506 – 503,535Segment result P1,705,427 P3,143,620 (P51,448) P– 4,797,599
(Forward)
2012 Food Service Franchising Leasing Eliminations Consolidated
Interest income P270,114Interest expense (206,013)Income before income tax 4,861,700Provision for income tax (1,149,704)Net income P3,711,996
Assets and LiabilitiesSegment assets P40,637,819 P– P444,490 P– P41,082,309Deferred tax assets – net 667,539 – 18,283 – 685,822Consolidated assets P41,305,358 P– P462,773 P– P41,768,131
Segment liabilities P14,032,646 P– P123,023 P– P14,155,669Deferred tax liabilities – net 371,280 – 3,465 – 374,745Long-term debt - including current
portion5,427,456 – – – 5,427,456
Income tax payable 77,361 – 1,597 – 78,958Consolidated liabilities P19,908,743 P– P128,085 P– P20,036,828
Other Segment InformationCapital expenditures P3,755,907 P– P– P– P3,755,907Depreciation and amortization 2,700,694 – 4,942 – 2,705,636
Geographical SegmentsThe Jollibee Group’s geographical segments are based on the location of the assets producing revenues in the Philippines and in other locations (which includes PRC, USA, UAE, Hong Kong, Brunei, Saudi Arabia, Singapore, Kuwait, Qatar and Vietnam). Sales to external customers disclosed in the geographical segments are based on the geographical location of the customers.
Majority of the Jollibee Group’s revenues were generated from the Philippines, which is the Jollibee Group’s country of domicile.
The Jollibee Group does not have a single external customer which revenue amounts to 10% or more of the Jollibee Group’s revenues.
The following table presents revenues, segment assets and capital expenditures of the Jollibee Group’s geographical segments:
2014 Philippines International Eliminations Consolidated
(In Thousands)Segment revenues P70,179,960 P20,689,510 (P198,232) P90,671,238Segment assets 36,417,986 16,948,729 – 53,366,715Capital expenditures 4,529,006 1,112,690 – 5,641,696
2013 Philippines International Eliminations Consolidated
(In Thousands)Segment revenues P62,002,412 P18,439,768 (P159,411) P80,282,769Segment assets 29,402,035 15,868,402 – 45,270,437Capital expenditures 2,686,332 1,488,814 – 4,175,146

65
2012 Philippines International Eliminations Consolidated
(In Thousands)Segment revenues P55,680,452 P15,668,586 (P289,999) P71,059,039Segment assets 26,439,607 14,642,702 – 41,082,309Capital expenditures 2,250,655 1,505,252 – 3,755,907
6. CASH AND CASH EQUIVALENTS
This account consists of:
2014 2013Cash on hand P403,680,062 P220,019,290Cash in banks 4,165,160,508 4,313,506,109Short-term deposits 3,049,632,697 5,370,351,669
P7,618,473,267 P9,903,877,068
Cash in banks earn interest at the respective savings or special demand deposit rates. Short-term deposits are made for varying periods of up to three months depending on the immediate cash requirements of the Jollibee Group, and earn interest at the respective short-term deposit rates.
Interest income earned from cash in banks and short-term deposits amounted to P111.8 million, P145.6 million and P159.9 million in 2014, 2013 and 2012, respectively (see Note 23).
7. RECEIVABLES
This account consists of:
2014 2013Trade P7,479,202,252 P3,128,358,963Less allowance for impairment loss 208,940,071 274,461,795
7,270,262,181 2,853,897,168
Advances to employees 157,067,206 112,214,103Current portion of employee car plan receivables 65,327,161 33,366,298Others 128,536,704 83,395,109
P7,621,193,252 P3,082,872,678
Trade receivables are noninterest-bearing and are generally on 30-60 day terms.
Advances to employees, current portion of employee car plan receivables and other receivables are normally collectible within the next financial year.
The movements in the allowance for impairment loss for trade receivables as at December 31 are as follows:
2014 2013Balance at beginning of year P274,461,795 P260,138,120Provisions (see Note 22) 36,301,470 34,007,984Write-off (101,112,448) (22,801,774)Reversals (see Note 22) (868,308) –Translation adjustments 157,562 3,117,465Balance at end of year P208,940,071 P274,461,795
The provisions in 2014 and 2013 resulted from specific and collective impairment assessments performed by the Jollibee Group.
8. INVENTORIES
This account consists of:
2014 2013At cost: Food supplies and processed inventories P5,677,944,750 P3,390,581,280 Packaging, store and other supplies 245,482,727 119,209,912
5,923,427,477 3,509,791,192At net realizable value - Novelty items 48,386,514 50,640,942Total inventories at lower of cost and net
realizable value P5,971,813,991 P3,560,432,134
The cost of novelty items carried at net realizable value amounted to P67.5 million and P67.2 million as at December 31, 2014 and 2013, respectively.
The movements in the allowance for inventory obsolescence as at December 31 are as follows:
2014 2013Balance at beginning of year P16,566,344 P7,198,880Provisions (see Note 22) 11,066,386 9,367,464Reversals (see Note 22) (8,489,305) –Balance at end of year P19,143,425 P16,566,344
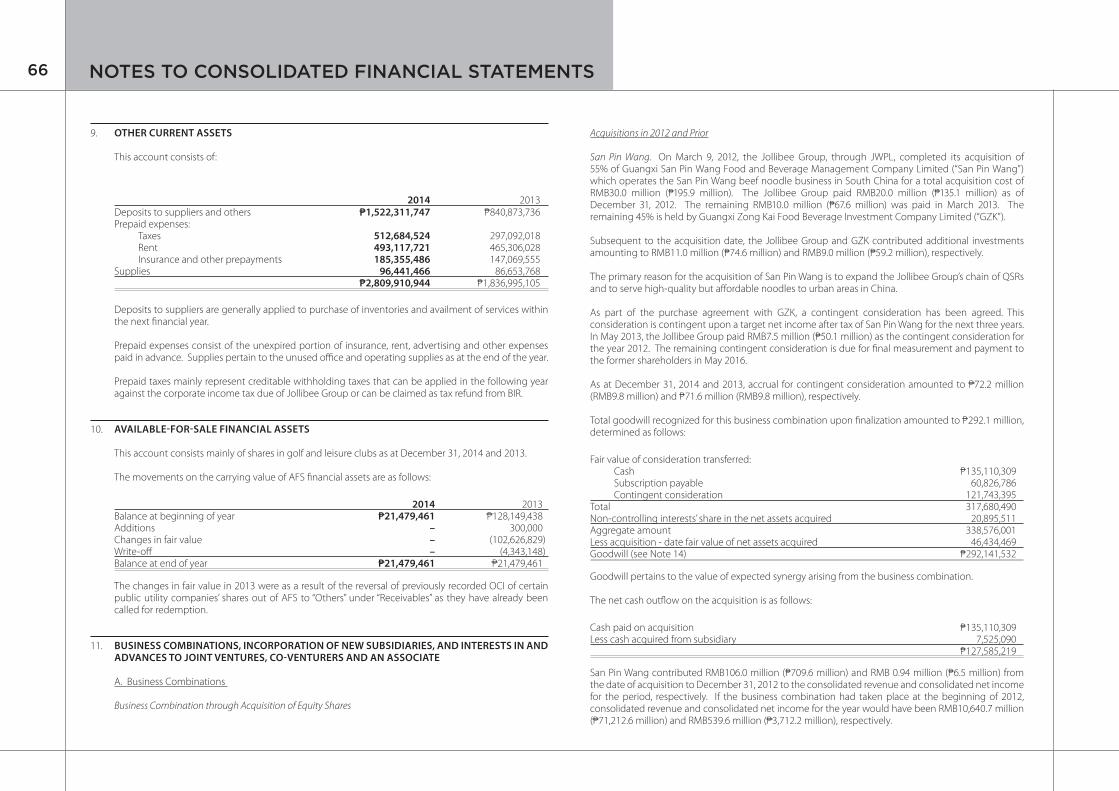
66 NOTES TO CONSOLIDATED FINANCIAL STATEMENTS
9. OTHER CURRENT ASSETS
This account consists of:
2014 2013Deposits to suppliers and others P1,522,311,747 P840,873,736Prepaid expenses: Taxes 512,684,524 297,092,018 Rent 493,117,721 465,306,028 Insurance and other prepayments 185,355,486 147,069,555Supplies 96,441,466 86,653,768
P2,809,910,944 P1,836,995,105
Deposits to suppliers are generally applied to purchase of inventories and availment of services within the next financial year.
Prepaid expenses consist of the unexpired portion of insurance, rent, advertising and other expenses paid in advance. Supplies pertain to the unused office and operating supplies as at the end of the year.
Prepaid taxes mainly represent creditable withholding taxes that can be applied in the following year against the corporate income tax due of Jollibee Group or can be claimed as tax refund from BIR.
10. AVAILABLE-FOR-SALE FINANCIAL ASSETS
This account consists mainly of shares in golf and leisure clubs as at December 31, 2014 and 2013.
The movements on the carrying value of AFS financial assets are as follows:
2014 2013Balance at beginning of year P21,479,461 P128,149,438Additions – 300,000Changes in fair value – (102,626,829)Write-off – (4,343,148)Balance at end of year P21,479,461 P21,479,461
The changes in fair value in 2013 were as a result of the reversal of previously recorded OCI of certain public utility companies’ shares out of AFS to “Others” under “Receivables” as they have already been called for redemption.
11. BUSINESS COMBINATIONS, INCORPORATION OF NEW SUBSIDIARIES, AND INTERESTS IN AND ADVANCES TO JOINT VENTURES, CO-VENTURERS AND AN ASSOCIATE
A. Business Combinations
Business Combination through Acquisition of Equity Shares
Acquisitions in 2012 and Prior
San Pin Wang. On March 9, 2012, the Jollibee Group, through JWPL, completed its acquisition of 55% of Guangxi San Pin Wang Food and Beverage Management Company Limited (“San Pin Wang”) which operates the San Pin Wang beef noodle business in South China for a total acquisition cost of RMB30.0 million (P195.9 million). The Jollibee Group paid RMB20.0 million (P135.1 million) as of December 31, 2012. The remaining RMB10.0 million (P67.6 million) was paid in March 2013. The remaining 45% is held by Guangxi Zong Kai Food Beverage Investment Company Limited (“GZK”).
Subsequent to the acquisition date, the Jollibee Group and GZK contributed additional investments amounting to RMB11.0 million (P74.6 million) and RMB9.0 million (P59.2 million), respectively.
The primary reason for the acquisition of San Pin Wang is to expand the Jollibee Group’s chain of QSRs and to serve high-quality but affordable noodles to urban areas in China.
As part of the purchase agreement with GZK, a contingent consideration has been agreed. This consideration is contingent upon a target net income after tax of San Pin Wang for the next three years. In May 2013, the Jollibee Group paid RMB7.5 million (P50.1 million) as the contingent consideration for the year 2012. The remaining contingent consideration is due for final measurement and payment to the former shareholders in May 2016.
As at December 31, 2014 and 2013, accrual for contingent consideration amounted to P72.2 million (RMB9.8 million) and P71.6 million (RMB9.8 million), respectively.
Total goodwill recognized for this business combination upon finalization amounted to P292.1 million, determined as follows:
Fair value of consideration transferred: Cash P135,110,309 Subscription payable 60,826,786 Contingent consideration 121,743,395Total 317,680,490Non-controlling interests’ share in the net assets acquired 20,895,511Aggregate amount 338,576,001Less acquisition - date fair value of net assets acquired 46,434,469Goodwill (see Note 14) P292,141,532
Goodwill pertains to the value of expected synergy arising from the business combination.
The net cash outflow on the acquisition is as follows:
Cash paid on acquisition P135,110,309Less cash acquired from subsidiary 7,525,090
P127,585,219
San Pin Wang contributed RMB106.0 million (P709.6 million) and RMB 0.94 million (P6.5 million) from the date of acquisition to December 31, 2012 to the consolidated revenue and consolidated net income for the period, respectively. If the business combination had taken place at the beginning of 2012, consolidated revenue and consolidated net income for the year would have been RMB10,640.7 million (P71,212.6 million) and RMB539.6 million (P3,712.2 million), respectively.

67
Mang Inasal. On November 22, 2010, the Jollibee Group, through the Parent Company, acquired 70% of the issued and outstanding shares of Mang Inasal from Injap Investments, Inc. (the seller), owner and operator of Mang Inasal restaurant business in the Philippines, for a total acquisition cost of P2,976.2 million. The Jollibee Group paid P2,700.0 million as of December 31, 2010. The present value of the remaining 10% of the purchase price is payable over a 3-year period as follows:
50% 12 months from November 22, 2010 (closing date)25% 24 months from closing date25% 36 months from closing date
The balance of liability for acquisition of Mang Inasal as at December 31, 2014 and 2013 are as follows:
2014 2013Balance at beginning of year P75,000,000 P72,292,267Payment (75,000,000) –Accretion (see Note 23) – 2,707,733Balance at end of year P– P75,000,000
As at December 31, 2014, the Jollibee Group has fully settled its liability for acquisition of Mang Inasal.
Business Combination through Purchase of Assets
Chowking US Operations. On May 27, 2011, the Jollibee Group, through its wholly-owned subsidiary, TTC, entered into an Asset Purchase Agreement with Fortune Capital Corporation, owner and operator of all Chowking stores in the USA as the master licensee therein, to purchase the latter’s property and equipment, inventories and security deposits of its twenty (20) existing stores. The purchase consideration amounted to USD16.0 million (P693.3 million). The Jollibee Group paid USD13.6 million resulting to an outstanding balance of USD2.4 million (P109.7 million) as of December 31, 2012 which shall be paid over the next five (5) years.
The balance of liability for acquisition of Chowking US operations as at December 31, 2014 and 2013 is as follows:
2014 2013Balance at beginning of year P90,023,088 P109,757,490Accretion (see Note 23) 6,856,382 6,620,533Payment (34,920,000) (34,560,000)Translation adjustments (165,398) 8,205,065Balance at end of year P61,794,072 P90,023,088
In original currency USD1,381,799 USD2,026,908
Current portion of liability P32,906,018 P32,666,875Noncurrent portion of liability 28,888,054 57,356,213
P61,794,072 P90,023,088
With this acquisition, the Jollibee Group took a more active role to further the growth of the Chowking business in the USA.
B. Incorporation of New Subsidiaries
Golden Cup Pte. Ltd. (Golden Cup). On December 19, 2014, the Jollibee Group, through JWPL, entered into a joint agreement to form Golden Cup together with Jasmine Asset Holding Ltd. (Jasmine), to own and operate Dunkin’ Donuts restaurants in the PRC.
JWPL owns 60% of the business and Jasmine owns the other 40%. JWPL and Jasmine have committed to invest up to USD300.0 million to the Joint Venture, of which up to USD180.0 million will be contributed by JWPL in proportion to its ownership in the business. JWPL shall be responsible for directing the day to day operations of the business. Golden Cup was incorporated on December 22, 2014 but has not yet started commercial operations.
Golden Beeworks Pte. Ltd. (Golden Beeworks). On May 16, 2012, the Jollibee Group, through GPPL, entered into an agreement to form Golden Beeworks together with Beeworks, Inc (“Beeworks”), to own and operate Jollibee stores in Singapore. Under the agreement, the parties will establish Golden Beeworks in Singapore which will be owned 60% by GPPL and 40% by Beeworks. GPPL will have full management control of the company, while leveraging on Beework’s experience, reputation and network to establish the “Jollibee” brand in Singapore. The initial funding for Golden Beeworks is USD1.0 million. Golden Beeworks was incorporated on July 19, 2012 and started its commercial operation on March 12, 2013.
As at December 31, 2014, capital contributions of the Jollibee Group to Golden Beeworks amounted to P38.6 million.
C. Partly-owned Subsidiaries with Material Non-Controlling Interest
Financial information of subsidiaries that have material non-controlling interests are provided below:
Proportion of equity interest held by non-controlling interests:
Country of incorporation and operation 2014 2013Mang Inasal Philippines 30% 30%JFPPL Singapore 30% 30%San Pin Wang People’s Republic of China 45% 45%
Summarized Statement of Comprehensive Income for 2014
Mang Inasal JFPPL San Pin WangRevenues P6,113,830,460 P1,366,618,701 P1,009,152,336Net income 333,620,513 72,129,007 44,378,997Other comprehensive income (loss) (8,489,686) 25,727,395 9,631,698Total comprehensive income 325,130,827 97,856,402 54,010,695Total comprehensive income
attributable to non-controlling interests 97,161,103 19,486,974 12,248,570
Dividends paid to non-controlling interests 36,000,000 – –

68 NOTES TO CONSOLIDATED FINANCIAL STATEMENTS
Summarized Statement of Comprehensive Income for 2013
Mang Inasal JFPPL San Pin WangRevenues P5,024,650,246 P922,513,905 P88,524,112Net income (loss) 243,925,820 (23,880,385) (22,758,697)Other comprehensive income (loss) (858,376) 33,534,645 28,127,143Total comprehensive income 243,067,445 9,654,260 5,368,446Total comprehensive income attributable to
non-controlling interests 77,455,459 2,700,169 3,865,149Dividends paid to non-controlling interests 30,000,000 − −
Summarized Statement of Comprehensive Income for 2012
Mang Inasal JFPPL San Pin WangRevenues P4,808,345,023 P36,365,967 P1,112,306,669Net income (loss) 168,479,571 (24,756,569) 10,822,549Other comprehensive income (loss) − 1,011 (3,220,775)Total comprehensive income 168,479,571 (24,755,558) 7,601,774Total comprehensive income attributable to
non-controlling interests 27,746,735 (11,294,550) (2,255,665)Dividends paid to non-controlling interests 45,000,000 − −
Summarized Statement of Financial Position as at December 31, 2014
Mang Inasal JFPPL San Pin WangCurrent assets P1,937,781,602 P512,981,429 P197,034,498Noncurrent assets 382,460,649 735,873,410 126,397,868Current liabilities 1,427,536,973 425,432,584 96,116,405Noncurrent liabilities 151,894,483 442,728,000 16,307,317Total equity 740,810,795 380,694,255 211,008,644Equity attributable to non-controlling interests 654,683,854 114,208,276 93,901,565
Summarized Statement of Financial Position as at December 31, 2013
Mang Inasal JFPPL San Pin WangCurrent assets P1,160,523,661 P401,781,653 P199,066,935Noncurrent assets 336,151,664 440,901,558 106,677,352Current liabilities 833,984,844 313,682,561 119,270,638Noncurrent liabilities 129,446,412 177,580,000 2,684,049Total equity 533,244,069 351,420,650 183,789,600Equity attributable to non-controlling interests 593,522,751 94,721,302 81,652,995
Summarized Statement of Financial Position as at December 31, 2012
Mang Inasal JFPPL San Pin WangCurrent assets P889,286,750 P6,014,729 P139,346,180Noncurrent assets 320,748,285 248,255,657 108,871,703Current liabilities 701,260,666 28,913,277 60,400,592Noncurrent liabilities 118,729,387 − −Total equity 390,044,982 225,357,109 187,817,291Equity attributable to non-controlling interests 545,786,042 67,607,133 77,787,846
Summarized Cash Flow Information for 2014
Mang Inasal JFPPL San Pin WangNet cash provided by (used in) operating
activities (P398,225,144) P14,304,136 P6,339,091Net cash used in investing activities (102,215,833) (294,084,243) (15,301,329)Net cash provided by financing activities 250,000,000 265,148,000 –Net decrease in cash and cash equivalents (250,440,977) (14,632,107) (8,962,238)
Summarized Cash Flow Information for 2013
Mang Inasal JFPPL San Pin WangNet cash provided by (used in) operating
activities P360,181,397 (P97,598,466) (P4,249,883)Net cash used in investing activities (69,758,734) (41,977,010) (34,800,901)Net cash provided by (used in) financing
activities (100,000,000) 177,580,000 −Net increase (decrease) in cash and cash
equivalents 190,556,600 38,004,524 (39,050,784)
Summarized Cash Flow Information for 2012
Mang Inasal JFPPL San Pin WangNet cash provided by (used in) operating
activities P414,847,292 P125,497,481 (P51,336,402)Net cash used in investing activities (117,069,644) (109,662,093) (39,009,357)Net cash provided by (used in) financing
activities (150,000,000) (13,299,879) 133,778,486Net increase in cash and cash equivalents 147,777,648 2,535,509 43,432,727
D. Interests in and Advances to Joint Ventures, Co-venturers and an Associate
2014 2013Interests in and advances to SuperFoods joint ventures and
co-venturers P3,144,855,846 P3,113,802,292Interest in joint venture - Wowprime 165,339,382 157,675,953
3,310,195,228 3,271,478,245Interest in an associate 78,707,378 50,915,520
P3,388,902,606 P3,322,393,765
SuperFoods Group. On January 20, 2012, upon fulfillment of certain legal and regulatory requirements in Vietnam, the Jollibee Group, through JWPL, acquired effective ownership of 50% share in the business of the SuperFoods Group through formation of joint ventures. This consists of a 49% share in SF Vung Tau Joint Stock Company, organized in Vietnam, and a 60% share in Blue Sky Holding Limited in Hong Kong (the SuperFoods Holding Companies). The formation of joint ventures is an implementation of the Framework Agreement made on May 20, 2011 between the Jollibee Group, through JWPL and its partner, Viet Thai International Joint Stock Company and Viet Thai International Company Limited (collectively, SuperFoods Group). The Framework Agreement provided for the Jollibee Group to contribute a total of USD25 million to gain 50% effective ownership of the joint ventures. Loans and deposits were made to SuperFoods Group and co-venturers prior to the formation of the joint ventures in 2012.

69
Pursuant to the Framework Agreement, the preliminary consideration for the 50% share in Superfoods Group amounted to a cash payment of USD25 million in 2011.
The Supplemental Agreement further provides that JWPL shall be required to pay the co-venturers an additional amount in 2016 based upon achieving a positive amount determined in accordance with a formula contained in the agreement. Based on management’s assessment using the earn-out formula, no additional consideration needs to be recognized as of January 20, 2012, date of acquisition, and as of December 31, 2012, 2013 and 2014.
In accordance with the Framework Agreement, JWPL, through its 99%-owned subsidiary JSF, extended loans to the SuperFoods Group with the details as follows:
Loan to Co-venturersLoan to the owners of the SuperFoods Group amounting to USD35.0 million (P1,565.2 million), extended on June 30, 2011, is payable in June 2016. The loan bears interest of 5% per annum payable in lump sum also in June 2016. The loan is agreed to be used for general corporate purposes. Total interest from this loan amounted to USD1.8 million (P79.3 million), USD1.4 million (P62.6 million) and USD 1.8 million (P79.6 million) for the years ended December 31, 2014, 2013 and 2012, respectively. The USD35.0 million loan is secured by a mortgage by the co-venturers of all their shares in SuperFoods Holding Companies.
On April 30, 2013, an additional loan was extended to SuperFoods Group amounting to USD1.0 million (P44.7 million) payable in February 2014 but was extended to April 2015. The loan bears interest of 5% per annum payable in lump sum also in April 2015. The loan is agreed to be used for general corporate purposes. Total interest from this loan amounted to USD0.05 million (P2.3 million) and USD0.03 million (P1.5 million) for the years ended December 31, 2014 and 2013, respectively.
On August 22, 2013, an additional loan was extended to SuperFoods Group amounting to USD1.0 million (P44.7 million) payable in August 2014. The date of payment was extended to August 2015. As of August 2014, the principal was subject to 5% interest per annum. However, with the extension to August 2015, the sum of the principal and the accumulated interest as of August 2014 shall be subject to 4.99% interest per annum. The loan is agreed to be used for general corporate purposes. Total interest from this loan amounted to USD0.05 million (P2.3 million) and USD0.02 million (P0.8 million) for the years ended December 31, 2014 and in 2013.
Loan to Blue SkyOn June 10, 2011, a loan was extended to Blue Sky Holdings Limited (Blue Sky), the Hong Kong-based joint venture, amounting to USD5.0 million (P223.6 million) payable in June 2014. The date of payment was extended to June 2015. As of June 2014, the principal was subject to 5% interest per annum. However, with the extension to June 2015, the sum of the principal and the accumulated interest as of June 2014 shall be subject to 4.99% interest per annum. Total interest from this loan amounted to USD0.3 million (P11.8 million), USD0.3 million (P11.3 million) and USD0.3 million (P11.3 million) for the years ended December 31, 2014, 2013 and 2012, respectively.
On May 7, 2012, an additional loan was extended to Blue Sky amounting to USD2.5 million (P111.8 million) payable in May 2014. The due date of payment was extended to May 2015. As of May 2014, the principal was subject to 5% interest per annum. However, with the extension to May 2015, the sum of the principal and the accumulated interests as of May 2014 shall be subject to 4.99% interest per annum. Total interest from this loan amounted to USD0.1 million (P5.8 million), USD0.1 million (P5.7 million) and USD0.1 million (P3.7 million) for the years ended December 31, 2014, 2013 and 2012, respectively.
The details of Jollibee Group’s interests in SuperFoods joint venture and advances to co-venturers as at December 31, 2014 and 2013 are as follows:
2014 2013Interest in a joint venture - cost P1,086,562,975 P1,086,562,975Equity in net loss: Balance at the beginning of year (172,909,359) (72,463,639) Equity in net loss for the year (86,630,512) (100,445,720)
(259,539,871) (172,909,359)Advances to the joint ventures and co-venturer: Balance at beginning of year 2,200,148,676 1,877,068,264 Additions – 88,790,000 Accrual of interest (see Note 23) 101,577,556 81,335,640 Translation adjustments 16,106,510 152,954,772Balance at end of year 2,317,832,742 2,200,148,676
P3,144,855,846 P3,113,802,292
The aggregate amounts of assets and liabilities as of December 31, 2014 and 2013 of SuperFoods Group are as follows:
2014 2013Current assets P391,071,679 P402,113,549Noncurrent assets 1,092,536,978 980,914,259Total assets P1,483,608,657 P1,383,027,808
Current liabilities P580,354,963 P473,141,806Noncurrent liabilities 768,588,861 609,348,409Total liabilities P1,348,943,824 P1,082,490,215
The amounts of assets and liabilities above include the following:
2014 2013Cash and cash equivalents P66,982,823 P88,194,498Current financial liabilities (excluding trade payables and other
current liabilities and provisions) 19,619,006 336,217,760Noncurrent financial liabilities (excluding provisions) 768,588,861 609,348,409
The amounts of the income and expenses account include the following:
2014 2013Revenues P2,317,386,922 P1,936,000,491Net loss (173,261,023) (200,891,440)Total comprehensive loss (173,261,023) (200,891,440)
2014 2013Depreciation and amortization P99,921,184 P118,111,479Interest income 102,437 3,395,889Interest expense 55,331,753 53,280,507Provision for income tax 2,162,576 84,749

70 NOTES TO CONSOLIDATED FINANCIAL STATEMENTS
Reconciliation of the above summarized financial information to the carrying amount of the interest in the associate recognized in the consolidated financial statements:
2014 2013Net assets P134,664,833 P300,537,593Proportion of the Jollibee Group’s ownership 50% 50%
67,332,416 150,268,797Goodwill 674,794,753 674,794,753Cumulative translation adjustments 84,895,935 88,590,066
P827,023,104 P913,653,616
Wowprime. On August 22, 2012, the Jollibee Group, through JWPL and GPPL, entered into an agreement with Hoppime Ltd., a subsidiary of Wowprime Corporation of Taiwan (Wowprime) and some key executives of Wowprime, to establish a joint venture entity to own and operate the 12 Hotpot brand in the People’s Republic of China, Hong Kong and Macau. The “12 Hotpot” restaurant is known in Taiwan for its low-priced hot dishes.
The joint venture entity, incorporated as WJ Investments Limited (WJ), is 48% owned by the Jollibee Group and 48% by Wowprime’s subsidiary and executives. The remaining 4% is owned by certain individuals with experience in the retail sector in China. Through their subsidiaries, Jollibee Group and Wowprime will share control and management of WJ.
The Jollibee Group has invested USD2.4 million (P98.0 million) as at December 31, 2012. The first store started commercial operations in January 2013. On October 31, 2013, the Jollibee Group invested an additional USD2.4 million (P103.6 million).
The details of Jollibee Group’s interest in Wowprime joint venture as at December 31, 2014 and 2013 are as follows:
2014 2013Interest in the joint venture: Balance at beginning of year P201,648,000 P98,040,000 Investment during the year 74,998,875 103,608,000 Balance at end of year 276,646,875 201,648,000Cumulative equity in net loss: Balance at beginning of year (43,972,047) – Equity in net loss during the year (67,335,446) (43,972,047) Balance at end of year (111,307,493) (43,972,047)Balance at end of year P165,339,382 P157,675,953
The aggregate amounts of assets and liabilities as at December 31, 2014 and 2013 pertaining to Wowprime are as follows:
2014 2013Current assets P231,353,675 P280,636,849Noncurrent assets 184,734,574 95,707,772Total assets P416,088,249 P376,344,621
Current liabilities P49,968,723 P23,160,593
The amounts of assets and liabilities above include the following:
2014 2013Cash and cash equivalents P146,008,593 P255,653,861Current financial liabilities (excluding trade payables and other
current liabilities and provisions) 303,141 15,594,727
The amounts of the income and expenses account include the following:
2014 2013Revenues P239,974,834 P48,433,607Net loss (140,282,180) (91,608,431)Total comprehensive loss (140,282,180) (91,608,431)
2014 2013Depreciation and amortization P30,365,317 P7,787,242Interest income 3,173,567 731,355
Reconciliation of the above summarized financial information to the carrying amount of the interest in the joint venture recognized in the consolidated financial statements:
2014 2013Net assets P366,119,526 P353,184,028Proportion of the Jollibee Group’s ownership 48% 48%
175,737,372 169,528,333Cumulative translation adjustments (10,397,990) (11,852,380)
P165,339,382 P157,675,953
Interest in an Associate
Entrek. The Jollibee Group, through JIBL, has 1/3 or 33.33% ownership over Entrek (B) SDN BHD (Entrek), a company that operates Jollibee stores in Brunei.

71
The details of the Jollibee Group’s interest in an associate as at December 31, 2014 and 2013 are as follows:
2014 2013Interests in an associate - cost P16,660,000 P16,660,000Cumulative equity in net earnings: Balance at beginning of year 34,255,520 5,633,981 Equity in net earnings during the year 27,791,858 28,621,539 Balance at end of year 62,047,378 34,255,520
P78,707,378 P50,915,520
The aggregate amounts as at December 31, 2014 and 2013 related to the Jollibee Group’s interest in Entrek follow:
2014 2013Current assets P413,250,302 P333,980,312Noncurrent assets 74,443,908 83,117,796Total assets P487,694,210 P417,098,108
Current liabilities P210,041,343 P202,049,401
2014 2013Revenues P519,839,966 P507,409,777Total comprehensive income 83,375,574 85,864,160
Reconciliation of the above summarized financial information to the carrying amount of the interest in the associate recognized in the consolidated financial statements:
2014 2013Net assets P277,652,867 P215,048,707Proportion of the Jollibee Group’s ownership 33.33% 33.33%
92,550,956 71,682,902Impairment loss recognized in 2011 (16,660,000) (16,660,000)Cumulative translation adjustments 2,816,422 (4,107,382)
P78,707,378 P50,915,520
E. Signing of New Joint Venture Agreement
Golden Crown Foods LLC (GCFL). On February 25, 2014, the Jollibee Group, through GPPL, signed a joint agreement with GCFL to establish a joint venture entity to own and operate the Jollibee Brand in the United Arab Emirates.
The Jollibee Group owns 49% of the joint venture while GCPL owns 51%. GPPL and GCFL will share control and management of the joint venture entity equally. The initial funding for the formation of the joint venture entity is approximately USD0.08 million.
The incorporation of the joint venture entity is still in process as at December 31, 2014.
12. PROPERTY, PLANT AND EQUIPMENT
The rollforward analysis of property, plant and equipment are as follows:
2014
Land and Land Improvements
Plant, Buildings, Condominium Units and Improvements
Leasehold Rights and Improvements
Office, Store and Food Processing Equipment
Furniture and Fixtures
Transportation Equipment
Construction in Progress Total
(In Thousands)CostBalance at beginning of year P666,214 P1,698,277 P12,985,033 P11,045,453 P888,507 P376,573 P548,004 P28,208,061Additions – 109,475 993,013 1,146,091 132,650 29,461 2,634,785 5,045,475Transfers – 1,097 198,923 42,376 48 – (242,444) –Retirements and disposals – (141,190) (814,067) (908,748) (91,236) (27,295) (33,817) (2,016,353)Reclassifications (see Note 13) – 717,112 (47,826) 680,489 49,308 133,118 (1,628,397) (96,196)Translation adjustments 429 129,179 (48,613) (19,128) 1,624 (712) (2,894) 59,885Balance at end of year 666,643 2,513,950 13,266,463 11,986,533 980,901 511,145 1,275,237 31,200,872
(Forward)

72 NOTES TO CONSOLIDATED FINANCIAL STATEMENTS
2014
Land and Land Improvements
Plant, Buildings, Condominium Units and Improvements
Leasehold Rights and Improvements
Office, Store and Food Processing Equipment
Furniture and Fixtures
Transportation Equipment
Construction in Progress Total
Accumulated Depreciation and AmortizationBalance at beginning of year P7,313 P720,755 P7,197,208 P7,608,975 P618,496 P266,673 P– P16,419,420Depreciation and amortization (see Notes 21 and 22) 107 86,354 1,522,480 1,358,648 130,898 43,664 – 3,142,151Transfers – – (150) 102 48 – – –Retirements and disposals – (41,001) (678,063) (852,408) (86,703) (25,664) – (1,683,839)Reclassifications (see Note 13) – 212,372 (237,424) (4,486) (4,261) 6,161 – (27,638)Translation adjustments – 22,872 (30,897) (7,361) 918 (321) – (14,789)Balance at end of year 7,420 1,001,352 7,773,154 8,103,470 659,396 290,513 – 17,835,305Accumulated Impairment LossesBalance at beginning of year – – – 16,200 – – – 16,200Additions during the year (see Note 22) – – – 2,000 – – – 2,000Reversals during the year (see Note 22) – – – (16,200) – – – (16,200)Balance at end of year – – – 2,000 – – – 2,000Net Book Value P659,223 P1,512,598 P5,493,309 P3,881,063 P321,505 P220,632 P1,275,237 P13,363,567
2013
Land and Land Improvements
Plant, Buildings,
Condominium Units and
Improvements
Leasehold Rights and Improvements
Office, Store and Food Processing Equipment
Furniture and Fixtures
Transportation Equipment
Construction in Progress Total
(In Thousands)CostBalance at beginning of year P661,794 P1,678,661 P11,683,920 P10,190,137 P923,867 P361,975 P292,754 P25,793,108Additions – 5,704 1,201,548 1,416,123 135,420 52,518 1,096,563 3,907,876Transfers – – (15) 10,940 – – (10,925) –Retirements and disposals – – (865,459) (822,814) (187,167) (44,368) (230,021) (2,149,829)Reclassifications – 854 526,967 79,943 3,388 1,962 (612,260) 854Translation adjustments 4,420 13,058 438,072 171,124 12,999 4,486 11,893 656,052Balance at end of year 666,214 1,698,277 12,985,033 11,045,453 888,507 376,573 548,004 28,208,061Accumulated Depreciation and AmortizationBalance at beginning of year 7,186 668,534 6,064,413 7,045,793 665,546 252,672 – 14,704,144Depreciation and amortization (see Notes 21 and 22) 127 51,534 1,607,616 1,229,317 124,933 46,024 – 3,059,551Retirements and disposals – – (678,604) (759,932) (177,943) (35,674) – (1,652,153)Reclassifications – – (1,106) 43 (12) 1,075 – –Translation adjustments – 687 204,889 93,754 5,972 2,576 – 307,878Balance at end of year 7,313 720,755 7,197,208 7,608,975 618,496 266,673 – 16,419,420Accumulated Impairment LossesBalance at beginning of year – – – 29,500 – – – 29,500Reversal of impairment during the year (see Note 22) – – – (13,300) – – – (13,300)Balance at end of year – – – 16,200 – – – 16,200Net Book Value P658,901 P977,522 P5,787,825 P3,420,278 P270,011 P109,900 P548,004 P11,772,441

73
The cost of fully depreciated property, plant and equipment still in use amounted to P7,405.7 million and P7,448.7 million as at December 31, 2014 and 2013, respectively.
Loss on disposals and retirements of property, plant and equipment and investment properties amounted to P156.6 million, P446.2 million and P318.6 million in 2014, 2013, and 2012, respectively.
Construction in progress account mainly pertains to costs incurred for ongoing construction of plants and properties, including soon-to-open stores.
In 2014 and 2013, management reassessed the recoverable amount of the Company’s office, store and food processing equipment of which reassessment process includes actual inspection of the Company’s existing assets and recognized a reversal of provision amounting to P16.2 million in 2014 and P13.3 million in 2013, based on fair value less cost to sell and presented under the “General and administrative expenses” account in the statements of comprehensive income (see Note 22).
13. INVESTMENT PROPERTIES
The rollforward analysis of this account follows:
2014
Land
Buildings
and Building
Improvements Total(In Thousands)
CostBalance at beginning of year P714,455 P336,030 P1,050,485Additions 276,252 1,233 277,485Retirements and disposals (7,279) (167,312) (174,591)Reclassifications (see Note 12) – 96,196 96,196Translation adjustments – 11,693 11,693Balance at end of year 983,428 277,840 1,261,268Accumulated Depreciation and
AmortizationBalance at beginning of year – 252,271 252,271Depreciation (see Notes 21 and 22) – 6,965 6,965Retirements and disposals – (59,293) (59,293)Reclassifications (see Note 12) – 27,638 27,638Translation adjustments – 8,042 8,042Balance at end of year – 235,623 235,623Accumulated Impairment LossesBalance at beginning year 46,447 – 46,447Reversals during the year (see Note 22) (46,447) – (46,447)Balance at end of year – – –Net Book Value P983,428 P42,217 P1,025,645
2013
Land
Buildings
and Building
Improvements Total(In Thousands)
CostBalance at beginning of year P714,455 P323,086 P1,037,541Translation adjustments – 12,944 12,944Balance at end of year 714,455 336,030 1,050,485Accumulated Depreciation and
AmortizationBalance at beginning of year – 237,081 237,081Depreciation (see Notes 21 and 22) – 12,905 12,905Translation adjustments – 2,285 2,285Balance at end of year – 252,271 252,271Accumulated Impairment LossesBalance at beginning and end of year 46,447 – 46,447Net Book Value P668,008 P83,759 P751,767
In 2014, the Jollibee Group transferred certain units of a building with carrying amount of P68.6 million as at December 31, 2014 from property, plant and equipment to investment property due to end of owner-occupation.
The cost of fully depreciated buildings still being leased out by the Jollibee Group amounted to P182.0 million and P202.0 million as at December 31, 2014 and 2013, respectively.
The Jollibee Group’s investment properties have aggregate fair values of P1,414.3 million and P1,050.5 million as at December 31, 2014 and 2013, respectively, as determined by independent appraisers, Asian Appraisal and Tan - Gatue Appraisal Associates, Inc. in 2014 and 2011, respectively. The valuations performed by the independent appraisers are in accordance with recognized professional appraisal standards.
In 2014, the Company reversed the allowance for impairment loss recognized in 2011 amounting to P46.4 million as a result of the increase in the fair value of the land compared to the carrying amount of the property had no impairment loss was recognized. The reversal of impairment loss is presented in the statement of comprehensive income.
In determining the fair value of the investment properties, the independent appraisers used the market data approach for land and cost approach for buildings and building improvements. For land, fair value is based on sales and listings of comparable properties within the vicinity after adjustments for differences in location, size and shape of the lot, time elements and other factors between the properties and their comparable properties. For buildings and building improvements, fair value is based on the current cost of replacement of the properties in accordance with prevailing market prices for materials, labor, and contractors’ overhead, profit and fees in the locality after adjustments for depreciation due to physical deterioration, functional and economic obsolescence based on personal inspection of the buildings and building improvements and in comparison to similar new properties. Fair value hierarchy disclosures for investment properties have been provided in Note 31.
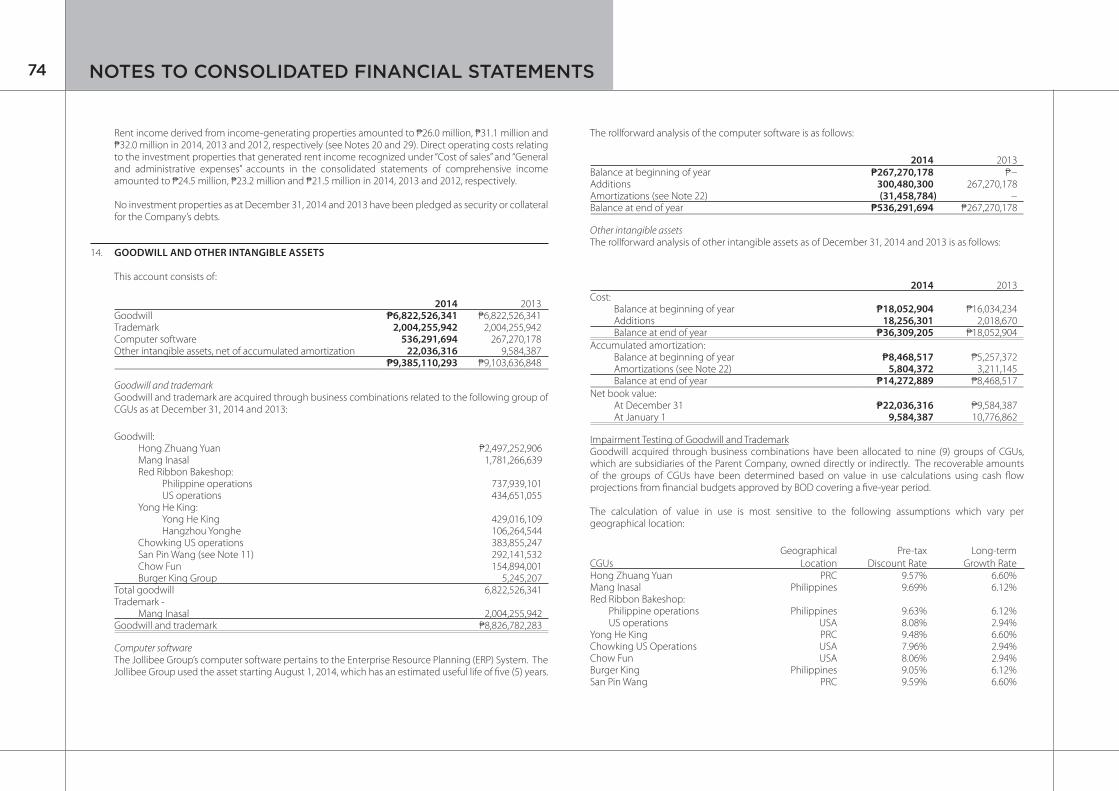
74 NOTES TO CONSOLIDATED FINANCIAL STATEMENTS
Rent income derived from income-generating properties amounted to P26.0 million, P31.1 million and P32.0 million in 2014, 2013 and 2012, respectively (see Notes 20 and 29). Direct operating costs relating to the investment properties that generated rent income recognized under “Cost of sales” and “General and administrative expenses” accounts in the consolidated statements of comprehensive income amounted to P24.5 million, P23.2 million and P21.5 million in 2014, 2013 and 2012, respectively.
No investment properties as at December 31, 2014 and 2013 have been pledged as security or collateral for the Company’s debts.
14. GOODWILL AND OTHER INTANGIBLE ASSETS
This account consists of:
2014 2013Goodwill P6,822,526,341 P6,822,526,341Trademark 2,004,255,942 2,004,255,942Computer software 536,291,694 267,270,178Other intangible assets, net of accumulated amortization 22,036,316 9,584,387 P9,385,110,293 P9,103,636,848
Goodwill and trademarkGoodwill and trademark are acquired through business combinations related to the following group of CGUs as at December 31, 2014 and 2013:
Goodwill: Hong Zhuang Yuan P2,497,252,906 Mang Inasal 1,781,266,639 Red Ribbon Bakeshop: Philippine operations 737,939,101 US operations 434,651,055 Yong He King: Yong He King 429,016,109 Hangzhou Yonghe 106,264,544 Chowking US operations 383,855,247 San Pin Wang (see Note 11) 292,141,532 Chow Fun 154,894,001 Burger King Group 5,245,207Total goodwill 6,822,526,341Trademark - Mang Inasal 2,004,255,942Goodwill and trademark P8,826,782,283
Computer softwareThe Jollibee Group’s computer software pertains to the Enterprise Resource Planning (ERP) System. The Jollibee Group used the asset starting August 1, 2014, which has an estimated useful life of five (5) years.
The rollforward analysis of the computer software is as follows:
2014 2013Balance at beginning of year P267,270,178 P−Additions 300,480,300 267,270,178Amortizations (see Note 22) (31,458,784) −Balance at end of year P536,291,694 P267,270,178
Other intangible assetsThe rollforward analysis of other intangible assets as of December 31, 2014 and 2013 is as follows:
2014 2013Cost: Balance at beginning of year P18,052,904 P16,034,234 Additions 18,256,301 2,018,670 Balance at end of year P36,309,205 P18,052,904
Accumulated amortization: Balance at beginning of year P8,468,517 P5,257,372 Amortizations (see Note 22) 5,804,372 3,211,145 Balance at end of year P14,272,889 P8,468,517
Net book value: At December 31 P22,036,316 P9,584,387 At January 1 9,584,387 10,776,862
Impairment Testing of Goodwill and TrademarkGoodwill acquired through business combinations have been allocated to nine (9) groups of CGUs, which are subsidiaries of the Parent Company, owned directly or indirectly. The recoverable amounts of the groups of CGUs have been determined based on value in use calculations using cash flow projections from financial budgets approved by BOD covering a five-year period.
The calculation of value in use is most sensitive to the following assumptions which vary per geographical location:
CGUs
Geographical
Location
Pre-tax
Discount Rate
Long-term
Growth RateHong Zhuang Yuan PRC 9.57% 6.60%Mang Inasal Philippines 9.69% 6.12%Red Ribbon Bakeshop: Philippine operations Philippines 9.63% 6.12% US operations USA 8.08% 2.94%Yong He King PRC 9.48% 6.60%Chowking US Operations USA 7.96% 2.94%Chow Fun USA 8.06% 2.94%Burger King Philippines 9.05% 6.12%San Pin Wang PRC 9.59% 6.60%

75
Key assumptions with respect to the calculation of value in use of the groups of CGUs as at December 31, 2014 and 2013 on which management had based its cash flow projection to undertake impairment testing of goodwill are as follows:
a) Discount rates - discount rates represent the current market assessment of the risks specific to each CGU, regarding the time value of money and individual risks of the underlying assets which have not been incorporated in the cash flow estimates. The discount rate calculation is based on the specific circumstances of the Jollibee Group and its CGUs and derived from its weighted average cost of capital (WACC). The WACC takes into account both debt and equity. The cost of equity is derived using the Capital Asset Pricing Model (CAPM). The cost of debt is based on the interest bearing borrowings the Jollibee Group is obliged to service. CGU-specific risk is incorporated by applying individual beta factors. The beta factors are evaluated annually based on publicly available market data.
b) Long-term growth rates - rates are determined with consideration of historical and projected results, as well as the economic environment in which the CGUs operate.
c) Earnings Before Interest, Taxes, Depreciation and Amortization (EBITDA) margin - is based on the most recent value achieved in the year preceding the start of the budget period, and adjusted for planned efficiency improvement, if any.
No impairment loss was recognized for goodwill and trademark for the years ended December 31, 2014, 2013 and 2012.
15. OTHER NONCURRENT ASSETS
This account consists of:
2014 2013Security and other deposits (see Notes 30 and 31) P1,522,942,799 P1,360,230,842Noncurrent portion of: Rent and other long-term prepayments 318,547,751 239,797,867 Employee car plan receivables (see Notes 30 and 31) 130,234,889 106,011,234Deferred rent expense 78,087,841 61,261,913Deferred compensation 13,256,501 13,433,144Returnable containers 23,458,995 21,303,019Other assets 53,019,885 91,237,373
P2,139,548,661 P1,893,275,392
Security and other deposits represent deposits for operating leases entered into by the Jollibee Group as lessee and other deposits. The security deposits are recoverable from the lessors at the end of the lease term, which ranges from three to twenty years. These are presented at amortized cost. The discount rates used range from 2.00% to 22.00% in 2014 and 2013. The difference between the fair value at initial recognition and the notional amount of the security deposits is charged to “Deferred rent expense” account and amortized on straight-line basis over the lease terms.
Accretion of interest on refundable deposits and employee car plan receivables amounted to P25.2 million and P18.9 million in 2014 and 2013, respectively (see Note 23).
16. TRADE PAYABLES AND OTHER CURRENT LIABILITIES
This account consists of:
2014 2013Trade P6,575,866,203 P6,006,639,836Accruals for: Local and other taxes 2,129,608,286 1,650,647,422 Salaries, wages and employee benefits 1,356,033,704 1,516,033,345 Advertising and promotions 1,022,030,971 1,022,817,189 Rent 727,097,312 534,417,910 Utilities 326,583,023 329,764,448 Freight 270,636,918 197,069,154 Operating supplies 232,297,364 174,724,487 Repairs and maintenance 219,646,777 143,883,572 Professional fees 152,476,539 114,884,136 Store operations, corporate events and others 2,106,557,671 1,572,317,710Customers’ deposits 731,790,996 602,100,377Unearned revenue from gift certificates 67,634,181 47,629,038Dividends payable 56,350,870 29,374,422Other current liabilities 321,054,359 307,622,975
P16,295,665,174 P14,249,926,021
Trade payables to suppliers are noninterest-bearing and are normally settled on a 30-day term.
Accrued expenses are noninterest-bearing and are normally settled within the next financial year.
Accretion of interest on the liability of acquisition of businesses and customers’ deposits amounted to P18.1 million and P19.1 million in 2014 and 2013, respectively (see Note 23).
17. PROVISIONS
The Jollibee Group has outstanding provisions amounting to P30.5 million as at December 31, 2014 and 2013, consisting mainly of provisions for legal claims.
These include estimates of legal services, settlement amounts and other costs of claims made against the Jollibee Group. Other information on the claims is not disclosed as this may prejudice the Jollibee Group’s position on such claims. The Jollibee Group’s management, after consultation with its legal counsel, believes that the provisions are sufficient to meet the costs related to the claims.

76 NOTES TO CONSOLIDATED FINANCIAL STATEMENTS
18. SHORT AND LONG-TERM DEBTS
Short-term DebtShort-term debt consists of unsecured bank loans of the Parent Company. These loans were availed in 2014 with maturities of one year or less with interest rates ranging from 1.8% to 1.9%. Short-term debt amounted to P1,865.0 million as of December 31, 2014.
Interest expense recognized on short-term debt amounted to P3.2 million, nil and P14.8 million in 2014, 2013 and 2012, respectively (see Note 23).
Long-term DebtAs at December 31, the long-term debt consists of the following:
2014 2013Principal P5,153,136,000 P5,176,745,744Unamortized debt issue cost (9,603,030) (7,500,000) P5,143,532,970 P5,169,245,744
The details of long-term debt follow:
2014 2013USD-denominated: Loan 1 P1,453,400,000 P1,775,800,000 Loan 2 804,960,000 799,110,000 Loan 3 – 443,950,000 Loan 4 – 329,362,744 Loan 5 178,880,000 177,580,000 Loan 6 263,848,000 –PHP-denominated: Loan 7 1,493,863,636 1,492,500,000 Loan 8 796,533,334 – Loan 9 152,048,000 150,943,000
5,143,532,970 5,169,245,744Less current portion 715,520,000 1,106,275,244
P4,428,012,970 P4,062,970,500
USD-denominated loans of JWPL. Loan 1 consists of a 5-year unsecured loan acquired from a local bank on February 25, 2013 amounting to USD40.0 million (or P1,632.0 million) subject to quarterly interest repricing with one-time option to fix in the future. The interest rate is based on three-month U.S. Dollar London Interbank Offered Rate (USD LIBOR) plus spread of 100 basis points. The principal is payable in 16 quarterly installments commencing on May 26, 2014 up to February 26, 2018, the date of maturity.
Loan 2 consists of a 4-year unsecured loan acquired from a local bank on October 25, 2013 amounting to USD18.0 million (or P777.8 million) with an interest rate based on three-month USD LIBOR plus spread of 1.00% subject to interest repricing every quarter. The principal is payable in 12 quarterly installment commencing on January 25, 2015 up to October 25, 2017, the date of maturity.
Loan 3 consists of a 3-year unsecured loan acquired from a local bank on April 29, 2011 amounting to USD40.0 million (or P1,712.0 million) with fixed interest rate of 2.53% per annum. The principal is payable in 4 semi-annual installments commencing on October 29, 2012 up to April 28, 2014, the date of maturity. The loan was fully paid in April 2014.
Loan 4 consists of a 3-year unsecured loan acquired from a foreign bank on May 9, 2011 amounting to USD30.0 million (or P1,287.9 million) with fixed interest rate of 2.72% per annum. The principal is payable in 4 semi-annual installments commencing on November 9, 2012 up to May 8, 2014, the date of maturity. The loan was fully paid in May 2014.
The loan agreements above (loans 1 - 4) provide certain restrictions and requirements principally with respect to maintenance of required financial ratios, which include debt to equity ratio which is not to exceed 1.5 and debt service coverage ratio not to exceed 2.0, and material change in ownership or control. As at December 31, 2014 and 2013, the Jollibee Group is in compliance with the terms of its loan covenants.
USD-denominated loans of JFPPL. Loan 5 consists of a 5-year unsecured loan acquired from a local bank on May 8, 2013 amounting to USD4.0 million (or P163.3 million) with an interest rate based on three-month USD LIBOR plus spread of 100 basis points subject to repricing every quarter. The principal is payable on May 7, 2018, the date of maturity.
Loan 6 consists of a 5-year unsecured loan acquired from a local bank on April 25, 2014 amounting to USD5.9 million (or P257.5 million) with an interest rate of 1.48% subject to repricing every quarter. The principal is payable on April 24, 2019, the date of maturity.
PHP-denominated loans of the Parent Company. On December 9, 2013, the Parent Company refinanced its P1,500.0 million term loan from local bank due on December 16, 2013 by availing a term loan of the same amount (Loan 7). The new loan is payable over five years and six months from the date of drawdown with annual principal repayments of P15.0 million starting on the 30th month from the date of drawdown and P1,455.0 million upon maturity. The loan is subject to a variable interest rate based on three-month Philippine Dealing System Treasury Fixing (PDST-F) rate plus spread of 1.25%, which is payable and is reset on a quarterly basis, and to an interest rate floor based on the Bangko Sentral ng Pilipinas (BSP) Overnight Reverse Repurchase Agreement Rate. The loan was drawn on December 16, 2013 and will mature on June 17, 2019. The Parent Company incurred debt issue costs of P7.5 million, representing documentary stamp tax, in relation to this loan in 2013.
Under the loan agreement with local bank, the Parent Company has an option to convert the variable interest rate into a fixed interest rate based on the PDST-F rate for the remaining term of the loan and the spread of 1.00% on any interest payment date. The Parent Company also has an option to prepay the loan in full or in multiples of P10.0 million on any interest payment date.
Under the loan agreement, the Parent Company is subject to certain debt covenants which include among others the maintenance of a required Debt-to-Equity ratio and Debt-to-EBITDA ratio not to exceed 3.0. The Parent Company is in compliance with these debt covenants as at December 31, 2014 and 2013.

77
Loan 8 consists of a 5-year unsecured loan acquired from a local bank on April 21, 2014 amounting to P800.0 million. The loan is subject to a variable interest rate based on three-month PDST-F rate plus spread of 1.0%, and to an interest rate floor based on the BSP Special Deposit Account Rate plus spread of 1.0% or BSP Overnight Borrowing Rate plus spread of 1.0%. The Parent Company incurred debt issue costs of P4.0 million, representing documentary stamp tax, in relation to this loan. The principal is payable on April 21, 2019, the date of maturity.
Under the loan agreement with the local bank, the Parent Company has an option to convert the variable interest rate into a fixed interest rate equal to the sum of the Margin and the five-year treasury securities benchmark yield as displayed under the heading “Bid Yields” appearing on the PDST-F Benchmarks screen of the Philippine Dealing Exchange of Bloomberg on the date of the Option to Convert is exercised, subject to a floor rate of 4.75% per annum. The Parent Company also has an option to prepay the loan, wholly or partially, without penalty at any time during the term of the loan subject to certain conditions.
Under the loan agreement, the Parent Company is subject to certain debt covenants which include among others the maintenance of a required Debt-to-Equity ratio and Debt Service Coverage ratio not to exceed 3.0 and 1.3, respectively. The Parent Company is in compliance with these debt covenants as at December 31, 2014.
The details of the Parent Company’s PHP denominated long-term debt (Loans 7 and 8) as at December 31, 2014 and 2013 is as follows:
2014 2013Principal P2,300,000,000 P1,500,000,000Less unamortized debt issue cost (9,603,030) (7,500,000)
P2,290,396,970 P1,492,500,000
The movements in unamortized debt issue cost in 2014 and 2013 are as follows:
2014 2013Balance at beginning of year P7,500,000 P10,296,795Additions 4,000,000 7,500,000Amortizations (1,896,970) (10,296,795)Balance at end of year P9,603,030 P7,500,000
PHP-denominated loan of PERF Restaurants, Inc.(PERF). Loan 9 is a 5-year unsecured USD3.4 million (or P149.2 million) bearing fixed interest rate of 5.32% per annum.
The loan contains certain restrictive covenants and requirements with respect to the following:
(a) Maintenance of the following ratios for the duration of the loan agreements: (1) minimum debt service coverage of 1.5:1; and (2) maximum debt to (EBITDA) of 4:1.
(b) Restrictions on changes in ownership structure; incurrence of any additional loans with term of more than one year; repayment of intercompany borrowings from the Parent Company except those agreed upon signing of this Facility Agreement; investing or entering into any business substantially different from the business in which PERF is presently engaged; and enter into merger or consolidation, except where PERF is the surviving corporation, and the Parent Company remains as the majority beneficial owner of the surviving corporation.
As at December 31, 2014, PERF is in compliance with the terms of the loan agreement.
Interest expense recognized on long-term debt including amortization of debt issue cost, amounted to P131.2 million, P133.8 million and P171.1 million in 2014, 2013 and 2012, respectively (see Note 23).
Derivative, Hedges and Hedge Effectiveness TestingIn 2012, Loan 9 was converted into a deliverable cross-currency swap transaction to hedge in full the foreign currency risk and interest rate risk on its floating rate. Under the cross-currency swap, PERF received at inception PHP notional amount of P149.2 million and paid USD notional amount of USD3.4 million based on the PHP/USD spot reference rate of P43.87. At every interest payment date, PERF will receive variable interest based on 3-month US LIBOR plus spread and will pay fix interest rate. At maturity date, PERF will receive USD notional amount of USD3.4 million and pay PHP notional amount of P149.2 million. The USD receipts from the cross-currency swap correspond with the expected interest fixed principal amount due on the hedged loan. Similar with the hedged loan, the cross-currency swap is non-amortizing and will mature on December 21, 2016.
Effectively, the cross-currency swap transformed the floating rate USD loan into a fixed rate PHP loan.
Since the critical terms of the hedged loan and cross-currency swap matched, the hedge was assessed to be highly effective. As such, there was no ineffectiveness recognized in the profit or loss for the years ended December 31, 2014 and 2013.
The movement in fair value of cash flow hedge presented in equity under other comprehensive loss in 2014 and 2013 follows:
2014 2013Balance at beginning of year P6,317,600 P13,124,439Changes in fair value of the cash flow hedge (4,998,710) (20,212,711)Transfer to profit or loss 3,116,583 13,405,872Net movement on cash flow hedge (1,882,127) (6,806,839)Balance at year-end 4,435,473 6,317,600Non-controlling interests’ share (2,040,318) (2,906,096)
P2,395,155 P3,411,504
The foreign exchange revaluation of the hedged loan, amounting to P3.1 million and P13.4 million, was recognized in other comprehensive loss on derivative liability in 2014 and 2013, respectively.
The net movement in the fair value of the Company’s derivative liability for the years ended December 31, 2014 and 2013 follows:
2014 2013Balance at beginning of year P4,532,600 P22,782,820Net changes in fair value (4,998,710) (20,212,711)Settlements 2,011,582 1,962,491Balance at end of year P1,545,472 P4,532,600

78 NOTES TO CONSOLIDATED FINANCIAL STATEMENTS
19. EQUITY
a. Capital Stock
The movements in the number of shares are as follows:
2014 2013Authorized - 1 par value P1,450,000,000 P1,450,000,000
Issued and subscribed: Balance at beginning of the year P1,068,608,675 P1,063,859,559 Issuances during the year 12,431,639 4,749,116 Balance at end of year 1,081,040,314 1,068,608,675 Subscription receivable (17,177,884) (17,177,884)
P1,063,862,430 P1,051,430,791
The total number of shareholders of the Parent Company is 3,173 and 3,244 as at December 31, 2014 and 2013, respectively.
b. Treasury Shares
The cost of common stock of the Parent Company held in treasury of P180.5 million consists of 16,447,340 shares as at December 31, 2014 and 2013.
c. Excess of Cost over the Carrying Value of Non-controlling Interests Acquired
The amount of excess of cost over the carrying value of non-controlling interests acquired as at December 31, 2014 and 2013, recognized as part of “Equity Attributable to Equity Holders of the Parent Company” section in the consolidated statements of financial position, resulted from the following acquisitions of non-controlling interests:
20% of Greenwich in 2006 P168,257,65915% of Belmont in 2007 375,720,91440% of Adgraphix in 2010 (1,214,087)
P542,764,486
d. Retained Earnings
The Jollibee Group has a cash dividend policy of declaring one-third of the Jollibee Group’s net income for the year as cash dividends. It uses best estimate of its net income as basis for declaring cash dividends. Actual cash dividends per share declared as a percentage of the EPS are 32.3%, 75.5% and 61.5% in 2014, 2013 and 2012, respectively.
The Parent Company’s retained earnings available for dividend declaration, computed based on the guidelines provided in SEC Memorandum Circular No. 11, amounted to P9,423.8 million and P7,895.7 million as at December 31, 2014 and 2013, respectively.
The Parent Company’s cash dividend declarations for 2014, 2013 and 2012 follow:
Declaration Date Record Date Payment Date
Cash Dividend
per Share
Total Cash
Dividends
Declared2014April 7 May 8 May 30 P0.75 P788,176,867November 12 November 27 December 18 0.89 945,305,674
P1.64 P1,733,482,541
2013April 11 May 7 May 30 P0.65 P680,017,923August 6 September 19 October 14 2.00 2,099,932,206November 12 November 29 December 16 0.71 745,597,226
P3.36 P3,525,547,355
2012April 12 May 9 May 31 P0.58 P602,206,230November 12 December 3 December 19 1.00 1,044,303,255November 12 December 3 December 19 0.62 647,468,018
P2.20 P2,293,977,503
An important part of Jollibee Group’s growth strategy is the acquisition of new businesses in the Philippines and abroad. Examples were acquisitions of 85% of Yonghe King in 2004 in PRC (P1,200.0 million), 100% of Red Ribbon in 2005 (P1,700.0 million), the remaining 20% minority share in Greenwich in 2007 (P384.0 million), the remaining 15% share of Yonghe King in 2007 (P413.7 million), 100% of Hong Zhuang Yuan restaurant chain in PRC in 2008 (P2,600.0 million), 70% of Mang Inasal in 2010 (P2,976.2 million), 100% of Chowking US Operations in 2011 (P693.3 million), 55% of San Pin Wang (P195.9 million plus a contingent consideration) and 48% of WJ Investments Limited (P98.0 million) in 2012.
The Jollibee Group plans to continue to make substantial acquisitions in the coming years. The Jollibee Group uses its cash generated from operations to finance these acquisitions and capital expenditures. These limit the amount of cash dividends that it can declare and pay, making the level of the retained earnings higher than the paid-up capital stock.
In support of the Jollibee Group’s strategy, the BOD approved the appropriation of P5,200.0 million and P3,800.0 million on April 11, 2013 and February 15, 2012, respectively, for future expansion and capital expenditure. Thus as at December 31, 2014 and 2013, the details of the appropriated retained earnings follow:
Projects Timeline AmountAcquisition of Businesses 2013 - 2018 P7,600,000,000Capital Expenditures 2013 - 2018 2,600,000,000
P10,200,000,000

79
The unappropriated retained earnings of the Parent Company is also restricted to the extent of cost of common stock held in treasury amounting to P180.5 million in both years as well as the undistributed retained earnings of its subsidiaries which amounted to P2,841.3 million and P629.2 million as at December 31, 2014 and 2013, respectively.
In relation with the SRC Rule 68, as Amended (2011), Annex 68-D, below is the summary of the Company’s track record of registration of securities.
2014 2013
Number
of shares
registered
Issue/offer
price
Date of
approval
Number of
holders of
securities as of
December 31
Number of
holders of
securities as of
December 31
Common shares 75,000,000 P9 June 21, 1993 3,173 3,244
20. ROYALTY, FRANCHISE FEES AND OTHERS
This account consists of:
2014 2013 2012Royalty fees P3,914,101,302 P3,470,663,663 P3,103,707,056Franchise fees 152,531,503 104,671,216 108,902,005Rent income (see Note 29) 90,642,833 97,500,225 93,552,079Service fees 78,544,132 86,040,358 69,925,324Other revenues 225,640,720 210,404,152 188,999,169
P4,461,460,490 P3,969,279,614 P3,565,085,633
The Jollibee Group has existing Royalty and Franchise Agreements with independent franchisees for the latter to operate quick service restaurant outlets under the “Jollibee”, “Chowking”, “Greenwich”, “Red Ribbon”, “Mang Inasal”, “Yong He King” and “Hong Zhuang Yuan” concepts and trade names. In consideration thereof, the franchisees agree to pay franchise fees and monthly royalty fees equivalent to a certain percentage of the franchisees’ net sales.
The franchisees also reimburse the Jollibee Group a share in the network advertising and promotional activities based on certain percentages of the former’s net sales.
21. COST OF SALES
This account consists of:
2014 2013 2012Cost of inventories P43,228,221,857 P38,227,726,820 P33,898,232,334Personnel costs: Salaries, wages and other employee
benefits 9,205,954,169 8,416,655,196 7,771,959,348 Pension expense (see Note 25) 119,911,904 102,196,339 57,928,961Rent (see Note 29) 6,671,204,628 5,962,800,559 5,499,468,204Electricity and other utilities 3,767,659,068 3,443,712,321 3,245,101,747Depreciation and amortization
(see Notes 12 and 13) 2,859,700,438 2,811,677,195 2,477,433,446Contracted services and professional fees 2,445,048,396 1,733,982,204 1,237,433,220Supplies 2,149,191,146 1,809,763,316 1,712,100,856Repairs and maintenance 943,277,853 809,564,647 666,242,481Security and janitorial 382,980,808 325,281,623 294,667,278Communication 151,658,421 135,038,254 119,488,497Entertainment, amusement and recreation 27,276,536 26,748,242 31,015,693Others 1,775,706,917 1,479,616,348 1,424,426,678
P73,727,792,141 P65,284,763,064 P58,435,498,743
22. GENERAL AND ADMINISTRATIVE EXPENSES
This account consists of:
2014 2013 2012Personnel costs: Salaries, wages and other employee benefits P4,675,596,092 P3,731,010,808 P3,104,737,878 Stock options expense (see Note 26) 166,490,888 150,418,741 76,984,373 Pension expense (see Note 25) 125,671,823 104,094,430 44,443,247Taxes and licenses 970,757,479 885,250,840 793,134,792Rent (see Note 29) 401,539,745 324,481,811 396,384,343Transportation and travel 393,123,071 339,949,959 299,910,571Professional fees 356,335,140 290,661,328 268,376,135Depreciation and amortization
(see Notes 12, 13 and 14) 326,679,292 260,778,625 228,192,916Contracted services 295,691,791 73,413,676 49,912,515Repairs and maintenance 105,738,442 88,207,428 43,774,873Communication 97,197,031 80,101,891 87,824,802Donations 88,575,310 92,513,001 68,199,176Entertainment, amusement and recreation 80,269,589 105,201,772 105,401,780Electricity and other utilities 64,955,121 51,858,492 58,686,416
(Forward)

80 NOTES TO CONSOLIDATED FINANCIAL STATEMENTS
2014 2013 2012Reversals of provision for impairment losses on: Receivables (see Note 7) (P868,308) P- P- Inventories (see Note 8) (8,489,305) - (13,316,722) Property, plant and equipment (see Note 12) (16,200,000) (13,300,000) - Investment properties (see Note 13) (46,447,298) - -Provision for impairment losses on: Receivables (see Note 7) 36,301,470 34,007,984 97,559,491 Inventories (see Note 8) 11,066,386 9,367,464 2,154,527 Property, plant and
equipment (see Note 12) 2,000,000 - 29,500,000 Investment properties - - 21,177,361 Security and other deposits - - 3,000,000Supplies 53,892,109 52,966,197 59,372,615Training 47,586,227 59,429,198 71,311,451Insurance 14,678,441 12,275,733 10,284,642Security and janitorial 14,613,774 18,596,895 22,168,913Corporate events and others 696,956,985 676,600,923 979,626,852
P8,953,711,295 P7,427,887,196 P6,908,802,947
23. INTEREST INCOME (EXPENSE) AND OTHER INCOME (EXPENSE)
2014 2013 2012Interest income: Cash and cash equivalents (see Note 6) P111,812,888 P145,624,891 P159,897,257 Accretion of interest on refundable deposits
and employee car plan receivables (see Note 15) 25,238,222 18,909,301 21,613,453 Loans and advances (see Note 11) 104,994,231 81,039,616 88,603,447
P242,045,341 P245,573,808 P270,114,157
Interest expense: Long-term debt (see Note 18) (P131,178,351) (P133,771,329) (P171,059,541) Short-term debt (see Note 18) (3,155,167) − (14,799,129) Accretion of interest on the liability and remeasurement of contingent consideration from acquisition of businesses and accretion of customers’ deposits (see Notes 11 and 16) (18,137,735) (19,148,699) (20,154,030)
(P152,471,253) (P152,920,028) (P206,012,700)
Other income (expense): Write-off of other liabilities P357,935,555 P97,044,819 P292,136,540 Rebates and suppliers’ incentives 258,778,135 122,379,003 76,099,289 Penalties and charges 27,448,182 17,438,114 16,063,313 Pre-termination of operating leases 25,797,871 13,058,342 43,765,252 Charges to franchisees 13,826,878 24,360,500 43,898,382 Other rentals 13,607,060 6,820,323 6,977,700 Foreign exchange gain (loss) - net (1,143,310) 46,628,738 (25,371,670) Insurance claims and others (36,946,445) 9,595,192 49,966,033
P659,303,926 P337,325,031 P503,534,839
24. INCOME TAXES
The Jollibee Group’s provision for current income tax consists of the following:
2014 2013 2012Final tax withheld on: Royalty and franchise fee income P868,377,737 P753,663,087 P691,731,651 Interest income 12,837,513 40,615,554 28,094,896RCIT: With itemized deduction 467,843,856 414,800,104 401,169,566 With optional standard deduction 207,318,757 175,871,530 156,164,621MCIT 138,390,687 135,539,174 –Dividend income − 1,477,233 –
P1,694,768,550 P1,521,966,682 P1,277,160,734
For the years ended December 31, 2014 and 2013, Zenith, Grandworth and RRBHI, wholly-owned subsidiaries, elected to use OSD in computing for its taxable income. The total tax benefits from the availment of OSD amounted to P67.0 million, P60.0 million and P47.8 million in 2014, 2013 and 2012, respectively.
The components of the Jollibee Group’s recognized net deferred tax assets follow:
2014 2013Deferred tax assets: Operating lease payables P223,282,139 P227,428,655 NOLCO: PRC-based entities 158,529,557 233,568,177 Philippine-based entities 128,403,747 77,033,807 Pension liability and other benefits 143,289,648 121,663,646 Accumulated impairment loss in value of receivables, property,
plant and equipment, investment properties, and other
nonfinancial assets 46,917,454 55,275,147 Excess of MCIT over RCIT 29,318,298 20,616,788 Unamortized past service costs 22,234,208 27,770,876 Unaccreted discount on security deposits and employee car
plan receivables 7,709,222 9,073,014 Unrealized foreign exchange loss 87,101 2,599,563 Others 7,776,928 7,513,467Total P767,548,302 P782,543,140Deferred tax liabilities: Unaccreted discount on product security deposit 5,989,024 8,110,116 Operating lease receivables 2,304,308 2,407,133 Deferred rent expense 1,954,470 3,742,190 Unrealized foreign exchange gain 225,174 1,968,063 Pension asset – 5,341,747 Others 5,110,008 4,777,031
15,582,984 26,346,280Deferred tax assets - net P751,965,318 P756,196,860

81
The components of the Jollibee Group’s recognized net deferred tax liabilities follow:
2014 2013Deferred tax assets: NOLCO - Philippine-based P258,019,288 P– Operating lease payables 188,905,938 184,292,117 Excess of MCIT over RCIT 131,039,374 2,204,170 Pension liability and other benefits 101,993,678 171,799,170 Unrealized foreign exchange loss 39,909,725 98,883,194 Unamortized past service costs 11,158,566 13,948,206 Accumulated impairment loss in value of property, plant
and equipment, investment properties, and other
nonfinancial assets 9,798,861 17,165,614 Unaccreted discount on security deposits and employee car
plan receivables 9,633,569 13,944,952 Provisions for legal claims 9,150,192 9,150,192 Allowance for impairment loss on receivables 7,849,611 22,688,381 Others 2,310 2,310
P767,461,112 P534,078,306Deferred tax liabilities: Excess of fair value over book value of identifiable assets of
acquired businesses 692,125,788 705,641,848 Unrealized foreign exchange gain 39,156,609 111,144,838 Prepaid rent 34,082,168 23,436,251 Deferred rent expense 9,531,966 9,531,966 Operating lease receivables – 22,926 Others 3,942,509 2,457,595
778,839,040 852,235,424Deferred tax liabilities – net P11,377,928 P318,157,118
The rollforward analysis of the net deferred tax assets and liabilities follows:
2014 2013Balance at beginning of year P438,039,742 P311,077,621Additions 424,239,011 (741,389)Application of excess of MCIT over RCIT – (1,874,880)Income tax effect of other remeasurements of
net defined benefit plan (106,374,133) 103,199,623Translation adjustments (15,317,230) 26,378,767
P740,587,390 P438,039,742
OSDThe availment of the OSD method also affected the recognition of several deferred tax assets and liabilities. Deferred tax assets and liabilities, for which the related income and expense are not considered in determining gross income for income tax purposes, are not recognized. This is because the manner by which the Jollibee Group expects to recover or settle the underlying assets and liabilities, for which the deferred tax assets and liabilities were initially recognized, would not result to any future tax consequence under the OSD method. Meanwhile, deferred tax assets and liabilities, for which the related income and expense are considered in determining gross income for income tax purposes, are recognized only to the extent of their future tax consequence under OSD method. Hence, the tax base
of these deferred tax assets and liabilities is reduced by the 40% allowable deduction provided for under the OSD method.
Accordingly, the Jollibee Group’s deferred tax assets and liabilities, which were not recognized due to the use of the OSD method in future years, are as follows:
2014 2013Deferred tax assets: Operating lease payables P12,037,179 P14,185,024 Pension liability 11,271,916 8,001,665 Allowance for impairment losses on: Receivables 3,963,705 3,963,705 Inventories – 25,858 Investment properties – 10,334,189 Other noncurrent assets – 3,676,834 Unamortized past service cost 505,008 627,013 Unaccreted discount on financial instruments 261,468 350,016 Others 118,378 118,378
28,157,654 41,282,682Deferred tax liabilities: Operating lease receivables 6,518,762 8,300,360 Deferred rent expense 133,167 201,113 Others 249,331 247,985
6,901,260 8,749,458P21,256,394 P32,533,224
As at December 31, 2014, NOLCO and excess of MCIT over RCIT of the Philippine-based entities that can be claimed as deductions from taxable income and income tax due, respectively, are as follows:
Year Incurred/Paid
Carry Forward
Benefit up to NOLCO
Excess of
MCIT over RCIT2014 December 31, 2017 P1,031,297,427 P137,536,7142013 December 31, 2016 121,422,688 16,383,798 2012 December 31, 2015 135,356,669 6,437,160
P1,288,076,784 P160,357,672
The PRC enterprise income tax law provides that income tax rates are unified at 25%. As at December 31, 2014, NOLCO of the PRC-based entities that can be claimed as deductions from taxable income are as follows:
Year Incurred
Carry Forward
Benefit Up to Tax Losses
Deferred Tax
at 25%2014 December 31, 2019 P197,014,877 P49,253,7192013 December 31, 2018 147,385,367 36,846,3422012 December 31, 2017 205,671,911 51,417,9782011 December 31, 2016 77,013,285 19,253,3212010 December 31, 2015 7,032,792 1,758,198
P634,118,232 P158,529,558

82 NOTES TO CONSOLIDATED FINANCIAL STATEMENTS
The reconciliation of provision for income tax computed at the statutory income tax rates to provision for income tax as shown in the consolidated statements of comprehensive income are as follows:
2014 2013 2012Provision for income tax at statutory
income tax rates P2,027,841,314 P1,873,654,379 P1,458,509,911Income tax effects of: Effect of different tax rate for royalty and
franchise fees and interest income (437,765,322) (395,069,768) (359,171,819) Intrinsic value of stock options
exercised (368,250,335) (109,909,193) – Difference between OSD and itemized
deductions (66,824,198) (54,787,415) (47,781,922) Net movement in unrecognized DTA (7,456,616) 2,540,695 (4,138,108) Nondeductible expenses 52,200,315 52,598,260 27,788,407 Expired/written off NOLCO and excess
of MCIT over RCIT 8,363,448 6,384,855 51,625,749 Unrecorded tax losses of BK Group 5,857,945 4,861,207 11,323,577 Others 56,562,988 142,435,051 11,548,256
P1,270,529,539 P1,522,708,071 P1,149,704,051
25. PENSION LIABILITY
Defined Benefit PlanThe Parent Company and certain Philippine-based subsidiaries have funded, non-contributory defined benefit pension plan covering all permanent employees. The benefits are based on employees’ projected salaries and number of years of service.
The funds are administered by a trustee bank. Subject to the specific instructions provided by Jollibee Group in writing, the Jollibee Group directs the trustee bank to hold, invest, and reinvest the funds and keep the same invested, in its sole discretion, without distinction between principal and income in, but not limited to, certain government securities and bonds, term loans, short-term fixed income securities and other loans and investments.
Under the existing regulatory framework, Republic Act 7641 requires a provision for retirement pay to qualified private sector employees in the absence of any retirement plan in the entity, provided however that the employees’ retirement benefits under any collective bargaining and other agreements shall not be less than those provided under the law. The law does not require minimum funding of the plan.
The following tables summarize the components of provision for pension expense, included under “Cost of sales” and “General and administrative expenses” accounts in the consolidated statements of comprehensive income and “Pension liability” account in the consolidated statements of financial position, which are based on the latest actuarial valuation.
Changes in pension liability of the Jollibee Group in 2014 are as follows:
Present Value
of Defined
Benefit
Obligation
Fair Value
of Plan Assets
Pension
LiabilityAt January 1, 2014 P2,405,920,441 P1,473,079,332 P932,841,109Pension expense (see Notes 21 and 22): Current service cost 195,996,581 – 195,996,581 Net interest 125,947,807 76,360,661 49,587,146
321,944,388 76,360,661 245,583,727Benefits paid (144,682,477) (144,682,477) –Remeasurements in other comprehensive
income: Return on plan assets (excluding
amount included in net interest) – 104,557,655 (104,557,655) Actuarial changes arising from changes
in financial assumptions 224,517,003 – 224,517,003 Actuarial changes due to experience
adjustment (478,487,633) – (478,487,633)(253,970,630) 104,557,655 (358,528,285)
Contributions – 58,300,000 (58,300,000)Other adjustments – (70,793,699) 70,793,699At December 31, 2014 P2,329,211,722 P1,496,821,472 P832,390,250
Changes in pension liability of the Jollibee Group in 2013 are as follows:
Present Value
of Defined
Benefit
Obligation
Fair Value
of Plan Assets
Pension
LiabilityAt January 1, 2013 P1,879,417,452 P1,357,838,850 P521,578,602Pension expense (see Notes 21 and 22): Current service cost 162,902,800 – 162,902,800 Net interest 120,486,015 80,944,803 39,541,212 Adjustments due to curtailment 3,846,757 – 3,846,757
287,235,572 80,944,803 206,290,769Benefits paid (169,833,368) (143,509,013) (26,324,355Remeasurements in other comprehensive
income: Return on plan assets (excluding
amount included in net interest) – 58,504,692 (58,504,692) Actuarial changes arising from changes
in financial assumptions 159,546,177 – 159,546,177 Actuarial changes due to experience
adjustment 249,554,608 – 249,554,608409,100,785 58,504,692 350,596,093
Contributions – 119,300,000 (119,300,000)At December 31, 2013 P2,405,920,441 P1,473,079,332 P932,841,109

83
The maximum economic benefit available is a combination of expected refunds from the plan and reductions in future contributions.
The following table presents the estimated fair values of the assets of the plan:
2014 2013Cash and cash equivalents P122,140,365 P152,755,806Investments in government and corporate debt securities 1,116,827,875 973,525,894Investments in quoted equity securities Holding firms 95,898,420 95,381,636 Property 65,193,429 63,636,911 Food, beverage and tobacco 64,476,681 58,864,127 Banks 43,416,176 30,966,661 Electricity, energy, power and water 29,694,338 12,337,971 Telecommunications 24,632,600 48,697,750 Others 26,584,565 31,985,361Interest and dividends receivable 15,445,663 30,984,022Fund liabilities (107,488,640) (26,056,807)
P1,496,821,472 P1,473,079,332
The plan’s assets and investments consist of the following:
Investments in government securities which consist of retail treasury bonds that bear interest ranging from 2.35%-8.13% and have maturities from February 2015 to August 2037 and fixed-rate treasury notes that bear interest ranging from 2.88%-11.70% and have maturities from September 2016 to October 2037.
Investments in equity securities consist of listed equity securities including investment in equity securities of the Parent Company for certain retirement plans of the Jollibee Group (see Note 27).
Investments in debt securities consist of long-term corporate bonds in the power sector, which bear interest ranging from 6.30%-7.75% maturing from April 2017 to April 2037.
Other financial assets held by the retirement plan are primarily accrued interest income on cash and cash equivalents, debt instruments and other securities.
Pension costs as well as the present value of the pension liability are determined using actuarial valuations. The actuarial valuation involves making various assumptions. The principal assumptions used in determining pension for the defined benefit plans are shown below:
December 31,
2014
December 31,
2013
January 1,
2013Discount rate 4.60% - 4.70% 5.00% - 6.00% 5.70% - 6.30%Salary increase rate 7.00% 6.50% - 7.11% 7.00% - 7.50%
The sensitivity analysis below has been determined based on reasonably possible changes of each significant assumption on the defined benefit obligation as of the end of the reporting period, assuming if all other assumptions were held constant:
December 31, 2014Increase
(Decrease)
Philippine
PlanDiscount rates +0.50 basis points (757,777,465)
-0.50 basis points 1,029,419,507
Future salary increases +0.50% 1,015,034,231-0.50% (778,272,017)
Shown below is the maturity analysis of the undiscounted benefit payments as at December 31, 2014:
Less than 1 year P125,937,856More than 1 year to 5 years 539,415,516More than 5 years to 10 years 1,179,774,525More than 10 years to 15 years 1,811,548,405More than 15 years to 20 years 2,059,412,925More than 20 years 7,110,256,644
The Jollibee Group does not have a formal asset-liability matching strategy. The overall investment policy and strategy of the retirement plan is based on the client suitability assessment, as provided by its trustee bank, in compliance with the Bangko Sentral ng Pilipinas requirements. It does not, however, ensure that there will be sufficient assets to pay the retirement benefits as they fall due while attempting to mitigate the various risks of the plan.
The plan assets are primarily exposed to financial risks such as liquidity risk and price risk. Liquidity risk pertains to the plan’s ability to meet its obligation to the employees upon retirement. To effectively manage liquidity risk, the trustee bank maintains assets in cash and short-term deposits. Price risk pertains mainly to fluctuation in market prices of the retirement funds marketable securities. In order to effectively manage price risk, the trustee bank continuously assesses these risks by closely monitoring the market value of the securities and implementing prudent investment strategies.
The Jollibee Group expects to contribute P125.9 million to the defined benefit pension plans in 2015.
The average duration of the defined benefit obligation is 10 years as at December 31, 2014 and 2013.
Defined Contribution PlanThe employees of the PRC-domiciled and USA-based subsidiaries of the Jollibee Group are members of a state-managed pension benefit scheme operated by the national governments. These subsidiaries are required to contribute a specified percentage of their payroll costs to the pension benefit scheme to fund the benefits. The only obligation of these subsidiaries with respect to the pension benefit scheme is to make the specified contributions.
The contributions made to the scheme and recognized as part of other employee benefits amounted to P354.4 million, P156.8 million and P280.2 million in 2014, 2013 and 2012, respectively (see Notes 21 and 22).

84 NOTES TO CONSOLIDATED FINANCIAL STATEMENTS
26. STOCK OPTION PLANS
Senior Management Stock Option and Incentive PlanOn December 17, 2002, the SEC approved the exemption requested by the Jollibee Group on the registration requirements of the 101,500,000 options underlying the Parent Company’s common shares to be issued pursuant to the Jollibee Group’s Senior Management Stock Option and Incentive Plan (the Plan). The Plan covers selected key members of management of the Jollibee Group, certain subsidiaries and designated affiliated entities.
The Plan is divided into two programs, namely, the Management Stock Option Program (MSOP) and the Executive Long-term Incentive Program (ELTIP). The MSOP provides a yearly stock option grant program based on company and individual performance while the ELTIP provides stock ownership as an incentive to reinforce entrepreneurial and long-term ownership behavior of executive participants.
MSOP. The MSOP is a yearly stock option grant program open to members of the corporate management committee of the Jollibee Group and members of the management committee, key talents and designated consultants of some of the business units.
Each MSOP cycle refers to the period commencing on the MSOP grant date and ending on the last day of the MSOP exercise period. Vesting is conditional on the employment of the employee-participants to the Jollibee Group within the vesting period. The options will vest at the rate of one-third of the total options granted on each anniversary of the MSOP grant date until the third anniversary.
The exercise price of the stock options is determined by the Jollibee Group with reference to prevailing market prices over the three months immediately preceding the date of grant for the 1st up to the 7th MSOP cycle. Starting with the 8th MSOP cycle, the exercise price of the option is determined by the Jollibee Group with reference to the market closing price as at date of grant.
The stock options expire eight years after grant date. The Jollibee Group does not pay cash as a form of settlement.
On July 1, 2004, the Compensation Committee of the Jollibee Group granted 2,385,000 options under the 1st MSOP cycle to eligible participants. The options will vest at the rate of one-third of the total options granted from the start of the grant date on each anniversary date which will start after a year from the MSOP grant date. One-third of the options granted, or 795,000 options vested and may be exercised starting July 1, 2005 and expired on June 30, 2012. On July 1, 2005 to 2014, the Compensation Committee granted series of MSOP grants under the 2nd to 11th MSOP cycle to eligible participants. The options vest similar to the 1st MSOP cycle. The second and third MSOP cycles expired in June 30, 2013 and 2014, respectively.
The movements in the number of stock options outstanding and related weighted average exercise prices (WAEP) are as follows:
2014 2013 2012 Number of
Options WAEP
Number of
Options WAEP
Number of
Options WAEPTotal options granted as at end of year 36,863,194 P73.58 33,404,194 P62.69 29,808,694 P53.07
Outstanding at beginning of year 16,915,937 P83.77 16,788,056 P63.90 17,505,395 P52.39Options granted during the year 3,459,000 178.66 3,595,500 142.51 3,018,030 107.90Options exercised during the year (6,765,662) 63.57 (3,373,561) 46.34 (3,375,915) 41.80
Options forfeited during the year –
– (94,058) 74.45 (359,454) 80.52Outstanding at end of year 13,609,275 117.51 16,915,937 83.77 16,788,056 63.90
Exercisable at end of year 6,865,265 P79.42 10,216,427 P57.83 10,367,798 P45.83
The weighted average share price is P181.34, P143.27 and P103.41 in 2014, 2013 and 2012, respectively. The weighted average remaining contractual life for the stock options outstanding as of December 31, 2014, 2013 and 2012 is 5.83 years, 4.83 years and 4.66 years, respectively.
The weighted average fair value of stock options granted in 2014, 2013 and 2012 is P32.39, P30.55 and P23.43, respectively. The fair value of share options as at the date of grant is estimated using the Black-Scholes Option Pricing Model, taking into account, the terms and conditions upon which the options were granted. The option style used for this plan is the American style because this option plan allows exercise before the maturity date. The inputs to the model used for the options granted on the dates of grant for each MSOP cycle are shown below:
MSOP Cycle Year of GrantDividend Yield
Expected
Volatility
Risk-free
Interest
Rate
Expected
Life of
the Option
Stock Price
on Grant
Date
Exercise
Price1st 2004 1.72% 36.91% 6.20% 5-7 years P24.00 P20.002nd 2005 1.72% 36.91% 6.20% 5-7 years 29.00 27.503rd 2006 1.72% 36.91% 6.20% 5-7 years 35.00 32.324th 2007 1.70% 28.06% 6.41% 3-4 years 52.50 50.775th 2008 1.80% 26.79% 8.38% 3-4 years 34.00 39.856th 2009 2.00% 30.37% 5.28% 3-4 years 48.00 45.457th 2010 2.00% 29.72% 5.25% 3-4 years 70.00 57.778th 2011 2.00% 34.53% 4.18% 3-4 years 89.90 89.909th 2012 2.00% 28.72% 3.50% 3-4 years 107.90 107.9010th 2013 2.00% 29.38% 2.68% 3-4 years 145.00 145.0011th 2014 2.00% 24.87% 2.64% 3-4 years 179.80 179.80
The expected life of the stock options is based on historical data and current expectations and is not necessarily indicative of exercise patterns that may occur. The expected volatility reflects the assumption that the historical volatility over a period similar to the life of the options is indicative of future trends, which may also not necessarily be the actual outcome.
ELTIP. The ELTIP entitlement is given to members of the corporate management committee.
Each ELTIP cycle refers to the period commencing on the ELTIP entitlement date and ending on the last day of the ELTIP exercise period. Actual grant and vesting is conditional upon achievement of the Jollibee Group’s minimum medium to long-term goals and individual targets in a given period, and the

85
employment of the employee-participants to the Jollibee Group within the vesting period. If the goals are achieved, the options will be granted. Starting with the 3rd ELTIP cycle, a percentage of the options to be granted are based on the percentage of growth in annual earnings per share such that 100%, 50% or 25% of the options granted when percentage of growth in annual earnings per share are 12% and above, 10% to less than 12% or 8% to less than 10%, respectively.
The exercise price of the stock options is determined by the Jollibee Group with reference to prevailing market prices over the three months immediately preceding the date of entitlement.
The Jollibee Group does not pay cash as a form of settlement. Starting with the 3rd ELTIP cycle, the exercise price of the option is determined by the Jollibee Group with reference to the closing market price as of the date of grant.
On July 1, 2004, the Compensation Committee gave an entitlement of 22,750,000 options under the 1st ELTIP cycle to eligible participants. The options will vest at the rate of one-third of the total options granted on each anniversary date which will start after a year of the ELTIP grant date. One-third of the options granted, or 7,583,333 options, vested and may be exercised starting July 1, 2007 and expired on June 30, 2012. On July 1, 2008 and October 19, 2012, a total entitlement of 20,399,999 and 24,350,000 options was given to eligible participants under the 2nd and 3rd ELTIP cycle, respectively.
The movements in the number of stock options outstanding for the 2nd and 3rd ELTIP cycles and related WAEP for the years ended December 31, 2014, 2013 and 2012 follow:
2014 2013 2012 Number of
Options WAEP
Number of
Options WAEP
Number of
Options WAEPTotal options given as at end of year 67,499,999 P56.66 67,499,999 P56.66 66,749,999 P56.12
Outstanding at beginning of year 37,186,110 P82.51 37,811,665 P80.51 27,674,569 P32.52Options granted during the year − − 750,000 105.00 23,600,000 105.00Options exercised during the year (5,665,977) 39.85 (1,375,555) 39.85 (12,962,905) 24.19Options forfeited during the year (249,573) 105.00 − − (499,999) 39.85Outstanding at end of year 31,270,560 P90.06 37,186,110 P82.51 37,811,665 P80.51
Exercisable at end of year 7,170,133 P39.85 12,836,110 P39.85 7,411,665 P39.85
The weighted average remaining contractual life for the stock options outstanding as of 2014, 2013 and 2012 is 4.85 years, 5.30 years and 5.68 years, respectively.
The fair value of stock options granted is P22.96 in 2014 and 2013. The fair value of share options as at the date of grant is estimated using the Black-Scholes Option Pricing Model, taking into account the terms and conditions upon which the options were granted. The option style used for this plan is the American style because this option plan allows exercise before the maturity date. The stock options granted under the 2nd and 3rd ELTIP cycles will expire on April 30, 2017 and 2020, respectively. The inputs to the model used for the options granted on the dates of grant for each ELTIP cycle is shown below:
ELTIP Cycle Year of GrantDividend
YieldExpected Volatility
Risk-free Interest Rate
Expected Life of
the Option
Stock Price on Grant
DateExercise
Price1st 2004 1.72% 36.91% 6.20% 5 years P24.00 P20.002nd 2008 1.80% 26.79% 8.38% 3-4 years 34.00 39.853rd 2012 2.00% 28.74% 3.60% 3-4 years 105.00 105.00
The expected life of the stock options is based on historical data and current expectations and is not necessarily indicative of exercise patterns that may occur. The expected volatility reflects the assumption that the historical volatility over a period similar to the life of the options is indicative of future trends, which may also not necessarily be the actual outcome.
The cost of the stock options expense charged to operations under “General and administrative expenses” account amounted to P166.5 million, P150.4 million and P77.0 million in 2014, 2013 and 2012, respectively (see Note 22). Correspondingly, a credit was made to additional paid-in-capital.
27. RELATED PARTY TRANSACTIONS
The Jollibee Group has transactions with related parties. Enterprises and individuals that directly, or indirectly through one or more intermediaries, control or are controlled by, or under common control with the Jollibee Group, including holding companies, subsidiaries and fellow subsidiaries are related entities of the Jollibee Group. Individuals owning, directly or indirectly, an interest in the voting power of the Jollibee Group that give them significant influence over the enterprise; key management personnel, including directors and officers of the Jollibee Group, and close members of the family of these individuals and companies associated with these individuals also constitute related entities.
Compensation of Key Management Personnel of the Jollibee GroupThe aggregate compensation and benefits to key management personnel of the Jollibee Group in 2014, 2013 and 2012 are as follows:
2014 2013 2012Salaries and short-term benefits P687,549,458 P584,663,115 P442,497,940Stock options expense (see Note 26) 166,490,888 150,418,741 76,984,373Net pension expense 59,134,502 46,292,773 41,900,346Employee car plan and other long-term
benefits 41,335,689 34,443,875 28,405,255P954,510,537 P815,818,504 P589,787,914
Transactions with the Retirement PlansAs at December 31, 2014 and 2013, certain retirement funds of the Jollibee Group include investment in equity securities of the Parent Company with details as follows:
2014 2013Number of shares 187,340 179,110
Cost P7,963,810 P6,503,796Market value 40,278,100 31,003,941Unrealized gain P32,314,290 P24,500,145
Transactions with a Joint VentureAs at December 31, 2014 and 2013, the Jollibee Group has outstanding advances to SuperFoods Group. The terms of these advances are disclosed in Note 11.

86 NOTES TO CONSOLIDATED FINANCIAL STATEMENTS
28. EARNINGS PER SHARE
Basic and diluted EPS are computed as follows:
2014 2013 2012(a) Net income attributable to the equity
holders of the Parent Company P5,361,978,768 P4,671,559,394 P3,727,084,297
(b) Weighted average number of shares -
basic 1,056,590,489 1,049,704,316 1,041,923,753 Weighted average number of shares
outstanding under the stock option
plan 51,249,701 54,309,458 33,470,157 Weighted average number of shares that
would have been purchased at fair
market value (25,692,236) (32,513,336) (14,521,214)(c) Adjusted weighted average shares -
diluted 1,082,147,954 1,071,500,438 1,060,872,696
EPS: Basic (a/b) P5.075 P4.450 P3.577 Diluted (a/c) 4.955 4.360 3.513
There were no anti-dilutive options outstanding as at December 31, 2014 and 2013.
29. COMMITMENTS AND CONTINGENCIES
a. Operating lease commitments - Jollibee Group as lessee
The Jollibee Group has various operating lease commitments for quick service restaurant outlets and offices. The noncancellable periods of the leases range from 3 to 20 years, mostly containing renewal options. Some of the leases contain escalation clauses. The lease contracts on certain sales outlets provide for the payment of additional rentals based on certain percentages of sales of the outlets. Rent payments in accordance with the terms of the lease agreements amounted to P7,071.0 million, P6,294.7 million and P5,779.0 million in 2014, 2013 and 2012, respectively. Of the total rent payments, variable rent portion amounted to P1,322.5 million, P1,447.0 million, P1,277.1 million in 2014, 2013, and 2012, respectively.
The future minimum lease payments for the noncancellable periods of the operating leases follows:
2014 2013 2012Within one year P1,254,614,379 P2,500,831,215 P2,391,671,677After one year but not more than five
years 4,486,065,276 8,090,153,478 7,953,687,706More than five years 3,951,886,603 3,911,301,278 5,965,097,801
P9,692,566,258 P14,502,285,971 P16,310,457,184
Rent expense recognized on a straight-line basis amounted to P7,072.7 million, P6,287.3 million and P5,895.9 million in 2014, 2013 and 2012, respectively (see Notes 21 and 22). The difference of rent expense recognized under the straight-line method and the rent amounts due in accordance with the terms of the lease agreements amounting to P1.7 million and P7.4 million in 2014 and 2013, respectively, are charged to “Operating lease payables” account in the consolidated statements of financial position.
b. Operating lease commitments - Jollibee Group as lessor
The Jollibee Group entered into commercial property leases for its investment property units and various sublease agreements. Noncancellable periods of the lease range from 3 to 20 years, mostly containing renewal options. All leases include a clause to enable upward revision of the rent charges on an annual basis based on prevailing market conditions. Rent income in accordance with the terms of the lease agreements amounted to P92.6 million, P98.7 million and P97.8 million in 2014, 2013 and 2012, respectively.
The future minimum rent receivables for the noncancellable periods of the operating leases follows:
2014 2013 2012Within one year P5,332,376 P2,184,390 P25,350,190After one year but not more than five years 3,295,213 5,223,839 41,607,749More than five years – – 2,314,149
P8,627,589 P7,408,229 P69,272,088
Rent income recognized on a straight-line basis amounted to P90.6 million, P97.5 million and P93.6 million in 2014, 2013 and 2012, respectively (see Note 20). The difference of rent income recognized under the straight-line method and the rent amounts in accordance with the terms of the lease agreements amounting to P2.0 million and P1.2 million in 2014 and 2013, respectively, are included under “Operating lease receivables” account in the consolidated statements of financial position.
c. Contingencies
The Jollibee Group is involved in litigations, claims and disputes which are normal to its business. Management believes that the ultimate liability, if any, with respect to these litigations, claims and disputes will not materially affect the financial position and financial performance of the Jollibee Group. Thus, other than the provisions in Note 17, there were no other provisions made for contingencies.
30. FINANCIAL RISK MANAGEMENT OBJECTIVES AND POLICIES
The Jollibee Group’s principal financial instruments comprise of cash and cash equivalents and receivables. The main purpose of these financial instruments is to obtain financing for the Jollibee Group’s operations. The Jollibee Group has other financial assets and liabilities such as other noncurrent assets and trade payables and other current liabilities which arise directly from its operations.

87
The main risks arising from these financial instruments are credit risk and liquidity risk. The Jollibee Group does not engage in any long-term debt and foreign currency-denominated transactions that may cause exposure to interest rate risk and foreign currency risk, respectively. The policies for managing each of these risks are summarized as follows:
Equity Price RiskThe Jollibee Group is not exposed to significant equity price risk on its investment in quoted equity securities consisting of investment in club shares.
Interest Rate RiskInterest rate risk arises from the possibility that the fair value or future cash flows of a financial instruments will fluctuate because of changes in market interest rates.
The Jollibee Group’s exposure to interest rate risk relates primarily to long-term debt with floating interest rates. Floating rate financial instruments are subject to cash flow interest rate risk. The Jollibee Group’s interest rate exposure management policy centers on reducing the Company’s overall interest expense and exposure to changes in the interest rates.
To manage the interest rate risk related to the Company’s long-term debt, the Company uses a derivative instrument to fix the interest rate over the term of the debt (see Note 18).
There is minimal exposure on the other sources of the Jollibee Group’s interest rate risk. These other sources are from the Jollibee Group’s cash in bank, short-term deposits, refundable deposits and employees’ car plan receivables.
The following table demonstrates the sensitivity to a reasonably possible change in interest rates, with all other variables held constant, of the Company’s equity as at December 31, 2014 and 2013. The impact on the Company’s equity is due to changes in the fair value of cross-currency swaps designated as cash flow hedges.
Derivative Instrument
Increase/ Decrease
in Basis Points
Effect in Profit or Loss Before
Income Tax
Effect in Equity Before Income Tax
2014USD +100 (P203) (P110,192)
-100 215 (114,914)
PHP +100 (26,800) (4,927,786) -100 27,802 5,138,954
Increase/ Decrease
in Basis Points
Effect in Profit or Loss Before
Income Tax
Effect in Equity Before
Income Tax2013USD +100 (P101,186) (P110,395)
-100 109,430 115,129
PHP +100 (4,522,944) (4,900,986)-100 4,877,210 5,111,152
Long-term Debt with Floating Interest Rates
Increase/ Decrease
in Basis Points
Effect in Profit or Loss Before
Income Tax2014USD +100 (P27,010,880)
-100 27,010,880
PHP +100 (22,903,970)-100 22,903,970
Increase/ Decrease
in Basis Points
Effect in Profit or Loss Before
Income Tax2013USD +100 (P27,524,900)
-100 27,524,900
PHP +100 (14,925,000)-100 14,925,000
Foreign Currency RiskThe Jollibee Group’s exposure to foreign currency risk arises from the Parent Company’s investments outside the Philippines, which are mainly in PRC and USA. While the foreign businesses have been rapidly growing, the net assets of foreign businesses account for only 9.12% and 10.84% of the consolidated net assets of the Jollibee Group as at December 31, 2014 and 2013, respectively.
The Jollibee Group also has transactional foreign currency exposures. Such exposure arises from the Jollibee Group’s Philippine operations’ cash and cash equivalents, receivables and long-term debt in foreign currencies.
The following table shows the Jollibee Group’s Philippine operations’ foreign currency-denominated monetary assets and liabilities and their peso equivalents as at December 31:
2014 2013
USD RMB
PHP
Equivalent USD RMB
PHP
EquivalentAssetsCash and cash equivalents 814,608 8,074 36,487,269 1,095,583 8,074 48,697,439Receivables 291,896 – 13,053,586 388,260 – 17,236,812LiabilityLong-term debt (3,400,000) – (152,048,000) (3,400,000) – (150,943,000)Net exposure (2,293,496) 8,074 (102,507,145) (1,916,157) 8,074 (85,008,749)
Foreign Currency Risk Sensitivity AnalysisThe Jollibee Group has recognized in its profit or loss, foreign currency exchange gain (loss) included under “Other income” account which amounted to (P2.3 million), P46.6 million and (P25.4 million) on its net foreign currency-denominated assets in 2014, 2013 and 2012, respectively (see Note 23).

88 NOTES TO CONSOLIDATED FINANCIAL STATEMENTS
This resulted from the movements of the Philippine peso against the USD and RMB as shown in the following table:
Peso to USD RMB
December 31, 2014 44.72 7.18December 31, 2013 44.40 7.31
The following table demonstrates the sensitivity to a reasonably possible change in USD and RMB to Philippine peso exchange rate, with all other variables held constant, of the Jollibee Group’s income before income tax (due to changes in the fair value of monetary assets and liabilities) as at December 31:
2014 2013
Appreciation (Depreciation) of P against Foreign Currency
Effect on Income
before Income Tax
Effect on Equity before
Income Tax
Effect on Income
before Income Tax
Effect on Equity before
Income Tax(In Thousands)
USD1.50 (P3,440) (P3,440) (P2,874) (P2,874)
(1.50) 3,440 3,440 2,874 2,8741.00 (2,293) (2,293) (1,916) (1,916)
(1.00) 2,293 2,293 1,916 1,916RMB
0.95 7.7 7.7 7.7 7.7(0.95) (7.7) (7.7) (7.7) (7.7)0.63 5.1 5.1 5.1 5.1
(0.63) (5.1) (5.1) (5.1) (5.1)
Credit RiskCredit risk is the risk that a customer or counterparty fails to fulfill its contractual obligations to the Jollibee Group. This includes risk of non-payment by borrowers and issuers, failed settlement of transactions and default on outstanding contracts.
The Jollibee Group has a strict credit policy. Its credit transactions are with franchisees and customers that have gone through rigorous screening before granting them the franchise. The credit terms are very short, while deposits and advance payments are also required before rendering the service or delivering the goods, thus, mitigating the possibility of non-collection. In cases of non-collection, defaults of the debtors are not tolerated; the exposure is contained the moment a default occurs and transactions that will increase the exposure of the Jollibee Group are not permitted.
The Jollibee Group has no significant concentration of credit risk with counterparty. The Jollibee Group’s franchisee profile is such that no single franchisee accounts for more than 5% of the total system wide sales of the Jollibee Group.
The aging analysis of loans and receivables as at December 31 are as follows:
2014Neither
Past
Due nor Past Due but not Impaired (Age in Days)Total Impaired 1-30 31-60 61-120 Over 120 Impaired
(In Millions)Cash and cash equivalents* P7,214.8 P7,214.8 P– P– P– P– P–
Receivables: Trade 7,479.2 2,914.9 1,771.6 808.0 940.2 835.6 208.9 Employee car plan receivables** 195.6 195.6 – – – – – Advances to employees 157.1 157.1 – – – – – Other receivables*** 121.6 121.6 – – – – –Other noncurrent assets: Security and other deposits 1,522.9 1,522.9 – – – – – Operating lease receivables 21.1 21.1 – – – – –
16,712.3 12,148.0 1,771.6 808.0 940.2 835.6 208.9AFS Financial Assets 21.5 21.5 – – – – –
P16,733.8 P12,169.5 P1,771.6 P808.0 P940.2 P835.6 P208.9
2013Neither
Past
Due nor Past Due but not Impaired (Age in Days)Total Impaired 1-30 31-60 61-120 Over 120 Impaired
(In Millions)Cash and cash equivalents* P9,683.9 P9,683.9 P– P– P– P– P–Receivables: Trade 3,128.4 1,782.3 294.3 92.3 91.0 594.0 274.5 Employee car plan receivables** 139.4 139.4 – – – – – Advances to employees 112.2 112.2 – – – – – Other receivables*** 76.8 76.8 – – – – –Other noncurrent assets: Security and other deposits 1,360.2 1,360.2 – – – – – Operating lease receivables 21.3 21.3 – – – – –
14,522.2 13,176.1 294.3 92.3 91.0 594.0 274.5AFS Financial Assets 21.5 21.5 – – – – –
P14,543.7 P13,197.6 P294.3 P92.3.0 P91.0 P594 P274.5
***Excluding cash on hand amounting to P 403.7 million and P 220.0 million in 2014 and 2013, respectively.***Including noncurrent portion of employee car plan receivables.
***Excluding receivables from government agencies amounting to P 6.9 million and P 6.6 million in 2014 and 2013, respectively.

89
Credit Risk Exposure. The table below shows the maximum exposure to credit risk of the Jollibee Group as at December 31, without considering the effects of collaterals and other credit risk mitigation techniques:
2014
Gross Maximum
Exposure
(a)
Fair Value and
Financial Effect of
Collateral or
Credit
Enhancement
(b)
Net Exposure
(c) = (a) - (b)(In Millions)
Financial AssetsCash and cash equivalents* P7,214.8 P149.6 P7,065.2**Receivables: Trade 7,479.2 197.6 7,281.6*** Employee car plan receivables 195.6 – 195.6 Advances to employees 157.1 – 157.1 Other receivables**** 121.6 – 121.6Other noncurrent assets: Security and other deposits 1,522.9 – 1,522.9
Operating lease receivables 21.1 – 21.1AFS financial asset 21.5 – 21.5
P16,733.8 P347.2 P16,386.6
2013
Gross Maximum
Exposure
(a)
Fair Value and
Financial Effect of
Collateral or Credit
Enhancement
(b)
Net Exposure
(c) = (a) - (b)(In Millions)
Financial AssetsCash and cash equivalents* P9,683.9 P129.1 P9,554.8**Receivables: Trade 3,128.4 96.8 3,031.6*** Employee car plan receivables 139.4 – 139.4 Advances to employees 112.2 – 112.2 Other receivables**** 76.8 – 76.8Other noncurrent assets: Security and other deposits 1,360.2 – 1,360.2
Operating lease receivables 21.3 – 21.3AFS financial asset 21.5 – 21.5
P14,543.7 P225.9 P14,317.8
**** Excluding cash on hand amounting to P 403.7 million and P 220.0 million in 2014 and 2013, respectively.**** Gross financial assets after taking into account insurance bank deposits for cash and cash equivalents.**** Gross financial assets after taking into account payables to the same counterparty.
**** Excluding receivables from government agencies amounting to P 6.9 million and P 6.6 million in 2014 and 2013, respectively.
With respect to credit risk arising from financial assets of the Jollibee Group, the Jollibee Group’s exposure to credit risk arises from default of the counterparty, with a maximum exposure equal to the carrying amount of these instruments.
Credit Quality. The tables below show the credit quality by class of financial assets that are neither past due nor impaired, based on the Jollibee Group’s credit rating system as at December 31, 2014 and 2013.
2014Neither Past Due nor Impaired Past Due or
ImpairedTotal A B C(In Millions)
Receivables Trade P7,479.2 P2,216.8 P562.3 P135.8 P4,564.3 Employee car plan receivables* 195.6 195.6 – – – Advances to employees 157.1 157.1 – – – Other receivables** 121.6 121.6 – – –AFS financial asset 21.5 21.5 – – –
P7,975.0 P2,712.6 P562.3 P135.8 P4,564.3
2013Neither Past Due nor Impaired Past Due or
ImpairedTotal A B C(In Millions)
Receivables Trade P3,128.4 P1,171.2 P539.5 P71.6 P1,346.1 Employee car plan receivables* 139.4 139.4 – – – Advances to employees 112.2 112.2 – – – Other receivables** 76.8 76.8 – – –AFS financial asset 21.5 21.5 – – –
P3,478.3 P1,521.1 P539.5 P71.6 P1,346.1
*Including noncurrent portion of employee car plan receivables.
**Excluding receivables from government agencies amounting to P 6.9 million and P 6.6 million in 2014 and 2013, respectively.
The credit quality of financial assets is managed by the Jollibee Group using internal credit ratings, as shown below:
A - For counterparty that is not expected by the Jollibee Group to default in settling its obligations, thus, credit risk exposure is minimal. This counterparty normally includes financial institutions, related parties and customers who pay on or before due date.
B - For counterparty with tolerable delays (normally from 1 to 30 days) in settling its obligations to the Jollibee Group. The delays may be due to cut-off differences and/or clarifications on contracts/billings.
C - For counterparty who consistently defaults in settling its obligation, but with continuing business transactions with the Jollibee Group, and may be or actually referred to legal and/or subjected to cash before delivery (CBD) scheme. Under this scheme, the customer’s credit line is suspended and all subsequent orders are paid in cash before delivery. The CBD status will only be lifted upon full settlement of the receivables and approval of management. Thereafter, the regular credit term and normal billing and collection processes will resume.

90 NOTES TO CONSOLIDATED FINANCIAL STATEMENTS
Liquidity RiskThe Jollibee Group’s exposure to liquidity risk refers to the risk that its financial liabilities are not serviced in a timely manner and that its working capital requirements and planned capital expenditures are not met. To manage this exposure and to ensure sufficient liquidity levels, the Jollibee Group closely monitors its cash flows.
On a weekly basis, the Jollibee Group’s Cash and Banking Team monitors its collections, expenditures and any excess/deficiency in the working capital requirements, by preparing cash position reports that present actual and projected cash flows for the subsequent week. Cash outflows resulting from major expenditures are planned so that money market placements are available in time with the planned major expenditure. In addition, the Jollibee Group has short-term cash deposits and has available credit lines with accredited banking institutions, in case there is a sudden deficiency. The Jollibee Group maintains a level of cash and cash equivalents deemed sufficient to finance the operations. No changes were made in the objectives, policies or processes of the Jollibee Group during the years ended December 31, 2014 and 2013.
The Jollibee Group’s financial assets, which have maturity of less than 12 months and are used to meet its short-term liquidity needs, are cash and cash equivalents and trade receivables amounting to P7,214.8 million and P7,479.2 million, respectively, as at December 31, 2014 and P9,683.9 million and P3,128.4 million, respectively, as at December 31, 2013.
The tables below summarize the maturity profile of the Jollibee Group’s financial liabilities based on the contractual undiscounted cash flows as at December 31:
2014Due and
DemandableLess than
1 Year 1 to 5 YearsOver
5 Years TotalFinancial LiabilitiesTrade payables and other
current liabilities* P- P12,742,389,003 P- P- P12,742,389,003Long-term debt (including
current portion) - 715,520,000 4,428,012,970 - 5,143,532,970Liability for acquisition of
businesses (including current portion) - 32,906,018 101,064,311 - 133,970,329
Operating lease payables - 142,438,494 486,815,789 915,591,908 1,544,846,191Total Financial Liabilities P- P13,633,253,515 P5,015,893,070 P915,591,908 P19,564,738,493
*Excluding other “Accrued salaries, wages and employee benefits”, “Output VAT and other local taxes” and “Unearned revenue from gift certificates.”
2013Due and
Demandable
Less than
1 Year 1 to 5 Years
Over
5 Years TotalFinancial LiabilitiesTrade payables and other
current liabilities* P- P11,035,616,216 P- P- P11,035,616,216Long-term debt (including
current portion) - 1,106,275,244 2,594,907,750 1,468,062,750 5,169,245,744Liability for acquisition of
businesses (including
current portion) - 107,666,875 129,007,932 - 236,674,807Operating lease payables - 144,730,977 494,650,869 929,689,615 1,569,071,461Total Financial Liabilities P- P12,394,289,312 P3,218,566,551 P2,397,752,365 P18,010,608,228
*Excluding other “Accrued salaries, wages and employee benefits”, “Output VAT and other local taxes” and “Unearned revenue from gift certificates.”
Capital ManagementCapital includes equity attributable to equity holders of the Parent Company.
The primary objective of the Jollibee Group’s capital management is to ensure that it maintains a strong credit rating and healthy capital ratios in order to support its business and maximize shareholder value. The Jollibee Group has sufficient capitalization.
The Jollibee Group generates cash flows from operations sufficient to finance its organic growth. It declares cash dividends representing about one-third of its consolidated net income, a ratio that would still leave some additional cash for future acquisitions. If needed, the Jollibee Group would borrow money for acquisitions of new businesses.
As at December 31, 2014 and 2013, the Jollibee Group’s debt ratio and net debt ratio are as follows:
Debt Ratio
2014 2013Total debt (a) P26,040,658,079 P22,665,694,036Total equity attributable to equity holders
of the Parent Company 27,190,326,655 22,548,878,780Total debt and equity attributable to equity
holders of the Parent Company (b) P53,230,984,734 P45,214,572,816
Debt ratio (a/b) 49% 50%
Net Debt Ratio
2014 2013Total debt P26,040,658,079 P22,665,694,036Less cash and cash equivalents 7,618,473,267 9,903,877,068Net debt (a) 18,422,184,812 12,761,816,968Total equity attributable to equity holders
of the Parent Company 27,190,326,655 22,548,878,780Net debt and equity attributable
to equity holders of the Parent Company (b) P45,612,511,467 P35,310,695,748
Net debt ratio (a/b) 40% 36%
31. FAIR VALUE OF FINANCIAL ASSETS AND LIABILITIES
The fair value of the financial assets and liabilities is included at the amount at which the instrument could be exchanged in a current transaction between willing parties, other than in a forced or liquidation sale.
Financial Instruments Whose Carrying Amounts Approximate Fair Value. Management has determined that the carrying amounts of cash and cash equivalents, receivables, trade payables and other current liabilities, short-term debt, current portion of due to related parties, current portion of liability for acquisition of a business, based on their notional amounts, reasonably approximate their fair values because of their short-term nature or due to the immaterial effect of discounting when the present value of future cash flows from these instruments are calculated.

91
AFS Financial Assets. The fair value of investments in quoted shares of stock is based on quoted prices. The Jollibee Group does not have the intention to dispose these financial assets in the near term.
Investment Properties. In determining the fair value of the investment properties, the market data approach has been used for land and the cost approach for buildings and building improvements. For land, fair value is based on sales and listings of comparable properties within the vicinity after adjustments for differences in location, size and shape of the lot, time elements and other factors between the properties and their comparable properties. For buildings and building improvements, fair value is based on the current cost of replacement of the properties in accordance with prevailing market prices for materials, labor, and contractors’ overhead, profit and fees in the locality after adjustments for depreciation due to physical deterioration, functional and economic obsolescence based on personal inspection of the buildings and building improvements and in comparison to similar new properties.
Security Deposits, Employee Car Plan Receivable, Long Term Debt and Derivative Liability. Management has determined that the estimated fair value of security and other deposits, noncurrent portion of employee car plan receivables, long-term debt and liability for acquisition of businesses are based on the discounted value of future cash flows using applicable rates as follows:
2014 2013Security and other deposits 0.48%-5.44% 0.23%–8.65%Employee car plan receivables 0.35%-9.37% 0.36%–8.84%Long term debt 1.48%-3.31% 1.18%-2.53%Derivative liability 0.96%-1.00% 0.93%-1.00%
The following table provides the fair value measurement hierarchy of the Jollibee Group’s recurring financial assets and liabilities.
Quantitative disclosure fair value measurement hierarchy for assets as at December 31, 2014:
Fair Value Measurement Using
Carrying Value Total
Quoted
Prices in
Active Markets
(Level 1)
Significant
Observable
Inputs
(Level 2)
Significant
Unobservable
Inputs
(Level 3)Assets measured at fair value: Available-for-sale financial
assets Quoted equity shares - club
shares P21,479,461 P21,479,461 P- P21,479,461 P-Assets for which fair values are
disclosed: Investment properties: 1,025,645,034 1,414,303,072 - 1,414,303,072 - Land 983,427,880 1,311,229,072 - 1,311,229,072 - Building 42,217,154 103,074,000 - 103,074,000 - Other noncurrent assets: Security and other deposits 1,522,942,799 1,545,877,698 - 1,545,877,698 - Employee car plan
receivables 130,234,889 139,690,838 - 139,690,838 -
Quantitative fair value measurement hierarchy for assets as at December 31, 2013:
Fair Value Measurement Using
Carrying Value Total
Quoted
Prices in
Active Markets
(Level 1)
Significant
Observable
Inputs
(Level 2)
Significant
Unobservable
Inputs
(Level 3)Assets measured at fair value: Available-for-sale financial
assets Quoted equity shares - club
shares P21,479,461 P21,479,461 P- P21,479,461 P-Assets for which fair values are
disclosed: Investment properties: 751,767,041 1,050,485,262 - 1,050,485,262 - Land 668,008,149 714,455,447 - 714,455,447 - Building 83,758,892 336,029,815 - 336,029,815 - Other noncurrent assets: Security and other deposits 1,360,230,842 1,414,161,439 - 1,414,161,439 - Employee car plan
receivables 106,011,234 116,155,190 - 116,155,190 -
Quantitative fair value measurement hierarchy for liabilities as at December 31, 2014:
Fair Value Measurement Using
Date of Valuation Total
Quoted Prices
in Active
Markets
(Level 1)
Significant
Observable
Inputs
(Level 2)
Significant
Unobservable
Inputs
(Level 3)
Liabilities measured at fair value:
Derivative liability December 31, 2014 P1,545,472 P- P1,545,472 P-
Contingent consideration December 31, 2014 72,176,257 - - 72,176,257
Long-term debt December 31, 2014 4,491,484,970 - 4,491,484,970 -
Liabilities disclosed at fair value:
Long-term debt December 31, 2014 147,297,754 147,297,754 -
Quantitative disclosure fair value measurement hierarchy for liabilities as at December 31, 2013:
Fair Value Measurement Using
Date of Valuation Total
Quoted Prices
in Active
Markets
(Level 1)
Significant
Observable
Inputs
(Level 2)
Significant
Unobservable
Inputs
(Level 3)
Liabilities measured at fair value:
Derivative liability December 31, 2013 P4,532,600 P- P4,532,600 P-
Contingent consideration December 31, 2013 71,651,719 - - 71,651,719
Long-term debt December 31, 2013 4,244,990,000 - 4,244,990,000 -
Liabilities disclosed at fair value:
Long-term debt December 31, 2013 920,360,179 - 920,360,179 -
There were no transfers between Level 1 and Level 2 fair value measurements, and no transfers into and out of Level 3 fair value measurements during the year.

92 NOTES TO CONSOLIDATED FINANCIAL STATEMENTS
Description of significant unobservable input to the measurement of the contingent consideration as at December 31, 2013 is as follows:
Valuation Technique
Significant
Unobservable Input Range of Input
Sensitivity of the
Input to
Fair ValueContingent
consideration
Multiple-scenario
weighted-probability
approach
Revenue growth
rate used to forecast
EBITDA
7.8% to 25.0% Increase (decrease) in
the discount would
increase (decrease) the
fair value.
32. EVENTS AFTER THE REPORTING PERIOD
Dividend DeclarationOn April, 7, 2015, the BOD approved a regular cash dividend of P0.80 a share of common stock to all stockholders of record as of May 7, 2015. Consequently, the cash dividend is expected to be paid out by May 29, 2015. The cash dividend is 6.7% higher than the P0.75 regular dividend a share declared in April 2014.
Loans AvailedParent Company. On January 14 and January 30, 2015, the Parent Company refinanced its short-term loans with a local bank amounting to P815.0 million and P1,050.0 million with fixed interest rates of 1.9% and 2.1%, respectively. The principal amounts were due on February 27, 2015. However, on due date, the Parent Company refinanced both loans to form a combined loan of P1,865.0 million with fixed interest rate of 2.4% payable on May 29, 2015.
On February 12, 2015, the Parent Company availed a short-term loan from a local bank amounting to P681.0 million with a fixed interest rate of 2.4%. The principal and interest were both due on March 30, 2015, original date of maturity. However, the principal was extended until June 30, 2015 with a new fixed interest rate of 2.5%.
JWPL. On February 12, 2015, JWPL availed a short-term loan from a local bank amounting to USD6.0 million (P266.2 million) with an interest rate of 1.5%, subject to monthly repricing. The principal is payable on February 5, 2016.
Zenith. On March 20, 2015, Zenith availed a short-term loan from a local bank amounting to P200.0 million with a fixed interest rate of 2.5%. The principal and interest are both payable on June 19, 2015, the date of maturity.
On March 27, 2015, Zenith availed a short-term loan from a local bank amounting to P170.0 million with a fixed interest rate of 2.5%. The principal and interest are both payable on June 26, 2015, the date of maturity.
Mang Inasal. On February 27, 2015, Mang Inasal availed a short-term loan from a local bank amounting to P315.0 million with a fixed interest rate of 2.4%. The principal and interest were both due on March 30, 2015, original date of maturity. However, the principal was extended until June 30, 2015 with a new fixed interest rate of 2.5%.
33. NON-CASH TRANSACTIONS
In 2013, the Jollibee Group’s principal non-cash transactions under investing activities pertains to the reclassification of trademark and patents under “Other noncurrent assets” account to “Intangible assets” account amounting to P9.8 million.
In 2013, the Jollibee Group’s principal non-cash transaction under financing activities pertains to the refinancing of Parent Company’s loan with a local bank amounting to P1,500.0 million within five (5) years and six (6) months from December 9, 2013.
There were no significant non-cash transactions in 2014.

COMPANY HEADQUARTERS10/F Jollibee Plaza Building
No. 10 F. Ortigas Jr. Avenue
Ortigas Center, Pasig City, Philipines 1605
Telephone: (632) 634-1111
Facsimile: (632) 633-9504
Website: www.jollibee.com.ph
COMMON STOCKJollibee’s common stock is listed and traded on the Philippine Stock Exchange with the
ticker symbol “JFC.” It is one of the companies which comprise the PSE Composite Index.
ANNUAL STOCKHOLDERS’ MEETINGThe Annual Stockholders’ Meeting will be held on June 26, 2015 at 2:00 P.M., (registration
starts at 1:00 P.M.) at the Philippine Stock Exchange Auditorium, Ground Floor, Philippine
Stock Exchange Centre, Exchange Road, Ortigas Center, Pasig City.
STOCKHOLDERS’ INQUIRIESInquiries regarding dividend payments, account status, address changes, stock
certificates and other pertinent matters may be addressed to the Company’s registrar
and transfer agent:
Rizal Commercial Banking Corporation
Stock Transfer Office
Ground Floor, West Wing
Grepalife Building
221 Senator Gil Puyat Avenue
Makati City
Telephone: (632) 892-4156
SEC FORM 17-AThe financial information in this report, in the opinion of Management, substantially
conforms with the information required in the “17-A Report” submitted to the Securities
and Exchange Commission. Copies of this report may be obtained free of charge upon
written request to the Office of the Corporate Secretary.
INVESTORS INFORMATION

Jollibee Foods CORPORATION10/F JOLLIBEE PLAZA BUILDING#10 F. ORTIGAS JR. AVE., ORTIGAS CENTERPASIG CITY, PHILIPPINES 1605