jessica instruments for solid waste management in greece · study final report - part 1 ... mrf...
TRANSCRIPT

JESSICA
JOINT EUROPEAN SUPPORT FOR
SUSTAINABLE INVESTMENT IN CITY AREAS
JESSICA Instruments for Solid Waste Management in Greece
STUDY
Final Report - Part 1
Analysis of Solid Waste Management in Greece
March 2010
This document has been produced with the financial assistance of the
European Union. The views expressed herein can in no way be taken to reflect the official opinion of the European Union.
EIB Study: JESSICA instruments for SWM in Greece: FINAL Report - Part 1
2
TABLE OF CONTENTS
1. BACKGROUND INFORMATION.............................................................. 8
1.1. Country Presentation..............................................................................8
1.2. Climate..................................................................................................9
1.3. Administrative Areas - Population ............................................................9
1.4. Population ...........................................................................................12
1.5. Solid Waste Management Over the Past Few Years ................................15
2. LEGAL FRAMEWORK OF WASTE MANAGEMENT IN GREECE...............17
2.1. Introduction.........................................................................................17
2.2. Historical Background...........................................................................17
2.3. Basic Legal Instruments on Waste Management in Greece......................19
2.3.1. Solid Waste Management Planning.................................................20
2.3.2. Non Hazardous Solid Waste...........................................................22
2.3.3. Packaging Waste and Special Streams............................................24
2.3.4. Hazardous Waste..........................................................................32
2.3.5. Medical Waste ..............................................................................33
2.4. Actors Involved in the Waste Management Sector ..................................34
2.4.1. Ministry of Environment, Energy and Climate Change......................34
2.4.2. Waste Management Inter-ministerial Committee.............................35
2.4.3. Funding........................................................................................36
2.4.4. Public Works.................................................................................36
2.4.5. Municipalities and Waste Management Authorities ..........................37
2.4.6. Hellenic Recovery Recycling Corporation ........................................38
2.4.7. Environmental Permit ....................................................................39
2.5. Maturity Plan & Environmental Licensing Procedure................................40
3. FUNDING OF WASTE MANAGEMENT INVESTMENTS ..........................46
3.1. NSRF 2007-2013 & Urban Development ................................................46
3.1.1. General Description of NSRF 2007-2013 .........................................46
3.1.2. Sectoral Operational Programmes ..................................................47
3.1.3. Regional Operational Programmes .................................................50
3.1.4. European Territorial Cooperation Programmes ................................51
3.1.5. Financial Framework – European Funds for Cohesion Policy.............53
EIB Study: JESSICA instruments for SWM in Greece: FINAL Report - Part 1
3
3.1.6. Environment & Sustainable Development .......................................54
3.2. Public – Private Partnerships (PPP) framework .......................................58
3.2.1. General Description.......................................................................58
3.2.2. SWM projects approved by PPP Committee.....................................59
3.2.3. Proposal to PPP Unit .....................................................................61
4. MSW GENERATION AND MANAGEMENT IN GREECE ..........................64
4.1. Introduction.........................................................................................64
4.2. MSW Current Generation and Composition.............................................64
4.2.1. MSW composition .........................................................................64
4.2.2. MSW Generation ...........................................................................66
4.3. Prediction of MSW future generation .....................................................68
4.3.1. Correlation between income and MSW generation...........................69
4.3.2. 3 Scenarios Analysis......................................................................76
4.4. Current MSW Management in Greece ....................................................80
4.4.1. Waste collection and transport.......................................................80
4.4.2. Waste Treatment and Disposal ......................................................80
4.5. Secondary Product Market ....................................................................86
4.5.1. Compost market ...........................................................................86
4.5.2. RDF- SRF market ..........................................................................88
4.5.3. Recyclable materials......................................................................89
4.6. MSW management tariff system............................................................92
5. MSW MANAGEMENT FUTURE PLANNING ...........................................94
5.1. Impact of EU Legislation.......................................................................94
5.2. Planned Facilities..................................................................................97
6. APPENDICES .....................................................................................100
EIB Study: JESSICA instruments for SWM in Greece: FINAL Report - Part 1
4
TABLE OF TABLES
Table 1: Greek Prefectures ..................................................................................10
Table 2: Greek Population over time ....................................................................12
Table 3: Greek Population for every Prefecture in 2001.........................................13
Table 4: Prediction of Greek Population growth until 2028 (Eurostat - convergence
scenario)............................................................................................................14
Table 5: Funding from structural funds for waste management facilities in Attiki and
Central Macedonia* ............................................................................................57
Table 6: MSW composition in Greece (J.M.D 50910/2727/03)................................65
Table 7: Composition of packaging waste in MSW in Greece..................................66
Table 8: Annual total MSW generation in Greece from 1995 until 2007 (Eurostat)...66
Table 9: Annual MSW generated quantities in Attiki and Thessaloniki.....................68
Table 10: MSW generated quantities per unit of income in EU (2007) ....................71
Table 11: Real GDP growth rate - Growth rate of GDP volume percentage change on
previous year (Eurostat)......................................................................................73
Table 12: Average Annual Growth of GDP in EU 2000-2009...................................75
Table 13: Central Scenario ..................................................................................77
Table 14: Min Scenario........................................................................................77
Table 15: Max Scenario.......................................................................................78
Table 16: MSW generation and treatment in Greece (1995 – 2007) .......................81
Table 17: Existing MBT Facilities in Greece (MRFs not included).............................84
Table 18: MSW Operating Results of the national packaging WM system................85
Table 19: Secondary products market average prices in Greece (2009)..................92
Table 20: Financial contribution to Municipalities for the collection of packaging
waste.................................................................................................................93
Table 21: Existing and Planned Waste Treatment Facilities in Greece (MRFs not
included)............................................................................................................98
EIB Study: JESSICA instruments for SWM in Greece: FINAL Report - Part 1
5
TABLE OF FIGURES
Figure 1: Greek Regions........................................................................................9
Figure 2: Geographical allocation of the Greek Prefectures ....................................10
Figure 3: Geographical allocation of the Greek R.O.Ps...........................................11
Figure 4: Schematic representation of the licensing process steps..........................44
Figure 5: Flow chart of the maturity procedure in case of project approval through
PPP Law (source: Ministry of Economy and Finance).............................................45
Figure 6: Allocation of the National Strategic Reference Framework funds..............56
Figure 7: MSW composition in Greece in 2007 (J.M.D 50910/2727/03)...................65
Figure 8: Annual total generation of MSW in Greece (Eurostat)..............................67
Figure 9: Annual generation of MSW per capita in Greece and EU-27 (Eurostat) .....67
Figure 10: Correlation between per capita income and MSW generation in EU (2000 –
2007).................................................................................................................70
Figure 11: Correlation between per capita income and MSW generation in Greece
(2000 – 2007) ....................................................................................................71
Figure 12: Average Annual Growth of GDP in EU from 2000 until 2009 (Data sourced
from Eurostat) ....................................................................................................76
Figure 13: MSW Total Generation in Greece from 2008-2028 assuming 3 different
scenarios (min, central and max).........................................................................79
Figure 14: Management of MSW in Greece, from 1995 until 2007 (Eurostat) ..........81
Figure 15: Existing treatment facilities in Greece (2009)........................................85
Figure 16: Future quantities and management of BMW in Greece ..........................96
Figure 17: Existing and planned treatment facilities in Greece (2009).....................99
EIB Study: JESSICA instruments for SWM in Greece: FINAL Report - Part 1
6
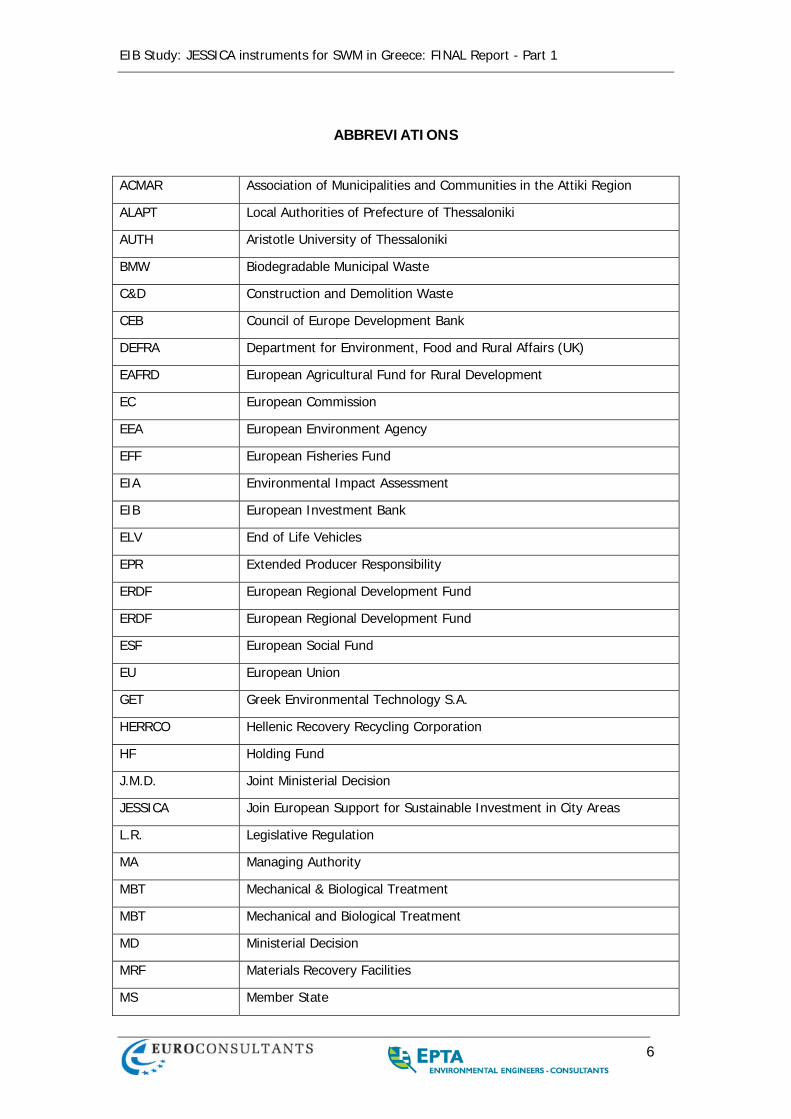
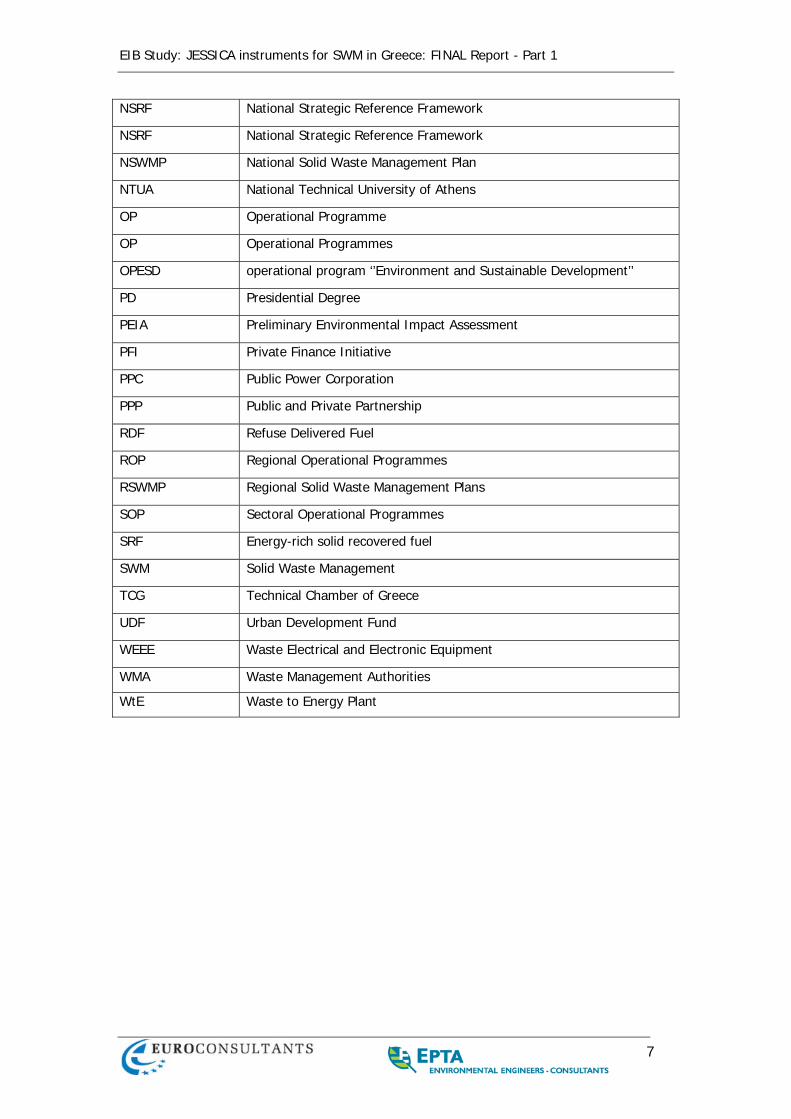
ABBREVIATIONS
ACMAR Association of Municipalities and Communities in the Attiki Region
ALAPT Local Authorities of Prefecture of Thessaloniki
AUTH Aristotle University of Thessaloniki
BMW Biodegradable Municipal Waste
C&D Construction and Demolition Waste
CEB Council of Europe Development Bank
DEFRA Department for Environment, Food and Rural Affairs (UK)
EAFRD European Agricultural Fund for Rural Development
EC European Commission
EEA European Environment Agency
EFF European Fisheries Fund
EIA Environmental Impact Assessment
EIB European Investment Bank
ELV End of Life Vehicles
EPR Extended Producer Responsibility
ERDF European Regional Development Fund
ERDF European Regional Development Fund
ESF European Social Fund
EU European Union
GET Greek Environmental Technology S.A.
HERRCO Hellenic Recovery Recycling Corporation
HF Holding Fund
J.M.D. Joint Ministerial Decision
JESSICA Join European Support for Sustainable Investment in City Areas
L.R. Legislative Regulation
MA Managing Authority
MBT Mechanical & Biological Treatment
MBT Mechanical and Biological Treatment
MD Ministerial Decision
MRF Materials Recovery Facilities
MS Member State
EIB Study: JESSICA instruments for SWM in Greece: FINAL Report - Part 1
7
NSRF National Strategic Reference Framework
NSRF National Strategic Reference Framework
NSWMP National Solid Waste Management Plan
NTUA National Technical University of Athens
OP Operational Programme
OP Operational Programmes
OPESD operational program ‘’Environment and Sustainable Development’’
PD Presidential Degree
PEIA Preliminary Environmental Impact Assessment
PFI Private Finance Initiative
PPC Public Power Corporation
PPP Public and Private Partnership
RDF Refuse Delivered Fuel
ROP Regional Operational Programmes
RSWMP Regional Solid Waste Management Plans
SOP Sectoral Operational Programmes
SRF Energy-rich solid recovered fuel
SWM Solid Waste Management
TCG Technical Chamber of Greece
UDF Urban Development Fund
WEEE Waste Electrical and Electronic Equipment
WMA Waste Management Authorities
WtE Waste to Energy Plant
EIB Study: JESSICA instruments for SWM in Greece: FINAL Report - Part 1
8
1. BACKGROUND INFORMATION
1.1. COUNTRY PRESENTATION
Greece (and the Greek Islands) is a peninsular and mountainous country located in
Southern Europe, on the Mediterranean, between Albania, Bulgaria, Turkey and the
Former Yugoslav Republic of Macedonia. The country dominates the Aegean and
Ionian Sea. It has a total area of 131,940 square km of which land represents
130,800 square km and water 1,140 square km. Greece has a coastline of 13,676 km
and is divided in regions and islands groups which are organized, for administrative
purposes, into prefectures. The mainland consists of the following regions: Central
Greece, Peloponnese, and Thessaly (east/central), Epirus (west), Macedonia
(north/northwest), Thrace (northwest). Capital city of Greece is Athens located in the
Attiki basin, in the centre of the Greek territory. The Peloponnese peninsula is
located in the southern part of Greece. It is separated from the mainland by the
artificial Isthmus of Corinth. The northern mainland is dissected by high mountains
that extend southwards towards a landscape of fertile plains, pine-forested uplands
and craggy, scrub-covered foothills. One of the characteristics of Greece is the large
amount of islands. There are more than 2000 islands scattered both in the Aegean
and Ionian Seas. The majority are located in the Aegean between the mainland and
Turkey.
Aegean Sea includes the regions of the Saronic, the closest islands from Athens, the
Cyclades, with 39 islands such as Santorini, Mykonos, Paros and Naxos, the
Dodecanese which lies off the Turkish coast, of which Rhodes is the best known,
Crete the largest island, the Sporades near the city of Volos and the Northeast
Aegean group which includes Lemnos, Lesvos, Chios, Samos and Ikaria. The Ionian
Sea includes the islands of Corfu, Kefalonia, Lefkada, Ithaki, Zakynthos and Kithira.
Greece is a mountainous country. The lowest point is the Mediterranean Sea, at 0m
of height, and the highest point is the Mount Olympus, at 2,917 m. The country is
quite rich in natural resources providing magnetite, lignite, bauxite, hydropower and
marble.
EIB Study: JESSICA instruments for SWM in Greece: FINAL Report - Part 1
9
1.2. CLIMATE
Greece has a Mediterranean climate with plenty of sunshine, mild temperatures and
a limited amount of rainfall. Due to the country's geographical position, its rugged
relief and its distribution between the mainland and the sea, there is a great
variation in Greece's climate. In summer, the dry hot days are cooled by seasonal
winds, while mountainous regions have generally lower temperatures. The winters
are mild in lowland areas, with a minimum amount of snow and ice, yet, mountains
are usually snow-covered. Moreover, a common phenomenon is the occurrence of
different climactic conditions during the same season (for instance, mild heat in
coastal areas and cool temperatures in mountainous regions).
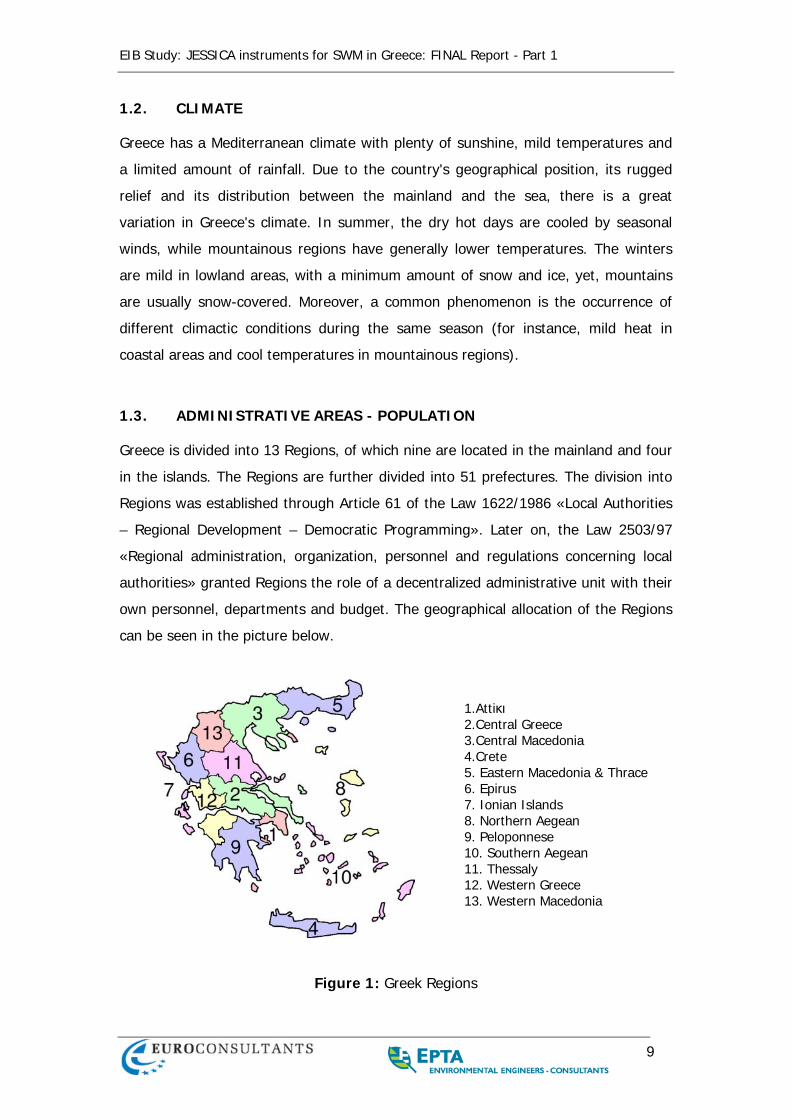
1.3. ADMINISTRATIVE AREAS - POPULATION
Greece is divided into 13 Regions, of which nine are located in the mainland and four
in the islands. The Regions are further divided into 51 prefectures. The division into
Regions was established through Article 61 of the Law 1622/1986 «Local Authorities
– Regional Development – Democratic Programming». Later on, the Law 2503/97
«Regional administration, organization, personnel and regulations concerning local
authorities» granted Regions the role of a decentralized administrative unit with their
own personnel, departments and budget. The geographical allocation of the Regions
can be seen in the picture below.
Figure 1: Greek Regions
1.Attiκι 2.Central Greece 3.Central Macedonia 4.Crete 5. Eastern Macedonia & Thrace 6. Epirus 7. Ionian Islands 8. Northern Aegean 9. Peloponnese 10. Southern Aegean 11. Thessaly 12. Western Greece 13. Western Macedonia
EIB Study: JESSICA instruments for SWM in Greece: FINAL Report - Part 1
10
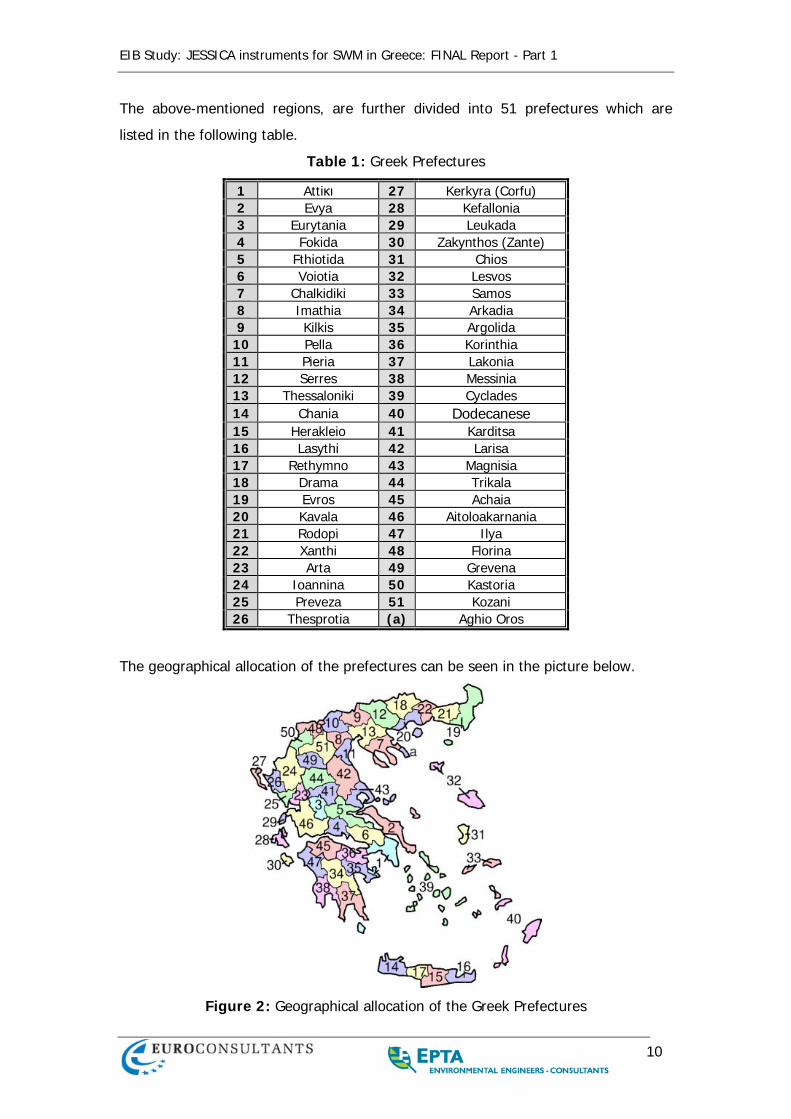
The above-mentioned regions, are further divided into 51 prefectures which are
listed in the following table.
Table 1: Greek Prefectures
1 Attiκι 27 Kerkyra (Corfu) 2 Evya 28 Kefallonia 3 Eurytania 29 Leukada 4 Fokida 30 Zakynthos (Zante) 5 Fthiotida 31 Chios 6 Voiotia 32 Lesvos 7 Chalkidiki 33 Samos 8 Imathia 34 Arkadia 9 Kilkis 35 Argolida
10 Pella 36 Korinthia 11 Pieria 37 Lakonia 12 Serres 38 Messinia 13 Thessaloniki 39 Cyclades 14 Chania 40 Dodecanese 15 Herakleio 41 Karditsa 16 Lasythi 42 Larisa 17 Rethymno 43 Magnisia 18 Drama 44 Trikala 19 Evros 45 Achaia 20 Kavala 46 Aitoloakarnania 21 Rodopi 47 Ilya 22 Xanthi 48 Florina 23 Arta 49 Grevena 24 Ioannina 50 Kastoria 25 Preveza 51 Kozani 26 Thesprotia (a) Aghio Oros
The geographical allocation of the prefectures can be seen in the picture below.
Figure 2: Geographical allocation of the Greek Prefectures
EIB Study: JESSICA instruments for SWM in Greece: FINAL Report - Part 1
11
The Prefectures are further subdivided into 900 municipalities and 133 communities.
Moreover, according to Regional Solid Waste Management Plans (RSWMP), each
Region is divided into Administrative Areas, which sometimes happen to have the
same geographical borders as the Prefectures. In most cases though the
Administrative Areas and Prefectures are not in alignment. For example the Region
of Central Greece consists of five Prefectures, but the total number of the
Administrative Areas is eleven. In total, Greece is divided into 104 Administrative
Areas in relation to RSWMPs.
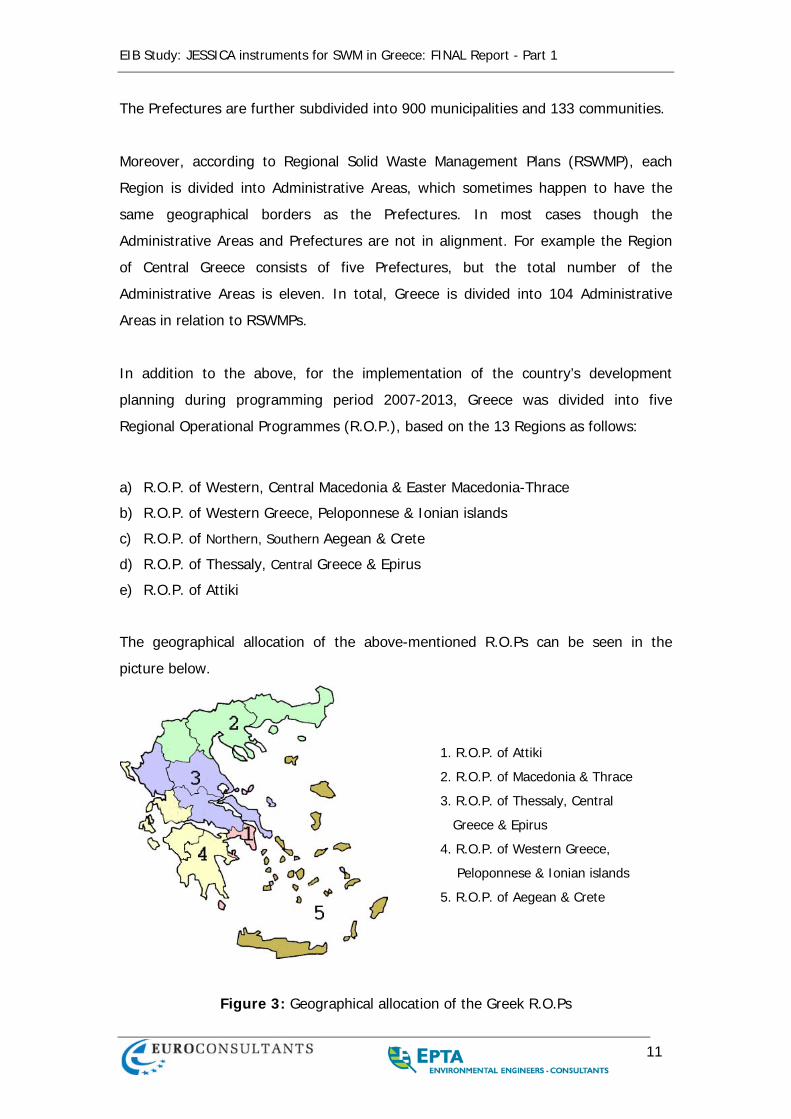
In addition to the above, for the implementation of the country’s development
planning during programming period 2007-2013, Greece was divided into five
Regional Operational Programmes (R.O.P.), based on the 13 Regions as follows:
a) R.O.P. of Western, Central Macedonia & Easter Macedonia-Thrace
b) R.O.P. of Western Greece, Peloponnese & Ionian islands
c) R.O.P. of Northern, Southern Aegean & Crete
d) R.O.P. of Thessaly, Central Greece & Epirus
e) R.O.P. of Attiki
The geographical allocation of the above-mentioned R.O.Ps can be seen in the
picture below.
Figure 3: Geographical allocation of the Greek R.O.Ps
1. R.O.P. of Attiki
2. R.O.P. of Macedonia & Thrace
3. R.O.P. of Thessaly, Central
Greece & Epirus
4. R.O.P. of Western Greece,
Peloponnese & Ionian islands
5. R.O.P. of Aegean & Crete
EIB Study: JESSICA instruments for SWM in Greece: FINAL Report - Part 1
12
1.4. POPULATION
Population censuses in Greece take place the first year of every decade. According to
the 2001 census (data sourced from National Statistical Service of Greece) the
population of Greece was 10,964,020, around 675,000 more than the 1991 census
(6.56 % increase). Greece has received a large number of immigrants since the early
1990s. More specifically, the 2001 census revealed that 797,091 foreigners lived
permanently in the country and comprised 6.95% of the total population, while their
number in 1990 was 142,367. During that time period (1991 -2001), the population
increase due to births was around 20.000.
Greek population in 2008 was estimated to 11,216,717 inhabitants, 43,300 more
than the 1st of January 2007, according to data published by Eurostat (2009). The
population increased again mainly due to immigration. The total number of
immigrants was 41,000 while the population increase due to births was around
2,300.
According to Eurostat estimations as of January 2009 gave the number of
11,263,216 inhabitants in the Greek peninsula.
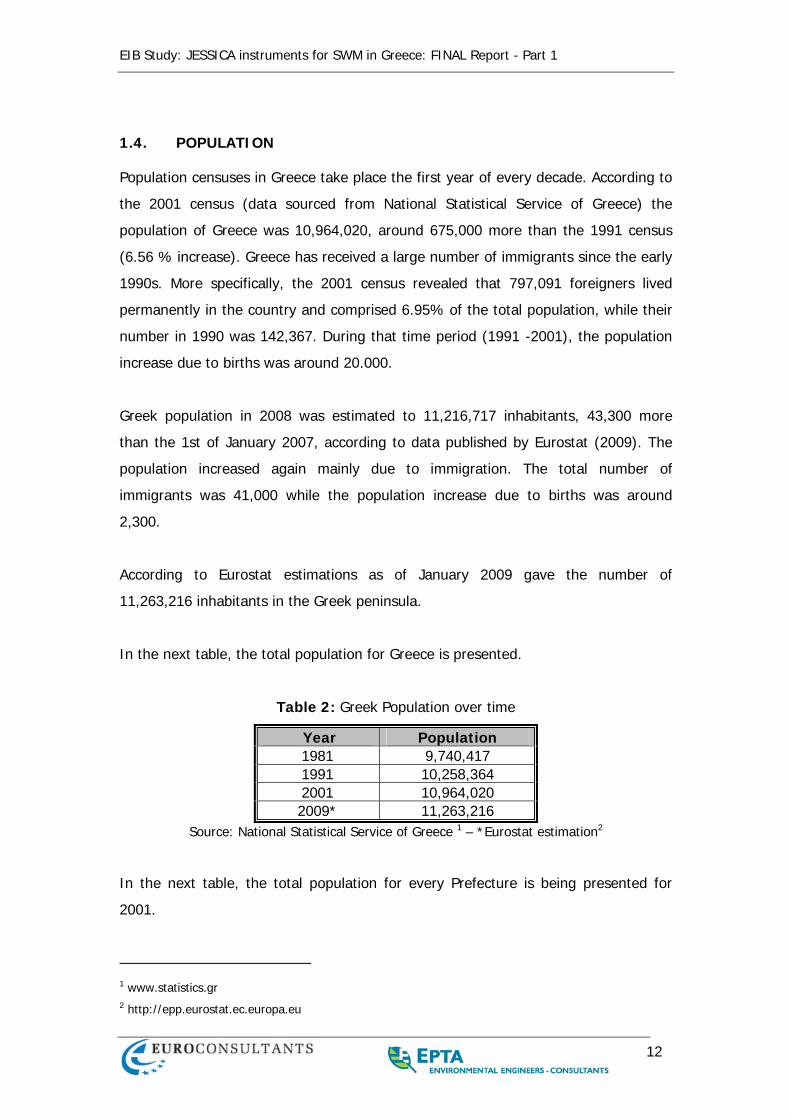
In the next table, the total population for Greece is presented.
Table 2: Greek Population over time
Year Population 1981 9,740,417 1991 10,258,364 2001 10,964,020 2009* 11,263,216
Source: National Statistical Service of Greece 1 – *Eurostat estimation2
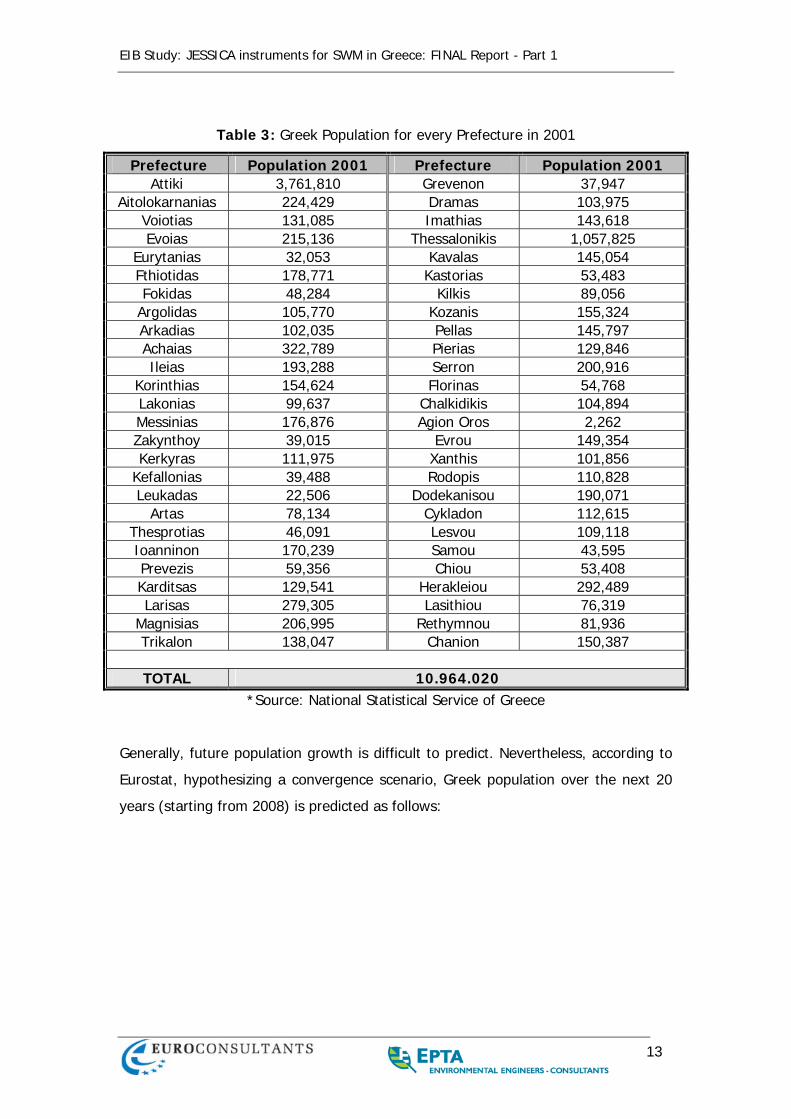
In the next table, the total population for every Prefecture is being presented for
2001.
1 www.statistics.gr 2 http://epp.eurostat.ec.europa.eu
EIB Study: JESSICA instruments for SWM in Greece: FINAL Report - Part 1
13
Table 3: Greek Population for every Prefecture in 2001
Prefecture Population 2001 Prefecture Population 2001 Attiki 3,761,810 Grevenon 37,947
Aitolokarnanias 224,429 Dramas 103,975 Voiotias 131,085 Imathias 143,618 Evoias 215,136 Thessalonikis 1,057,825
Eurytanias 32,053 Kavalas 145,054 Fthiotidas 178,771 Kastorias 53,483 Fokidas 48,284 Kilkis 89,056
Argolidas 105,770 Kozanis 155,324 Arkadias 102,035 Pellas 145,797 Achaias 322,789 Pierias 129,846 Ileias 193,288 Serron 200,916
Korinthias 154,624 Florinas 54,768 Lakonias 99,637 Chalkidikis 104,894 Messinias 176,876 Agion Oros 2,262 Zakynthoy 39,015 Evrou 149,354 Kerkyras 111,975 Xanthis 101,856
Kefallonias 39,488 Rodopis 110,828 Leukadas 22,506 Dodekanisou 190,071
Artas 78,134 Cykladon 112,615 Thesprotias 46,091 Lesvou 109,118 Ioanninon 170,239 Samou 43,595 Prevezis 59,356 Chiou 53,408 Karditsas 129,541 Herakleiou 292,489 Larisas 279,305 Lasithiou 76,319
Magnisias 206,995 Rethymnou 81,936 Trikalon 138,047 Chanion 150,387
TOTAL 10.964.020
*Source: National Statistical Service of Greece
Generally, future population growth is difficult to predict. Nevertheless, according to
Eurostat, hypothesizing a convergence scenario, Greek population over the next 20
years (starting from 2008) is predicted as follows:
EIB Study: JESSICA instruments for SWM in Greece: FINAL Report - Part 1
14
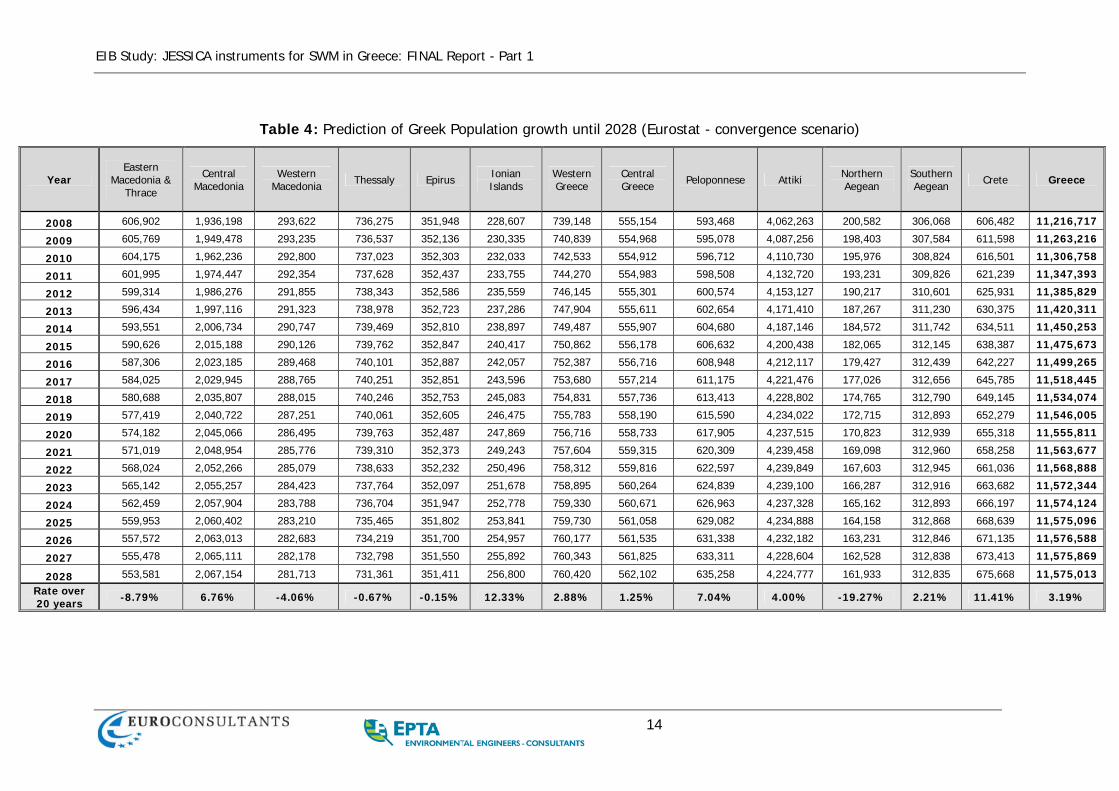
Table 4: Prediction of Greek Population growth until 2028 (Eurostat - convergence scenario)
Year Eastern
Macedonia & Thrace
Central Macedonia
Western Macedonia Thessaly Epirus Ionian
Islands Western Greece
Central Greece Peloponnese Attiki Northern
Aegean Southern Aegean Crete Greece
2008 606,902 1,936,198 293,622 736,275 351,948 228,607 739,148 555,154 593,468 4,062,263 200,582 306,068 606,482 11,216,717
2009 605,769 1,949,478 293,235 736,537 352,136 230,335 740,839 554,968 595,078 4,087,256 198,403 307,584 611,598 11,263,216
2010 604,175 1,962,236 292,800 737,023 352,303 232,033 742,533 554,912 596,712 4,110,730 195,976 308,824 616,501 11,306,758
2011 601,995 1,974,447 292,354 737,628 352,437 233,755 744,270 554,983 598,508 4,132,720 193,231 309,826 621,239 11,347,393
2012 599,314 1,986,276 291,855 738,343 352,586 235,559 746,145 555,301 600,574 4,153,127 190,217 310,601 625,931 11,385,829
2013 596,434 1,997,116 291,323 738,978 352,723 237,286 747,904 555,611 602,654 4,171,410 187,267 311,230 630,375 11,420,311
2014 593,551 2,006,734 290,747 739,469 352,810 238,897 749,487 555,907 604,680 4,187,146 184,572 311,742 634,511 11,450,253
2015 590,626 2,015,188 290,126 739,762 352,847 240,417 750,862 556,178 606,632 4,200,438 182,065 312,145 638,387 11,475,673
2016 587,306 2,023,185 289,468 740,101 352,887 242,057 752,387 556,716 608,948 4,212,117 179,427 312,439 642,227 11,499,265
2017 584,025 2,029,945 288,765 740,251 352,851 243,596 753,680 557,214 611,175 4,221,476 177,026 312,656 645,785 11,518,445
2018 580,688 2,035,807 288,015 740,246 352,753 245,083 754,831 557,736 613,413 4,228,802 174,765 312,790 649,145 11,534,074
2019 577,419 2,040,722 287,251 740,061 352,605 246,475 755,783 558,190 615,590 4,234,022 172,715 312,893 652,279 11,546,005
2020 574,182 2,045,066 286,495 739,763 352,487 247,869 756,716 558,733 617,905 4,237,515 170,823 312,939 655,318 11,555,811
2021 571,019 2,048,954 285,776 739,310 352,373 249,243 757,604 559,315 620,309 4,239,458 169,098 312,960 658,258 11,563,677
2022 568,024 2,052,266 285,079 738,633 352,232 250,496 758,312 559,816 622,597 4,239,849 167,603 312,945 661,036 11,568,888
2023 565,142 2,055,257 284,423 737,764 352,097 251,678 758,895 560,264 624,839 4,239,100 166,287 312,916 663,682 11,572,344
2024 562,459 2,057,904 283,788 736,704 351,947 252,778 759,330 560,671 626,963 4,237,328 165,162 312,893 666,197 11,574,124
2025 559,953 2,060,402 283,210 735,465 351,802 253,841 759,730 561,058 629,082 4,234,888 164,158 312,868 668,639 11,575,096
2026 557,572 2,063,013 282,683 734,219 351,700 254,957 760,177 561,535 631,338 4,232,182 163,231 312,846 671,135 11,576,588
2027 555,478 2,065,111 282,178 732,798 351,550 255,892 760,343 561,825 633,311 4,228,604 162,528 312,838 673,413 11,575,869
2028 553,581 2,067,154 281,713 731,361 351,411 256,800 760,420 562,102 635,258 4,224,777 161,933 312,835 675,668 11,575,013 Rate over 20 years -8.79% 6.76% -4.06% -0.67% -0.15% 12.33% 2.88% 1.25% 7.04% 4.00% -19.27% 2.21% 11.41% 3.19%
EIB Study: JESSICA instruments for SWM in Greece: FINAL Report - Part 1
15
According to that scenario, it is expected a 6.76 % population growth in Central
Macedonia, mainly due to rapid development of Thessaloniki, and a 4.00 %
population growth in Attiki.
1.5. SOLID WASTE MANAGEMENT OVER THE PAST FEW YEARS
Waste management has been recognized as one of the most severe problems within
European Union. Greece, until early nineties was relying only on semi-controlled
landfills. Nevertheless, during the last two decades the solid waste management in
Greece has been remarkably upgraded. While it is still generally considered a major
problem, now it is increasingly becoming a well-structured, organized and
environmentally responsible activity with specific goals, mostly in urban areas.
Regarding solid waste management it must be noted that general planning is carried
out through the National Solid Waste Management Plan (NSWMP). The first waste
management planning introduced in the early nineties. Next, the 1998 intermediate
National Planning promoted the construction of 75 landfills in order to accept waste
from 75% of the total population. Around 85% of those landfills had capacity of less
than 50 tonnes per day. Moreover, in the 2000 National Planning main priority was
to close down semi and uncontrolled landfills without considering the fact that waste
treatment facilities would be necessary in the near future in order to divert part of
the waste stream from landfills.
The requirements for recycling, processing and landfilling of solid waste increased
the need of an integrated planning in national and regional level, thus the need for
regional planning was highlighted by the Ministry of Environment (Circular
11836/1951/27.6.2002) and was included in the 2003 NSWMP, where it was stated
that RSWMP should be established by 22/12/2005. As a result, all targets set in the
2003 NSWMP, based on EU Directives, are apportioned into the 13 aforementioned
Regions through the RSWMP.
Nevertheless, most of the waste management systems operated in Greece are still
not in full compliance with the requirements of Landfill Directive, which establishes
diversion rates of biodegradable municipal waste from landfills, and the revised
Waste Framework Directive 2008/98/EC, which encourages the separate collection of
EIB Study: JESSICA instruments for SWM in Greece: FINAL Report - Part 1
16
bio-waste with a view to the composting and digestion of bio-waste. This is mainly
duo to the fact that in the last two decades, and especially during the 1994-1999 and
2000-2006 Programming Periods, priority was given to the construction of compliant
infrastructure and therefore most of the 13 Regions still lack in waste processing
infrastructure. At present, there is a note of relative optimism, since most of the
waste treatment facilities foreseen in RSWMPs are under planning; however funding
needs are greater than the allocated funds in 2007-2013 Programming Period.
EIB Study: JESSICA instruments for SWM in Greece: FINAL Report - Part 1
17
2. LEGAL FRAMEWORK OF WASTE MANAGEMENT IN
GREECE
2.1. INTRODUCTION
Most of waste management law in Greece follows the development of European
waste management law. Next, basic legal instruments on waste management in
Greece, main actors and competent authorities are presented.
2.2. HISTORICAL BACKGROUND
The first waste management related legislation in Greece was the Ministerial Decision
(M.D.) EIB/301/64 «on collection and disposal of waste» where the technical
guidelines for collection and disposal were set. According to article 7 the provisions
of the Decision could be bypassed with a Decision issued by the Prefecture.
Some years later with the Legislative Regulation (L.R.) 703/1970, Law 25/1975, Law
429/1976 and Law 1080/1980 sanitary fee was based on the household surface in
sq. meters, and this has not changed until today. In 1985, Law 1650 «on the
protection of the Environment» established a framework of sanctions and liabilities
for the protection of the environment. According to Article 12 the regional waste
management (collection, temporary storage, treatment and disposal) was placed
under the jurisdiction of Municipalities and Waste Management Authorities (WMA).
The EU Waste framework Directive was transposed into domestic law in 1986,
through the Joint Ministerial Decision (J.M.D.) 49541/1424/1986 (not valid) on «Solid
waste in conformity with Directive 75/442/EEC…» and for the first time the basic
principles for environment and public health protection together with the necessity
for waste management plans were introduced in the legislative framework. The
J.M.D. also:
• Contained definitions for waste management relevant terms
• Named the competent authorities for waste management
• Regulated solid waste management permissions for legal or natural persons
(apart from municipalities)
• Contained regulations for industrial waste

EIB Study: JESSICA instruments for SWM in Greece: FINAL Report - Part 1
18
In 1996, J.M.D. 49541/1424/1986 was replaced by J.M.D. 69728/824/1996 (not
valid) on «Solid Waste Management» was published were the responsible parties for
issuing and implementing waste management plans were named. Those were the
Prefectures or the Region, if the Prefecture could not fulfill that task. Great
importance was given to sanitation of disposal sites and to the restoration of
uncontrolled dumpsites. The European Waste Catalogue was attached to the J.M.D..
In the same year the Ministry of Environment issued a circular that explained in
detail what the contents of the application file, concerning the use of a location for
the construction of a waste management facility, should be.
One year later with the J.M.D. 113944/97 (not valid) «on National Waste
Management Planning» and the J.M.D. 114218/97 «on technical specifications and
general plans for solid waste management», the legal framework concerning solid
waste became more specific.
Some years later the Law 2939/2001 «οn packaging and recycling of packaging and
other products - Establishment of the National Organization for Recycling of
Packaging and other Products» sets the legal framework for recycling of packaging
waste and other products and the Direction 94/62/EEC is transposed into national
Law. Presidential Decrees (P.D.) were issued that set management targets for every
waste stream. So far the P.D.’s 82/2004, 109/2004, 115/2004, 116/2004. 117/2004
και 15/2006 for used oils, tires, batteries, end of life vehicles and waste electrical and
electronic equipment have been issued. In 2003 J.M.D. 37591/2031/2003 concerning
healthcare waste was published. Accordingly healthcare units have to issue rules of
procedure concerning hazardous medical waste.
In the same year the J.M.D. 50910/2727/2003 «on measures and terms for solid
waste management - national and regional planning management», in complete
compliance with the European Waste Framework Directive 91/156/EEC is issued.
Basic principles and targets for solid waste management together with the
specifications for national and regional planning are set there.
The most recent legislative regulations are J.M.D. 13588/725/2006 for hazardous
waste, the MD 8668/2007 on the approval of Hazardous Waste National Planning
EIB Study: JESSICA instruments for SWM in Greece: FINAL Report - Part 1
19
and the Law 3536/2007 were the legal form of Waste Management Authorities is
defined. During 2009 the M.D. 8111.41/09/2009 on measures and terms on port
reception facilities for ship-generated waste and cargo residues in compliance with
the provisions of the Directive 2007/71/ΕC was published.
2.3. BASIC LEGAL INSTRUMENTS ON WASTE MANAGEMENT IN GREECE
The basic current acts in force on Waste Management in Greece are:
1. Solid Waste Management Planning
J.M.D. 50910/2727/2003 on «measures and conditions on solid waste
management - National and Regional Management Plan»
2. Non Hazardous Solid Waste (includes MSW)
J.M.D. 114218/1997 «Establishment of a framework of technical
specifications and of general plans of solid waste management »
M.D. 29407/3508/2002 «On measures and terms for landfilling of waste»
J.M.D. 22912/1117/2005 «On measures and terms for the prevention and
reduction of environmental pollution and the incineration of waste»
J.M.D. 4641/232/2006 «Establishment of technical specifications of small
landfill sites on small islands and isolated settlements»
3. Packaging waste and other special streams
Law 2931/2001 «Οn packaging and recycling of packaging and other
products - Establishment of the National Organization for Recycling of
Packaging and other Products» and associated Presidential Decrees.
J.M.D. 9268/469/2007 «Amendment of 2931/2001 about quantitative
national targets for recover and recycling of packaging waste»
4. Hazardous waste
M.D. 8668/2007 «Approval of the hazardous waste national plan»
J.M.D. 24944/1159/2006 «Concerning the establishment of general
technical specifications of hazardous waste management».
J.M.D. 13588/725/2006 «On measures, terms and restrictions concerning
hazardous waste management»
EIB Study: JESSICA instruments for SWM in Greece: FINAL Report - Part 1
20
5. Medical Waste.
J.M.D. 37591/2031/2003 «on measures and terms concerning healthcare
waste management».
Next, the key points of the aforementioned acts, are briefly presented.
2.3.1. Solid Waste Management Planning
As stated, planning operates at two levels. Firstly, the National Waste Management
Plan, annexed to the 50910/2727/2003 Joint Ministerial Decision on «measures and
conditions on solid waste management - National and Regional Management Plan»,
which sets out the general priorities in relation to waste management. The
operational plan, however, is set at the regional level.
J.M.D. 50910 on the management of waste, transposed Directive 2006/12/EC
(replaced by the Directive 2008/98) into the national legislation. It comprises to the
following basic axes:
• Adaptation and approval of the National Solid Waste Management Planning
so as to incorporate the major principles, goals, policies and actions for the
rational management of urban wastes, according to the community legal
framework and arising national obligations;
• Establishment of the Regional Solid Waste Management Planning as the
executive action plan in the area of solid waste management, with
specifications and goals in consistency with those of the National Planning.
The objective of the RSWM Plan is to specify the general directions of the
National Plan and identify priorities and measures to be taken at the regional
level by Regions, Prefectures and WMAs.
In the aforementioned J.M.D. the national targets regarding solid waste
management are set in order:
To ensure a high level of protection for the environment and public health
To conserve natural resources, water, energy and earth surface
To reduce the air emissions contributing to the greenhouse effect
EIB Study: JESSICA instruments for SWM in Greece: FINAL Report - Part 1
21
To expand the life span of sanitary landfills
To ensure that final disposal of waste will not pose a threat to future
generations
Solid waste management is governed by the following principles:
Prevention of waste.
The polluter pays.
Proximity of disposal sites to the sites/sources of waste generation.
The hierarchy in the waste management sector according to the NSWMP consists of
three actions, as following:
1. Prevention or minimization of waste production (quantitative minimization) as
well as the minimization of the waste content in hazardous substances
(qualitative minimization)
2. Utilization of waste (recycling and energy recovering)
3. Safe final disposal of residues
According to the J.M.D., the NSWMP will be revised every five years and will be
published after common approval from the Ministries of Interior, Environment,
Health and Agriculture, after consulting with the Central Unions of Municipalities &
Communities of Greece (Greek abbreviation: KEDKE) and the Central Union of
Prefectures of Greece (Greek abbreviation: ENAE). If necessary the revision can
occur earlier than the five years in order to confront with urgent changes in the
waste management sector. Those can be changes due to:
a) the promotion or implementation of European or international programs,
b) to legislation amendments,
c) natural or other disasters or
d) unforeseeable problems during the construction of MSW facilities.
Moreover, J.M.D. 50910 sets the targets for diversion of biowaste, in accordance
with the Council Directive 1999/31/EC of 26 April 1999. More specifically the J.M.D.
50910 sets the following targets:
EIB Study: JESSICA instruments for SWM in Greece: FINAL Report - Part 1
22
In 2010, BMW going to landfills must be reduced to 75 % of the total amount of
BMW produced in 1995, for which standardised Eurostat data are available;
In 2013, BMW going to landfills must be reduced to 50 % of the total amount of
BMW produced in 1995 for which standardised Eurostat data are available;
In 2020, BMW going to landfills must be reduced to 35 % of the total amount of
BMW produced in 1995 for which standardised Eurostat data are available.
Regarding packaging waste, J.M.D. sets quantitative national targets based on Law
2931/2001, however these were amended by J.M.D. 9268/469/2007.
Finally, the J.M.D. determines the obligations of the WMA and the Regions, regulates
the permits of waste management operators and sets a time limit for the eradication
of uncontrolled dumping.
2.3.2. Non Hazardous Solid Waste
Regarding non hazardous waste (that includes MSW) treatment and disposal, the
most important statutes and the way they affect strategic decisions in handling solid
waste are described in this section
J.M.D. 114218/1997 on Technical Specifications
«Establishment of a framework of technical specifications and of general plans of
solid waste management »
J.M.D. 114218 determines the technical specifications regarding the appropriate
systems, means and procedures for each of the available waste treatment methods
(like temporary storage, collection and disposal, collection at source, recycling etc.)
and it also specifies the criteria for the selection of landfills, as well as for the
planning, design and function of “Sanitary Legal Waste Disposal Sites”, mechanical
sorting plants and composting facilities. Specifications on compost products are also
included.
J.M.D 29407/3508/2002 on Landfilling of Waste
«On measures and terms for landfilling of waste»
EIB Study: JESSICA instruments for SWM in Greece: FINAL Report - Part 1
23
Through the aforementioned J.M.D., the Directive 99/31/EC on the landfill of waste
was transposed into the Greek legislative framework. The main elements introduced
with the J.M.D. are:
• Waste must be treated before landfilled,
• Stricter operational rules for sanitary landfills
• Changes regarding gate fee for landfilling were introduced,
• Requirements for the landfill operating authorities where established
• Planning and permitting procedure were changed
Those requirements aim to promote the construction of high standard landfills which
will gradually be turned into residue landfills. Regarding gate fee, costs of financial
security, final closure and after-care have to be included.
Moreover, Article 12 of J.M.D 29407 requires that the costs for operation and
extension works of landfills is covered by the price charged by the Waste
Management Authorities (via Municipalities) for the disposal of waste.
J.M.D. 22912/1117/2005 on Waste Incineration
«On measures and terms for the prevention and reduction of environmental pollution
and the incineration of waste»
The J.M.D. was published in order to transpose Directive 2000/76/EG on waste
incineration into national legislation. The J.M.D. aims to reduce and prevent
environmental impacts deriving from waste incineration.
In order to achieve that:
• Certain technical specifications for the design, construction and equipment of
incineration facilities are given;
• Emission limits for certain pollutants released into air or waster are set;
• The procedure for waste acceptance in the facility is defined;
• Equipment needs to be installed in order to monitor operating parameters,
flue gas emissions, and heavy metals;
• The conditions in order to approve the environmental terms of the facility are
defined.
EIB Study: JESSICA instruments for SWM in Greece: FINAL Report - Part 1
24
J.M.D. 4641/232/2006 on Small Landfills
«Establishment of technical specifications of small landfill sites on small islands and
isolated settlements»
This J.M.D. sets the technical specifications for landfills usually found in small islands
or small settlements.
2.3.3. Packaging Waste and Special Streams
Regarding special streams, Law 2931/2001 «on packaging and recycling of
packaging and other products - Establishment of the National Organization for
Recycling of Packaging and other Products» and associated Presidential Decrees for
the recycling of packaging waste, transposing Council Directive 94/62/EC on
packaging waste and related Directives on other wastes, i.e. used tyres, end-of-life
vehicles, waste oils, electrical and electronic waste, waste batteries and demolition
and construction waste.
For the above waste streams, the following Presidential Decrees have been issued:
Oil wastes (Presidential Decree 82/ O.J.G. 64A/02-03-2004);
Used batteries and accumulators (Presidential Decree 115 / O.J.G. 80A/05-03-
2004);
Used vehicle tires (Presidential Decree 109 / O.J.G. 75A/05-03-2004);
Used electric and electronic equipment (Presidential Decree 117 / O.J.G. 82A/05-
03-2004);
End-of-life vehicles (Presidential Decree 116 / O.J.G. 81A/05-03-2004);
Excavation, construction and demolition wastes (Presidential Decree under
publication).
The Law obligates the economic actors (producers, importers) to organize or
participate in collective (or individual) recycling schemes (i.e. return, collection,
transportation and recovery systems) in order to achieve specific quantitative
targets. Schemes, have to be approved by the Ministry of Environment and are
funded through the corresponding producers.
EIB Study: JESSICA instruments for SWM in Greece: FINAL Report - Part 1
25
Responsible for the monitoring of the management of specific waste streams is the
National Organization for Alternative Management of Packaging and other Products
(Greek abbreviation: EOEDSAP). In 2008, P.D. 99/2008 on «establishment, structure
and operation of the National Organization for Recycling of Packaging and other
Products - Financial Management and Procurements of the Organization» which
describes the exact operation terms of the Organization, was adopted. The
management board consists of 15 persons and is established by a Decision issued by
the Minister of environment. The responsibilities of the board are laid down in this
Decree. The Organization is divided in the Directorate of Finance and Administration
and in the Directorate of Recycling. The terms for tender procedures and
procurements of the Organization are also contained in the Decree.
For the time being (2009) monitoring of Recycling Systems is assigned to the
Direction of Recycling of the Ministry of Environment.
Packaging Waste
According to Law 2939/01 «packaging is every product, manufactured by any kind of
material raw or secondary that is used to contain goods in order to protect, move
and distribute them from the producer to the final consumer». Moreover, the
packaging waste management responsibility lies with producers according to the
Extended Producer Responsibility (EPR) strategy. EPR uses political means to hold
producers liable for the costs of managing their waste and end of life products.
More specifically, Law 2939/01 obligates the economic actors (producers, importers)
to organize or participate in collective (or individual) systems of alternative waste
management (i.e. return, collection, transportation and recovery systems) in order to
achieve specific quantitative targets.
As a result, the Hellenic Recovery Recycling Corporation (HERRCO) was founded in
December 2001 by industrial and commercial enterprises which, either supply
packaged products to the Greek market, or manufacture different packaging items.
The Central Union of Municipalities & Communities in Greece (Greek abbreviation:
KEDKE) has a shareholding of 35% in the System’s share capital. In compliance with
the provisions of Law 2939/01 and in seeking to fulfill the obligations of packaging
operators in an effective and cost-efficient way, HERRCO has developed and
EIB Study: JESSICA instruments for SWM in Greece: FINAL Report - Part 1
26
implemented the Collective Alternative Management System – “RECYCLING”
(C.A.M.S. – RECYCLING) and has come to an arrangement with packaging producers
as stated in the legal framework, in order to ensure that packaging waste is being
collected and recycled. At the same time contracts have been signed with several
municipalities in order to install and expand the separation at source system of
packaging material.
Apart from HERRCO the following recycling systems from private companies have
been also approved:
Recycling system for used oil packaging (Greek abbreviation: KEPED). This
system aims to collect and recover used waste oil packaging waste. During
2007 3.900 tonnes where recovered and recycled.
Packaging waste management system of the Vasilopoulos S.A. (M.D. 106156 ,
OJG 1108Β/22.7.2004). This system has recovered and recycled 1.240 tonnes
of private label packaging waste and an additional 2.450 tonnes of other
packaging waste.
Collection system based on the establishment of «Refund Recycling Centers».
Those centers accept and sort the materials and provide a small financial
compensation. The Central Union of Municipalities and Communities of Greece
is also participating in that system and it will function in a supplementary way
to the system of HERRCO.
In January 2007 the J.M.D. 9268/469/2007 (harmonization with Directive
2004/12/EC) adopted new recovery and recycling targets for packaging waste as
following:
No later than 31 December 2011, 60% as a minimum by weight of packaging
waste will be recovered or incinerated at waste incineration plants with energy
recovery
No later than 31 December 2011, the following minimum recycling targets for
materials contained in packaging waste will be attained:
(i) 60% by weight for glass;
EIB Study: JESSICA instruments for SWM in Greece: FINAL Report - Part 1
27
(ii) 60% by weight for paper and board;
(iii) 50% by weight for metals;
(iv) 22,5% by weight for plastics, counting exclusively material that is recycled
back into plastics;
(v) 15% by weight for wood.
Special Streams
Special streams include, Batteries, End of Life Vehicles (E.L.V.), Waste Electrical and
Electronic Equipment (W.E.E.E.), Used Tires and Used Oils. Extended producer
responsibility schemes have been set-up in Greece for special waste streams, an
overview of which is provided in the paragraphs below.
End of Life Vehicles (ELV)
The term of End of Life Vehicle refers to every vehicle that can be classified as waste
meaning that its owner is willing or intends or is obligated to dispose it. The
following categories of vehicles can be defined as End of Life Vehicles:
Vehicle that its owner intends to dispose
Abandoned vehicle that has been declared as waste
Vehicle that is partially or totally destroyed
Vehicle that does not fulfill legal and technical requirements
P.D. 116/2004 «On measures and terms for recycling of end of life vehicles»
describes the operation of ELV management schemes and the obligations of owners,
producers, collectors and other persons involved in the ELV market.
According to the P.D. 116/2004 following targets are set:
No later than 1 January 2015, for all end-of life vehicles, the reuse and recovery
shall be increased to a minimum of 95 % by an average weight per vehicle and
year
Within the same time limit, the re-use and recycling shall be increased to a
minimum of 85 % by an average weight per vehicle and year.
EIB Study: JESSICA instruments for SWM in Greece: FINAL Report - Part 1
28
The national management scheme for ELV (Greek abbreviation: EDOE) was
approved by the Ministerial Decision (M.D.) 105136/10.06.04 (907Β/17.06.04) and
its operation is governed by the regulations of Law 2939/2001 and Presidential
Degree (P.D.) 116/2004. Owners of E.L.V. are obliged to hand them in designated
collection points or authorized treatment facilities without being charged since there
is no market value for the vehicle. Given that many E.L.V. owners abandon their cars
in parking places, EDOE is cooperating with local authorities who collect these
vehicles.
Waste Electrical and Electronic Equipment (W.E.E.E.)
W.E.E.E. management in Greece is governed by the regulations of Law 2939/01 and
P.D.s 117/2004 and 15/2006. With these Decrees the Directives 2002/96/EC on
waste electrical and electronic equipment and 2002/95/EC on the restriction of the
use of certain hazardous substances in electrical and electronic equipment were
transposed into the national legislation framework. The term electrical and electronic
waste refers to a wide spectrum of materials and is one of the most complicated
solid waste streams due to the variety of raw materials it contains and to the many
different types of electrical devices that be found in the market. P.D. 117/2004
classifies W.E.E.E. according to its origin source in the following categories (based on
Directive 2002/96/ΕC):
Large household appliances
Small household appliances
IT and telecommunications equipment
Consumer equipment
Lighting equipment
Electrical and electronic tools
Toys, leisure and sports equipment
Medical devices
Monitoring and control instruments
Automatic dispensers
The recycling/recovery targets set for each category are:
(a) For W.E.E.E. falling under categories 1 and 10 of Annex IA,

EIB Study: JESSICA instruments for SWM in Greece: FINAL Report - Part 1
29
the rate of recovery shall be increased to a minimum of 80 % by an average
weight per appliance, and
component, material and substance reuse and recycling shall be increased to
a minimum of 75 % by an average weight per appliance;
(b) For W.E.E.E. falling under categories 3 and 4 of Annex IA,
the rate of recovery shall be increased to a minimum of 75 % by an average
weight per appliance, and
component, material and substance reuse and recycling shall be increased to
a minimum of 65 % by an average weight per appliance;
(c) For W.E.E.E. falling under categories 2, 5, 6, 7 and 9 of Annex IA,
the rate of recovery shall be increased to a minimum of 70 % by an average
weight per appliance, and
component, material and substance reuse and recycling shall be increased to
a minimum of 50 % by an average weight per appliance;
(d) For gas discharge lamps, the rate of component, material and substance reuse
and recycling shall reach a minimum of 80 % by weight of the lamps.
Producers of Electric and Electronic equipment sign the Entry Agreement, regularly
declare the quantities of products marketed in Greece and pay the legally required
financial contribution to "Appliances Recycling S.A.". The scheme also cooperates
with local authorities in order to set collection points for citizens. W.E.E.E. can be
transferred directly to the Corinth processing facility or stored temporarily. It must be
mentioned that local collectors are trading useful materials contained in W.E.E.E. and
an initiative should be taken in order to associate them to the scheme.
Used Tyres
Current legislative statutes forbid the landfilling of used tires. According to Law
2939/01 and P.D. 109/04 «on measures and terms for recycling management of
used tires», tire producers are obligated to create or participate in recycling schemes
for used tires. The operation of those schemes together with the obligations of all
stakeholders involved in tire management is described in the P.D.
Owners or final users of used tires are obliged to hand them to collection points or
approved management schemes.
According to the P.D. 109/2004 following targets are set:
EIB Study: JESSICA instruments for SWM in Greece: FINAL Report - Part 1
30
no later than July 2006 to recover 65% of the total amount of used tires
produced
no later than July 2006 to recycle 10% of the total amount of used tires
produced
Current legislative statutes forbid the landfilling of used tires. According to Law
2939/01 and P.D. 109/04 tire producers are obligated to create or participate to
recycling schemes for used tires. Owners or final users of used tires are obliged to
hand them to collection points or approved management schemes. The competent
scheme called Ecoelastika S.A. begun its operation in 1-11-2004 in the Prefectures of
Voiotia and Fthiotida. In Greece recycled tires are used mainly for construction of
sport facilities and construction of rubber wheels for waste bins.
Construction and Demolition Waste (C&D)
The term construction and demolition waste refers to a wide variety of materials that
can be divided into four main categories depending on their source of origin:
Excavation materials
Road construction waste
Demolition waste
Construction – Site waste
No organized network for the management of construction and demolition waste
exists in Greece. Actions towards recycling and recovery are not frequent and
depend totally on the site manager. Mainly useful materials like cables and glasses
are recovered while the inert waste is used for the restoration of old quarries. A
Presidential Decree that will regulate C&D waste is under publication.
Batteries
P.D. 115/2004 «on measures and terms for recycling of batteries and accumulators»,
sets the measures, terms and general directions for the operation of recycling
schemes for batteries and accumulators. It aims to:
Prevent environmental pollution
EIB Study: JESSICA instruments for SWM in Greece: FINAL Report - Part 1
31
To reduce the hazards due to the heavy metal content of batteries and
accumulators
To reduce the amount of batteries and accumulators in household waste
To promote recovery and recycling
To inform the public opinion
To give directions regarding separate collection, temporary storage and
transportation of used accumulators
To collect 30% of all used batteries and accumulators and to recycle 80% of the
amount collected.
The competent management scheme for batteries AFIS S.A. started its operation in
March 2004. AFIS has come to an agreement with importers/producers of batteries,
which contribute a fee for every battery sold in the Greek market in order to cover
the costs for collection, transportation, recycling and dissemination activities.
Used Oils
Article 17 of Law 2939/2001 describes the creation of recycling schemes for used
oils. The specifications and requirements for the operation and creation of the
management scheme are described in the P.D. 82/2004 «On measures and terms for
the recycling of used oils »
The P.D. was the driving force behind the establishment of the competent authority
Greek Environmental Technology S.A. (GET) which is subsidized by the producers of
lube oil in Greece according to the ‘polluter-pays-principle’. There are three
responsible parties regarding used oil management:
Producers of lubricant oils
Importers of lubricant oils
Distributors lubricant oils
Those are obligated to create or to participate in recycling schemes like GET and to
collect used lubricant oils in order to be processed in authorized facilities. Distributors
should not distribute lubricant oils brands that are not participating in management
schemes.
EIB Study: JESSICA instruments for SWM in Greece: FINAL Report - Part 1
32
According to the P.D. 82/2004 following targets are set:
no later than 2006 to collect 70% of the total amount of used lubricant oils
produced
no later than 2006 to regenerate 80% of the total amount of used lubricant oils
produced
The company is also cooperating with major oil consumers like the Army and the
Public Power Corporation (P.P.C.) and has focused in promoting cooperation with
municipalities. The producers of waste oils are obliged to hand the waste to
approved collectors.
2.3.4. Hazardous Waste
Regarding hazardous waste, M.D. 8668/2007 «Approval of the hazardous waste
national plan» is in force. The purpose of the present ministerial decision is to
implement the provisions of articles 11 and 12 of law 1650/1986, as well as to
implement the provisions of article 5 (par. A) of the Joint Ministerial Decision
13588/725/2006, which adapted the relevant Greek legislation to the provisions of
Directive 91/156/EEC, so as to succeed in an environmentally rational and
sustainable management of hazardous waste, in order to achieve a high level
protection of the environment, through an environmentally complete national
strategy in the sector of hazardous waste. The National Plan for the Management of
Hazardous Waste is hereby approved.
The National Plan for the Management of Hazardous Waste was created pursuant to
article 5 (par. A) of the Joint Ministerial Decision 13588/725/2006 and includes the
following units: description of the existing situation in Greece, as regards the sources
of origin, the categories, the quantities produced, the used practices for the
management of hazardous waste, as well as the forecasts for the production of
hazardous waste in the state, a description of the goals of the National Plan, a
description of the actions which must be undertaken in the future, in order to
achieve these goals, a description of the stages of realization of the National Plan,
including the criteria for finding and making available the appropriate areas or
installations for the disposal of hazardous wastes, a description of the requisite
actions for the constant monitoring and updating of the National Plan, a plan for the
EIB Study: JESSICA instruments for SWM in Greece: FINAL Report - Part 1
33
management of small quantities of hazardous waste in urban wastes, financial
resources for the realization of the National Plan ( Article 2 ).
Article 3 of the present decision amends articles 7, 11, 19 of the Joint Ministerial
Decision 13588/725/2006 (B´ 383), whereas article 4 includes an Annex, which
forms an integral part of the present decision and contains the National Plan for the
Management of Hazardous Waste.
The technical specifications for transportation, storage, operations in waste transfer
stations, treatment and landfilling of hazardous waste are given in J.M.D.
24944/1159/2006 «Concerning the establishment of general technical specifications
of hazardous waste management».
Moreover, J.M.D. 13588/725/2006 «On measures, terms and restrictions concerning
hazardous waste management», sets out among others, the obligations of all
operators involved in the management of hazardous waste and includes provisions
for pollution prevention and remediation and contaminated sites due to improper
management of hazardous wastes.
According to Article 11 of J.M.D. 13588/2006, every producer of hazardous waste
must keep records with data and submit annual report to the competent regional
authority, as well as to the competent authority for granting the environmental
permit. The standard forms of both the before mentioned records and annual report
are set in J.M.D 24944/2006. Moreover, as set in J.M.D 24944/1159/2006, hazardous
waste should be properly UN classified, packaged and labeled according to the
respective international and community standards of waste transport.
2.3.5. Medical Waste
J.M.D. 37591/2031/2003 «on measures and terms concerning healthcare waste
management», implements the provisions of article 12 of Law 1650/1986 in
conformity to the provisions of Directive 91/689/EEC, in order to ensure, through the
determination of directions, measures and procedures, a high-level of protection of
the environment and public health, especially through the prevention and/or
reduction of the production and of the hazardous effects of waste, or/and through
EIB Study: JESSICA instruments for SWM in Greece: FINAL Report - Part 1
34
their recovery, by means of the development and use of clean technologies, which
do not entail excessive costs.
J.M.D. 37591/2003, categorizes the medical wastes and sets out the technical
specifications for collection, transfer, treatment and final disposal of hazardous
medical waste. Moreover, the waste management license procedures is given, while
a monitoring system is set.
In addition to the J.M.D. 37591/2003, it must be noted that the National Medical
Waste Plan (NMWP) is under publication by the Ministry of Environment and Ministry
of Finance.
2.4. ACTORS INVOLVED IN THE WASTE MANAGEMENT SECTOR
In this section, the main actors which are involved in waste management in Greece
are described.
2.4.1. Ministry of Environment, Energy and Climate Change
At national level, J.M.D. 49541/1424/86, placed the overall responsibility for the
formulation of general policy directions in the hands of the Ministry of Environment,
Energy and Climate Change (until Sept 2009: Ministry of Environment, Spatial
Planning & Public Works). The Ministry of Environment, however, should act “in
cooperation with the other responsible Ministries, the Central Association of
Municipalities and Communities (KEDKE) and the Association of the Local Authorities
of Greek Prefectures (ENAE)”.
The Ministry of Environment is responsible for policy making, national planning,
technical matters, as well as licensing and regulating the financing of large waste
treatment and disposal facilities. More specifically:
Defines waste management policy
Prepares the legislative framework and proposes the issuing of legislative
regulations (Laws, Presidential Decrees, Join Ministerial Decisions, and
Ministerial Decisions) and issues circulars for the implementation of the
legislation.
EIB Study: JESSICA instruments for SWM in Greece: FINAL Report - Part 1
35
Prepares the National Planning of non hazardous Solid Waste and the
National Planning of hazardous Solid Waste, which contains the goals and
actions regarding waste management.
Evaluates and approves proposals for the funding of waste infrastructure
according to the regional and national planning in case of funding through
OPESD (see chapter 3).
Delivers opinion on whether the planned actions of the regional plan should
be included in Regional Operational Programmes (R.O.P.).
Is responsible for the environmental license of certain project categories (see
section 2.4.6)
2.4.2. Waste Management Inter-ministerial Committee
Special mention should be made of the inter-ministerial committee for integrated
waste management which was established during March 2008 according to the M.D.
325/14.03.08 on «Establishment of a Waste Management Inter-ministerial
Committee». The committee consists of the following:
a) the Vice Minister for Interior responsible for regional and local government as
well as for Development Programs in the role of the President,
b) the Vice Minister for Economy and Finance responsible for investment and
development issues, and
c) the Vice Minister for Development responsible for industrial and environmental
issues as well as for quality policy.
Main responsibilities of the committee are:
a) To issue and monitor an integrated plan that includes all activities related to
collection, recovery, storage, transportation, treatment, reuse and final
disposal of solid waste.
b) To issue and submit operational plans, programs and other actions involved
in the solid waste management sector and moreover to evaluate, approve
and finance those, with national or EC Funds and to monitor their
implementation.
EIB Study: JESSICA instruments for SWM in Greece: FINAL Report - Part 1
36
c) To monitor the implementation of waste management plans and the
coordination of the WMAs.
d) To coordinate and monitor suggestions and other actions for the sanitation
and later on the utilization of restored uncontrolled dumpsites and landfills.
Also to survey the works and the authorities responsible for their
implementation in order to impose penalties according to the law.
e) To comment on suggestions submitted to the committee responsible for
Public-Private-Partnership (PPP) projects and are relevant to solid waste
management.
f) To contribute towards campaigns aiming to inform and mobilize the public
opinion towards an environmental friendly solid waste management.
g) To represent the country in European and international level for issues
concerning solid waste and to submit financing requests, for some or all the
programs, actions and plans described in the Integrated Solid Waste
Management Plan.
2.4.3. Funding
The Ministry of Finance is involved in the funding of waste management
infrastructure projects through:
national funds, via the Ministry of Interior
national & EC structural funds, via the National Strategic Reference Framework
and more specifically via the R.O.Ps
national funds – complementary to private funds, via the PPP model, for
projects approved by the Inter-Ministerial PPP Committee, within the
framework of PPP Law 3389/2005.
2.4.4. Public Works
Since September 2009, Ministry of Public Works, Transport and Communication is
responsible for the following:
curve out the National policy and develop the appropriate legal framework as
well as the implementation of the policy in the sector of public works (including
waste processing facilities).
elaborate long-term and annual programmes of public works to be constructed

EIB Study: JESSICA instruments for SWM in Greece: FINAL Report - Part 1
37
set the national framework for the development of the technical, organizational
and economic capabilities of the constructing companies that undertake the
construction of public works.
2.4.5. Municipalities and Waste Management Authorities
According to the NSWMP , the operation of transfer stations, the processing and
disposal of waste lies within the jurisdiction of Waste Management Authorities
(WMA), while the Ministry of Interior is responsible for the establishment of the
registry of WMA. For waste streams apart from MSW, the management responsibility
lies with producers. Especially for the special waste streams that are included in Law
2939/01 (electrical waste, tires, vehicles etc), as stated above, recycling is carried
out by producer responsibility schemes created and financed by the producers.
Regarding WMA, according to Law 3536/2007 «on migration policy and other issues
falling into the competence of the Ministry of Interior, Public Administration and
Decentralization», can be Associations of Municipalities or S.A. of Municipalities,
while Ministry of Interior is responsible for organizing and monitoring the WMA
(registry, operational plans, etc). Moreover, WMA’s the legal form must be decided
within the date stated in the RSWMP. Otherwise the General Secretary of the Region
can impose the obligatory formation of the association, in which case all
Municipalities of the Administrative Area have to join.
Newly introduced J.M.D. 2527/2009 «on waste management authorities», describes
the competence field of the authorities. More specifically it is stated that they are
responsible for the operation of waste transfer stations, temporary storage,
transshipment, processing, recycling and disposal of waste as well as for the
implementation of the RSWMP . WMA are obliged to prepare a 4 year operational
plan which should contain a description of the Administrative Area, the pricing policy
and the monitoring procedure. WMA have to publish waste management results and
to send reports to the competent authorities of the Region and Ministry of
Environment.
As stated, J.M.D. 50910/2727/2003, «on measures and terms for solid waste
management» names the Municipalities as the competent authorities for the
collection and transfer of waste. The municipalities reserve the right not to collect
EIB Study: JESSICA instruments for SWM in Greece: FINAL Report - Part 1
38
waste that does not resemble household waste and cannot be collected for technical
reasons. In that case the producer is responsible for the collection.
According to the Ministerial Decision No. 2527 O.J.G. B 83/21.1.2009 it is possible for
WMA to take over collection of waste instead of the municipalities. A programme
contract between the WMA and the municipality can be signed towards that
direction.
2.4.6. Hellenic Recovery Recycling Corporation
Regarding recycling, as stated, Hellenic Recovery Recycling Corporation (HERRCO) is
the main competent authority for managing packaging waste. HERRCO was founded
in December 2001 by industrial and commercial enterprises while the Central Union
of Municipalities & Communities in Greece (KEDKE) has a shareholding of 35% in the
System’s share capital. HERRCO has developed and implemented the Collective
Alternative Management System – “RECYCLING” (C.A.M.S. – RECYCLING) in Greece
and organizes the municipal and industrial recycling program according to the
provisions of packaging directive.
HERRCO has come to an arrangement with packaging producers as stated in the
legal framework, and manage packaging waste produced directly from industries, in
order to ensure that packaging waste is being collected and recycled. Packaging
importers and packagers pay a financial contribution to the approved collective
alternative management systems, determined by their share of the packaging
market, which contributes to the costs of collection, transport, recovery, recycling
and information dissemination amongst users and consumers.
At the same time contracts have been signed with several municipalities in order to
install and expand the separation at source system of packaging material. Packaging
waste is temporarily stored in blue bins (source separation) that are provided by
HERRCO and afterwards transferred to Materials Recovery Facilities (MRF) under the
responsibility of Municipalities, using special waste collection vehicles made available
by HERRCO. MRFs operate under the responsibility or funding of HERRCO. Moreover,
HERRCO is responsible for the promotion of the separation at source system
EIB Study: JESSICA instruments for SWM in Greece: FINAL Report - Part 1
39
Following its first six-year period of operation (2003-2009), the renewal of the
system’s operation was ratified for the 2nd six-year period, namely 2009-2015, by
means of Ministerial Decision 118019/18-3-09. Furthermore, C.A.M.S.- RECYCLING is
the main Alternative Packaging Management System serving the packaging of all
non-hazardous products; in addition, following related audits, the competent
authorities have proposed that an Alternative Management Certificate (AMC) be
administered, thereby releasing affiliated enterprises from their legal obligation,
pursuant to the existing legal framework.
2.4.7. Environmental Permit
It must be noted that during the issuing of permission of solid waste management
infrastructure numerous authorities are involved as stated in the national and EU
legislation. For example, Regions and Prefectures are responsible for the
environmental license of certain project categories, while Forest and Archeological
authorities and the Ministries of Health and Culture need to deliver an opinion on the
Environmental Impact Assessment studies. Project categories and competent
authorities are briefly described next.
Categorization of Projects and competent authorities
According to J.M.D. 15393/2332/2002, public and private projects are classified into
different categories depending on the size, type and population covered by the
facility. Depending on the category there is a different procedure and competent
authority. The different categories are:
Category A includes works and activities, which may cause severe environmental
impact because of their nature, size or location and required both Preliminary
Environmental Impact Assessment (PEIA) and Environmental Impact Assessment
(EIA). Category A is divided into subcategories 1 and 2. The competent authorities
are:
• The Special Environmental Authority of Ministry of Environment for projects
under A1 category
• The Regional Environmental Authority for projects under A2 category
Category B includes projects, which do not cause severe environmental impact, but
terms and limitations should be set for ensuring environmental protection. Category
EIB Study: JESSICA instruments for SWM in Greece: FINAL Report - Part 1
40
B is also divided into subcategories 3 and 4. Projects under subcategory 4 required a
simple Environmental Study Report (ESR), while projects under B3 category after a
screening procedure are subsumed either into category A2 (PEIA and EIA) or B4
(ESR). The competent authorities are:
• The Regional Environmental Authority is screening the project under B3
category. After the screening procedure the project is subsumed either into
category A2 or B4
• The Prefectural Environmental Authority for projects under B4 category
Annex I of the J.M.D. 15393/2002 provides a list of 10 main groups of projects
categorized into A and B categories and their subcategories, taking into account their
size: motorways-roads, hydraulic projects, ports, infrastructure projects, mining
industry, tourism installations, stockbreeding and poultry installations, sea farm
installations, industrial installations and special projects.
2.5. MATURITY PLAN & ENVIRONMENTAL LICENSING PROCEDURE
One of the most critical parameter for case study selection is the maturity level of
each one, which is mainly based upon the current phase of the licensing process. All
major waste management units (Landfills, MBTs, MRFs, Transport Stations etc) are
subject to the same steps of environmental licensing. J.M.D. 11014/703/2003
regulates the procedure and evaluation of Environmental Impact Assessment, as well
as the Approval of Environmental Agreements Conditions, for works and activities of
subcategories 1 and 2 of class A and subcategories 3 and 4 of class B.
The maturity plan (not in case of PPP) and the environmental licensing process of all
major waste management units is divided into the next steps:
Step 1: Project Idea - Concept
Competent waste management authorities (WMA) assign to consultants the
preliminary assessments (feasibility and techno-economic studies) in order for the
final concept and idea to be established.
Step 2: Assignment and Preparation of the Preliminary Environmental Impact
Assessment (EIA Screening / Scoping Study Report)
EIB Study: JESSICA instruments for SWM in Greece: FINAL Report - Part 1
41
After the concept has been established, WMA assign the preliminary environmental
impact assessment to private engineering consultants. The preparation of a
Preliminary Environmental Impact Assessment Study is necessary according to Article
7 of J.M.D. 50910/03 for all projects. Assignment can be done through open
competition which lasts approximately 1 month or direct commission, while
preparation usually lasts 1-2 months, depending on the special characteristics of the
project under examination.
The EIA Screening / Scoping Study shall cover all aspects and matters that must be
evaluated and assessed on the basis of existing Greek and Community legislation.
The Study must be submitted for approval.
Step 3: Approval of Preliminary Environmental Impact Assessment
The Preliminary Environmental Impact Assessment Study has to be submitted to the
competent Prefecture, Region or Department of the Ministry of Environment, and
must include specific information, such as the position and size of the work, the use
of natural resources and the production of waste. The competent authority, following
an examination of the PEIA and a conclusion as to its completeness, and prior to
rendering an advisory opinion as to its content, transmits the file to the relevant
Ministries, bodies and entities within ten (10) days from the filing date. These
authorities shall render their advisory opinions within fifteen (15) days from the
receipt of the file. The competent authority, which receives the aforementioned
advisory opinions, shall proceed to an evaluation, which will be either a positive
Advisory Opinion or a negative decision on the PEIA.
Step 4: Assignment and Preparation of the Environmental Impact Assessment (EIA
Report)
The next step is the assignment of the Environmental Impact Assessment Study from
the WMA to private engineering consultants. Assignment can be done through open
competition which lasts approximately 1 month or direct commission, while
preparation usually lasts 1-2 months, depending on the special characteristics of the
project under examination. The ΕΙΑ along with the positive Advisory Opinion from
step 3 must be submitted for approval.
EIB Study: JESSICA instruments for SWM in Greece: FINAL Report - Part 1
42
Step 5: Approval of the Environmental Impact Assessment and publication of
Environmental Agreements.
The next step which is submitted to the competent Prefecture, Region or Department
of the Ministry of Environment depending on the population covered and the type of
the facility. The competent authority shall examine the file, decide upon whether it is
complete or not and, if it considers it expedient, shall subsequently transmit the file
to the competent Ministries and other bodies within ten (10) days from the filing
date. These public bodies shall transmit to the competent service any observations
they may have within thirty five (35) days from the receipt of the file. Following the
receipt of these advisory opinions, the decision approving (or not) the Environmental
Agreements shall be issued within fifteen (15) days.
By virtue of the decision approving the Environmental Agreements, certain measures,
conditions and limitations are imposed as regards the performance of the works or
the activity. These measures, conditions and limitations shall refer principally to the
kind, the size and basic technical characteristics of the work or the activity, the
emission limit values, the monitoring of the observance of environmental conditions
from the matter of the work or the activity, the environment of the area, and,
possibly, to the specially protected zones and the determination of the necessary
measures and works for their preservation.
Step 6: Assignment and Preparation of Technical Engineering Studies and Tender
Documents
In this step, the preparation of all the appropriate technical engineering studies and
tender documents are assigned by WMA to private engineering consults, in order for
all the necessary information about the implementation of the project to be identified
and assessed.
The Tender Documents, among others, include:
Technical Specifications for all construction works / equipment
Preliminary design / studies and drawings
Bills of quantities with pre-measurements
EIB Study: JESSICA instruments for SWM in Greece: FINAL Report - Part 1
43
Step 7: Application for Funding
In this step WMA, usually with the assistance of the aforementioned consulting
engineers, prepare and submit a complete application file for co-funding of the
Project by either the Cohesion Fund (OPESD) in accordance with the European Union
requirements (application only to “Major Projects”), or R.O.P funds (Special
Management Agent).
Step 8: Project Tender
In this step candidates (constructors) submit their tenders, and WMA, usually with
the assistance of the aforementioned consulting engineers, evaluate the tenders and
prepare an evaluation report.
Step 9: Assign and Construction
The final step involves the contract assignment and construction of the project based
on the above-mentioned evaluation report.
Next a schematic representation of the above steps is presented.
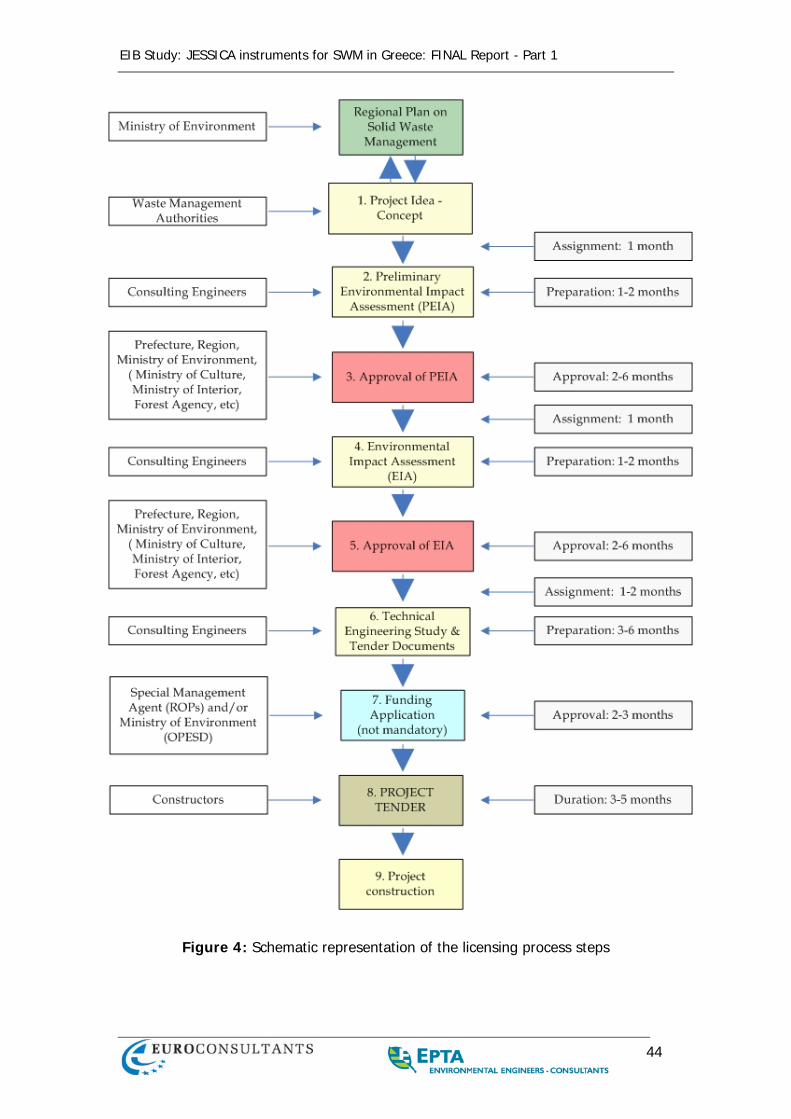
EIB Study: JESSICA instruments for SWM in Greece: FINAL Report - Part 1
44
Figure 4: Schematic representation of the licensing process steps
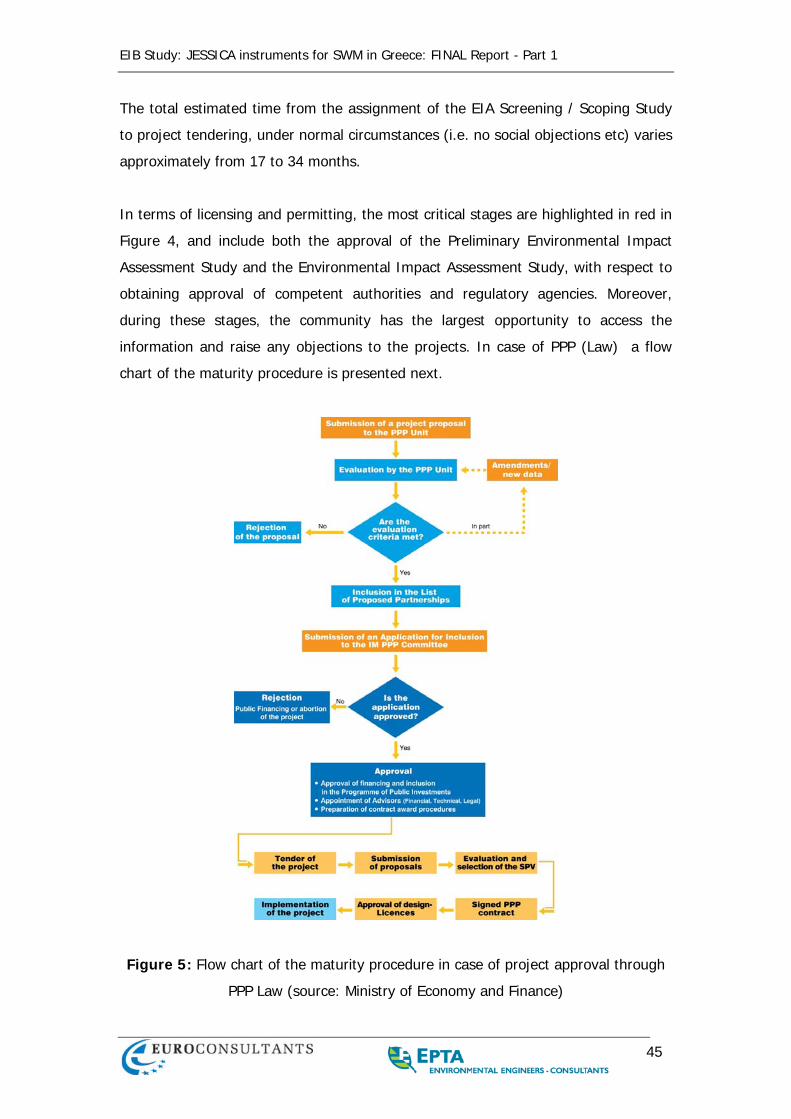
EIB Study: JESSICA instruments for SWM in Greece: FINAL Report - Part 1
45
The total estimated time from the assignment of the EIA Screening / Scoping Study
to project tendering, under normal circumstances (i.e. no social objections etc) varies
approximately from 17 to 34 months.
In terms of licensing and permitting, the most critical stages are highlighted in red in
Figure 4, and include both the approval of the Preliminary Environmental Impact
Assessment Study and the Environmental Impact Assessment Study, with respect to
obtaining approval of competent authorities and regulatory agencies. Moreover,
during these stages, the community has the largest opportunity to access the
information and raise any objections to the projects. In case of PPP (Law) a flow
chart of the maturity procedure is presented next.
Figure 5: Flow chart of the maturity procedure in case of project approval through
PPP Law (source: Ministry of Economy and Finance)
EIB Study: JESSICA instruments for SWM in Greece: FINAL Report - Part 1
46
3. FUNDING OF WASTE MANAGEMENT INVESTMENTS
3.1. NSRF 2007-2013 & URBAN DEVELOPMENT
3.1.1. General Description of NSRF 2007-2013
The National Strategic Reference Framework (NSRF) 2007–2013 constitutes the
reference document for the programming of European Union Funds at national level
for the 2007–2013 period. The NSRF targeting was structured over 4 levels:
the NSRF strategic objectives level,
the thematic (5) and spatial (3) priorities level, as required by the General
Regulation of the Funds,
the level of the General Objectives, in which each thematic priority is
subdivided,
the level of special targets and of main means of achievement.
The architecture of the NSRF 2007-2013 Operational Programmes (OPs) was
formulated in such a way as to implement the country's strategic choices in the best
possible manner, whilst also taking into account new data for the programming
period 2007–2013 (63% of the country's population in a state of transitional
support).
The new scheme is characterised by a smaller number of Operational Programmes in
relation to the previous 2000–2006 period, leading to a more flexible management
scheme, while the number of programmes was reduced from 25 to 14. The country’s
strategic planning for the 2007 - 2013 period will be implemented through eight (8)
Sectoral OPs, five (5) Regional OPs and twelve (12) European Territorial Cooperation
OPs. Thus, during the 2007–2013 period, all accessibility infrastructure projects will
be implemented through a single OP, while there will no longer be a distinct OP for
the sectors of health and culture and the relevant actions will be carried out through
Regional and Sectoral OPs. Furthermore, one programme is for a national
contingency reserve under the Convergence Objective.
EIB Study: JESSICA instruments for SWM in Greece: FINAL Report - Part 1
47
Three of the Sectoral programmes and the contingency reserve are co–funded by the
European Social Fund (ESF), while the rest 5 sectoral programmes and all regional
programmes are funded by the European Regional Development Fund (ERDF). The
Cohesion Fund (CF) provides additional funding for the accessibility and
environmental programmes.
3.1.2. Sectoral Operational Programmes
The Sectoral Operational Programmes are the following:
S.O.P. «Environment & Sustainable Development» (co-funded by Cohesion Fund
& ERDF)
S.O.P. «Accessibility Improvement» (co-funded by Cohesion Fund & ERDF)
S.O.P. «Competitiveness and Entrepreneurship» (co-funded by ERDF)
S.O.P. «Digital Convergence» (co-funded by ERDF)
S.O.P. «Human Resources Development» (co-funded by ESF)
S.O.P. «Education and Lifelong Learning» (co-funded by ESF)
S.O.P. «Public Administration Reform» (co-funded by ESF)
S.O.P. «Technical Support for Implementation» (co-funded by ERDF)
S.O.P. «Environment & Sustainable Development»
The main developmental aspiration of the programme concerns the protection,
upgrading and sustainable management of the environment, so that it may
constitute the foundation for the protection of public health, the improvement of
citizens’ quality of life, as well as contribute to the enhancement of the
competitiveness of the Economy. Some of the major interventions that will take place
in the context of the Operational Programme are the integrated management of solid
and hazardous waste and the protection of the soil, the management of urban
waste, the application of action plans for the limitation of air pollution, pollution of
the marine environment and the coasts. It also aims at the integrated protection and
management of biotopes, the establishment of infrastructure for large scale anti-
flood protection and the prevention and effective mitigation of natural and
technological disasters.
EIB Study: JESSICA instruments for SWM in Greece: FINAL Report - Part 1
48
S.O.P. «Accessibility Improvement»
The program focuses on the following:
Development and modernisation of the country’s transportation infrastructure
Completion of the construction and upgrade of road axes, railway network,
port facilities and airports.
Completion of the construction of Athens Metro projects and urban road
works in the Attica and Central Macedonia Regions. Special emphasis is
placed on transport safety.
S.O.P. «Competitiveness and Entrepreneurship»
The program focuses on the following:
Improvement of the competitiveness and outward orientation of the country’s
businesses and production system, placing special emphasis on the
innovation factor.
Promotion of the country’s Research, Development and Innovation (RDI)
system and its interconnection with the productive fabric. Qualitative upgrade
of products, promotion of corporate networking, improvement of market
supervisory mechanisms. Ensuring adequate energy capacity for the country,
including through the use of Renewable Energy Sources.
S.O.P. «Digital Convergence»
The program aims at promoting the use of Information and Communication
Technologies (ICT) by enterprises, streamlining procedures in the Public Sector,
promoting entrepreneurship in sectors making use of ICTs, increased utilisation of
digital applications in State administration for the benefit of the citizen and improved
quality of life achieved through ICTs.
S.O.P. «Human Resources Development»
The program focuses on the following:
strengthening the adaptability of human resources and enterprises
Assist access to employment.

EIB Study: JESSICA instruments for SWM in Greece: FINAL Report - Part 1
49
Establishment of reforms in the Mental Health sector, development of Primary
Healthcare and promotion of Public Health.
Supporting employment of women and youth, mature employees and
vulnerable social groups. Promotion of equal access to the job market, as well
as alleviating social isolation and boosting social cohesion.
S.O.P. «Education and Lifelong Learning»
The program focuses on the following:
Upgrade of the quality of education and promotion of social integration.
Upgrade of initial vocational training and vocational educational systems and
linking education with the job market.
Strengthening human capital in order to promote research and innovation.
Reforms in the educational system so that lifelong learning will become a
reality for all.
Revision of study programmes, acceleration of the pace of adoption of new
technologies, restructuring vocational training in various sectors, including the
maritime professional sector etc, expansion of Second Chance Schools, Adult
Training Centres and the Open University and reinforcement of Lifelong
Learning Institutes, training educators and boosting specially-targeted
teaching addressed at minorities.
S.O.P. «Public Administration Reform»
Creation of a citizen-centred, effective, open and flexible governance model,
for the transition from role and procedural-based management to
management by results-oriented policies and services rendered.
Reconfiguration, application and evaluation of public policies and
programmes, streamlining administrative procedures, organisational and
functional reorganisation and administrative restructuring, coverage of the
needs of public administration in training and upgrading the quality of service
provision in practice.
EIB Study: JESSICA instruments for SWM in Greece: FINAL Report - Part 1
50
S.O.P. «Technical Support for Implementation»
The Operational Programme “Technical Support for Implementation 2007-2013” was
designed with the purpose of boosting the executive bodies and supporting
structures of the management and coordination system of the OP, as well as the
beneficiary bodies, through the funding of preparatory, management, monitoring,
evaluative, informative and control activities of Operational Programmes, as well as
activities aiming at improving administrative functionality, for the realisation of the
activities included under the Funds, which cover both priority codes of thematic
priority "Technical Assistance" foreseen under Implementation Regulation (Article 11
and Annexes II and III), namely under no. 85 "Preparation, application, monitoring
and inspections" and no. 86 "Evaluation and studies, information and publicity”.
National Contingency Reserve
The National Contingency Reserve, pursuant to the provisions of Article 51 of Council
Regulation 1083/2006, is a form of intervention designed to meet unforeseen local or
sectoral crises linked to economic and social restructuring or to the consequences of
the opening up of trade. The structure and content of the OP «National Contingency
Reserve 2007-2013» are designed so as to cover the funding of a complex of actions
that serve the aforementioned objectives through 2 Priority Axes, titled:
Priority Axis 1: «Medium- and long-term support of human resources affected
by the consequences of unforeseen local or sectoral crises linked to economic
and social restructuring or to the consequences of the opening up of trade in
the “Convergence” Objective regions.
Priority Axis 2: «Immediate tackling of the direct consequences affecting the
human resources due to unforeseen local or sectoral crises linked to
economic and social restructuring or to the consequences of the opening up
of trade in the “Convergence” Objective regions.
3.1.3. Regional Operational Programmes
For the implementation of the country’s development planning during programming
period 2007-2013, Greece was divided into five regions, which correspond to five
Regional Operational Programmes (R.O.P.), as follows:
EIB Study: JESSICA instruments for SWM in Greece: FINAL Report - Part 1
51
R.O.P. of Macedonia & Thrace
R.O.P. of Western Greece, Peloponnese & Ionian islands
R.O.P. of Aegean & Crete
R.O.P. of Thessaly, Central Greece & Epirus
R.O.P. of Attiki
ROP will contribute towards meeting the national strategic goals, in conjunction with
the sectoral programmes, with an emphasis placed on the distinct characteristics and
needs of each Region. In any case, ROP for all the Regions will cover a common core
of interventions, as follows:
sustainable urban development policies
social infrastructure
health and social solidarity (infrastructure for hospitals and social welfare
facilities, special units, healthcare and open-care centres, specialised
equipment, measures for the promotion and protection of Public Health)
culture (reinforcing basic cultural infrastructure, safeguarding and
enhancement of cultural heritage)
accessibility and environmental projects on a local scale
policies in support of mountainous, underdeveloped and island areas.
The regional operational programmes formulate priority axes dedicated to
sustainable urban development while, additional funding mechanism such as the
global grants (article 42 & 43 Of Regulation 1083/2006) are foreseen. Additionally,
all the regional operational programmes make a reference to potential JESSICA
usage, in order to achieve the objectives. Furthermore it must be noted that Athens
belongs to the O.P. of Attiki, while Thessaloniki to the O.P. of Macedonia – Thrace.
3.1.4. European Territorial Cooperation Programmes
During the new programming period, the Community Initiative Programmes are
replaced by the Programmes of Goal III "European Territorial Cooperation". The total
budget of Goal III programmes amounts to EUR 8.7 billion, of which EUR 210 million

EIB Study: JESSICA instruments for SWM in Greece: FINAL Report - Part 1
52
from the European Regional Development Fund (ERDF) have been earmarked for
Greece. Νearly EUR 300 million of Community and national resources will be
allocated to European Territorial Cooperation Programmes.
Cross-border Programmes
In this framework and in regard to the Cross-border Cooperation Programmes,
Greece participates in six Programmes, with a total budget that exceeds EUR
320,000,000, for which it retains the Managing Authority.
The Programmes are as follows:
“Greece-Bulgaria” Programme, with a budget of EUR 110,735,958
“Greece-Italy” Programme, with a budget of EUR 88,955,170
“Greece-Cyprus” Programme, with a budget of EUR 41,633,290
“Greece-Albania” Programme, co-funded by the Instrument for Pre Accession
Assistance (IPA) with a budget of EUR 22,143,015
“Greece-FYROM” Programme, co-funded by IPA with a budget of EUR
24,810,005
“Greece-Turkey” Programme3, co-funded by IPA with a budget of EUR
34,088,992
Greece also participates in three (3) multilateral cross-border cooperation
Programmes:
Adriatic Programme, with eligible territories being those of the Prefectures of
Corfu and Thesprotia in Greece, as well as regions in Italy, Bosnia-
Herzegovina, Montenegro, Albania, Serbia and Slovenia. The Programme is
co-funded by IPA, while Greece contributes EUR 5,659,992.
Mediterranean Sea Basin, with eligible territories being those of all countries
located around the Mediterranean Sea. The total programme Budget exceeds
EUR 170,000,000.
Black Sea, with the Regions of Central and Eastern Macedonia–Thrace in
Greece, as well as regions in Bulgaria, Romania, Russia, Turkey, Azerbaijan,
3 Under Suspension
EIB Study: JESSICA instruments for SWM in Greece: FINAL Report - Part 1
53
the Ukraine, Georgia, Romania and Moldavia as eligible territories. The
contribution of Greece amounts to EUR 1,132,000 and will have a reinforced
role, as it has been decided that it will designate the First Consultant of the
Managing Authority, which is being hosted in Romania.
Transnational Programmes
Greece participates in two transnational programmes. These are:
MEDA Programme, in which Greece, Spain, Italy, France, Portugal, United
Kingdom–Gibraltar, Malta, Cyprus, Slovenia, Croatia and Bosnia–Herzegovina
participate. The Programme resulted from the merger of the INTERREG
ARCHIMED and MEDOCC Programmes. One of the Programme’s two Liaison
Offices will be located in Thessaloniki, which will be responsible, among
others, for supporting candidate partners and Final Beneficiaries from among
the candidate and potential candidate countries for accession to the European
Union participating in the Programme. The Programme Budget amounts to
EUR 193,191,331.
Southeast Europe Area, in which eight (8) E.U. Member States participate
(Italy, Austria, Hungary, Slovakia, Slovenia, Romania, Bulgaria and Greece),
as well as Moldavia, Croatia, Serbia, Montenegro, Bosnia-Herzegovina,
Albania, FYROM and the Ukraine. The Programme resulted from the division
of the CADSES programme into two different zones, north and south. Its
budget amounts to EUR 206,691,645.
Interregional Programme
Greece participates in the INTERREG IV C interregional programme, in which all E.U.
Member States –with the exception of Germany– participate, as well as Norway and
Switzerland. Its Budget amounts to EUR 321,321,762.
Networks
Greece also participates in the INTERACT, ESPON and URBACT networks.
3.1.5. Financial Framework – European Funds for Cohesion Policy
The allocation of Community resources for Cohesion Policy of period 2007-2013, was
decided at the session of the European Council held in December 2005. Greece is
EIB Study: JESSICA instruments for SWM in Greece: FINAL Report - Part 1
54
allocated EUR 20.4 billion in current values (including national match funding). These
resources will be used to finance interventions through the European Regional
Development Fund (ERDF), the European Social Fund (ESF) and the Cohesion Fund.
The total amount of funding, as well as its annual allocation, is separately designated
for each type of Region. Thus, a total amount of EUR 9.4 billion is allocated to the 8
Regions classified under Objective Convergence. EUR 6.5 billion is allocated to the 3
Statistical phasing out Regions (Attiki, Central and Western Macedonia). In the 2
Phasing In Regions (Mainland Greece, Southern Aegean) are allocated EUR 0.63
billion. Additionally, for the Programmes falling under Objective 3, there are
Community funds available in the amount of EUR 0.21 billion. As laid down in the
Greek National Strategic Reference Framework, from the total amount of the
aforementioned amounts, namely EUR 16.7 billion, EUR 12.36 billion is channelled to
the new Operational Programmes through the European Regional Development Fund
(ERDF) and the remaining EUR 4.36 billion will be channelled thereto through the
European Social Fund (ESF). Additionally, Community funds of EUR 3.7 billion are
earmarked for Greece through the Cohesion Fund.
Finally, EUR 3.9 billion, are invested to Greek regions, through the Programmes of
the Ministry of Rural Development and Food. These resources are part of the
European Agricultural Fund for Rural Development (EAFRD) and the European
Fisheries Fund (EFF).
3.1.6. Environment & Sustainable Development
As stated, there is no sectoral operational programme dedicated to urban
development. However, all sectoral programmes comprise of priority axes that
directly or indirectly promote the target of sustainable urban development. The most
relevant ones are as follows:
S.O.P. «Environment & Sustainable Development», priority axis 4 - soil
protection and solid waste management.
S.O.P. «Accessibility Improvement», i.e. priority axes of transport
infrastructure, means of public transport etc.
EIB Study: JESSICA instruments for SWM in Greece: FINAL Report - Part 1
55
S.O.P. «Competitiveness and Entrepreneurship», priority axis that ensure the
adequate energy capacity for the country through the use of Renewable
Energy Source.
S.O.P. «Environment & Sustainable Development»
The operational program ‘’Environment and Sustainable Development’’ (OPESD 2007-
2013), was submitted during September 2007 and was approved during October –
November 2007. The program consists of eleven priority axis. As stated, solid waste
management is included in Axis 4 (Soil Protection and Solid Waste Management)
which aims to protect public health, soil and underground water from the pollution
caused by uncontrolled dumping of solid waste.
Together and in accordance with the regional operational programs, the necessary
infrastructure in order to divert the biodegradable fraction of MSW from landfills
towards treatment facilities that are described in the Regional Plan will be financed.
The OPESD through the Cohesion Fund and the Regional Operational Programmes
through the ERDF will cover the costs for the construction of transfer stations,
treatment units and landfills including the costs for rehabilitation of all uncontrolled
dumpsites throughout the country.
Priority will be given to actions described in the regional solid waste management
plans. The total budget of Axis 4 for Soil Protection and Solid Waste Management in
the OPESD reaches 288,995,000 €. This amount consist of 179,380,000 € from
Cohesion Funding, € 44,845,000 from National Funding and 65,770,000 € from other
sources (e.g. private investments). OPESD has already distributed the total amount
to certain Regions for regional solid waste management plans. In the region of Attiki,
the total funding that have beet committed for waste management from OPESD
(Cohesion Fund) is € 72 Mio.
In the following diagram, the allocation of the above-mentioned funds is outlined.
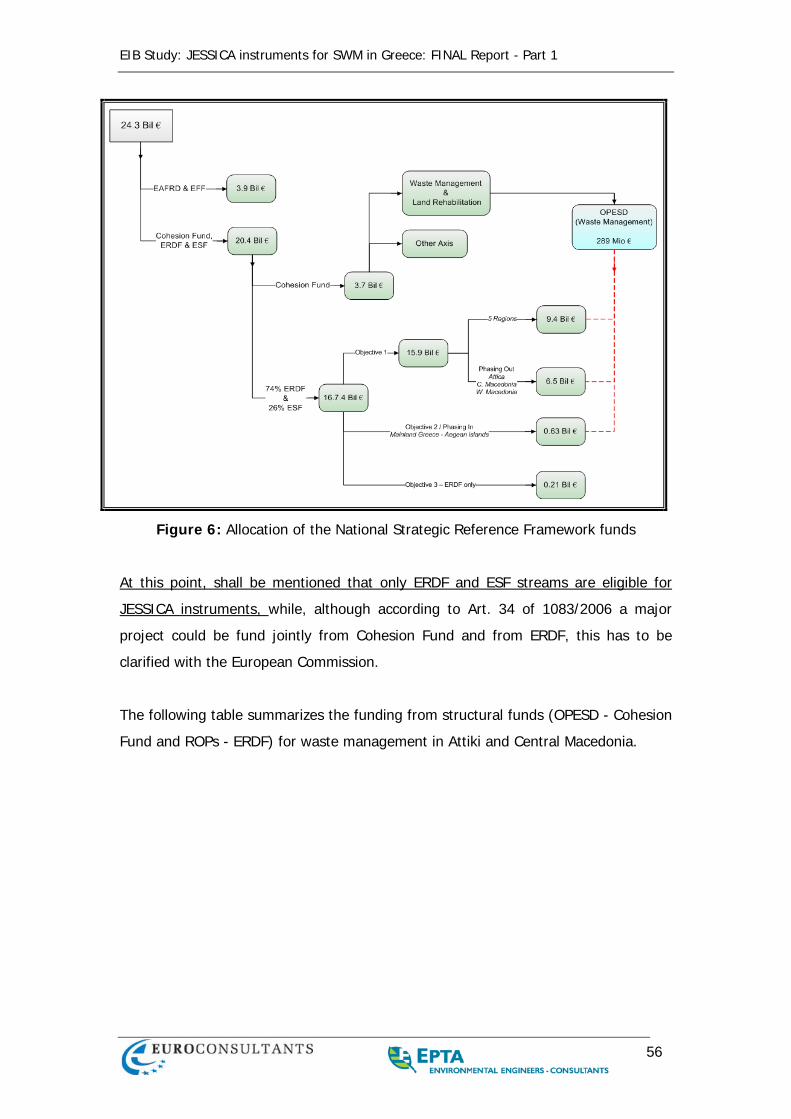
EIB Study: JESSICA instruments for SWM in Greece: FINAL Report - Part 1
56
Figure 6: Allocation of the National Strategic Reference Framework funds
At this point, shall be mentioned that only ERDF and ESF streams are eligible for
JESSICA instruments, while, although according to Art. 34 of 1083/2006 a major
project could be fund jointly from Cohesion Fund and from ERDF, this has to be
clarified with the European Commission.
The following table summarizes the funding from structural funds (OPESD - Cohesion
Fund and ROPs - ERDF) for waste management in Attiki and Central Macedonia.
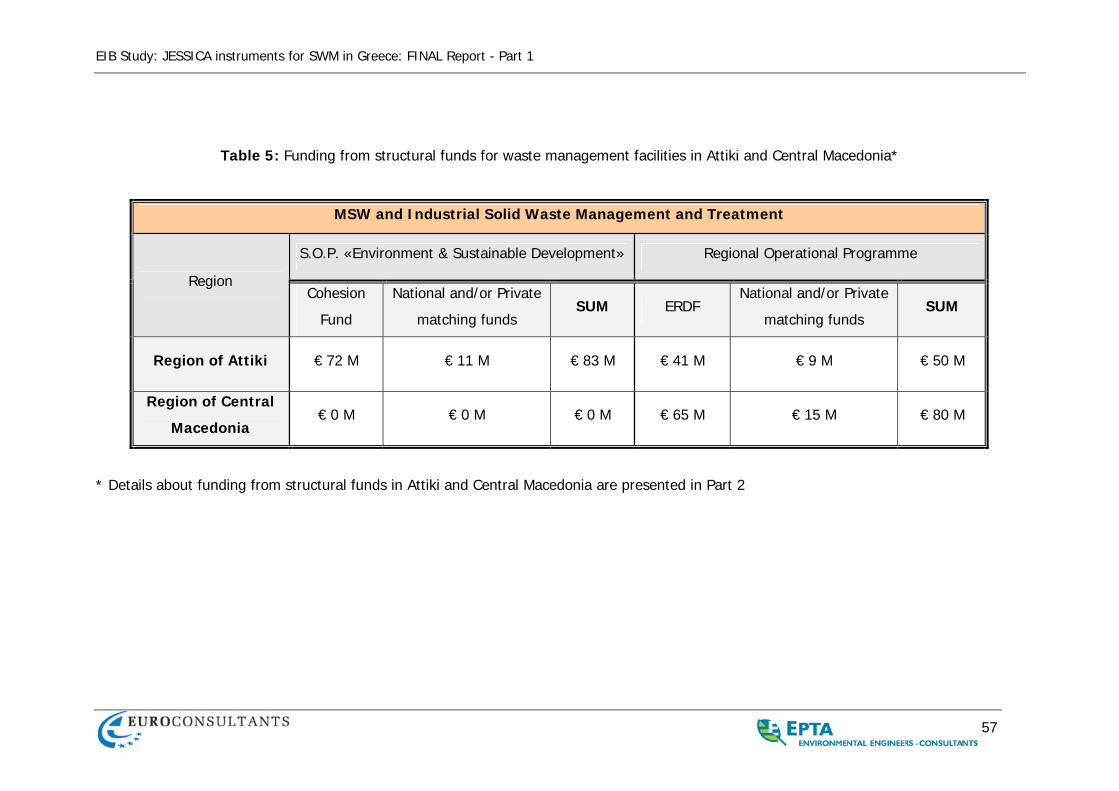
EIB Study: JESSICA instruments for SWM in Greece: FINAL Report - Part 1
57
Table 5: Funding from structural funds for waste management facilities in Attiki and Central Macedonia*
MSW and Industrial Solid Waste Management and Treatment
S.O.P. «Environment & Sustainable Development» Regional Operational Programme
Region Cohesion
Fund
National and/or Private
matching funds SUM ERDF
National and/or Private
matching funds SUM
Region of Attiki € 72 M € 11 M € 83 M € 41 M € 9 M € 50 M
Region of Central
Macedonia € 0 M € 0 M € 0 M € 65 M € 15 M € 80 M
* Details about funding from structural funds in Attiki and Central Macedonia are presented in Part 2
EIB Study: JESSICA instruments for SWM in Greece: FINAL Report - Part 1
58
3.2. PUBLIC – PRIVATE PARTNERSHIPS (PPP) FRAMEWORK
3.2.1. General Description
Law 3389/2005 establishes a new legal framework for the implementation of Public -
Private Partnerships in Greece. This legal framework aims to promote the
implementation of PPP projects, taking into consideration the experience gained from
concession agreements that were successfully implemented in Greece, especially for
large scale projects in transportation sector (i.e. new Athens Airport, Attiki Odos
motorway, Rio-Antirrio bridge), but also the important attempts over the last years to
implement privately funded projects in other sectors.
The implementation of PPPs has been the issue of consultation for many years in
Greece. It was necessary to overcome a legal gap in Greece, which led each
contractual agreement for a project co-financed by the private sector for ratification
by the Parliament. Furthermore, lot of issues, hindering the negotiations for the
financing of the projects and causing delays in their implementation, had to be
settled.
It was also necessary to create a framework, through which private entities would be
able to implement projects and services, without imposing indirect / shadow
charging schemes for end users.
The time required to tender a PPP project depends on its maturity and the actions
already taken by the Contracting Authority (the public institution) to ensure the
successful implementation of the project. The main characteristic of this procedure,
according to the international practice and given the lack of internal capacity in PPP
projects, is the recruitment of external, financial, technical and legal advisors. These
advisors assist the authorities to prepare projects faster and more effectively, since
the tender documents and procedures differ from those of traditional Public
Procurements. The new tasks needed In the PPP tenders and provided by the
external advisors, are: Project Financial Model, Risks allocation matrix, Payment
mechanism model, Public Sector Comparator - VfM, market sounding survey,
financial advise to the Public Entities, till the SPV financing is definitely ensured and
the relevant loan contracts are signed. Also, in PPP tenders, emphasis is given in the
EIB Study: JESSICA instruments for SWM in Greece: FINAL Report - Part 1
59
project operation and maintenance requirements, instead of the detailed technical
design – as it is usually the case for traditional Public Procurements.
PPP schemes are complementary not only to traditional public works, but also to
other forms of partnerships between the public and the private sector, such as the
concession agreements or collaborations between Local Authorities and private
partners. Anyhow, the Ministry of Finance intends to offer to Public Authorities a new
additional mechanism & financial tool (PPPs though the Law 3389/2005), the use of
which is upon them. To choose between the two options (concession or PPP through
the new Law), the Local Authorities should take into consideration the benefits and
setbacks of each procedure:
Concession through existing Public Procurement Law: More familiar procedure and
tender documents, shorter tender procedure, but tighter legal environment of
contract implementation
PPP through the new law 3389/2005: accelerated approval of project permits /
licenses, supplementary public financing, more effective legal provisions for possible
disputes between Contracting Authority and SPV, but lengthy procedures for project
approval and tendering.
3.2.2. SWM projects approved by PPP Committee
So far (Oct 2009) the following two SWM projects have been approved by the Joint
Ministers’ Committee for PPPs:
Project 1: “Implementation of an integrated waste-management system in the
Prefecture of Thessaloniki”
Contracting Authority: Union of Municipalities of the Greater Thessaloniki area
Date of approval: 30 Jan 2008
Indicative Budget 242 million euros (+20% insurance cost and heavy
maintenance cost)
Project Duration: 29 years
Construction Period: 4 years
Operation Period: 25 years
Forecasted period of SPV selection: mid 2010

EIB Study: JESSICA instruments for SWM in Greece: FINAL Report - Part 1
60
Project Details:
This PPP project involves the design, financing, construction, maintenance, facility
management and operation of the new infrastructure of the integrated waste
management system in the Prefecture of Thessaloniki for a period of 29 years.
More specifically, the private partner will undertake the design, construction,
maintenance and operation of a plant that will treat solid waste of the North-western
unit of the Prefecture of Thessaloniki. This plant will be composed of a treatment and
exploitation unit and a compliant residual waste landfill. This unit will be constructed
upon any proven technology that can meet the targets set by the Community
Directives and the output specifications set by the Contracting Authority. The unit will
have a capacity of 400.000 tons per year. Moreover the private partner will be given
the right to commercially exploit the output of the unit (such as recyclable products,
biogas, RDF, energy, etc.)
Project 2: “Implementation of infrastructure for the Integrated Waste Management
System in the Region of Western Macedonia”
Contracting Authority: DIADYMA S.A.
Date of approval: 02 Aug 2007
Indicative Budget 97 million euros (+20% insurance cost and heavy
maintenance cost)
Project Duration: 27 years
Construction Period: 2 years
Operation Period: 25 years
Forecasted period of SPV selection: mid 2010
Project Details:
This PPP project involves the design, construction, financing, maintenance, facility
management, and operation of the new infrastructure, aiming at covering the waste
management requirements imposed by the Community Directives. Contracting
Authority of this project is DIADYMA SA (Local Authorities’ Development Agency,
responsible for the design development and operation of the Integrated Waste
Management System of Western Macedonia).
More specifically, the SPV that will be selected will undertake the following:
EIB Study: JESSICA instruments for SWM in Greece: FINAL Report - Part 1
61
The design, construction, maintenance and operation of the central integrated
waste management installations, which will be composed by a treatment and
exploitation unit and a compliant residual waste landfill. This unit will be
constructed upon any proven technology that can meet the targets set by the
Community Directives and the output specification set by the Contracting
Authority. Moreover the SPV will be given the right to commercially exploit the
output of the unit (such as recyclable products, biogas, RDF, SRF , etc.)
The maintenance and operation of the existing network of waste transfer
stations, when the treatment unit begins its operation. This network consists of
ten transfer stations and their mobile equipment.
The capacity of the above mentioned unit starts from 120.000 tons per year,
reaching 152.000 tons per year by the end of the partnership, the operational period
of which is 25 years.
This PPP project is a part of the strategic plan of the Region of Western Macedonia.
The construction and operation of the treatment comes to integrate the existing
integrated waste management system of the Region, thus creating a waste
management model, completely compatible with the environmental strategy of the
European Union. The implementation of this project ensures that the amount of
waste to landfill decreases, the environmental impact of treating biodegradable
waste is minimized, and that commercially exploitable products are produced.
Moreover, the construction and operation of the treatment unit results to doubling
the life cycle of the existing landfill and maximizing the impact of the investment
made during the 2002 - 2004 period, financed by the Cohesion Fund.
3.2.3. Proposal to PPP Unit
In case of PPP (Law 3389/2005), the Public Entity (e.g. WMA) wishing to implement
a PPP project may submit a proposal to the PPP Unit, which then evaluates the
feasibility of the specific project under a PPP scheme. This proposal should include
the following:
Detailed description of the project that will be provided as a PPP, and its
technical characteristics,
EIB Study: JESSICA instruments for SWM in Greece: FINAL Report - Part 1
62
Indicative budget of the proposed PPP project,
Operation and maintenance cost,
Schedules,
Presentation of the proposed PPP scheme,
Value for Money (VfM) evaluation, which justifies the implementation of the
project under a PPP scheme,
Other issues that influence the implementation of the project, such as legal
and environmental.
The PPP unit analyses the public entity's proposal and determines whether it can be
implemented as PPP under the provision of Law 3389/2005. In case that the
proposal in positively evaluated, as it was initially submitted or was finally amended
with necessary modifications, the PPP unit includes it in the "List of Proposed
Partnerships" and notifies the public entity of this decision. If the involved Public
Entity decides to submit an "Application for Inclusion" within no more than two
months after the date of notification the Minister of Economy, acting as the President
of the IM PPP Committee, sets this application as an item of the agenda of the next
meeting of the IM PPP Committee and invites all regular members and the Minister
that supervises the involved Public Entity.
In this meeting, the report drafted by the PPP Unit is presented to the Ministers, and
all necessary and additional information and clarifications are provided, so as to help
Ministers to reach a decision. After that, the IM PPP Committee announces its
decision, to either approve or reject this application. If the IM PPP Committee
decides to approve a partnership, the PPP Unit has to coordinate and monitor all
contract award procedures, as defined in Law 3389/2005, so as to select the Special
Purpose Vehicle (SPV) that will participate in the partnership.
Beyond specific regulations with the award of PPP contracts, it must be noted that
Law 3389/2005 is in line with the general principles of both national and Community
law (equal treatment, transparency, protection of public interest etc), regulating the
contract award procedures and the relations of the Contracting Authorities with
candidates. The procedures for contract award are either open or restricted. In the
case of complex contracts, the process of the competitive dialogue or the negotiated
procedure may be applied.

EIB Study: JESSICA instruments for SWM in Greece: FINAL Report - Part 1
63
Contracts will be awarded by the Public Entity acting as Contracting Authority either
on the criterion of the tender being the most economically advantageous or on the
criterion of lowest price. The minimum qualifications and abilities of the tenders who
participate in the contract procedure are clearly defined by the Invitation to Tender.
EIB Study: JESSICA instruments for SWM in Greece: FINAL Report - Part 1
64
4. MSW GENERATION AND MANAGEMENT IN GREECE
4.1. INTRODUCTION
The waste quantity and composition directly influence the functioning of and capacity
required for waste collection and treatment/disposal systems and facilities. In
planning an upgrade of existing or development of new systems/facilities it is
therefore of utmost importance to as accurately as possible determine the current
waste quantity and composition.
In planning and executing a waste quantity and composition survey, it shall be
considered that the waste generation varies between waste generators, between
days in the same period and between seasons. Therefore, careful planning and
execution is required to achieve representative and correct results.
In this chapter, existing and future quantities of MSW generate in Greece, existing
waste management and future planning according to National and Regional Solid
Waste Management Plans are described.
4.2. MSW CURRENT GENERATION AND COMPOSITION
4.2.1. MSW composition
According to Eurostat and the European Environment Agency (EEA), Municipal Solid
Waste (MSW) includes predominantly household waste (domestic waste) with the
addition of commercial waste (waste from premises used wholly or mainly for the
purposes of a trade or business or for the purpose of sport, recreation, education or
entertainment), non hazardous waste from industry and waste from clinics and
hospitals, which are similar in nature and composition to household waste, collected
by or on behalf of municipal authorities and disposed of through the waste
management system.
In summary MSW includes:
Household waste;
Garden (yard) and park waste; and
Commercial/institutional waste similar in nature and composition to household
waste.
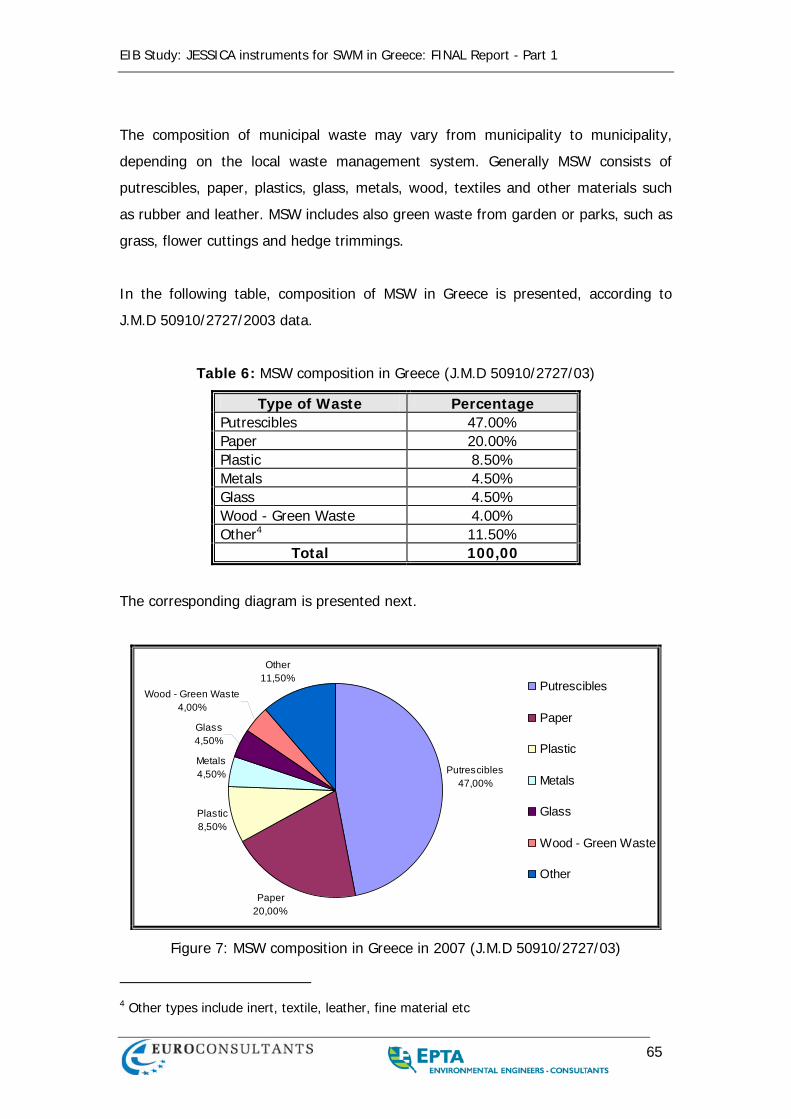
EIB Study: JESSICA instruments for SWM in Greece: FINAL Report - Part 1
65
The composition of municipal waste may vary from municipality to municipality,
depending on the local waste management system. Generally MSW consists of
putrescibles, paper, plastics, glass, metals, wood, textiles and other materials such
as rubber and leather. MSW includes also green waste from garden or parks, such as
grass, flower cuttings and hedge trimmings.
In the following table, composition of MSW in Greece is presented, according to
J.M.D 50910/2727/2003 data.
Table 6: MSW composition in Greece (J.M.D 50910/2727/03)
Type of Waste Percentage Putrescibles 47.00% Paper 20.00% Plastic 8.50% Metals 4.50% Glass 4.50% Wood - Green Waste 4.00% Other4 11.50%
Total 100,00
The corresponding diagram is presented next.
Putrescibles47,00%
Paper20,00%
Plastic8,50%
Metals4,50%
Glass4,50%
Wood - Green Waste4,00%
Other11,50%
Putrescibles
Paper
Plastic
Metals
Glass
Wood - Green Waste
Other
Figure 7: MSW composition in Greece in 2007 (J.M.D 50910/2727/03)
4 Other types include inert, textile, leather, fine material etc
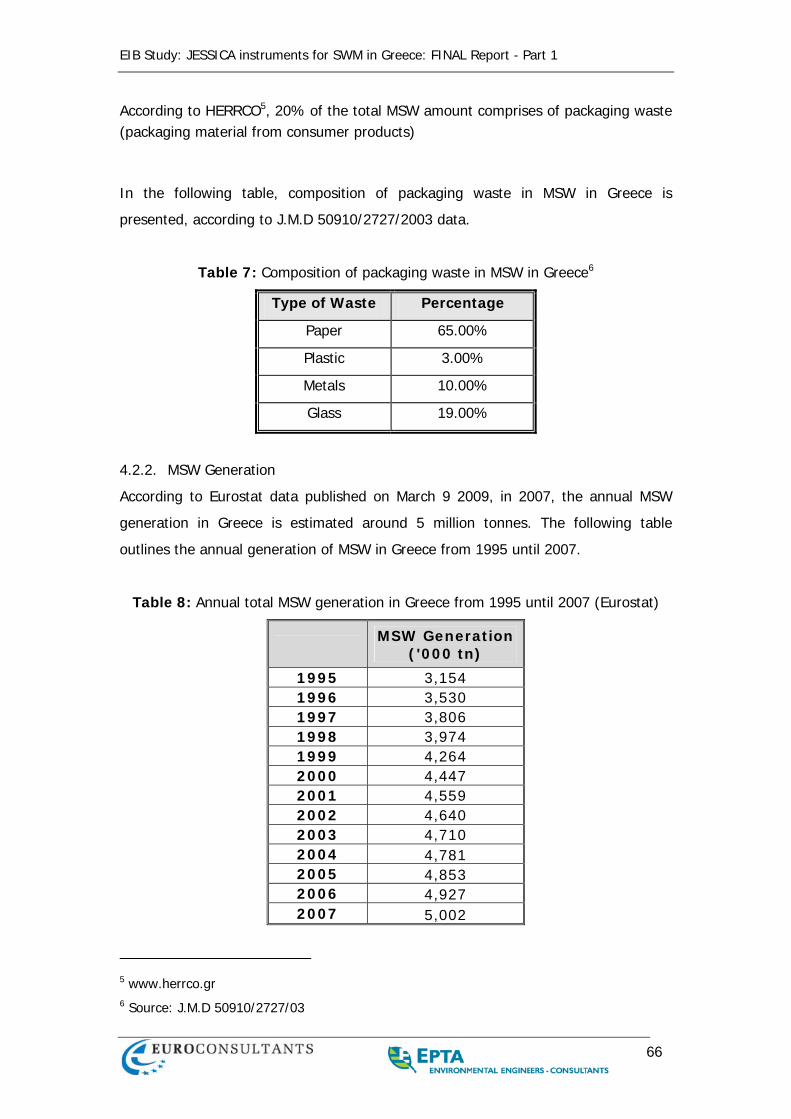
EIB Study: JESSICA instruments for SWM in Greece: FINAL Report - Part 1
66
According to HERRCO5, 20% of the total MSW amount comprises of packaging waste (packaging material from consumer products)
In the following table, composition of packaging waste in MSW in Greece is
presented, according to J.M.D 50910/2727/2003 data.
Table 7: Composition of packaging waste in MSW in Greece6
Type of Waste Percentage
Paper 65.00%
Plastic 3.00%
Metals 10.00%
Glass 19.00%
4.2.2. MSW Generation
According to Eurostat data published on March 9 2009, in 2007, the annual MSW
generation in Greece is estimated around 5 million tonnes. The following table
outlines the annual generation of MSW in Greece from 1995 until 2007.
Table 8: Annual total MSW generation in Greece from 1995 until 2007 (Eurostat)
MSW Generation
('000 tn)
1995 3,154 1996 3,530 1997 3,806 1998 3,974 1999 4,264 2000 4,447 2001 4,559 2002 4,640 2003 4,710 2004 4,781 2005 4,853 2006 4,927 2007 5,002
5 www.herrco.gr 6 Source: J.M.D 50910/2727/03
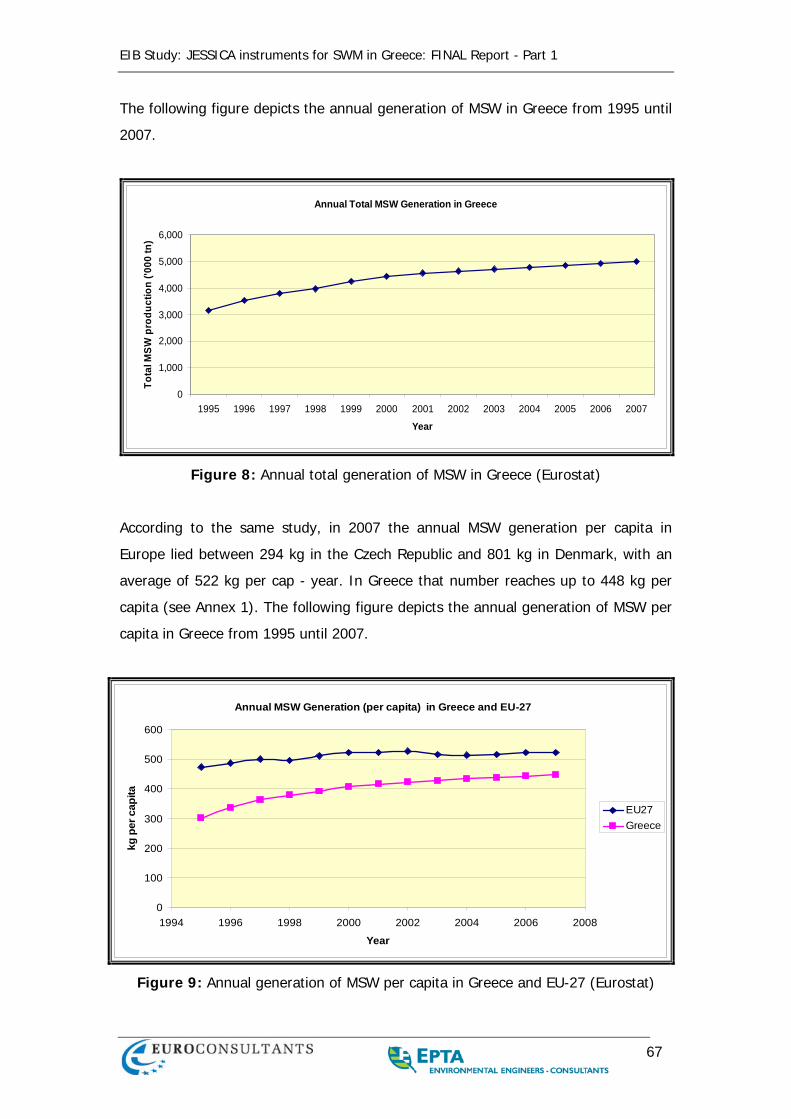
EIB Study: JESSICA instruments for SWM in Greece: FINAL Report - Part 1
67
The following figure depicts the annual generation of MSW in Greece from 1995 until
2007.
Annual Total MSW Generation in Greece
0
1,000
2,000
3,000
4,000
5,000
6,000
1995 1996 1997 1998 1999 2000 2001 2002 2003 2004 2005 2006 2007
Year
Tota
l MSW
pro
duct
ion
('000
tn)
Figure 8: Annual total generation of MSW in Greece (Eurostat)
According to the same study, in 2007 the annual MSW generation per capita in
Europe lied between 294 kg in the Czech Republic and 801 kg in Denmark, with an
average of 522 kg per cap - year. In Greece that number reaches up to 448 kg per
capita (see Annex 1). The following figure depicts the annual generation of MSW per
capita in Greece from 1995 until 2007.
Annual MSW Generation (per capita) in Greece and EU-27
0
100
200
300
400
500
600
1994 1996 1998 2000 2002 2004 2006 2008
Year
kg p
er c
apita
EU27Greece
Figure 9: Annual generation of MSW per capita in Greece and EU-27 (Eurostat)
EIB Study: JESSICA instruments for SWM in Greece: FINAL Report - Part 1
68
Per capita waste generation is strongly correlated with income and social
development but also affected by waste awareness and education. Figure 5 shows
an increase of just over 33% in the period 1995-2000, but with a tendency to level
off from 2001 onwards. However, annual MSW generation per capita is still
increasing, and unless a national strategy for waste prevention and reduction is
successfully developed and implemented, the upward trend seen over the last 14
years is expected to continue.
In general, nowadays it is estimated that more than 5.2 million tones of MSW are
produced annually in Greece, 39% of which are produced in the area of Attiki and
16% are produced in the region of Central Macedonia that includes the prefecture of
Thessaloniki (11%). In other words, the total annual production of municipal solid
waste in these two areas exceeds 2.600.000 tonnes per year, as it is outlined in the
following table.
Table 9: Annual MSW generated quantities in Attiki and Thessaloniki
Prefecture MSW 2001 (tn) MSW 2009 (tn) Attiki 7 1,775,000 2,000,000
Thessaloniki8 450,000 640,000
Biodegradable Municipal Waste (BMW) can be commonly found in municipal solid
waste and generally, is defined as waste that may undergo aerobic or anaerobic
degradation, such as: food wastes, gardening wastes, paper and cardboard wastes,
and biomass. According to J.M.D 50910/2727/2003 data, MSW in Greece contains
around 70% BMW.
4.3. PREDICTION OF MSW FUTURE GENERATION
Prediction of the quality and quantity of MSW is crucial for designing and
programming municipal solid waste management system. However, predicting the
amount of generated waste is a difficult task because various parameters affect it
and its fluctuation is high. Several methods of estimating waste generation have
been applied so far. Various analyses conducted in several cases, have shown high
correlations of the generation of Municipal Solid Waste to the total GDP, per capita
7 According to RSWMP of Attiki 8 According to Waste Management Authority of Thessaloniki
EIB Study: JESSICA instruments for SWM in Greece: FINAL Report - Part 1
69
income, and the population. Thus, predictions of future MSW amounts in this study
is based on the correlation between average per capita income (based on the GDP
and population) and waste generation.
The method focused on EU-27 and went through the following steps.
1. Making use of Eurostat data, the average per capita income was estimated based
on the total GDP at current prices, and population.
2. The total amount of MSW generated was analyzed, and the relationship between
waste generation and per capita income was estimated.
3. Finally, 3 scenarios were developed , namely min max and central scenario.
At this point, it must be stressed that the scenarios are no prediction, but just give
an impression of what could happen. All Eurostat data are outlined in Annexes 3,4
and 5.
4.3.1. Correlation between income and MSW generation
Figures 11 and 12 illustrate the correlation between unit of per capita income and
per capita MSW generation in EU from 2000 until 2007.
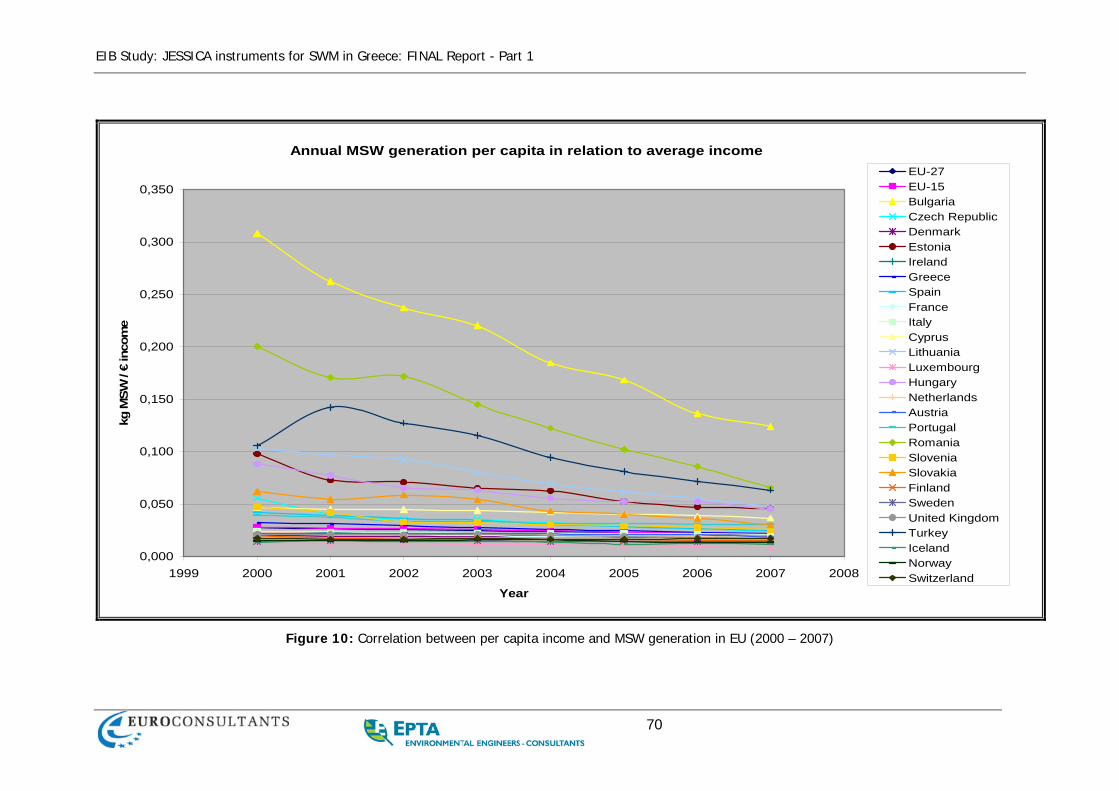
EIB Study: JESSICA instruments for SWM in Greece: FINAL Report - Part 1
70
Annual MSW generation per capita in relation to average income
0,000
0,050
0,100
0,150
0,200
0,250
0,300
0,350
1999 2000 2001 2002 2003 2004 2005 2006 2007 2008
Year
kg M
SW /
€ in
com
e
EU-27EU-15BulgariaCzech RepublicDenmarkEstoniaIrelandGreeceSpainFranceItalyCyprusLithuaniaLuxembourgHungaryNetherlandsAustriaPortugalRomaniaSloveniaSlovakiaFinlandSwedenUnited KingdomTurkeyIcelandNorwaySwitzerland
Figure 10: Correlation between per capita income and MSW generation in EU (2000 – 2007)
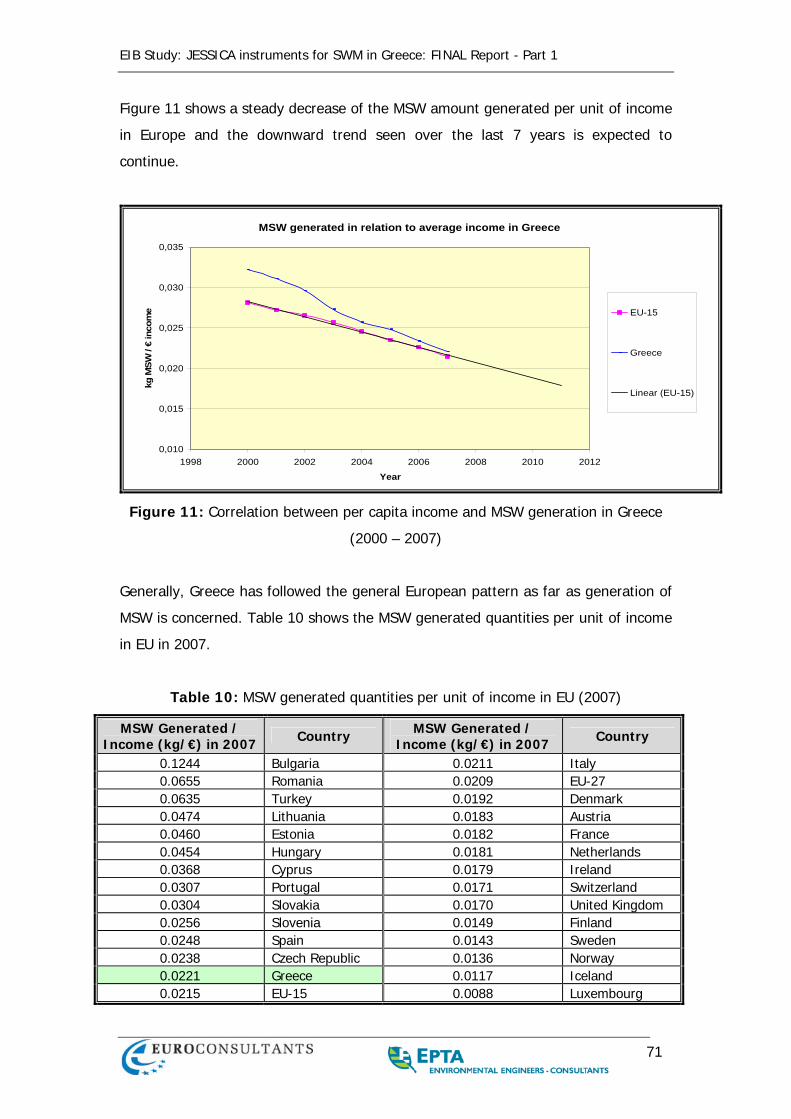
EIB Study: JESSICA instruments for SWM in Greece: FINAL Report - Part 1
71
Figure 11 shows a steady decrease of the MSW amount generated per unit of income
in Europe and the downward trend seen over the last 7 years is expected to
continue.
MSW generated in relation to average income in Greece
0,010
0,015
0,020
0,025
0,030
0,035
1998 2000 2002 2004 2006 2008 2010 2012Year
kg M
SW /
€ in
com
e EU-15
Greece
Linear (EU-15)
Figure 11: Correlation between per capita income and MSW generation in Greece
(2000 – 2007)
Generally, Greece has followed the general European pattern as far as generation of
MSW is concerned. Table 10 shows the MSW generated quantities per unit of income
in EU in 2007.
Table 10: MSW generated quantities per unit of income in EU (2007)
MSW Generated / Income (kg/€) in 2007 Country MSW Generated /
Income (kg/€) in 2007 Country
0.1244 Bulgaria 0.0211 Italy 0.0655 Romania 0.0209 EU-27 0.0635 Turkey 0.0192 Denmark 0.0474 Lithuania 0.0183 Austria 0.0460 Estonia 0.0182 France 0.0454 Hungary 0.0181 Netherlands 0.0368 Cyprus 0.0179 Ireland 0.0307 Portugal 0.0171 Switzerland 0.0304 Slovakia 0.0170 United Kingdom 0.0256 Slovenia 0.0149 Finland 0.0248 Spain 0.0143 Sweden 0.0238 Czech Republic 0.0136 Norway 0.0221 Greece 0.0117 Iceland 0.0215 EU-15 0.0088 Luxembourg
EIB Study: JESSICA instruments for SWM in Greece: FINAL Report - Part 1
72
As for Greek GDP, it presented a constant increase over the last decade, but
estimations for the future are not easy. Despite last decade’s dynamism, the Greek
economy seems to be following EU towards a period of uncertainty. Table 11 shows
the real GDP growth rate in EU, for the past few years.
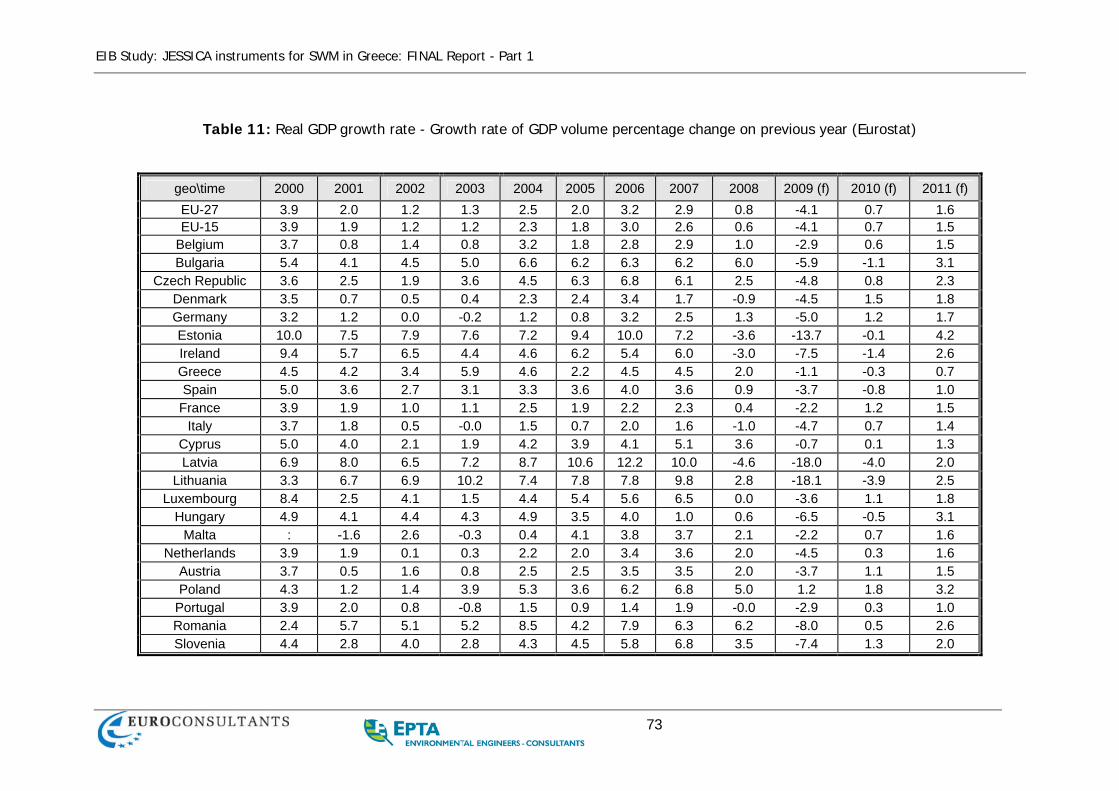
EIB Study: JESSICA instruments for SWM in Greece: FINAL Report - Part 1
73
Table 11: Real GDP growth rate - Growth rate of GDP volume percentage change on previous year (Eurostat)
geo\time 2000 2001 2002 2003 2004 2005 2006 2007 2008 2009 (f) 2010 (f) 2011 (f) EU-27 3.9 2.0 1.2 1.3 2.5 2.0 3.2 2.9 0.8 -4.1 0.7 1.6 EU-15 3.9 1.9 1.2 1.2 2.3 1.8 3.0 2.6 0.6 -4.1 0.7 1.5
Belgium 3.7 0.8 1.4 0.8 3.2 1.8 2.8 2.9 1.0 -2.9 0.6 1.5 Bulgaria 5.4 4.1 4.5 5.0 6.6 6.2 6.3 6.2 6.0 -5.9 -1.1 3.1
Czech Republic 3.6 2.5 1.9 3.6 4.5 6.3 6.8 6.1 2.5 -4.8 0.8 2.3 Denmark 3.5 0.7 0.5 0.4 2.3 2.4 3.4 1.7 -0.9 -4.5 1.5 1.8 Germany 3.2 1.2 0.0 -0.2 1.2 0.8 3.2 2.5 1.3 -5.0 1.2 1.7 Estonia 10.0 7.5 7.9 7.6 7.2 9.4 10.0 7.2 -3.6 -13.7 -0.1 4.2 Ireland 9.4 5.7 6.5 4.4 4.6 6.2 5.4 6.0 -3.0 -7.5 -1.4 2.6 Greece 4.5 4.2 3.4 5.9 4.6 2.2 4.5 4.5 2.0 -1.1 -0.3 0.7 Spain 5.0 3.6 2.7 3.1 3.3 3.6 4.0 3.6 0.9 -3.7 -0.8 1.0
France 3.9 1.9 1.0 1.1 2.5 1.9 2.2 2.3 0.4 -2.2 1.2 1.5 Italy 3.7 1.8 0.5 -0.0 1.5 0.7 2.0 1.6 -1.0 -4.7 0.7 1.4
Cyprus 5.0 4.0 2.1 1.9 4.2 3.9 4.1 5.1 3.6 -0.7 0.1 1.3 Latvia 6.9 8.0 6.5 7.2 8.7 10.6 12.2 10.0 -4.6 -18.0 -4.0 2.0
Lithuania 3.3 6.7 6.9 10.2 7.4 7.8 7.8 9.8 2.8 -18.1 -3.9 2.5 Luxembourg 8.4 2.5 4.1 1.5 4.4 5.4 5.6 6.5 0.0 -3.6 1.1 1.8
Hungary 4.9 4.1 4.4 4.3 4.9 3.5 4.0 1.0 0.6 -6.5 -0.5 3.1 Malta : -1.6 2.6 -0.3 0.4 4.1 3.8 3.7 2.1 -2.2 0.7 1.6
Netherlands 3.9 1.9 0.1 0.3 2.2 2.0 3.4 3.6 2.0 -4.5 0.3 1.6 Austria 3.7 0.5 1.6 0.8 2.5 2.5 3.5 3.5 2.0 -3.7 1.1 1.5 Poland 4.3 1.2 1.4 3.9 5.3 3.6 6.2 6.8 5.0 1.2 1.8 3.2
Portugal 3.9 2.0 0.8 -0.8 1.5 0.9 1.4 1.9 -0.0 -2.9 0.3 1.0 Romania 2.4 5.7 5.1 5.2 8.5 4.2 7.9 6.3 6.2 -8.0 0.5 2.6 Slovenia 4.4 2.8 4.0 2.8 4.3 4.5 5.8 6.8 3.5 -7.4 1.3 2.0
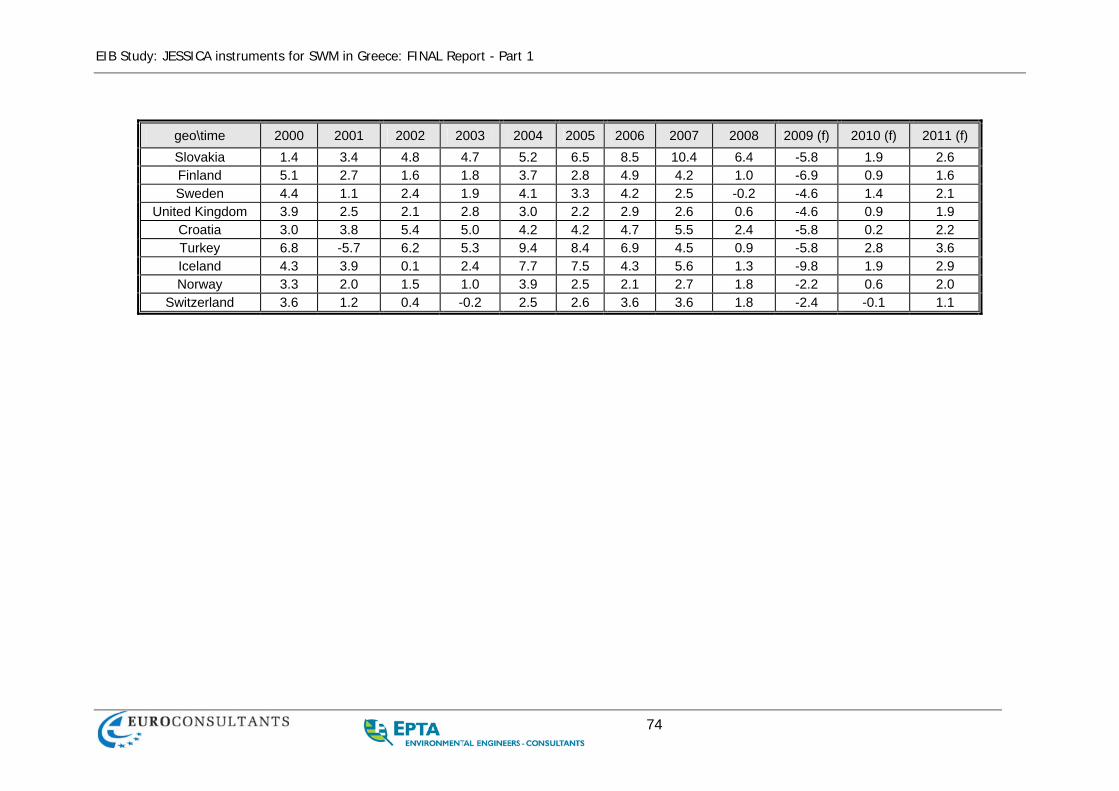
EIB Study: JESSICA instruments for SWM in Greece: FINAL Report - Part 1
74
geo\time 2000 2001 2002 2003 2004 2005 2006 2007 2008 2009 (f) 2010 (f) 2011 (f) Slovakia 1.4 3.4 4.8 4.7 5.2 6.5 8.5 10.4 6.4 -5.8 1.9 2.6 Finland 5.1 2.7 1.6 1.8 3.7 2.8 4.9 4.2 1.0 -6.9 0.9 1.6 Sweden 4.4 1.1 2.4 1.9 4.1 3.3 4.2 2.5 -0.2 -4.6 1.4 2.1
United Kingdom 3.9 2.5 2.1 2.8 3.0 2.2 2.9 2.6 0.6 -4.6 0.9 1.9 Croatia 3.0 3.8 5.4 5.0 4.2 4.2 4.7 5.5 2.4 -5.8 0.2 2.2 Turkey 6.8 -5.7 6.2 5.3 9.4 8.4 6.9 4.5 0.9 -5.8 2.8 3.6 Iceland 4.3 3.9 0.1 2.4 7.7 7.5 4.3 5.6 1.3 -9.8 1.9 2.9 Norway 3.3 2.0 1.5 1.0 3.9 2.5 2.1 2.7 1.8 -2.2 0.6 2.0
Switzerland 3.6 1.2 0.4 -0.2 2.5 2.6 3.6 3.6 1.8 -2.4 -0.1 1.1
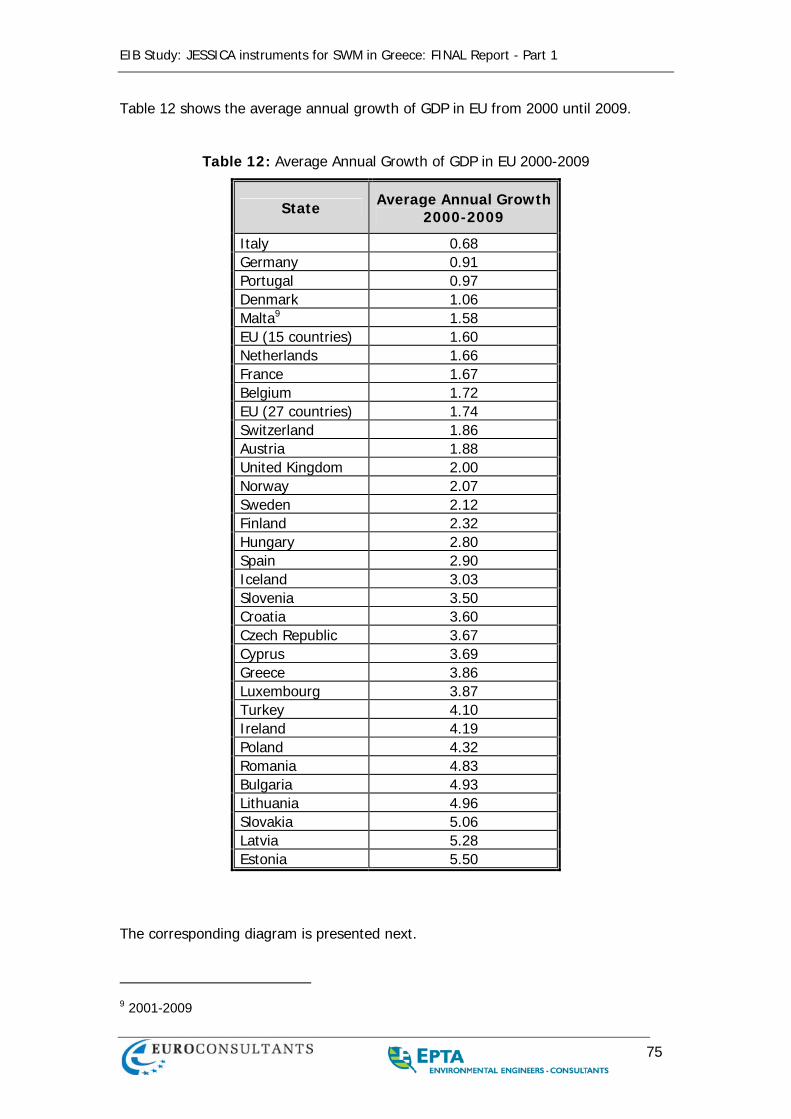
EIB Study: JESSICA instruments for SWM in Greece: FINAL Report - Part 1
75
Table 12 shows the average annual growth of GDP in EU from 2000 until 2009.
Table 12: Average Annual Growth of GDP in EU 2000-2009
State Average Annual Growth 2000-2009
Italy 0.68 Germany 0.91 Portugal 0.97 Denmark 1.06 Malta9 1.58 EU (15 countries) 1.60 Netherlands 1.66 France 1.67 Belgium 1.72 EU (27 countries) 1.74 Switzerland 1.86 Austria 1.88 United Kingdom 2.00 Norway 2.07 Sweden 2.12 Finland 2.32 Hungary 2.80 Spain 2.90 Iceland 3.03 Slovenia 3.50 Croatia 3.60 Czech Republic 3.67 Cyprus 3.69 Greece 3.86 Luxembourg 3.87 Turkey 4.10 Ireland 4.19 Poland 4.32 Romania 4.83 Bulgaria 4.93 Lithuania 4.96 Slovakia 5.06 Latvia 5.28 Estonia 5.50
The corresponding diagram is presented next.
9 2001-2009
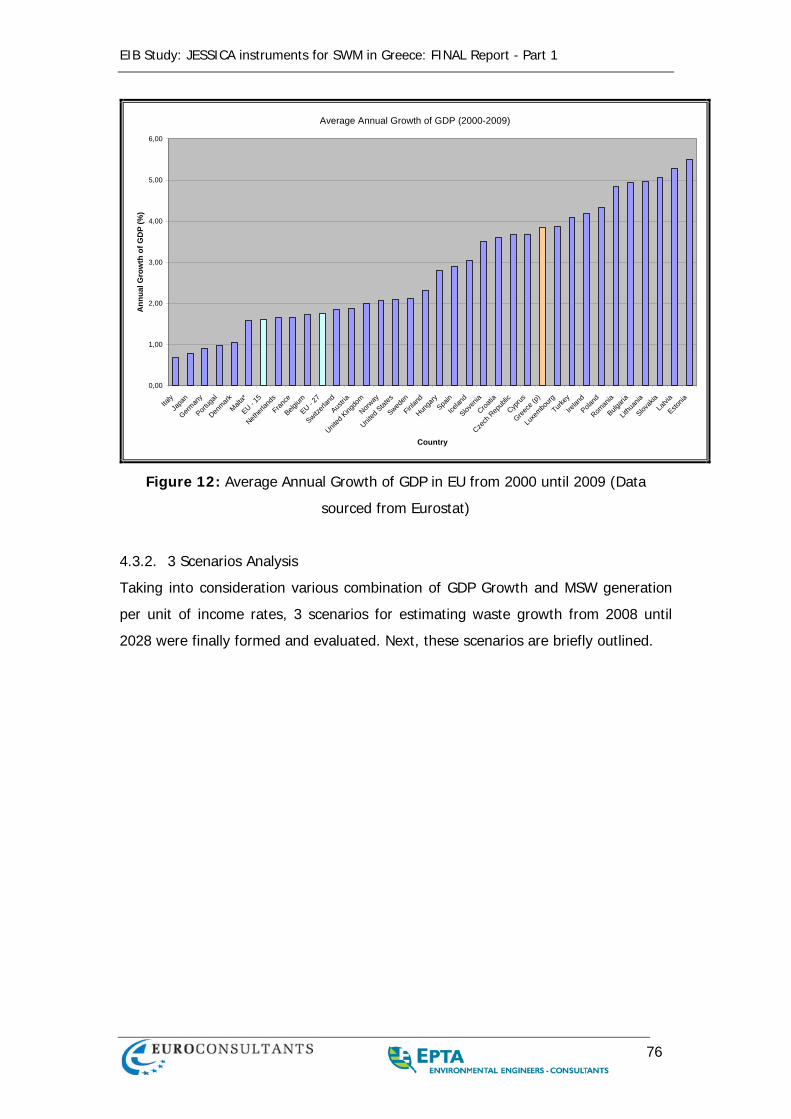
EIB Study: JESSICA instruments for SWM in Greece: FINAL Report - Part 1
76
Average Annual Growth of GDP (2000-2009)
0,00
1,00
2,00
3,00
4,00
5,00
6,00
Italy
Japa
n
German
y
Portug
al
Denmark
Malta*
EU - 15
Netherl
ands
France
Belgium
EU - 27
Switzerl
and
Austria
United
Kingdo
m
Norway
United
States
Sweden
Finlan
d
Hunga
rySpa
in
Icelan
d
Sloven
ia
Croatia
Czech
Rep
ublic
Cyprus
Greece
(p)
Luxe
mbourg
Turkey
Irelan
d
Poland
Roman
ia
Bulgari
a
Lithu
ania
Slovak
iaLa
tvia
Estonia
Country
Ann
ual G
row
th o
f GD
P (%
)
Figure 12: Average Annual Growth of GDP in EU from 2000 until 2009 (Data
sourced from Eurostat)
4.3.2. 3 Scenarios Analysis
Taking into consideration various combination of GDP Growth and MSW generation
per unit of income rates, 3 scenarios for estimating waste growth from 2008 until
2028 were finally formed and evaluated. Next, these scenarios are briefly outlined.
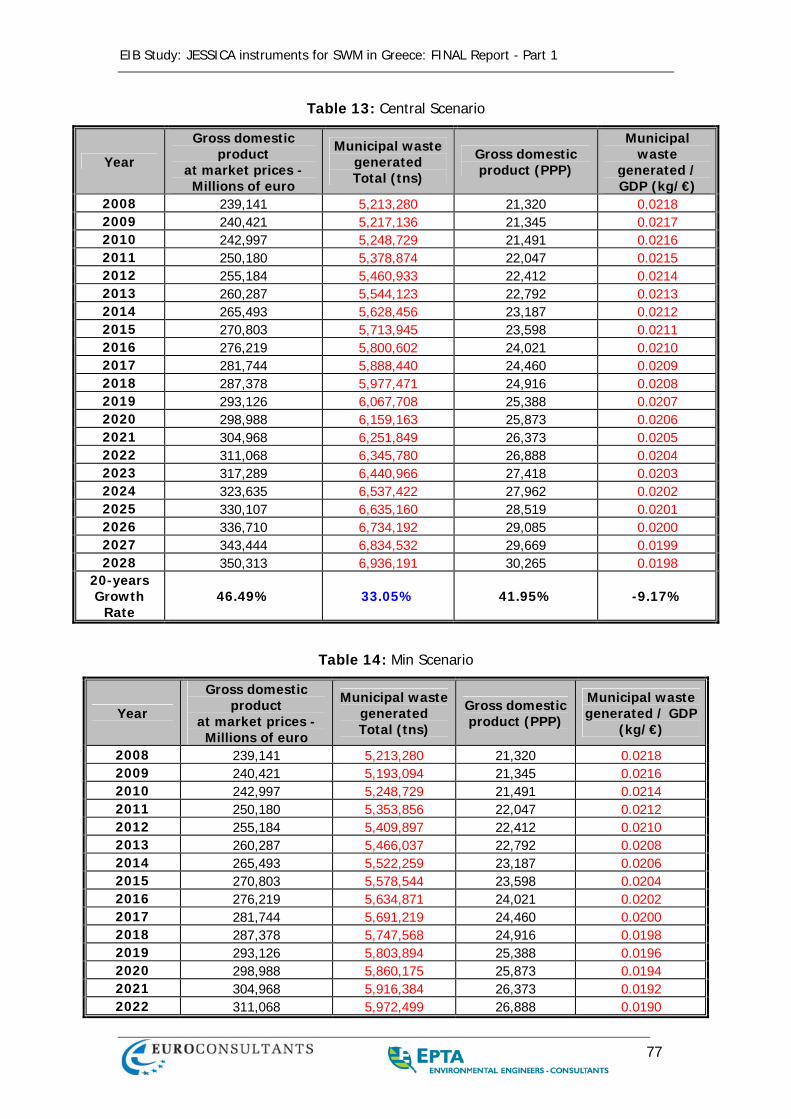
EIB Study: JESSICA instruments for SWM in Greece: FINAL Report - Part 1
77
Table 13: Central Scenario
Year
Gross domestic product
at market prices - Millions of euro
Municipal waste generated Total (tns)
Gross domestic product (PPP)
Municipal waste
generated / GDP (kg/€)
2008 239,141 5,213,280 21,320 0.0218 2009 240,421 5,217,136 21,345 0.0217 2010 242,997 5,248,729 21,491 0.0216 2011 250,180 5,378,874 22,047 0.0215 2012 255,184 5,460,933 22,412 0.0214 2013 260,287 5,544,123 22,792 0.0213 2014 265,493 5,628,456 23,187 0.0212 2015 270,803 5,713,945 23,598 0.0211 2016 276,219 5,800,602 24,021 0.0210 2017 281,744 5,888,440 24,460 0.0209 2018 287,378 5,977,471 24,916 0.0208 2019 293,126 6,067,708 25,388 0.0207 2020 298,988 6,159,163 25,873 0.0206 2021 304,968 6,251,849 26,373 0.0205 2022 311,068 6,345,780 26,888 0.0204 2023 317,289 6,440,966 27,418 0.0203 2024 323,635 6,537,422 27,962 0.0202 2025 330,107 6,635,160 28,519 0.0201 2026 336,710 6,734,192 29,085 0.0200 2027 343,444 6,834,532 29,669 0.0199 2028 350,313 6,936,191 30,265 0.0198
20-years Growth
Rate 46.49% 33.05% 41.95% -9.17%
Table 14: Min Scenario
Year
Gross domestic product
at market prices - Millions of euro
Municipal waste generated Total (tns)
Gross domestic product (PPP)
Municipal waste generated / GDP
(kg/€)
2008 239,141 5,213,280 21,320 0.0218 2009 240,421 5,193,094 21,345 0.0216 2010 242,997 5,248,729 21,491 0.0214 2011 250,180 5,353,856 22,047 0.0212 2012 255,184 5,409,897 22,412 0.0210 2013 260,287 5,466,037 22,792 0.0208 2014 265,493 5,522,259 23,187 0.0206 2015 270,803 5,578,544 23,598 0.0204 2016 276,219 5,634,871 24,021 0.0202 2017 281,744 5,691,219 24,460 0.0200 2018 287,378 5,747,568 24,916 0.0198 2019 293,126 5,803,894 25,388 0.0196 2020 298,988 5,860,175 25,873 0.0194 2021 304,968 5,916,384 26,373 0.0192 2022 311,068 5,972,499 26,888 0.0190
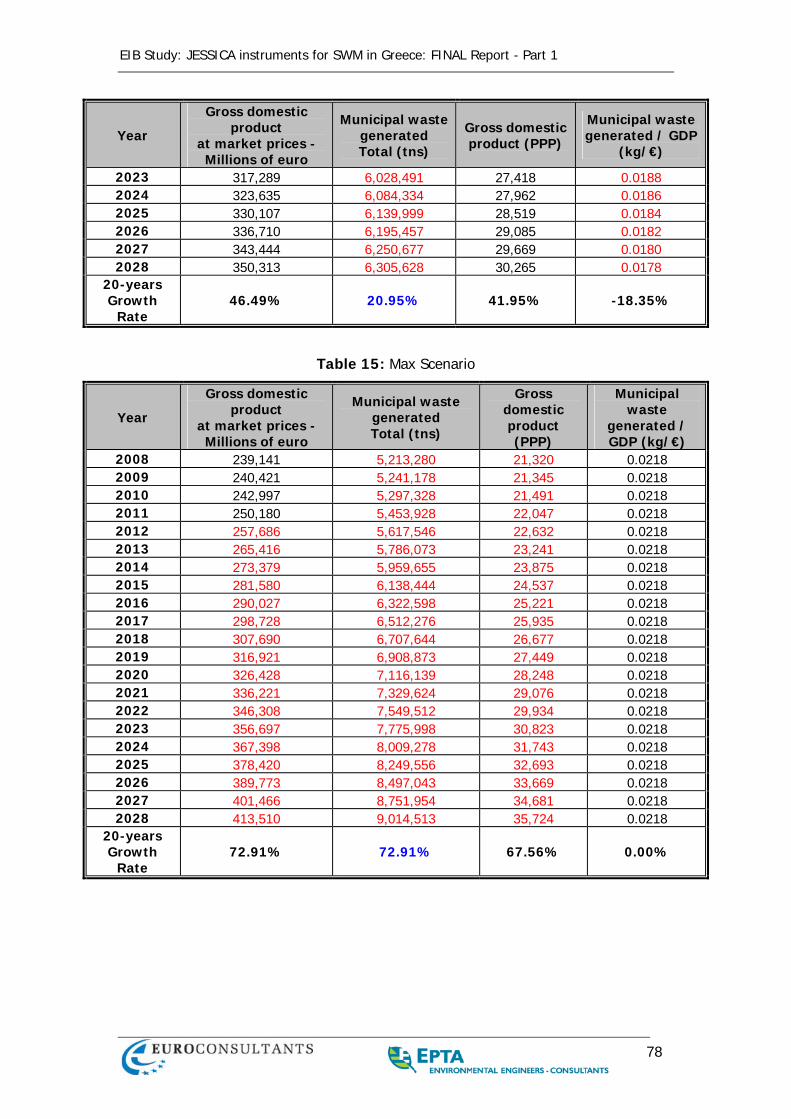
EIB Study: JESSICA instruments for SWM in Greece: FINAL Report - Part 1
78
Year
Gross domestic product
at market prices - Millions of euro
Municipal waste generated Total (tns)
Gross domestic product (PPP)
Municipal waste generated / GDP
(kg/€)
2023 317,289 6,028,491 27,418 0.0188 2024 323,635 6,084,334 27,962 0.0186 2025 330,107 6,139,999 28,519 0.0184 2026 336,710 6,195,457 29,085 0.0182 2027 343,444 6,250,677 29,669 0.0180 2028 350,313 6,305,628 30,265 0.0178
20-years Growth
Rate 46.49% 20.95% 41.95% -18.35%
Table 15: Max Scenario
Year
Gross domestic product
at market prices - Millions of euro
Municipal waste generated Total (tns)
Gross domestic product (PPP)
Municipal waste
generated / GDP (kg/€)
2008 239,141 5,213,280 21,320 0.0218 2009 240,421 5,241,178 21,345 0.0218 2010 242,997 5,297,328 21,491 0.0218 2011 250,180 5,453,928 22,047 0.0218 2012 257,686 5,617,546 22,632 0.0218 2013 265,416 5,786,073 23,241 0.0218 2014 273,379 5,959,655 23,875 0.0218 2015 281,580 6,138,444 24,537 0.0218 2016 290,027 6,322,598 25,221 0.0218 2017 298,728 6,512,276 25,935 0.0218 2018 307,690 6,707,644 26,677 0.0218 2019 316,921 6,908,873 27,449 0.0218 2020 326,428 7,116,139 28,248 0.0218 2021 336,221 7,329,624 29,076 0.0218 2022 346,308 7,549,512 29,934 0.0218 2023 356,697 7,775,998 30,823 0.0218 2024 367,398 8,009,278 31,743 0.0218 2025 378,420 8,249,556 32,693 0.0218 2026 389,773 8,497,043 33,669 0.0218 2027 401,466 8,751,954 34,681 0.0218 2028 413,510 9,014,513 35,724 0.0218
20-years Growth
Rate 72.91% 72.91% 67.56% 0.00%
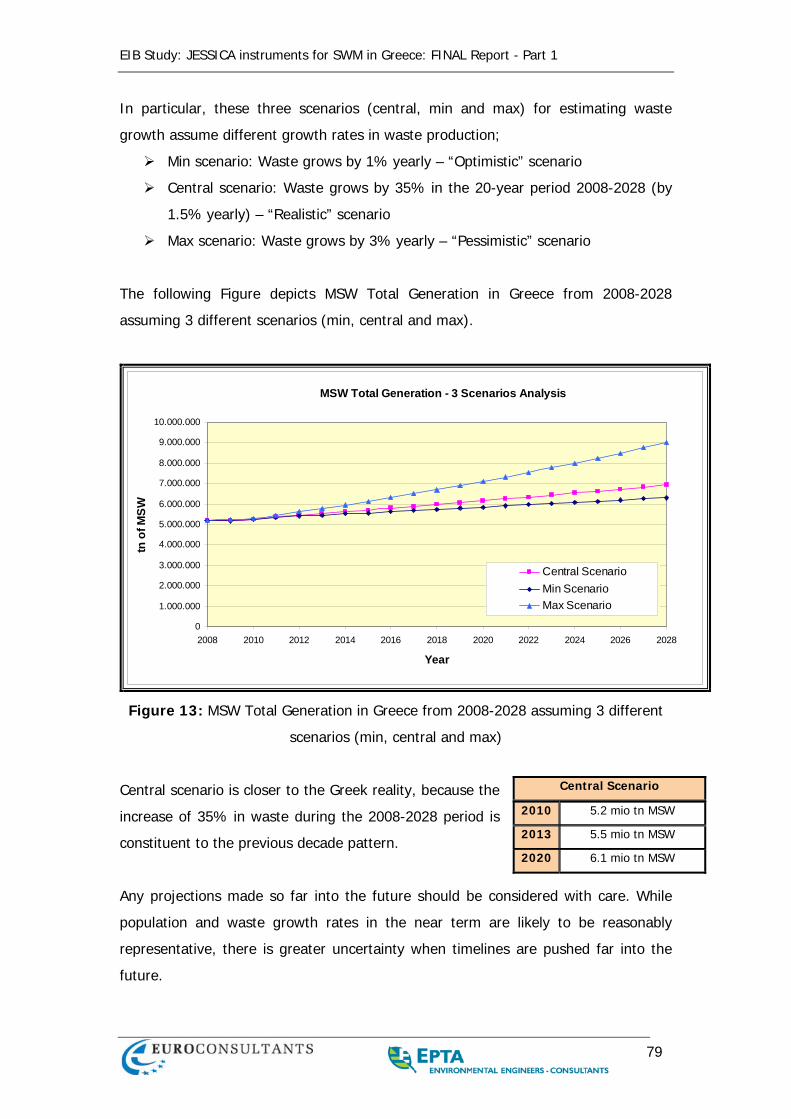
EIB Study: JESSICA instruments for SWM in Greece: FINAL Report - Part 1
79
In particular, these three scenarios (central, min and max) for estimating waste
growth assume different growth rates in waste production;
Min scenario: Waste grows by 1% yearly – “Optimistic” scenario
Central scenario: Waste grows by 35% in the 20-year period 2008-2028 (by
1.5% yearly) – “Realistic” scenario
Max scenario: Waste grows by 3% yearly – “Pessimistic” scenario
The following Figure depicts MSW Total Generation in Greece from 2008-2028
assuming 3 different scenarios (min, central and max).
MSW Total Generation - 3 Scenarios Analysis
0
1.000.000
2.000.000
3.000.000
4.000.000
5.000.000
6.000.000
7.000.000
8.000.000
9.000.000
10.000.000
2008 2010 2012 2014 2016 2018 2020 2022 2024 2026 2028
Year
tn o
f MSW
Central ScenarioMin ScenarioMax Scenario
Figure 13: MSW Total Generation in Greece from 2008-2028 assuming 3 different
scenarios (min, central and max)
Central scenario is closer to the Greek reality, because the
increase of 35% in waste during the 2008-2028 period is
constituent to the previous decade pattern.
Any projections made so far into the future should be considered with care. While
population and waste growth rates in the near term are likely to be reasonably
representative, there is greater uncertainty when timelines are pushed far into the
future.
Central Scenario
2010 5.2 mio tn MSW
2013 5.5 mio tn MSW
2020 6.1 mio tn MSW
EIB Study: JESSICA instruments for SWM in Greece: FINAL Report - Part 1
80
4.4. CURRENT MSW MANAGEMENT IN GREECE
Waste management has become a progressively more difficult issue in developing
and transition countries over recent years while the environmentally sustainable
strategy of waste management procedures constitutes a major goal for all European
countries.
A significant improvement can be seen in the development of treatment facilities,
collection and recycling. At the same time, it is obvious that management of MSW in
Greece needs a continuous improvement, while a considerable management
reorganization is also required in order to achieve EC goals.
4.4.1. Waste collection and transport
For the collection of MSW rolling bins with capacities from 80 to 1700 lt are used.
The collection and transport is carried out by the municipalities using mainly press
and mill type vehicles.
4.4.2. Waste Treatment and Disposal
In the last two decades, and especially during the 1994-1999 and 2000-2006
Programming Periods, priority was given to the construction of compliant
infrastructure and therefore most of the 13 Regions lack in waste processing
infrastructure. Therefore, despite of the NSWMP that was introduced in 2003, most
of the waste management systems operated in Greece are not in full compliance
with the requirements of Landfill Directive, which establishes diversion rates of
biodegradable municipal waste from landfills, and the revised Waste Framework
Directive 2008/98/EC, which encourages the separate collection of bio-waste with a
view to the composting and digestion of bio-waste.
More specifically, according to Eurostat data (2009), in 2007 landfilling rate in Greece
lied at 84%, the recycling rate at 14% (62.7 kg per capita out of 450kg generated)
and composting at 2% (8.96 kg per capita - year). With 84% of its municipal solid
waste sent to landfill in 2007, Greece landfilled much more than the 42% recorded
across the EU as a whole (see Annex 2). Particularly low levels of landfilling were
recorded by Germany with just 1% of MSW being disposed of in this way, the
Netherlands (3%), Belgium (4%) and Sweden (also 4%).
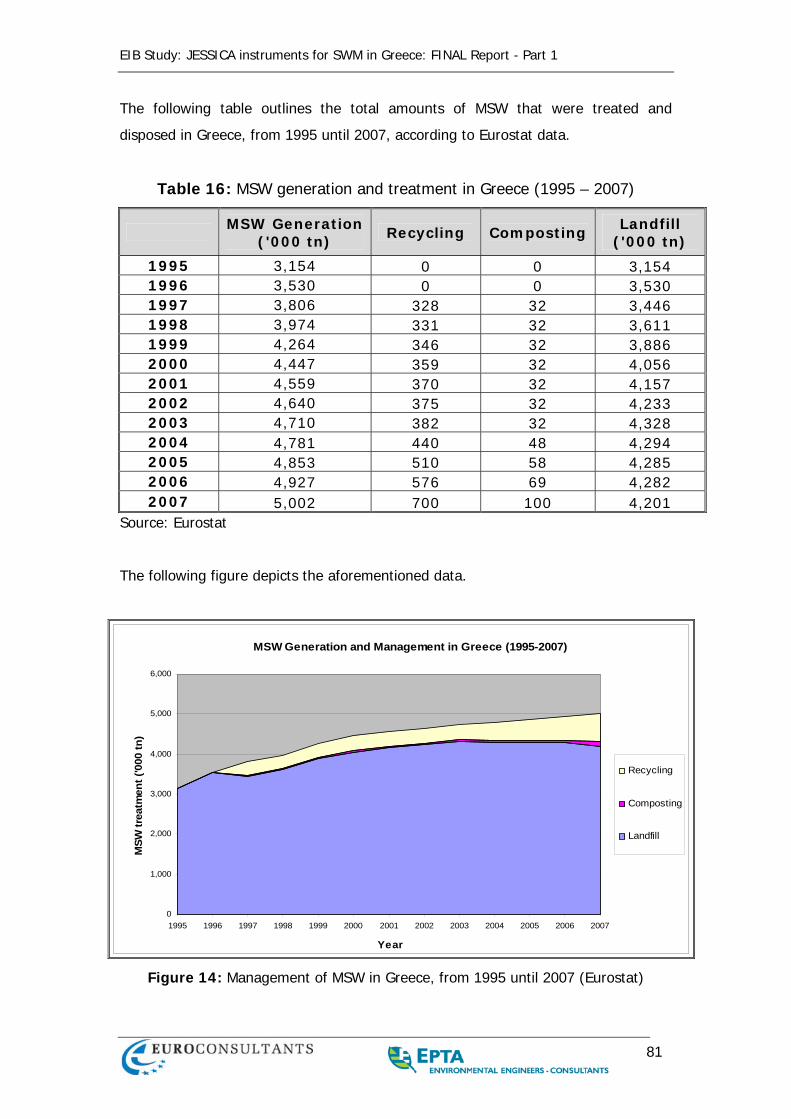
EIB Study: JESSICA instruments for SWM in Greece: FINAL Report - Part 1
81
The following table outlines the total amounts of MSW that were treated and
disposed in Greece, from 1995 until 2007, according to Eurostat data.
Table 16: MSW generation and treatment in Greece (1995 – 2007)
MSW Generation
('000 tn) Recycling Composting Landfill
('000 tn)
1995 3,154 0 0 3,154 1996 3,530 0 0 3,530 1997 3,806 328 32 3,446 1998 3,974 331 32 3,611 1999 4,264 346 32 3,886 2000 4,447 359 32 4,056 2001 4,559 370 32 4,157 2002 4,640 375 32 4,233 2003 4,710 382 32 4,328 2004 4,781 440 48 4,294 2005 4,853 510 58 4,285 2006 4,927 576 69 4,282 2007 5,002 700 100 4,201
Source: Eurostat
The following figure depicts the aforementioned data.
MSW Generation and Management in Greece (1995-2007)
0
1,000
2,000
3,000
4,000
5,000
6,000
1995 1996 1997 1998 1999 2000 2001 2002 2003 2004 2005 2006 2007
Year
MSW
trea
tmen
t ('0
00 tn
)
Recycling
Composting
Landfill
Figure 14: Management of MSW in Greece, from 1995 until 2007 (Eurostat)
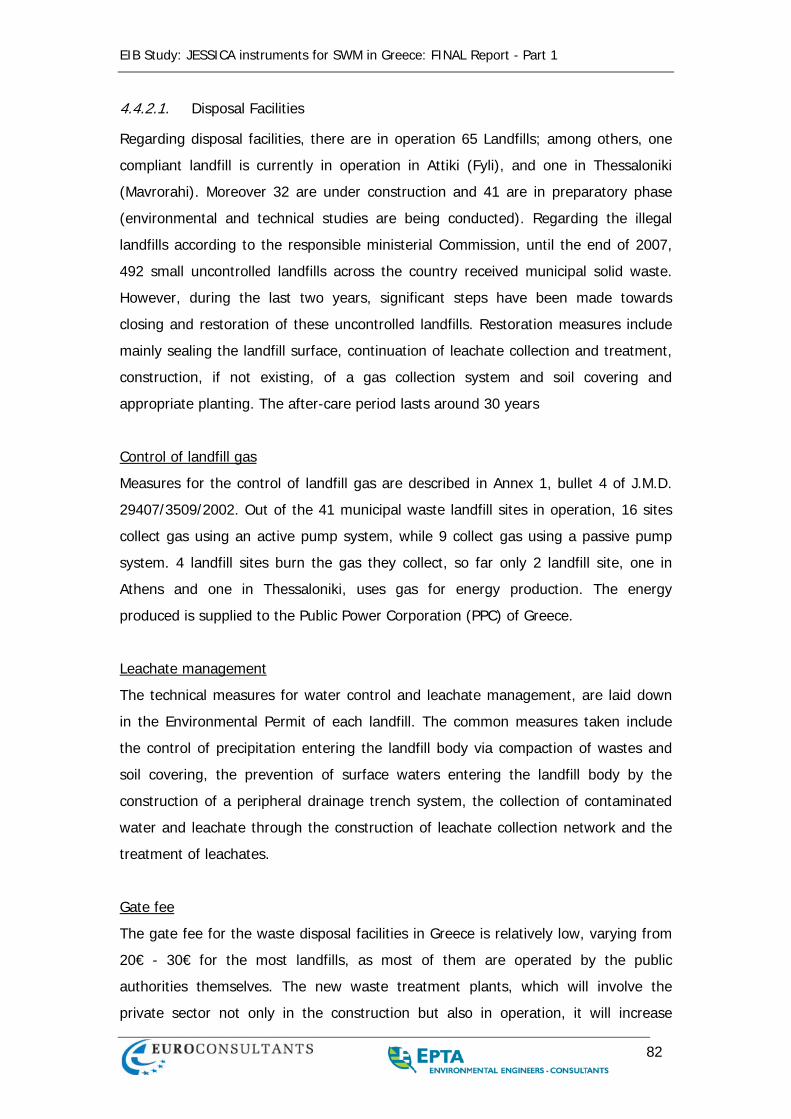
EIB Study: JESSICA instruments for SWM in Greece: FINAL Report - Part 1
82
4.4.2.1. Disposal Facilities
Regarding disposal facilities, there are in operation 65 Landfills; among others, one
compliant landfill is currently in operation in Attiki (Fyli), and one in Thessaloniki
(Mavrorahi). Moreover 32 are under construction and 41 are in preparatory phase
(environmental and technical studies are being conducted). Regarding the illegal
landfills according to the responsible ministerial Commission, until the end of 2007,
492 small uncontrolled landfills across the country received municipal solid waste.
However, during the last two years, significant steps have been made towards
closing and restoration of these uncontrolled landfills. Restoration measures include
mainly sealing the landfill surface, continuation of leachate collection and treatment,
construction, if not existing, of a gas collection system and soil covering and
appropriate planting. The after-care period lasts around 30 years
Control of landfill gas
Measures for the control of landfill gas are described in Annex 1, bullet 4 of J.M.D.
29407/3509/2002. Out of the 41 municipal waste landfill sites in operation, 16 sites
collect gas using an active pump system, while 9 collect gas using a passive pump
system. 4 landfill sites burn the gas they collect, so far only 2 landfill site, one in
Athens and one in Thessaloniki, uses gas for energy production. The energy
produced is supplied to the Public Power Corporation (PPC) of Greece.
Leachate management
The technical measures for water control and leachate management, are laid down
in the Environmental Permit of each landfill. The common measures taken include
the control of precipitation entering the landfill body via compaction of wastes and
soil covering, the prevention of surface waters entering the landfill body by the
construction of a peripheral drainage trench system, the collection of contaminated
water and leachate through the construction of leachate collection network and the
treatment of leachates.
Gate fee
The gate fee for the waste disposal facilities in Greece is relatively low, varying from
20€ - 30€ for the most landfills, as most of them are operated by the public
authorities themselves. The new waste treatment plants, which will involve the
private sector not only in the construction but also in operation, it will increase
EIB Study: JESSICA instruments for SWM in Greece: FINAL Report - Part 1
83
significantly the gate fee, depending on the funding mechanisms and type of
technology selected.
Uncontrolled landfills rehabilitation
According to Waste Management Inter-ministerial Committee (section 2.4.2.) until
2006 were in operation more than 1000 uncontrolled landfills in Greece. However,
during 2007 and 2008, most of them were closed and in February 2009 was reported
that only 404 were still in use. Generally, there are many potential problems related
to the closing of uncontrolled landfills and several key questions typically arise, such
as what method to use to minimize impacts in progress. One problem that always
occurs is the difficulty in overcoming old habits and introducing new technology.
Furthermore, it is impossible to properly close a site that continues to be used as a
dump site. This has to be addressed by providing a new waste disposal facility that
can accept the waste and enable the old site to be completely closed. There are in
principle 3 methods available to close an uncontrolled landfill:
1. Closing by covering the waste (in-place method)
2. Closing by removing the waste from the site (evacuation/mining method)
3. Closing by upgrading the dump to a controlled dumping site or sanitary landfill (upgrading method)
In-place method is the most commonly used option. The solid waste is left at the site
and covered with a layer of local soil and re-vegetated. The function of the cover
layer is to:
• Reduce waste exposure to wind and vectors
• Prevent people and animals from scavenging
• Control odour
• Minimise the risk of fires
• Stop people from using the site
• Control infiltration of rainwater / surface water
• Control migration of landfill gas
• Serve as growth medium for vegetation
• Support suitable post-closure activities
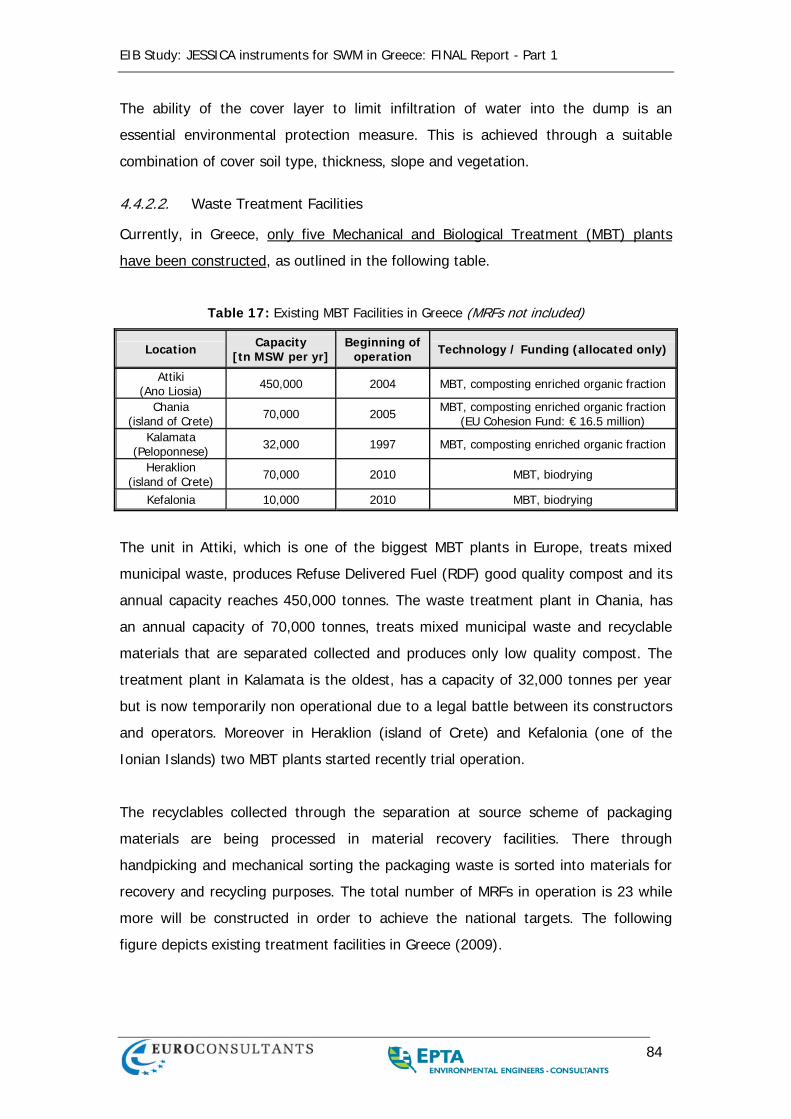
EIB Study: JESSICA instruments for SWM in Greece: FINAL Report - Part 1
84
The ability of the cover layer to limit infiltration of water into the dump is an
essential environmental protection measure. This is achieved through a suitable
combination of cover soil type, thickness, slope and vegetation.
4.4.2.2. Waste Treatment Facilities
Currently, in Greece, only five Mechanical and Biological Treatment (MBT) plants
have been constructed, as outlined in the following table.
Table 17: Existing MBT Facilities in Greece (MRFs not included)
Location Capacity [tn MSW per yr]
Beginning of operation Technology / Funding (allocated only)
Attiki (Ano Liosia) 450,000 2004 MBT, composting enriched organic fraction
Chania (island of Crete) 70,000 2005 MBT, composting enriched organic fraction
(EU Cohesion Fund: € 16.5 million) Kalamata
(Peloponnese) 32,000 1997 MBT, composting enriched organic fraction
Heraklion (island of Crete) 70,000 2010 MBT, biodrying
Kefalonia 10,000 2010 MBT, biodrying
The unit in Attiki, which is one of the biggest MBT plants in Europe, treats mixed
municipal waste, produces Refuse Delivered Fuel (RDF) good quality compost and its
annual capacity reaches 450,000 tonnes. The waste treatment plant in Chania, has
an annual capacity of 70,000 tonnes, treats mixed municipal waste and recyclable
materials that are separated collected and produces only low quality compost. The
treatment plant in Kalamata is the oldest, has a capacity of 32,000 tonnes per year
but is now temporarily non operational due to a legal battle between its constructors
and operators. Moreover in Heraklion (island of Crete) and Kefalonia (one of the
Ionian Islands) two MBT plants started recently trial operation.
The recyclables collected through the separation at source scheme of packaging
materials are being processed in material recovery facilities. There through
handpicking and mechanical sorting the packaging waste is sorted into materials for
recovery and recycling purposes. The total number of MRFs in operation is 23 while
more will be constructed in order to achieve the national targets. The following
figure depicts existing treatment facilities in Greece (2009).
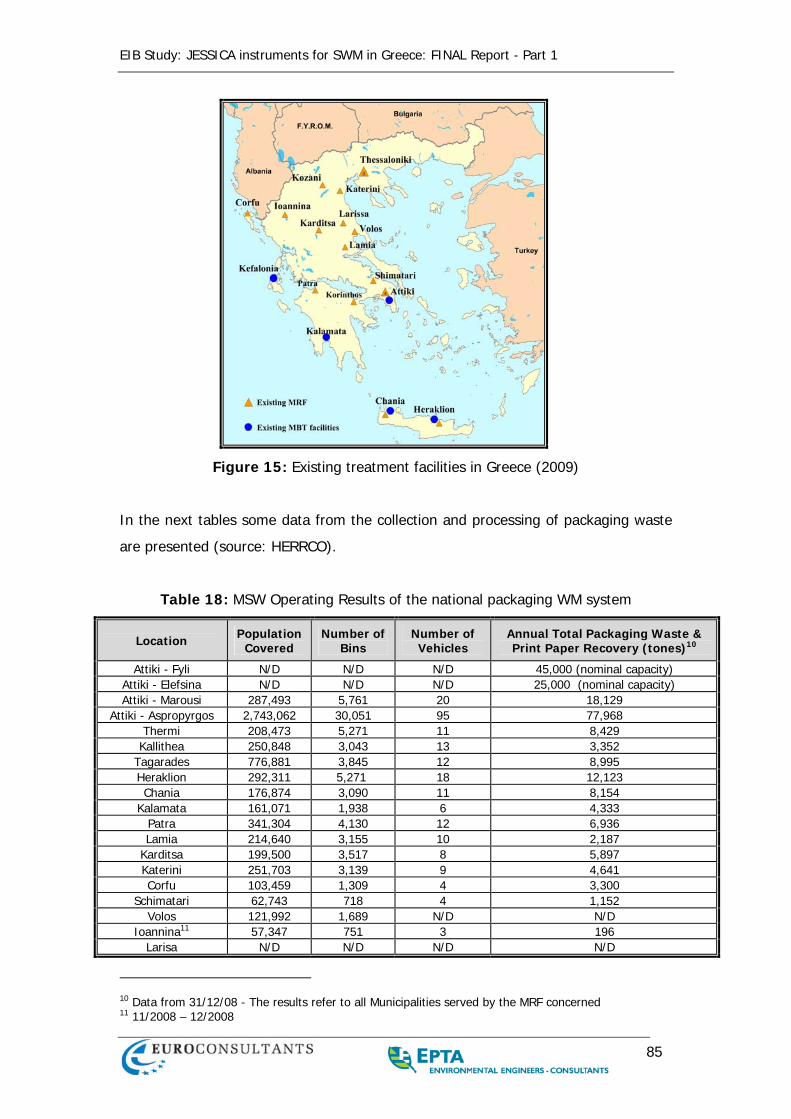
EIB Study: JESSICA instruments for SWM in Greece: FINAL Report - Part 1
85
Figure 15: Existing treatment facilities in Greece (2009)
In the next tables some data from the collection and processing of packaging waste
are presented (source: HERRCO).
Table 18: MSW Operating Results of the national packaging WM system
Location Population Covered
Number of Bins
Number of Vehicles
Annual Total Packaging Waste & Print Paper Recovery (tones)10
Attiki - Fyli N/D N/D N/D 45,000 (nominal capacity) Attiki - Elefsina N/D N/D N/D 25,000 (nominal capacity) Attiki - Marousi 287,493 5,761 20 18,129
Attiki - Aspropyrgos 2,743,062 30,051 95 77,968 Thermi 208,473 5,271 11 8,429
Kallithea 250,848 3,043 13 3,352 Tagarades 776,881 3,845 12 8,995 Heraklion 292,311 5,271 18 12,123 Chania 176,874 3,090 11 8,154
Kalamata 161,071 1,938 6 4,333 Patra 341,304 4,130 12 6,936 Lamia 214,640 3,155 10 2,187
Karditsa 199,500 3,517 8 5,897 Katerini 251,703 3,139 9 4,641 Corfu 103,459 1,309 4 3,300
Schimatari 62,743 718 4 1,152 Volos 121,992 1,689 N/D N/D
Ioannina11 57,347 751 3 196 Larisa N/D N/D N/D N/D
10 Data from 31/12/08 - The results refer to all Municipalities served by the MRF concerned 11 11/2008 – 12/2008
EIB Study: JESSICA instruments for SWM in Greece: FINAL Report - Part 1
86
No Incineration Plants are currently in operation. The environmental impact
assessment studies for a plant in the island of Rhodes and another one in Thiva
(Viotia) are in progress. Considering the fact that the issuing of an operating
permission is a time-consuming procedure, its not expected that it will start
operating before 2013.
4.5. SECONDARY PRODUCT MARKET
The viability of any investment in solid waste processing depends on the optimisation
of the available waste streams, the plant capacity and the existing and future
markets for the materials produced (e.g recyclables, compost, energy etc). The
latter, is a key parameter in the evaluation of the viability of any such investment,
and an area where many unsuccessful ventures have paid insufficient attention.
Market analysis is as important for products where markets exist but are vulnerable
to fluctuations (such as recyclables or energy) as for products where markets are not
developed yet (such as compost). For example compost utilisation, is affected by and
would benefit from several activities where further analysis in the Greek market
context would be beneficial. Examples of these include the development and formal
adoption of quality standards for domestic, agricultural, soil enrichment etc, use of
compost, public attitude surveys on the use of compost, evaluation of factors
affecting compost quality etc. In the following sections, a brief description of the
compost and RDF/SRF market is outlined.
4.5.1. Compost market
Compost is a unique product which can improve the physical, chemical (nutritional)
and biological properties of soil and plant growth media. These characteristics make
compost a valuable product which can be used in a variety of applications. High
quality composts have been produced from leaf and yard debris, biosolids, municipal
solid waste, animal manures, agricultural by-products, food and a variety of industrial
by-products. Generally a cleaner separated at source bio-waste fraction allows to
produce high quality compost. Moreover the residue from anaerobic digestion (the
digestate) can be composted and produce also good quality compost. According to
EU Green Paper “on the management of bio-waste in the European Union”, compost
in EU is used in agriculture (about 50%), for landscaping (up to 20%), to produce
EIB Study: JESSICA instruments for SWM in Greece: FINAL Report - Part 1
87
growing media (blends) and manufactured soil (around 20%), and by private
consumers (up to 25%). Countries which produce compost predominantly from
mixed waste and have undeveloped compost markets tend to use it in agriculture,
for land restoration or landfill cover. The demand for compost varies in Europe
depending mostly on soil improvement needs, and consumer confidence. EU soil
policy calling on the Commission and the Parliament to act against the degradation
of soil, as well as increasing consumer confidence in relation to the safe use of
composts from waste, could enhance demand significantly. Nowadays, in Greece, the
price of compost varies from 2.50 up to 15.00 € / tonne (bulk) depending on its
properties and quality. The price of bagged, high quality compost in Europe reaches
up to 100.00 € / tonne, however, at this point, the market for high quality compost
in Greece it is estimated to be very limited, due to the low price of competitive
fertilizers.
For the compost produced in the Athens M.B.T. a study was issued in order to
examine the available options for its utilization. The study investigated the possibility
to utilize the compost in Municipalities with park areas, in the gardening sector and
in the Public Power Corporation Plant of Megalopolis. In case compost is utilized as a
soil improver following requirements should be met:
Zero content of heavy metals
Moisture content: 30%
pH: 6.5-7
Grain size: fine
Total N Content: 80-90%
NH4 Content: 75%
Impurities (glas,plastic): 1%
Zero content on enterobacteriaceae
Agricultural and fertilizer firms are mainly interested in specific chemical and physical
characteristics when evaluating the quality of a compost product. The products
quality should remain constant throughout the year. Typical requirements are:
Moisture content: 40%
pH 6.5-7.0
C/N ratio: 15
Grain size: fine

EIB Study: JESSICA instruments for SWM in Greece: FINAL Report - Part 1
88
Total N Content: 1.5%
Impurities (glass, plastic): 1%
Zero content of heavy metals
A six month testing in order to assess its contribution to the growth rate of
the plants
When the aforementioned requirements are met, gardening businesses are
interested in the use of compost, especially if its price is lower than other fertilizers
and soil improvers.
The Public Power Corporation was interested in using compost as a restoration
material in order to compensate its mining activities. The company expressed its
reservations regarding how suitable the material for the restoration of the mining
sites is. For that reason it requested an initial five month trial period in order to
assess the situation. At the time being the compost from existing MBT in Athens
(Ano Liosia) is only used for restoration and landfill works, and the average price is
2.5 €/tn.
4.5.2. RDF- SRF market
RDF consists largely of organic components of municipal waste such as plastics and
biodegradable waste. RDF processing facilities are normally located near a source of
MSW and, while an optional combustion facility is normally close to the processing
facility, it may also be located at a remote location. SRF can be distinguished from
RDF in the fact that it is produced to reach a standard such as CEN/343 ANAS.
RDF can be used in a variety of ways to produce electricity. It can be used alongside
traditional sources of fuel in coal power plants. In Greece the RDF produced in the
M.B.T. of A. Liossia it is either stored or used in landfilling operations. The WMA of
the Attica Region issued a market study in order to find a way to utilize the RDF
produced in the Athens treatment unit. The study included two big cement industries
(AGET IRAKLIS and Titan A.E.) and other types of industry where big amounts of
energy are required (Public Power Corporation, Steel Industries and Lime Industries)
but there was no correspondence. The cement industries didn’t provide data relating
to the fuel type they are using and gave the following specifications regarding the
characteristics of the RDF in order to accept it as a fuel:

EIB Study: JESSICA instruments for SWM in Greece: FINAL Report - Part 1
89
Moisture Content: 3-10%
Chlor Content: 15%
Low bulk density
A comparatively high calorific value (15−18 MJ/kg)
Some of the issues brought to the table by the industry (low facility performance,
odor emissions while handling RDF which might affect personnel, need of storage
capacity, RDF production rate, modification of the facility’s environmental permission
terms) should be examined closely and solutions should be provided. Assuming that
the RDF qualitative requirements are met then the perspectives for the acceptance of
RDF will be given since the interest in using alternative fuels is constantly increasing.
A contract has been signed between AGET IRAKLIS and the W.M.A. which states that
initially 35,000 tn/year will be co incinerated in the AGET plant and that amount will
increase to 75,000 tn/year. According to the contract AGET will receive 10 € per tone
of RDF co incinerated. Totally 750,000 €/year will be required, while for less amount
the price could reach 20 € per tone (-20 €/). The contract was signed during
February 2007 and has a five year duration. Nevertheless the total amount of RDF is
still being landfilled. Construction and operation of Waste to Energy plants are
expected to enhance demand and thus selling price significantly.
4.5.3. Recyclable materials
The main recyclable materials produced during the mechanical sorting of MSW are
metals. As mentioned before, in 2007, the recycling rate in Greece was 14% (62 kg
per capita - year). Depending on the desired recovery rates, other recyclables such
as plastic, paper and glass can be recovered as well. Those materials are not pure
since they derive from commingled waste and contain a big proportion of impurities
mainly organic waste. The impurities cause those materials to have a lower
commercial compared to recyclables originating from source separation schemes.
Ferrous Metal
Ferrous metals recovered originate from packaging waste and consist of steel with a
thin internal layer of tin. The requirements set by companies in order to absorb the
recycled metals are the following:
EIB Study: JESSICA instruments for SWM in Greece: FINAL Report - Part 1
90
Metals should be separated and free from impurities (plastic, wood, earth)
Sorting into categories is usually a necessary requirement and increases
commercial value
No significant problems have been identified in selling the recovered metals. Prices
achieved lie around 120-140 €/tn.
Non Ferrous metal
The main fraction of non ferrous metals comprises of aluminium originating from
beer and refreshment cans. Scrap aluminium can achieve high prices that encourage
high recovery rates. It can be reused many times without loosing in quality.
Requirements in order to sell the non ferrous metals are:
Metals should be sorted and free from impurities
High compression isn’t wanted in order to be able separate the metals easily.
Selling prices for aluminimium vary a lot depending on the market needs. Usually it
can be sold for 700 €/tn.
Paper
Paper can be classified in different categories depending on quality and the presence
of impurities. Paper originating from commingled waste has for example low
commercial value due to a big amount of impurities found such as:
plastic films that cause problems to the paper recycling equipment
organics attached that cause high moisture levels
small metal pieces like paper clips
Paper is the fastest developing market for recycled products. According to market
studies that have been issued the need for recovered paper is constantly increasing.
In order to be accepted it needs to be free from impurities and high levels of
moisture. Prices are influenced by the fluctuations in the international market.
Typically it can be sold for 35 - 80 € / tone depending on the quality.
Glass
Glass can be recycled many times without any negative impact in the final quality.
For that reason it is considered as one of the most environmental-friendly materials.
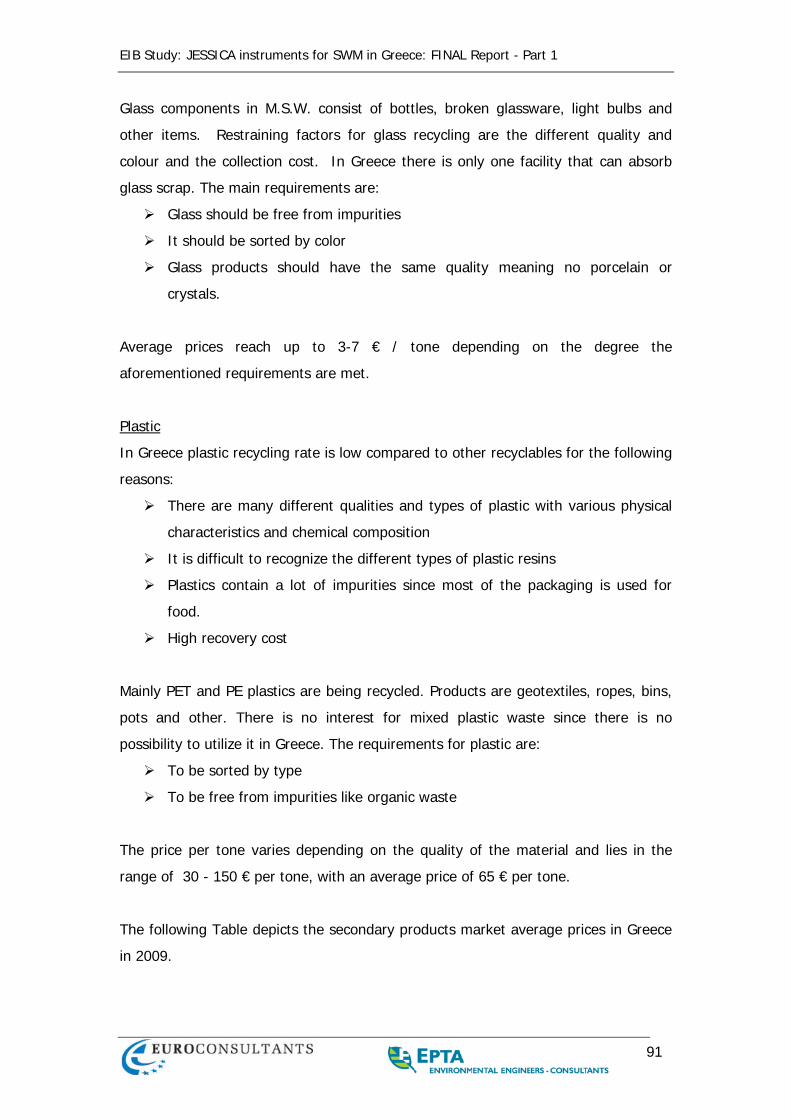
EIB Study: JESSICA instruments for SWM in Greece: FINAL Report - Part 1
91
Glass components in M.S.W. consist of bottles, broken glassware, light bulbs and
other items. Restraining factors for glass recycling are the different quality and
colour and the collection cost. In Greece there is only one facility that can absorb
glass scrap. The main requirements are:
Glass should be free from impurities
It should be sorted by color
Glass products should have the same quality meaning no porcelain or
crystals.
Average prices reach up to 3-7 € / tone depending on the degree the
aforementioned requirements are met.
Plastic
In Greece plastic recycling rate is low compared to other recyclables for the following
reasons:
There are many different qualities and types of plastic with various physical
characteristics and chemical composition
It is difficult to recognize the different types of plastic resins
Plastics contain a lot of impurities since most of the packaging is used for
food.
High recovery cost
Mainly PET and PE plastics are being recycled. Products are geotextiles, ropes, bins,
pots and other. There is no interest for mixed plastic waste since there is no
possibility to utilize it in Greece. The requirements for plastic are:
To be sorted by type
To be free from impurities like organic waste
The price per tone varies depending on the quality of the material and lies in the
range of 30 - 150 € per tone, with an average price of 65 € per tone.
The following Table depicts the secondary products market average prices in Greece
in 2009.
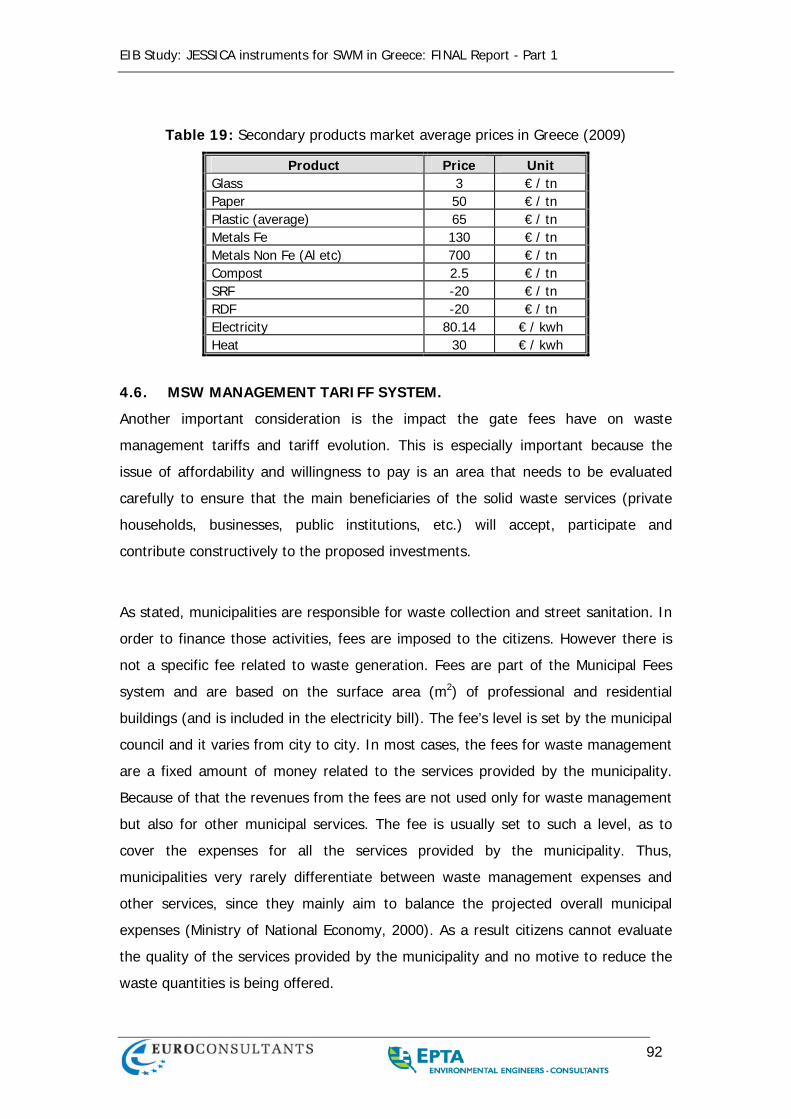
EIB Study: JESSICA instruments for SWM in Greece: FINAL Report - Part 1
92
Table 19: Secondary products market average prices in Greece (2009)
Product Price Unit Glass 3 € / tn Paper 50 € / tn Plastic (average) 65 € / tn Metals Fe 130 € / tn Metals Non Fe (Al etc) 700 € / tn Compost 2.5 € / tn SRF -20 € / tn RDF -20 € / tn Electricity 80.14 € / kwh Heat 30 € / kwh
4.6. MSW MANAGEMENT TARIFF SYSTEM.
Another important consideration is the impact the gate fees have on waste
management tariffs and tariff evolution. This is especially important because the
issue of affordability and willingness to pay is an area that needs to be evaluated
carefully to ensure that the main beneficiaries of the solid waste services (private
households, businesses, public institutions, etc.) will accept, participate and
contribute constructively to the proposed investments.
As stated, municipalities are responsible for waste collection and street sanitation. In
order to finance those activities, fees are imposed to the citizens. However there is
not a specific fee related to waste generation. Fees are part of the Municipal Fees
system and are based on the surface area (m2) of professional and residential
buildings (and is included in the electricity bill). The fee’s level is set by the municipal
council and it varies from city to city. In most cases, the fees for waste management
are a fixed amount of money related to the services provided by the municipality.
Because of that the revenues from the fees are not used only for waste management
but also for other municipal services. The fee is usually set to such a level, as to
cover the expenses for all the services provided by the municipality. Thus,
municipalities very rarely differentiate between waste management expenses and
other services, since they mainly aim to balance the projected overall municipal
expenses (Ministry of National Economy, 2000). As a result citizens cannot evaluate
the quality of the services provided by the municipality and no motive to reduce the
waste quantities is being offered.
EIB Study: JESSICA instruments for SWM in Greece: FINAL Report - Part 1
93
Collection, treatment and disposal costs are depending on the geographical data and
the equipment used. In Attiki the average annual unit waste management cost is
€42/cap-year with minimum value at €11/cap-year and maximum at €130/cap-
year12. The new waste treatment plants, which will involve the private sector not
only in the construction but also in operation, it will increase significantly annual unit
waste management cost, depending on the funding mechanisms and type of
technology selected. This will be a good opportunity to change the way fee for solid
waste is allocated and a “Pay as You Throw” strategy to be introduced by Waste
Management Authorities (WMA). Nevertheless, taking into consideration that MSW
generation in Greece lies around 448 kg per capita, it is expected that the annual
expenses per person for MSW management, will reach an average of 80 €/cap-year.
Regarding recycling, since the beginning of 2009, Municipalities receive an extra
financial aid for the collection of recyclables by HERRCO. The amount scales
according to the quantity of packaging waste collected per inhabitant, and is shown
in the following table.
Table 20: Financial contribution to Municipalities for the collection of packaging
waste
Collected Waste per capita Financial Aid
From (kg) To (kg) € / tn 0.0 8.0 30 8.1 15.0 40 15.1 20.0 50 20.1 25.0 60 25.1 30.0 65 30.1 -- 70
12 Katia Lasaridi et al, Comparative analysis and geographic differentiation of solid waste management costs in urban and rural municipalities, 2008

EIB Study: JESSICA instruments for SWM in Greece: FINAL Report - Part 1
94
5. MSW MANAGEMENT FUTURE PLANNING
5.1. IMPACT OF EU LEGISLATION
Greece, as any other Member State (MS), is under the obligation to meet certain
targets regarding material recycling and the diversion of biodegradable waste.
Council Directive 1999/31/EC of 26 April 1999 refers to the disposal of waste to
landfills. The aim of the Directive is to define measures, directions and guidance, in
order to prevent or reduce, as far as possible, the adverse effects of the landfill of
waste on the environment, in particular on surface water, groundwater, soil, air and
human health, by providing stringent operational and technical requirements on the
waste and landfills.
The Directive requires from the MS to set up a national strategy for the
implementation of the reduction of Biodegradable Municipal Waste (BMW) going to
landfills in a specific interval of time by means of recycling, composting, biogas
production or materials/energy recovery, and notify the Commission of this strategy.
More specifically the Directive sets the following targets:
In 2006, BMW going to landfills must be reduced to 75 % of the total amount of
BMW produced in 1995, for which standardised Eurostat data are available;
In 2009, BMW going to landfills must be reduced to 50 % of the total amount of
BMW produced in 1995 for which standardised Eurostat data are available;
In 2016, BMW going to landfills must be reduced to 35 % of the total amount of
BMW produced in 1995 for which standardised Eurostat data are available.
Countries, such as Greece and United Kingdom, where more than 80% of the waste
ended up at landfills in the reference year gained a 4-year extension in order to
reach the aforementioned targets. Greece is formulating its strategies by placing
targets for the years 2010, 2013 and 2020. This requires the adoption of treatment
technologies that results in either the recycling of the material (such as composting)
or the recovery of energy (such as thermal treatment).
EIB Study: JESSICA instruments for SWM in Greece: FINAL Report - Part 1
95
Based on Eurostat, official data for Greece exist for years 1985, 1990, 1991, 1992,
1997 and 2001. The majority of the data reported to Eurostat are based on
estimations, since in the ‘80s and the early ‘90s uncontrolled or semi-controlled
dumping was the common practice in Greece. As for MSW composition, data from
field measurements exist for only a few areas such as Athens, Creta, Thessaloniki,
etc. Official data on national level were firstly published in the M.D. 14312/1302 (not
valid) and then in J.M.D. 50910/2727/2003 that reported a total quantity of 3.9
million tones in 1997 of which 2.6 million tonnes are biodegradable (67.0%). Based
on the above, year 1997 was chosen as a basis for calculations, and the targets for
Greece are:
In 2010, BMW going to landfills must be reduced to 1.95 million tonnes;
In 2013, BMW going to landfills must be reduced to 1.3 million tonnes;
In 2020, BMW going to landfills must be reduced to 0.91 million tonnes.
Regarding packaging materials which are collected separately through the competent
scheme HERRCO, as stated, the following targets have been set (J.M.D.
9268/469/2007):
No later than 31 December 2011 60 % as a minimum by weight of packaging
waste will be recovered or incinerated at waste incineration plants with energy
recovery
No later than 31 December 2011 the following minimum recycling targets for
materials contained in packaging waste will be attained:
(i) 60 % by weight for glass;
(ii) 60 % by weight for paper and board;
(iii) 50 % by weight for metals;
(vi) 22,5 % by weight for plastics, counting exclusively material that is recycled
back into plastics;
(vii) 15 % by weight for wood.
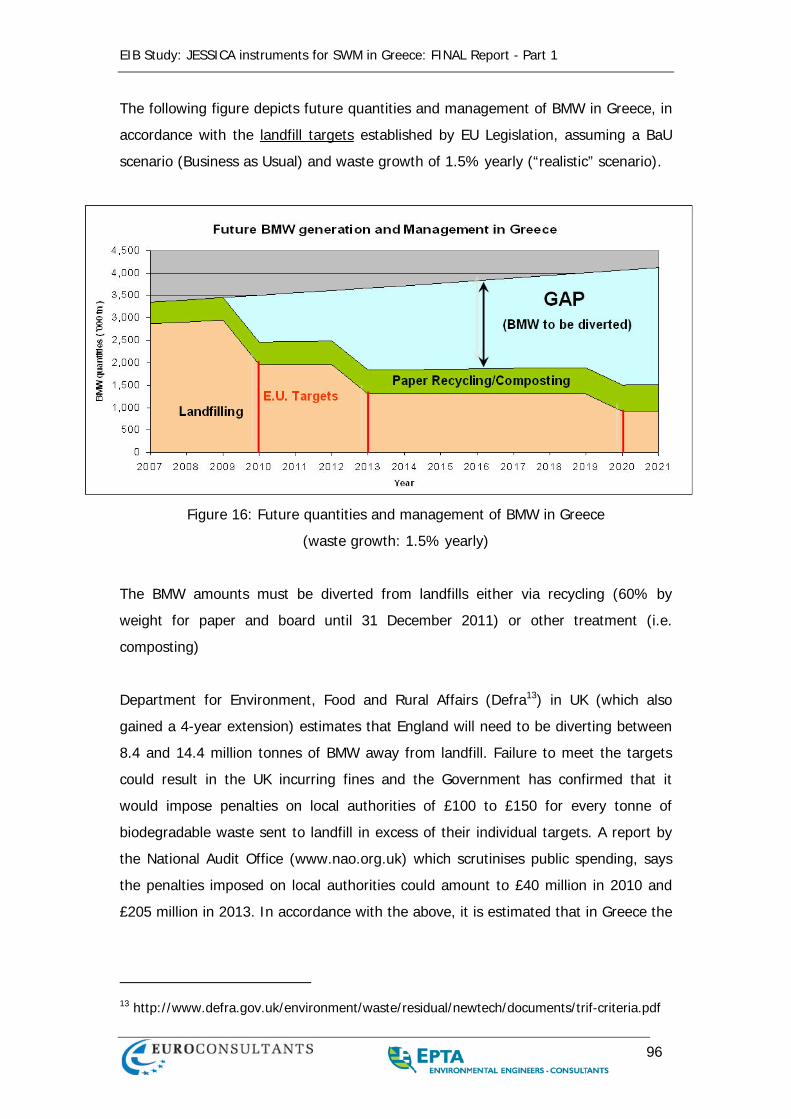
EIB Study: JESSICA instruments for SWM in Greece: FINAL Report - Part 1
96
The following figure depicts future quantities and management of BMW in Greece, in
accordance with the landfill targets established by EU Legislation, assuming a BaU
scenario (Business as Usual) and waste growth of 1.5% yearly (“realistic” scenario).
Figure 16: Future quantities and management of BMW in Greece
(waste growth: 1.5% yearly)
The BMW amounts must be diverted from landfills either via recycling (60% by
weight for paper and board until 31 December 2011) or other treatment (i.e.
composting)
Department for Environment, Food and Rural Affairs (Defra13) in UK (which also
gained a 4-year extension) estimates that England will need to be diverting between
8.4 and 14.4 million tonnes of BMW away from landfill. Failure to meet the targets
could result in the UK incurring fines and the Government has confirmed that it
would impose penalties on local authorities of £100 to £150 for every tonne of
biodegradable waste sent to landfill in excess of their individual targets. A report by
the National Audit Office (www.nao.org.uk) which scrutinises public spending, says
the penalties imposed on local authorities could amount to £40 million in 2010 and
£205 million in 2013. In accordance with the above, it is estimated that in Greece the
13 http://www.defra.gov.uk/environment/waste/residual/newtech/documents/trif-criteria.pdf

EIB Study: JESSICA instruments for SWM in Greece: FINAL Report - Part 1
97
financial penalty could reach up to €150/tonne for each tonne of BMW landfilled in
excess of the landfill allowance limit.
5.2. PLANNED FACILITIES
In line with EU and international best practice, the hierarchy in the waste
management sector according to the NSWMP is based on the following three
principles.
1. Prevention or minimization of waste production (quantitative minimization) as
well as the minimization of the waste content in hazardous substances
(qualitative minimization)
2. Utilization of waste (reuse, recycling and energy recovering)
3. Safe final disposal of residues
In accordance with the above, several compliant residual waste landfills and
treatment units are foreseen by RSWMPs for the next years across the country, in
order to promote sustainability and achieve the targets for diversion of
biodegradable waste and recycling. RSWMPs establish integrated waste management
systems by taking into consideration the environmental impacts, in particular the
waste hierarchy (promote waste prevention, recycling and processing), social and
economical costs and benefits and the best environment practices option, seeing
responsible waste management as part of sustainable development. Moreover, in
each RSWMP local needs and conditions are evaluated, and then a combination of
the most appropriate waste management activities for those conditions is selected.
In the following table, the major existing and planned facilities for waste treatment in
Greece are outlined.
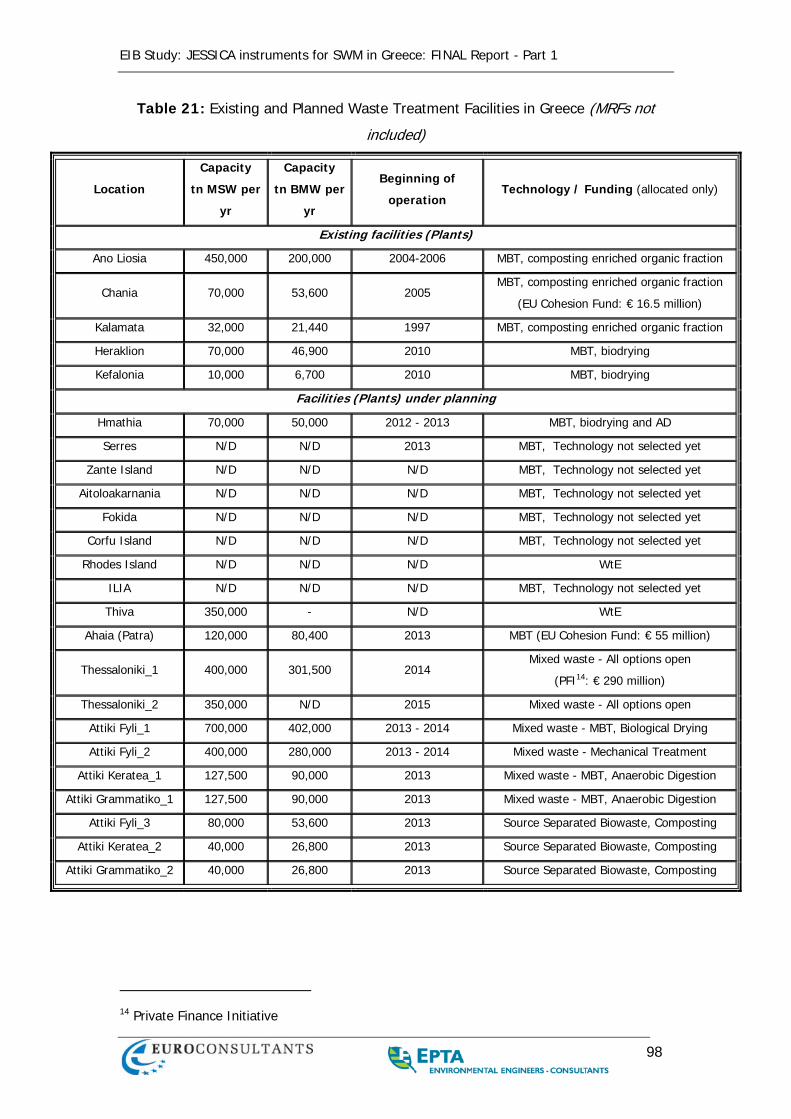
EIB Study: JESSICA instruments for SWM in Greece: FINAL Report - Part 1
98
Table 21: Existing and Planned Waste Treatment Facilities in Greece (MRFs not
included)
Location
Capacity
tn MSW per
yr
Capacity
tn BMW per
yr
Beginning of
operation Technology / Funding (allocated only)
Existing facilities (Plants)
Ano Liosia 450,000 200,000 2004-2006 MBT, composting enriched organic fraction
Chania 70,000 53,600 2005 MBT, composting enriched organic fraction
(EU Cohesion Fund: € 16.5 million)
Kalamata 32,000 21,440 1997 MBT, composting enriched organic fraction
Heraklion 70,000 46,900 2010 MBT, biodrying
Kefalonia 10,000 6,700 2010 MBT, biodrying
Facilities (Plants) under planning
Hmathia 70,000 50,000 2012 - 2013 MBT, biodrying and AD
Serres N/D N/D 2013 MBT, Technology not selected yet
Zante Island N/D N/D N/D MBT, Technology not selected yet
Aitoloakarnania N/D N/D N/D MBT, Technology not selected yet
Fokida N/D N/D N/D MBT, Technology not selected yet
Corfu Island N/D N/D N/D MBT, Technology not selected yet
Rhodes Island N/D N/D N/D WtE
ILIA N/D N/D N/D MBT, Technology not selected yet
Thiva 350,000 - N/D WtE
Ahaia (Patra) 120,000 80,400 2013 MBT (EU Cohesion Fund: € 55 million)
Thessaloniki_1 400,000 301,500 2014 Mixed waste - All options open
(PFI14: € 290 million)
Thessaloniki_2 350,000 N/D 2015 Mixed waste - All options open
Attiki Fyli_1 700,000 402,000 2013 - 2014 Mixed waste - MBT, Biological Drying
Attiki Fyli_2 400,000 280,000 2013 - 2014 Mixed waste - Mechanical Treatment
Attiki Keratea_1 127,500 90,000 2013 Mixed waste - MBT, Anaerobic Digestion
Attiki Grammatiko_1 127,500 90,000 2013 Mixed waste - MBT, Anaerobic Digestion
Attiki Fyli_3 80,000 53,600 2013 Source Separated Biowaste, Composting
Attiki Keratea_2 40,000 26,800 2013 Source Separated Biowaste, Composting
Attiki Grammatiko_2 40,000 26,800 2013 Source Separated Biowaste, Composting
14 Private Finance Initiative
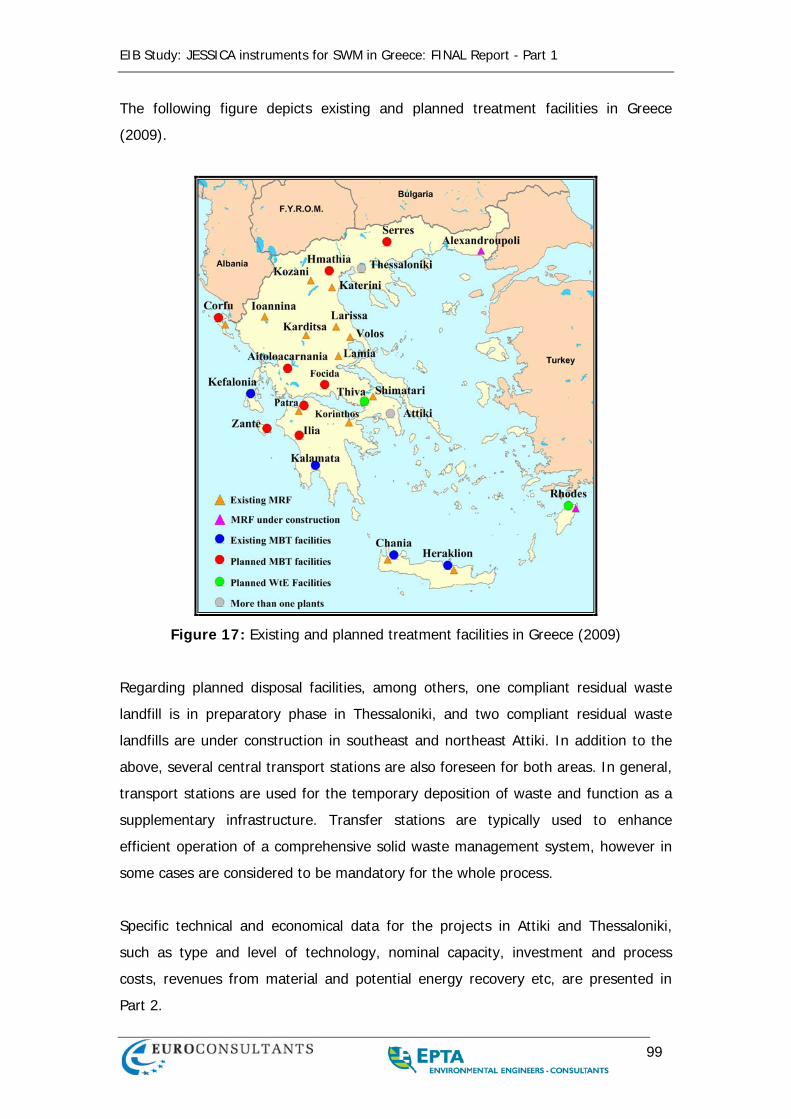
EIB Study: JESSICA instruments for SWM in Greece: FINAL Report - Part 1
99
The following figure depicts existing and planned treatment facilities in Greece
(2009).
Figure 17: Existing and planned treatment facilities in Greece (2009)
Regarding planned disposal facilities, among others, one compliant residual waste
landfill is in preparatory phase in Thessaloniki, and two compliant residual waste
landfills are under construction in southeast and northeast Attiki. In addition to the
above, several central transport stations are also foreseen for both areas. In general,
transport stations are used for the temporary deposition of waste and function as a
supplementary infrastructure. Transfer stations are typically used to enhance
efficient operation of a comprehensive solid waste management system, however in
some cases are considered to be mandatory for the whole process.
Specific technical and economical data for the projects in Attiki and Thessaloniki,
such as type and level of technology, nominal capacity, investment and process
costs, revenues from material and potential energy recovery etc, are presented in
Part 2.
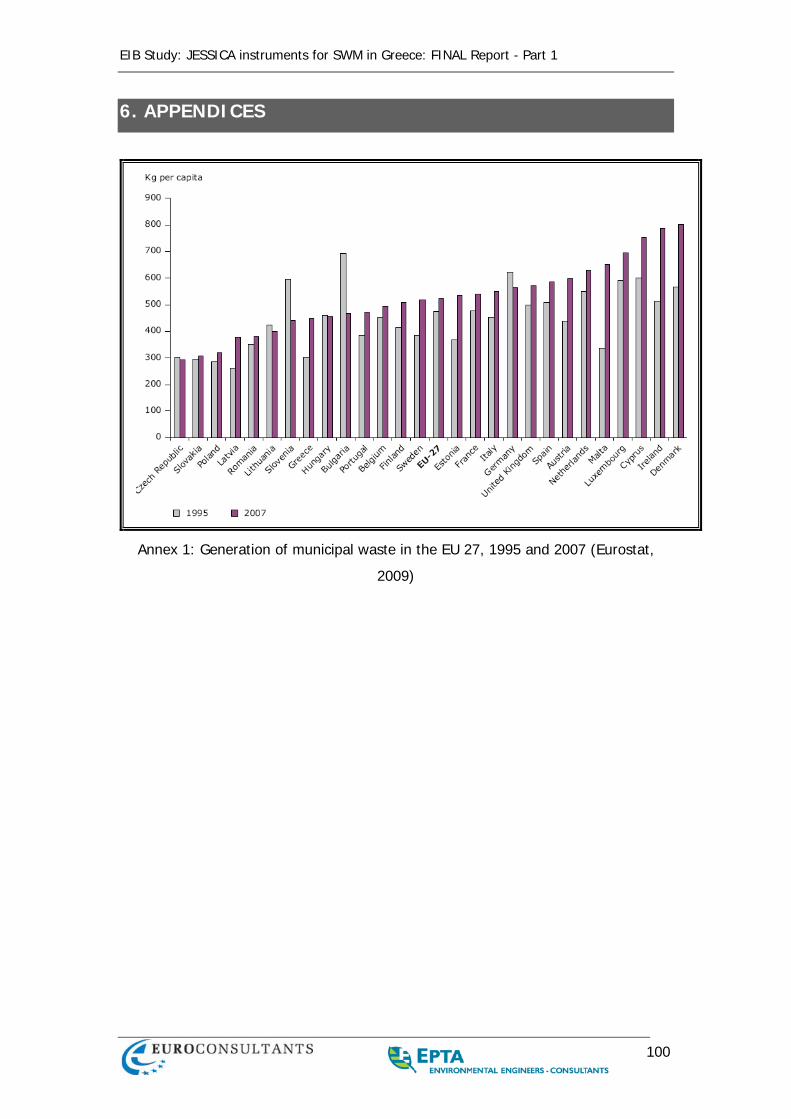
EIB Study: JESSICA instruments for SWM in Greece: FINAL Report - Part 1
100
6. APPENDICES
Annex 1: Generation of municipal waste in the EU 27, 1995 and 2007 (Eurostat,
2009)
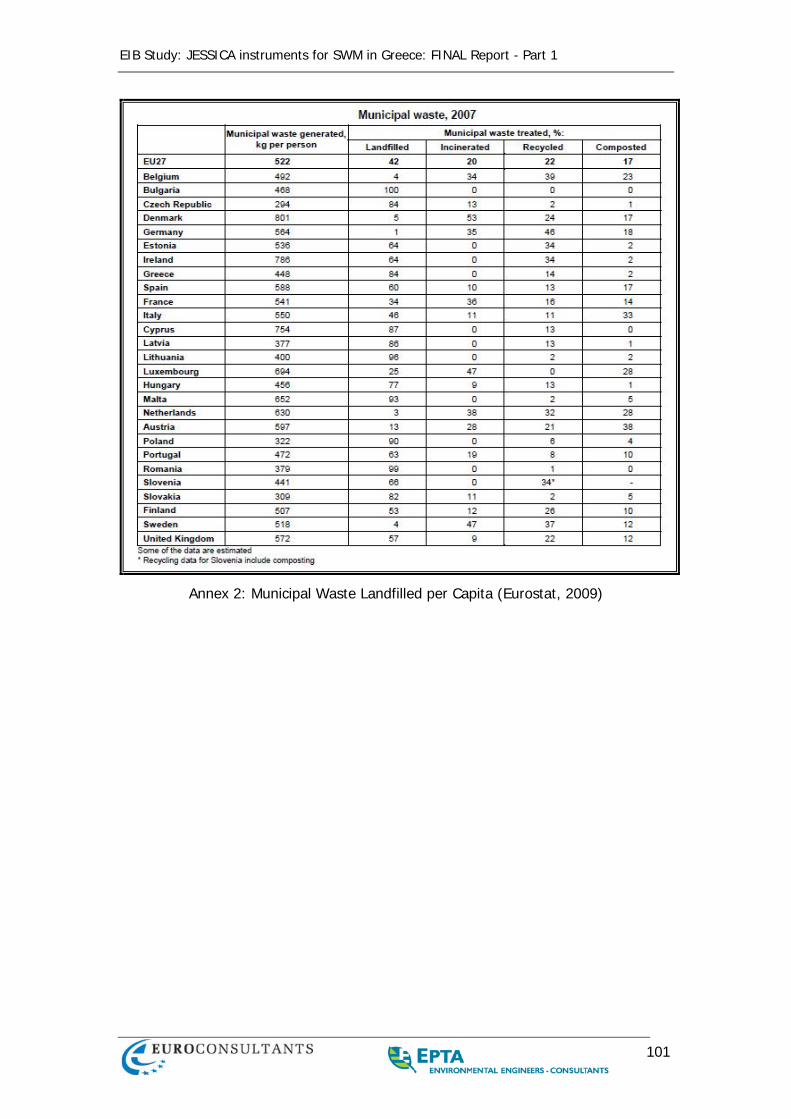
EIB Study: JESSICA instruments for SWM in Greece: FINAL Report - Part 1
101
Annex 2: Municipal Waste Landfilled per Capita (Eurostat, 2009)

EIB Study: JESSICA instruments for SWM in Greece: FINAL Report - Part 1
102
GDP at market prices; Mio Euros 2000 2001 2002 2003 2004 2005 2006 2007 2008* 2009*
EU-27 9.201.599 9.580.280 9.942.036 10.109.207 10.606.787 11.061.212 11.681.281 12.357.562 12.506.082 12.167.820 EU-15 9.147.243 9.519.674 9.876.798 10.038.864 10.525.848 10.959.527 11.558.292 12.204.817 12.334.928 11.999.234 Bulgaria 13.704 15.250 16.623 17.767 19.875 21.882 25.238 28.899 34.118 33.416 Czech Republic 61.495 69.045 80.004 80.924 88.262 100.190 113.696 127.331 147.879 134.653 Denmark 173.598 179.226 184.744 188.500 197.070 207.367 218.747 227.025 233.027 224.910 Estonia 6.160 6.971 7.776 8.719 9.685 11.182 13.229 15.627 16.073 13.849 Ireland 104.830 116.931 130.258 139.763 149.098 162.091 176.759 189.751 181.815 164.211 Greece 137.930 146.428 156.615 172.431 185.813 195.366 210.460 226.437 239.141 240.421 Spain 630.263 680.678 729.206 782.929 841.042 908.792 984.284 1.052.730 1.088.502 1.049.052 France 1.441.373 1.497.187 1.548.559 1.594.814 1.660.189 1.726.068 1.806.429 1.894.646 1.950.085 1.943.436 Italy 1.191.057 1.248.648 1.295.226 1.335.354 1.391.530 1.429.479 1.485.377 1.544.915 1.572.243 1.533.800 Cyprus 10.079 10.801 11.170 11.785 12.728 13.659 14.673 15.951 17.248 17.558 Lithuania 12.377 13.577 15.052 16.497 18.158 20.870 23.979 28.577 32.203 26.029 Luxembourg 22.001 22.572 23.992 25.834 27.455 30.281 34.149 37.464 39.347 37.530 Hungary 51.320 59.584 70.874 74.186 82.666 88.646 89.894 101.087 105.536 91.988 Netherlands 417.960 447.731 465.214 476.945 491.184 513.407 540.216 568.664 595.883 574.826 Austria 207.529 212.499 218.848 223.302 232.782 243.585 256.162 270.782 281.868 275.538 Portugal 122.270 129.308 135.434 138.582 144.128 149.123 155.446 163.051 166.429 162.336 Romania 40.651 45.357 48.615 52.577 61.064 79.802 97.751 124.821 137.035 117.655 Slovenia 21.435 22.707 24.527 25.736 27.136 28.758 31.056 34.568 37.135 35.476 Slovakia 22.036 23.542 25.980 29.486 34.032 38.490 44.567 54.857 64.884 66.262 Finland 132.198 139.789 143.808 145.795 152.151 157.070 167.009 179.659 184.728 175.758 Sweden 266.422 251.340 264.244 275.657 287.689 294.674 313.450 331.147 328.088 293.808 United Kingdom 1.602.240 1.643.154 1.710.421 1.647.056 1.772.546 1.833.954 1.944.751 2.044.133 1.818.524 1.590.692 Turkey 289.933 217.905 243.440 268.331 314.584 386.937 419.232 471.972 498.373 442.295 Iceland 9.421 8.830 9.474 9.709 10.660 13.124 13.311 14.851 10.265 9.684 Norway 182.579 190.956 204.074 199.146 208.256 242.935 268.363 283.366 309.251 261.755 Switzerland 270.918 284.886 296.018 287.754 292.382 299.554 311.873 317.202 341.330 357.744
Annex 3: GDP at market prices (Mio Euros) in the EU 27 MS (Eurostat, 2009)
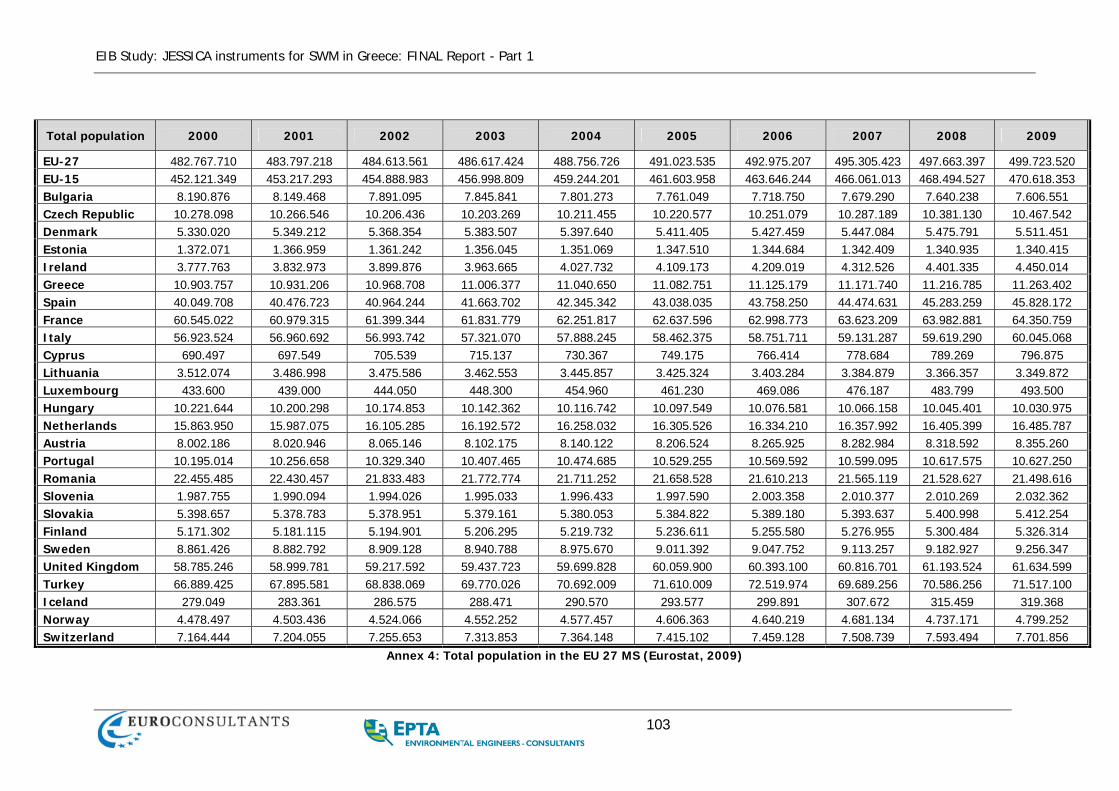
EIB Study: JESSICA instruments for SWM in Greece: FINAL Report - Part 1
103
Total population 2000 2001 2002 2003 2004 2005 2006 2007 2008 2009
EU-27 482.767.710 483.797.218 484.613.561 486.617.424 488.756.726 491.023.535 492.975.207 495.305.423 497.663.397 499.723.520 EU-15 452.121.349 453.217.293 454.888.983 456.998.809 459.244.201 461.603.958 463.646.244 466.061.013 468.494.527 470.618.353 Bulgaria 8.190.876 8.149.468 7.891.095 7.845.841 7.801.273 7.761.049 7.718.750 7.679.290 7.640.238 7.606.551 Czech Republic 10.278.098 10.266.546 10.206.436 10.203.269 10.211.455 10.220.577 10.251.079 10.287.189 10.381.130 10.467.542 Denmark 5.330.020 5.349.212 5.368.354 5.383.507 5.397.640 5.411.405 5.427.459 5.447.084 5.475.791 5.511.451 Estonia 1.372.071 1.366.959 1.361.242 1.356.045 1.351.069 1.347.510 1.344.684 1.342.409 1.340.935 1.340.415 Ireland 3.777.763 3.832.973 3.899.876 3.963.665 4.027.732 4.109.173 4.209.019 4.312.526 4.401.335 4.450.014 Greece 10.903.757 10.931.206 10.968.708 11.006.377 11.040.650 11.082.751 11.125.179 11.171.740 11.216.785 11.263.402 Spain 40.049.708 40.476.723 40.964.244 41.663.702 42.345.342 43.038.035 43.758.250 44.474.631 45.283.259 45.828.172 France 60.545.022 60.979.315 61.399.344 61.831.779 62.251.817 62.637.596 62.998.773 63.623.209 63.982.881 64.350.759 Italy 56.923.524 56.960.692 56.993.742 57.321.070 57.888.245 58.462.375 58.751.711 59.131.287 59.619.290 60.045.068 Cyprus 690.497 697.549 705.539 715.137 730.367 749.175 766.414 778.684 789.269 796.875 Lithuania 3.512.074 3.486.998 3.475.586 3.462.553 3.445.857 3.425.324 3.403.284 3.384.879 3.366.357 3.349.872 Luxembourg 433.600 439.000 444.050 448.300 454.960 461.230 469.086 476.187 483.799 493.500 Hungary 10.221.644 10.200.298 10.174.853 10.142.362 10.116.742 10.097.549 10.076.581 10.066.158 10.045.401 10.030.975 Netherlands 15.863.950 15.987.075 16.105.285 16.192.572 16.258.032 16.305.526 16.334.210 16.357.992 16.405.399 16.485.787 Austria 8.002.186 8.020.946 8.065.146 8.102.175 8.140.122 8.206.524 8.265.925 8.282.984 8.318.592 8.355.260 Portugal 10.195.014 10.256.658 10.329.340 10.407.465 10.474.685 10.529.255 10.569.592 10.599.095 10.617.575 10.627.250 Romania 22.455.485 22.430.457 21.833.483 21.772.774 21.711.252 21.658.528 21.610.213 21.565.119 21.528.627 21.498.616 Slovenia 1.987.755 1.990.094 1.994.026 1.995.033 1.996.433 1.997.590 2.003.358 2.010.377 2.010.269 2.032.362 Slovakia 5.398.657 5.378.783 5.378.951 5.379.161 5.380.053 5.384.822 5.389.180 5.393.637 5.400.998 5.412.254 Finland 5.171.302 5.181.115 5.194.901 5.206.295 5.219.732 5.236.611 5.255.580 5.276.955 5.300.484 5.326.314 Sweden 8.861.426 8.882.792 8.909.128 8.940.788 8.975.670 9.011.392 9.047.752 9.113.257 9.182.927 9.256.347 United Kingdom 58.785.246 58.999.781 59.217.592 59.437.723 59.699.828 60.059.900 60.393.100 60.816.701 61.193.524 61.634.599 Turkey 66.889.425 67.895.581 68.838.069 69.770.026 70.692.009 71.610.009 72.519.974 69.689.256 70.586.256 71.517.100 Iceland 279.049 283.361 286.575 288.471 290.570 293.577 299.891 307.672 315.459 319.368 Norway 4.478.497 4.503.436 4.524.066 4.552.252 4.577.457 4.606.363 4.640.219 4.681.134 4.737.171 4.799.252 Switzerland 7.164.444 7.204.055 7.255.653 7.313.853 7.364.148 7.415.102 7.459.128 7.508.739 7.593.494 7.701.856
Annex 4: Total population in the EU 27 MS (Eurostat, 2009)
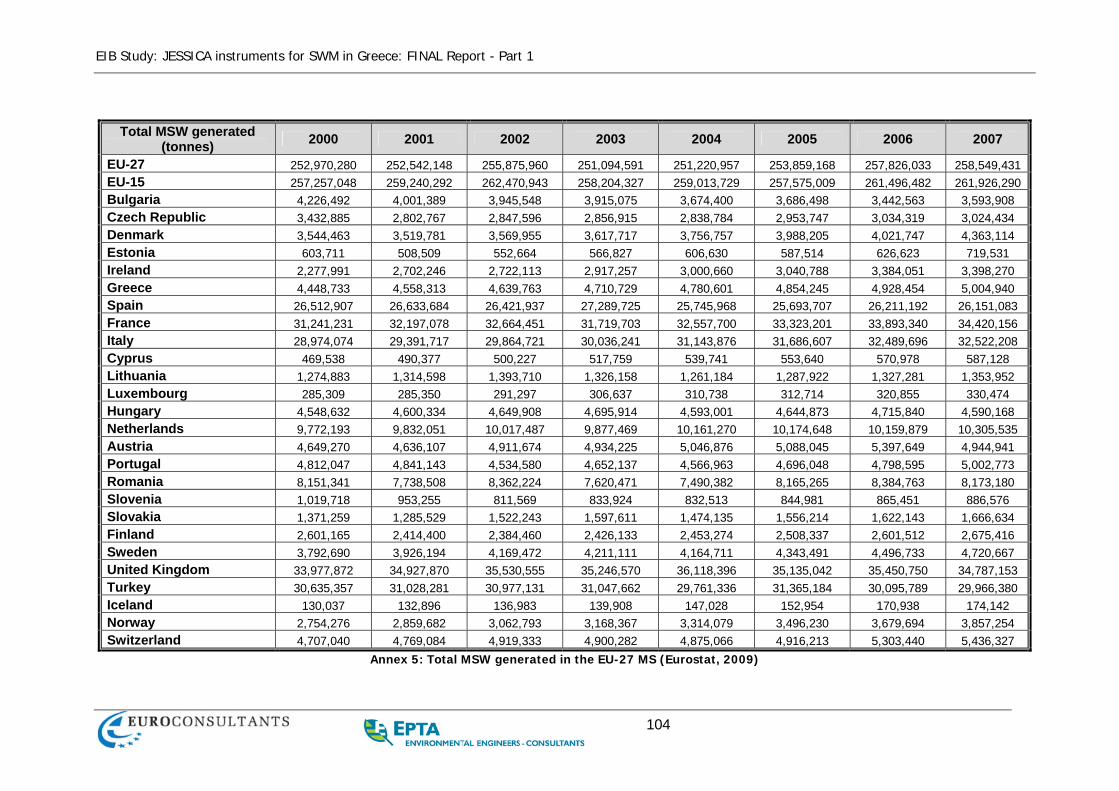
EIB Study: JESSICA instruments for SWM in Greece: FINAL Report - Part 1
104
Total MSW generated (tonnes) 2000 2001 2002 2003 2004 2005 2006 2007
EU-27 252,970,280 252,542,148 255,875,960 251,094,591 251,220,957 253,859,168 257,826,033 258,549,431 EU-15 257,257,048 259,240,292 262,470,943 258,204,327 259,013,729 257,575,009 261,496,482 261,926,290 Bulgaria 4,226,492 4,001,389 3,945,548 3,915,075 3,674,400 3,686,498 3,442,563 3,593,908 Czech Republic 3,432,885 2,802,767 2,847,596 2,856,915 2,838,784 2,953,747 3,034,319 3,024,434 Denmark 3,544,463 3,519,781 3,569,955 3,617,717 3,756,757 3,988,205 4,021,747 4,363,114 Estonia 603,711 508,509 552,664 566,827 606,630 587,514 626,623 719,531 Ireland 2,277,991 2,702,246 2,722,113 2,917,257 3,000,660 3,040,788 3,384,051 3,398,270 Greece 4,448,733 4,558,313 4,639,763 4,710,729 4,780,601 4,854,245 4,928,454 5,004,940 Spain 26,512,907 26,633,684 26,421,937 27,289,725 25,745,968 25,693,707 26,211,192 26,151,083 France 31,241,231 32,197,078 32,664,451 31,719,703 32,557,700 33,323,201 33,893,340 34,420,156 Italy 28,974,074 29,391,717 29,864,721 30,036,241 31,143,876 31,686,607 32,489,696 32,522,208 Cyprus 469,538 490,377 500,227 517,759 539,741 553,640 570,978 587,128 Lithuania 1,274,883 1,314,598 1,393,710 1,326,158 1,261,184 1,287,922 1,327,281 1,353,952 Luxembourg 285,309 285,350 291,297 306,637 310,738 312,714 320,855 330,474 Hungary 4,548,632 4,600,334 4,649,908 4,695,914 4,593,001 4,644,873 4,715,840 4,590,168 Netherlands 9,772,193 9,832,051 10,017,487 9,877,469 10,161,270 10,174,648 10,159,879 10,305,535 Austria 4,649,270 4,636,107 4,911,674 4,934,225 5,046,876 5,088,045 5,397,649 4,944,941 Portugal 4,812,047 4,841,143 4,534,580 4,652,137 4,566,963 4,696,048 4,798,595 5,002,773 Romania 8,151,341 7,738,508 8,362,224 7,620,471 7,490,382 8,165,265 8,384,763 8,173,180 Slovenia 1,019,718 953,255 811,569 833,924 832,513 844,981 865,451 886,576 Slovakia 1,371,259 1,285,529 1,522,243 1,597,611 1,474,135 1,556,214 1,622,143 1,666,634 Finland 2,601,165 2,414,400 2,384,460 2,426,133 2,453,274 2,508,337 2,601,512 2,675,416 Sweden 3,792,690 3,926,194 4,169,472 4,211,111 4,164,711 4,343,491 4,496,733 4,720,667 United Kingdom 33,977,872 34,927,870 35,530,555 35,246,570 36,118,396 35,135,042 35,450,750 34,787,153 Turkey 30,635,357 31,028,281 30,977,131 31,047,662 29,761,336 31,365,184 30,095,789 29,966,380 Iceland 130,037 132,896 136,983 139,908 147,028 152,954 170,938 174,142 Norway 2,754,276 2,859,682 3,062,793 3,168,367 3,314,079 3,496,230 3,679,694 3,857,254 Switzerland 4,707,040 4,769,084 4,919,333 4,900,282 4,875,066 4,916,213 5,303,440 5,436,327
Annex 5: Total MSW generated in the EU-27 MS (Eurostat, 2009)
EIB Study: JESSICA instruments for SWM in Greece: FINAL Report - Part 1
105
JESSICA
JOINT EUROPEAN SUPPORT FOR
SUSTAINABLE INVESTMENT IN CITY AREAS
JESSICA Instruments for Solid Waste Management in Greece
STUDY
Final Report – Part 2
Analysis of SWM Case Studies for Jessica funding
March 2010
This document has been produced with the financial assistance of the
European Union. The views expressed herein can in no way be taken to reflect the official opinion of the European Union.
EIB Study: JESSICA instruments for SWM in Greece: FINAL Report - Part 2
2
TABLE OF CONTENTS
1. REGION OF ATTIKI ............................................................................... 7
1.1. Background Information .........................................................................7
1.1.1. Location and Population ..................................................................7
1.1.2. Waste Management Authority..........................................................9
1.2. Waste Generation and Composition .........................................................9
1.2.1. Waste Generation ...........................................................................9
1.2.2. Waste Composition .......................................................................11
1.3. BMW Diversion and Recycling Targets ...................................................13
1.4. Current MSW Management ...................................................................16
1.4.1. Collection .....................................................................................17
1.4.2. Transfer .......................................................................................17
1.4.3. Disposal .......................................................................................18
1.4.4. MSW Treatment............................................................................18
1.5. MSW Management Future Planning .......................................................23
1.6. Regional Operational Programme of Attiki..............................................25
1.7. Project Analysis....................................................................................25
1.7.1. General Information......................................................................26
1.7.2. Mechanical Treatment (Sorting) Plant – Mixed Wastes – West Attiki.27
1.7.3. MBT Plant – Mixed Waste – Biological Drying – West Attiki .............30
1.7.4. MBT Plants – Mixed Waste – Anaerobic Digestion – East Attiki........33
1.7.5. Composting Plants – Biowaste – Composting – East Attiki ...............37
1.7.6. MBT Plant – Biowaste – Composting – West Attiki...........................39
1.7.7. General design parameters and BMW diversion targets coverage .....41
1.7.8. Timetable .....................................................................................43
1.8. Critical overview...................................................................................43
2. REGION OF THESSALONIKI ................................................................45
2.1. Background Information .......................................................................45
2.1.1. Location and Population ................................................................45
2.1.2. Waste Management Authority........................................................45
2.2. Waste Generation and Composition .......................................................46
2.2.1. Waste Generation .........................................................................46
2.2.2. Waste Composition .......................................................................47
EIB Study: JESSICA instruments for SWM in Greece: FINAL Report - Part 2
3
2.3. BMW Diversion and Recycling Targets ...................................................49
2.4. Current MSW Management ...................................................................50
2.4.1. Collection .....................................................................................50
2.4.2. Transfer .......................................................................................50
2.4.3. Disposal .......................................................................................51
2.4.4. MSW Treatment............................................................................51
2.5. MSW Management Future Planning .......................................................52
2.6. Regional Operational Programme of Macedonia – Thrace........................54
2.7. Project Analysis....................................................................................55
2.7.1. MBT Plant – Mixed Waste – Mavrorachi ..........................................55
2.7.2. Timetable .....................................................................................57
2.8. MATURE SWM PROJECTS PROPOSED FOR JESSICA FUNDING ................57
3. APPENDICES .......................................................................................59

EIB Study: JESSICA instruments for SWM in Greece: FINAL Report - Part 2
4
TABLE OF TABLES
Table 1: Municipal Solid Waste Generation in Attiki (RSWMP, 2006) .......................9
Table 2: MSW composition over time in Attiki (ACMAR – NTUA, 2008) ..................11
Table 3: MSW composition and humidity in Attiki (ACMAR) ..................................13
Table 4: MBT Plant in Ano Liosia operation results in 2008 (ACMAR) ....................21
Table 5: Results of MRFs operation in Attiki (2008)..............................................22
Table 6: Planned Waste Treatment Facilities in Attiki ...........................................24
Table 7: Funding from structural funds for Solid Waste Management in Attiki ......25
Table 8: Recovery and Diversion Rates - MT Sorting............................................28
Table 9: Projected Annual Amounts of MT Sorting Plant in West Attiki (Fyli)..........29
Table 10: Projected Capital Costs of MT Sorting Plant in West Attiki (Fyli).............29
Table 11: Projected Process Costs - (Fixed) of MT Sorting Plant in West Attiki (Fyli)
.........................................................................................................................29
Table 12: Recovery and Diversion Rates – MBT (Biological Drying) in West Attiki
(Fyli)..................................................................................................................32
Table 13: Projected Annual Amounts of MBT (Biological Drying) in West Attiki (Fyli)
.........................................................................................................................32
Table 14: Projected Capital Costs of MBT (Biological Drying) in West Attiki (Fyli) ..33
Table 15: Projected Process Costs - (fixed) of MBT (Biological Drying) in West Attiki
(Fyli)..................................................................................................................33
Table 16: Recovery and Diversion Rates – each MBT (A.D.) in East Attiki .............36
Table 17: Projected Annual Amounts of each MBT (A.D.) in East Attiki .................36
Table 18: Projected Capital Costs of each MBT (A.D.) in East Attiki ......................36
Table 19: Projected Process Costs - (fixed) of each MBT (A.D.) in East Attiki ........37
Table 20: Projected Annual Amounts of each Composting plant in East Attiki........38
Table 21: Projected Capital Costs of each Composting plant in East Attiki .............38
Table 22: Projected Process Costs - (fixed) of each Composting plant in East Attiki
.........................................................................................................................39
Table 23: Projected Annual Amounts of Composting plant in West Attiki (Fyli) ......40
Table 24: Projected Capital Costs of Composting plant in West Attiki (Fyli) ...........40
Table 25: Projected Process Costs - (fixed) of Composting plant in West Attiki (Fyli)
.........................................................................................................................40
Table 26: Estimated population and municipalities served by MBTs under planning
in Attiki ..............................................................................................................41
EIB Study: JESSICA instruments for SWM in Greece: FINAL Report - Part 2
5
Table 27: BMW diversion targets coverage from waste processing facilities under
planning in Attiki.................................................................................................42
Table 28: Indicative timetable for planned projects in Attiki .................................43
Table 29: Municipal Solid Waste Generation in Prefecture of Thessaloniki (ALAPT
2008).................................................................................................................46
Table 30: MSW composition in Thessaloniki (ALART – AUT, 2007) .......................48
Table 31: Results of MRFs operation in Thessaloniki (2008) .................................52
Table 32: Funding from structural funds for Solid Waste Management in Central
Macedonia..........................................................................................................54
Table 33: Recovery and Diversion Rates - MBT Biological Drying in Mavrorachi .....55
Table 34: Projected Annual Amounts of MBT Biological Drying in Mavrorachi ........56
Table 35: Projected Capital Costs of MBT (Biological Drying) in Mavrorachi...........56
Table 36: Projected Process Costs - (fixed) of MBT (Biological Drying) in Mavrorachi
.........................................................................................................................57
Table 37: Indicative timetable for the MBT plant in Mavrorachi ............................57
Table 38: Matured Facilities for Waste Processing under planning in Attiki and
Thessaloniki .......................................................................................................58

EIB Study: JESSICA instruments for SWM in Greece: FINAL Report - Part 2
6
TABLE OF FIGURES
Figure 1: Region of Attiki and area of Athens........................................................8
Figure 2: Population distribution in metropolitan area of Athens.............................8
Figure 3: MSW Total Generation in Attiki from 2008-2028 assuming 3 different
scenarios (min, central and max).........................................................................10
Figure 4: MSW composition in Attiki in 2008 (ACMAR – NTUA, 2008) ...................12
Figure 5: Annual production of MSW in Greece ...................................................14
Figure 6: Geographical distribution of MSW production in Greece.........................14
Figure 7: Future quantities of BMW generation and disposal in Attiki (waste growth:
1.5% yearly) ......................................................................................................15
Figure 8: Location of central transfer station in Attiki Region ...............................17
Figure 9: Location and aerial photograph of MBT Plant in Ano Liosia (source: Google
Earth) ................................................................................................................20
Figure 10: Process Block Diagram of MBT Plant in Ano Liosia (Adopted by ACMAR)
.........................................................................................................................21
Figure 11: Locations of the existing facilities in Attiki...........................................22
Figure 12: Locations of the existing and under planning plants in Attiki ................24
Figure 13: Indicative process diagram of the Mechanical Treatment (Sorting) Plant
.........................................................................................................................28
Figure 14: Indicative process diagram of the MBT (Biological Drying) plant in West
Attiki (Fyli). ........................................................................................................31
Figure 15: Indicative mass balance of each Composting plant in East Attiki ..........38
Figure 16: Prefecture of Thessaloniki .................................................................45
Figure 17: MSW Total Generation in Thessaloniki from 2008-2028 assuming 3
different scenarios (min, central and max) ...........................................................47
Figure 18: MSW composition in Thessaloniki in 2007 (ALAPT , 2007) ...................48
Figure 19: Future quantities of BMW generation and disposal in Thessaloniki (waste
growth: 1.5% yearly)..........................................................................................49
Figure 20: Locations of existing transfer stations in Prefecture of Thessaloniki......51
Figure 21: Locations of the existing and under planning facilities in Thessaloniki ..54
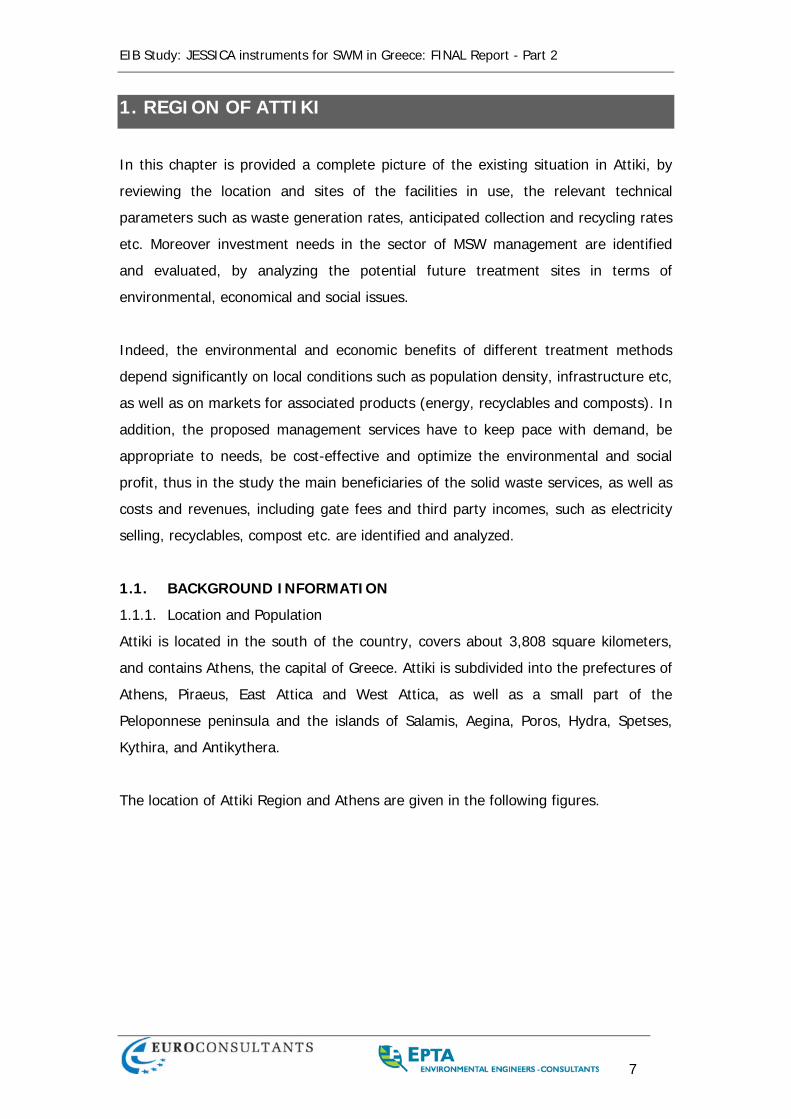
EIB Study: JESSICA instruments for SWM in Greece: FINAL Report - Part 2
7
1. REGION OF ATTIKI
In this chapter is provided a complete picture of the existing situation in Attiki, by
reviewing the location and sites of the facilities in use, the relevant technical
parameters such as waste generation rates, anticipated collection and recycling rates
etc. Moreover investment needs in the sector of MSW management are identified
and evaluated, by analyzing the potential future treatment sites in terms of
environmental, economical and social issues.
Indeed, the environmental and economic benefits of different treatment methods
depend significantly on local conditions such as population density, infrastructure etc,
as well as on markets for associated products (energy, recyclables and composts). In
addition, the proposed management services have to keep pace with demand, be
appropriate to needs, be cost-effective and optimize the environmental and social
profit, thus in the study the main beneficiaries of the solid waste services, as well as
costs and revenues, including gate fees and third party incomes, such as electricity
selling, recyclables, compost etc. are identified and analyzed.
1.1. BACKGROUND INFORMATION
1.1.1. Location and Population
Attiki is located in the south of the country, covers about 3,808 square kilometers,
and contains Athens, the capital of Greece. Attiki is subdivided into the prefectures of
Athens, Piraeus, East Attica and West Attica, as well as a small part of the
Peloponnese peninsula and the islands of Salamis, Aegina, Poros, Hydra, Spetses,
Kythira, and Antikythera.
The location of Attiki Region and Athens are given in the following figures.
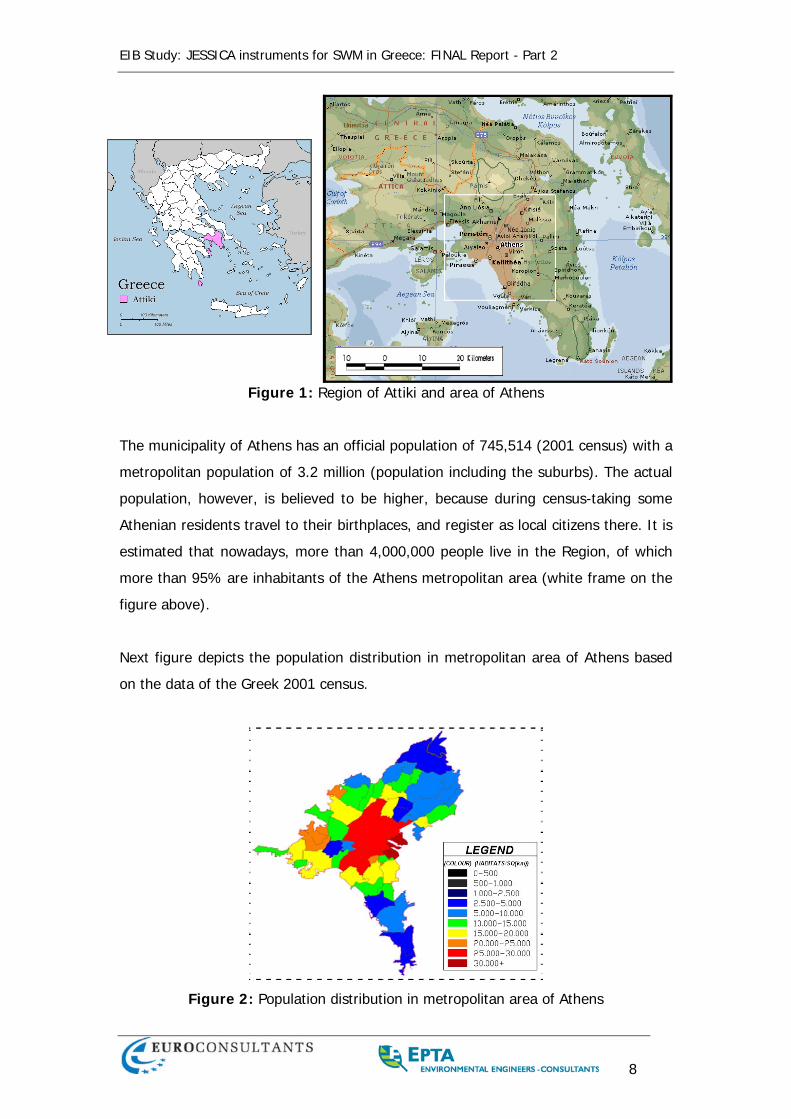
EIB Study: JESSICA instruments for SWM in Greece: FINAL Report - Part 2
8
Figure 1: Region of Attiki and area of Athens
The municipality of Athens has an official population of 745,514 (2001 census) with a
metropolitan population of 3.2 million (population including the suburbs). The actual
population, however, is believed to be higher, because during census-taking some
Athenian residents travel to their birthplaces, and register as local citizens there. It is
estimated that nowadays, more than 4,000,000 people live in the Region, of which
more than 95% are inhabitants of the Athens metropolitan area (white frame on the
figure above).
Next figure depicts the population distribution in metropolitan area of Athens based
on the data of the Greek 2001 census.
Figure 2: Population distribution in metropolitan area of Athens
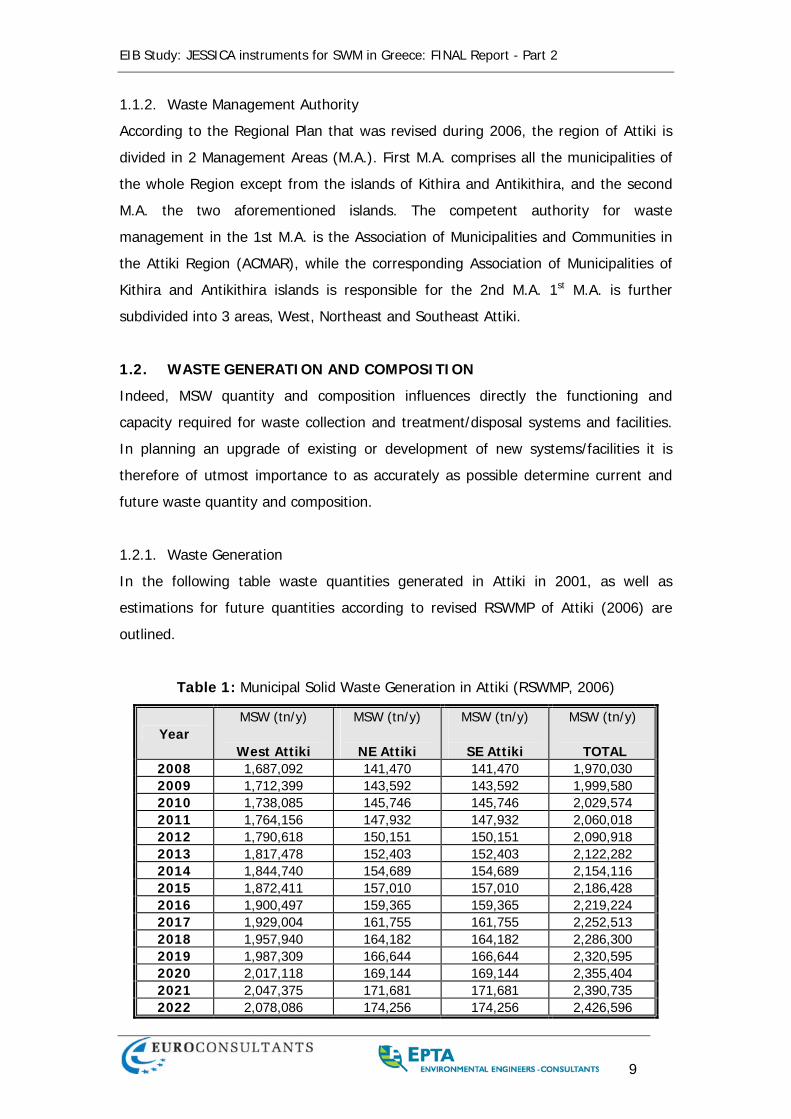
EIB Study: JESSICA instruments for SWM in Greece: FINAL Report - Part 2
9
1.1.2. Waste Management Authority
According to the Regional Plan that was revised during 2006, the region of Attiki is
divided in 2 Management Areas (M.A.). First M.A. comprises all the municipalities of
the whole Region except from the islands of Kithira and Antikithira, and the second
M.A. the two aforementioned islands. The competent authority for waste
management in the 1st M.A. is the Association of Municipalities and Communities in
the Attiki Region (ACMAR), while the corresponding Association of Municipalities of
Kithira and Antikithira islands is responsible for the 2nd M.A. 1st M.A. is further
subdivided into 3 areas, West, Northeast and Southeast Attiki.
1.2. WASTE GENERATION AND COMPOSITION
Indeed, MSW quantity and composition influences directly the functioning and
capacity required for waste collection and treatment/disposal systems and facilities.
In planning an upgrade of existing or development of new systems/facilities it is
therefore of utmost importance to as accurately as possible determine current and
future waste quantity and composition.
1.2.1. Waste Generation
In the following table waste quantities generated in Attiki in 2001, as well as
estimations for future quantities according to revised RSWMP of Attiki (2006) are
outlined.
Table 1: Municipal Solid Waste Generation in Attiki (RSWMP, 2006)
Year MSW (tn/y)
West Attiki
MSW (tn/y)
NE Attiki
MSW (tn/y)
SE Attiki
MSW (tn/y)
TOTAL 2008 1,687,092 141,470 141,470 1,970,030 2009 1,712,399 143,592 143,592 1,999,580 2010 1,738,085 145,746 145,746 2,029,574 2011 1,764,156 147,932 147,932 2,060,018 2012 1,790,618 150,151 150,151 2,090,918 2013 1,817,478 152,403 152,403 2,122,282 2014 1,844,740 154,689 154,689 2,154,116 2015 1,872,411 157,010 157,010 2,186,428 2016 1,900,497 159,365 159,365 2,219,224 2017 1,929,004 161,755 161,755 2,252,513 2018 1,957,940 164,182 164,182 2,286,300 2019 1,987,309 166,644 166,644 2,320,595 2020 2,017,118 169,144 169,144 2,355,404 2021 2,047,375 171,681 171,681 2,390,735 2022 2,078,086 174,256 174,256 2,426,596
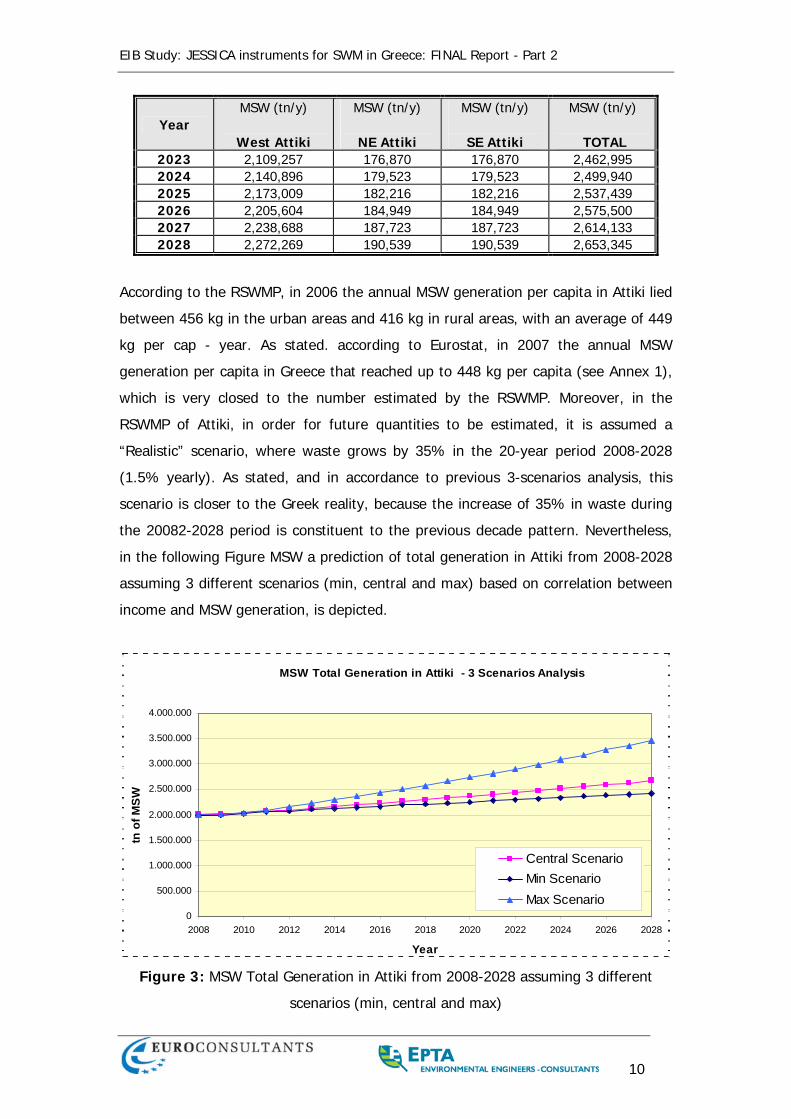
EIB Study: JESSICA instruments for SWM in Greece: FINAL Report - Part 2
10
Year MSW (tn/y)
West Attiki
MSW (tn/y)
NE Attiki
MSW (tn/y)
SE Attiki
MSW (tn/y)
TOTAL 2023 2,109,257 176,870 176,870 2,462,995 2024 2,140,896 179,523 179,523 2,499,940 2025 2,173,009 182,216 182,216 2,537,439 2026 2,205,604 184,949 184,949 2,575,500 2027 2,238,688 187,723 187,723 2,614,133 2028 2,272,269 190,539 190,539 2,653,345
According to the RSWMP, in 2006 the annual MSW generation per capita in Attiki lied
between 456 kg in the urban areas and 416 kg in rural areas, with an average of 449
kg per cap - year. As stated. according to Eurostat, in 2007 the annual MSW
generation per capita in Greece that reached up to 448 kg per capita (see Annex 1),
which is very closed to the number estimated by the RSWMP. Moreover, in the
RSWMP of Attiki, in order for future quantities to be estimated, it is assumed a
“Realistic” scenario, where waste grows by 35% in the 20-year period 2008-2028
(1.5% yearly). As stated, and in accordance to previous 3-scenarios analysis, this
scenario is closer to the Greek reality, because the increase of 35% in waste during
the 20082-2028 period is constituent to the previous decade pattern. Nevertheless,
in the following Figure MSW a prediction of total generation in Attiki from 2008-2028
assuming 3 different scenarios (min, central and max) based on correlation between
income and MSW generation, is depicted.
MSW Total Generation in Attiki - 3 Scenarios Analysis
0
500.000
1.000.000
1.500.000
2.000.000
2.500.000
3.000.000
3.500.000
4.000.000
2008 2010 2012 2014 2016 2018 2020 2022 2024 2026 2028
Year
tn o
f MS
W
Central ScenarioMin ScenarioMax Scenario
Figure 3: MSW Total Generation in Attiki from 2008-2028 assuming 3 different
scenarios (min, central and max)
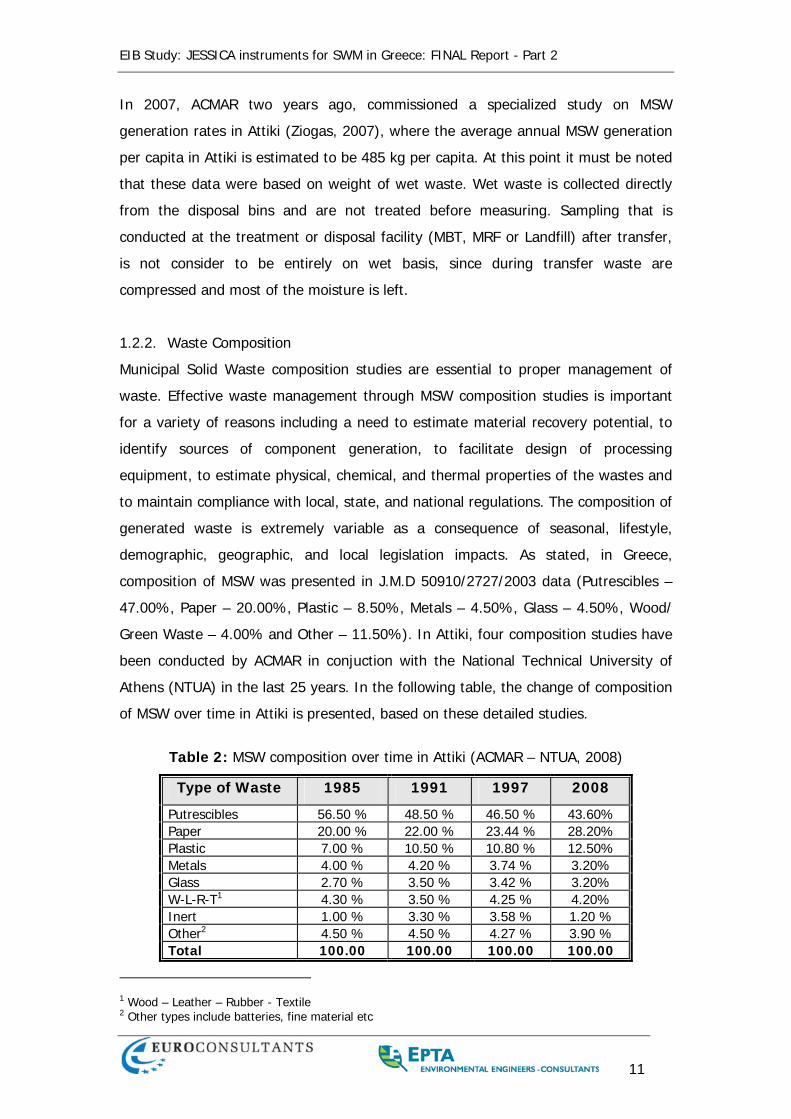
EIB Study: JESSICA instruments for SWM in Greece: FINAL Report - Part 2
11
In 2007, ACMAR two years ago, commissioned a specialized study on MSW
generation rates in Attiki (Ziogas, 2007), where the average annual MSW generation
per capita in Attiki is estimated to be 485 kg per capita. At this point it must be noted
that these data were based on weight of wet waste. Wet waste is collected directly
from the disposal bins and are not treated before measuring. Sampling that is
conducted at the treatment or disposal facility (MBT, MRF or Landfill) after transfer,
is not consider to be entirely on wet basis, since during transfer waste are
compressed and most of the moisture is left.
1.2.2. Waste Composition
Municipal Solid Waste composition studies are essential to proper management of
waste. Effective waste management through MSW composition studies is important
for a variety of reasons including a need to estimate material recovery potential, to
identify sources of component generation, to facilitate design of processing
equipment, to estimate physical, chemical, and thermal properties of the wastes and
to maintain compliance with local, state, and national regulations. The composition of
generated waste is extremely variable as a consequence of seasonal, lifestyle,
demographic, geographic, and local legislation impacts. As stated, in Greece,
composition of MSW was presented in J.M.D 50910/2727/2003 data (Putrescibles –
47.00%, Paper – 20.00%, Plastic – 8.50%, Metals – 4.50%, Glass – 4.50%, Wood/
Green Waste – 4.00% and Other – 11.50%). In Attiki, four composition studies have
been conducted by ACMAR in conjuction with the National Technical University of
Athens (NTUA) in the last 25 years. In the following table, the change of composition
of MSW over time in Attiki is presented, based on these detailed studies.
Table 2: MSW composition over time in Attiki (ACMAR – NTUA, 2008)
Type of Waste 1985 1991 1997 2008
Putrescibles 56.50 % 48.50 % 46.50 % 43.60% Paper 20.00 % 22.00 % 23.44 % 28.20% Plastic 7.00 % 10.50 % 10.80 % 12.50% Metals 4.00 % 4.20 % 3.74 % 3.20% Glass 2.70 % 3.50 % 3.42 % 3.20% W-L-R-T1 4.30 % 3.50 % 4.25 % 4.20% Inert 1.00 % 3.30 % 3.58 % 1.20 % Other2 4.50 % 4.50 % 4.27 % 3.90 % Total 100.00 100.00 100.00 100.00
1 Wood – Leather – Rubber - Textile 2 Other types include batteries, fine material etc
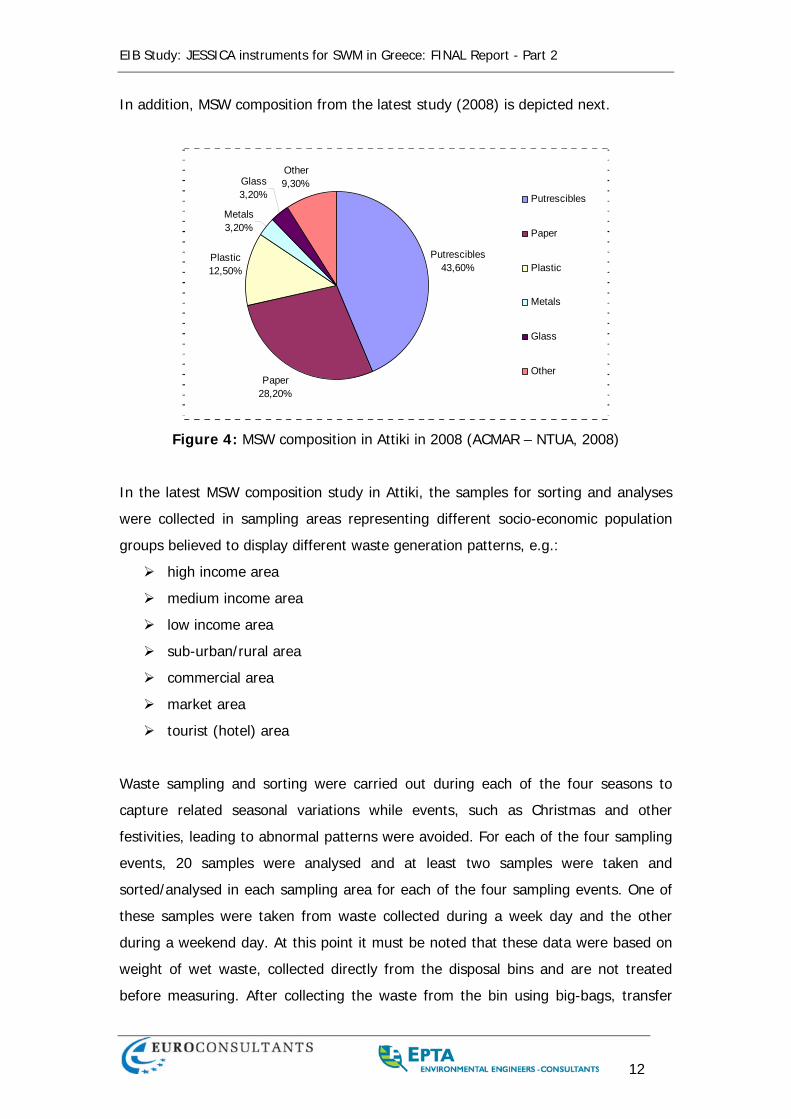
EIB Study: JESSICA instruments for SWM in Greece: FINAL Report - Part 2
12
In addition, MSW composition from the latest study (2008) is depicted next.
Putrescibles43,60%
Paper28,20%
Plastic12,50%
Metals3,20%
Glass3,20%
Other9,30%
Putrescibles
Paper
Plastic
Metals
Glass
Other
Figure 4: MSW composition in Attiki in 2008 (ACMAR – NTUA, 2008)
In the latest MSW composition study in Attiki, the samples for sorting and analyses
were collected in sampling areas representing different socio-economic population
groups believed to display different waste generation patterns, e.g.:
high income area
medium income area
low income area
sub-urban/rural area
commercial area
market area
tourist (hotel) area
Waste sampling and sorting were carried out during each of the four seasons to
capture related seasonal variations while events, such as Christmas and other
festivities, leading to abnormal patterns were avoided. For each of the four sampling
events, 20 samples were analysed and at least two samples were taken and
sorted/analysed in each sampling area for each of the four sampling events. One of
these samples were taken from waste collected during a week day and the other
during a weekend day. At this point it must be noted that these data were based on
weight of wet waste, collected directly from the disposal bins and are not treated
before measuring. After collecting the waste from the bin using big-bags, transfer
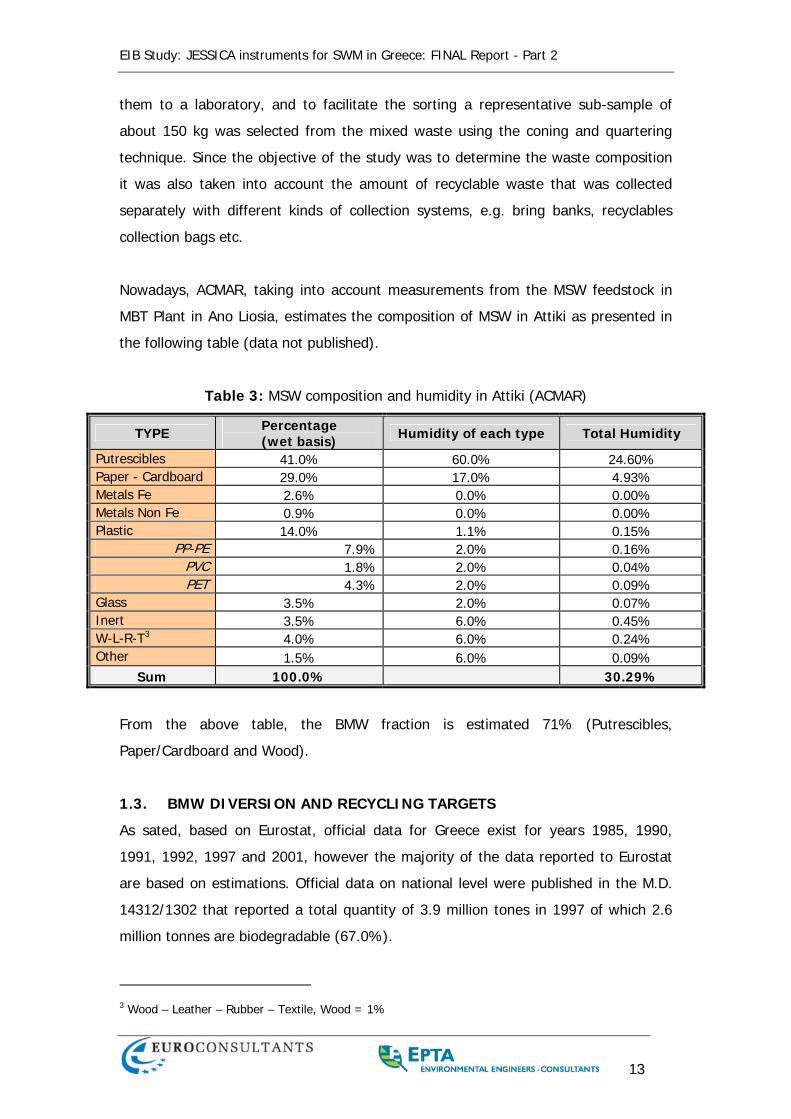
EIB Study: JESSICA instruments for SWM in Greece: FINAL Report - Part 2
13
them to a laboratory, and to facilitate the sorting a representative sub-sample of
about 150 kg was selected from the mixed waste using the coning and quartering
technique. Since the objective of the study was to determine the waste composition
it was also taken into account the amount of recyclable waste that was collected
separately with different kinds of collection systems, e.g. bring banks, recyclables
collection bags etc.
Nowadays, ACMAR, taking into account measurements from the MSW feedstock in
MBT Plant in Ano Liosia, estimates the composition of MSW in Attiki as presented in
the following table (data not published).
Table 3: MSW composition and humidity in Attiki (ACMAR)
TYPE Percentage (wet basis) Humidity of each type Total Humidity
Putrescibles 41.0% 60.0% 24.60% Paper - Cardboard 29.0% 17.0% 4.93% Metals Fe 2.6% 0.0% 0.00% Metals Non Fe 0.9% 0.0% 0.00% Plastic 14.0% 1.1% 0.15%
PP-PE 7.9% 2.0% 0.16% PVC 1.8% 2.0% 0.04% PET 4.3% 2.0% 0.09%
Glass 3.5% 2.0% 0.07% Inert 3.5% 6.0% 0.45% W-L-R-T3 4.0% 6.0% 0.24% Other 1.5% 6.0% 0.09%
Sum 100.0% 30.29%
From the above table, the BMW fraction is estimated 71% (Putrescibles,
Paper/Cardboard and Wood).
1.3. BMW DIVERSION AND RECYCLING TARGETS
As sated, based on Eurostat, official data for Greece exist for years 1985, 1990,
1991, 1992, 1997 and 2001, however the majority of the data reported to Eurostat
are based on estimations. Official data on national level were published in the M.D.
14312/1302 that reported a total quantity of 3.9 million tones in 1997 of which 2.6
million tonnes are biodegradable (67.0%).
3 Wood – Leather – Rubber – Textile, Wood = 1%
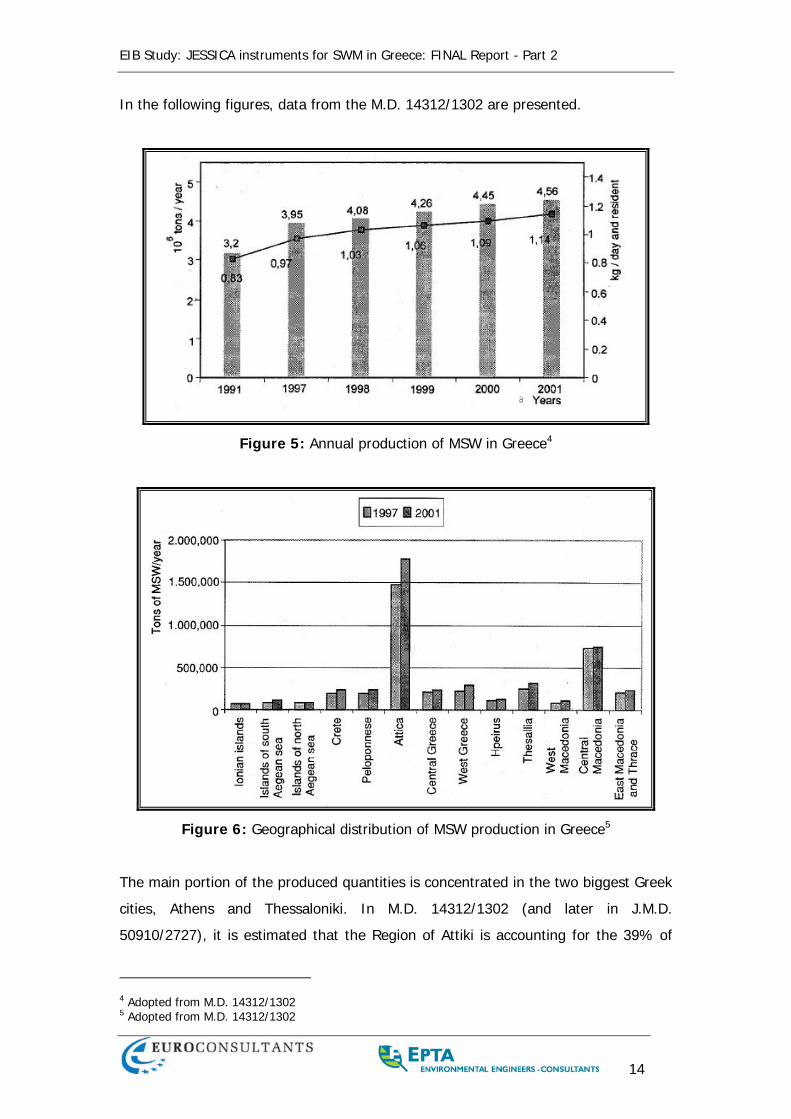
EIB Study: JESSICA instruments for SWM in Greece: FINAL Report - Part 2
14
In the following figures, data from the M.D. 14312/1302 are presented.
Figure 5: Annual production of MSW in Greece4
Figure 6: Geographical distribution of MSW production in Greece5
The main portion of the produced quantities is concentrated in the two biggest Greek
cities, Athens and Thessaloniki. In M.D. 14312/1302 (and later in J.M.D.
50910/2727), it is estimated that the Region of Attiki is accounting for the 39% of
4 Adopted from M.D. 14312/1302 5 Adopted from M.D. 14312/1302
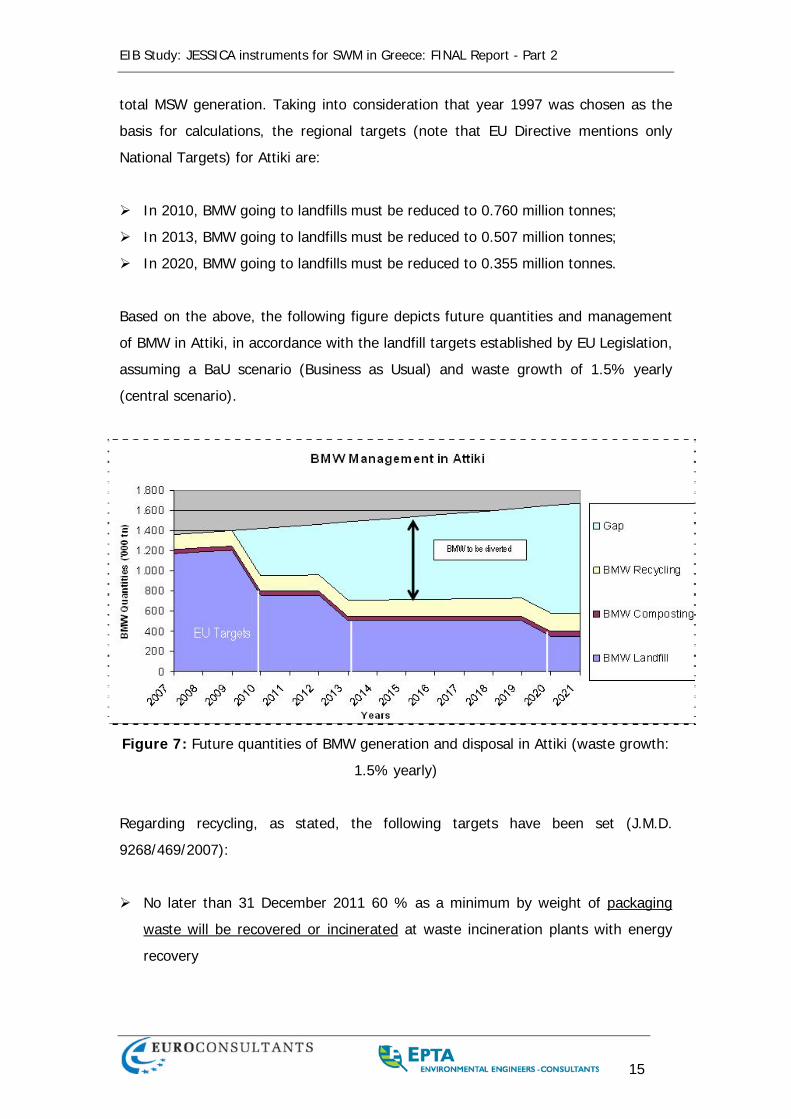
EIB Study: JESSICA instruments for SWM in Greece: FINAL Report - Part 2
15
total MSW generation. Taking into consideration that year 1997 was chosen as the
basis for calculations, the regional targets (note that EU Directive mentions only
National Targets) for Attiki are:
In 2010, BMW going to landfills must be reduced to 0.760 million tonnes;
In 2013, BMW going to landfills must be reduced to 0.507 million tonnes;
In 2020, BMW going to landfills must be reduced to 0.355 million tonnes.
Based on the above, the following figure depicts future quantities and management
of BMW in Attiki, in accordance with the landfill targets established by EU Legislation,
assuming a BaU scenario (Business as Usual) and waste growth of 1.5% yearly
(central scenario).
Figure 7: Future quantities of BMW generation and disposal in Attiki (waste growth:
1.5% yearly)
Regarding recycling, as stated, the following targets have been set (J.M.D.
9268/469/2007):
No later than 31 December 2011 60 % as a minimum by weight of packaging
waste will be recovered or incinerated at waste incineration plants with energy
recovery
EIB Study: JESSICA instruments for SWM in Greece: FINAL Report - Part 2
16
No later than 31 December 2011 the following minimum recycling targets for
materials contained in packaging waste will be attained:
(i) 60 % by weight for glass;
(ii) 60 % by weight for paper and board;
(iii) 50 % by weight for metals;
(iv) 22,5 % by weight for plastics, counting exclusively material that is recycled
back into plastics;
(v) 15 % by weight for wood.
As for MSW, according to HERRCO, around 160,000 tones of total packaging waste &
print paper were recovered by MSW in Attiki in 2009. Taking into account that
recyclable materials contained in the MSW reaches an average of 50%, and the MSW
generation in 2009 in Attiki was around 2,000,000, it is estimated that recycling rate
of MSW reached an average of 1,000,000160,000 = 16%.
However, HERRCO mentions that the total amount of packaging materials produced
(from municipal and private waste) in 2008, is estimated around 1,000,000 tonnes,
out of which 504,000 tonnes (50%) where recycled. Apart form packaging waste,
estimations about the quantities of other waste streams (mainly private) kin this
category are highly uncertain as no sufficient quantity and quality data are available.
Nevertheless, all targets set by EU Directives are percentages of recyclable waste
generation, thus since all MSW treatment plants under planning will have very strict
recyclable sorting requirements, will be more convenient for the aforementioned
targets to be met.
1.4. CURRENT MSW MANAGEMENT
Generally, waste streams begin at the point of generation, flow through collection
and transportation, separation for resource recovery, treatment for volume
reduction, detoxification, stabilisation, recycling and/or energy recovery and
terminate at Sanitary Landfills. It is worth to be mentioned that recycling is
considered as a preferable process in comparison with incineration or mechanical
treatment, because higher quality products and therefore higher resources savings
can be achieved. However, recycling usually needs a very well organized and
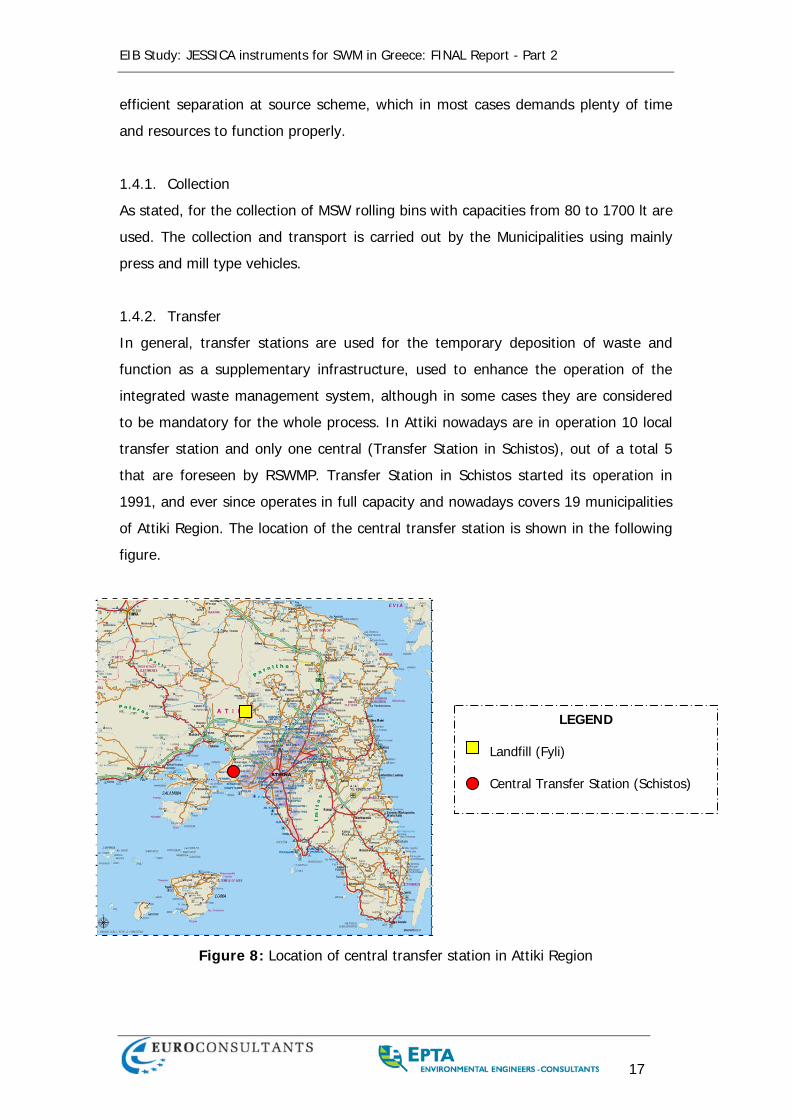
EIB Study: JESSICA instruments for SWM in Greece: FINAL Report - Part 2
17
efficient separation at source scheme, which in most cases demands plenty of time
and resources to function properly.
1.4.1. Collection
As stated, for the collection of MSW rolling bins with capacities from 80 to 1700 lt are
used. The collection and transport is carried out by the Municipalities using mainly
press and mill type vehicles.
1.4.2. Transfer
In general, transfer stations are used for the temporary deposition of waste and
function as a supplementary infrastructure, used to enhance the operation of the
integrated waste management system, although in some cases they are considered
to be mandatory for the whole process. In Attiki nowadays are in operation 10 local
transfer station and only one central (Transfer Station in Schistos), out of a total 5
that are foreseen by RSWMP. Transfer Station in Schistos started its operation in
1991, and ever since operates in full capacity and nowadays covers 19 municipalities
of Attiki Region. The location of the central transfer station is shown in the following
figure.
Figure 8: Location of central transfer station in Attiki Region
LEGEND
Landfill (Fyli)
Central Transfer Station (Schistos)
EIB Study: JESSICA instruments for SWM in Greece: FINAL Report - Part 2
18
1.4.3. Disposal
In the 1st M.A., nowadays there is only one landfill operating at the area of Fyli (an
extension is under construction), where daily are being disposed more than 6,000 tn
of Municipal Solid Waste, including commercial waste. Additionally, it is estimated
that more than 10 uncontrolled landfill sites are still operating only in eastern part of
Attiki. In the 2nd M.A., 2 Sanitary landfills are under construction for the disposal of
Municipal Solid Waste, one for the island of Kithira and one for the island of
Antikithira.
1.4.4. MSW Treatment
Mechanical and Biological Treatment Plants
In Attiki, only one Mechanical and Biological Treatment (MBT) plant in Ano Liosia has
been constructed, which is one of the biggest MBT plants in Europe. The plant
started in 1997, was put in operation initially in 2004 and cost 64 mio Euros. The
MBT plant faced several operational problems and it started working at full capacity
of 1,200 tn/day in 2007. During 2009 it closed down due to administrator difficulties,
however it is expected to start operation again in early 2010. Generally, it treats
mixed municipal waste, produces Refuse Delivered Fuel (RDF), good quality compost
and its annual capacity can reach up to 400,000 tonnes.
More analytically, the Ano Liosia MBT plant comprises of a waste mechanical
separation unit and a composting unit. The plant receives waste from the Attiki
Region and its capacity is:
1,200 tonnes of mixed domestic waste/day
300 tonnes/day of sewage sludge generated from the Wastewater Treatment
Plant of the Attica Prefecture
130 tonnes/day of green waste
The products from the operation of the plant are refused derived fuel (RDF), ferrous
metals, aluminium and compost. The mechanical sorting unit consists of the
following components:
Three waste reception compartments.
The main compartment of mechanical separation
EIB Study: JESSICA instruments for SWM in Greece: FINAL Report - Part 2
19
Three lines of mechanical sorting process. Each line is fed with mixed waste from
the respective receptor
Line for the dry fraction of waste
One Refuse Derived Fuel (RDF) line
One Residuals Line
One Aluminium Line
One homogenization line
Furthermore, the mechanical sorting unit is equipped with anti-pollution system
which includes cyclones, air ducts and air ventilators.
The composting unit is based on tunnel composting technology and receives the
organic waste that is separated through the mechanical sorting unit, sludge and
green waste. The compost from the tunnels is fed to the refinery unit through the
conveyor belts. The compost is received at the reception unit, where is agitated and
grinded. Two rotating drum screens are used for the separation of three different
streams of output material. The finest material is led through a conveyor belt to the
waste residuals. The coarser material, which is mainly comprised of material that has
not been fully composted is transferred to a density separation table. The middle
sized stream is led to another density separation table. The screening unit has in
total 3 density separation tables. Finally, the screening unit has a vibrating screen
that produces two streams, the coarse stream is directed to the waste residues while
the finer one is led for maturation after magnetic separation.
The maturation unit consists of an open-air system and a warehouse where the
process takes place as follows: In the open-air system, the screened fresh compost is
placed into windrows by using loaders. The maximum height of the windrows is 3.5
m. The residence time of the compost in the windrows is 1 month. 85% of the
produced fresh compost is get matured in this facility. The other 15% is subjected to
maturation inside the warehouse where the compost is placed in windrows. The
warehouse protects the compost from the outside environmental conditions. The
windrows have a maximum height of 3.5 m. The residence time is 1 month. Then,
the mature compost is led to the packaging unit.
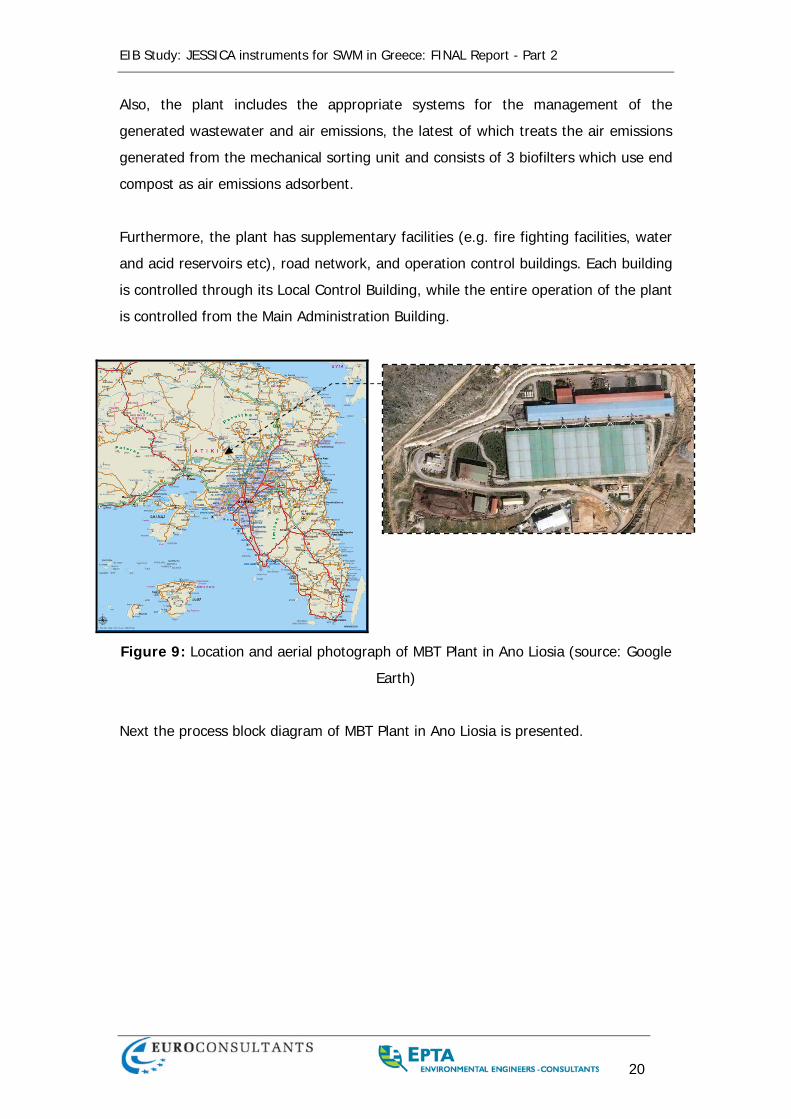
EIB Study: JESSICA instruments for SWM in Greece: FINAL Report - Part 2
20
Also, the plant includes the appropriate systems for the management of the
generated wastewater and air emissions, the latest of which treats the air emissions
generated from the mechanical sorting unit and consists of 3 biofilters which use end
compost as air emissions adsorbent.
Furthermore, the plant has supplementary facilities (e.g. fire fighting facilities, water
and acid reservoirs etc), road network, and operation control buildings. Each building
is controlled through its Local Control Building, while the entire operation of the plant
is controlled from the Main Administration Building.
Figure 9: Location and aerial photograph of MBT Plant in Ano Liosia (source: Google
Earth)
Next the process block diagram of MBT Plant in Ano Liosia is presented.
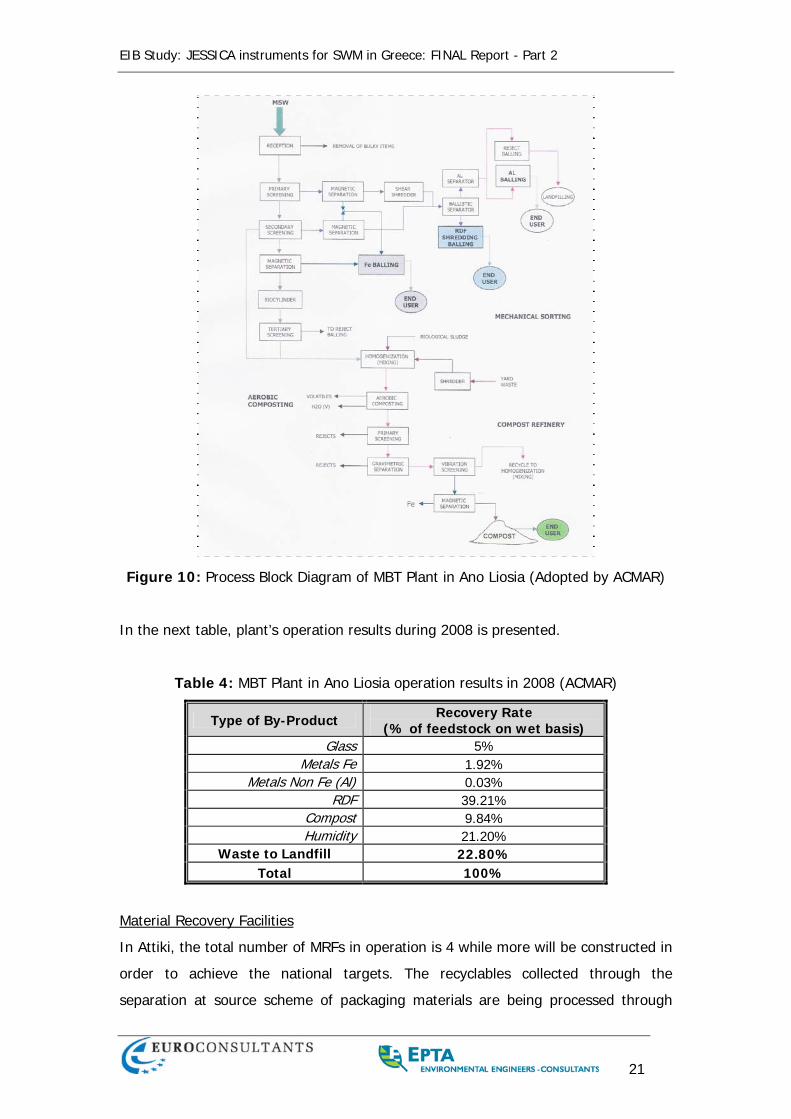
EIB Study: JESSICA instruments for SWM in Greece: FINAL Report - Part 2
21
Figure 10: Process Block Diagram of MBT Plant in Ano Liosia (Adopted by ACMAR)
In the next table, plant’s operation results during 2008 is presented.
Table 4: MBT Plant in Ano Liosia operation results in 2008 (ACMAR)
Type of By-Product Recovery Rate (% of feedstock on wet basis)
Glass 5% Metals Fe 1.92%
Metals Non Fe (Al) 0.03% RDF 39.21%
Compost 9.84% Humidity 21.20%
Waste to Landfill 22.80% Total 100%
Material Recovery Facilities
In Attiki, the total number of MRFs in operation is 4 while more will be constructed in
order to achieve the national targets. The recyclables collected through the
separation at source scheme of packaging materials are being processed through
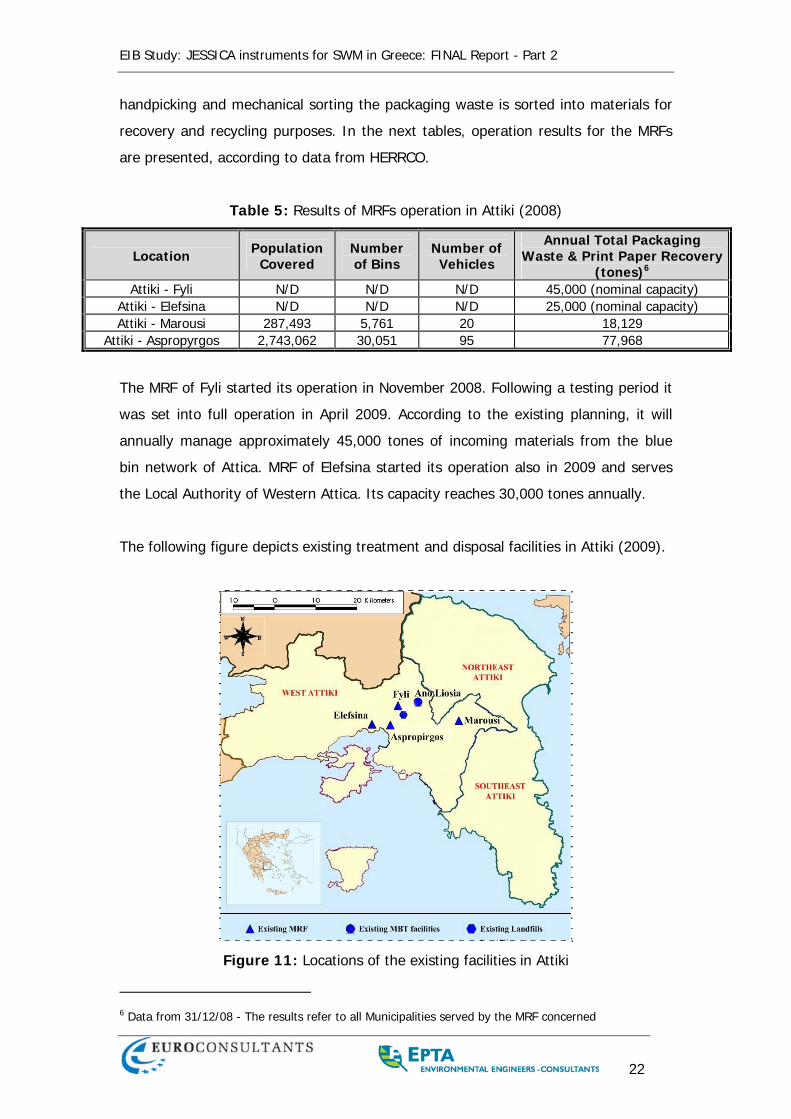
EIB Study: JESSICA instruments for SWM in Greece: FINAL Report - Part 2
22
handpicking and mechanical sorting the packaging waste is sorted into materials for
recovery and recycling purposes. In the next tables, operation results for the MRFs
are presented, according to data from HERRCO.
Table 5: Results of MRFs operation in Attiki (2008)
Location Population Covered
Number of Bins
Number of Vehicles
Annual Total Packaging Waste & Print Paper Recovery
(tones)6 Attiki - Fyli N/D N/D N/D 45,000 (nominal capacity)
Attiki - Elefsina N/D N/D N/D 25,000 (nominal capacity) Attiki - Marousi 287,493 5,761 20 18,129
Attiki - Aspropyrgos 2,743,062 30,051 95 77,968
The MRF of Fyli started its operation in November 2008. Following a testing period it
was set into full operation in April 2009. According to the existing planning, it will
annually manage approximately 45,000 tones of incoming materials from the blue
bin network of Attica. MRF of Elefsina started its operation also in 2009 and serves
the Local Authority of Western Attica. Its capacity reaches 30,000 tones annually.
The following figure depicts existing treatment and disposal facilities in Attiki (2009).
Figure 11: Locations of the existing facilities in Attiki
6 Data from 31/12/08 - The results refer to all Municipalities served by the MRF concerned
EIB Study: JESSICA instruments for SWM in Greece: FINAL Report - Part 2
23
1.5. MSW MANAGEMENT FUTURE PLANNING
According to the Regional Plans several treatment units are foreseen for the next
years in Attiki, in order to achieve the quantified targets for diversion of
biodegradable waste shown on the above-mentioned figure. ACMAR has recently
commissioned a study in order to evaluate the most appropriate technology for the
treatment of the amounts of MSW that are still being disposed directly to Fyli Landfill.
According to the results of the aforementioned study, the construction of the
following waste treatment units has been proposed:
West Attiki
A MBT plant (biological drying) in Fyli, with annual capacity of 700,000 tones per
year and the ability to treat mixed waste and produce S.R.F. (budget
153,510,000 €).
A Mechanical Treatment plant with annual capacity of 400,000 tones for the
treatment of mixed solid waste in Fyli (84,430,500 €)
A Biological Treatment plant (composting) for separated at source organic waste
(biowaste) in Fyli, with annual capacity of 80,000 tones per year (budget
39.329.262 €).
Northeast Attiki
One Landfill in the area of Grammatiko, which is under construction, with annual
capacity of 125,000 tn per year.
A MBT Plant (anaerobic digestion) with annual capacity of 127,500 tn/year for
the treatment of mixed solid waste in Grammatiko (budget 89,083,400 €)
A Biological Treatment plant (composting) for separated at source organic waste
(biowaste) in Grammatiko with annual capacity of 40,000 tones per year (budget
26,403,720 €).
Southeast Attiki
One Landfill in the area of Keratea, with annual capacity of 125,000 tn per year.
A MBT Plant (anaerobic digestion) with annual capacity of 127,500 tn/year for
the treatment of mixed solid waste in Keratea (budget 89,083,400 €)
A Biological Treatment plant (composting) for separated at source organic waste
(biowaste) in Keratea with annual capacity of 40,000 tones per year (budget
26,403,720 €).
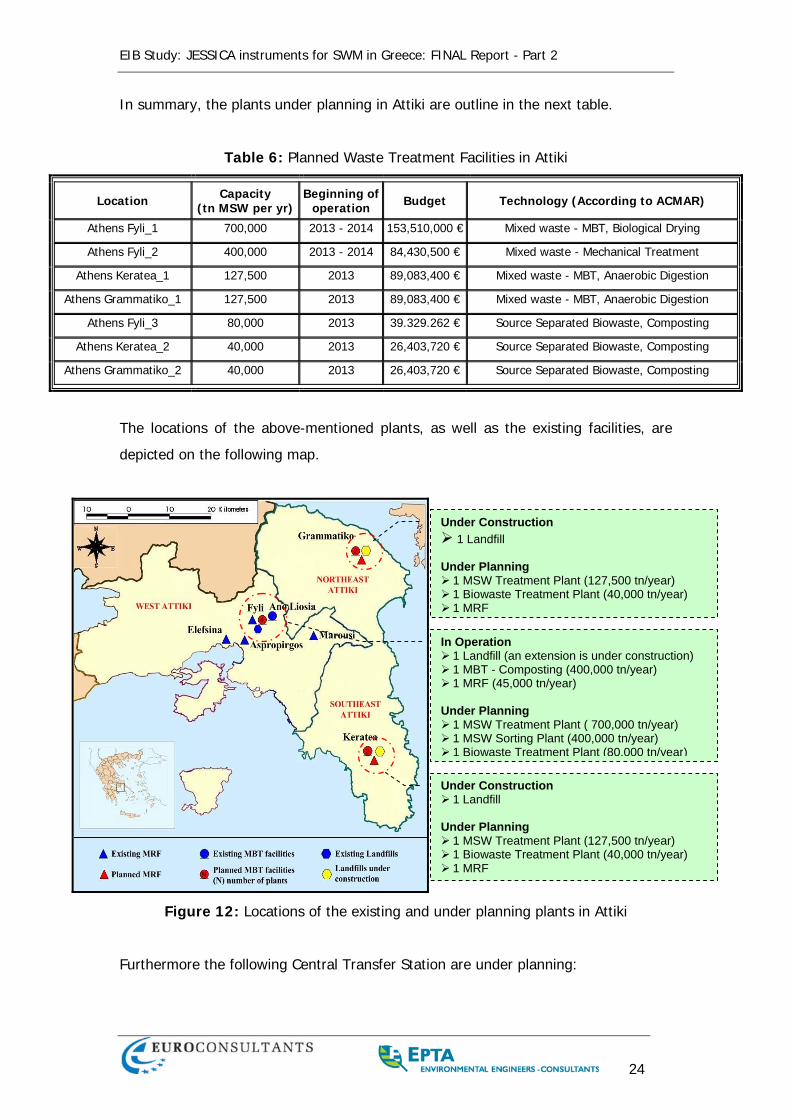
EIB Study: JESSICA instruments for SWM in Greece: FINAL Report - Part 2
24
In summary, the plants under planning in Attiki are outline in the next table.
Table 6: Planned Waste Treatment Facilities in Attiki
Location Capacity (tn MSW per yr)
Beginning of operation Budget Technology (According to ACMAR)
Athens Fyli_1 700,000 2013 - 2014 153,510,000 € Mixed waste - MBT, Biological Drying
Athens Fyli_2 400,000 2013 - 2014 84,430,500 € Mixed waste - Mechanical Treatment
Athens Keratea_1 127,500 2013 89,083,400 € Mixed waste - MBT, Anaerobic Digestion
Athens Grammatiko_1 127,500 2013 89,083,400 € Mixed waste - MBT, Anaerobic Digestion
Athens Fyli_3 80,000 2013 39.329.262 € Source Separated Biowaste, Composting
Athens Keratea_2 40,000 2013 26,403,720 € Source Separated Biowaste, Composting
Athens Grammatiko_2 40,000 2013 26,403,720 € Source Separated Biowaste, Composting
The locations of the above-mentioned plants, as well as the existing facilities, are
depicted on the following map.
Figure 12: Locations of the existing and under planning plants in Attiki
Furthermore the following Central Transfer Station are under planning:
Under Construction 1 Landfill
Under Planning
1 MSW Treatment Plant (127,500 tn/year) 1 Biowaste Treatment Plant (40,000 tn/year) 1 MRF
In Operation 1 Landfill (an extension is under construction) 1 MBT - Composting (400,000 tn/year) 1 MRF (45,000 tn/year)
Under Planning
1 MSW Treatment Plant ( 700,000 tn/year) 1 MSW Sorting Plant (400,000 tn/year) 1 Biowaste Treatment Plant (80,000 tn/year)
Under Construction 1 Landfill
Under Planning
1 MSW Treatment Plant (127,500 tn/year) 1 Biowaste Treatment Plant (40,000 tn/year) 1 MRF
EIB Study: JESSICA instruments for SWM in Greece: FINAL Report - Part 2
25
Transfer Station in Eleonas (Athens).
The construction of this stationit is expected to start in 2010, and upon
completion will cover Municipality of Athens and 5 neighbouring
municipalities.
Transfer Station in Southwest Attiki (site under examination).
Transfer Station in Northwest Attiki (site under examination).
Transfer Station in Central Attiki (site under examination).
1.6. REGIONAL OPERATIONAL PROGRAMME OF ATTIKI
The Attiki Regional Operational Programme 2007-2013 consists of 5 priority axes and
MSW management is included in Axis 2, “Sustainable Development and Improvement
of the Quality of Life” (thematic priority 44 - “MSW and Industrial Waste
Management”). This is funded only by ERDF, and the allocated EU fund is
41.000.000 €. The strategic objective of the ROP is targeted towards the treatment
of 75% of generated MSW in the Region until 2013 (baseline percentage is 25% in
2006). According to the ROP, it is estimated that the remaining percentage will be
covered from the Cohesion Fund. The following table summarizes the funding from
structural funds (OPESD - Cohesion Fund and ROPs - ERDF) for solid waste
management in Attiki.
Table 7: Funding from structural funds for Solid Waste Management in Attiki
S.O.P. «Environment & Sustainable Development»
Axis 4 (Soil Protection and Solid Waste Management)
R.O.P. - Axis 2 Thematic priority 44 (MSW and Industrial
Waste Management)
Cohesion Fund
National and/or Private matching
funds SUM ERDF
National and/or Private matching
funds SUM
€ 72 M € 11 M € 83 M € 41 M € 9 M € 50 M
1.7. PROJECT ANALYSIS
In this section, design parameters of each project (population to be served,
quantitative and qualitative waste feedstock data, BMW diversion rates etc.) are
described, and a short technical description of each type of project is given.
EIB Study: JESSICA instruments for SWM in Greece: FINAL Report - Part 2
26
1.7.1. General Information
According to ACMAR, the aforementioned technology methods that will be integrated
to the mixed waste processing MBT plants in Attiki will not be mandatory in the
procurement process (technology will be open, either biological drying or anaerobic
treatment). However, all MBT plants, should be able to meet the needs of EC
Legislation and the goals that will be set by the contracting entity (ACMAR). As a
result, at this point a detailed technical description of each project cannot be given.
Nevertheless, technical and financial (capital cost) data were sourced from a
preliminary study conducted by ACMAR in 2008 (“Evaluation of Treatment Methods
of MSW in Attiki Region”, ACMAR, 2008) where all possible options were analyzed
and evaluated, and the specific combination of facilities and proposed technologies
were selected.
Regarding operational expenditure (Opex), it must be noted that the acquisition of
detailed cost data regarding waste treatment facilities is a very difficult task, since
operational expenditures are strongly depending upon the complexity of the
technology, the degree of mechanisation and automation employed and more
importantly the stability of the secondary products market. More specifically, factors
than can affect the final output, among other are, revenues from secondary products
(as mentioned, MBT systems are sensitive to the markets and outlets for recycled
materials, RDF and soil conditioners that are produced by different processes),
labour costs (employing significant amounts of manual hand-picking could greatly
increase overall operating costs), pollution control systems (i.e. biological drying,
even thought is generally a proven process applied in numerous mechanical
biological treatment plants in Europe, needs extensive control equipment in order to
steer the process effectively), fuel and electricity prices, competition from other
treatment facilities (e.g. recycling), the waste that are sent to landfill, landfill tax, the
quality and quantity of material being presented, energy costs, the final size of the
facility and the number of shifts operated at a given facility.
Generally, typical MBT Opex (including fixed and variable costs) using anaerobic
process varies from £16 to £59 per tonne, while Opex for aerobic processes may
EIB Study: JESSICA instruments for SWM in Greece: FINAL Report - Part 2
27
vary from £20 to £59 per tonne7 (2007 prices). Fixed Opex (i.e. labour, maintenance,
insurance and environmental monitoring) are analysed for each plant separately in
the following sections. Variable costs such as those that are affected by tonnage of
feedstock (e.g. water, wastewater treatment, fuel and electricity expenditures etc),
are very difficult to be estimated in detail, thus in the financial model, cost data were
based upon European examples. At this point should also be noted that the MBT –
biological drying in Fyli (nominal capacity of 700.000 tn/year) upon completion would
be the largest MBT facility worldwide, thus no previous data about cost for a plant of
this size are available today.
1.7.2. Mechanical Treatment (Sorting) Plant – Mixed Wastes – West Attiki
Capacity: 400,000 tones/year
Feedstock: Mixed Waste
Location: Fyli
Budget: 84,430,500 €
The mechanical element is usually an automated mechanical sorting stage. This
either removes recyclable elements from a mixed waste stream (such as metals,
plastics, glass and paper) or processes them. It typically involves factory style
conveyors, industrial magnets, eddy current separators, trommels, shredders and
other tailor made systems, or the sorting is made by hand. The mechanical element
has a number of similarities to a materials recovery facility (MRF). MBT can
alternatively process the waste to produce RDF. This depends strictly on system
configurations. Next, an indicative process diagram of Mechanical Treatment
(Sorting) Plant is presented.
7 Mechanical Biological Treatment of Municipal Solid Waste, DEFRA, 2007
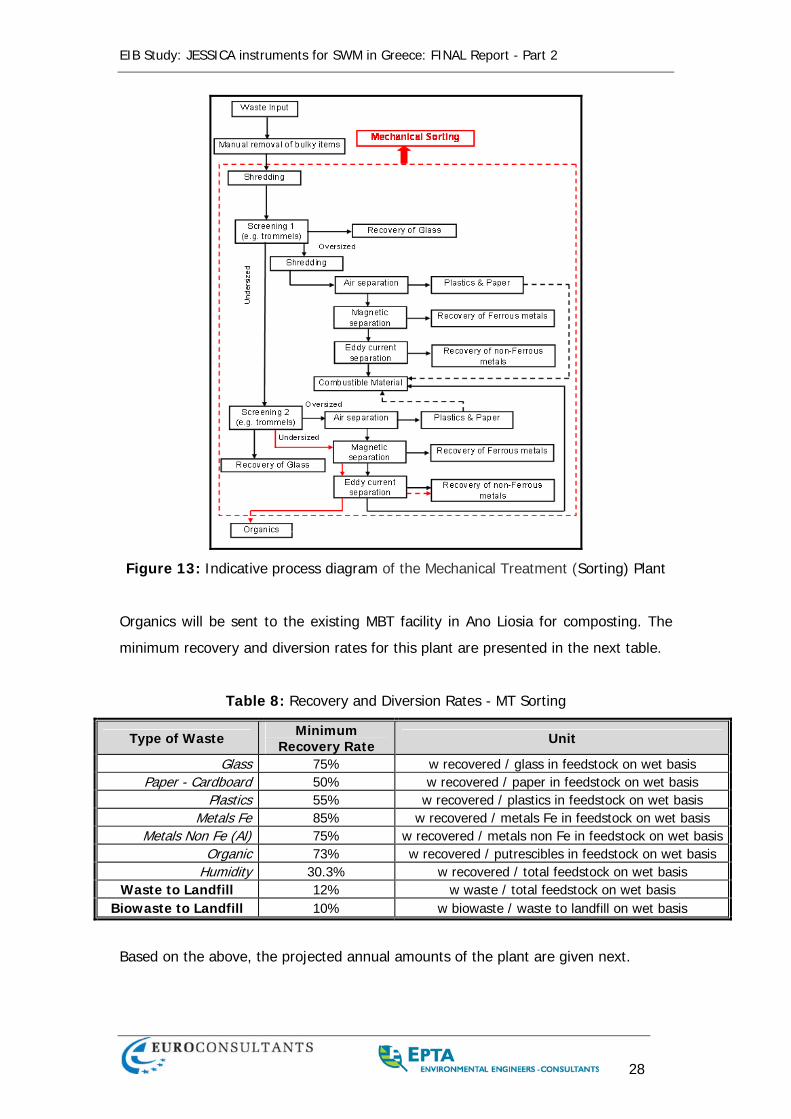
EIB Study: JESSICA instruments for SWM in Greece: FINAL Report - Part 2
28
Figure 13: Indicative process diagram of the Mechanical Treatment (Sorting) Plant
Organics will be sent to the existing MBT facility in Ano Liosia for composting. The
minimum recovery and diversion rates for this plant are presented in the next table.
Table 8: Recovery and Diversion Rates - MT Sorting
Type of Waste Minimum Recovery Rate Unit
Glass 75% w recovered / glass in feedstock on wet basis Paper - Cardboard 50% w recovered / paper in feedstock on wet basis
Plastics 55% w recovered / plastics in feedstock on wet basis Metals Fe 85% w recovered / metals Fe in feedstock on wet basis
Metals Non Fe (Al) 75% w recovered / metals non Fe in feedstock on wet basisOrganic 73% w recovered / putrescibles in feedstock on wet basis
Humidity 30.3% w recovered / total feedstock on wet basis Waste to Landfill 12% w waste / total feedstock on wet basis
Biowaste to Landfill 10% w biowaste / waste to landfill on wet basis
Based on the above, the projected annual amounts of the plant are given next.
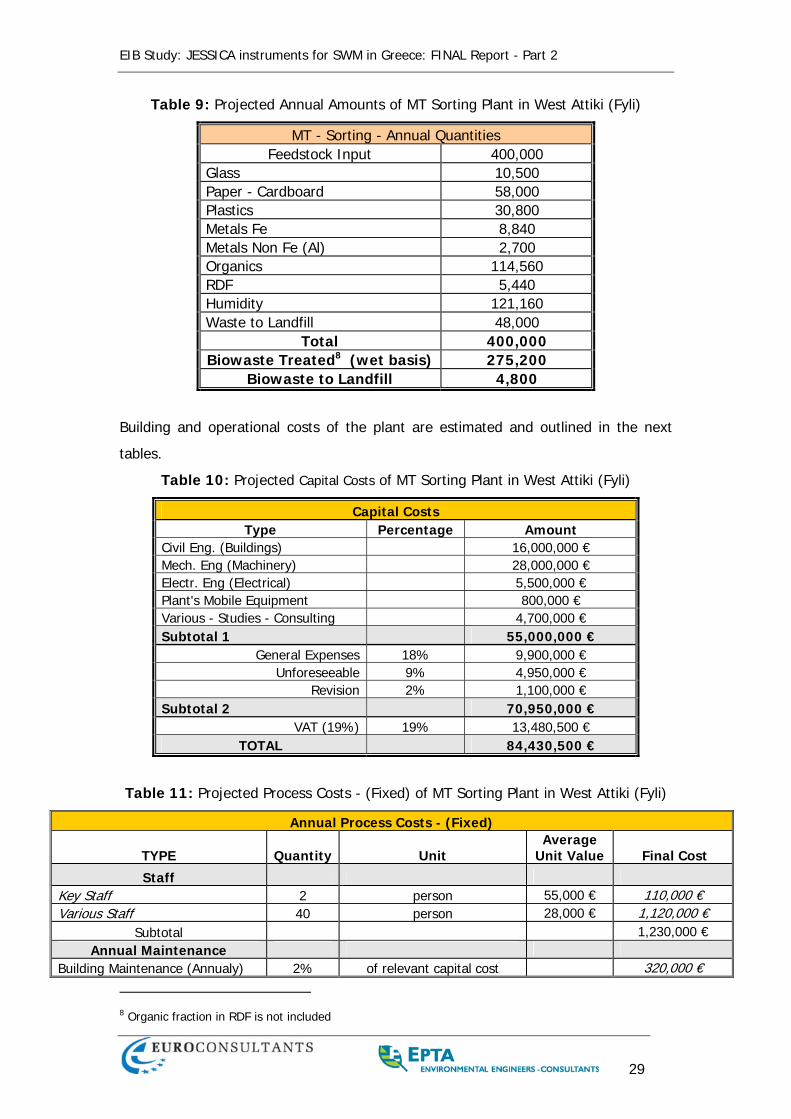
EIB Study: JESSICA instruments for SWM in Greece: FINAL Report - Part 2
29
Table 9: Projected Annual Amounts of MT Sorting Plant in West Attiki (Fyli)
MT - Sorting - Annual Quantities Feedstock Input 400,000
Glass 10,500 Paper - Cardboard 58,000 Plastics 30,800 Metals Fe 8,840 Metals Non Fe (Al) 2,700 Organics 114,560 RDF 5,440 Humidity 121,160 Waste to Landfill 48,000
Total 400,000 Biowaste Treated8 (wet basis) 275,200
Biowaste to Landfill 4,800
Building and operational costs of the plant are estimated and outlined in the next
tables.
Table 10: Projected Capital Costs of MT Sorting Plant in West Attiki (Fyli)
Capital Costs Type Percentage Amount
Civil Eng. (Buildings) 16,000,000 € Mech. Eng (Machinery) 28,000,000 € Electr. Eng (Electrical) 5,500,000 € Plant's Mobile Equipment 800,000 € Various - Studies - Consulting 4,700,000 € Subtotal 1 55,000,000 €
General Expenses 18% 9,900,000 € Unforeseeable 9% 4,950,000 €
Revision 2% 1,100,000 € Subtotal 2 70,950,000 €
VAT (19%) 19% 13,480,500 € TOTAL 84,430,500 €
Table 11: Projected Process Costs - (Fixed) of MT Sorting Plant in West Attiki (Fyli)
Annual Process Costs - (Fixed)
TYPE Quantity Unit Average
Unit Value Final Cost
Staff Key Staff 2 person 55,000 € 110,000 € Various Staff 40 person 28,000 € 1,120,000 €
Subtotal 1,230,000 € Annual Maintenance
Building Maintenance (Annualy) 2% of relevant capital cost 320,000 €
8 Organic fraction in RDF is not included
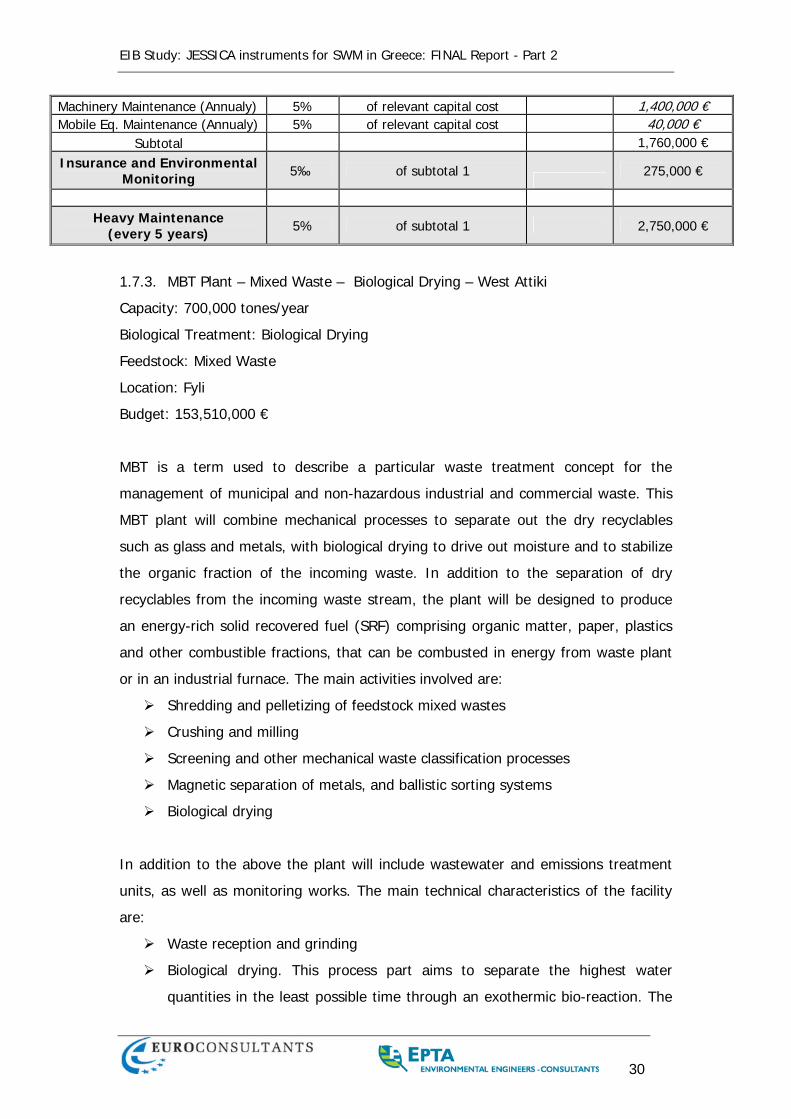
EIB Study: JESSICA instruments for SWM in Greece: FINAL Report - Part 2
30
Machinery Maintenance (Annualy) 5% of relevant capital cost 1,400,000 € Mobile Eq. Maintenance (Annualy) 5% of relevant capital cost 40,000 €
Subtotal 1,760,000 € Insurance and Environmental
Monitoring 5‰ of subtotal 1
275,000 €
Heavy Maintenance
(every 5 years) 5% of subtotal 1 2,750,000 €
1.7.3. MBT Plant – Mixed Waste – Biological Drying – West Attiki
Capacity: 700,000 tones/year
Biological Treatment: Biological Drying
Feedstock: Mixed Waste
Location: Fyli
Budget: 153,510,000 €
MBT is a term used to describe a particular waste treatment concept for the
management of municipal and non-hazardous industrial and commercial waste. This
MBT plant will combine mechanical processes to separate out the dry recyclables
such as glass and metals, with biological drying to drive out moisture and to stabilize
the organic fraction of the incoming waste. In addition to the separation of dry
recyclables from the incoming waste stream, the plant will be designed to produce
an energy-rich solid recovered fuel (SRF) comprising organic matter, paper, plastics
and other combustible fractions, that can be combusted in energy from waste plant
or in an industrial furnace. The main activities involved are:
Shredding and pelletizing of feedstock mixed wastes
Crushing and milling
Screening and other mechanical waste classification processes
Magnetic separation of metals, and ballistic sorting systems
Biological drying
In addition to the above the plant will include wastewater and emissions treatment
units, as well as monitoring works. The main technical characteristics of the facility
are:
Waste reception and grinding
Biological drying. This process part aims to separate the highest water
quantities in the least possible time through an exothermic bio-reaction. The
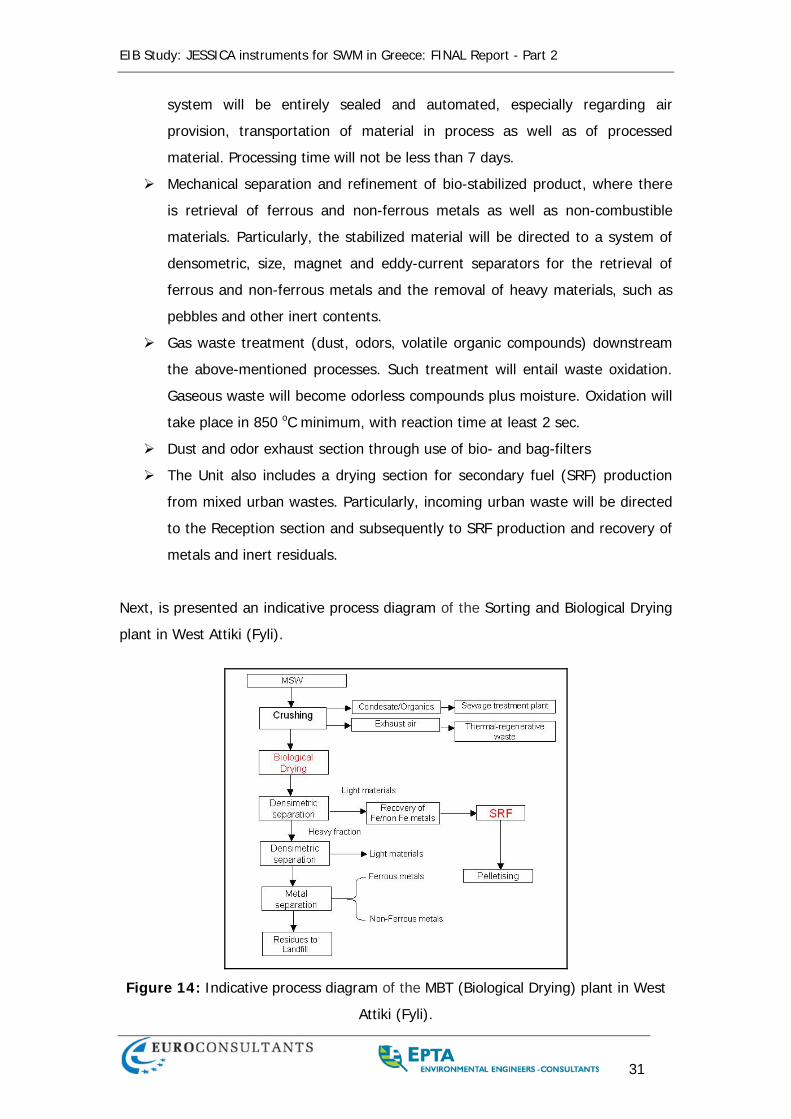
EIB Study: JESSICA instruments for SWM in Greece: FINAL Report - Part 2
31
system will be entirely sealed and automated, especially regarding air
provision, transportation of material in process as well as of processed
material. Processing time will not be less than 7 days.
Mechanical separation and refinement of bio-stabilized product, where there
is retrieval of ferrous and non-ferrous metals as well as non-combustible
materials. Particularly, the stabilized material will be directed to a system of
densometric, size, magnet and eddy-current separators for the retrieval of
ferrous and non-ferrous metals and the removal of heavy materials, such as
pebbles and other inert contents.
Gas waste treatment (dust, odors, volatile organic compounds) downstream
the above-mentioned processes. Such treatment will entail waste oxidation.
Gaseous waste will become odorless compounds plus moisture. Oxidation will
take place in 850 oC minimum, with reaction time at least 2 sec.
Dust and odor exhaust section through use of bio- and bag-filters
The Unit also includes a drying section for secondary fuel (SRF) production
from mixed urban wastes. Particularly, incoming urban waste will be directed
to the Reception section and subsequently to SRF production and recovery of
metals and inert residuals.
Next, is presented an indicative process diagram of the Sorting and Biological Drying
plant in West Attiki (Fyli).
Figure 14: Indicative process diagram of the MBT (Biological Drying) plant in West
Attiki (Fyli).
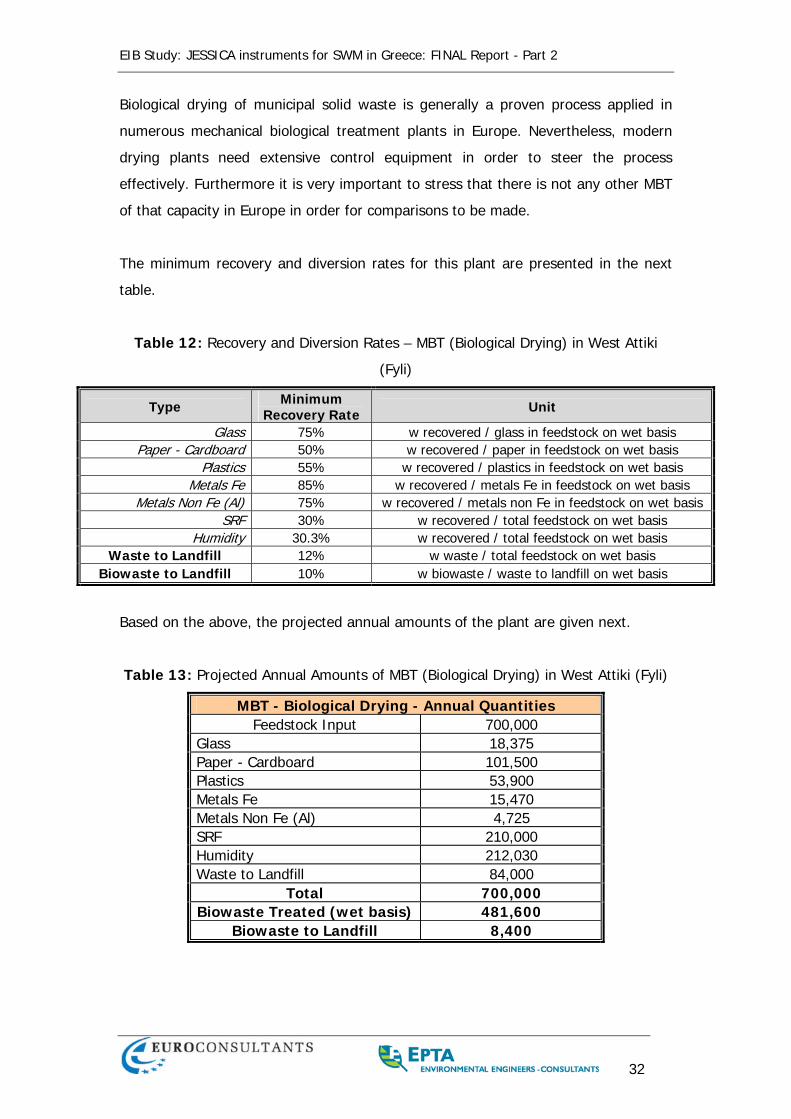
EIB Study: JESSICA instruments for SWM in Greece: FINAL Report - Part 2
32
Biological drying of municipal solid waste is generally a proven process applied in
numerous mechanical biological treatment plants in Europe. Nevertheless, modern
drying plants need extensive control equipment in order to steer the process
effectively. Furthermore it is very important to stress that there is not any other MBT
of that capacity in Europe in order for comparisons to be made.
The minimum recovery and diversion rates for this plant are presented in the next
table.
Table 12: Recovery and Diversion Rates – MBT (Biological Drying) in West Attiki
(Fyli)
Type Minimum Recovery Rate Unit
Glass 75% w recovered / glass in feedstock on wet basis Paper - Cardboard 50% w recovered / paper in feedstock on wet basis
Plastics 55% w recovered / plastics in feedstock on wet basis Metals Fe 85% w recovered / metals Fe in feedstock on wet basis
Metals Non Fe (Al) 75% w recovered / metals non Fe in feedstock on wet basis SRF 30% w recovered / total feedstock on wet basis
Humidity 30.3% w recovered / total feedstock on wet basis Waste to Landfill 12% w waste / total feedstock on wet basis
Biowaste to Landfill 10% w biowaste / waste to landfill on wet basis
Based on the above, the projected annual amounts of the plant are given next.
Table 13: Projected Annual Amounts of MBT (Biological Drying) in West Attiki (Fyli)
MBT - Biological Drying - Annual Quantities Feedstock Input 700,000
Glass 18,375 Paper - Cardboard 101,500 Plastics 53,900 Metals Fe 15,470 Metals Non Fe (Al) 4,725 SRF 210,000 Humidity 212,030 Waste to Landfill 84,000
Total 700,000 Biowaste Treated (wet basis) 481,600
Biowaste to Landfill 8,400

EIB Study: JESSICA instruments for SWM in Greece: FINAL Report - Part 2
33
Table 14: Projected Capital Costs of MBT (Biological Drying) in West Attiki (Fyli)
Capital Costs Type Percentage Amount Civil Eng. (Buildings) 25,000,000 € Mech. Eng (Machinery) 36,500,000 € Biological Treatment (Machinery) 23,000,000 € Electr. Eng (Electrical) 8,500,000 € Plant's Mobile Equipment 1,200,000 € Various - Studies - Consulting 5,800,000 € Subtotal 1 100,000,000 €
General Expenses 18% 18,000,000 € Unforeseeable (9%) 9% 9,000,000 €
Revision 2% 2,000,000 € Subtotal 2 129,000,000 € VAT (19%) 19% 24,510,000 €
TOTAL 153,510,000 €
Table 15: Projected Process Costs - (fixed) of MBT (Biological Drying) in West Attiki
(Fyli)
Annual Process Costs - (Fixed) TYPE Quantity Unit Average Unit Value Final Cost Staff
Key Staff 2 person 55,000 € 110,000 € Various Staff 55 person 28,000 € 1,540,000 €
Subtotal 1,650,000 € Annual Maintenance
Building Maintenance (Annualy) 2% of relevant capital cost 500,000 € Machinery Maintenance (Annualy) 5% of relevant capital cost 2,975,000 € Mobile Eq. Maintenance (Annualy) 5% of relevant capital cost 60,000 €
Subtotal 3,535,000 € Insurance and Environmental
Monitoring 5‰ of subtotal 1 500,000 €
Heavy Maintenance
(every 5 years) 5% of subtotal 1 5,000,000 €
1.7.4. MBT Plants – Mixed Waste – Anaerobic Digestion – East Attiki
Capacity: 127,500 tones/year each plant
Biological Treatment: Anaerobic Digestion
Feedstock: Mixed Waste
Location: Grammatiko and Keratea
Budget: 89.083.400 € each plant
EIB Study: JESSICA instruments for SWM in Greece: FINAL Report - Part 2
34
Two identical MBT plants are foreseen in Northeast and Southeast Attiki. The plants
will treat mixed MSW, and will apply anaerobic digestion technology for the biological
treatment of waste.
Anaerobic Digestion (AD) is a process whereby organic waste is broken down in a
controlled, oxygen free environment by bacteria naturally occurring in the waste
material. Methane rich biogas will be produced thus facilitating renewable energy
generation. The produced methane will be treated and provide energy for the plant
and to the grid. The residual nutrient rich liquor and digestate will be composted and
then will be suitable for use as fertiliser.
The main compartments of the anaerobic digestion plant are:
Receiving hall: quality control and initial preparation of the incoming
biowaste)
Pre-treatment compartment: process water is added
Anaerobic digestion chamber: The biowaste (organic) is fed directly into
the digester and the process is developed under controlled conditions
Biogas production compartment: The main air product of the process
(biogas) is collected
Digestate compartment: Separation and handling of the stabilized
products into a solid and a liquid fraction
Air emissions control system: The generated air emissions are treated in a
water scrubber and in a biofilter in order to eliminate odour problems
The facility will include an anaerobic digestion plant and a gas engines system which
will produce electricity by the combustion of the biogas produced by the anaerobic
digestion plant. The solid waste will be deposited in a bunker which can be closed in
order to minimize odour emissions. A pushing floor at the bottom of the bunker will
transfer the waste to the pre-treatment station which consists of a cascade mill, a
screen of 40 mm and an over-belt magnet. The oversize screened materials will be
disposed to the landfill. The remaining materials of low size, will be sent to a buffer
compartment. The buffer allows the feeding of the digester during the weekend so
that a continuous operation of the anaerobic digester and continuous gas production
are achieved. The material, before being pumped into the anaerobic reactor, will be
EIB Study: JESSICA instruments for SWM in Greece: FINAL Report - Part 2
35
mixed with digested residues and a low quantity of steam, in order to heat up the
substrate to about 50 °C.
The digestion process will take place under thermophilic conditions, in the range of
50-55 °C. The reactor will be heated by a hot water spiral in order to minimise the
amount of steam needed for maintaining the operation temperature in the optimum
range. The mean retention time of the substrate in the reactor varies from 20 to 30
days. The waste heat is usually used to evaporate the produced wastewater. As a
result, the installation could operate free of any effluent.
The expected gas production is about 110 Nm³ per ton of waste fed to the digester.
The collected gas is stored in a gas bag and will be used, as fuel in engines. The
surplus of electrical energy will be sold to the grid. A high temperature torch will be
installed in order to flare off excess biogas. The digester will have a semi-conical
bottom with a sliding frame of 3 m diameter. The digested product will be extracted
and either recycled together with fresh substrate back into the reactor or pumped to
a buffer in order to be dewatered. Before the dewatering process, the stabilised
product will be transferred to a mixing unit and mixed with a polymer solution in
order to improve dewatering. A screw press is dewatering the residue to 50% total
solids.
The produced press cake will be sent to a post-composting system in order to
produce mature compost. The water effluent from the press will be centrifuged and
the effluent is stored into a buffer before being evaporated by utilising the waste
heat of the gas engines. The concentrate of the evaporator is mixed with the press
cake and the centrifuge cake in order to be stabilised aerobically. The steam is sent
to an acid scrubber which captures the evaporated ammonia, producing an
ammonium sulphate solution. After the scrubber the steam is mixed with process air
and clean air, and then treated in an insulated container passing through a biofilter.
Each plant is expected to generate around 20,000 MWh electricity per year derived
from the biogas. The plant consumption is estimated around 5,000 MWh per year
resulting in an electricity production of 15,000 MWh per year.
The minimum recovery and diversion rates for this plant are presented in the next
table.
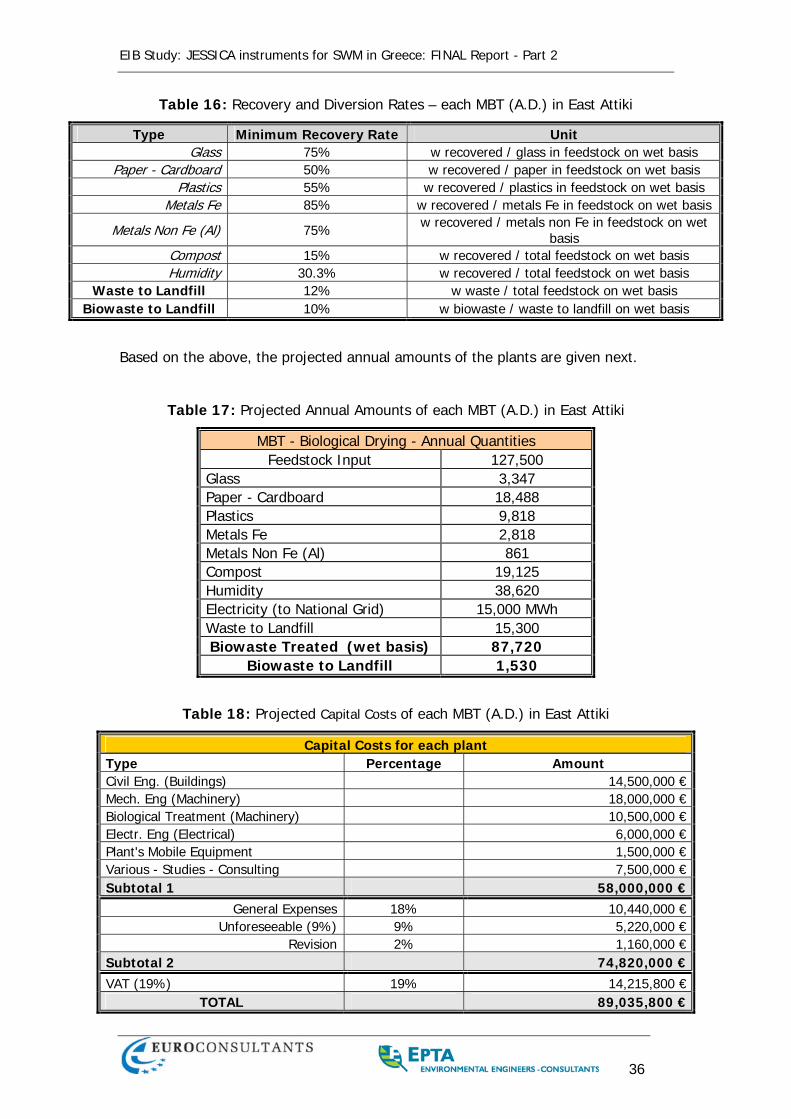
EIB Study: JESSICA instruments for SWM in Greece: FINAL Report - Part 2
36
Table 16: Recovery and Diversion Rates – each MBT (A.D.) in East Attiki
Type Minimum Recovery Rate Unit Glass 75% w recovered / glass in feedstock on wet basis
Paper - Cardboard 50% w recovered / paper in feedstock on wet basis Plastics 55% w recovered / plastics in feedstock on wet basis
Metals Fe 85% w recovered / metals Fe in feedstock on wet basis
Metals Non Fe (Al) 75% w recovered / metals non Fe in feedstock on wet basis
Compost 15% w recovered / total feedstock on wet basis Humidity 30.3% w recovered / total feedstock on wet basis
Waste to Landfill 12% w waste / total feedstock on wet basis Biowaste to Landfill 10% w biowaste / waste to landfill on wet basis
Based on the above, the projected annual amounts of the plants are given next.
Table 17: Projected Annual Amounts of each MBT (A.D.) in East Attiki
MBT - Biological Drying - Annual Quantities Feedstock Input 127,500
Glass 3,347 Paper - Cardboard 18,488 Plastics 9,818 Metals Fe 2,818 Metals Non Fe (Al) 861 Compost 19,125 Humidity 38,620 Electricity (to National Grid) 15,000 MWh Waste to Landfill 15,300 Biowaste Treated (wet basis) 87,720
Biowaste to Landfill 1,530
Table 18: Projected Capital Costs of each MBT (A.D.) in East Attiki
Capital Costs for each plant Type Percentage Amount Civil Eng. (Buildings) 14,500,000 €Mech. Eng (Machinery) 18,000,000 €Biological Treatment (Machinery) 10,500,000 €Electr. Eng (Electrical) 6,000,000 €Plant's Mobile Equipment 1,500,000 €Various - Studies - Consulting 7,500,000 €Subtotal 1 58,000,000 €
General Expenses 18% 10,440,000 €Unforeseeable (9%) 9% 5,220,000 €
Revision 2% 1,160,000 €Subtotal 2 74,820,000 €VAT (19%) 19% 14,215,800 €
TOTAL 89,035,800 €
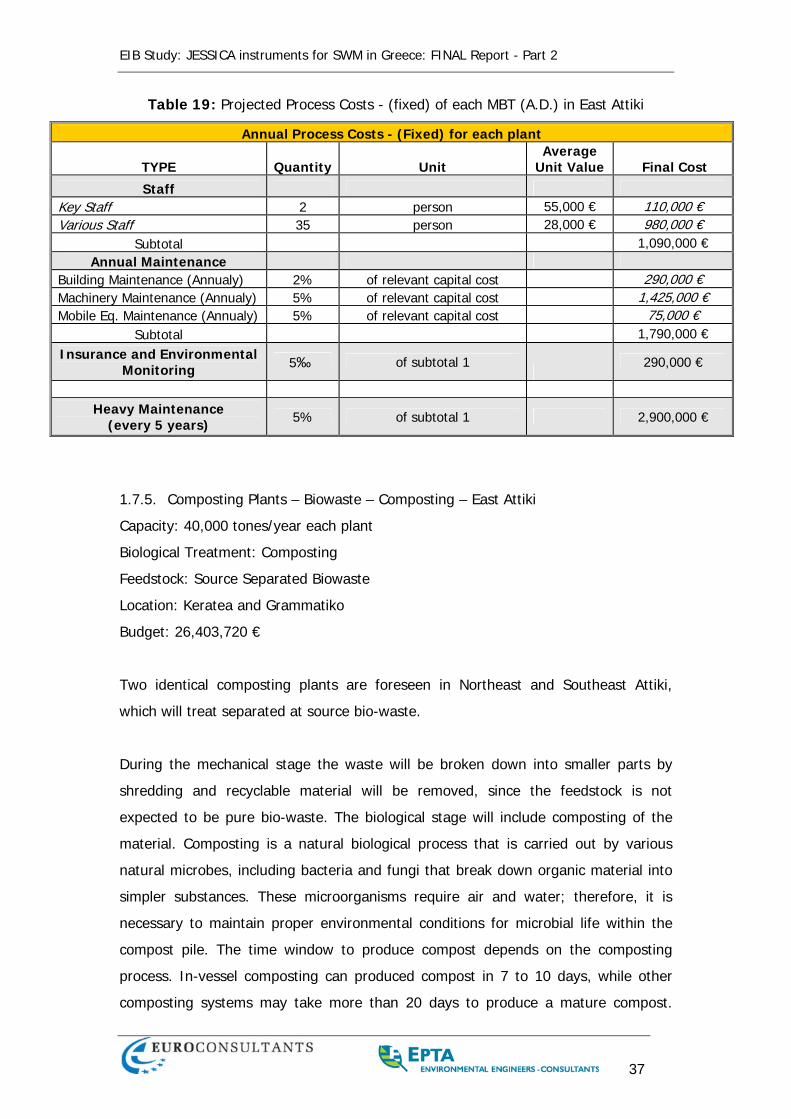
EIB Study: JESSICA instruments for SWM in Greece: FINAL Report - Part 2
37
Table 19: Projected Process Costs - (fixed) of each MBT (A.D.) in East Attiki
Annual Process Costs - (Fixed) for each plant
TYPE Quantity Unit Average
Unit Value Final Cost
Staff Key Staff 2 person 55,000 € 110,000 € Various Staff 35 person 28,000 € 980,000 €
Subtotal 1,090,000 € Annual Maintenance
Building Maintenance (Annualy) 2% of relevant capital cost 290,000 € Machinery Maintenance (Annualy) 5% of relevant capital cost 1,425,000 € Mobile Eq. Maintenance (Annualy) 5% of relevant capital cost 75,000 €
Subtotal 1,790,000 € Insurance and Environmental
Monitoring 5‰ of subtotal 1
290,000 €
Heavy Maintenance
(every 5 years) 5% of subtotal 1 2,900,000 €
1.7.5. Composting Plants – Biowaste – Composting – East Attiki
Capacity: 40,000 tones/year each plant
Biological Treatment: Composting
Feedstock: Source Separated Biowaste
Location: Keratea and Grammatiko
Budget: 26,403,720 €
Two identical composting plants are foreseen in Northeast and Southeast Attiki,
which will treat separated at source bio-waste.
During the mechanical stage the waste will be broken down into smaller parts by
shredding and recyclable material will be removed, since the feedstock is not
expected to be pure bio-waste. The biological stage will include composting of the
material. Composting is a natural biological process that is carried out by various
natural microbes, including bacteria and fungi that break down organic material into
simpler substances. These microorganisms require air and water; therefore, it is
necessary to maintain proper environmental conditions for microbial life within the
compost pile. The time window to produce compost depends on the composting
process. In-vessel composting can produced compost in 7 to 10 days, while other
composting systems may take more than 20 days to produce a mature compost.
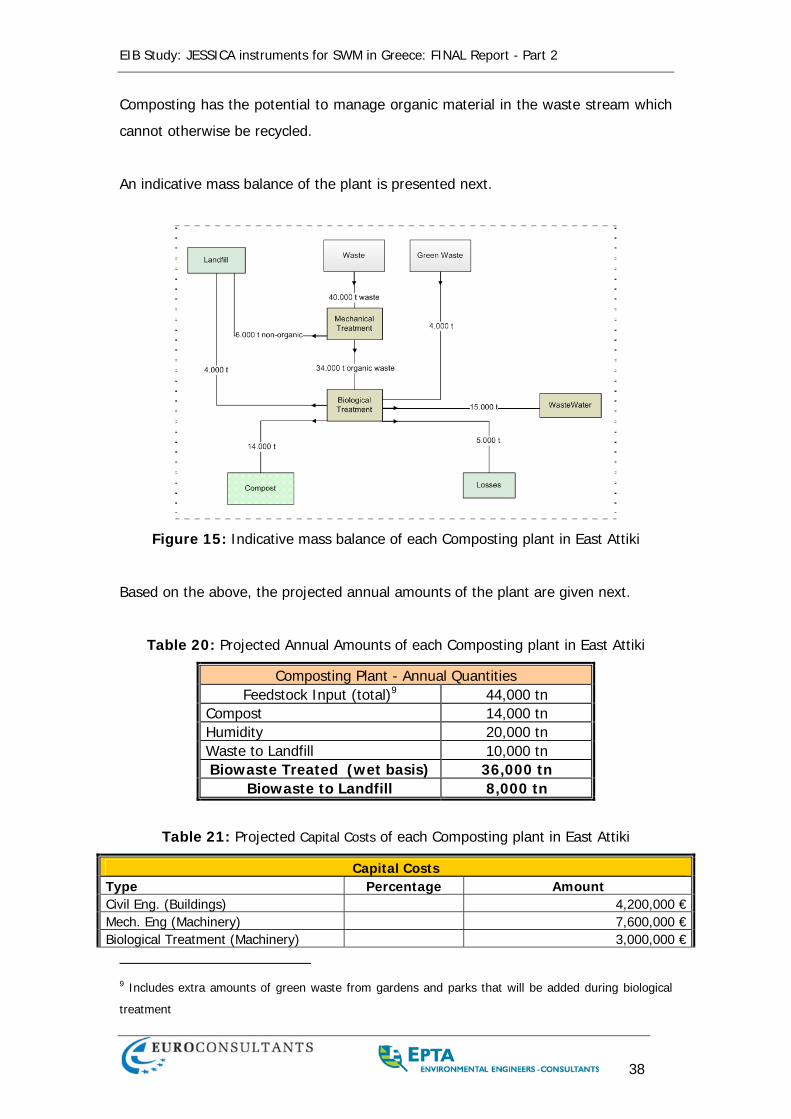
EIB Study: JESSICA instruments for SWM in Greece: FINAL Report - Part 2
38
Composting has the potential to manage organic material in the waste stream which
cannot otherwise be recycled.
An indicative mass balance of the plant is presented next.
Figure 15: Indicative mass balance of each Composting plant in East Attiki
Based on the above, the projected annual amounts of the plant are given next.
Table 20: Projected Annual Amounts of each Composting plant in East Attiki
Composting Plant - Annual Quantities Feedstock Input (total)9 44,000 tn
Compost 14,000 tn Humidity 20,000 tn Waste to Landfill 10,000 tn Biowaste Treated (wet basis) 36,000 tn
Biowaste to Landfill 8,000 tn
Table 21: Projected Capital Costs of each Composting plant in East Attiki
Capital Costs Type Percentage Amount Civil Eng. (Buildings) 4,200,000 €Mech. Eng (Machinery) 7,600,000 €Biological Treatment (Machinery) 3,000,000 €
9 Includes extra amounts of green waste from gardens and parks that will be added during biological
treatment
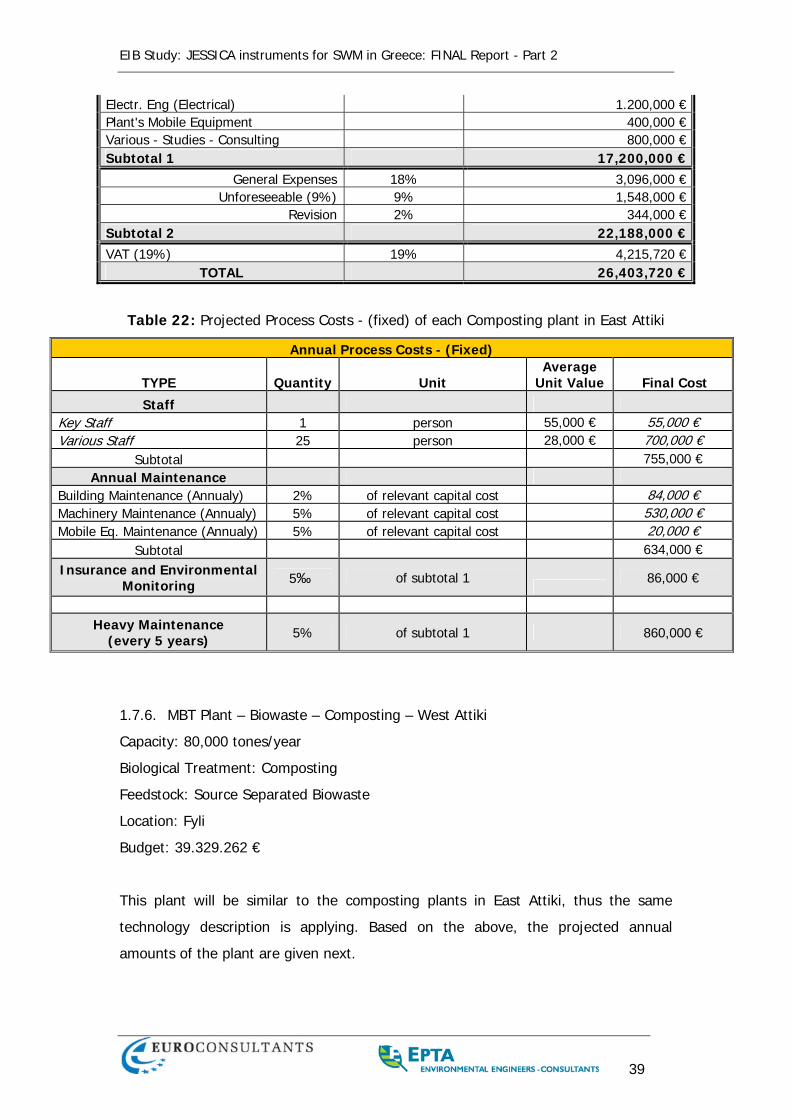
EIB Study: JESSICA instruments for SWM in Greece: FINAL Report - Part 2
39
Electr. Eng (Electrical) 1.200,000 €Plant's Mobile Equipment 400,000 €Various - Studies - Consulting 800,000 €Subtotal 1 17,200,000 €
General Expenses 18% 3,096,000 €Unforeseeable (9%) 9% 1,548,000 €
Revision 2% 344,000 €Subtotal 2 22,188,000 €VAT (19%) 19% 4,215,720 €
TOTAL 26,403,720 €
Table 22: Projected Process Costs - (fixed) of each Composting plant in East Attiki
Annual Process Costs - (Fixed)
TYPE Quantity Unit Average
Unit Value Final Cost
Staff Key Staff 1 person 55,000 € 55,000 € Various Staff 25 person 28,000 € 700,000 €
Subtotal 755,000 € Annual Maintenance
Building Maintenance (Annualy) 2% of relevant capital cost 84,000 € Machinery Maintenance (Annualy) 5% of relevant capital cost 530,000 € Mobile Eq. Maintenance (Annualy) 5% of relevant capital cost 20,000 €
Subtotal 634,000 € Insurance and Environmental
Monitoring 5‰ of subtotal 1
86,000 €
Heavy Maintenance
(every 5 years) 5% of subtotal 1 860,000 €
1.7.6. MBT Plant – Biowaste – Composting – West Attiki
Capacity: 80,000 tones/year
Biological Treatment: Composting
Feedstock: Source Separated Biowaste
Location: Fyli
Budget: 39.329.262 €
This plant will be similar to the composting plants in East Attiki, thus the same
technology description is applying. Based on the above, the projected annual
amounts of the plant are given next.
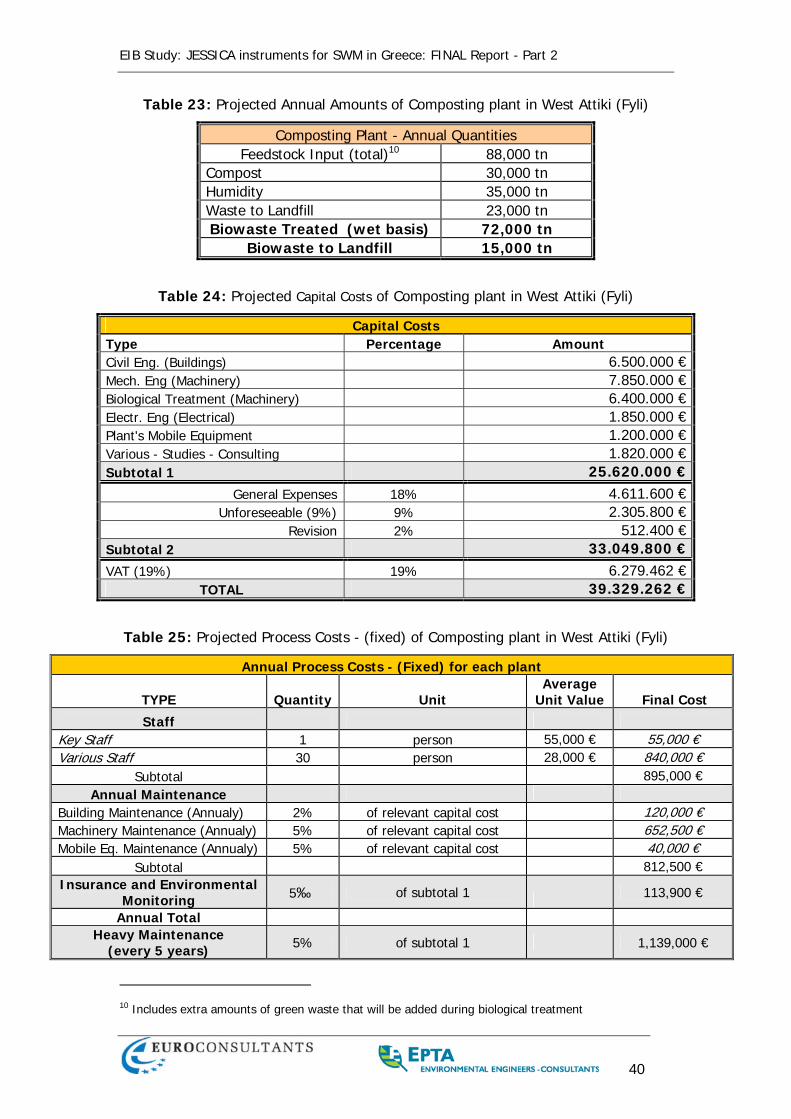
EIB Study: JESSICA instruments for SWM in Greece: FINAL Report - Part 2
40
Table 23: Projected Annual Amounts of Composting plant in West Attiki (Fyli)
Composting Plant - Annual Quantities Feedstock Input (total)10 88,000 tn
Compost 30,000 tn Humidity 35,000 tn Waste to Landfill 23,000 tn Biowaste Treated (wet basis) 72,000 tn
Biowaste to Landfill 15,000 tn
Table 24: Projected Capital Costs of Composting plant in West Attiki (Fyli)
Capital Costs Type Percentage Amount Civil Eng. (Buildings) 6.500.000 €Mech. Eng (Machinery) 7.850.000 €Biological Treatment (Machinery) 6.400.000 €Electr. Eng (Electrical) 1.850.000 €Plant's Mobile Equipment 1.200.000 €Various - Studies - Consulting 1.820.000 €Subtotal 1 25.620.000 €
General Expenses 18% 4.611.600 €Unforeseeable (9%) 9% 2.305.800 €
Revision 2% 512.400 €Subtotal 2 33.049.800 €VAT (19%) 19% 6.279.462 €
TOTAL 39.329.262 €
Table 25: Projected Process Costs - (fixed) of Composting plant in West Attiki (Fyli)
Annual Process Costs - (Fixed) for each plant
TYPE Quantity Unit Average
Unit Value Final Cost
Staff Key Staff 1 person 55,000 € 55,000 € Various Staff 30 person 28,000 € 840,000 €
Subtotal 895,000 € Annual Maintenance
Building Maintenance (Annualy) 2% of relevant capital cost 120,000 € Machinery Maintenance (Annualy) 5% of relevant capital cost 652,500 € Mobile Eq. Maintenance (Annualy) 5% of relevant capital cost 40,000 €
Subtotal 812,500 € Insurance and Environmental
Monitoring 5‰ of subtotal 1 113,900 €
Annual Total Heavy Maintenance
(every 5 years) 5% of subtotal 1 1,139,000 €
10 Includes extra amounts of green waste that will be added during biological treatment
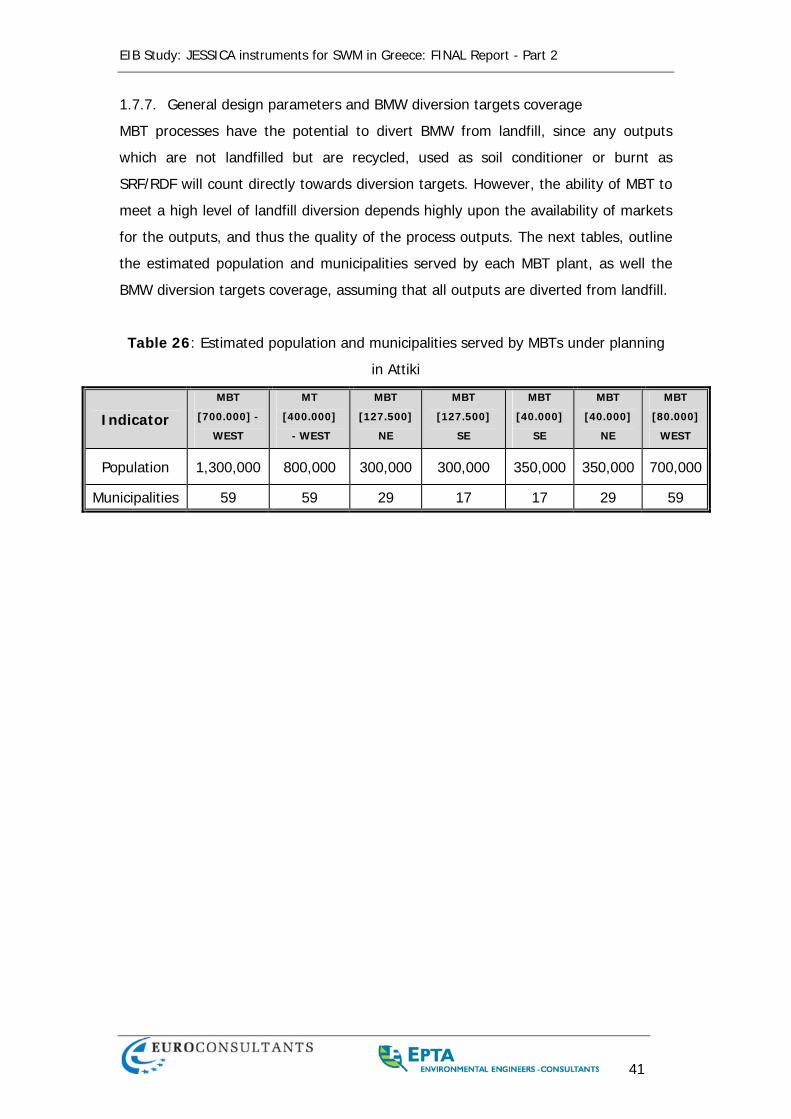
EIB Study: JESSICA instruments for SWM in Greece: FINAL Report - Part 2
41
1.7.7. General design parameters and BMW diversion targets coverage
MBT processes have the potential to divert BMW from landfill, since any outputs
which are not landfilled but are recycled, used as soil conditioner or burnt as
SRF/RDF will count directly towards diversion targets. However, the ability of MBT to
meet a high level of landfill diversion depends highly upon the availability of markets
for the outputs, and thus the quality of the process outputs. The next tables, outline
the estimated population and municipalities served by each MBT plant, as well the
BMW diversion targets coverage, assuming that all outputs are diverted from landfill.
Table 26: Estimated population and municipalities served by MBTs under planning
in Attiki
Indicator
MBT
[700.000] -
WEST
MT
[400.000]
- WEST
MBT
[127.500]
NE
MBT
[127.500]
SE
MBT
[40.000]
SE
MBT
[40.000]
NE
MBT
[80.000]
WEST
Population 1,300,000 800,000 300,000 300,000 350,000 350,000 700,000
Municipalities 59 59 29 17 17 29 59
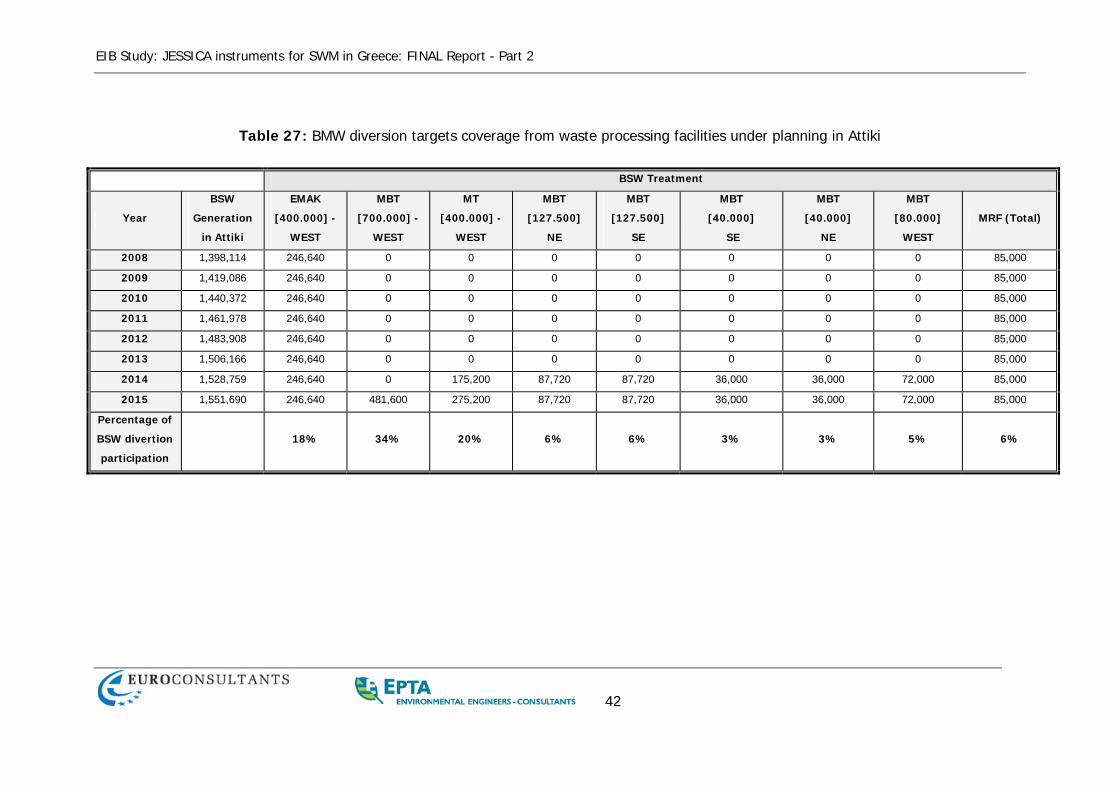
EIB Study: JESSICA instruments for SWM in Greece: FINAL Report - Part 2
42
Table 27: BMW diversion targets coverage from waste processing facilities under planning in Attiki
BSW Treatment
Year
BSW
Generation
in Attiki
EMAK
[400.000] -
WEST
MBT
[700.000] -
WEST
MT
[400.000] -
WEST
MBT
[127.500]
NE
MBT
[127.500]
SE
MBT
[40.000]
SE
MBT
[40.000]
NE
MBT
[80.000]
WEST
MRF (Total)
2008 1,398,114 246,640 0 0 0 0 0 0 0 85,000
2009 1,419,086 246,640 0 0 0 0 0 0 0 85,000
2010 1,440,372 246,640 0 0 0 0 0 0 0 85,000
2011 1,461,978 246,640 0 0 0 0 0 0 0 85,000
2012 1,483,908 246,640 0 0 0 0 0 0 0 85,000
2013 1,506,166 246,640 0 0 0 0 0 0 0 85,000
2014 1,528,759 246,640 0 175,200 87,720 87,720 36,000 36,000 72,000 85,000
2015 1,551,690 246,640 481,600 275,200 87,720 87,720 36,000 36,000 72,000 85,000
Percentage of
BSW divertion
participation
18% 34% 20% 6% 6% 3% 3% 5% 6%
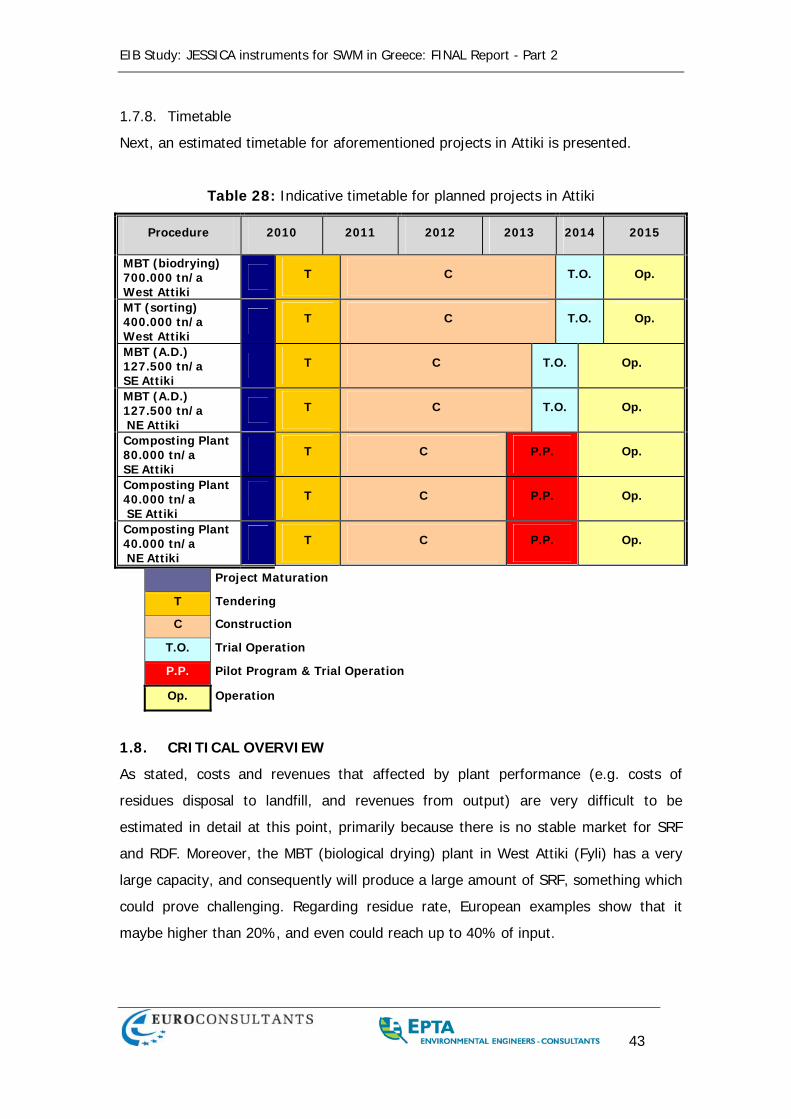
EIB Study: JESSICA instruments for SWM in Greece: FINAL Report - Part 2
43
1.7.8. Timetable
Next, an estimated timetable for aforementioned projects in Attiki is presented.
Table 28: Indicative timetable for planned projects in Attiki
Procedure 2010 2011 2012 2013 2014 2015
MBT (biodrying) 700.000 tn/a West Attiki
T C T.O. Op.
MT (sorting) 400.000 tn/a West Attiki
T C T.O. Op.
MBT (A.D.) 127.500 tn/a SE Attiki
T C T.O. Op.
MBT (A.D.) 127.500 tn/a NE Attiki
T C T.O. Op.
Composting Plant 80.000 tn/a SE Attiki
T C P.P. Op.
Composting Plant 40.000 tn/a SE Attiki
T C P.P. Op.
Composting Plant 40.000 tn/a NE Attiki
T C P.P. Op.
Project Maturation
T Tendering
C Construction
T.O. Trial Operation
P.P. Pilot Program & Trial Operation
Op. Operation
1.8. CRITICAL OVERVIEW
As stated, costs and revenues that affected by plant performance (e.g. costs of
residues disposal to landfill, and revenues from output) are very difficult to be
estimated in detail at this point, primarily because there is no stable market for SRF
and RDF. Moreover, the MBT (biological drying) plant in West Attiki (Fyli) has a very
large capacity, and consequently will produce a large amount of SRF, something which
could prove challenging. Regarding residue rate, European examples show that it
maybe higher than 20%, and even could reach up to 40% of input.

EIB Study: JESSICA instruments for SWM in Greece: FINAL Report - Part 2
44
Generally, the application of all waste treatment technologies has been fraught with
problems that have often arisen because of over-optimistic assessments of technical,
institutional and financial feasibility. Overestimations of the calorific value of the waste
in case of incineration projects, market demand for compost and recyclables, technical
skills and available operation and maintenance budgets, has been a major cause of
failure of investments in waste treatment technology. All these risk factors have to be
taken into consideration during the evaluation of each project from the contracting
authority and probably incorporated into the procurement documents.
The most important issue that have to be addressed prior to the operation of each
plant is the market demand risks. The viability of MBT plants rests on the availability of
outlets for the principal products and residues. In the case of MBT plants that create
RDF and SRF, the main barriers to development are the planning problems associated
with the construction of dedicated Waste to Energy plants to receive the fuel, and the
lack of secure long-term markets for the fuel in the cement, power and other energy-
intensive industries that could try alternatives to fossil fuel. In the case of MBT plants
that create a biologically stable product for landfill the main uncertainty relates to
whether the product complies with the requirement of the Landfill Directive for the
diversion of biodegradable waste from landfills. In cases where an MBT plant produces
a recyclable or marketable product (compost etc) the issue of product quality and
consistency is paramount if a long-term market is to be secured. Products developed
from mixed waste inputs are generally too contaminated to permit uses other than in
low value applications.
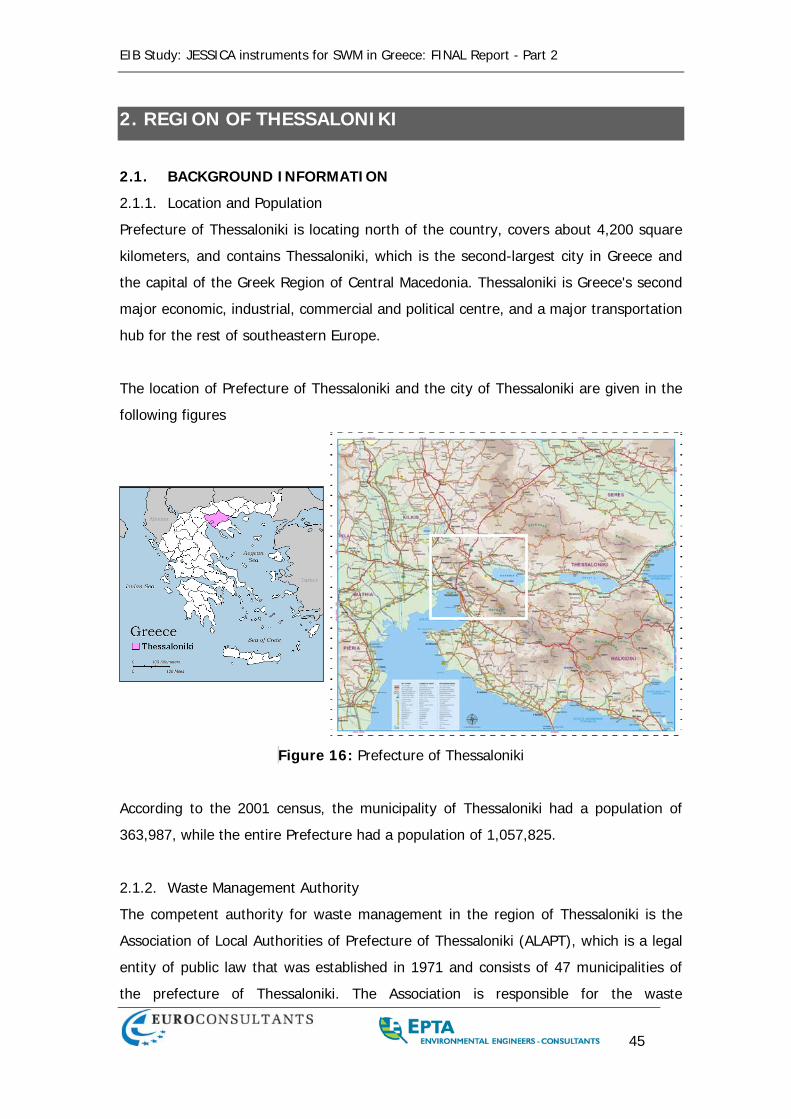
EIB Study: JESSICA instruments for SWM in Greece: FINAL Report - Part 2
45
2. REGION OF THESSALONIKI
2.1. BACKGROUND INFORMATION
2.1.1. Location and Population
Prefecture of Thessaloniki is locating north of the country, covers about 4,200 square
kilometers, and contains Thessaloniki, which is the second-largest city in Greece and
the capital of the Greek Region of Central Macedonia. Thessaloniki is Greece's second
major economic, industrial, commercial and political centre, and a major transportation
hub for the rest of southeastern Europe.
The location of Prefecture of Thessaloniki and the city of Thessaloniki are given in the
following figures
Figure 16: Prefecture of Thessaloniki
According to the 2001 census, the municipality of Thessaloniki had a population of
363,987, while the entire Prefecture had a population of 1,057,825.
2.1.2. Waste Management Authority
The competent authority for waste management in the region of Thessaloniki is the
Association of Local Authorities of Prefecture of Thessaloniki (ALAPT), which is a legal
entity of public law that was established in 1971 and consists of 47 municipalities of
the prefecture of Thessaloniki. The Association is responsible for the waste
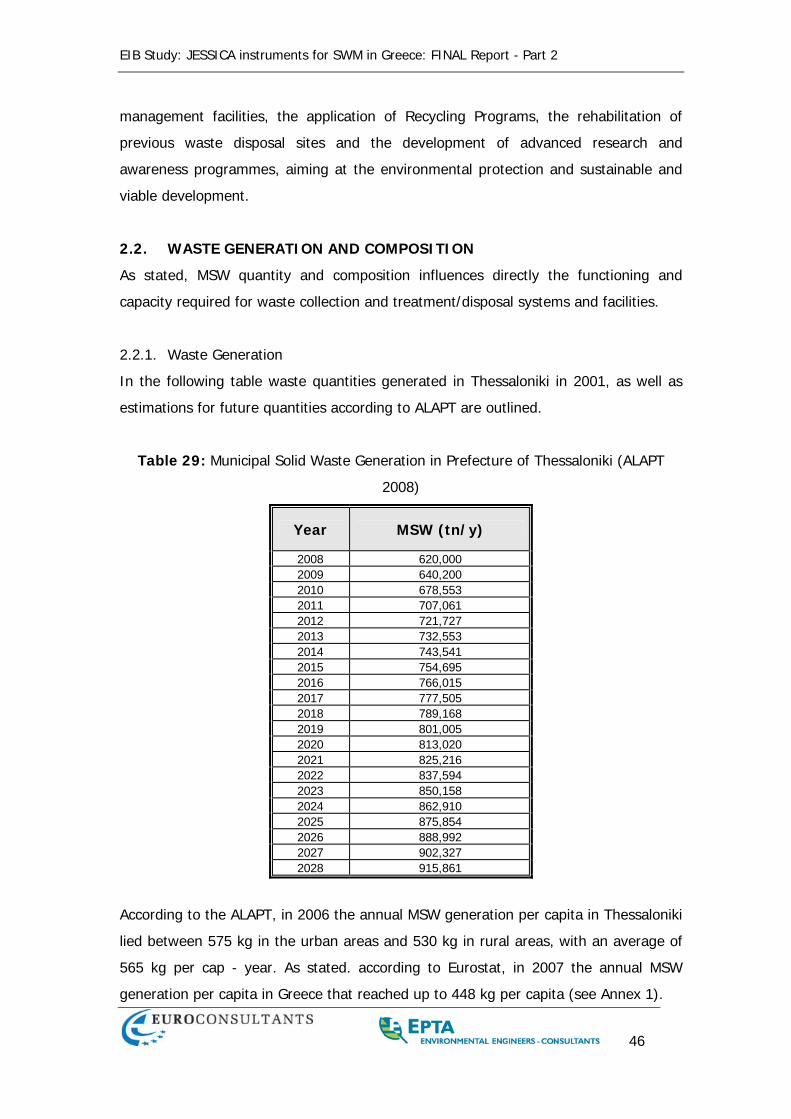
EIB Study: JESSICA instruments for SWM in Greece: FINAL Report - Part 2
46
management facilities, the application of Recycling Programs, the rehabilitation of
previous waste disposal sites and the development of advanced research and
awareness programmes, aiming at the environmental protection and sustainable and
viable development.
2.2. WASTE GENERATION AND COMPOSITION
As stated, MSW quantity and composition influences directly the functioning and
capacity required for waste collection and treatment/disposal systems and facilities.
2.2.1. Waste Generation
In the following table waste quantities generated in Thessaloniki in 2001, as well as
estimations for future quantities according to ALAPT are outlined.
Table 29: Municipal Solid Waste Generation in Prefecture of Thessaloniki (ALAPT
2008)
Year MSW (tn/y)
2008 620,000 2009 640,200 2010 678,553 2011 707,061 2012 721,727 2013 732,553 2014 743,541 2015 754,695 2016 766,015 2017 777,505 2018 789,168 2019 801,005 2020 813,020 2021 825,216 2022 837,594 2023 850,158 2024 862,910 2025 875,854 2026 888,992 2027 902,327 2028 915,861
According to the ALAPT, in 2006 the annual MSW generation per capita in Thessaloniki
lied between 575 kg in the urban areas and 530 kg in rural areas, with an average of
565 kg per cap - year. As stated. according to Eurostat, in 2007 the annual MSW
generation per capita in Greece that reached up to 448 kg per capita (see Annex 1).

EIB Study: JESSICA instruments for SWM in Greece: FINAL Report - Part 2
47
Moreover, in the RSWMP of Macedonia-Thrace, in order for future quantities to be
estimated, it is assumed a “Realistic” scenario, where waste grows by 35% in the 20-
year period 2008-2028 (by 1.5% yearly). As stated, and in accordance to previous 3-
scenarios analysis, this scenario is closer to the Greek reality, because the increase of
35% in waste during the 2008-2028 period is constituent to the previous decade
pattern (47%). Nevertheless, in the following Figure MSW total generation in
Thessaloniki from 2008-2028 assuming 3 different scenarios (min, central and max)
based on correlation between income and MSW generation, is depicted.
MSW Total Generation - 3 Scenarios Analysis
0
200,000
400,000
600,000
800,000
1,000,000
1,200,000
1,400,000
2008 2010 2012 2014 2016 2018 2020 2022 2024 2026 2028
Year
tn o
f MSW
Central ScenarioMin ScenarioMax Scenario
Figure 17: MSW Total Generation in Thessaloniki from 2008-2028 assuming 3
different scenarios (min, central and max)
2.2.2. Waste Composition
As stated, in Greece, composition of MSW was presented in J.M.D 50910/2727/2003
data (Putrescibles - 47,00%, Paper - 20,00%, Plastic - 8,50%, Metals - 4,50%, Glass -
4,50%, Wood/ Green Waste - 4,00% and Other - 11,50%).
In the following table, the composition of MSW in Thessaloniki (2007) is presented,
based on a detailed study conducted by ALART (Research on quality and quantity
composition of Thessaloniki's urban solid waste, using the European methodology
MODECOM) and the Aristotele University of Thessaloniki (A.U.T.).
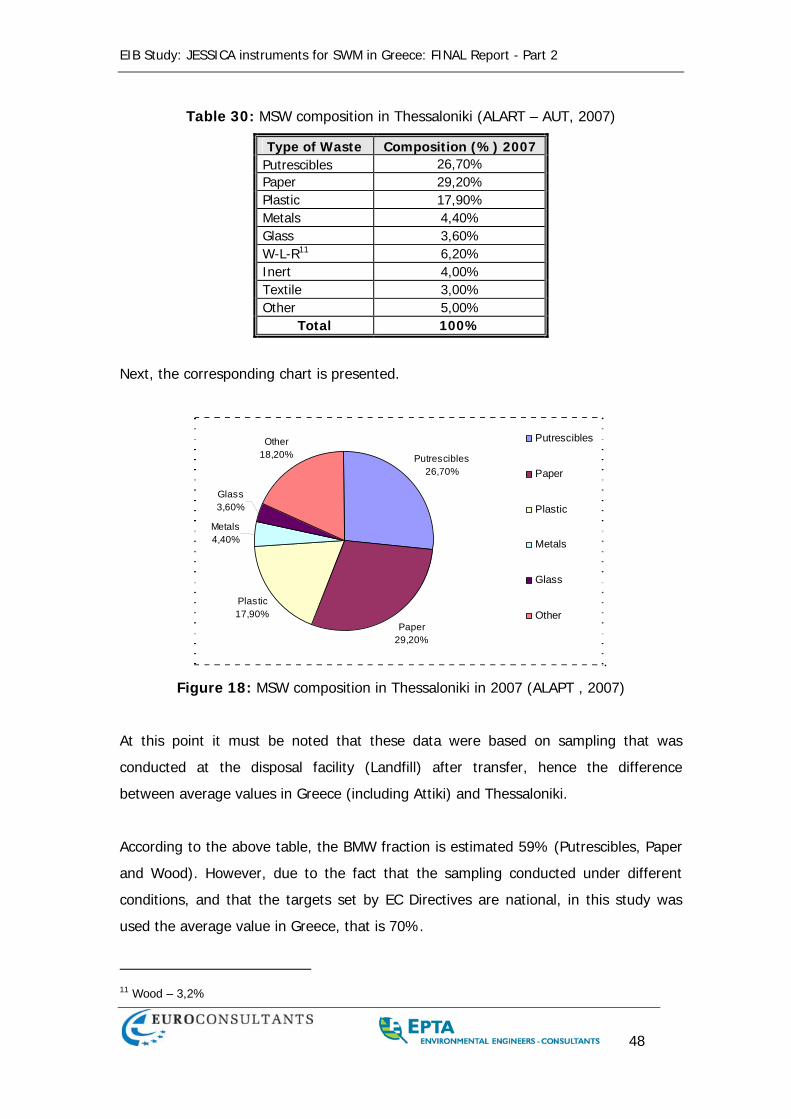
EIB Study: JESSICA instruments for SWM in Greece: FINAL Report - Part 2
48
Table 30: MSW composition in Thessaloniki (ALART – AUT, 2007)
Type of Waste Composition (%) 2007Putrescibles 26,70% Paper 29,20% Plastic 17,90% Metals 4,40% Glass 3,60% W-L-R11 6,20% Inert 4,00% Textile 3,00% Other 5,00%
Total 100%
Next, the corresponding chart is presented.
Putrescibles26,70%
Paper29,20%
Plastic17,90%
Metals4,40%
Glass3,60%
Other18,20%
Putrescibles
Paper
Plastic
Metals
Glass
Other
.
Figure 18: MSW composition in Thessaloniki in 2007 (ALAPT , 2007)
At this point it must be noted that these data were based on sampling that was
conducted at the disposal facility (Landfill) after transfer, hence the difference
between average values in Greece (including Attiki) and Thessaloniki.
According to the above table, the BMW fraction is estimated 59% (Putrescibles, Paper
and Wood). However, due to the fact that the sampling conducted under different
conditions, and that the targets set by EC Directives are national, in this study was
used the average value in Greece, that is 70%.
11 Wood – 3,2%
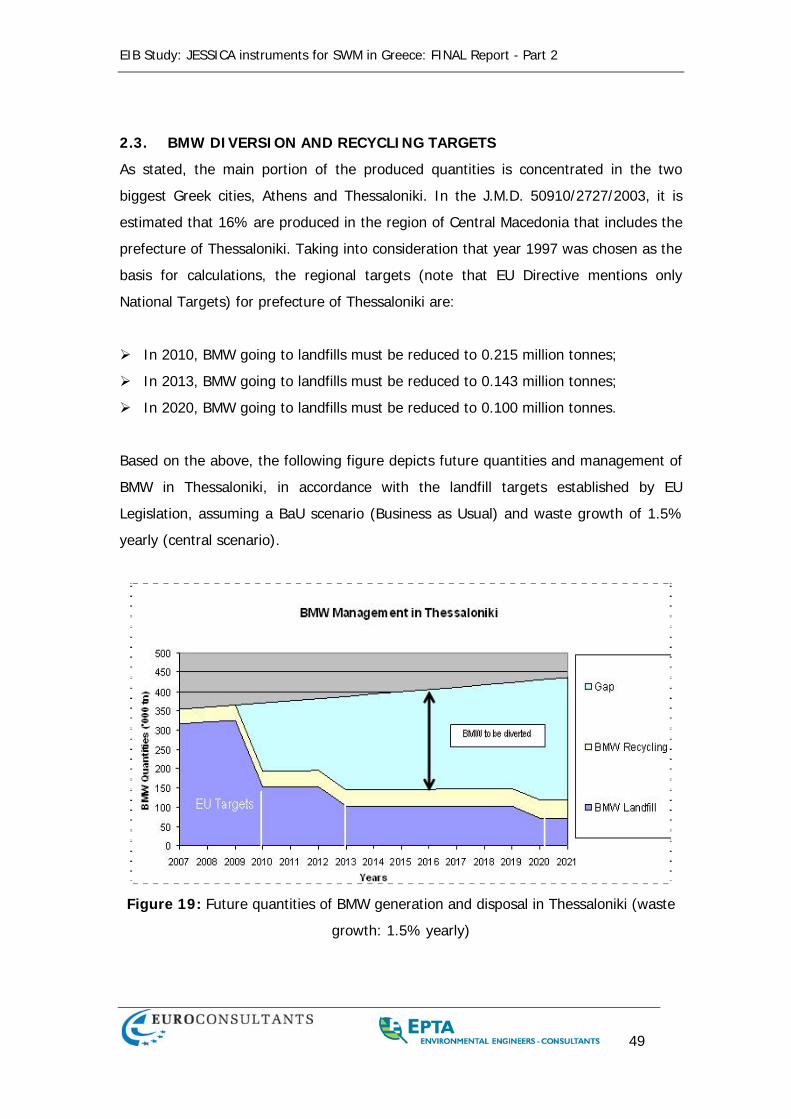
EIB Study: JESSICA instruments for SWM in Greece: FINAL Report - Part 2
49
2.3. BMW DIVERSION AND RECYCLING TARGETS
As stated, the main portion of the produced quantities is concentrated in the two
biggest Greek cities, Athens and Thessaloniki. In the J.M.D. 50910/2727/2003, it is
estimated that 16% are produced in the region of Central Macedonia that includes the
prefecture of Thessaloniki. Taking into consideration that year 1997 was chosen as the
basis for calculations, the regional targets (note that EU Directive mentions only
National Targets) for prefecture of Thessaloniki are:
In 2010, BMW going to landfills must be reduced to 0.215 million tonnes;
In 2013, BMW going to landfills must be reduced to 0.143 million tonnes;
In 2020, BMW going to landfills must be reduced to 0.100 million tonnes.
Based on the above, the following figure depicts future quantities and management of
BMW in Thessaloniki, in accordance with the landfill targets established by EU
Legislation, assuming a BaU scenario (Business as Usual) and waste growth of 1.5%
yearly (central scenario).
Figure 19: Future quantities of BMW generation and disposal in Thessaloniki (waste
growth: 1.5% yearly)
EIB Study: JESSICA instruments for SWM in Greece: FINAL Report - Part 2
50
As for MSW, according to HERRCO, around 40,000 tones of total packaging waste &
print paper were recovered by MSW in Thessaloniki in 2009. Taking into account that
recyclable materials contained in the MSW reaches an average of 50%, and the MSW
generation in 2009 in Thessaloniki was around 640,000, it is estimated that recycling
rate of MSW reached an average of 320,00020,000 = 6.25%. All targets set by EU
Directives are percentages of recyclable waste generation, thus since all MSW
treatment plants under planning will have very strict recyclable sorting requirements,
will be more convenient for the aforementioned targets to be met.
2.4. CURRENT MSW MANAGEMENT
2.4.1. Collection
As stated, for the collection of MSW rolling bins with capacities from 80 to 1700 lt are
used. The collection and transport is carried out by the Municipalities using mainly
press and mill type vehicles.
2.4.2. Transfer
In Thessaloniki nowadays are in operation 3 transfer station out of a total of 7 that are
foreseen by RSWMP. The existing station are in Kalochori, Pylea and Michaniona.
During the next 2 years, the most mature project out of the remaining 4 stations
foreseen by RSWMP, is in Efkarpia (EIA submitted for approval - budget: 6,800,000 €).
The locations of the existing transfer stations are depicted in the next figure.
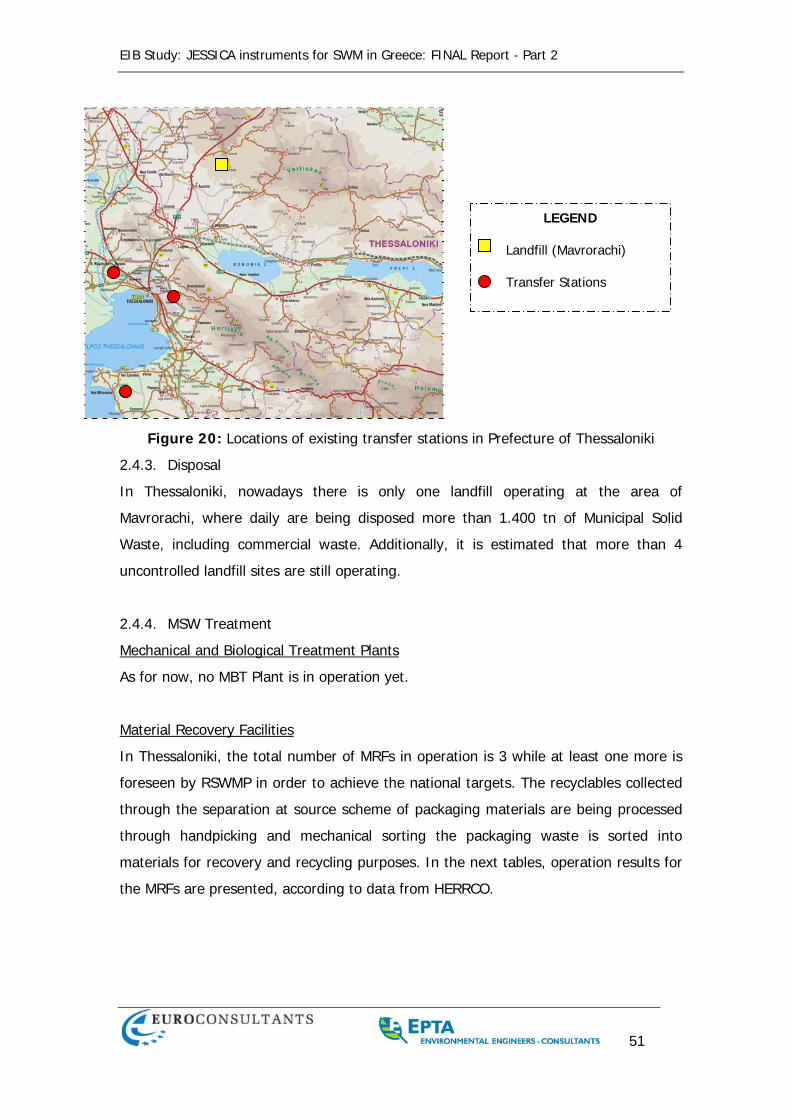
EIB Study: JESSICA instruments for SWM in Greece: FINAL Report - Part 2
51
Figure 20: Locations of existing transfer stations in Prefecture of Thessaloniki
2.4.3. Disposal
In Thessaloniki, nowadays there is only one landfill operating at the area of
Mavrorachi, where daily are being disposed more than 1.400 tn of Municipal Solid
Waste, including commercial waste. Additionally, it is estimated that more than 4
uncontrolled landfill sites are still operating.
2.4.4. MSW Treatment
Mechanical and Biological Treatment Plants
As for now, no MBT Plant is in operation yet.
Material Recovery Facilities
In Thessaloniki, the total number of MRFs in operation is 3 while at least one more is
foreseen by RSWMP in order to achieve the national targets. The recyclables collected
through the separation at source scheme of packaging materials are being processed
through handpicking and mechanical sorting the packaging waste is sorted into
materials for recovery and recycling purposes. In the next tables, operation results for
the MRFs are presented, according to data from HERRCO.
LEGEND
Landfill (Mavrorachi)
Transfer Stations
EIB Study: JESSICA instruments for SWM in Greece: FINAL Report - Part 2
52
Table 31: Results of MRFs operation in Thessaloniki (2008)
Location Population Covered
Number of Bins
Number of Vehicles
Annual Total Packaging Waste & Print Paper Recovery (tones)12
Thermi 208,473 5,271 11 8,429 Kallithea 250,848 3,043 13 3,352
Tagarades 776,881 3,845 12 8,995
2.5. MSW MANAGEMENT FUTURE PLANNING
According to the Regional Plan two treatment units are foreseen for the next years in
Thessaloniki, in order to achieve the quantified targets for diversion of biological
(organic) waste.
MBT – 400,000 tones / annum in Mavrorachi
The first facility under planning is a MBT plant, with a nominal capacity of 400,000
tones / annum. The plant will be constructed near the landfill of Mavrorachi, while the
technology is not selected yet. The project will be financed thought PFI (290,010,000
€). This PPP project involves the design, financing, construction, maintenance, facility
management and operation of the new infrastructure of the integrated waste
management system in the Prefecture for a period of 29 years (4 years construction
and 25 years operation).
More specifically, the private partner will undertake the design, construction,
maintenance and operation of a plant that will treat solid waste of the North-western
unit of the Prefecture. This plant will be composed of a treatment and exploitation unit
and a sanitary landfill. This unit will be constructed upon any proven technology that
can meet the targets set by the Community Directives and the output specifications
set by the Contracting Authority (ALAPT). Moreover the private partner will be given
the right to commercially exploit the output of the unit (such as recyclable products,
biogas, RDF, energy, etc.)
According to the international practice for tendering such projects, the indicative
budget of a waste management PPP project is set at the lower end of the
12 Data from 31/12/08 - The results refer to all Municipalities served by the MRF concerned
EIB Study: JESSICA instruments for SWM in Greece: FINAL Report - Part 2
53
technological solution that according to available data fulfils the national and
community Directives.
It must be noted that the amount of the maximum fee to be imposed to the end users
has been estimated after taking into consideration the public affordability levels. Given
that this amount is not sufficient for the total reimbursement of the project, the State
will undertake the repayment of the remaining part through the Public Investments
Program.
Date of approval by the IM PPP Committee: 30 Jan 2008
Indicative Budget: 242 million euros
(+20% insurance cost and heavy maintenance cost)
Project Duration: 29 years
Construction Period: 4 years
Operation Period: 25 years
Forecasted period of SPV selection: mid 2010
MBT and Waste to Energy (WtE) – 350,000 tones / annum in Aghios Antonios
In Aghios Antonios, a MBT facility (technology in not decided yet) and a Waste to
Energy plant are under planning. MBT plant will treat 350,000 tones per annum and
will produce SRF, which will be burnt in the WtE plant. The budget for both plants,
according to ALAPT is estimated to be 270,000,000€.
MRF – 28,000 tones / annum in Efkarpia
The fourth MRF plant, will be located in Efkarpia and will have a nominal capacity of
28,000 tones per annum. The Environmental Conditions have been recently issued,
while the budget, according to preliminary data is estimated to be 6,000,000 €.
Landfill in Aghios Antonios
Finally, one Landfill in the area of Aghios Antonios, is also under planning (EIA
submitted - estimated budget 9,510,000 €).
The locations of planning, as well as the existing facilities, are depicted on the
following map.
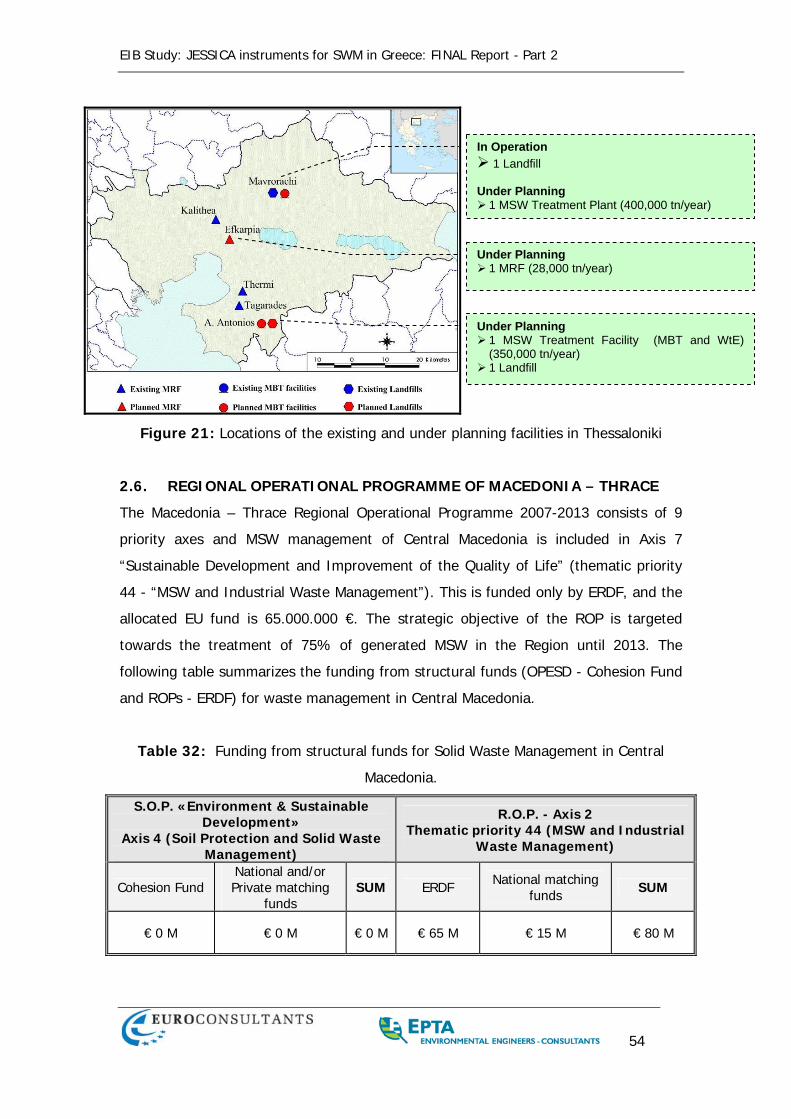
EIB Study: JESSICA instruments for SWM in Greece: FINAL Report - Part 2
54
Figure 21: Locations of the existing and under planning facilities in Thessaloniki
2.6. REGIONAL OPERATIONAL PROGRAMME OF MACEDONIA – THRACE
The Macedonia – Thrace Regional Operational Programme 2007-2013 consists of 9
priority axes and MSW management of Central Macedonia is included in Axis 7
“Sustainable Development and Improvement of the Quality of Life” (thematic priority
44 - “MSW and Industrial Waste Management”). This is funded only by ERDF, and the
allocated EU fund is 65.000.000 €. The strategic objective of the ROP is targeted
towards the treatment of 75% of generated MSW in the Region until 2013. The
following table summarizes the funding from structural funds (OPESD - Cohesion Fund
and ROPs - ERDF) for waste management in Central Macedonia.
Table 32: Funding from structural funds for Solid Waste Management in Central
Macedonia.
S.O.P. «Environment & Sustainable Development»
Axis 4 (Soil Protection and Solid Waste Management)
R.O.P. - Axis 2 Thematic priority 44 (MSW and Industrial
Waste Management)
Cohesion Fund National and/or Private matching
funds SUM ERDF National matching
funds SUM
€ 0 M € 0 M € 0 M € 65 M € 15 M € 80 M
In Operation 1 Landfill
Under Planning
1 MSW Treatment Plant (400,000 tn/year)
Under Planning 1 MRF (28,000 tn/year)
Under Planning 1 MSW Treatment Facility (MBT and WtE) (350,000 tn/year) 1 Landfill
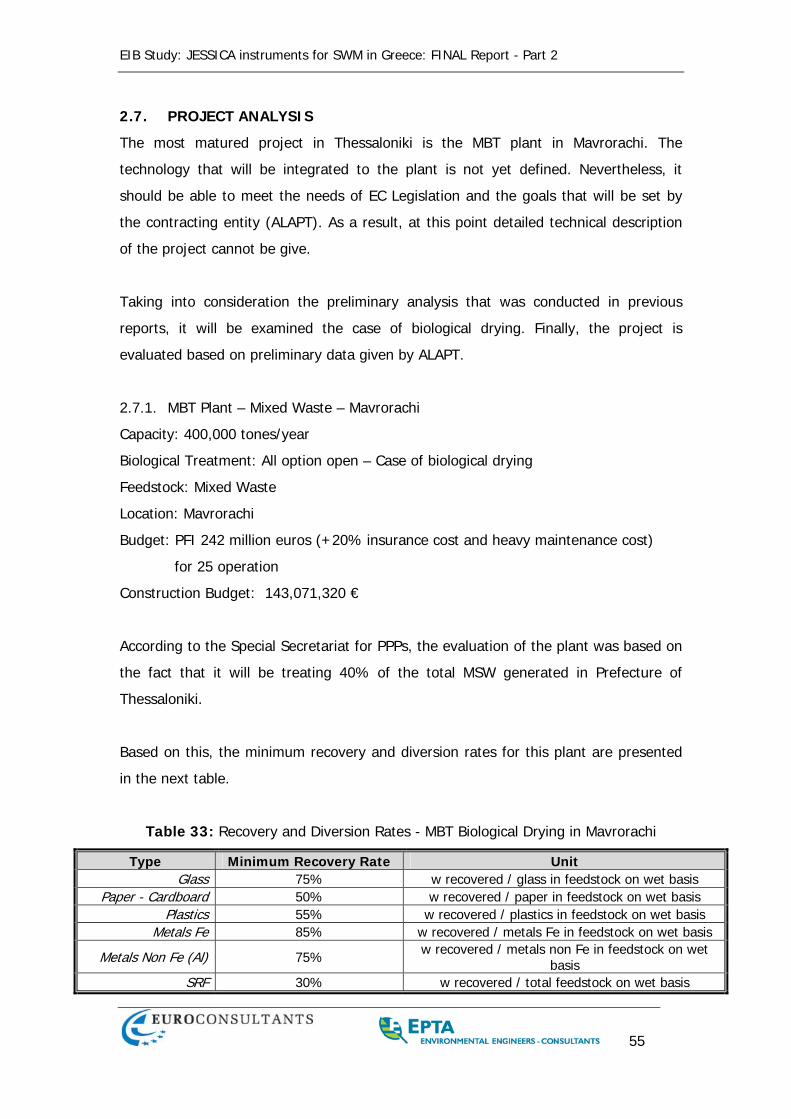
EIB Study: JESSICA instruments for SWM in Greece: FINAL Report - Part 2
55
2.7. PROJECT ANALYSIS
The most matured project in Thessaloniki is the MBT plant in Mavrorachi. The
technology that will be integrated to the plant is not yet defined. Nevertheless, it
should be able to meet the needs of EC Legislation and the goals that will be set by
the contracting entity (ALAPT). As a result, at this point detailed technical description
of the project cannot be give.
Taking into consideration the preliminary analysis that was conducted in previous
reports, it will be examined the case of biological drying. Finally, the project is
evaluated based on preliminary data given by ALAPT.
2.7.1. MBT Plant – Mixed Waste – Mavrorachi
Capacity: 400,000 tones/year
Biological Treatment: All option open – Case of biological drying
Feedstock: Mixed Waste
Location: Mavrorachi
Budget: PFI 242 million euros (+20% insurance cost and heavy maintenance cost)
for 25 operation
Construction Budget: 143,071,320 €
According to the Special Secretariat for PPPs, the evaluation of the plant was based on
the fact that it will be treating 40% of the total MSW generated in Prefecture of
Thessaloniki.
Based on this, the minimum recovery and diversion rates for this plant are presented
in the next table.
Table 33: Recovery and Diversion Rates - MBT Biological Drying in Mavrorachi
Type Minimum Recovery Rate Unit Glass 75% w recovered / glass in feedstock on wet basis
Paper - Cardboard 50% w recovered / paper in feedstock on wet basis Plastics 55% w recovered / plastics in feedstock on wet basis
Metals Fe 85% w recovered / metals Fe in feedstock on wet basis
Metals Non Fe (Al) 75% w recovered / metals non Fe in feedstock on wet basis
SRF 30% w recovered / total feedstock on wet basis
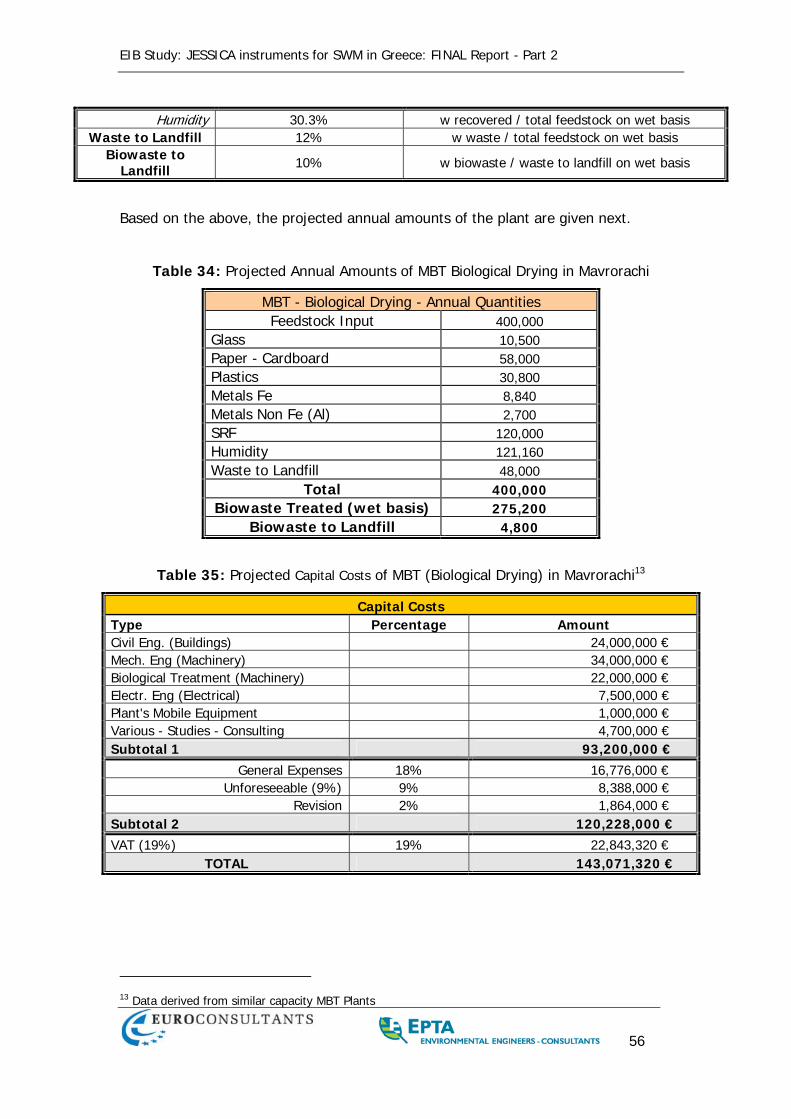
EIB Study: JESSICA instruments for SWM in Greece: FINAL Report - Part 2
56
Humidity 30.3% w recovered / total feedstock on wet basis Waste to Landfill 12% w waste / total feedstock on wet basis
Biowaste to Landfill 10% w biowaste / waste to landfill on wet basis
Based on the above, the projected annual amounts of the plant are given next.
Table 34: Projected Annual Amounts of MBT Biological Drying in Mavrorachi
MBT - Biological Drying - Annual Quantities Feedstock Input 400,000
Glass 10,500 Paper - Cardboard 58,000 Plastics 30,800 Metals Fe 8,840 Metals Non Fe (Al) 2,700 SRF 120,000 Humidity 121,160 Waste to Landfill 48,000
Total 400,000 Biowaste Treated (wet basis) 275,200
Biowaste to Landfill 4,800
Table 35: Projected Capital Costs of MBT (Biological Drying) in Mavrorachi13
Capital Costs Type Percentage Amount Civil Eng. (Buildings) 24,000,000 € Mech. Eng (Machinery) 34,000,000 € Biological Treatment (Machinery) 22,000,000 € Electr. Eng (Electrical) 7,500,000 € Plant's Mobile Equipment 1,000,000 € Various - Studies - Consulting 4,700,000 € Subtotal 1 93,200,000 €
General Expenses 18% 16,776,000 € Unforeseeable (9%) 9% 8,388,000 €
Revision 2% 1,864,000 € Subtotal 2 120,228,000 € VAT (19%) 19% 22,843,320 €
TOTAL 143,071,320 €
13 Data derived from similar capacity MBT Plants
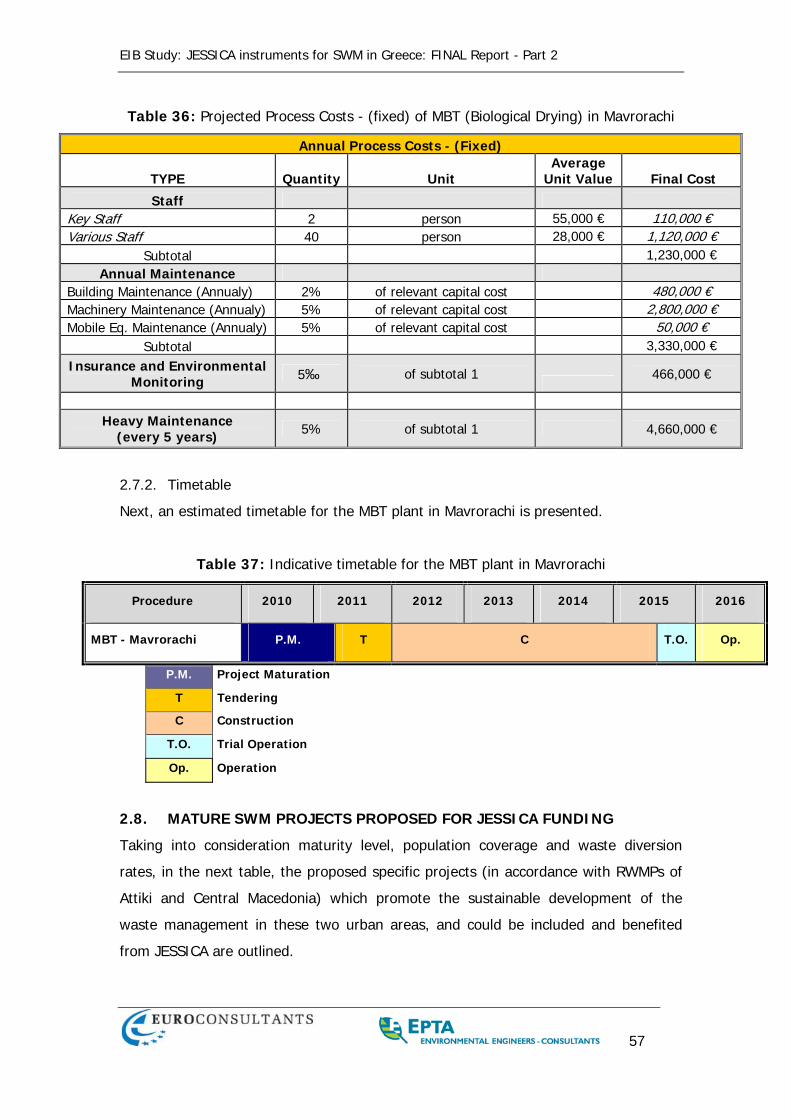
EIB Study: JESSICA instruments for SWM in Greece: FINAL Report - Part 2
57
Table 36: Projected Process Costs - (fixed) of MBT (Biological Drying) in Mavrorachi
Annual Process Costs - (Fixed)
TYPE Quantity Unit Average
Unit Value Final Cost
Staff Key Staff 2 person 55,000 € 110,000 € Various Staff 40 person 28,000 € 1,120,000 €
Subtotal 1,230,000 € Annual Maintenance
Building Maintenance (Annualy) 2% of relevant capital cost 480,000 € Machinery Maintenance (Annualy) 5% of relevant capital cost 2,800,000 € Mobile Eq. Maintenance (Annualy) 5% of relevant capital cost 50,000 €
Subtotal 3,330,000 € Insurance and Environmental
Monitoring 5‰ of subtotal 1
466,000 €
Heavy Maintenance
(every 5 years) 5% of subtotal 1 4,660,000 €
2.7.2. Timetable
Next, an estimated timetable for the MBT plant in Mavrorachi is presented.
Table 37: Indicative timetable for the MBT plant in Mavrorachi
Procedure 2010 2011 2012 2013 2014 2015 2016
MBT - Mavrorachi P.M. T C T.O. Op.
P.M. Project Maturation
T Tendering
C Construction
T.O. Trial Operation
Op. Operation
2.8. MATURE SWM PROJECTS PROPOSED FOR JESSICA FUNDING
Taking into consideration maturity level, population coverage and waste diversion
rates, in the next table, the proposed specific projects (in accordance with RWMPs of
Attiki and Central Macedonia) which promote the sustainable development of the
waste management in these two urban areas, and could be included and benefited
from JESSICA are outlined.
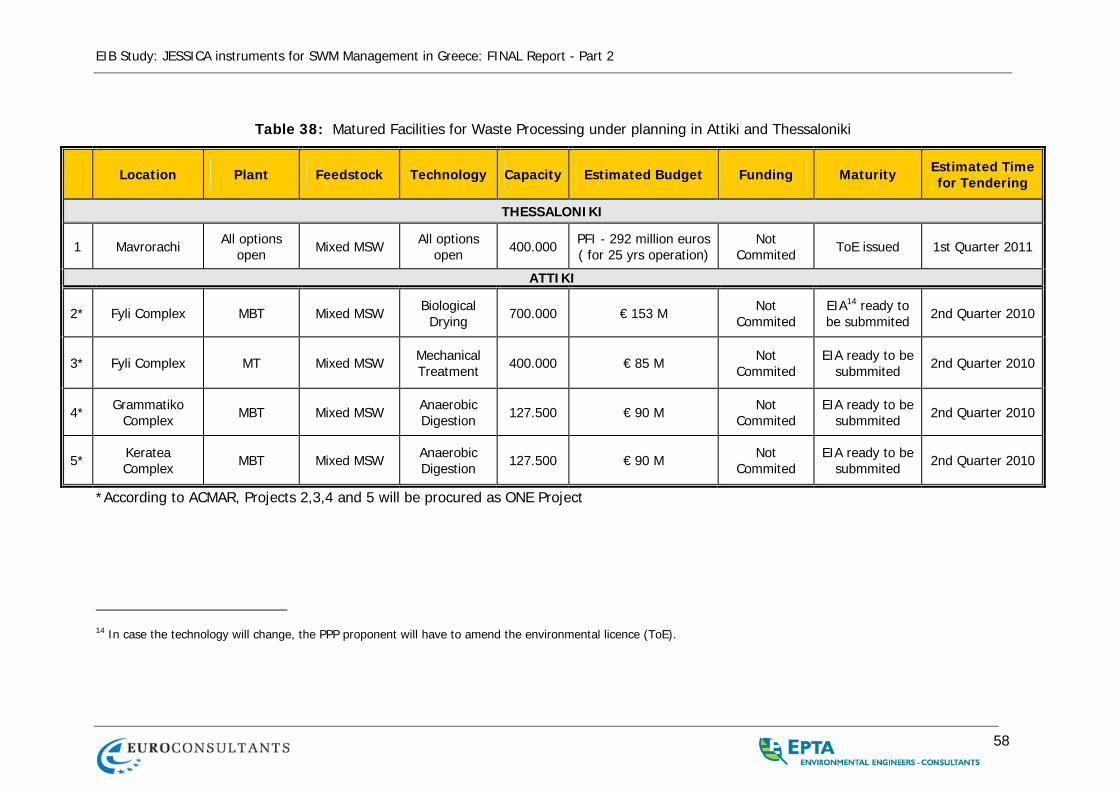
EIB Study: JESSICA instruments for SWM Management in Greece: FINAL Report - Part 2
58
Table 38: Matured Facilities for Waste Processing under planning in Attiki and Thessaloniki
Location Plant Feedstock Technology Capacity Estimated Budget Funding Maturity Estimated Time for Tendering
THESSALONIKI
1 Mavrorachi All options open Mixed MSW All options
open 400.000 PFI - 292 million euros ( for 25 yrs operation)
Not Commited ToE issued 1st Quarter 2011
ATTIKI
2* Fyli Complex MBT Mixed MSW Biological Drying 700.000 € 153 M Not
Commited EIA14 ready to be submmited 2nd Quarter 2010
3* Fyli Complex MT Mixed MSW Mechanical Treatment 400.000 € 85 M Not
Commited EIA ready to be
submmited 2nd Quarter 2010
4* Grammatiko Complex MBT Mixed MSW Anaerobic
Digestion 127.500 € 90 M Not Commited
EIA ready to be submmited 2nd Quarter 2010
5* Keratea Complex MBT Mixed MSW Anaerobic
Digestion 127.500 € 90 M Not Commited
EIA ready to be submmited 2nd Quarter 2010
*According to ACMAR, Projects 2,3,4 and 5 will be procured as ONE Project
14 In case the technology will change, the PPP proponent will have to amend the environmental licence (ToE).
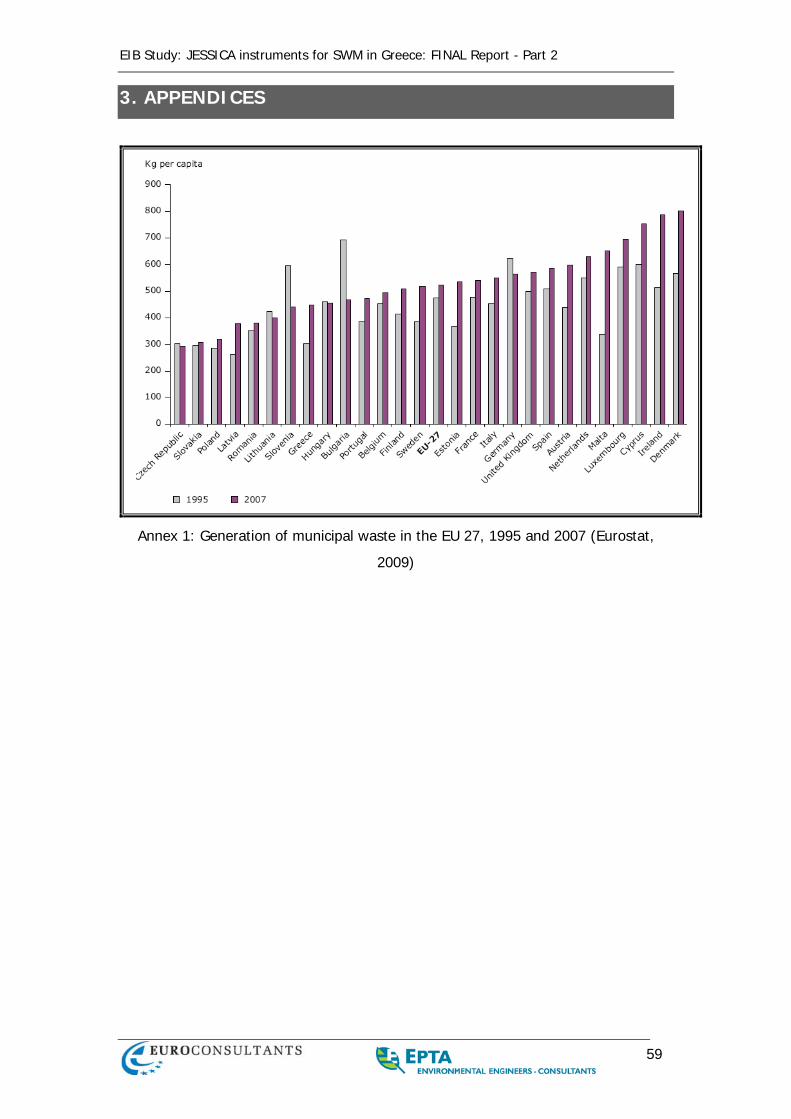
EIB Study: JESSICA instruments for SWM in Greece: FINAL Report - Part 2
59
3. APPENDICES
Annex 1: Generation of municipal waste in the EU 27, 1995 and 2007 (Eurostat,
2009)
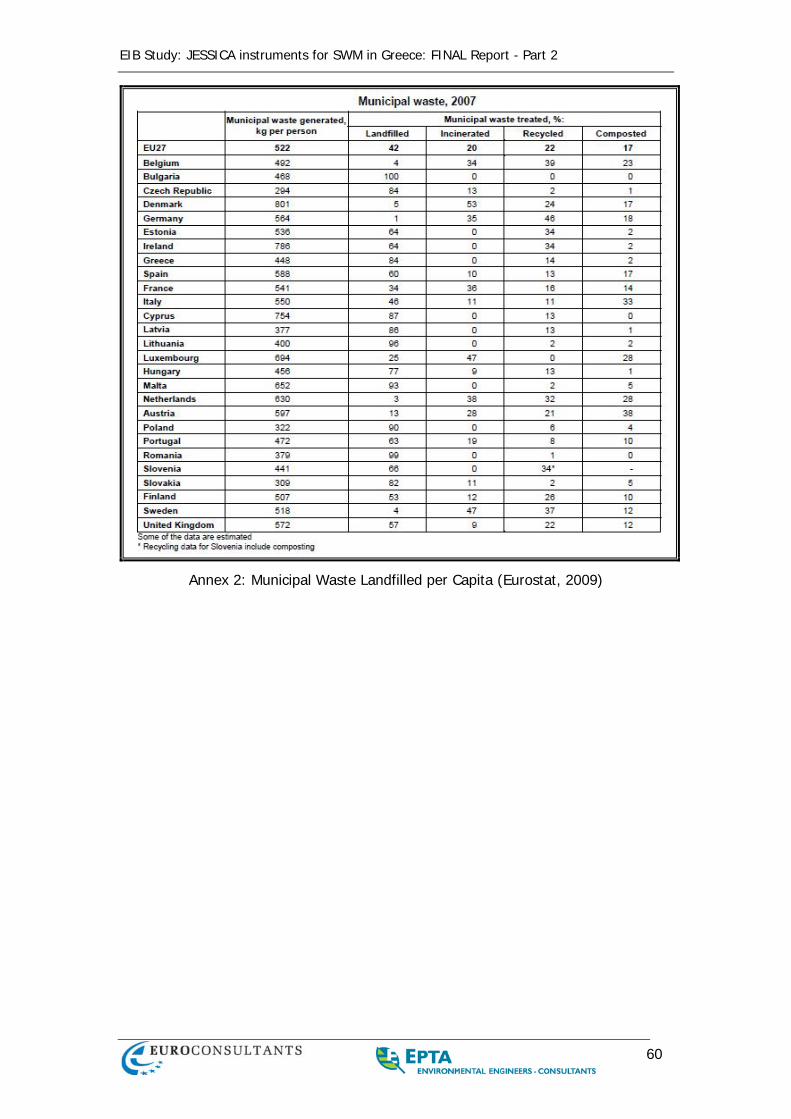
EIB Study: JESSICA instruments for SWM in Greece: FINAL Report - Part 2
60
Annex 2: Municipal Waste Landfilled per Capita (Eurostat, 2009)

JESSICA
JOINT EUROPEAN SUPPORT FOR
SUSTAINABLE INVESTMENT IN CITY AREAS
JESSICA Instruments for Solid Waste Management in Greece
STUDY
Final Report - Part 3
JESSICA SWM Financial Model & Implementation Plan
March 2010
This document has been produced with the financial assistance of the
European Union. The views expressed herein can in no way be taken to reflect the official opinion of the European Union.
EIB Study: JESSICA instruments for SWM Management in Greece: Final Report – Part 3
2
TABLE OF CONTENTS
1. FINANCIAL MODEL ANALYSIS – PROJECT LEVEL.................................................... 6
1.1. Introduction ................................................................................................................ 6 1.2. General Assumptions................................................................................................. 7 1.3. Economic Considerations .......................................................................................... 9 1.4. Scenario 1 – Financial Analysis: JESSICA without Grant instruments..................... 10
1.4.1. Summary – Scenario 1 .......................................................................................... 11 1.4.2. Project 1 – Scenario 1 – Financial Analysis........................................................... 12 1.4.3. Project 2 – Scenario 1 – Financial Analysis........................................................... 14 1.4.4. Project 3 – Scenario 1 – Financial Analysis........................................................... 16 1.4.5. Project 4 – Scenario 1 – Financial Analysis........................................................... 18 1.4.6. Project 5 – Scenario 1 – Financial Analysis........................................................... 20 1.4.7. Combined Projects 1-4 – Financial Analysis.......................................................... 22 1.4.8. Conclusion............................................................................................................. 23
1.5. Scenario 2 – Financial Analysis: JESSICA together with Grant instruments............ 30 1.5.1. Summary ............................................................................................................... 32 1.5.2. Project 1 – Scenario 2 – Financial Analysis........................................................... 33 1.5.3. Project 2 – Scenario 2 – Financial Analysis........................................................... 35 1.5.4. Project 3 – Scenario 2 – Financial Analysis........................................................... 37 1.5.5. Project 4 – Scenario 2 – Financial Analysis........................................................... 39 1.5.6. Project 5 – Scenario 2 – Financial Analysis........................................................... 41 1.5.7. Combined Projects 1-4 – Financial Analysis.......................................................... 43 1.5.8. Conclusion............................................................................................................. 44
1.6. Scenario 3 – Financial Analysis: Grant instruments only ......................................... 48 1.6.1. Summary ............................................................................................................... 49 1.6.2. Project 1 – Scenario 3 – Financial Analysis........................................................... 49 1.6.3. Project 2 – Scenario 3 – Financial Analysis........................................................... 52 1.6.4. Project 3 – Scenario 3 – Financial Analysis........................................................... 54 1.6.5. Project 4 – Scenario 3 – Financial Analysis........................................................... 56 1.6.6. Project 5 – Scenario 3 – Financial Analysis........................................................... 58 1.6.7. Combined Projects 1-4 – Financial Analysis.......................................................... 60 1.6.8. Conclusion............................................................................................................. 61
1.7. Main Conclusions from Scenario Analysis ............................................................... 64
2. JESSICA LEGAL & MANAGEMENT FRAMEWORK ................................................... 66
2.1. LEGAL FRAMEWORK............................................................................................. 66 2.1.1. EU Regulations...................................................................................................... 66 2.1.2. NSRF 2007-13....................................................................................................... 67 2.1.3. Equity Fund Legal Framework............................................................................... 67
2.2. UDF MANAGEMENT............................................................................................... 69
3. JESSICA INTRODUCTION TIMETABLE ...................................................................... 72
EIB Study: JESSICA instruments for SWM Management in Greece: Final Report – Part 3
3
TABLE OF FIGURES Figure 1: General representation of the parties and scenarios involved in JESSICA financing.. 7
Figure 2: Cash Flow - Scenario 1 - Case 1 - Projects 1-4 & 5 - Private Investor Perspective .. 25
Figure 3: Cash Flow - Scenario 1 - Case 1 - Projects 1-4 & 5 - JESSICA Perspective ............ 25
Figure 4: Overview of the expected impact through the implementation of Capital Preservation options ..................................................................................................................................... 27
Figure 5: Overview of the financial models been analyzed for the UDF fund structure in Scenario 1 – Case 1................................................................................................................. 28
Figure 6: Cash Flow - Scenario 1 - Case 2 - Projects 1-4 & 5 - Private Investor Perspective .. 29
Figure 7: Cash Flow - Scenario 1 - Case 2 - Projects 1-4 & 5 - JESSICA Perspective ............ 29
Figure 8: Cash Flow - Scenario 2 - Case 1 - Projects 1-4 & 5 - Private Investor Perspective .. 46
Figure 9: Cash Flow - Scenario 2 - Case 1 - Projects 1-4 & 5 - JESSICA Perspective ............ 46
Figure 10: Cash Flow - Scenario 2 - Case 2 - Projects 1-4 & 5 - Private Investor Perspective 47
Figure 11: Cash Flow - Scenario 2 - Case 2 - Projects 1-4 & 5 - JESSICA Perspective .......... 47
Figure 12: Cash Flow - Scenario 3 - Base Case - Projects 1-4 & 5 - Private Investor Perspective .............................................................................................................................. 63
Figure 13: Proposed UDF Management Organisation ............................................................. 70
Figure 14: Timetable of actions for JESSICA introduction in SWM sector in Greece............... 72
EIB Study: JESSICA instruments for SWM Management in Greece: Final Report – Part 3
4
LIST OF TABLES Table 1: Selected Projects for implementation in Attiki and Thessaloniki Regions..................... 8
Table 2: Scenario 1 – Projects 1-4 & 5 – Project Perspective .................................................. 12
Table 3: Scenario 1 – Project 1 – Project Perspective ............................................................. 12
Table 4: Scenario 1 – Project 1 – Stakeholder Perspective ..................................................... 13
Table 5: Scenario 1 – Project 2 – Project Perspective ............................................................. 14
Table 6: Scenario 1 – Project 2 – Stakeholder Perspective ..................................................... 15
Table 7: Scenario 1 – Project 3 – Project Perspective ............................................................. 16
Table 8: Scenario 1 – Project 3 – Stakeholder Perspective ..................................................... 17
Table 9: Scenario 1 – Project 4 – Project Perspective ............................................................. 18
Table 10: Scenario 1 – Project 4 – Stakeholder Perspective ................................................... 19
Table 11: Scenario 1 – Project 5 – Project Perspective ........................................................... 20
Table 12: Scenario 1 – Project 5 – Stakeholder Perspective ................................................... 21
Table 13: Scenario 1 – Projects 1-4 – Project Perspective ...................................................... 22
Table 14: Scenario 1 – Projects 1-4 – Stakeholder Perspective .............................................. 23
Table 15: Scenario 1 – Projects 1-4 & 5 – Stakeholder Perspective ........................................ 24
Table 16: Scenario 2 – Projects 1-4 & 5 – Project Perspective ................................................ 32
Table 17: Scenario 2 – Project 1 – Project Perspective ........................................................... 33
Table 18: Scenario 2 – Project 1 – Stakeholder Perspective ................................................... 34
Table 19: Scenario 2 – Project 2 – Project Perspective ........................................................... 35
Table 20: Scenario 2 – Project 2 – Stakeholder Perspective ................................................... 36
Table 21: Scenario 2 – Project 3 – Project Perspective ........................................................... 37
Table 22: Scenario 2 – Project 3 – Stakeholder Perspective ................................................... 38
Table 23: Scenario 2 – Project 4 – Project Perspective ........................................................... 39
Table 24: Scenario 2 – Project 4 – Stakeholder Perspective ................................................... 40
Table 25: Scenario 2 – Project 5 – Project Perspective ........................................................... 41
Table 26: Scenario 2 – Project 5 – Stakeholder Perspective ................................................... 42
Table 27: Scenario 2 – Projects 1-4 – Project Perspective ...................................................... 43
Table 28: Scenario 2 – Projects 1-4 – Stakeholder Perspective .............................................. 44
Table 29: Scenario 2 – Projects 1-4 & 5 – Stakeholder Perspective ........................................ 45
Table 30: Scenario 3 – Projects 1-4 & 5 – Project Perspective ................................................ 49
Table 31: Scenario 3 – Project 1 – Project Perspective ........................................................... 50
Table 32: Scenario 3 – Project 1 – Stakeholder Perspective ................................................... 51
EIB Study: JESSICA instruments for SWM Management in Greece: Final Report – Part 3
5
Table 33: Scenario 3 – Project 2 – Project Perspective ........................................................... 52
Table 34: Scenario 3 – Project 2 – Stakeholder Perspective ................................................... 53
Table 35: Scenario 3 – Project 3 – Project Perspective ........................................................... 54
Table 36: Scenario 3 – Project 3 – Stakeholder Perspective ................................................... 55
Table 37: Scenario 3 – Project 4 – Project Perspective ........................................................... 56
Table 38: Scenario 3 – Project 4 – Stakeholder Perspective ................................................... 57
Table 39: Scenario 3 – Project 5 – Project Perspective ........................................................... 58
Table 40: Scenario 3 – Project 5 – Stakeholder Perspective ................................................... 59
Table 41: Scenario 3 – Projects 1-4 – Project Perspective ...................................................... 60
Table 42: Scenario 3 – Projects 1-4 – Stakeholder Perspective .............................................. 61
Table 43: Scenario 3 – Projects 1-4 & 5 – Stakeholder Perspective ........................................ 62
EIB Study: JESSICA instruments for SWM Management in Greece: Final Report – Part 3
6
1. FINANCIAL MODEL ANALYSIS – PROJECT LEVEL 1.1. Introduction
In this chapter we present, a Financial Modeling exercise based on realistic project cases and analysis that could be selected for the initial implementation of the JESSICA Solid Waste Management UDF in Greece. The main objective of this case study is to exemplify different approaches for implementing JESSICA and the UDF, while presenting with actual figures the potential of this initiative and the benefits for the stakeholders on each level. The Financial Modeling logic covers two different levels of JESSICA: Project level and UDF level. Three potential options exist regarding the way that a UDF - Project (SPV) relationship could be established regarding Project funding: (i) JESSICA Equity participation, in the funding of Projects, (ii) JESSICA Loan participation and (iii) and JESSICA Loan + JESSICA Equity participation. This means that the funds provided from the ERDF to the UDF could be used as an equity or loan or equity + loan participation to the projects. A financial institution (bank) will co-finance the projects through a commercial loan along with the UDF and the private investors. A graphical representation of the parties involved is given in Figure 1. According to the above options, financial simulations were performed under three general scenarios: Scenario 1: JESSICA without Grant instruments, Scenario 2: JESSICA together with Grant instruments and Scenario 3: Grant instruments only. Within each scenario, three cases have been simulated: Base Case: no JESSICA involvement, Case 1: JESSICA Equity + Loan participation and Case 2: JESSICA Equity only participation. For Case 1 an extra investigation is carried out referred to as the “Capital Preservation Option”. This has to do with returning the capital (through dividends) to the JESSICA fund involved as soon as that is possible in order to minimize the fund’s exposure and ready new funds for further applications (revolving funding); however, this is achieved to the cost of future earnings for the fund and a lower internal rate of return for JESSICA. At Project Level, 5 different projects that could be implemented through JESSICA participation are examined: Projects 1 – 4 for the Attiki region and Project 5 for the Thessaloniki region. The financial model used here is based on inputs and assumptions. It produces intermediary outputs and (final) results. Inputs: Project inputs are: investment cost, capacity, construction period, types of revenues and operating costs and their respective schedule. Specific UDF perspective inputs mainly concern the management fees and management costs. Intermediate Outputs: The Inputs generate pro-forma Profit & Loss, Cash Flow and Sources & Uses tables which are analyzed for each of the 5 Projects separately and for the UDF Portfolio (5 Projects) as a whole; an intermediary portfolio including only the four projects in Attiki is considered also. Profitability and sustainability from the perspective of the
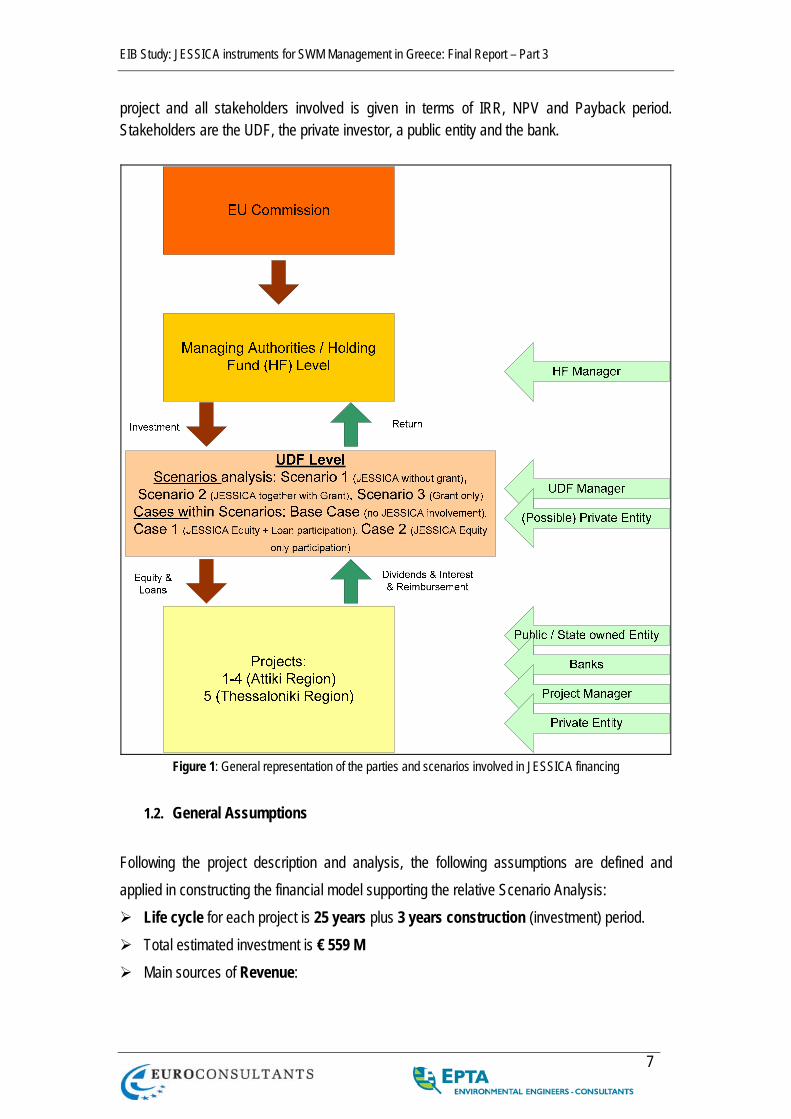
EIB Study: JESSICA instruments for SWM Management in Greece: Final Report – Part 3
7
project and all stakeholders involved is given in terms of IRR, NPV and Payback period. Stakeholders are the UDF, the private investor, a public entity and the bank.
Figure 1: General representation of the parties and scenarios involved in JESSICA financing
1.2. General Assumptions
Following the project description and analysis, the following assumptions are defined and applied in constructing the financial model supporting the relative Scenario Analysis:
Life cycle for each project is 25 years plus 3 years construction (investment) period. Total estimated investment is € 559 M Main sources of Revenue:
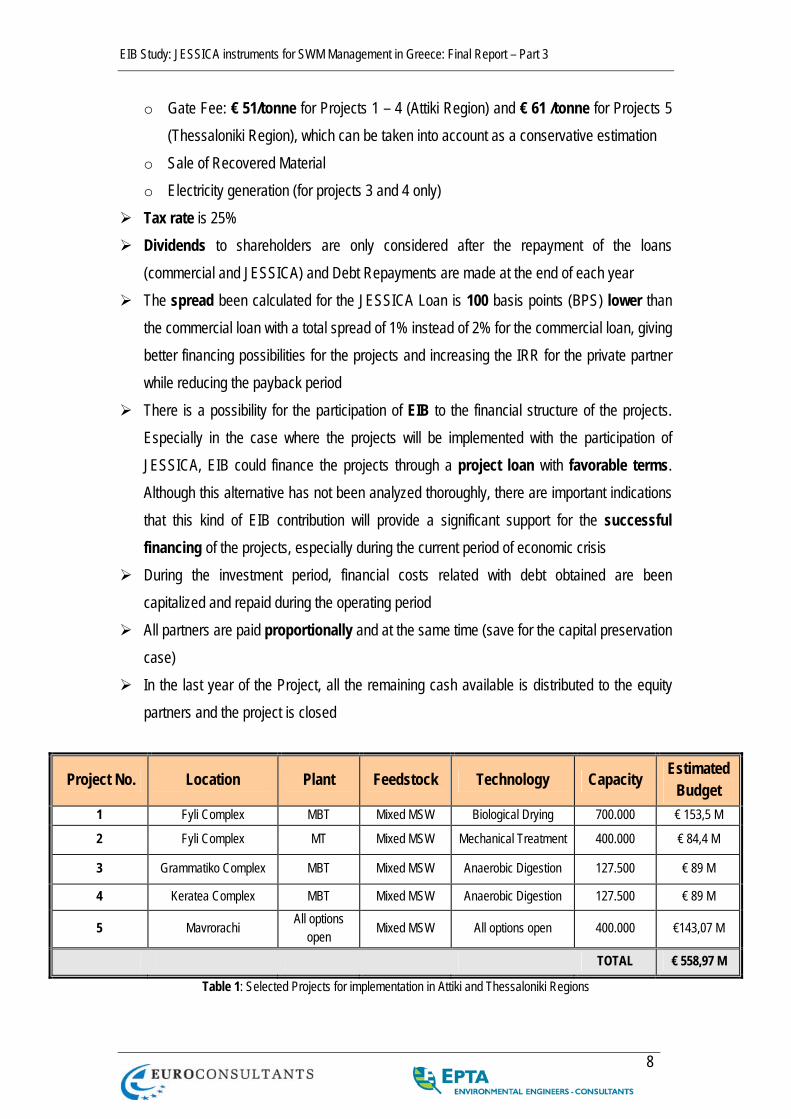
EIB Study: JESSICA instruments for SWM Management in Greece: Final Report – Part 3
8
o Gate Fee: € 51/tonne for Projects 1 – 4 (Attiki Region) and € 61 /tonne for Projects 5 (Thessaloniki Region), which can be taken into account as a conservative estimation
o Sale of Recovered Material o Electricity generation (for projects 3 and 4 only)
Tax rate is 25% Dividends to shareholders are only considered after the repayment of the loans
(commercial and JESSICA) and Debt Repayments are made at the end of each year The spread been calculated for the JESSICA Loan is 100 basis points (BPS) lower than
the commercial loan with a total spread of 1% instead of 2% for the commercial loan, giving better financing possibilities for the projects and increasing the IRR for the private partner while reducing the payback period
There is a possibility for the participation of EIB to the financial structure of the projects. Especially in the case where the projects will be implemented with the participation of JESSICA, EIB could finance the projects through a project loan with favorable terms. Although this alternative has not been analyzed thoroughly, there are important indications that this kind of EIB contribution will provide a significant support for the successful financing of the projects, especially during the current period of economic crisis
During the investment period, financial costs related with debt obtained are been capitalized and repaid during the operating period
All partners are paid proportionally and at the same time (save for the capital preservation case)
In the last year of the Project, all the remaining cash available is distributed to the equity partners and the project is closed
Project No. Location Plant Feedstock Technology Capacity Estimated Budget
1 Fyli Complex MBT Mixed MSW Biological Drying 700.000 € 153,5 M
2 Fyli Complex MT Mixed MSW Mechanical Treatment 400.000 € 84,4 M
3 Grammatiko Complex MBT Mixed MSW Anaerobic Digestion 127.500 € 89 M
4 Keratea Complex MBT Mixed MSW Anaerobic Digestion 127.500 € 89 M
5 Mavrorachi All options open Mixed MSW All options open 400.000 €143,07 M
TOTAL € 558,97 M
Table 1: Selected Projects for implementation in Attiki and Thessaloniki Regions
EIB Study: JESSICA instruments for SWM Management in Greece: Final Report – Part 3
9
1.3. Economic Considerations Overall, the acquisition of detailed cost data regarding MBT facilities is a very difficult, since there is a wide range of capital and operational costs dependent upon the complexity of the technology, the degree of mechanisation and automation employed and more importantly the stability of the secondary products market. Both capital and operating costs were included, based upon specific technologies which may be used in Attiki and Thessaloniki facilities; however there is a variety of factors than can affect the final output such as:
revenues from secondary products (as mentioned, MBT systems are sensitive to the markets and outlets for recycled materials, RDF and soil conditioners that are produced by different processes)
labour costs (employing significant amounts of manual hand-picking could greatly increase overall operating costs)
pollution control systems (i.e. biological drying, even thought is generally a proven process applied in numerous mechanical biological treatment plants in Europe, needs extensive control equipment in order to steer the process effectively)
fuel and electricity prices, competition from other treatment facilities (e.g. recycling) the landfill tax the quality and quantity of material being presented energy costs the final size of the facility and the number of shifts operated at a given facility
Accordingly, gate fees for similar treatment options can vary substantially, both across and within regions. According to WRAP (2008), in the UK the gate fee for an anaerobic digestion plant may vary from £30 to £65 (2008 prices). Furthermore, according to DEFRA (2007), typical MBT operating expenditures using anaerobic process varies from £16 to £59 per tonne, while operating expenditures for aerobic processes may vary from £20 to £59 per tonne (2007 prices). At this point should be also noted that the MBT in Fyli (nominal capacity of 700.000 tn/year) would be the largest MBT facility worldwide, thus no previous data about cost for a plant of this size is available today. Taking all the above into consideration, it is possible that the gate
EIB Study: JESSICA instruments for SWM Management in Greece: Final Report – Part 3
10
fee could reach more than 60 € per tonne, however, despite these variations and difficulties, the ranking of gate fees for all scenarios analyzed in this study was in line with expectations.
1.4. Scenario 1 – Financial Analysis: JESSICA without Grant instruments As far as the Base Case considered, the following assumptions are made:
Funding: o No grant o Equity (25%):
o Public Entity (5%) o Private partner (95%)
o Commercial loan (75%): with a 6% interest rate Case 1 differs from the base case through the use of a JESSICA fund providing both equity and a (somewhat cheaper) loan. In more detail the assumptions made are the following:
Funding: o No grant; o Equity (25%):
o Public Entity (5%) o Private partner
Projects 1 – 4 (67%) Project 5 (60%)
o JESSICA Equity participation Projects 1 – 4 (28%) Project 5 (35%)
o Loan (75%): o Commercial loan with a 6% interest rate
o Project 1 (95%) o Project 2 (93%) o Projects 3 - 4 (92%) o Project 5 (88%)
o JESSICA loan with a 4,5% interest rate o Project 1 (5%)
EIB Study: JESSICA instruments for SWM Management in Greece: Final Report – Part 3
11
o Project 2 (7%) o Projects 3 - 4 (8%) o Project 5 (12%)
An additional Case 2 is considered, where the following adjustments to the assumptions made are undertaken:
Funding: o No grant; o Equity (30%):
o Public Entity (5%) o Private partner
Projects 1 – 4 (55%) Projects 5 (51%)
o JESSICA Equity participation Projects 1 – 4 (40%) Projects 5 (44%)
o Loan (70%): o Commercial loan with a 6% interest rate o No JESSICA loan
1.4.1. Summary – Scenario 1
The specific assumptions regarding the funding structure and project perspective results are summarized, for each case of the Scenario 1, in the following table:
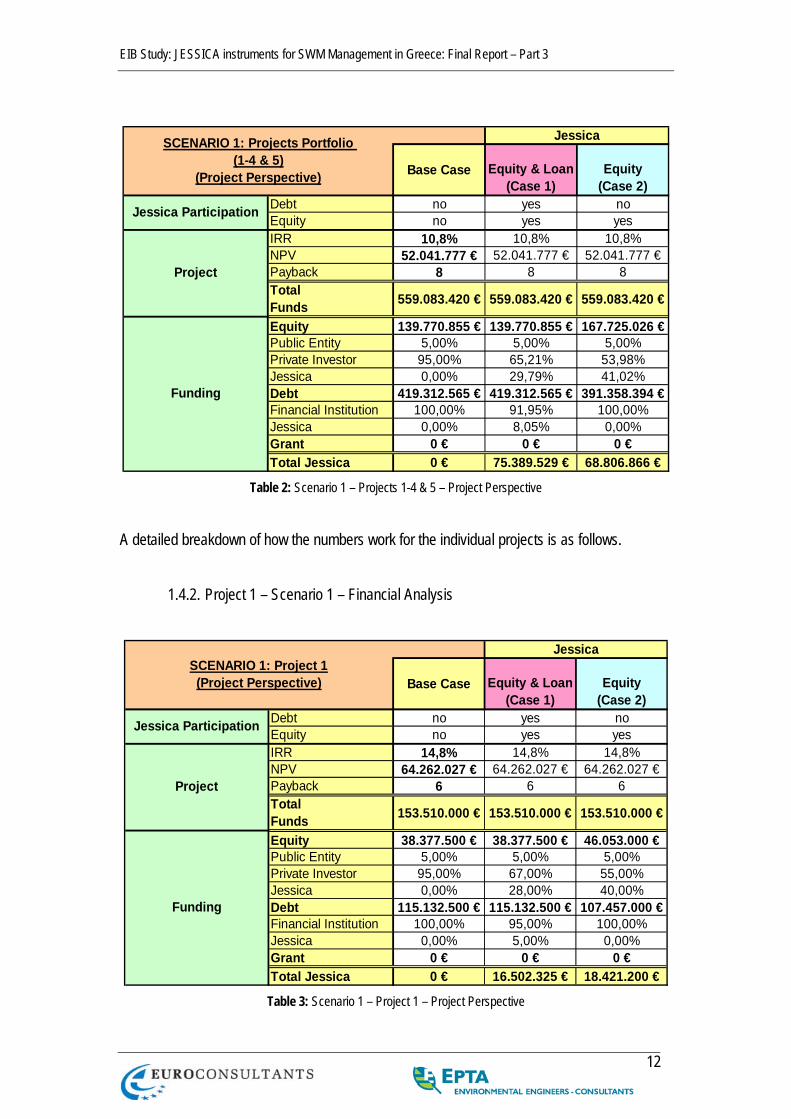
EIB Study: JESSICA instruments for SWM Management in Greece: Final Report – Part 3
12
Base Case Equity & Loan(Case 1)
Equity(Case 2)
Debt no yes noEquity no yes yesIRR 10,8% 10,8% 10,8%NPV 52.041.777 € 52.041.777 € 52.041.777 €Payback 8 8 8TotalFunds 559.083.420 € 559.083.420 € 559.083.420 €
Equity 139.770.855 € 139.770.855 € 167.725.026 €Public Entity 5,00% 5,00% 5,00%Private Investor 95,00% 65,21% 53,98%Jessica 0,00% 29,79% 41,02%Debt 419.312.565 € 419.312.565 € 391.358.394 €Financial Institution 100,00% 91,95% 100,00%Jessica 0,00% 8,05% 0,00%Grant 0 € 0 € 0 €Total Jessica 0 € 75.389.529 € 68.806.866 €
Jessica Participation
Project
Funding
SCENARIO 1: Projects Portfolio (1-4 & 5)
(Project Perspective)
Jessica
Table 2: Scenario 1 – Projects 1-4 & 5 – Project Perspective
A detailed breakdown of how the numbers work for the individual projects is as follows.
1.4.2. Project 1 – Scenario 1 – Financial Analysis
Base Case Equity & Loan(Case 1)
Equity(Case 2)
Debt no yes noEquity no yes yesIRR 14,8% 14,8% 14,8%NPV 64.262.027 € 64.262.027 € 64.262.027 €Payback 6 6 6TotalFunds 153.510.000 € 153.510.000 € 153.510.000 €
Equity 38.377.500 € 38.377.500 € 46.053.000 €Public Entity 5,00% 5,00% 5,00%Private Investor 95,00% 67,00% 55,00%Jessica 0,00% 28,00% 40,00%Debt 115.132.500 € 115.132.500 € 107.457.000 €Financial Institution 100,00% 95,00% 100,00%Jessica 0,00% 5,00% 0,00%Grant 0 € 0 € 0 €Total Jessica 0 € 16.502.325 € 18.421.200 €
Funding
SCENARIO 1: Project 1(Project Perspective)
Jessica
Jessica Participation
Project
Table 3: Scenario 1 – Project 1 – Project Perspective

EIB Study: JESSICA instruments for SWM Management in Greece: Final Report – Part 3
13
Base CaseEquity & Loan
(Case 1)Equity
(Case 2)25:75 25:75 30:70
0 € 0 € 0 €IRR 14,82% 14,82% 14,82%NPV 64.262.027 € 64.262.027 € 64.262.027 €Payback 6 6 6TotalFunds 153.510.000 € 153.510.000 € 153.510.000 €
IRR 37,49% 37,54% 33,32%NPV 103.494.282 € 73.150.688 € 58.674.465 €Payback 2 2 3Funds 36.458.625 € 25.712.925 € 25.329.150 €IRR n/a 84,72% 78,78%NPV n/a 88.314.353 € 73.838.130 €Payback n/a 1 1Funds n/a 25.712.925 € 25.329.150 €IRR 37,49% 37,54% 33,32%NPV 5.447.067 € 5.459.007 € 5.334.042 €Payback 2 2 3Funds 1.918.875 € 1.918.875 € 2.302.650 €IRR n/a 24,59% 28,72%NPV n/a 24.381.131 € 36.292.693 €Payback n/a 4 3Funds n/a 16.502.325 € 18.421.200 €IRR n/a 28,51% 33,32%NPV n/a 28.992.191 € 42.672.338 €Payback n/a 3 3Funds n/a 16.502.325 € 18.421.200 €IRR 6,00% 6,00% 6,00%Payback 20 20 20Funds 115.132.500 € 109.375.875 € 107.457.000 €
Gearing (Equity:Debt)Grant
Project
Private Investor
Private Investor (inc. construction)
Public Entity
Jessica Net retunrs
Jessica Gross retunrs
Financial Institution
SCENARIO 1: Project 1(Stakeholder Perspective)
Jessicawithout Capital Preservation
Table 4: Scenario 1 – Project 1 – Stakeholder Perspective

EIB Study: JESSICA instruments for SWM Management in Greece: Final Report – Part 3
14
1.4.3. Project 2 – Scenario 1 – Financial Analysis
Base Case Equity & Loan(Case 1)
Equity(Case 2)
Debt no yes noEquity no yes yesIRR 16,7% 16,7% 16,7%NPV 51.014.568 € 51.014.568 € 51.014.568 €Payback 5 5 5TotalFunds 84.430.500 € 84.430.500 € 84.430.500 €
Equity 21.107.625 € 21.107.625 € 25.329.150 €Public Entity 5,00% 5,00% 5,00%Private Investor 95,00% 67,00% 55,00%Jessica 0,00% 28,00% 40,00%Debt 63.322.875 € 63.322.875 € 59.101.350 €Financial Institution 100,00% 93,00% 100,00%Jessica 0,00% 7,00% 0,00%Grant 0 € 0 € 0 €Total Jessica 0 € 10.342.736 € 10.131.660 €
Project
Funding
SCENARIO 1: Project 2(Project Perspective)
Jessica
Jessica Participation
Table 5: Scenario 1 – Project 2 – Project Perspective

EIB Study: JESSICA instruments for SWM Management in Greece: Final Report – Part 3
15
Base CaseEquity & Loan
(Case 1)Equity
(Case 2)25:75 25:75 30:70
0 € 0 € 0 €IRR 16,68% 16,68% 16,68%NPV 51.014.568 € 51.014.568 € 51.014.568 €Payback 5 5 5TotalFunds 84.430.500 € 84.430.500 € 84.430.500 €
IRR 41,96% 42,02% 37,40%NPV 72.738.844 € 51.423.715 € 41.406.171 €Payback 2 2 2Funds 20.052.244 € 14.142.109 € 13.931.033 €IRR n/a 90,64% 84,35%NPV n/a 59.860.847 € 49.843.304 €Payback n/a 1 1Funds n/a 14.142.109 € 13.931.033 €IRR 41,96% 42,02% 37,40%NPV 3.828.360 € 3.837.591 € 3.764.197 €Payback 2 2 2Funds 1.055.381 € 1.055.381 € 1.266.458 €IRR n/a 25,81% 33,06%NPV n/a 17.357.575 € 26.604.774 €Payback n/a 3 3Funds n/a 10.342.736 € 10.131.660 €IRR n/a 29,56% 37,40%NPV n/a 20.247.530 € 30.113.579 €Payback n/a 3 2Funds n/a 10.342.736 € 10.131.660 €IRR 6,00% 6,00% 6,00%Payback 20 20 20Funds 63.322.875 € 58.890.274 € 59.101.350 €
SCENARIO 1: Project 2(Stakeholder Perspective)
Jessicawithout Capital Preservation
Gearing (Equity:Debt)Grant
Project
Private Investor
Private Investor (inc. construction)
Public Entity
Jessica Net retunrs
Jessica Gross retunrs
Financial Institution
Table 6: Scenario 1 – Project 2 – Stakeholder Perspective

EIB Study: JESSICA instruments for SWM Management in Greece: Final Report – Part 3
16
1.4.4. Project 3 – Scenario 1 – Financial Analysis
Base Case Equity & Loan(Case 1)
Equity(Case 2)
Debt no yes noEquity no yes yesIRR 2,3% 2,3% 2,3%NPV -38.094.569 € -38.094.569 € -38.094.569 €Payback 18 18 18TotalFunds 89.035.800 € 89.035.800 € 89.035.800 €
Equity 22.258.950 € 22.258.950 € 26.710.740 €Public Entity 5,00% 5,00% 5,00%Private Investor 95,00% 67,00% 55,00%Jessica 0,00% 28,00% 40,00%Debt 66.776.850 € 66.776.850 € 62.325.060 €Financial Institution 100,00% 92,00% 100,00%Jessica 0,00% 8,00% 0,00%Grant 0 € 0 € 0 €Total Jessica 0 € 11.574.654 € 10.684.296 €
Jessica Participation
Project
Funding
SCENARIO 1: Project 3(Project Perspective)
Jessica
Table 7: Scenario 1 – Project 3 – Project Perspective
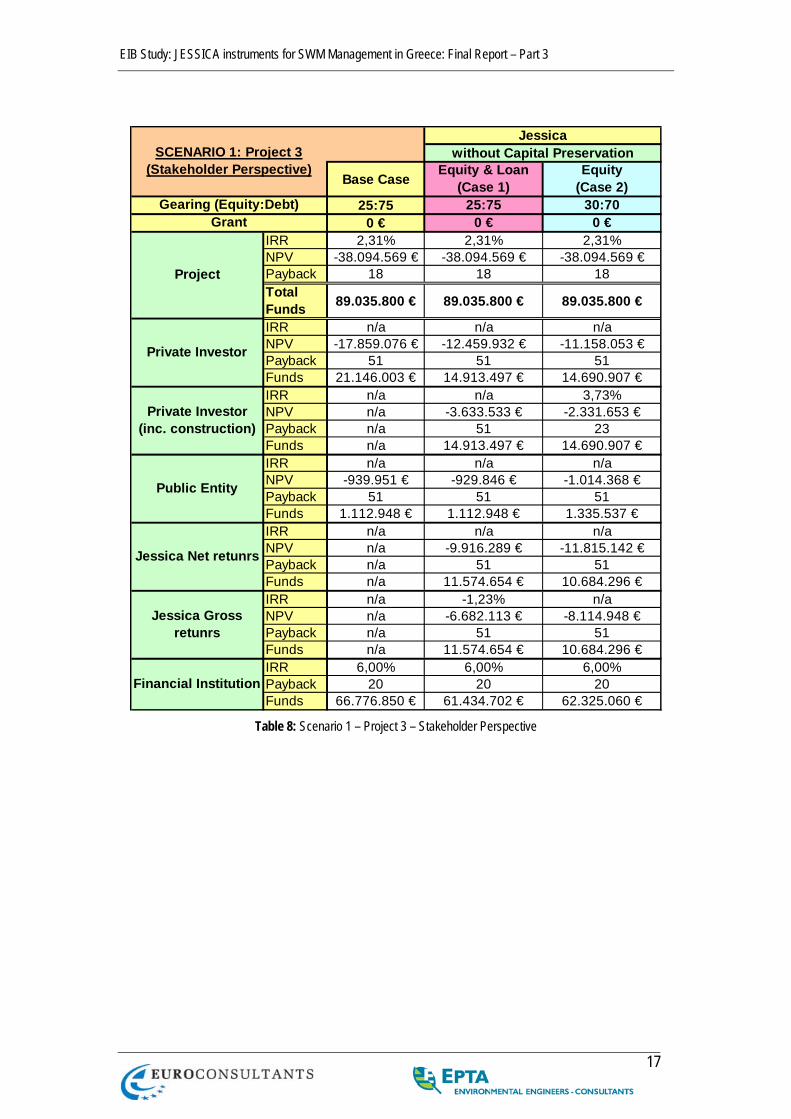
EIB Study: JESSICA instruments for SWM Management in Greece: Final Report – Part 3
17
Base CaseEquity & Loan
(Case 1)Equity
(Case 2)25:75 25:75 30:70
0 € 0 € 0 €IRR 2,31% 2,31% 2,31%NPV -38.094.569 € -38.094.569 € -38.094.569 €Payback 18 18 18TotalFunds 89.035.800 € 89.035.800 € 89.035.800 €
IRR n/a n/a n/aNPV -17.859.076 € -12.459.932 € -11.158.053 €Payback 51 51 51Funds 21.146.003 € 14.913.497 € 14.690.907 €IRR n/a n/a 3,73%NPV n/a -3.633.533 € -2.331.653 €Payback n/a 51 23Funds n/a 14.913.497 € 14.690.907 €IRR n/a n/a n/aNPV -939.951 € -929.846 € -1.014.368 €Payback 51 51 51Funds 1.112.948 € 1.112.948 € 1.335.537 €IRR n/a n/a n/aNPV n/a -9.916.289 € -11.815.142 €Payback n/a 51 51Funds n/a 11.574.654 € 10.684.296 €IRR n/a -1,23% n/aNPV n/a -6.682.113 € -8.114.948 €Payback n/a 51 51Funds n/a 11.574.654 € 10.684.296 €IRR 6,00% 6,00% 6,00%Payback 20 20 20Funds 66.776.850 € 61.434.702 € 62.325.060 €
SCENARIO 1: Project 3(Stakeholder Perspective)
Jessicawithout Capital Preservation
Gearing (Equity:Debt)Grant
Project
Private Investor
Private Investor (inc. construction)
Public Entity
Jessica Net retunrs
Jessica Gross retunrs
Financial Institution
Table 8: Scenario 1 – Project 3 – Stakeholder Perspective
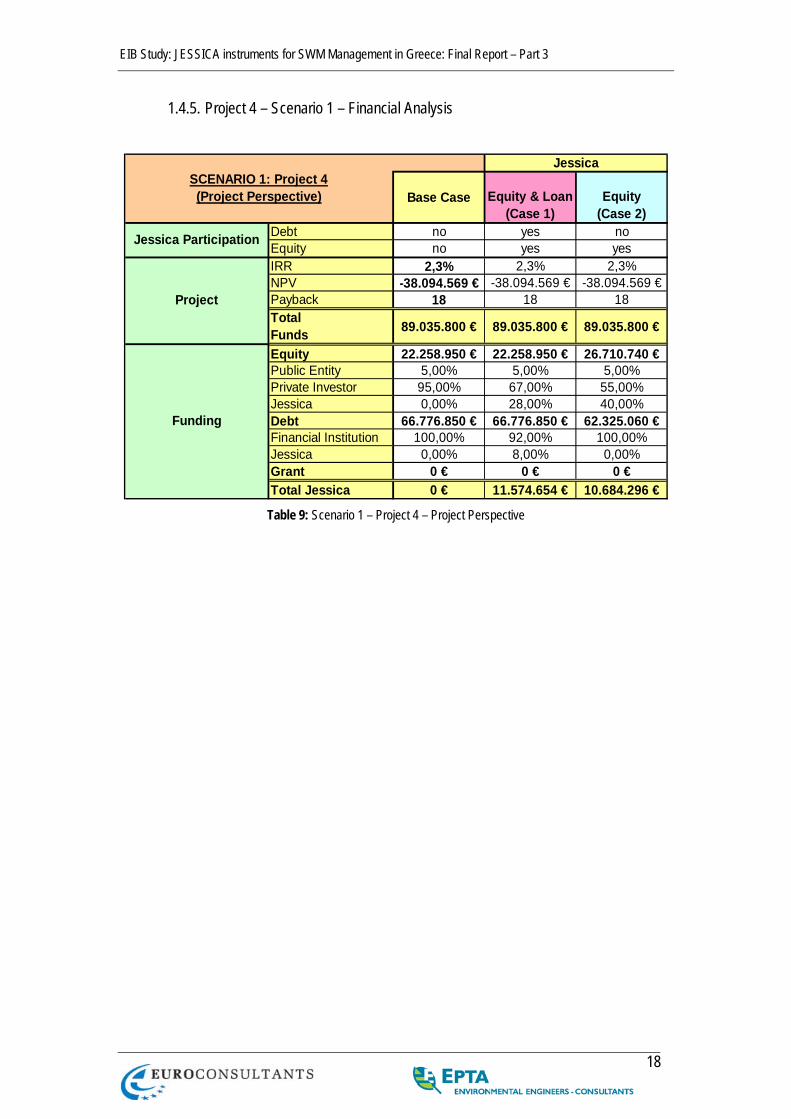
EIB Study: JESSICA instruments for SWM Management in Greece: Final Report – Part 3
18
1.4.5. Project 4 – Scenario 1 – Financial Analysis
Base Case Equity & Loan(Case 1)
Equity(Case 2)
Debt no yes noEquity no yes yesIRR 2,3% 2,3% 2,3%NPV -38.094.569 € -38.094.569 € -38.094.569 €Payback 18 18 18TotalFunds 89.035.800 € 89.035.800 € 89.035.800 €
Equity 22.258.950 € 22.258.950 € 26.710.740 €Public Entity 5,00% 5,00% 5,00%Private Investor 95,00% 67,00% 55,00%Jessica 0,00% 28,00% 40,00%Debt 66.776.850 € 66.776.850 € 62.325.060 €Financial Institution 100,00% 92,00% 100,00%Jessica 0,00% 8,00% 0,00%Grant 0 € 0 € 0 €Total Jessica 0 € 11.574.654 € 10.684.296 €
Jessica
Jessica Participation
Project
Funding
SCENARIO 1: Project 4(Project Perspective)
Table 9: Scenario 1 – Project 4 – Project Perspective

EIB Study: JESSICA instruments for SWM Management in Greece: Final Report – Part 3
19
Base CaseEquity & Loan
(Case 1)Equity
(Case 2)25:75 25:75 30:70
0 € 0 € 0 €IRR 2,31% 2,31% 2,31%NPV -38.094.569 € -38.094.569 € -38.094.569 €Payback 18 18 18TotalFunds 89.035.800 € 89.035.800 € 89.035.800 €
IRR n/a n/a n/aNPV -17.859.076 € -12.459.932 € -11.158.053 €Payback 51 51 51Funds 21.146.003 € 14.913.497 € 14.690.907 €IRR n/a n/a 3,73%NPV n/a -3.633.533 € -2.331.653 €Payback n/a 51 23Funds n/a 14.913.497 € 14.690.907 €IRR n/a n/a n/aNPV -939.951 € -929.846 € -1.014.368 €Payback 51 51 51Funds 1.112.948 € 1.112.948 € 1.335.537 €IRR n/a n/a n/aNPV n/a -9.916.289 € -11.815.142 €Payback n/a 51 51Funds n/a 11.574.654 € 10.684.296 €IRR n/a -1,23% n/aNPV n/a -6.682.113 € -8.114.948 €Payback n/a 51 51Funds n/a 11.574.654 € 10.684.296 €IRR 6,00% 6,00% 6,00%Payback 20 20 20Funds 66.776.850 € 61.434.702 € 62.325.060 €
SCENARIO 1: Project 4(Stakeholder Perspective)
Jessicawithout Capital Preservation
Gearing (Equity:Debt)Grant
Project
Private Investor
Private Investor (inc. construction)
Public Entity
Jessica Net retunrs
Jessica Gross retunrs
Financial Institution
Table 10: Scenario 1 – Project 4 – Stakeholder Perspective
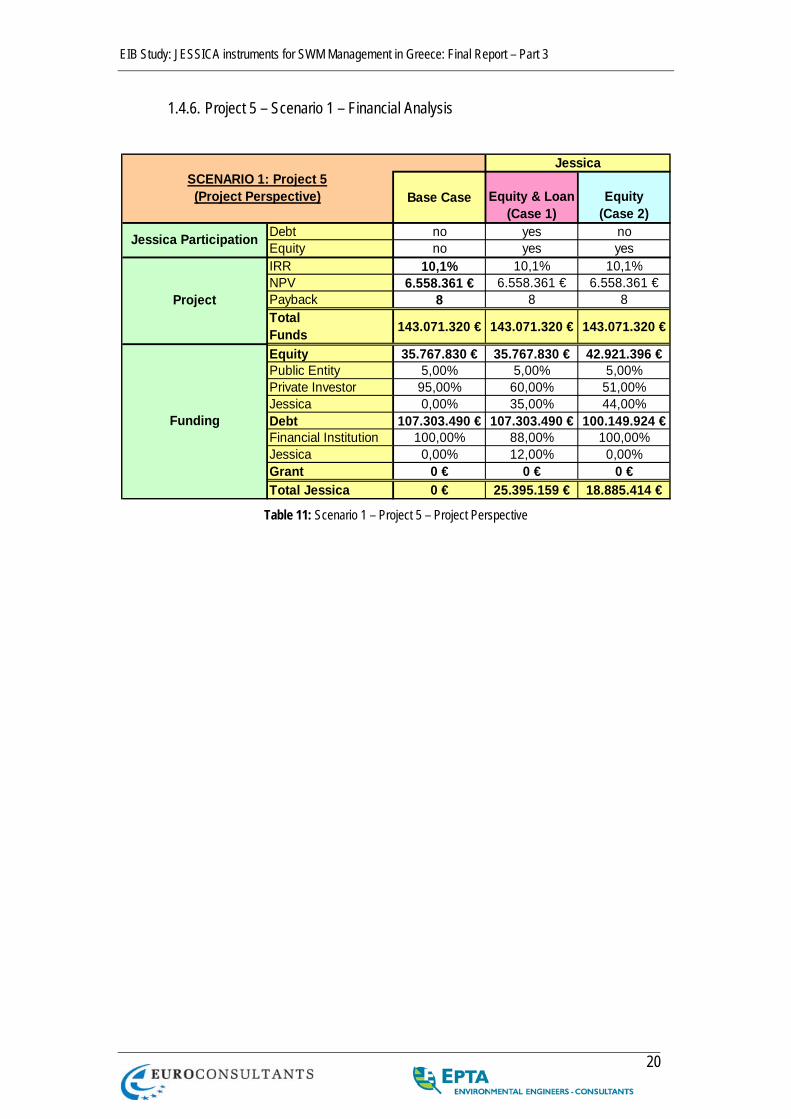
EIB Study: JESSICA instruments for SWM Management in Greece: Final Report – Part 3
20
1.4.6. Project 5 – Scenario 1 – Financial Analysis
Base Case Equity & Loan(Case 1)
Equity(Case 2)
Debt no yes noEquity no yes yesIRR 10,1% 10,1% 10,1%NPV 6.558.361 € 6.558.361 € 6.558.361 €Payback 8 8 8TotalFunds 143.071.320 € 143.071.320 € 143.071.320 €
Equity 35.767.830 € 35.767.830 € 42.921.396 €Public Entity 5,00% 5,00% 5,00%Private Investor 95,00% 60,00% 51,00%Jessica 0,00% 35,00% 44,00%Debt 107.303.490 € 107.303.490 € 100.149.924 €Financial Institution 100,00% 88,00% 100,00%Jessica 0,00% 12,00% 0,00%Grant 0 € 0 € 0 €Total Jessica 0 € 25.395.159 € 18.885.414 €
Funding
SCENARIO 1: Project 5(Project Perspective)
Jessica
Jessica Participation
Project
Table 11: Scenario 1 – Project 5 – Project Perspective

EIB Study: JESSICA instruments for SWM Management in Greece: Final Report – Part 3
21
Base CaseEquity & Loan
(Case 1)Equity
(Case 2)25:75 25:75 30:70
0 € 0 € 0 €IRR 10,14% 10,14% 10,14%NPV 6.558.361 € 6.558.361 € 6.558.361 €Payback 8 8 8TotalFunds 143.071.320 € 143.071.320 € 143.071.320 €
IRR 23,41% 23,60% 21,00%NPV 42.053.025 € 26.948.962 € 21.676.077 €Payback 4 4 4Funds 33.979.439 € 21.460.698 € 21.889.912 €IRR n/a 73,48% 64,37%NPV n/a 41.080.665 € 35.807.780 €Payback n/a 1 1Funds n/a 21.460.698 € 21.889.912 €IRR 23,41% 23,60% 21,00%NPV 2.213.317 € 2.245.747 € 2.125.106 €Payback 4 4 4Funds 1.788.392 € 1.788.392 € 2.146.070 €IRR n/a 11,86% 16,48%NPV n/a 5.094.542 € 12.160.517 €Payback n/a 8 6Funds n/a 25.395.159 € 18.885.414 €IRR n/a 15,53% 21,00%NPV n/a 12.190.427 € 18.700.929 €Payback n/a 6 4Funds n/a 25.395.159 € 18.885.414 €IRR 6,00% 6,00% 6,00%Payback 20 20 20Funds 107.303.490 € 94.427.071 € 100.149.924 €
SCENARIO 1: Project 5(Stakeholder Perspective)
Jessicawithout Capital Preservation
Gearing (Equity:Debt)Grant
Project
Private Investor
Private Investor (inc. construction)
Public Entity
Jessica Net retunrs
Jessica Gross retunrs
Financial Institution
Table 12: Scenario 1 – Project 5 – Stakeholder Perspective
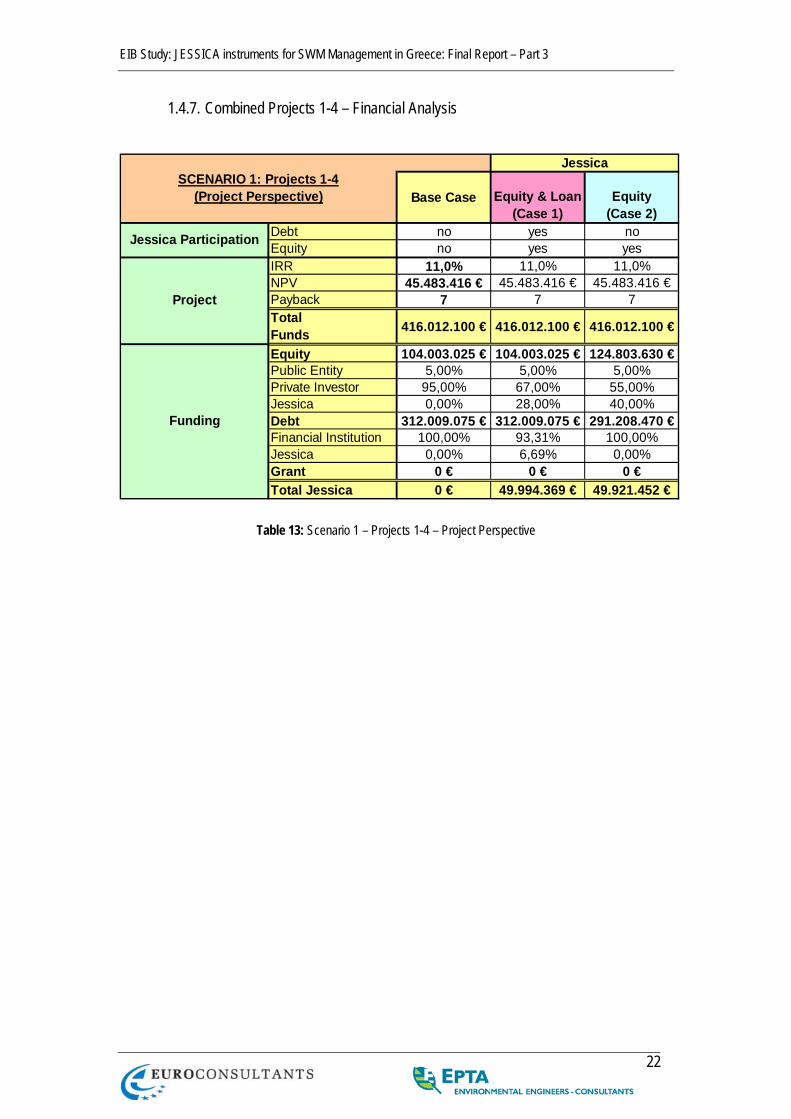
EIB Study: JESSICA instruments for SWM Management in Greece: Final Report – Part 3
22
1.4.7. Combined Projects 1-4 – Financial Analysis
Base Case Equity & Loan(Case 1)
Equity(Case 2)
Debt no yes noEquity no yes yesIRR 11,0% 11,0% 11,0%NPV 45.483.416 € 45.483.416 € 45.483.416 €Payback 7 7 7TotalFunds 416.012.100 € 416.012.100 € 416.012.100 €
Equity 104.003.025 € 104.003.025 € 124.803.630 €Public Entity 5,00% 5,00% 5,00%Private Investor 95,00% 67,00% 55,00%Jessica 0,00% 28,00% 40,00%Debt 312.009.075 € 312.009.075 € 291.208.470 €Financial Institution 100,00% 93,31% 100,00%Jessica 0,00% 6,69% 0,00%Grant 0 € 0 € 0 €Total Jessica 0 € 49.994.369 € 49.921.452 €
Project
Funding
SCENARIO 1: Projects 1-4(Project Perspective)
Jessica
Jessica Participation
Table 13: Scenario 1 – Projects 1-4 – Project Perspective
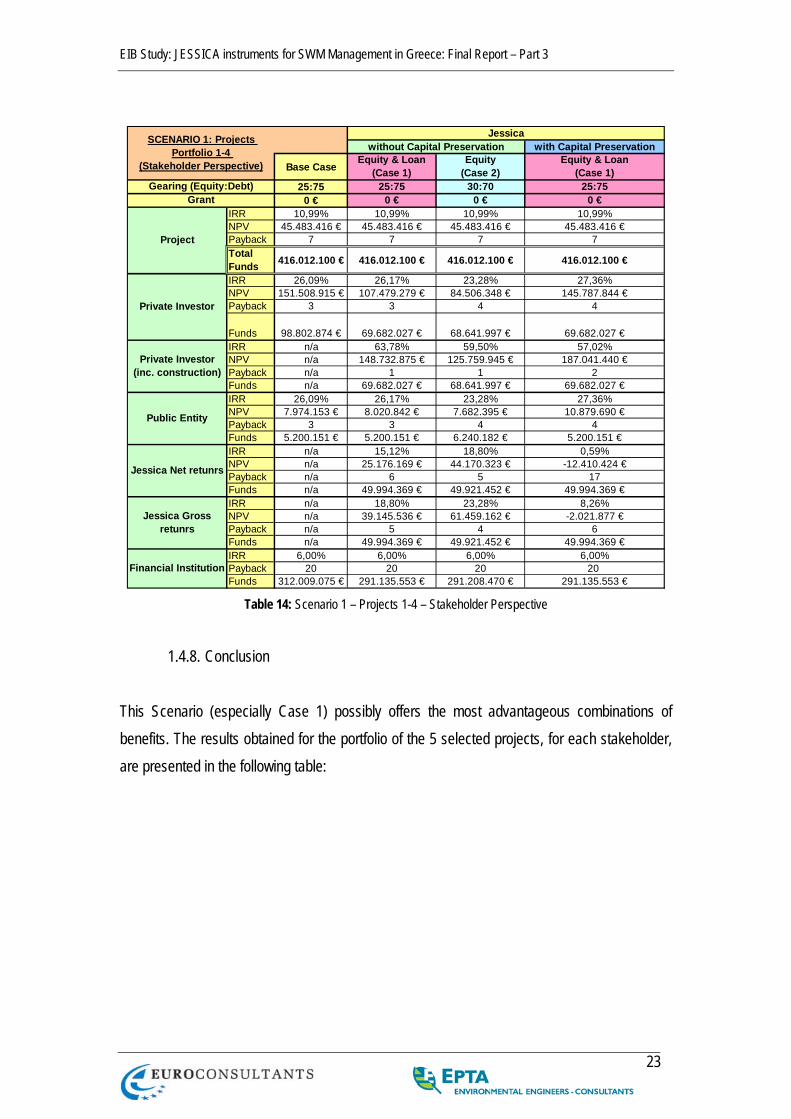
EIB Study: JESSICA instruments for SWM Management in Greece: Final Report – Part 3
23
with Capital Preservation
Base CaseEquity & Loan
(Case 1)Equity
(Case 2)Equity & Loan
(Case 1)25:75 25:75 30:70 25:75
0 € 0 € 0 € 0 €IRR 10,99% 10,99% 10,99% 10,99%NPV 45.483.416 € 45.483.416 € 45.483.416 € 45.483.416 €Payback 7 7 7 7TotalFunds 416.012.100 € 416.012.100 € 416.012.100 € 416.012.100 €
IRR 26,09% 26,17% 23,28% 27,36%NPV 151.508.915 € 107.479.279 € 84.506.348 € 145.787.844 €Payback 3 3 4 4
Funds 98.802.874 € 69.682.027 € 68.641.997 € 69.682.027 €IRR n/a 63,78% 59,50% 57,02%NPV n/a 148.732.875 € 125.759.945 € 187.041.440 €Payback n/a 1 1 2Funds n/a 69.682.027 € 68.641.997 € 69.682.027 €IRR 26,09% 26,17% 23,28% 27,36%NPV 7.974.153 € 8.020.842 € 7.682.395 € 10.879.690 €Payback 3 3 4 4Funds 5.200.151 € 5.200.151 € 6.240.182 € 5.200.151 €IRR n/a 15,12% 18,80% 0,59%NPV n/a 25.176.169 € 44.170.323 € -12.410.424 €Payback n/a 6 5 17Funds n/a 49.994.369 € 49.921.452 € 49.994.369 €IRR n/a 18,80% 23,28% 8,26%NPV n/a 39.145.536 € 61.459.162 € -2.021.877 €Payback n/a 5 4 6Funds n/a 49.994.369 € 49.921.452 € 49.994.369 €IRR 6,00% 6,00% 6,00% 6,00%Payback 20 20 20 20Funds 312.009.075 € 291.135.553 € 291.208.470 € 291.135.553 €
SCENARIO 1: Projects Portfolio 1-4
(Stakeholder Perspective)
Jessicawithout Capital Preservation
Gearing (Equity:Debt)Grant
Project
Private Investor
Private Investor (inc. construction)
Public Entity
Jessica Net retunrs
Jessica Gross retunrs
Financial Institution
Table 14: Scenario 1 – Projects 1-4 – Stakeholder Perspective
1.4.8. Conclusion
This Scenario (especially Case 1) possibly offers the most advantageous combinations of benefits. The results obtained for the portfolio of the 5 selected projects, for each stakeholder, are presented in the following table:
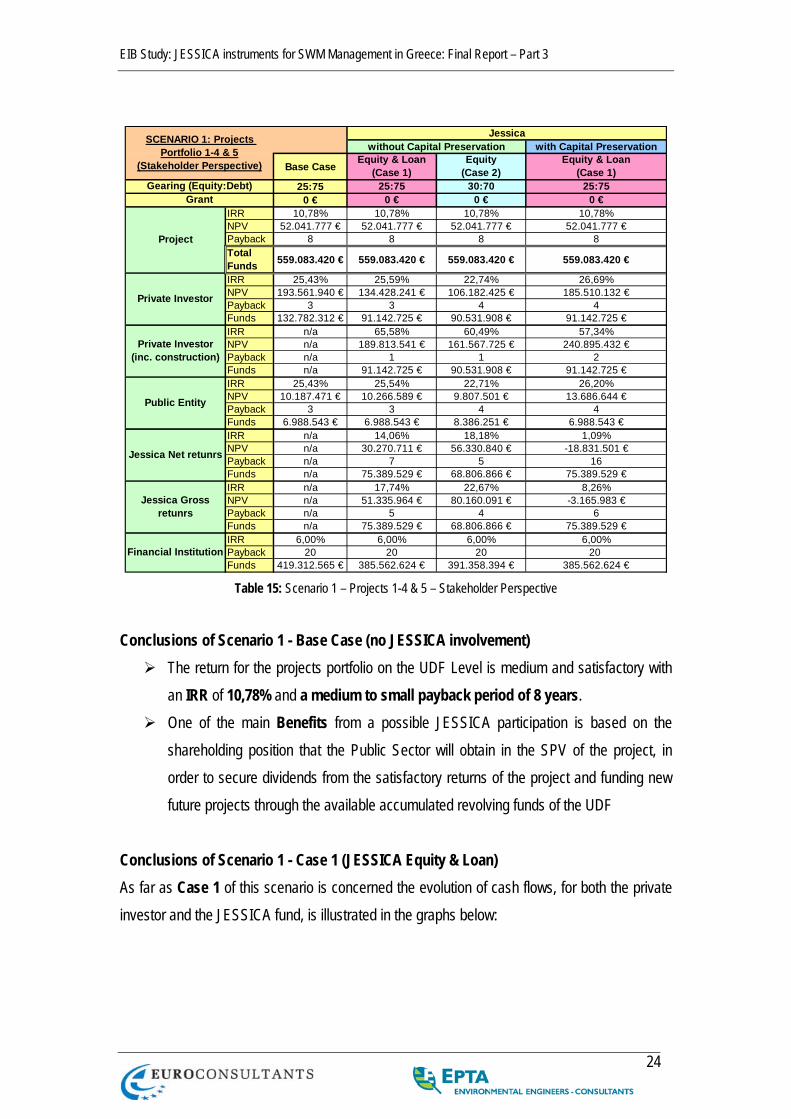
EIB Study: JESSICA instruments for SWM Management in Greece: Final Report – Part 3
24
with Capital Preservation
Base CaseEquity & Loan
(Case 1)Equity
(Case 2)Equity & Loan
(Case 1)25:75 25:75 30:70 25:75
0 € 0 € 0 € 0 €IRR 10,78% 10,78% 10,78% 10,78%NPV 52.041.777 € 52.041.777 € 52.041.777 € 52.041.777 €Payback 8 8 8 8TotalFunds 559.083.420 € 559.083.420 € 559.083.420 € 559.083.420 €
IRR 25,43% 25,59% 22,74% 26,69%NPV 193.561.940 € 134.428.241 € 106.182.425 € 185.510.132 €Payback 3 3 4 4Funds 132.782.312 € 91.142.725 € 90.531.908 € 91.142.725 €IRR n/a 65,58% 60,49% 57,34%NPV n/a 189.813.541 € 161.567.725 € 240.895.432 €Payback n/a 1 1 2Funds n/a 91.142.725 € 90.531.908 € 91.142.725 €IRR 25,43% 25,54% 22,71% 26,20%NPV 10.187.471 € 10.266.589 € 9.807.501 € 13.686.644 €Payback 3 3 4 4Funds 6.988.543 € 6.988.543 € 8.386.251 € 6.988.543 €IRR n/a 14,06% 18,18% 1,09%NPV n/a 30.270.711 € 56.330.840 € -18.831.501 €Payback n/a 7 5 16Funds n/a 75.389.529 € 68.806.866 € 75.389.529 €IRR n/a 17,74% 22,67% 8,26%NPV n/a 51.335.964 € 80.160.091 € -3.165.983 €Payback n/a 5 4 6Funds n/a 75.389.529 € 68.806.866 € 75.389.529 €IRR 6,00% 6,00% 6,00% 6,00%Payback 20 20 20 20Funds 419.312.565 € 385.562.624 € 391.358.394 € 385.562.624 €
SCENARIO 1: Projects Portfolio 1-4 & 5
(Stakeholder Perspective)
Jessicawithout Capital Preservation
Gearing (Equity:Debt)Grant
Project
Private Investor
Private Investor (inc. construction)
Public Entity
Jessica Net retunrs
Jessica Gross retunrs
Financial Institution
Table 15: Scenario 1 – Projects 1-4 & 5 – Stakeholder Perspective
Conclusions of Scenario 1 - Base Case (no JESSICA involvement)
The return for the projects portfolio on the UDF Level is medium and satisfactory with an IRR of 10,78% and a medium to small payback period of 8 years.
One of the main Benefits from a possible JESSICA participation is based on the shareholding position that the Public Sector will obtain in the SPV of the project, in order to secure dividends from the satisfactory returns of the project and funding new future projects through the available accumulated revolving funds of the UDF
Conclusions of Scenario 1 - Case 1 (JESSICA Equity & Loan) As far as Case 1 of this scenario is concerned the evolution of cash flows, for both the private investor and the JESSICA fund, is illustrated in the graphs below:
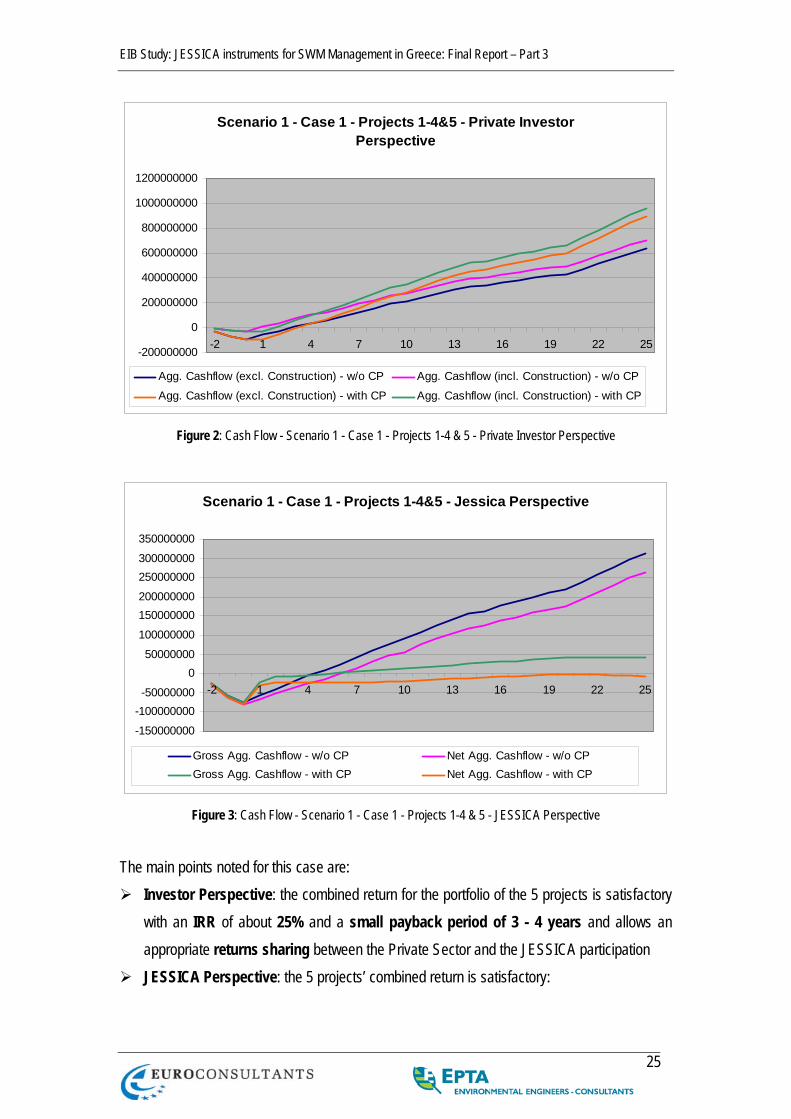
EIB Study: JESSICA instruments for SWM Management in Greece: Final Report – Part 3
25
Scenario 1 - Case 1 - Projects 1-4&5 - Private Investor Perspective
-200000000
0
200000000
400000000
600000000
800000000
1000000000
1200000000
-2 1 4 7 10 13 16 19 22 25
Agg. Cashflow (excl. Construction) - w/o CP Agg. Cashflow (incl. Construction) - w/o CPAgg. Cashflow (excl. Construction) - with CP Agg. Cashflow (incl. Construction) - with CP
Figure 2: Cash Flow - Scenario 1 - Case 1 - Projects 1-4 & 5 - Private Investor Perspective
Scenario 1 - Case 1 - Projects 1-4&5 - Jessica Perspective
-150000000-100000000-50000000
050000000
100000000150000000200000000250000000300000000350000000
-2 1 4 7 10 13 16 19 22 25
Gross Agg. Cashflow - w/o CP Net Agg. Cashflow - w/o CPGross Agg. Cashflow - with CP Net Agg. Cashflow - with CP
Figure 3: Cash Flow - Scenario 1 - Case 1 - Projects 1-4 & 5 - JESSICA Perspective
The main points noted for this case are:
Investor Perspective: the combined return for the portfolio of the 5 projects is satisfactory with an IRR of about 25% and a small payback period of 3 - 4 years and allows an appropriate returns sharing between the Private Sector and the JESSICA participation
JESSICA Perspective: the 5 projects’ combined return is satisfactory:
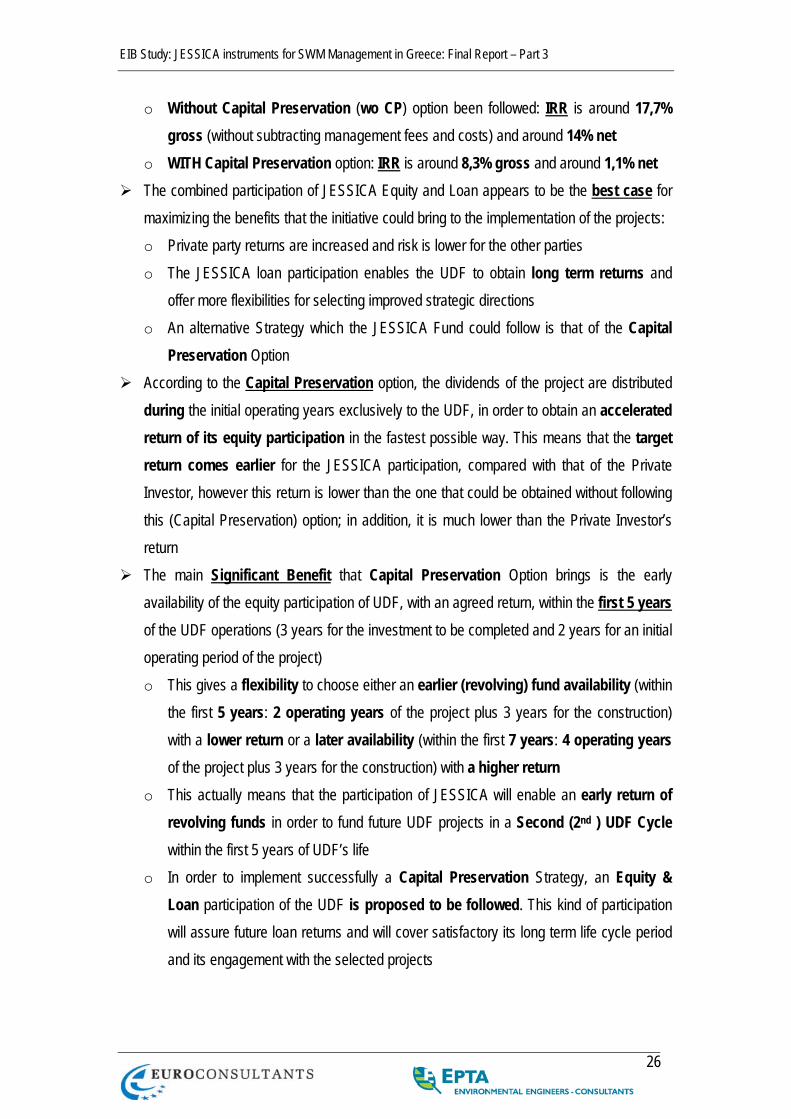
EIB Study: JESSICA instruments for SWM Management in Greece: Final Report – Part 3
26
o Without Capital Preservation (wo CP) option been followed: IRR is around 17,7% gross (without subtracting management fees and costs) and around 14% net
o WITH Capital Preservation option: IRR is around 8,3% gross and around 1,1% net The combined participation of JESSICA Equity and Loan appears to be the best case for
maximizing the benefits that the initiative could bring to the implementation of the projects: o Private party returns are increased and risk is lower for the other parties o The JESSICA loan participation enables the UDF to obtain long term returns and
offer more flexibilities for selecting improved strategic directions o An alternative Strategy which the JESSICA Fund could follow is that of the Capital
Preservation Option According to the Capital Preservation option, the dividends of the project are distributed
during the initial operating years exclusively to the UDF, in order to obtain an accelerated return of its equity participation in the fastest possible way. This means that the target return comes earlier for the JESSICA participation, compared with that of the Private Investor, however this return is lower than the one that could be obtained without following this (Capital Preservation) option; in addition, it is much lower than the Private Investor’s return
The main Significant Benefit that Capital Preservation Option brings is the early availability of the equity participation of UDF, with an agreed return, within the first 5 years of the UDF operations (3 years for the investment to be completed and 2 years for an initial operating period of the project) o This gives a flexibility to choose either an earlier (revolving) fund availability (within
the first 5 years: 2 operating years of the project plus 3 years for the construction) with a lower return or a later availability (within the first 7 years: 4 operating years of the project plus 3 years for the construction) with a higher return
o This actually means that the participation of JESSICA will enable an early return of revolving funds in order to fund future UDF projects in a Second (2nd ) UDF Cycle within the first 5 years of UDF’s life
o In order to implement successfully a Capital Preservation Strategy, an Equity & Loan participation of the UDF is proposed to be followed. This kind of participation will assure future loan returns and will cover satisfactory its long term life cycle period and its engagement with the selected projects
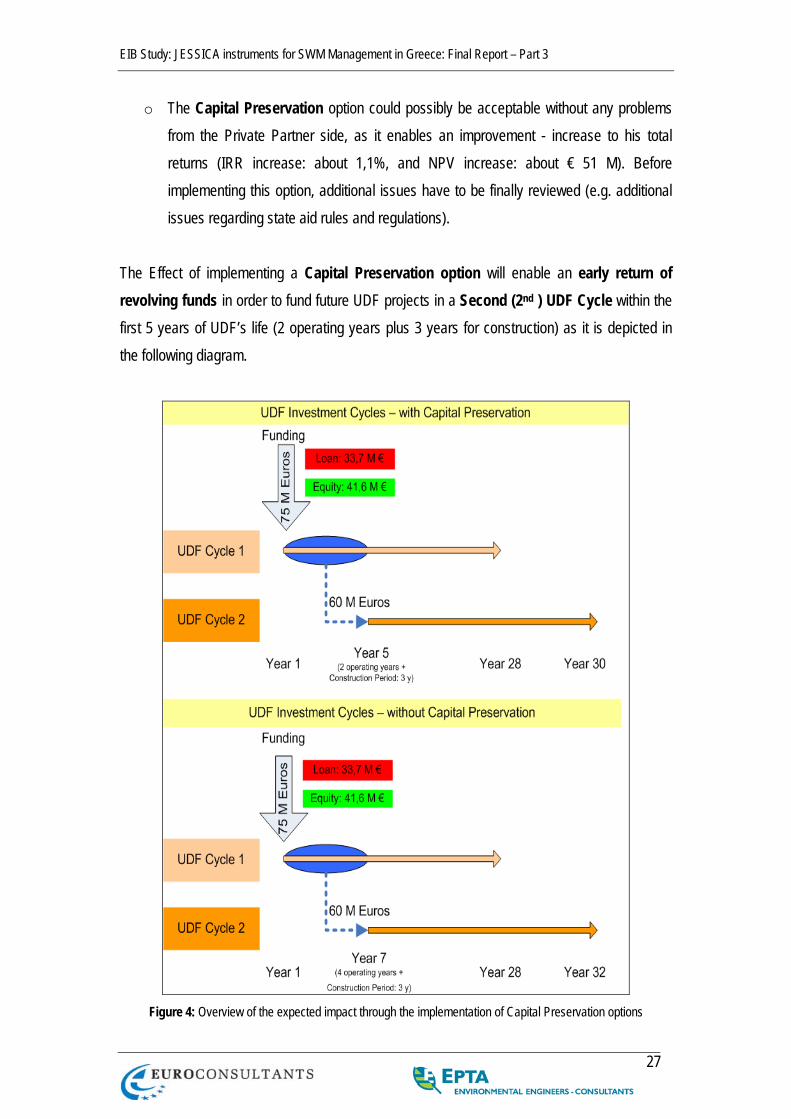
EIB Study: JESSICA instruments for SWM Management in Greece: Final Report – Part 3
27
o The Capital Preservation option could possibly be acceptable without any problems from the Private Partner side, as it enables an improvement - increase to his total returns (IRR increase: about 1,1%, and NPV increase: about € 51 M). Before implementing this option, additional issues have to be finally reviewed (e.g. additional issues regarding state aid rules and regulations).
The Effect of implementing a Capital Preservation option will enable an early return of revolving funds in order to fund future UDF projects in a Second (2nd ) UDF Cycle within the first 5 years of UDF’s life (2 operating years plus 3 years for construction) as it is depicted in the following diagram.
Figure 4: Overview of the expected impact through the implementation of Capital Preservation options
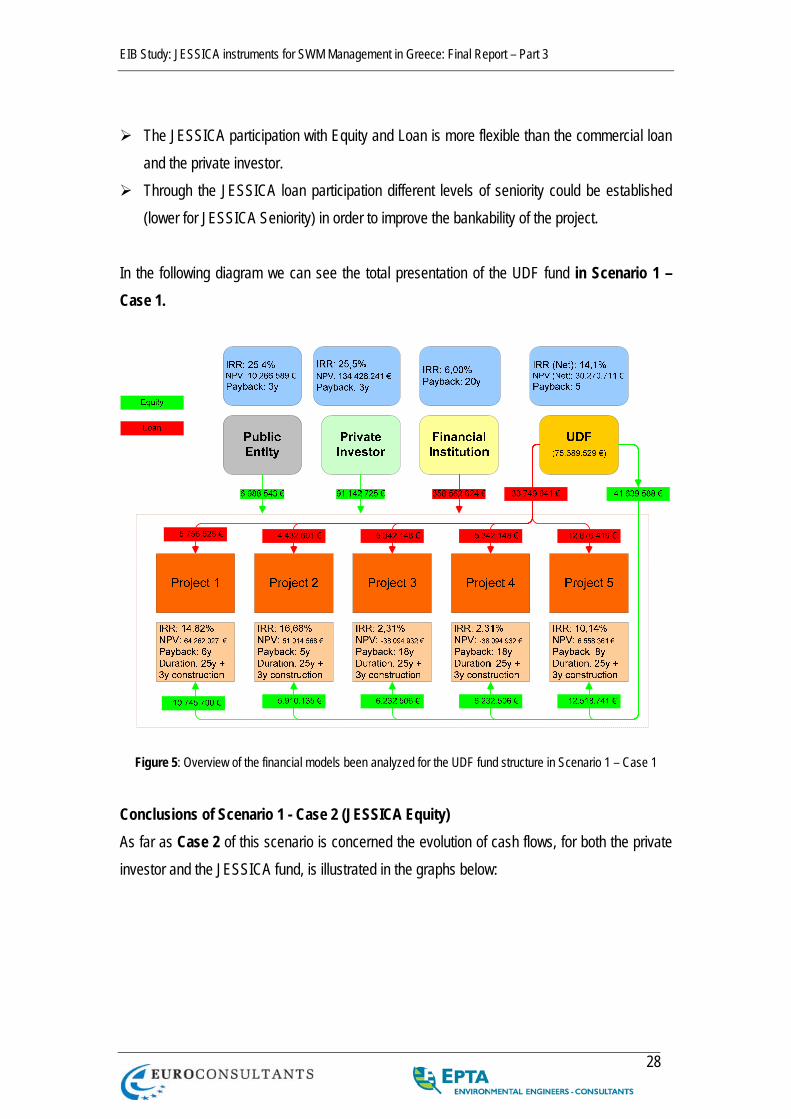
EIB Study: JESSICA instruments for SWM Management in Greece: Final Report – Part 3
28
The JESSICA participation with Equity and Loan is more flexible than the commercial loan
and the private investor. Through the JESSICA loan participation different levels of seniority could be established
(lower for JESSICA Seniority) in order to improve the bankability of the project. In the following diagram we can see the total presentation of the UDF fund in Scenario 1 – Case 1.
Figure 5: Overview of the financial models been analyzed for the UDF fund structure in Scenario 1 – Case 1
Conclusions of Scenario 1 - Case 2 (JESSICA Equity) As far as Case 2 of this scenario is concerned the evolution of cash flows, for both the private investor and the JESSICA fund, is illustrated in the graphs below:
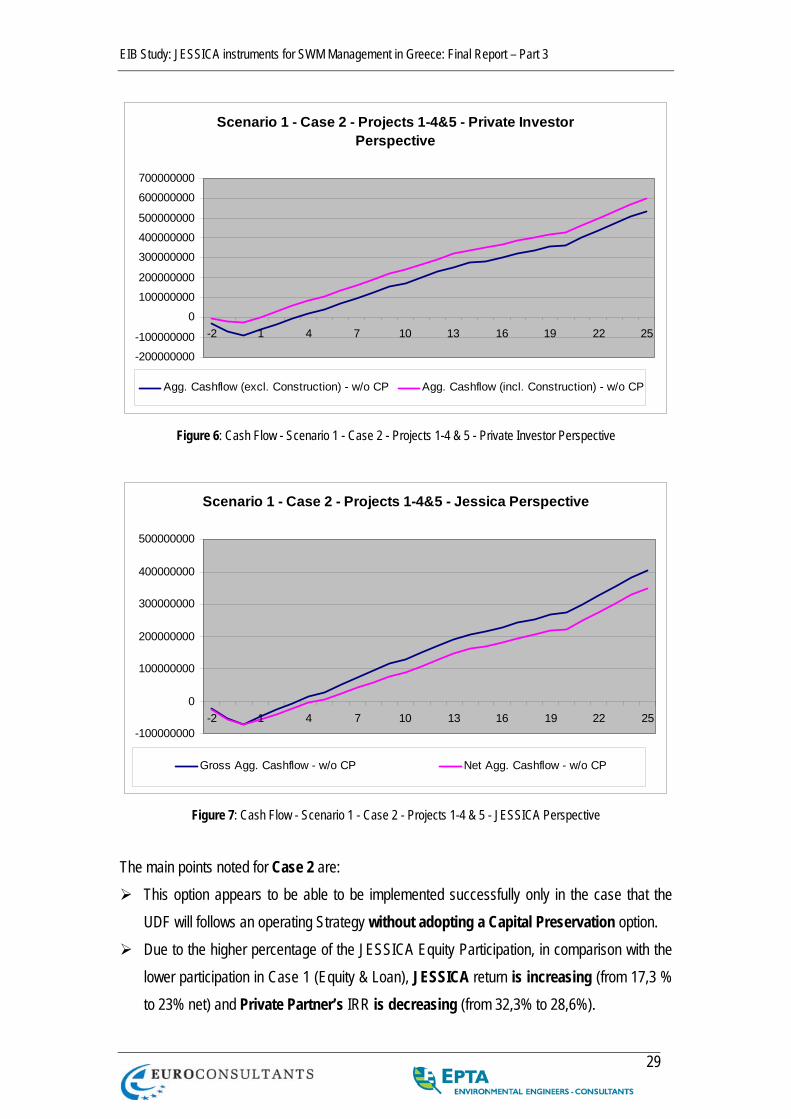
EIB Study: JESSICA instruments for SWM Management in Greece: Final Report – Part 3
29
Scenario 1 - Case 2 - Projects 1-4&5 - Private Investor Perspective
-200000000-100000000
0100000000200000000
300000000400000000500000000
600000000700000000
-2 1 4 7 10 13 16 19 22 25
Agg. Cashflow (excl. Construction) - w/o CP Agg. Cashflow (incl. Construction) - w/o CP
Figure 6: Cash Flow - Scenario 1 - Case 2 - Projects 1-4 & 5 - Private Investor Perspective
Scenario 1 - Case 2 - Projects 1-4&5 - Jessica Perspective
-100000000
0
100000000
200000000
300000000
400000000
500000000
-2 1 4 7 10 13 16 19 22 25
Gross Agg. Cashflow - w/o CP Net Agg. Cashflow - w/o CP
Figure 7: Cash Flow - Scenario 1 - Case 2 - Projects 1-4 & 5 - JESSICA Perspective
The main points noted for Case 2 are:
This option appears to be able to be implemented successfully only in the case that the UDF will follows an operating Strategy without adopting a Capital Preservation option.
Due to the higher percentage of the JESSICA Equity Participation, in comparison with the lower participation in Case 1 (Equity & Loan), JESSICA return is increasing (from 17,3 % to 23% net) and Private Partner’s IRR is decreasing (from 32,3% to 28,6%).
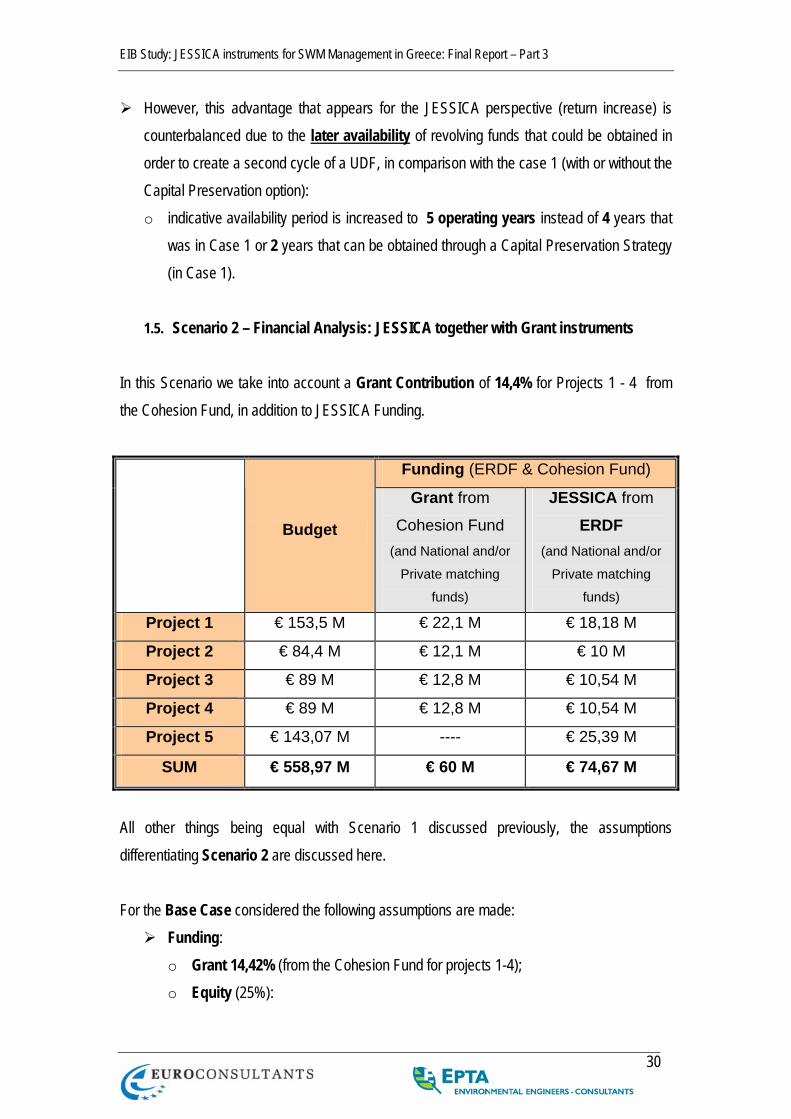
EIB Study: JESSICA instruments for SWM Management in Greece: Final Report – Part 3
30
However, this advantage that appears for the JESSICA perspective (return increase) is counterbalanced due to the later availability of revolving funds that could be obtained in order to create a second cycle of a UDF, in comparison with the case 1 (with or without the Capital Preservation option): o indicative availability period is increased to 5 operating years instead of 4 years that
was in Case 1 or 2 years that can be obtained through a Capital Preservation Strategy (in Case 1).
1.5. Scenario 2 – Financial Analysis: JESSICA together with Grant instruments
In this Scenario we take into account a Grant Contribution of 14,4% for Projects 1 - 4 from the Cohesion Fund, in addition to JESSICA Funding.
Funding (ERDF & Cohesion Fund)
Budget
Grant from
Cohesion Fund (and National and/or
Private matching
funds)
JESSICA from
ERDF (and National and/or
Private matching
funds) Project 1 € 153,5 M € 22,1 M € 18,18 M
Project 2 € 84,4 M € 12,1 M € 10 M
Project 3 € 89 M € 12,8 M € 10,54 M
Project 4 € 89 M € 12,8 M € 10,54 M
Project 5 € 143,07 M ---- € 25,39 M
SUM € 558,97 M € 60 M € 74,67 M
All other things being equal with Scenario 1 discussed previously, the assumptions differentiating Scenario 2 are discussed here. For the Base Case considered the following assumptions are made:
Funding: o Grant 14,42% (from the Cohesion Fund for projects 1-4); o Equity (25%):
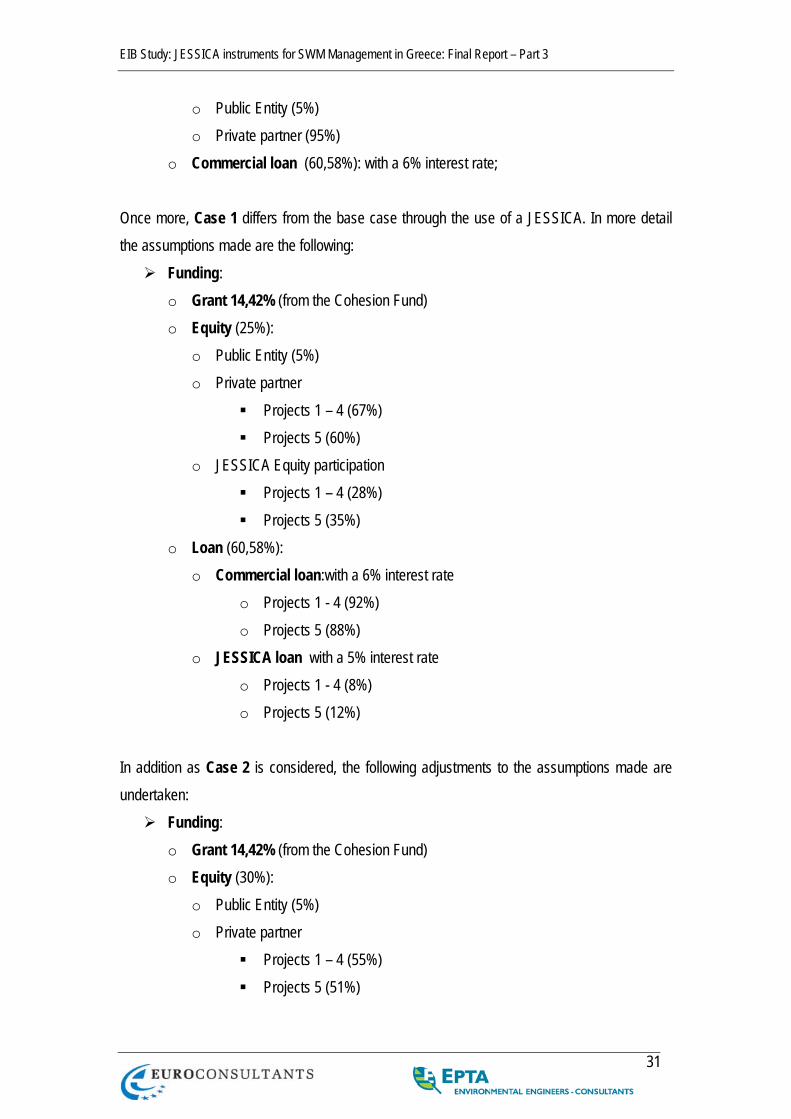
EIB Study: JESSICA instruments for SWM Management in Greece: Final Report – Part 3
31
o Public Entity (5%) o Private partner (95%)
o Commercial loan (60,58%): with a 6% interest rate; Once more, Case 1 differs from the base case through the use of a JESSICA. In more detail the assumptions made are the following:
Funding: o Grant 14,42% (from the Cohesion Fund) o Equity (25%):
o Public Entity (5%) o Private partner
Projects 1 – 4 (67%) Projects 5 (60%)
o JESSICA Equity participation Projects 1 – 4 (28%) Projects 5 (35%)
o Loan (60,58%): o Commercial loan:with a 6% interest rate
o Projects 1 - 4 (92%) o Projects 5 (88%)
o JESSICA loan with a 5% interest rate o Projects 1 - 4 (8%) o Projects 5 (12%)
In addition as Case 2 is considered, the following adjustments to the assumptions made are undertaken:
Funding: o Grant 14,42% (from the Cohesion Fund) o Equity (30%):
o Public Entity (5%) o Private partner
Projects 1 – 4 (55%) Projects 5 (51%)
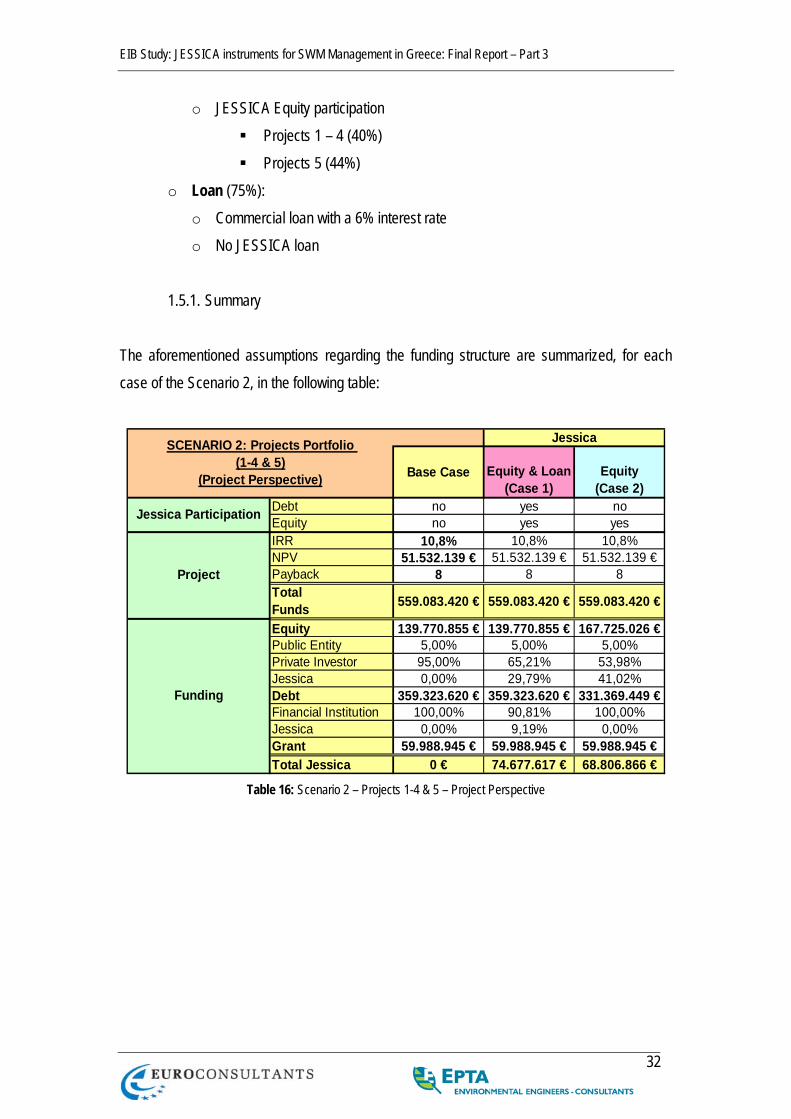
EIB Study: JESSICA instruments for SWM Management in Greece: Final Report – Part 3
32
o JESSICA Equity participation Projects 1 – 4 (40%) Projects 5 (44%)
o Loan (75%): o Commercial loan with a 6% interest rate o No JESSICA loan
1.5.1. Summary
The aforementioned assumptions regarding the funding structure are summarized, for each case of the Scenario 2, in the following table:
Base Case Equity & Loan(Case 1)
Equity(Case 2)
Debt no yes noEquity no yes yesIRR 10,8% 10,8% 10,8%NPV 51.532.139 € 51.532.139 € 51.532.139 €Payback 8 8 8TotalFunds 559.083.420 € 559.083.420 € 559.083.420 €
Equity 139.770.855 € 139.770.855 € 167.725.026 €Public Entity 5,00% 5,00% 5,00%Private Investor 95,00% 65,21% 53,98%Jessica 0,00% 29,79% 41,02%Debt 359.323.620 € 359.323.620 € 331.369.449 €Financial Institution 100,00% 90,81% 100,00%Jessica 0,00% 9,19% 0,00%Grant 59.988.945 € 59.988.945 € 59.988.945 €Total Jessica 0 € 74.677.617 € 68.806.866 €
Funding
SCENARIO 2: Projects Portfolio (1-4 & 5)
(Project Perspective)
Jessica
Jessica Participation
Project
Table 16: Scenario 2 – Projects 1-4 & 5 – Project Perspective
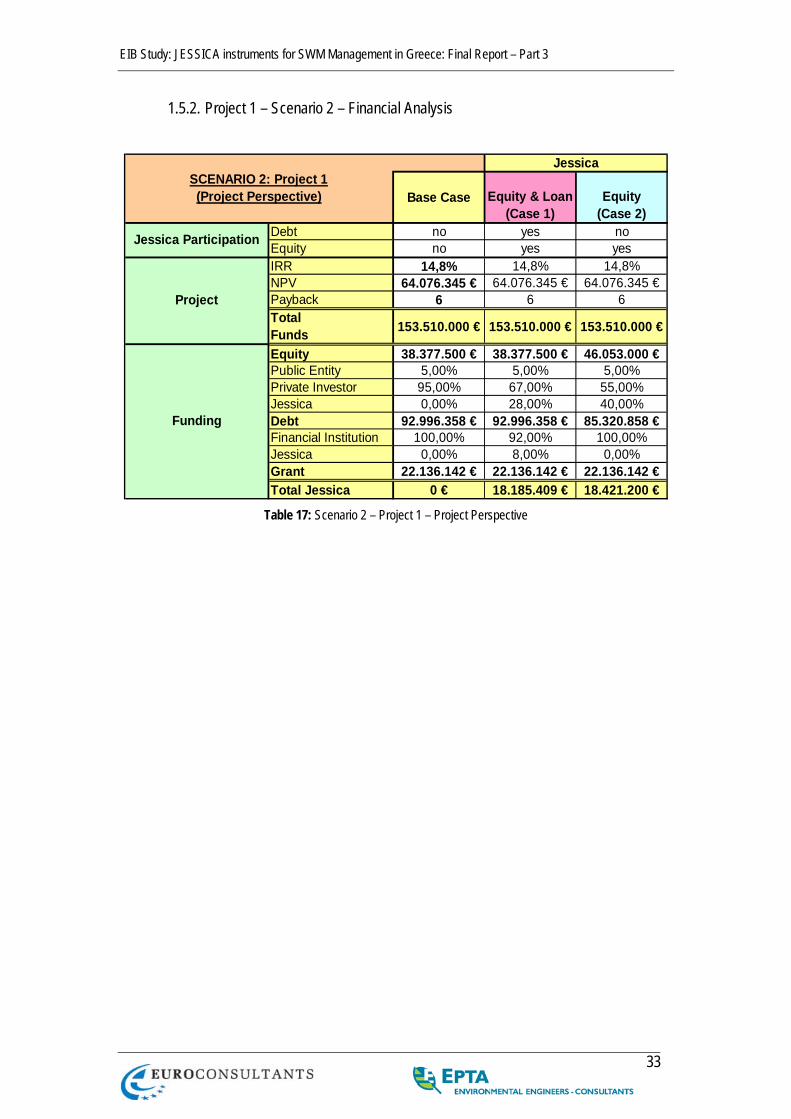
EIB Study: JESSICA instruments for SWM Management in Greece: Final Report – Part 3
33
1.5.2. Project 1 – Scenario 2 – Financial Analysis
Base Case Equity & Loan(Case 1)
Equity(Case 2)
Debt no yes noEquity no yes yesIRR 14,8% 14,8% 14,8%NPV 64.076.345 € 64.076.345 € 64.076.345 €Payback 6 6 6TotalFunds 153.510.000 € 153.510.000 € 153.510.000 €
Equity 38.377.500 € 38.377.500 € 46.053.000 €Public Entity 5,00% 5,00% 5,00%Private Investor 95,00% 67,00% 55,00%Jessica 0,00% 28,00% 40,00%Debt 92.996.358 € 92.996.358 € 85.320.858 €Financial Institution 100,00% 92,00% 100,00%Jessica 0,00% 8,00% 0,00%Grant 22.136.142 € 22.136.142 € 22.136.142 €Total Jessica 0 € 18.185.409 € 18.421.200 €
Jessica Participation
Project
Funding
SCENARIO 2: Project 1(Project Perspective)
Jessica
Table 17: Scenario 2 – Project 1 – Project Perspective

EIB Study: JESSICA instruments for SWM Management in Greece: Final Report – Part 3
34
Base CaseEquity & Loan
(Case 1)Equity
(Case 2)25:61:14 25:61:14 30:56:14
22.136.142 € 22.136.142 € 22.136.142 €IRR 14,82% 14,82% 14,82%NPV 64.262.027 € 64.262.027 € 64.262.027 €Payback 6 6 6TotalFunds 153.510.000 € 153.510.000 € 153.510.000 €
IRR 39,90% 39,96% 35,48%NPV 115.015.712 € 81.322.669 € 65.344.491 €Payback 2 2 3Funds 36.458.625 € 25.712.925 € 25.329.150 €IRR n/a 88,97% 82,69%NPV n/a 96.486.334 € 80.508.156 €Payback n/a 1 1Funds n/a 25.712.925 € 25.329.150 €IRR 39,90% 39,96% 35,48%NPV 6.053.459 € 6.068.856 € 5.940.408 €Payback 2 2 3Funds 1.918.875 € 1.918.875 € 2.302.650 €IRR n/a 24,55% 30,72%NPV n/a 26.824.519 € 40.989.443 €Payback n/a 4 3Funds n/a 18.185.409 € 18.421.200 €IRR n/a 28,54% 35,48%NPV n/a 31.945.911 € 47.523.266 €Payback n/a 3 3Funds n/a 18.185.409 € 18.421.200 €IRR 6,00% 6,00% 6,00%Payback 20 20 20Funds 92.996.358 € 85.556.649 € 85.320.858 €
Jessica Net retunrs
Jessica Gross retunrs
Financial Institution
Project
Private Investor
Private Investor (inc. construction)
Public Entity
SCENARIO 2: Project 1(Stakeholder Perspective)
Jessicawithout Capital Preservation
Gearing (Equity:Debt:Grant)Grant
Table 18: Scenario 2 – Project 1 – Stakeholder Perspective

EIB Study: JESSICA instruments for SWM Management in Greece: Final Report – Part 3
35
1.5.3. Project 2 – Scenario 2 – Financial Analysis
Base Case Equity & Loan(Case 1)
Equity(Case 2)
Debt no yes noEquity no yes yesIRR 16,7% 16,7% 16,7%NPV 50.904.109 € 50.904.109 € 50.904.109 €Payback 5 5 5TotalFunds 84.430.500 € 84.430.500 € 84.430.500 €
Equity 21.107.625 € 21.107.625 € 25.329.150 €Public Entity 5,00% 5,00% 5,00%Private Investor 95,00% 67,00% 55,00%Jessica 0,00% 28,00% 40,00%Debt 51.147.997 € 51.147.997 € 46.926.472 €Financial Institution 100,00% 92,00% 100,00%Jessica 0,00% 8,00% 0,00%Grant 12.174.878 € 12.174.878 € 12.174.878 €Total Jessica 0 € 10.001.975 € 10.131.660 €
Jessica
Jessica Participation
Project
Funding
SCENARIO 2: Project 2(Project Perspective)
Table 19: Scenario 2 – Project 2 – Project Perspective
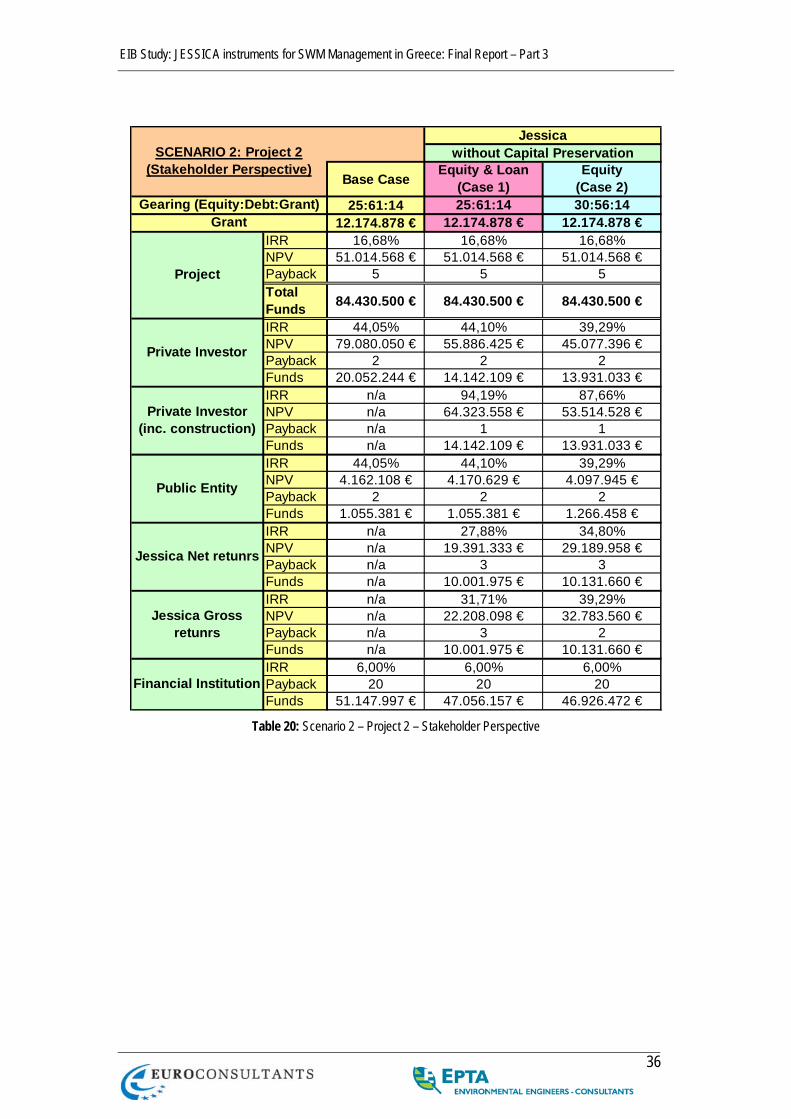
EIB Study: JESSICA instruments for SWM Management in Greece: Final Report – Part 3
36
Base CaseEquity & Loan
(Case 1)Equity
(Case 2)25:61:14 25:61:14 30:56:14
12.174.878 € 12.174.878 € 12.174.878 €IRR 16,68% 16,68% 16,68%NPV 51.014.568 € 51.014.568 € 51.014.568 €Payback 5 5 5TotalFunds 84.430.500 € 84.430.500 € 84.430.500 €
IRR 44,05% 44,10% 39,29%NPV 79.080.050 € 55.886.425 € 45.077.396 €Payback 2 2 2Funds 20.052.244 € 14.142.109 € 13.931.033 €IRR n/a 94,19% 87,66%NPV n/a 64.323.558 € 53.514.528 €Payback n/a 1 1Funds n/a 14.142.109 € 13.931.033 €IRR 44,05% 44,10% 39,29%NPV 4.162.108 € 4.170.629 € 4.097.945 €Payback 2 2 2Funds 1.055.381 € 1.055.381 € 1.266.458 €IRR n/a 27,88% 34,80%NPV n/a 19.391.333 € 29.189.958 €Payback n/a 3 3Funds n/a 10.001.975 € 10.131.660 €IRR n/a 31,71% 39,29%NPV n/a 22.208.098 € 32.783.560 €Payback n/a 3 2Funds n/a 10.001.975 € 10.131.660 €IRR 6,00% 6,00% 6,00%Payback 20 20 20Funds 51.147.997 € 47.056.157 € 46.926.472 €
Jessica Net retunrs
Jessica Gross retunrs
Financial Institution
Project
Private Investor
Private Investor (inc. construction)
Public Entity
Jessicawithout Capital Preservation
Gearing (Equity:Debt:Grant)Grant
SCENARIO 2: Project 2(Stakeholder Perspective)
Table 20: Scenario 2 – Project 2 – Stakeholder Perspective

EIB Study: JESSICA instruments for SWM Management in Greece: Final Report – Part 3
37
1.5.4. Project 3 – Scenario 2 – Financial Analysis
Base Case Equity & Loan(Case 1)
Equity(Case 2)
Debt no yes noEquity no yes yesIRR 2,3% 2,3% 2,3%NPV -38.106.345 € -38.106.345 € -38.106.345 €Payback 18 18 18TotalFunds 89.035.800 € 89.035.800 € 89.035.800 €
Equity 22.258.950 € 22.258.950 € 26.710.740 €Public Entity 5,00% 5,00% 5,00%Private Investor 95,00% 67,00% 55,00%Jessica 0,00% 28,00% 40,00%Debt 53.937.888 € 53.937.888 € 49.486.098 €Financial Institution 100,00% 92,00% 100,00%Jessica 0,00% 8,00% 0,00%Grant 12.838.962 € 12.838.962 € 12.838.962 €Total Jessica 0 € 10.547.537 € 10.684.296 €
Funding
SCENARIO 2: Project 3(Project Perspective)
Jessica
Jessica Participation
Project
Table 21: Scenario 2 – Project 3 – Project Perspective

EIB Study: JESSICA instruments for SWM Management in Greece: Final Report – Part 3
38
Base CaseEquity & Loan
(Case 1)Equity
(Case 2)25:61:14 25:61:14 30:56:14
12.838.962 € 12.838.962 € 12.838.962 €IRR 2,31% 2,31% 2,31%NPV -38.094.569 € -38.094.569 € -38.094.569 €Payback 18 18 18TotalFunds 89.035.800 € 89.035.800 € 89.035.800 €
IRR 2,71% 2,84% 3,08%NPV -11.195.340 € -7.740.067 € -7.055.433 €Payback 22 22 22Funds 21.146.003 € 14.913.497 € 14.690.907 €IRR n/a 11,84% 13,73%NPV n/a 1.086.332 € 1.770.966 €Payback n/a 9 7Funds n/a 14.913.497 € 14.690.907 €IRR 2,71% 2,84% 3,08%NPV -589.228 € -577.617 € -641.403 €Payback 22 22 22Funds 1.112.948 € 1.112.948 € 1.335.537 €IRR n/a 0,23% n/aNPV n/a -7.396.450 € -8.920.841 €Payback n/a 25 51Funds n/a 10.547.537 € 10.684.296 €IRR n/a 3,52% 3,08%NPV n/a -4.426.043 € -5.131.224 €Payback n/a 19 22Funds n/a 10.547.537 € 10.684.296 €IRR 6,00% 6,00% 6,00%Payback 20 20 20Funds 53.937.888 € 49.622.857 € 49.486.098 €
Jessica Net retunrs
Jessica Gross retunrs
Financial Institution
Project
Private Investor
Private Investor (inc. construction)
Public Entity
Jessicawithout Capital Preservation
Gearing (Equity:Debt:Grant)Grant
SCENARIO 2: Project 3(Stakeholder Perspective)
Table 22: Scenario 2 – Project 3 – Stakeholder Perspective
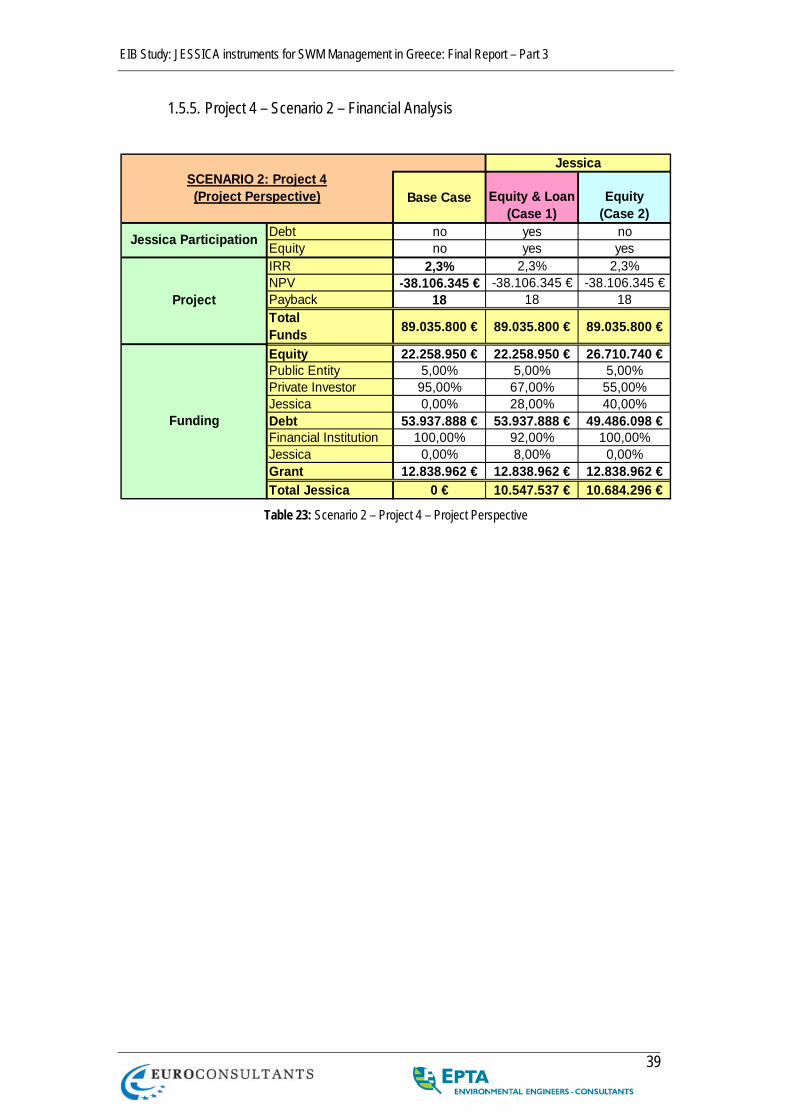
EIB Study: JESSICA instruments for SWM Management in Greece: Final Report – Part 3
39
1.5.5. Project 4 – Scenario 2 – Financial Analysis
Base Case Equity & Loan(Case 1)
Equity(Case 2)
Debt no yes noEquity no yes yesIRR 2,3% 2,3% 2,3%NPV -38.106.345 € -38.106.345 € -38.106.345 €Payback 18 18 18TotalFunds 89.035.800 € 89.035.800 € 89.035.800 €
Equity 22.258.950 € 22.258.950 € 26.710.740 €Public Entity 5,00% 5,00% 5,00%Private Investor 95,00% 67,00% 55,00%Jessica 0,00% 28,00% 40,00%Debt 53.937.888 € 53.937.888 € 49.486.098 €Financial Institution 100,00% 92,00% 100,00%Jessica 0,00% 8,00% 0,00%Grant 12.838.962 € 12.838.962 € 12.838.962 €Total Jessica 0 € 10.547.537 € 10.684.296 €
Project
Funding
SCENARIO 2: Project 4(Project Perspective)
Jessica
Jessica Participation
Table 23: Scenario 2 – Project 4 – Project Perspective

EIB Study: JESSICA instruments for SWM Management in Greece: Final Report – Part 3
40
Base CaseEquity & Loan
(Case 1)Equity
(Case 2)25:61:14 25:61:14 30:56:14
12.838.962 € 12.838.962 € 12.838.962 €IRR 2,31% 2,31% 2,31%NPV -38.094.569 € -38.094.569 € -38.094.569 €Payback 18 18 18TotalFunds 89.035.800 € 89.035.800 € 89.035.800 €
IRR 2,71% 2,84% 3,08%NPV -11.195.340 € -7.740.067 € -7.055.433 €Payback 22 22 22Funds 21.146.003 € 14.913.497 € 14.690.907 €IRR n/a 11,84% 13,73%NPV n/a 1.086.332 € 1.770.966 €Payback n/a 9 7Funds n/a 14.913.497 € 14.690.907 €IRR 2,71% 2,84% 3,08%NPV -589.228 € -577.617 € -641.403 €Payback 22 22 22Funds 1.112.948 € 1.112.948 € 1.335.537 €IRR n/a 0,23% n/aNPV n/a -7.396.450 € -8.920.841 €Payback n/a 25 51Funds n/a 10.547.537 € 10.684.296 €IRR n/a 3,52% 3,08%NPV n/a -4.426.043 € -5.131.224 €Payback n/a 19 22Funds n/a 10.547.537 € 10.684.296 €IRR 6,00% 6,00% 6,00%Payback 20 20 20Funds 53.937.888 € 49.622.857 € 49.486.098 €
Jessica Net retunrs
Jessica Gross retunrs
Financial Institution
Project
Private Investor
Private Investor (inc. construction)
Public Entity
Jessicawithout Capital Preservation
Gearing (Equity:Debt:Grant)Grant
SCENARIO 2: Project 4(Stakeholder Perspective)
Table 24: Scenario 2 – Project 4 – Stakeholder Perspective
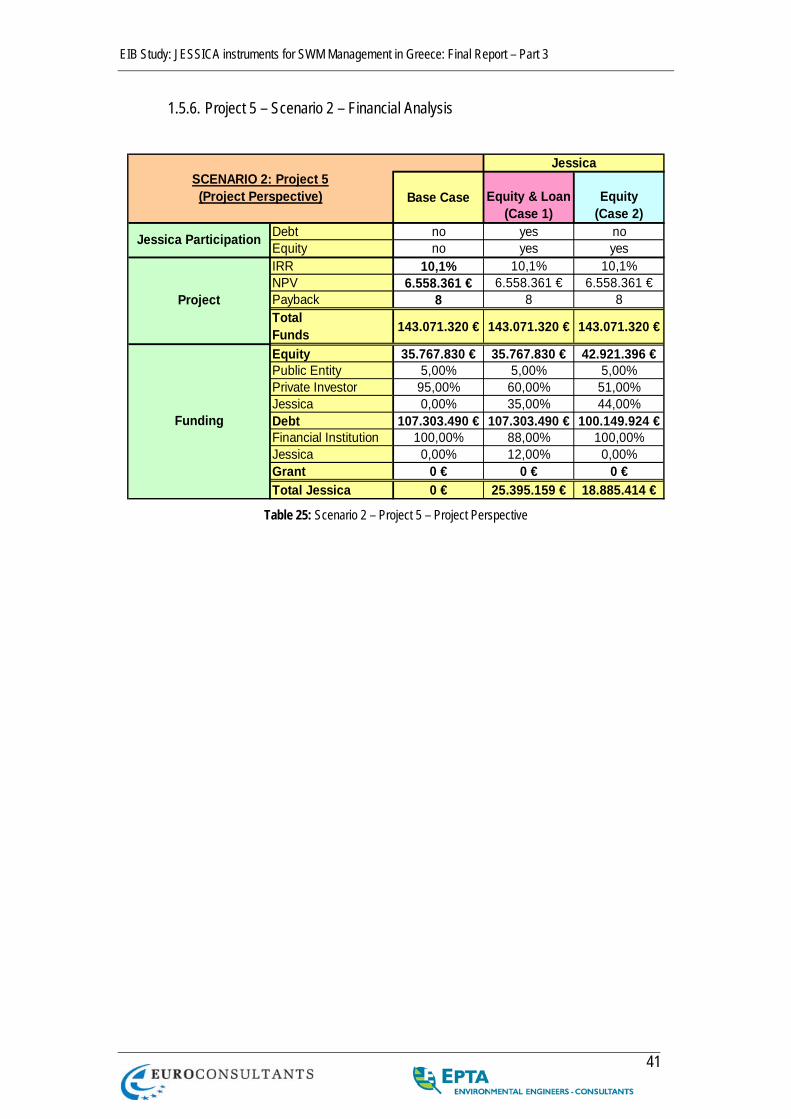
EIB Study: JESSICA instruments for SWM Management in Greece: Final Report – Part 3
41
1.5.6. Project 5 – Scenario 2 – Financial Analysis
Base Case Equity & Loan(Case 1)
Equity(Case 2)
Debt no yes noEquity no yes yesIRR 10,1% 10,1% 10,1%NPV 6.558.361 € 6.558.361 € 6.558.361 €Payback 8 8 8TotalFunds 143.071.320 € 143.071.320 € 143.071.320 €
Equity 35.767.830 € 35.767.830 € 42.921.396 €Public Entity 5,00% 5,00% 5,00%Private Investor 95,00% 60,00% 51,00%Jessica 0,00% 35,00% 44,00%Debt 107.303.490 € 107.303.490 € 100.149.924 €Financial Institution 100,00% 88,00% 100,00%Jessica 0,00% 12,00% 0,00%Grant 0 € 0 € 0 €Total Jessica 0 € 25.395.159 € 18.885.414 €
Jessica Participation
Project
Funding
SCENARIO 2: Project 5(Project Perspective)
Jessica
Table 25: Scenario 2 – Project 5 – Project Perspective
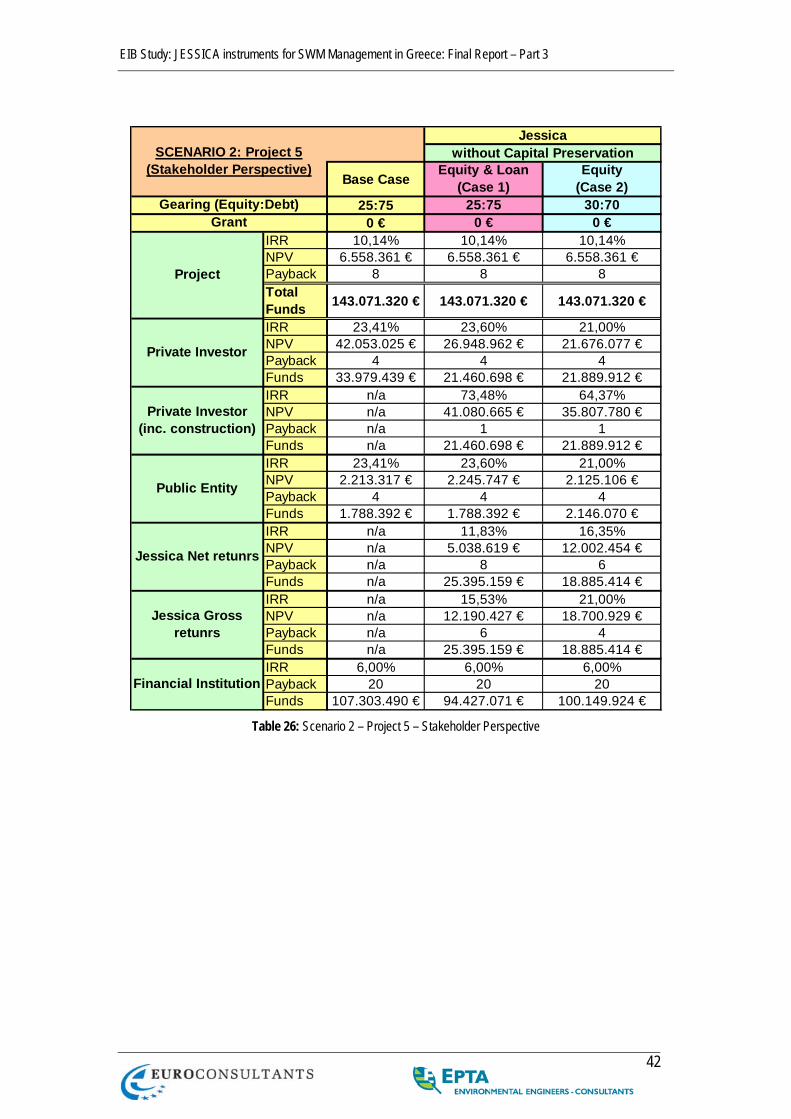
EIB Study: JESSICA instruments for SWM Management in Greece: Final Report – Part 3
42
Base CaseEquity & Loan
(Case 1)Equity
(Case 2)25:75 25:75 30:70
0 € 0 € 0 €IRR 10,14% 10,14% 10,14%NPV 6.558.361 € 6.558.361 € 6.558.361 €Payback 8 8 8TotalFunds 143.071.320 € 143.071.320 € 143.071.320 €
IRR 23,41% 23,60% 21,00%NPV 42.053.025 € 26.948.962 € 21.676.077 €Payback 4 4 4Funds 33.979.439 € 21.460.698 € 21.889.912 €IRR n/a 73,48% 64,37%NPV n/a 41.080.665 € 35.807.780 €Payback n/a 1 1Funds n/a 21.460.698 € 21.889.912 €IRR 23,41% 23,60% 21,00%NPV 2.213.317 € 2.245.747 € 2.125.106 €Payback 4 4 4Funds 1.788.392 € 1.788.392 € 2.146.070 €IRR n/a 11,83% 16,35%NPV n/a 5.038.619 € 12.002.454 €Payback n/a 8 6Funds n/a 25.395.159 € 18.885.414 €IRR n/a 15,53% 21,00%NPV n/a 12.190.427 € 18.700.929 €Payback n/a 6 4Funds n/a 25.395.159 € 18.885.414 €IRR 6,00% 6,00% 6,00%Payback 20 20 20Funds 107.303.490 € 94.427.071 € 100.149.924 €
Jessica Net retunrs
Jessica Gross retunrs
Financial Institution
Project
Private Investor
Private Investor (inc. construction)
Public Entity
Jessicawithout Capital Preservation
Gearing (Equity:Debt)Grant
SCENARIO 2: Project 5(Stakeholder Perspective)
Table 26: Scenario 2 – Project 5 – Stakeholder Perspective
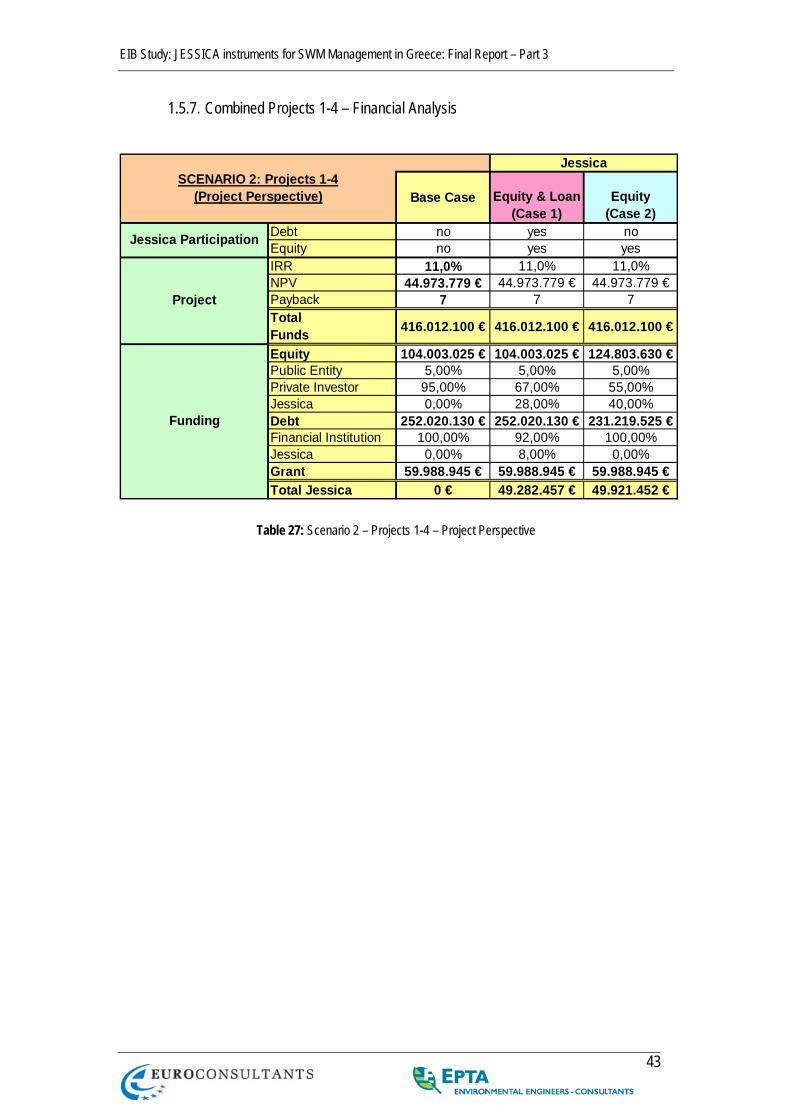
EIB Study: JESSICA instruments for SWM Management in Greece: Final Report – Part 3
43
1.5.7. Combined Projects 1-4 – Financial Analysis
Base Case Equity & Loan(Case 1)
Equity(Case 2)
Debt no yes noEquity no yes yesIRR 11,0% 11,0% 11,0%NPV 44.973.779 € 44.973.779 € 44.973.779 €Payback 7 7 7TotalFunds 416.012.100 € 416.012.100 € 416.012.100 €
Equity 104.003.025 € 104.003.025 € 124.803.630 €Public Entity 5,00% 5,00% 5,00%Private Investor 95,00% 67,00% 55,00%Jessica 0,00% 28,00% 40,00%Debt 252.020.130 € 252.020.130 € 231.219.525 €Financial Institution 100,00% 92,00% 100,00%Jessica 0,00% 8,00% 0,00%Grant 59.988.945 € 59.988.945 € 59.988.945 €Total Jessica 0 € 49.282.457 € 49.921.452 €
Jessica
Jessica Participation
Project
Funding
SCENARIO 2: Projects 1-4(Project Perspective)
Table 27: Scenario 2 – Projects 1-4 – Project Perspective
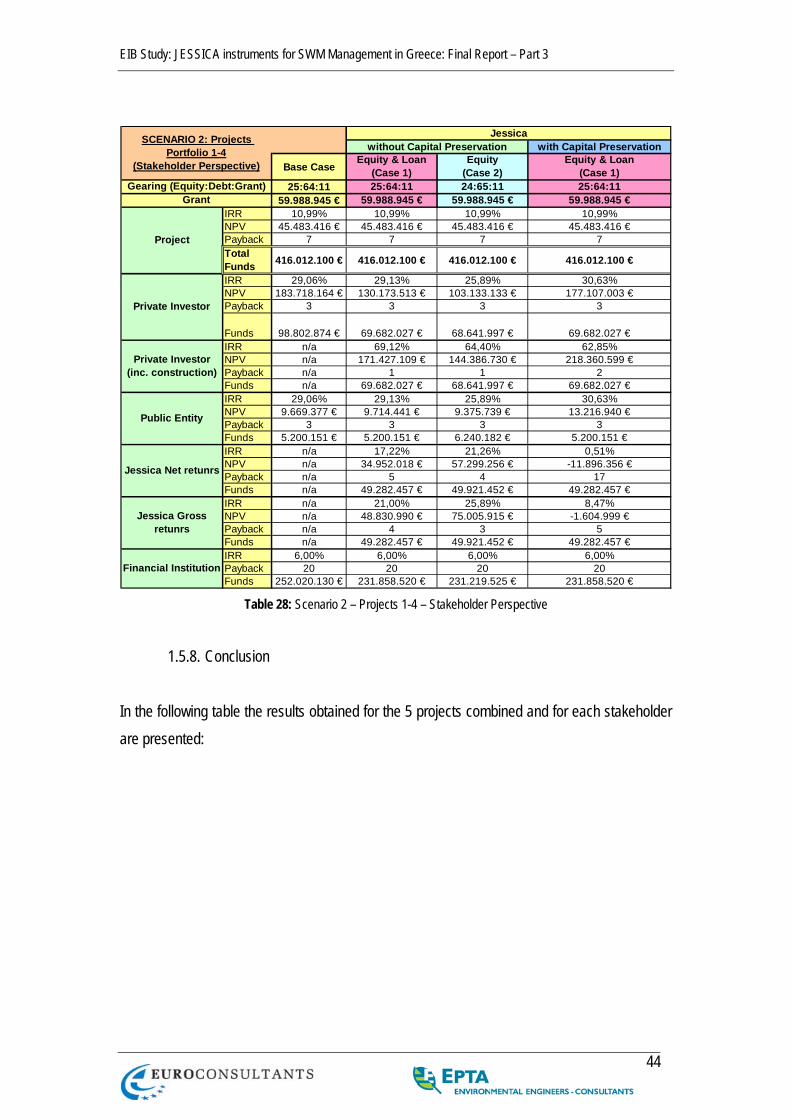
EIB Study: JESSICA instruments for SWM Management in Greece: Final Report – Part 3
44
with Capital Preservation
Base CaseEquity & Loan
(Case 1)Equity
(Case 2)Equity & Loan
(Case 1)25:64:11 25:64:11 24:65:11 25:64:11
59.988.945 € 59.988.945 € 59.988.945 € 59.988.945 €IRR 10,99% 10,99% 10,99% 10,99%NPV 45.483.416 € 45.483.416 € 45.483.416 € 45.483.416 €Payback 7 7 7 7TotalFunds 416.012.100 € 416.012.100 € 416.012.100 € 416.012.100 €
IRR 29,06% 29,13% 25,89% 30,63%NPV 183.718.164 € 130.173.513 € 103.133.133 € 177.107.003 €Payback 3 3 3 3
Funds 98.802.874 € 69.682.027 € 68.641.997 € 69.682.027 €IRR n/a 69,12% 64,40% 62,85%NPV n/a 171.427.109 € 144.386.730 € 218.360.599 €Payback n/a 1 1 2Funds n/a 69.682.027 € 68.641.997 € 69.682.027 €IRR 29,06% 29,13% 25,89% 30,63%NPV 9.669.377 € 9.714.441 € 9.375.739 € 13.216.940 €Payback 3 3 3 3Funds 5.200.151 € 5.200.151 € 6.240.182 € 5.200.151 €IRR n/a 17,22% 21,26% 0,51%NPV n/a 34.952.018 € 57.299.256 € -11.896.356 €Payback n/a 5 4 17Funds n/a 49.282.457 € 49.921.452 € 49.282.457 €IRR n/a 21,00% 25,89% 8,47%NPV n/a 48.830.990 € 75.005.915 € -1.604.999 €Payback n/a 4 3 5Funds n/a 49.282.457 € 49.921.452 € 49.282.457 €IRR 6,00% 6,00% 6,00% 6,00%Payback 20 20 20 20Funds 252.020.130 € 231.858.520 € 231.219.525 € 231.858.520 €
Jessica Net retunrs
Jessica Gross retunrs
Financial Institution
Project
Private Investor
Private Investor (inc. construction)
Public Entity
Jessicawithout Capital Preservation
Gearing (Equity:Debt:Grant)Grant
SCENARIO 2: Projects Portfolio 1-4
(Stakeholder Perspective)
Table 28: Scenario 2 – Projects 1-4 – Stakeholder Perspective
1.5.8. Conclusion
In the following table the results obtained for the 5 projects combined and for each stakeholder are presented:

EIB Study: JESSICA instruments for SWM Management in Greece: Final Report – Part 3
45
with Capital Preservation
Base CaseEquity & Loan
(Case 1)Equity
(Case 2)Equity & Loan
(Case 1)25:64:11 25:64:11 24:65:11 25:64:11
59.988.945 € 59.988.945 € 59.988.945 € 59.988.945 €IRR 10,78% 10,78% 10,78% 10,78%NPV 52.041.777 € 52.041.777 € 52.041.777 € 52.041.777 €Payback 8 8 8 8TotalFunds 559.083.420 € 559.083.420 € 559.083.420 € 559.083.420 €
IRR 27,69% 27,90% 24,77% 29,20%NPV 225.771.189 € 157.122.475 € 124.809.210 € 216.777.005 €Payback 3 3 3 3Funds 132.782.312 € 91.142.725 € 90.531.908 € 91.142.725 €IRR n/a 69,91% 64,39% 61,93%NPV n/a 212.507.775 € 180.194.510 € 272.162.305 €Payback n/a 1 1 2Funds n/a 91.142.725 € 90.531.908 € 91.142.725 €IRR 27,69% 27,79% 24,70% 28,67%NPV 11.882.694 € 11.960.188 € 11.500.845 € 16.019.993 €Payback 3 3 3 3Funds 6.988.543 € 6.988.543 € 8.386.251 € 6.988.543 €IRR n/a 15,47% 19,97% 1,06%NPV n/a 39.990.636 € 69.301.710 € -18.287.391 €Payback n/a 6 4 16Funds n/a 74.677.617 € 68.806.866 € 74.677.617 €IRR n/a 19,23% 24,61% 8,42%NPV n/a 61.021.417 € 93.706.844 € -2.692.918 €Payback n/a 4 3 6Funds n/a 74.677.617 € 68.806.866 € 74.677.617 €IRR 6,00% 6,00% 6,00% 6,00%Payback 20 20 20 20Funds 359.323.620 € 326.285.591 € 331.369.449 € 326.285.591 €
Jessica Net retunrs
Jessica Gross retunrs
Financial Institution
Project
Private Investor
Private Investor (inc. construction)
Public Entity
Jessicawithout Capital Preservation
Gearing (Equity:Debt:Grant)Grant
SCENARIO 2: Projects Portfolio 1-4 & 5
(Stakeholder Perspective)
Table 29: Scenario 2 – Projects 1-4 & 5 – Stakeholder Perspective
The evolution of the cash flows for Case 1 towards the Private Investor and the JESSICA Fund are illustrated below.
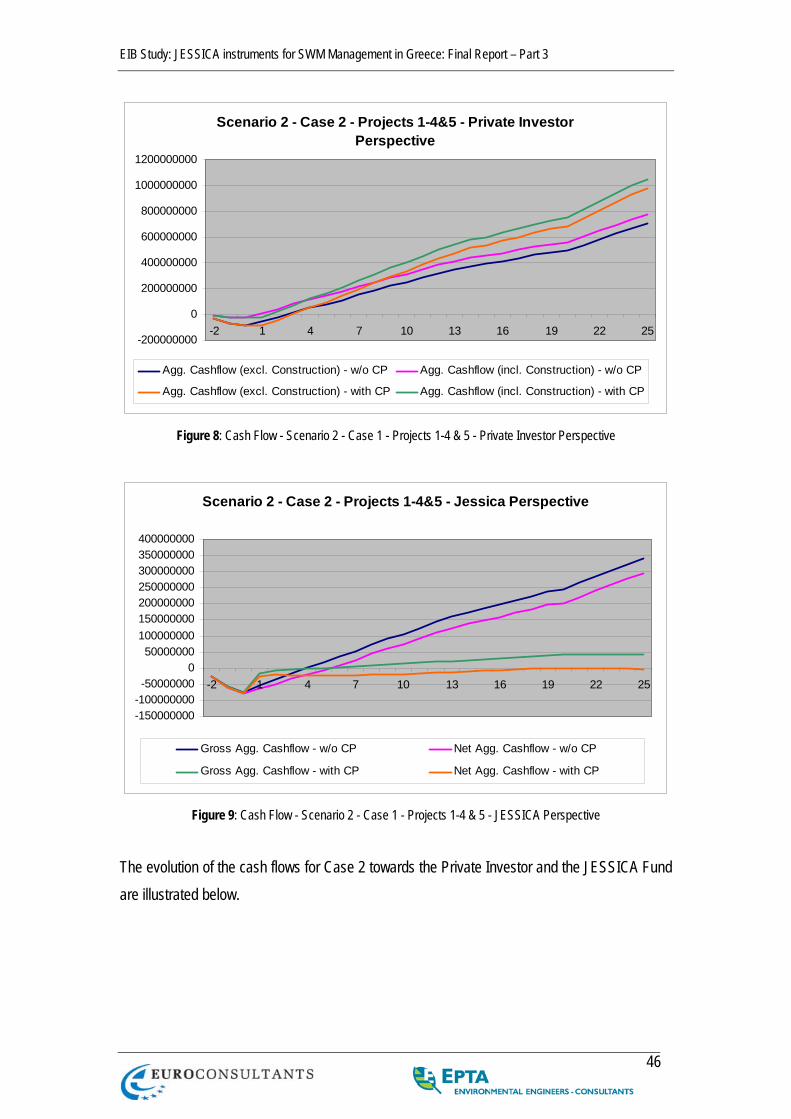
EIB Study: JESSICA instruments for SWM Management in Greece: Final Report – Part 3
46
Scenario 2 - Case 2 - Projects 1-4&5 - Private Investor Perspective
-200000000
0
200000000
400000000
600000000
800000000
1000000000
1200000000
-2 1 4 7 10 13 16 19 22 25
Agg. Cashflow (excl. Construction) - w/o CP Agg. Cashflow (incl. Construction) - w/o CP
Agg. Cashflow (excl. Construction) - with CP Agg. Cashflow (incl. Construction) - with CP
Figure 8: Cash Flow - Scenario 2 - Case 1 - Projects 1-4 & 5 - Private Investor Perspective
Scenario 2 - Case 2 - Projects 1-4&5 - Jessica Perspective
-150000000-100000000-50000000
050000000
100000000150000000200000000250000000300000000350000000400000000
-2 1 4 7 10 13 16 19 22 25
Gross Agg. Cashflow - w/o CP Net Agg. Cashflow - w/o CP
Gross Agg. Cashflow - with CP Net Agg. Cashflow - with CP
Figure 9: Cash Flow - Scenario 2 - Case 1 - Projects 1-4 & 5 - JESSICA Perspective
The evolution of the cash flows for Case 2 towards the Private Investor and the JESSICA Fund are illustrated below.
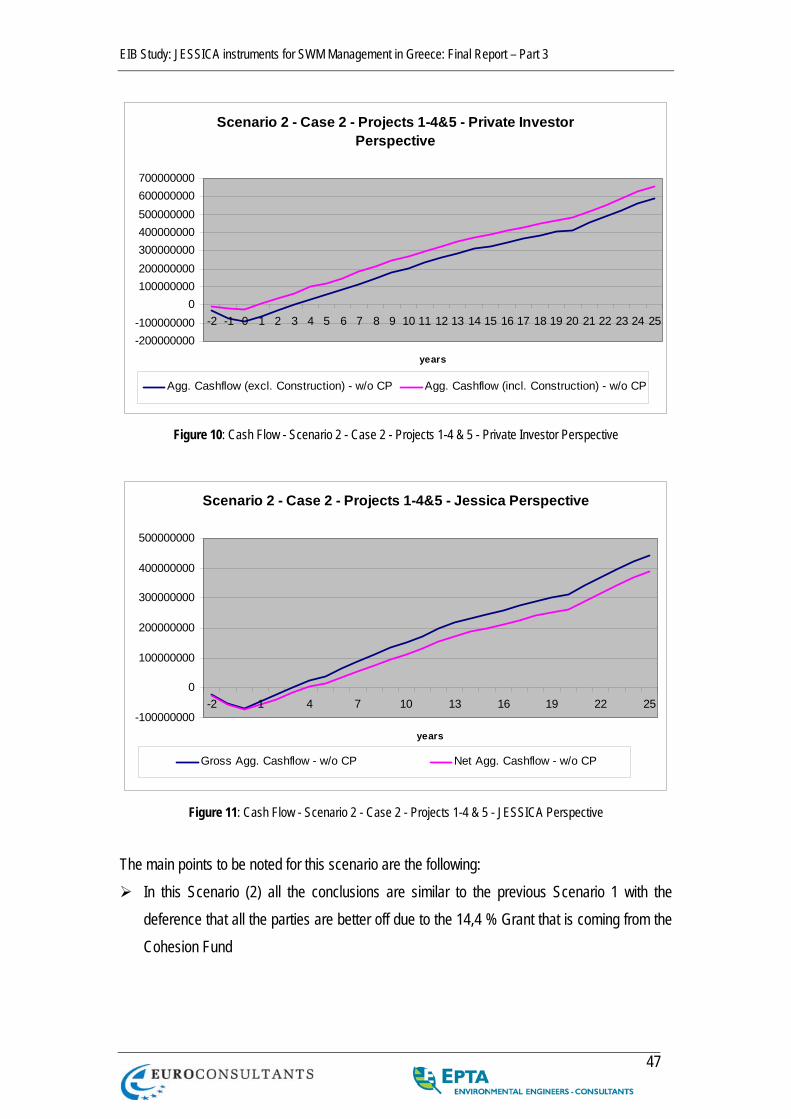
EIB Study: JESSICA instruments for SWM Management in Greece: Final Report – Part 3
47
Scenario 2 - Case 2 - Projects 1-4&5 - Private Investor Perspective
-200000000-100000000
0100000000200000000300000000400000000500000000600000000700000000
-2 -1 0 1 2 3 4 5 6 7 8 9 10 11 12 13 14 15 16 17 18 19 20 21 22 23 24 25
years
Agg. Cashflow (excl. Construction) - w/o CP Agg. Cashflow (incl. Construction) - w/o CP
Figure 10: Cash Flow - Scenario 2 - Case 2 - Projects 1-4 & 5 - Private Investor Perspective
Scenario 2 - Case 2 - Projects 1-4&5 - Jessica Perspective
-100000000
0
100000000
200000000
300000000
400000000
500000000
-2 1 4 7 10 13 16 19 22 25
years
Gross Agg. Cashflow - w/o CP Net Agg. Cashflow - w/o CP
Figure 11: Cash Flow - Scenario 2 - Case 2 - Projects 1-4 & 5 - JESSICA Perspective
The main points to be noted for this scenario are the following:
In this Scenario (2) all the conclusions are similar to the previous Scenario 1 with the deference that all the parties are better off due to the 14,4 % Grant that is coming from the Cohesion Fund
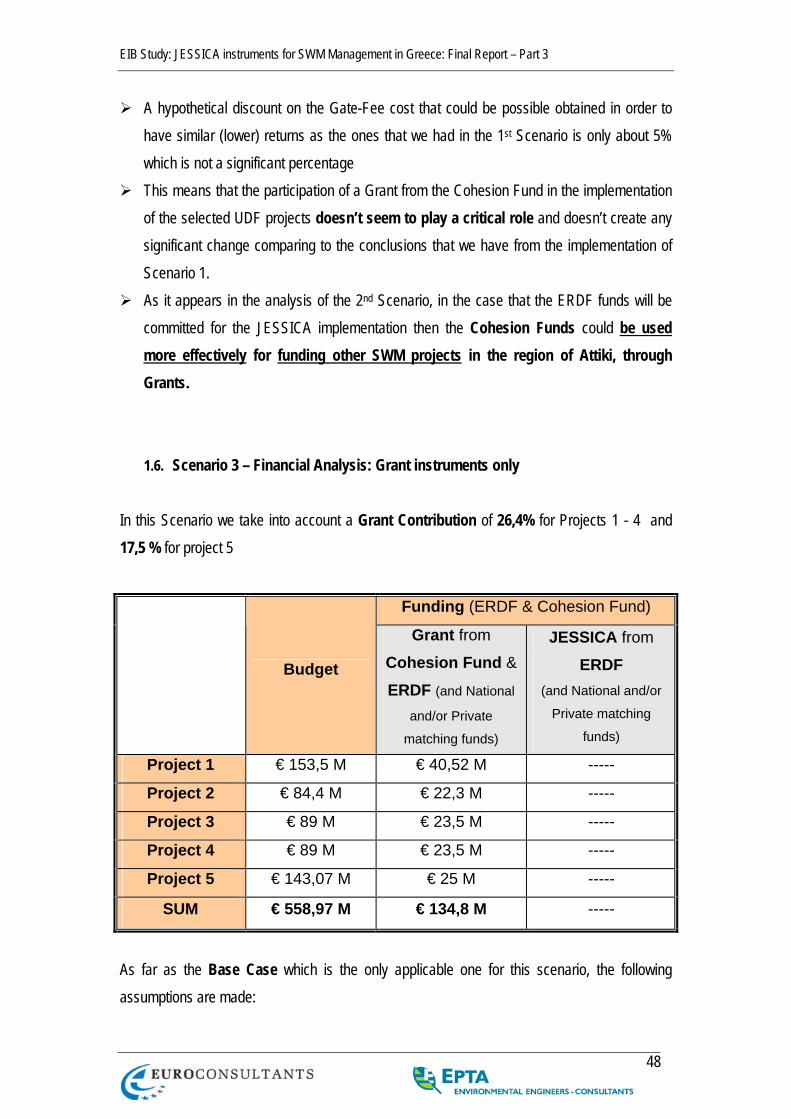
EIB Study: JESSICA instruments for SWM Management in Greece: Final Report – Part 3
48
A hypothetical discount on the Gate-Fee cost that could be possible obtained in order to have similar (lower) returns as the ones that we had in the 1st Scenario is only about 5% which is not a significant percentage
This means that the participation of a Grant from the Cohesion Fund in the implementation of the selected UDF projects doesn’t seem to play a critical role and doesn’t create any significant change comparing to the conclusions that we have from the implementation of Scenario 1.
As it appears in the analysis of the 2nd Scenario, in the case that the ERDF funds will be committed for the JESSICA implementation then the Cohesion Funds could be used more effectively for funding other SWM projects in the region of Attiki, through Grants.
1.6. Scenario 3 – Financial Analysis: Grant instruments only In this Scenario we take into account a Grant Contribution of 26,4% for Projects 1 - 4 and 17,5 % for project 5
Funding (ERDF & Cohesion Fund)
Budget
Grant from
Cohesion Fund &
ERDF (and National
and/or Private
matching funds)
JESSICA from
ERDF (and National and/or
Private matching
funds)
Project 1 € 153,5 M € 40,52 M -----
Project 2 € 84,4 M € 22,3 M -----
Project 3 € 89 M € 23,5 M -----
Project 4 € 89 M € 23,5 M -----
Project 5 € 143,07 M € 25 M -----
SUM € 558,97 M € 134,8 M -----
As far as the Base Case which is the only applicable one for this scenario, the following assumptions are made:
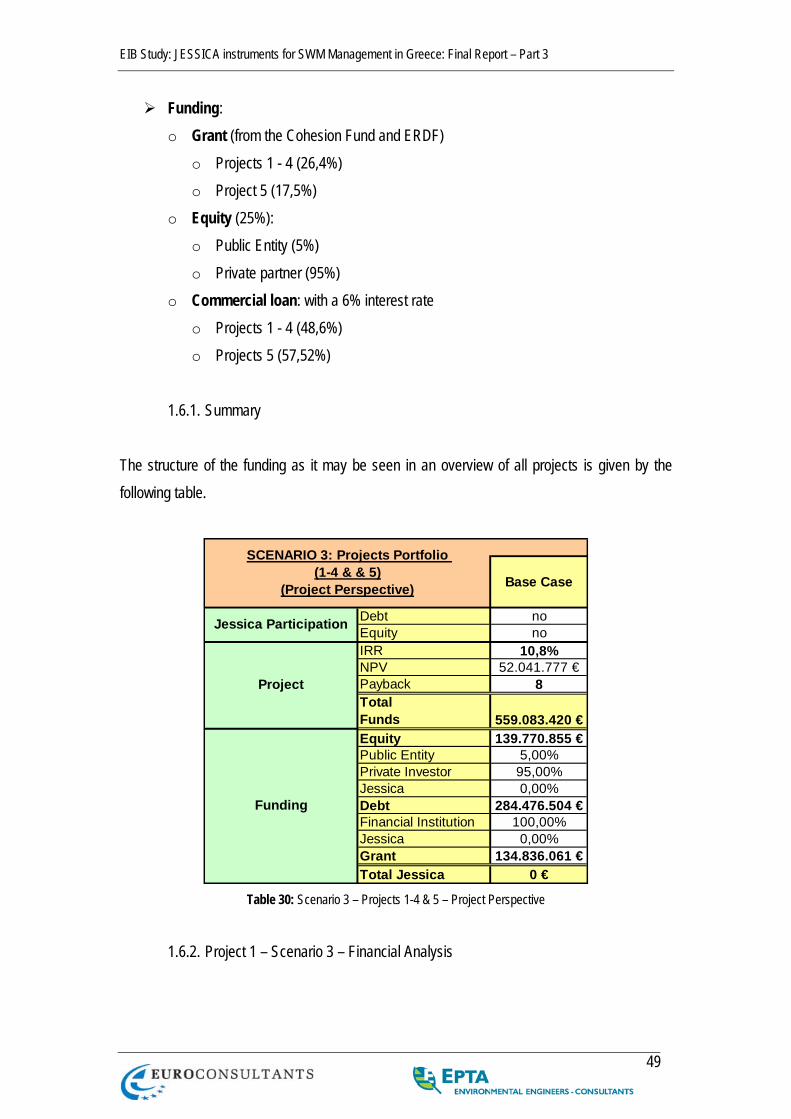
EIB Study: JESSICA instruments for SWM Management in Greece: Final Report – Part 3
49
Funding: o Grant (from the Cohesion Fund and ERDF)
o Projects 1 - 4 (26,4%) o Project 5 (17,5%)
o Equity (25%): o Public Entity (5%) o Private partner (95%)
o Commercial loan: with a 6% interest rate o Projects 1 - 4 (48,6%) o Projects 5 (57,52%)
1.6.1. Summary
The structure of the funding as it may be seen in an overview of all projects is given by the following table.
Base Case
Debt noEquity noIRR 10,8%NPV 52.041.777 €Payback 8TotalFunds 559.083.420 €Equity 139.770.855 €Public Entity 5,00%Private Investor 95,00%Jessica 0,00%Debt 284.476.504 €Financial Institution 100,00%Jessica 0,00%Grant 134.836.061 €Total Jessica 0 €
Jessica Participation
Project
Funding
SCENARIO 3: Projects Portfolio (1-4 & & 5)
(Project Perspective)
Table 30: Scenario 3 – Projects 1-4 & 5 – Project Perspective
1.6.2. Project 1 – Scenario 3 – Financial Analysis
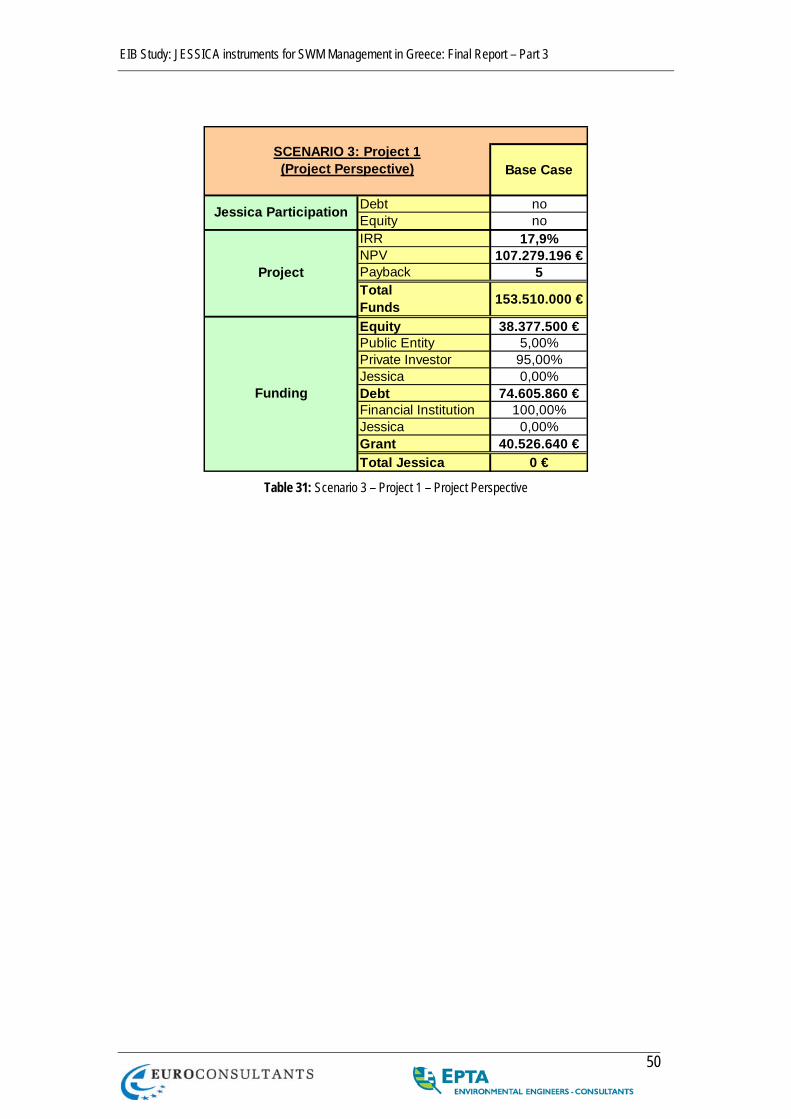
EIB Study: JESSICA instruments for SWM Management in Greece: Final Report – Part 3
50
Base Case
Debt noEquity noIRR 17,9%NPV 107.279.196 €Payback 5TotalFunds 153.510.000 €
Equity 38.377.500 €Public Entity 5,00%Private Investor 95,00%Jessica 0,00%Debt 74.605.860 €Financial Institution 100,00%Jessica 0,00%Grant 40.526.640 €Total Jessica 0 €
SCENARIO 3: Project 1(Project Perspective)
Jessica Participation
Project
Funding
Table 31: Scenario 3 – Project 1 – Project Perspective
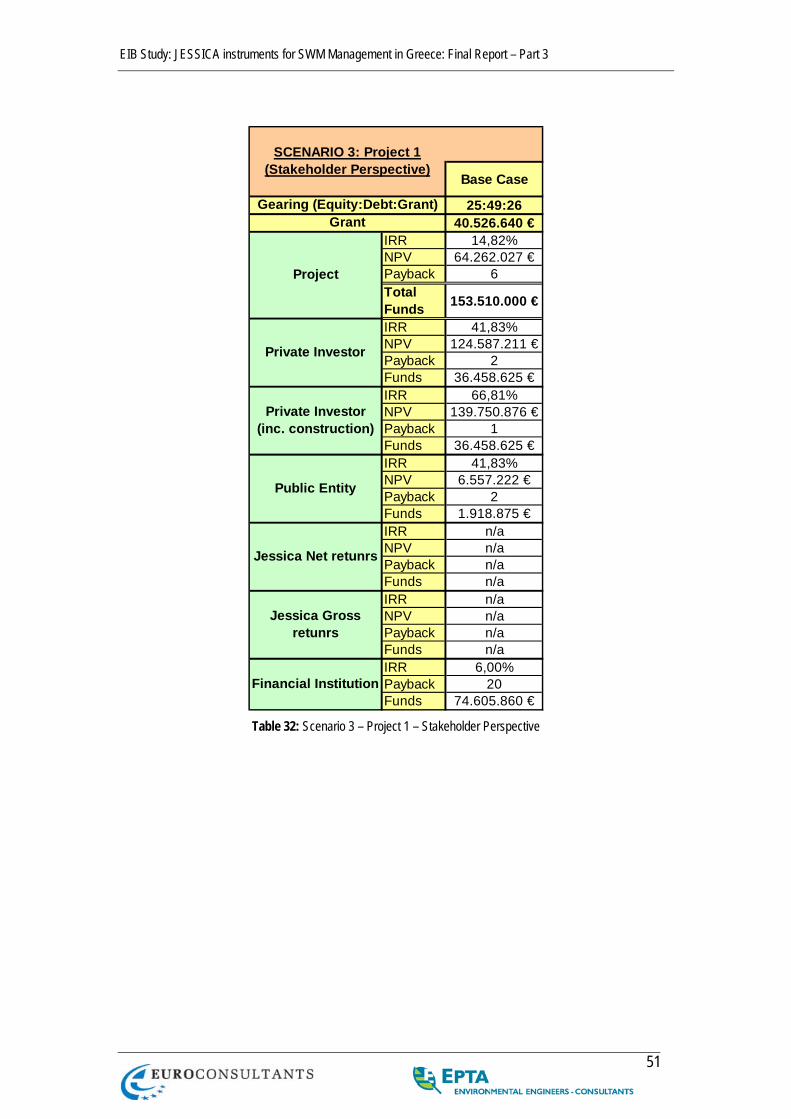
EIB Study: JESSICA instruments for SWM Management in Greece: Final Report – Part 3
51
Base Case
25:49:2640.526.640 €
IRR 14,82%NPV 64.262.027 €Payback 6TotalFunds 153.510.000 €
IRR 41,83%NPV 124.587.211 €Payback 2Funds 36.458.625 €IRR 66,81%NPV 139.750.876 €Payback 1Funds 36.458.625 €IRR 41,83%NPV 6.557.222 €Payback 2Funds 1.918.875 €IRR n/aNPV n/aPayback n/aFunds n/aIRR n/aNPV n/aPayback n/aFunds n/aIRR 6,00%Payback 20Funds 74.605.860 €
SCENARIO 3: Project 1(Stakeholder Perspective)
Gearing (Equity:Debt:Grant)Grant
Project
Private Investor
Private Investor (inc. construction)
Public Entity
Jessica Net retunrs
Jessica Gross retunrs
Financial Institution
Table 32: Scenario 3 – Project 1 – Stakeholder Perspective

EIB Study: JESSICA instruments for SWM Management in Greece: Final Report – Part 3
52
1.6.3. Project 2 – Scenario 3 – Financial Analysis
Base Case
Debt noEquity noIRR 19,6%NPV 75.594.696 €Payback 4TotalFunds 84.430.500 €Equity 21.107.625 €Public Entity 5,00%Private Investor 95,00%Jessica 0,00%Debt 41.033.223 €Financial Institution 100,00%Jessica 0,00%Grant 22.289.652 €Total Jessica 0 €
SCENARIO 3: Project 2(Project Perspective)
Jessica Participation
Project
Funding
Table 33: Scenario 3 – Project 2 – Project Perspective

EIB Study: JESSICA instruments for SWM Management in Greece: Final Report – Part 3
53
Base Case
25:49:2622.289.652 €
IRR 16,68%NPV 51.014.568 €Payback 5TotalFunds 84.430.500 €
IRR 45,73%NPV 84.348.264 €Payback 2Funds 20.052.244 €IRR 71,33%NPV 92.785.396 €Payback 1Funds 20.052.244 €IRR 45,73%NPV 4.439.382 €Payback 2Funds 1.055.381 €IRR n/aNPV n/aPayback n/aFunds n/aIRR n/aNPV n/aPayback n/aFunds n/aIRR 6,00%Payback 20Funds 41.033.223 €
SCENARIO 3: Project 2(Stakeholder Perspective)
Gearing (Equity:Debt:Grant)Grant
Project
Private Investor
Private Investor (inc. construction)
Public Entity
Jessica Net retunrs
Jessica Gross retunrs
Financial Institution
Table 34: Scenario 3 – Project 2 – Stakeholder Perspective

EIB Study: JESSICA instruments for SWM Management in Greece: Final Report – Part 3
54
1.6.4. Project 3 – Scenario 3 – Financial Analysis
Base Case
Debt noEquity noIRR 4,3%NPV -28.889.102 €Payback 14TotalFunds 89.035.800 €Equity 22.258.950 €Public Entity 5,00%Private Investor 95,00%Jessica 0,00%Debt 43.271.399 €Financial Institution 100,00%Jessica 0,00%Grant 23.505.451 €Total Jessica 0 €
SCENARIO 3: Project 3(Project Perspective)
Jessica Participation
Project
Funding
Table 35: Scenario 3 – Project 3 – Project Perspective
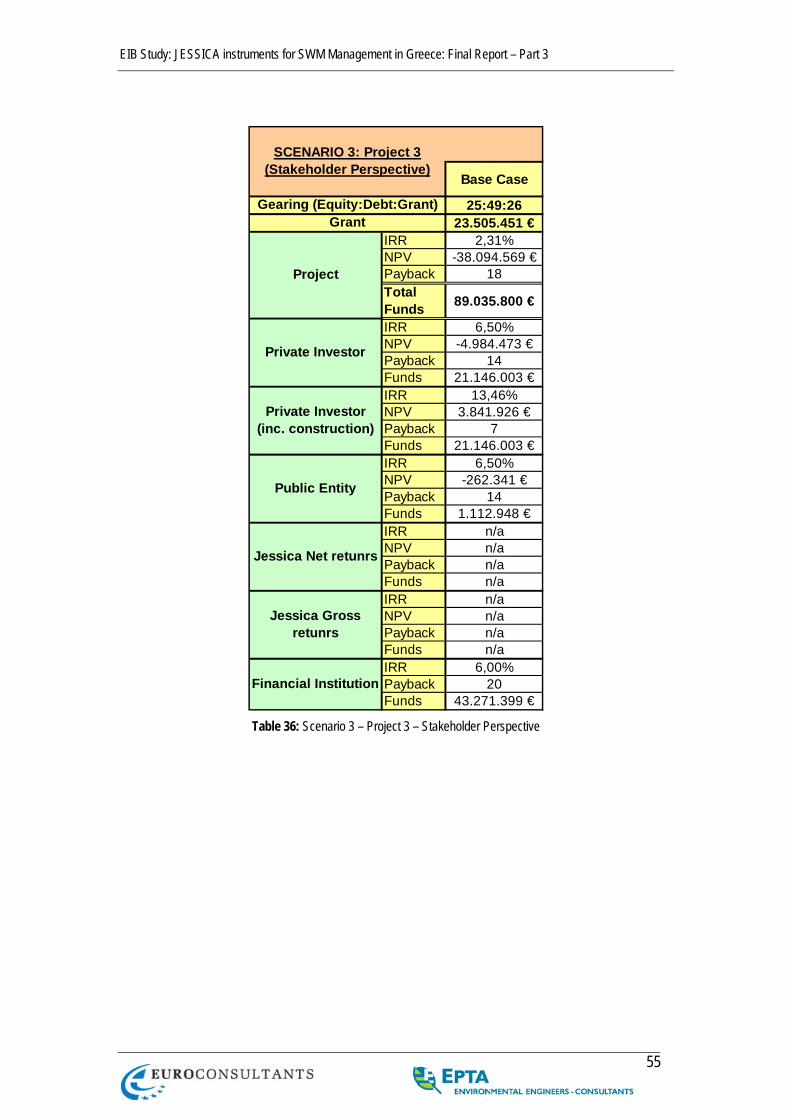
EIB Study: JESSICA instruments for SWM Management in Greece: Final Report – Part 3
55
Base Case
25:49:2623.505.451 €
IRR 2,31%NPV -38.094.569 €Payback 18TotalFunds 89.035.800 €
IRR 6,50%NPV -4.984.473 €Payback 14Funds 21.146.003 €IRR 13,46%NPV 3.841.926 €Payback 7Funds 21.146.003 €IRR 6,50%NPV -262.341 €Payback 14Funds 1.112.948 €IRR n/aNPV n/aPayback n/aFunds n/aIRR n/aNPV n/aPayback n/aFunds n/aIRR 6,00%Payback 20Funds 43.271.399 €
SCENARIO 3: Project 3(Stakeholder Perspective)
Gearing (Equity:Debt:Grant)Grant
Project
Private Investor
Private Investor (inc. construction)
Public Entity
Jessica Net retunrs
Jessica Gross retunrs
Financial Institution
Table 36: Scenario 3 – Project 3 – Stakeholder Perspective
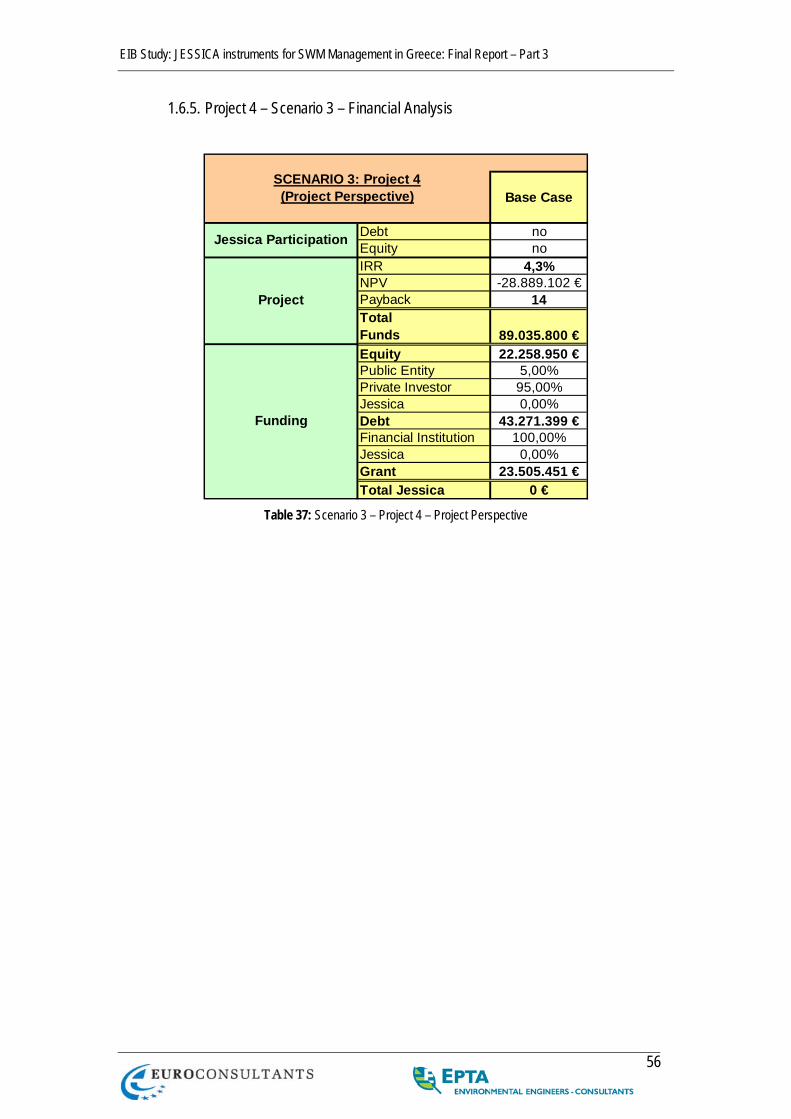
EIB Study: JESSICA instruments for SWM Management in Greece: Final Report – Part 3
56
1.6.5. Project 4 – Scenario 3 – Financial Analysis
Base Case
Debt noEquity noIRR 4,3%NPV -28.889.102 €Payback 14TotalFunds 89.035.800 €Equity 22.258.950 €Public Entity 5,00%Private Investor 95,00%Jessica 0,00%Debt 43.271.399 €Financial Institution 100,00%Jessica 0,00%Grant 23.505.451 €Total Jessica 0 €
SCENARIO 3: Project 4(Project Perspective)
Jessica Participation
Project
Funding
Table 37: Scenario 3 – Project 4 – Project Perspective

EIB Study: JESSICA instruments for SWM Management in Greece: Final Report – Part 3
57
Base Case
25:49:2623.505.451 €
IRR 2,31%NPV -38.094.569 €Payback 18TotalFunds 89.035.800 €
IRR 6,50%NPV -4.984.473 €Payback 14Funds 21.146.003 €IRR 13,46%NPV 3.841.926 €Payback 7Funds 21.146.003 €IRR 6,50%NPV -262.341 €Payback 14Funds 1.112.948 €IRR n/aNPV n/aPayback n/aFunds n/aIRR n/aNPV n/aPayback n/aFunds n/aIRR 6,00%Payback 20Funds 43.271.399 €
SCENARIO 3: Project 4(Stakeholder Perspective)
Gearing (Equity:Debt:Grant)Grant
Project
Private Investor
Private Investor (inc. construction)
Public Entity
Jessica Net retunrs
Jessica Gross retunrs
Financial Institution
Table 38: Scenario 3 – Project 4 – Stakeholder Perspective
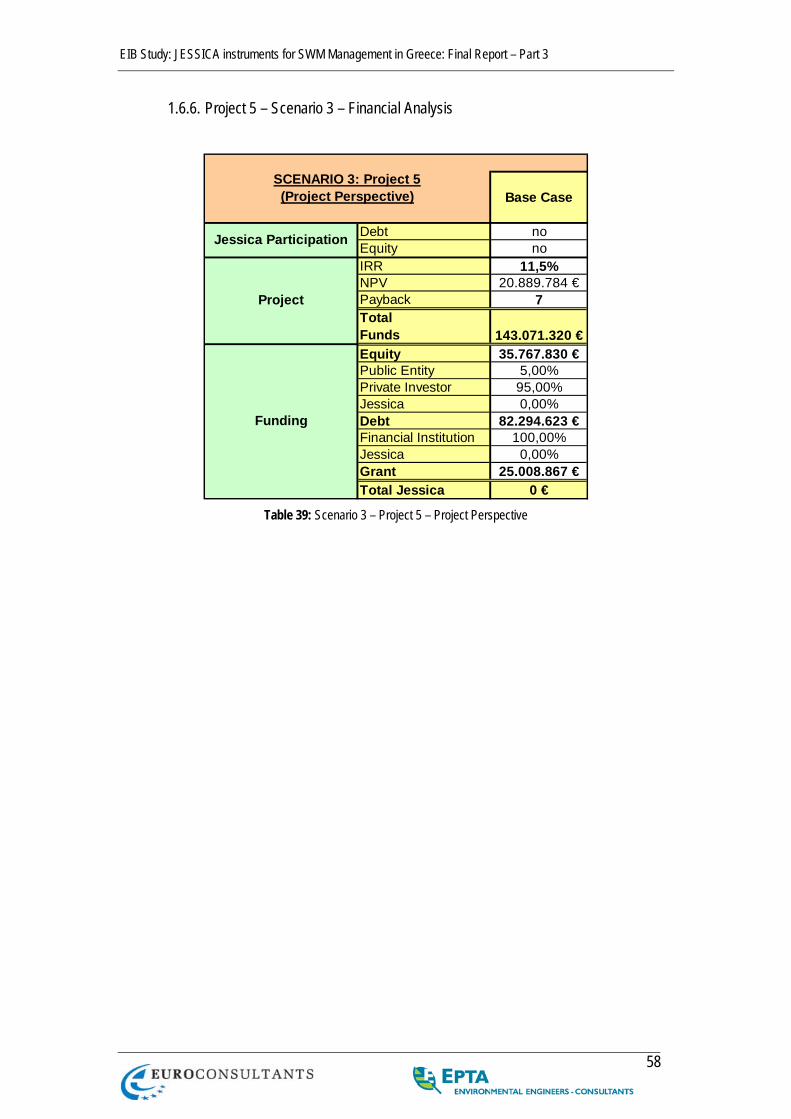
EIB Study: JESSICA instruments for SWM Management in Greece: Final Report – Part 3
58
1.6.6. Project 5 – Scenario 3 – Financial Analysis
Base Case
Debt noEquity noIRR 11,5%NPV 20.889.784 €Payback 7TotalFunds 143.071.320 €Equity 35.767.830 €Public Entity 5,00%Private Investor 95,00%Jessica 0,00%Debt 82.294.623 €Financial Institution 100,00%Jessica 0,00%Grant 25.008.867 €Total Jessica 0 €
SCENARIO 3: Project 5(Project Perspective)
Jessica Participation
Project
Funding
Table 39: Scenario 3 – Project 5 – Project Perspective

EIB Study: JESSICA instruments for SWM Management in Greece: Final Report – Part 3
59
Base Case
25:58:1725.008.867 €
IRR 10,14%NPV 6.558.361 €Payback 8TotalFunds 143.071.320 €
IRR 27,37%NPV 55.788.644 €Payback 3Funds 33.979.439 €IRR 46,40%NPV 69.920.347 €Payback 2Funds 33.979.439 €IRR 27,37%NPV 2.936.244 €Payback 3Funds 1.788.392 €IRR n/aNPV n/aPayback n/aFunds n/aIRR n/aNPV n/aPayback n/aFunds n/aIRR 6,00%Payback 20Funds 82.294.623 €
SCENARIO 3: Project 5(Stakeholder Perspective)
Gearing (Equity:Debt:Grant)Grant
Project
Private Investor
Private Investor (inc. construction)
Public Entity
Jessica Net retunrs
Jessica Gross retunrs
Financial Institution
Table 40: Scenario 3 – Project 5 – Stakeholder Perspective
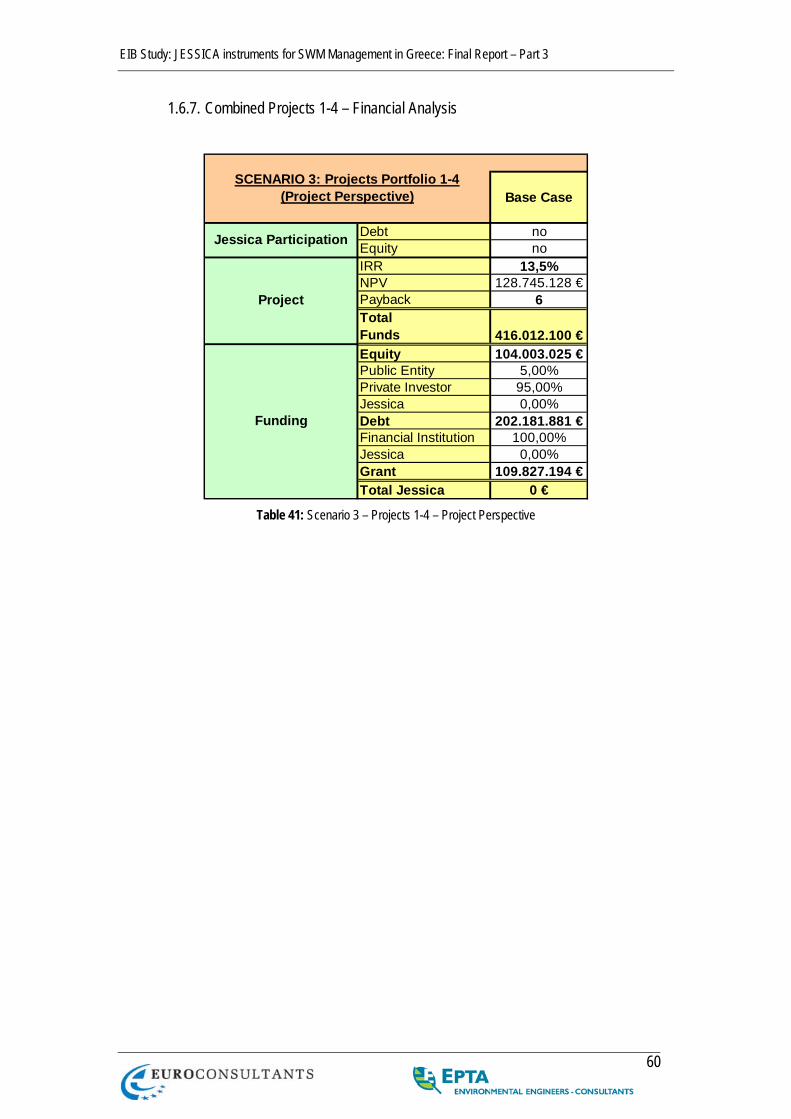
EIB Study: JESSICA instruments for SWM Management in Greece: Final Report – Part 3
60
1.6.7. Combined Projects 1-4 – Financial Analysis
Base Case
Debt noEquity noIRR 13,5%NPV 128.745.128 €Payback 6TotalFunds 416.012.100 €Equity 104.003.025 €Public Entity 5,00%Private Investor 95,00%Jessica 0,00%Debt 202.181.881 €Financial Institution 100,00%Jessica 0,00%Grant 109.827.194 €Total Jessica 0 €
SCENARIO 3: Projects Portfolio 1-4(Project Perspective)
Jessica Participation
Project
Funding
Table 41: Scenario 3 – Projects 1-4 – Project Perspective
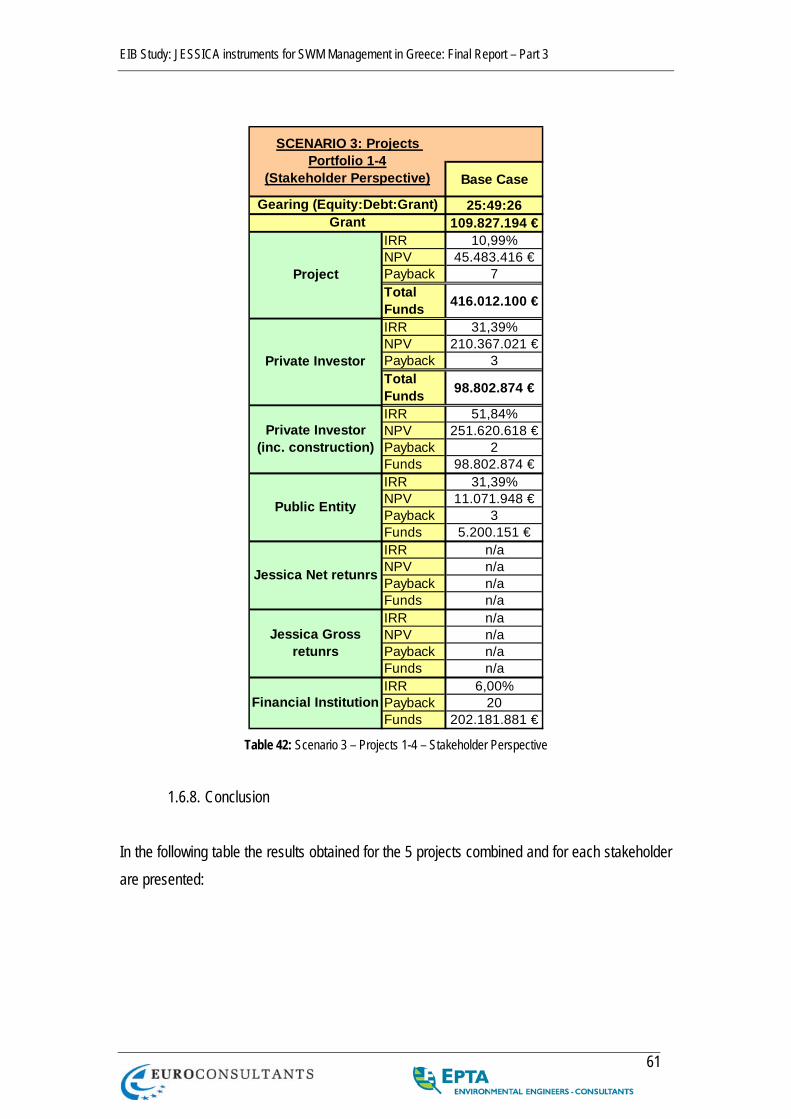
EIB Study: JESSICA instruments for SWM Management in Greece: Final Report – Part 3
61
Base Case
25:49:26109.827.194 €
IRR 10,99%NPV 45.483.416 €Payback 7TotalFunds 416.012.100 €
IRR 31,39%NPV 210.367.021 €Payback 3TotalFunds 98.802.874 €
IRR 51,84%NPV 251.620.618 €Payback 2Funds 98.802.874 €IRR 31,39%NPV 11.071.948 €Payback 3Funds 5.200.151 €IRR n/aNPV n/aPayback n/aFunds n/aIRR n/aNPV n/aPayback n/aFunds n/aIRR 6,00%Payback 20Funds 202.181.881 €
SCENARIO 3: Projects Portfolio 1-4
(Stakeholder Perspective)
Gearing (Equity:Debt:Grant)Grant
Project
Private Investor
Private Investor (inc. construction)
Public Entity
Jessica Net retunrs
Jessica Gross retunrs
Financial Institution
Table 42: Scenario 3 – Projects 1-4 – Stakeholder Perspective
1.6.8. Conclusion
In the following table the results obtained for the 5 projects combined and for each stakeholder are presented:
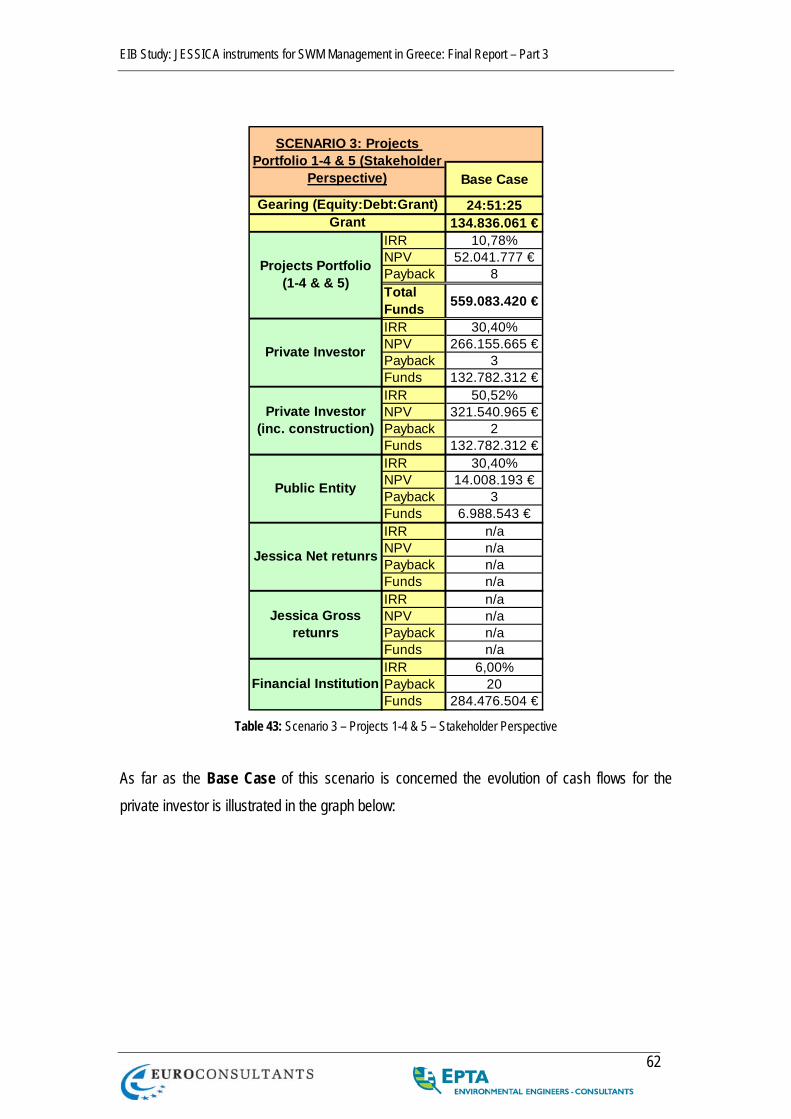
EIB Study: JESSICA instruments for SWM Management in Greece: Final Report – Part 3
62
Base Case
24:51:25134.836.061 €
IRR 10,78%NPV 52.041.777 €Payback 8TotalFunds 559.083.420 €
IRR 30,40%NPV 266.155.665 €Payback 3Funds 132.782.312 €IRR 50,52%NPV 321.540.965 €Payback 2Funds 132.782.312 €IRR 30,40%NPV 14.008.193 €Payback 3Funds 6.988.543 €IRR n/aNPV n/aPayback n/aFunds n/aIRR n/aNPV n/aPayback n/aFunds n/aIRR 6,00%Payback 20Funds 284.476.504 €
SCENARIO 3: Projects Portfolio 1-4 & 5 (Stakeholder
Perspective)
Gearing (Equity:Debt:Grant)Grant
Jessica Net retunrs
Jessica Gross retunrs
Financial Institution
Projects Portfolio (1-4 & & 5)
Private Investor
Private Investor (inc. construction)
Public Entity
Table 43: Scenario 3 – Projects 1-4 & 5 – Stakeholder Perspective
As far as the Base Case of this scenario is concerned the evolution of cash flows for the private investor is illustrated in the graph below:
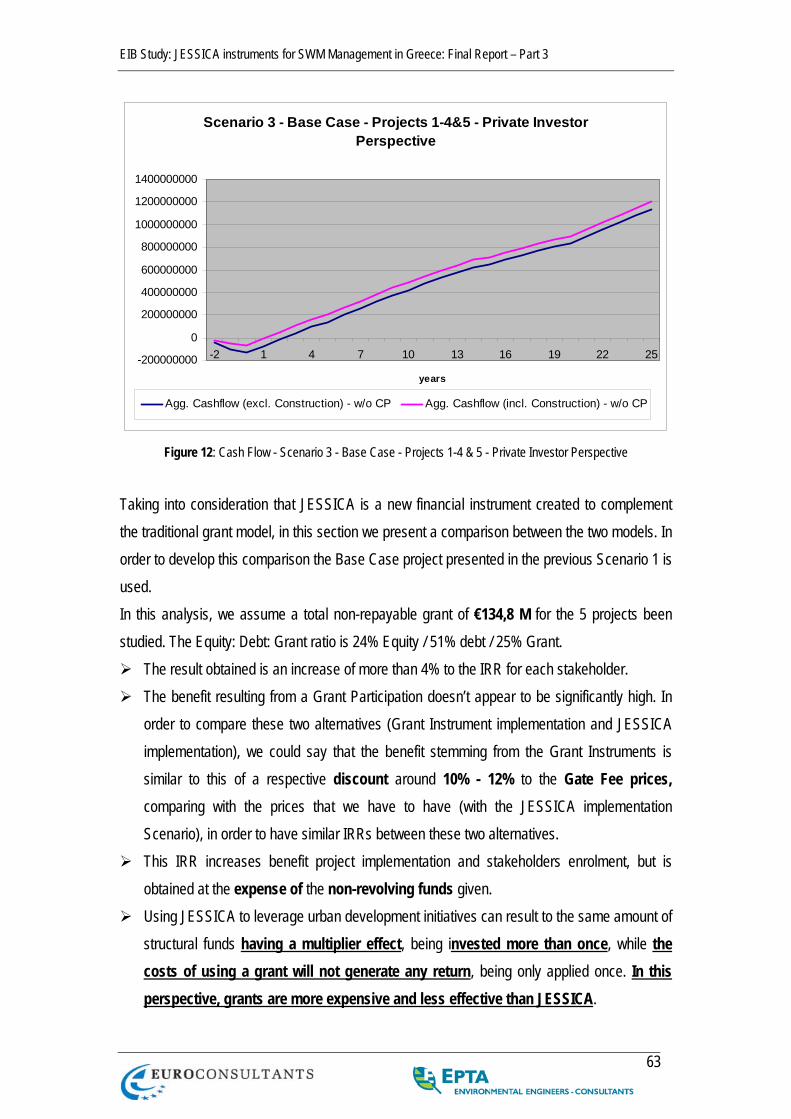
EIB Study: JESSICA instruments for SWM Management in Greece: Final Report – Part 3
63
Scenario 3 - Base Case - Projects 1-4&5 - Private Investor Perspective
-200000000
0
200000000
400000000
600000000
800000000
1000000000
1200000000
1400000000
-2 1 4 7 10 13 16 19 22 25
years
Agg. Cashflow (excl. Construction) - w/o CP Agg. Cashflow (incl. Construction) - w/o CP
Figure 12: Cash Flow - Scenario 3 - Base Case - Projects 1-4 & 5 - Private Investor Perspective
Taking into consideration that JESSICA is a new financial instrument created to complement the traditional grant model, in this section we present a comparison between the two models. In order to develop this comparison the Base Case project presented in the previous Scenario 1 is used. In this analysis, we assume a total non-repayable grant of €134,8 M for the 5 projects been studied. The Equity: Debt: Grant ratio is 24% Equity / 51% debt / 25% Grant.
The result obtained is an increase of more than 4% to the IRR for each stakeholder. The benefit resulting from a Grant Participation doesn’t appear to be significantly high. In
order to compare these two alternatives (Grant Instrument implementation and JESSICA implementation), we could say that the benefit stemming from the Grant Instruments is similar to this of a respective discount around 10% - 12% to the Gate Fee prices, comparing with the prices that we have to have (with the JESSICA implementation Scenario), in order to have similar IRRs between these two alternatives.
This IRR increases benefit project implementation and stakeholders enrolment, but is obtained at the expense of the non-revolving funds given.
Using JESSICA to leverage urban development initiatives can result to the same amount of structural funds having a multiplier effect, being invested more than once, while the costs of using a grant will not generate any return, being only applied once. In this perspective, grants are more expensive and less effective than JESSICA.
EIB Study: JESSICA instruments for SWM Management in Greece: Final Report – Part 3
64
On a public perspective, an economic and social benefit deriving from the projects implementation itself and from the public economic gains should be compared with the opportunity costs of using structural funds that could be returned and re-used if these were applied through a JESSICA instrument.
With JESSICA Participation, as we have seen in the previous Scenarios, an increase of stakeholders interest in the project is expected; namely from the financial institutions.
1.7. Main Conclusions from Scenario Analysis
Significant contribution to satisfy Financing needs for the Implementation of large SWM
projects JESSICA –UDF contribution to a better Risk allocation regarding the initial SWM projects
which are going to be implemented in Greece through a Concession / PPP contract JESSICA –UDF contribution to a better distribution of satisfactory economic benefits –
dividends and Investment returns to Stockholders Option for a return of invested Capital back to the JESSICA –UDF in a period of 5 – 7
years (construction period of 3 years included), with a significant possibility for reinvesting – financing new sustainable urban development projects for covering relative needs after the current ERDF period
With the implementation of JESSICA mechanism, the funds will return to the UDF, either on a dividends basis, or on a loan basis (with interest), in order to create a revolving funding system (reinvestment on other projects)
From a public perspective, the examined projects that have serious revenue generating characteristics compensate totally the public investment made
With JESSICA, various inefficiencies could be solved; an advanced mechanism and an efficient system of assuring a proper and most effective use of public funds and resources will be established and more permanent multiplying effect of funds can be expected as a result
This means that, from a public sector perspective, the predominant culture will be transformed from a "giving away" funds culture without any effective control of the final outcome, into a culture of investing public funds more efficiently, where effective outcome control mechanisms will be implemented.

EIB Study: JESSICA instruments for SWM Management in Greece: Final Report – Part 3
65
Through the implementation of JESSICA instruments not only a risk buffer for the financial institution perspective is created which acts as a leverage force (similar to the one created through the use of Grants), but also an improved project governance and Risk Management mechanism is established; This has a very positive impact on the overall and effective control of project risk and will also improve project quality
Saving Resources from the Public Investments Program; Available resources for other projects
Enhanced leverage of Private Investments in ths SWM Sector Optimization of the medium – long term benefit and the value added that is achieved, for
the Public Sector and the Citizens, through the utilization of Public (EU and National) resources. Avoidance of constrains coming from focusing on short term benefits only (through the participation of Grant instruments only)
Less bureaucracy and time spent by Managing Authority (Ministry) on monitoring and every-day document processing due to the delegation of project selection and fund management from the Managing Authority to external body. Possibility of implementation of the selection procedure from an independence authority - HF Manager (e.g EIB)
Variety and elasticity of financial instruments (loans, equity, guarantees, mezzanine), quicker payment from EC and greater availability of funds
Financial institutions which have the appropriate & significant experience - know how (e.g. relative fund management experience and financing of relative urban development projects), might show interest in undertaking UDF Management
Little chance to build leverage for UDFs or HFs with banks Significant possibility for attracting financial institutions interest to leverage projects
selected by JESSICA, on a project base (e.g. SPVs), particularly in the case of a Bank that will undertake the Management of the Fund
An immediate creation – operation of the JESSICA UDF is needed in order for it to have the possibility of participating in mature SWM projects which are ready to be tendered; appropriate projection of JESSICA participation needed to be included in the Tender Documents
EIB Study: JESSICA instruments for SWM Management in Greece: Final Report – Part 3
66
2. JESSICA LEGAL & MANAGEMENT FRAMEWORK
2.1. LEGAL FRAMEWORK
2.1.1. EU Regulations Regulation 1083/2006 encloses the general provisions on the European Regional Development Fund, the European Social Fund and the Cohesion Fund and repealing Regulation (EC) No 1260/1999. Article 44 of the Regulation provides for financial engineering instruments giving structural funds the opportunity, “as part of an operational program, to finance expenditure in respect of an operation comprising contributions to support financial engineering instruments for enterprises, guarantee funds, loan funds and for urban development funds”. According to the regulation, urban development funds are defined as funds investing in public-private partnerships and other projects included in an integrated plan for sustainable urban development. Regulation 1828/2006 is setting out the rules for the implementation of Council Regulation (EC) 1083/2006 and Regulation (EC) 1080/2006 of the European Parliament and of the Council on the European Regional Development Fund Of particular interest in the context of the current study are articles 43-46 (section 8) which provide for :
• The general provisions applicable to financial engineering instruments (specifications of the business plan submitted by the co-financing partners or shareholders of funds, legal status of funds, management costs, specifications of the funding agreement between the MAs and financial engineering instrument) – article 43
• Additional provisions of the holding funds (funding agreement specifications, evaluation studies) – article 44
• Additional provisions applicable to urban development funds. Article 46 provides for the following :
- Where structural funds finance urban development funds, those funds shall invest in public- private partnerships or other projects included in an integrated plan for sustainable urban development. Such public-private partnerships or other projects shall not include the creation and development of financial instruments such as venture capital, loan and guarantee funds
EIB Study: JESSICA instruments for SWM Management in Greece: Final Report – Part 3
67
- Urban development funds shall invest by means of equity, loans and guarantees. Urban projects receiving grant assistance from an operational program may also be supported by urban development funds - Where structural funds finance urban development funds, the funds concerned shall not re-finance acquisitions or participations in projects already completed.
2.1.2. NSRF 2007-13
The administration, management and implementation of development interventions in the context of the programming period 2007 – 2013 are regulated by the Law 3614/2007. Regarding financial engineering tools, there is a relative provision in Article 24 of Law 3614/2007, based on the Regulations (EC) 1083/2006 and 1828/2006. More specifically, in Article 24 – paragraph 1 of the Law 3614/2007 there is a provision for the establishment of Funds, or Funds of Funds, which will be financed through Operational Programs of NSRF. The establishment of the above financial engineering instruments is activated via a joint ministerial decision (Minister of Economy and Finance and the competent minister according to the funds’ objectives), which will also provide for the specifications, requirements and appropriate details for the organization and operation of the funds. In addition, in Article 24 - paragraph 3 of the Law 3614/2007 there is provision for the existing state owned financing institution “Consignment & Depository Trust (CDT)” to undertake the management of separate financing entities serving as Urban Development Funds. The operation framework of the UDFs and the responsibilities of the CDT will be determined by a Presidential decree, after a relative joint proposal of the Ministry of Interior & the Ministry of Economy & Finance. Finally in Article 24 - paragraph 4 of the Law 3614/2007 there is a provision for Local Authorities (Municipalities & Prefectures) to associate with Financial Institutions in order to establish UDFs.
2.1.3. Equity Fund Legal Framework The Greek Venture Capital (VC) & Private Equity (PE) industry has been active in Greece and in the South East European Region since the early ‘90s. The Greek Venture Capital market starts to develop and acquire considerable size after 1997. At that point a significant
EIB Study: JESSICA instruments for SWM Management in Greece: Final Report – Part 3
68
percentage of the investment capitals are raised and two major funds are established by the foreign firm Parthenon Trust, in 1998 (350 million euro) and in 2001 (750 million euro). Since then private and semi-public financing institutions for high-technology ventures were developed to satisfy a slowly emerging demand (i.e. TANEO). A few private VCs emerged either as affiliates to large banks or as initiatives of other financing institutions. Foreign VCs funding research-intensive start-ups were identified. The commercial banks have acted as intermediaries in the flow of small volumes of funding from the Operational Programmes to SMEs and microenterprises, thus reducing the administrative burden of the managing authorities of the programmes and facilitating access to the funds for the beneficiaries. The first attempt to set a legal framework which will give incentives for the growth of the VC industry was made with the enforcement of Law 1775/88. The aforementioned law introduced the Venture Capital Provision Firms (EPEK). These structures were obliged to have the legal form of a Greek Société Anonyme (S.A.). and 51% of the firms’ portfolio should consist of investments in high technology companies. A new legislative regulation was introduced in 2002, by Law 2992/2002 aiming to further support the growth of the Venture Capital Industry. The law foresees the establishment of AKES which is a closed-end venture capital mutual fund, formed as a partnership. The structure is tax transparent for domestic and non-domestic investors with the ability to be exempted from having a permanent establishment when investing through the fund. Both management fees and carried interest are not liable to VAT. AKES pay corporate income taxes at a rate of 20% of profits distributed to shareholders. Corporate income tax does not apply to corporate profits which are not distributed to shareholders but are retained within the company for reinvestment. However, the AKES is not free from undue restrictions and can only invest in non-listed Greek Société Anonyme and Limited Liability Companies. The law enables the transformation of EKES operating under Law 2367/1995 to AKES without any tax (article 7). In 2000 Law 2843/2000 established the New Economy Development Fund S.A. (TANEO). TANEO is a Greek government backed Fund-of-Funds. Initially the government was the only investor, but later on the fund raised also private capital. Based in Athens, the fund has 150 million euro under management, 105 of which come from foreign investment institutions and Greek investors and 45 million euro from the Greek government. The fund was structured by the UK fund of funds group Westport Private Equity. TANEO’s mission is to produce financial returns at the same time as jump-starting the venture capital industry and boosting the Greek
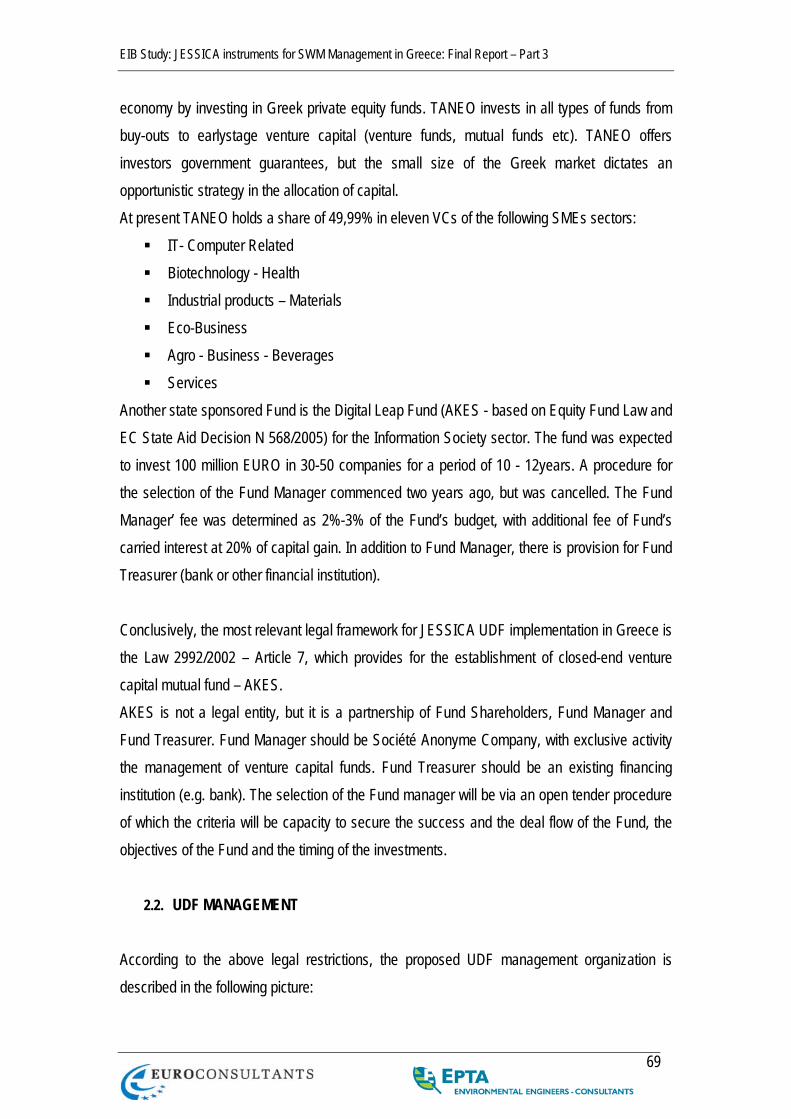
EIB Study: JESSICA instruments for SWM Management in Greece: Final Report – Part 3
69
economy by investing in Greek private equity funds. TANEO invests in all types of funds from buy-outs to earlystage venture capital (venture funds, mutual funds etc). TANEO offers investors government guarantees, but the small size of the Greek market dictates an opportunistic strategy in the allocation of capital. At present TANEO holds a share of 49,99% in eleven VCs of the following SMEs sectors:
IT- Computer Related Biotechnology - Health Industrial products – Materials Eco-Business Agro - Business - Beverages Services
Another state sponsored Fund is the Digital Leap Fund (AKES - based on Equity Fund Law and EC State Aid Decision N 568/2005) for the Information Society sector. The fund was expected to invest 100 million EURO in 30-50 companies for a period of 10 - 12years. A procedure for the selection of the Fund Manager commenced two years ago, but was cancelled. The Fund Manager’ fee was determined as 2%-3% of the Fund’s budget, with additional fee of Fund’s carried interest at 20% of capital gain. In addition to Fund Manager, there is provision for Fund Treasurer (bank or other financial institution). Conclusively, the most relevant legal framework for JESSICA UDF implementation in Greece is the Law 2992/2002 – Article 7, which provides for the establishment of closed-end venture capital mutual fund – AKES. AKES is not a legal entity, but it is a partnership of Fund Shareholders, Fund Manager and Fund Treasurer. Fund Manager should be Société Anonyme Company, with exclusive activity the management of venture capital funds. Fund Treasurer should be an existing financing institution (e.g. bank). The selection of the Fund manager will be via an open tender procedure of which the criteria will be capacity to secure the success and the deal flow of the Fund, the objectives of the Fund and the timing of the investments.
2.2. UDF MANAGEMENT According to the above legal restrictions, the proposed UDF management organization is described in the following picture:
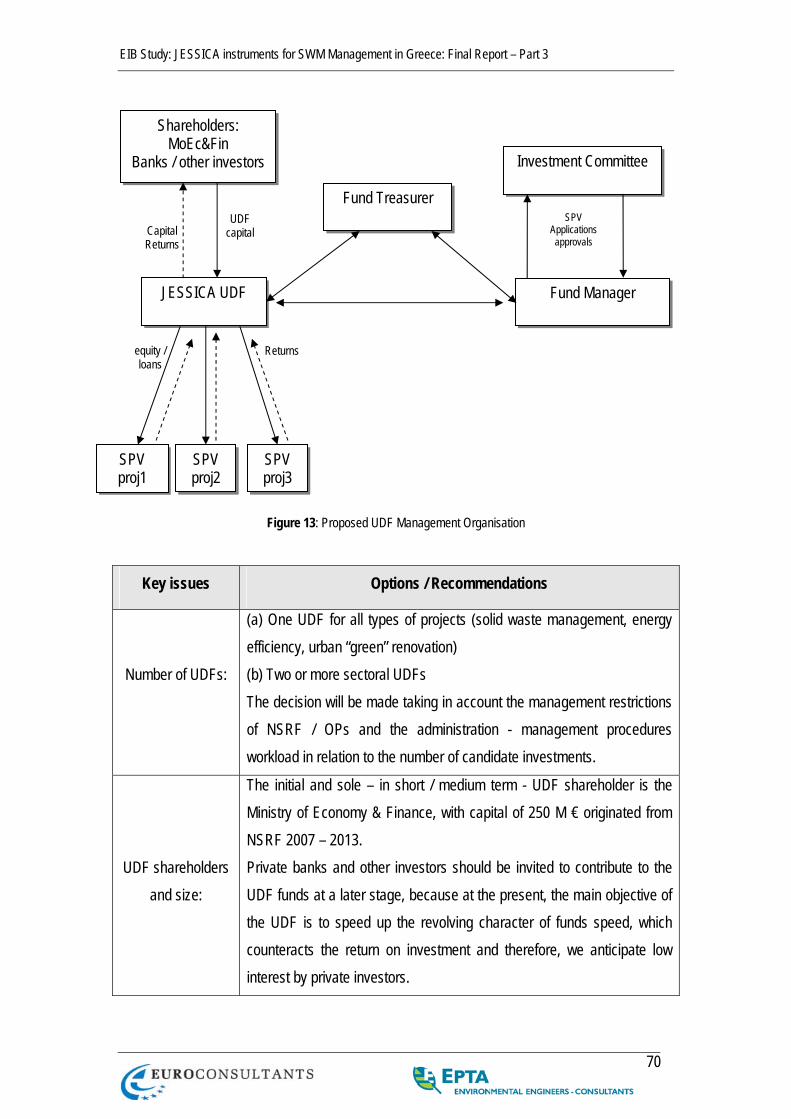
EIB Study: JESSICA instruments for SWM Management in Greece: Final Report – Part 3
70
Figure 13: Proposed UDF Management Organisation
Key issues Options / Recommendations
Number of UDFs:
(a) One UDF for all types of projects (solid waste management, energy efficiency, urban “green” renovation) (b) Two or more sectoral UDFs The decision will be made taking in account the management restrictions of NSRF / OPs and the administration - management procedures workload in relation to the number of candidate investments.
UDF shareholders and size:
The initial and sole – in short / medium term - UDF shareholder is the Ministry of Economy & Finance, with capital of 250 M € originated from NSRF 2007 – 2013. Private banks and other investors should be invited to contribute to the UDF funds at a later stage, because at the present, the main objective of the UDF is to speed up the revolving character of funds speed, which counteracts the return on investment and therefore, we anticipate low interest by private investors.
Shareholders: MoEc&Fin
Banks / other investors
JESSICA UDF
SPV proj1
SPV proj2
SPV proj3
Investment Committee
Fund Manager
UDF capital Capital
Returns
SPV Applicationsapprovals
Fund Treasurer
equity / loans
Returns
EIB Study: JESSICA instruments for SWM Management in Greece: Final Report – Part 3
71
Fund Treasurer:
It should be a Financing Institution, selected through an open tender. It is recommended that the Consignment & Depository Trust (CDT) could be assigned as UDF Treasurer. (In that case, there is no need for an open tender selection procedure, since CDT is a public entity).
Fund Manager / Investment Committee
The Fund Manager should be suitably competent, experienced, authorised and qualified company. The Investment Committee will consist of members that will appointed by the MoEcon&Fin. as well as members (directors) of the Fund Manager. It is recommended that the Fund Manager should have decision making authority in investment strategy and proposals selection.
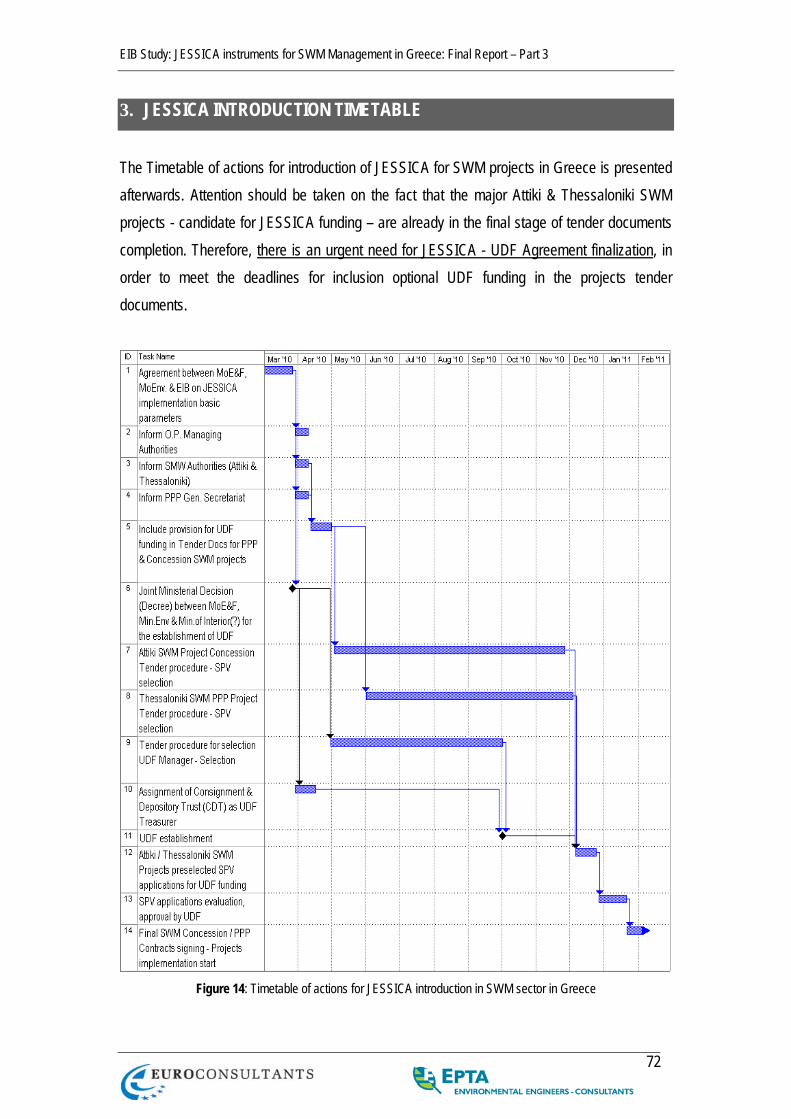
EIB Study: JESSICA instruments for SWM Management in Greece: Final Report – Part 3
72
3. JESSICA INTRODUCTION TIMETABLE The Timetable of actions for introduction of JESSICA for SWM projects in Greece is presented afterwards. Attention should be taken on the fact that the major Attiki & Thessaloniki SWM projects - candidate for JESSICA funding – are already in the final stage of tender documents completion. Therefore, there is an urgent need for JESSICA - UDF Agreement finalization, in order to meet the deadlines for inclusion optional UDF funding in the projects tender documents.
Figure 14: Timetable of actions for JESSICA introduction in SWM sector in Greece