jessica 2014-2020 multi -region study for italy · jessica 2014-2020 multi-region study for italy...
TRANSCRIPT
www.pwc.com www.sinloc.com
DISCLAIMER: This document has been produced with the financial assistance of the European Union. The views expressed herein can in no way be taken to reflect the official opinion of the European Union. Sole responsibility for the views, interpretations or conclusions contained in this document lies with the authors. No representation or warranty express or implied will be made and no liability or responsibility is or will be accepted by the European Investment Bank or the European Commission or the Managing Authorities of Structural Funds Operational Programmes in relation to the accuracy or completeness of the information contained in this document and any such liability is expressly disclaimed. This document is provided for information only. Financial data given in this document has not been audited, the business plans examined for the selected case studies have not been checked and the financial model used for simulations has not been audited. The case studies and financial simulations are purely for theoretical and explanatory illustration purposes. The projects studied in no way anticipate projects that will actually be financed using Financial Instruments. Neither the European Investment Bank nor the European Commission gives any undertaking to provide any additional information or correct any inaccuracies in it.
JESSICA 2014-2020 Multi-
Region Study for Italy
(Marche, Emilia-
Romagna, Lazio, Veneto)
Final Report Date:
31 March 2014
Client:
European Investment
Bank (EIB)
JESSICA 2014-2020 Multi-
Region Study for Italy
(Marche, Emilia-Romagna,
Lazio, Veneto)
Multiregional Study
2
Table of contents
Glossary of terms 3
Definitions 5
Introduction 8
Scope of the study 8
Structure of the Final Report 8
Section 1- Context Overview 9
1. EU Cohesion Policy 2007-2013 10
1.2. Initiatives implemented in Italy 15
1.3. Lessons learned 23
2. Main Opportunities of the 2014-2020 Programme 25
2.1. Legal and policy framework 25
3. State of the art in Italy 36
4. Methodology proposed for the regional analysis 38
Section 2 - Regional studies 39
5. Marche region 40
5.1. Guidelines of the 2014-2020 regional programme and priority thematic areas 40
5.2. Sectors, financial requirements and suboptimal investment conditions 41
5.3. Value added of FIs 51
5.4. Proposed FI investment strategy 56
6. Emilia-Romagna region 61
6.1. Guidelines of the 2014-2020 regional programme and priority thematic areas 61
6.2. Sectors, financial requirements and suboptimal investment conditions 62
6.3. Value added of FIs 68
6.4. Proposed FI investment strategy 72
Veneto region 77
6.5. Guidelines of the 2014-2020 regional program and priority thematic areas 77
6.6. Sectors, financial requirements and suboptimal investment conditions 78
6.7. Value added of FIs 92
6.8. Proposed FI investment strategy 96
7. Lazio region 100
7.1. Guidelines of the 2014-2020 regional programme and priority thematic areas 100
7.2. Sectors, financial requirements and suboptimal investment conditions 101
7.3. Value added of FIs 105
7.4. Proposed FI investment strategy 108
Multiregional Study
3
Glossary of terms
AIR Annual Implementation Report
CEB Council of Europe Development Bank
CF Cohesion Fund
COCOF Coordination Committee of the Funds
CPR Common Provision Regulation
CSF Common Strategic Framework
DG Directorate General
CPR Common Provisions Regulation
D.G.R. Delibera di Giunta Regionale (Regional Committee Resolution)
D.L. Decree Law
D.lgs Legislative Decree
D.M. Decree of the Ministry
EAFRD European Agricultural Fund for Rural Development
EC European Commission
EIB European Investment Bank
EIF European Investment Fund
EMFF European Maritime and Fisheries Fund
ERDF European Regional Development Fund
ESF European Social Fund
ESI European Structural and Investment
EU European Union
FA Financial Agreement
FEI Financial Engineering Instrument
FI Financial Instrument
FIT Fondo per l’Innovazione Tecnologica (Fund for the Technological Innovation)
HF Holding Fund
IOP Interregional Operational Program
IPSUD Integrated Plan for Sustainable Urban Development
JEREMIE Joint European Resources for Micro to Medium Enterprises
Multiregional Study
4
JESSICA Joint European Support for Sustainable Investment in City Areas
MA Managing Authority
MC Monitoring Committee
MED Ministry of Economic Development
Meuro Millions of euro
MS Member State
NOP National Operational Programme
OA Operational Agreement
O.J. Official Journal
OP Operational Programme
PIA Pacchetto Integrato di Agevolazioni (Integrated Package of Facilities)
PIOT Pacchetti Integrati di Offerta Turistica (Integrated Package of Tourist Service)
PPP Public-Private Partnership
ROP Regional Operational Programme
SME Small and Medium Enterprise
SPV Special Purpose Vehicle
STU Società di Trasformazione Urbana1 (Urban Development Company)
TUEL Testo Unico degli Enti Locali2 (National Regulation for Public Entities)
UDF Urban Development Fund
1 The Società di Trasformazione Urbana (“STU”) has been set up by Article 17 (59) Law “Bassanini” no. 127 and amended by Article 120 Legislative Decree “D.Lgs” 167/2000 (National Regulation for Public Entities – “TUEL”) and its source Circolare del Ministero Lavori Pubblici (Communication of the Ministry for Public Works) December 2000, Prot. 622/Segr. 2 Testo Unico degli Enti Locali - TUEL, updated at Decree Law (“D.L.”) 2 May 2012, no. 16 (cfr. Decreto Fiscale), published on the Official Journal (“O.J.”) no. 99, 28 April 2012.
Multiregional Study
5
Definitions
Beneficiary Article 2(10) of the CPR defines “beneficiary”, in the context of financial instruments as the body that implements the financial instrument or the fund of funds as appropriate.
Capital gain
An increase in the value of a capital asset (investment or real estate) that gives it a higher worth than the purchase price. Profit that results when, for instance, the price of a security held by a mutual fund rises above its purchase price and the security is sold (realized gain).
Confidi
Bodies, whether cooperative or consortium structure, which provide mutual activities of collective guarantee of funding in favour of member companies. In accordance with Article 13 of Law no. 326, 24 November 2003, Confidi may have the legal structure of financial operators (included in the specific section of the list regulated by Article 106 of the Banking Law or in the special provisions of Article 107 of the Consolidated Law) or cooperative banks with limited liability.
Counter guarantee Guarantee provided by a fund in favour of “Confidi” or other guarantee funds. It is managed by financial intermediaries registered on the general list (Article 106, Legislative Decree no. 385, 1 September 1993).
CPR
Regulation (EU) No 1303/2013 of the European Parliament and of the Council of 17 December 2013 laying down common provisions on the European Regional Development Fund, the European Social Fund, the Cohesion Fund, the European Agricultural Fund for Rural Development and the European Maritime and Fisheries Fund and laying down general provisions on the European Regional Development Fund, the European Social Fund, the Cohesion Fund and the European Maritime and Fisheries Fund and repealing Council Regulation (EC) No 1083/2006
Early-stage capital Financing for enterprises before they initiate commercial manufacturing and sales or generate any profit. Includes seed and start-up financing.
Equity
Equity investment concerns the provision of capital to a firm, invested directly or indirectly in return to the total or partial ownership of that firm; through this means, the investor shares the firm's profits, and may also take on some management control . Equity (quasi-equity) may also assume the form of a shareholder subordinated debt.
Expansion capital
Expansion capital is the financing provided with the scope of sustaining the growth of an enterprise. It may or may not break even or be profitable. Expansion capital may be used to finance increased production capacity, market or product development, or to provide working capital as set out in a Business Plan.
Final recipient
The term “final recipient” refers to enterprises, Public-Private Partnerships (PPP), projects and any legal or natural person receiving repayable investments (namely through equity participations, loans, guarantees and other forms of repayable investments implemented through similar transactions, with the exception of grants) from a financial engineering instrument.
Financial Engineering Instruments
Financial Engineering Instruments are those set up under Article 44 of Council Regulation (EC) No 1083/2006. As part of an Operational Programme, the Structural Funds may finance of the following:
a) Financial Engineering Instruments for enterprises, primarily small and medium-sized ones, such as Venture Capital funds, Guarantee funds, and Loan funds;
b) Urban Development Funds, that are funds invested in PPPs and other projects included in an Integrated Plan for Sustainable Urban
Multiregional Study
6
Development;
c) Funds or other incentive schemes providing loans, guarantees for repayable investments, or equivalent instruments, for energy efficiency and use of renewable energy in buildings, including in existing housing.3
Financial Instruments
In accordance with the CPR, the Financial Engineering Instruments are defined as Financial Instruments under the new programming period 2014–2020 (see common provisions, Title IV, Articles from 37 to 46, of the above-mentioned Regulation Proposal 4 ). In particular, Managing Authorities may provide a financial contribution to the following financial instruments (Article 38 of the CPR):
a) financial instruments set up at Union level, managed directly or indirectly by the Commission;
b) financial instruments set up at national, regional, transnational or cross-border level, managed by or under the responsibility of the managing authority.
Guarantee
A guarantee is a commitment by a third party - called the guarantor - to pay the debt of a borrower when the latter cannot pay it himself. The guarantor is liable to cover any shortfall or default on the borrower's debt under the terms and conditions as stipulated in the agreement between the guarantor, the lender and/or the borrower.
In-house
According to the European Court of Justice5, the “in-house providing” exception is based on two requirements: the public authority must exercise control over the in-house provider, which is similar to that exercised over its own departments and, at the same time, the in-house provider must carry out the essential part of its activities with the controlling part authority or authorities.
Integrated Plan for Sustainable Urban Development
A plan prepared, authorized or supported by public authorities and aimed at sustainable urban development, as referred to in the Commission regulations regarding Structural Funds.
Legal Entities A legal entity that is separate and distinct from its owners. Legal entities have the right to enter into contracts, loan and borrow money, sue and be sued, hire employees, own assets and pay taxes.
Management fee Management fee recognized to the fund manager.
Managing Authority In accordance with Article 123 of the CPR, a national, regional or local public authority or body or private body designated by the member State to manage the Operational Programme.
Mezzanine Financing
A hybrid of debt and equity financing that is typically used to finance the expansion of existing companies. Mezzanine financing is a form of debt capital that gives the lender the rights to convert to an ownership or equity interest in the company if the loan is not paid back in time and in full. It is generally subordinated to debt provided by senior lenders such as banks and venture capital companies. Since a private negative performance has an impact on the reimbursement of the Mezzanine Financing and the priority of the Senior Debt on it, the repayment on the Mezzanine Financing is generally bigger compared to the Senior Debt one.
Micro Credit Small Loans, usually up to €25,000, granted either by institutions specialising in microcredit or by other financial intermediaries. In the context of this report, the purpose of the micro-credit needs to be related to economic activities.
Operations Article 2(9) of the CPR defines operation as a project, contract, action or group of projects selected by the managing authorities of the programmes concerned, or under their responsibility, that contributes to the objectives of a priority or
3 See Article 44 of Regulation (EC) No. 1083/2006. 4 Ibidem 5 See the Judgments of the European Court of Justice: European Court of Justice Judgment on date 18 November 1999, cause C-107/98, Teckal, ECR I-8121, European Court of Justice Judgment on date 13 October 2005, cause C-458/03, Parking Brixen, ECR I-8585, European Court of Justice Judgment on date 11 May 2006, cause C-340/04, Carbotermo, ECR I-4137.

Multiregional Study
7
priorities; in the context of financial instruments, an operation is constituted by the financial contributions from a programme to financial instruments and the subsequent financial support provided by those financial instruments
Project finance
Project finance schemes point out that financial investors in order to reimburse loans and obtain returns on investments, will exclusively (non recourse operations) or partially (limited recourse operations) ground on cash flow generated by the project itself.
Private Operators
Enterprises, which provide services of general economic interest; enterprises, which regularly and continuously deal with activities related to commercial, industrial and services fields – agricultural and forest enterprises included – subject to the individual or corporate payment of the value added tax.
Public Authorities
Regions, territories, municipalities, mountain communities and other public entities, which are recognized by law as legal personalities, including associations, unions, and consortia among legal authorities, regional or local agencies for the energy saving as well as teaching or research institutions, their related consortia included.
Public Entities Governmental agencies, entities and private companies entirely owned by the regional Administration and functionally dependent from it.
Public-private partnership
According to the EC Communication on PPPs (COM(2009)615, 19.11.2009), PPPs are forms of cooperation between public authorities and the private sector that aim to modernise the delivery of infrastructure and strategic public services. In some cases, PPPs involve the financing, design, construction, renovation, management or maintenance of an infrastructure asset; in others, they incorporate the provision of a service traditionally delivered by public institutions. Whilst the principal focus of PPPs should be on promoting efficiency in public services through risk sharing and harnessing private sector expertise, they can also relieve the immediate pressure on public finances by providing an additional source of capital. In turn, public sector participation in a project may offer important safeguards for private investors, in particular the stability of long term cash-flows from public finances, and can incorporate important social or environmental benefits into a project. See also Article 2(24) of the CPR.
Repayable investment
For the purpose of this study, repayable investments are repayable financial assistance or support wholly or partially financed through Structural Funds programmes, to address Cohesion policy objectives, by way of loans, guarantees or equity.
Seed Capital Seed capital is a financing provided to study, assess and develop an initial concept. The seed phase precedes the start-up phase. The two phases together are referred as the “early stage”.
Senior Debt
Senior debt is debt that takes priority over other unsecured debt owned by the issuer.
Senior debt is cheaper than other sources of financing (except subsidies). The project leverage (the debt level that privileged financiers offer compared to the equity one) depends on the variability of the cash flows. As long as the cash flows risky level increases, the “requirement” needed by financial investors to estimate the free cash flow and the cash flow for debt service will increase as well.
Start up capital Provided to enterprises for product development and initial marketing. Enterprises may be in the process of being set up or may exist, but have yet to sell their product or service commercially.
Venture capital
Investment in unquoted enterprises by venture capital firms who, acting as principals, manage individual, institutional or in-house money. In Europe, the main financing stages included in venture capital are early-stage (covering seed and start-up) and expansion. Strictly defined, venture capital is a subset of private equity. Venture capital is thus professional equity co-invested with the entrepreneur to fund an early-stage (seed and start-up) or expansion venture. Offsetting the high risk the investor takes is the expectation of a higher-than-average return on the investment.
Multiregional Study
8
Introduction
Scope of the study
This report represents the Final Report of the project activities based on the “JESSICA 2014-2020 Evaluation
Study for the Marche Region” proposal, provided by the Consortium PwC-Sinloc to the European Investment
Bank (EIB) on 13 March 2013. The study was successively extended to cover the Emilia-Romagna, Lazio and
Veneto regions.
The Study aims to analyse the possibility to implement Financial Instruments (“FI”) focused on urban and
territorial development under the next programming period (i.e. 2014 – 2020) in Italy and, in particular, in the
Emilia-Romagna, Lazio, Marche and Veneto regions.
The first phase of the assignment is focused on the analysis of the common legislative and policy framework and
on the description of the general context regarding the implementation of Financial Engineering Instruments
(“FEI”) in Italian Regions in 2007-2013. Such preliminary review created the ground for the identification of
main strengths and weaknesses encountered during the settlement and implementation phases of FEIs.
The 2014-2002 legislative package proposed by the European Commission (“EC”) on Cohesion Policy
emphasises the use of FI and the centrality of the urban agenda and offers several opportunities for their
implementation. Lessons learned from the 2007-2013 programming period and opportunities offered in the
next programming period supported the identification of key drivers for the assessment of the possibility to
implement FIs for urban and territorial development during the 2014-2020 programming period in the
Marche, Emilia-Romagna, Lazio, and Veneto regions.
Basing on such key drivers, specific assessments were carried out at regional level to indicate the most promising schemes to implement FIs in Marche, Emilia-Romagna, Lazio, and Veneto.
The Final Report includes:
A general context. It provides a review of the 2007-2013 Italian experiences related to FEIs
implementation, with a specific focus on urban and territorial development initiatives. The review
includes the identification of current players, implementation progress and the key challenges and
opportunities for this type of instruments, as well as the analysis of the main difficulties and
bottlenecks experienced so far in implementing FEIs. This part also includes a comprehensive
description of the main opportunities, in terms of FIs implementation, offered by the legislative
package proposed by the EC for the 2014-2020 Cohesion Policy. As a result the general part of the
study proposes a methodology to develop the preliminary assessment of the opportunity to implement
FIs in the next programming period.
Specific regional analysis. Specific studies were developed to verify the opportunity of
implementing FIs in Marche, Emilia-Romagna, Veneto and Lazio regions.
Structure of the Final Report
The Report is structured in 5 sections:
Section 1 – Context overview
Section 2 - Regional studies: Marche region, Emilia-Romagna region, Veneto region, Lazio region

Multiregional Study
9
Section 1- Context Overview
Multiregional Study
10
1. EU Cohesion Policy 2007-2013
1.1. Legal and policy framework
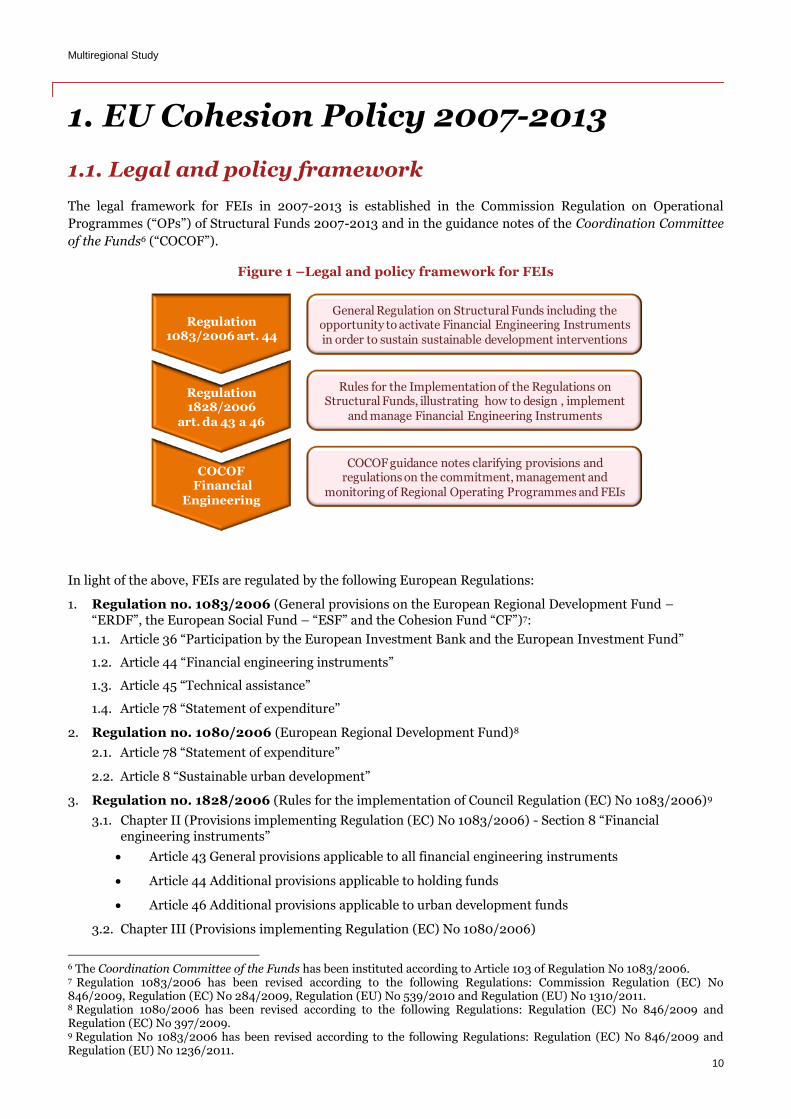
The legal framework for FEIs in 2007-2013 is established in the Commission Regulation on Operational
Programmes (“OPs”) of Structural Funds 2007-2013 and in the guidance notes of the Coordination Committee
of the Funds6 (“COCOF”).
Figure 1 –Legal and policy framework for FEIs
In light of the above, FEIs are regulated by the following European Regulations:
1. Regulation no. 1083/2006 (General provisions on the European Regional Development Fund – “ERDF”, the European Social Fund – “ESF” and the Cohesion Fund “CF”)7:
1.1. Article 36 “Participation by the European Investment Bank and the European Investment Fund”
1.2. Article 44 “Financial engineering instruments”
1.3. Article 45 “Technical assistance”
1.4. Article 78 “Statement of expenditure”
2. Regulation no. 1080/2006 (European Regional Development Fund)8
2.1. Article 78 “Statement of expenditure”
2.2. Article 8 “Sustainable urban development”
3. Regulation no. 1828/2006 (Rules for the implementation of Council Regulation (EC) No 1083/2006)9
3.1. Chapter II (Provisions implementing Regulation (EC) No 1083/2006) - Section 8 “Financial engineering instruments”
Article 43 General provisions applicable to all financial engineering instruments
Article 44 Additional provisions applicable to holding funds
Article 46 Additional provisions applicable to urban development funds
3.2. Chapter III (Provisions implementing Regulation (EC) No 1080/2006)
6 The Coordination Committee of the Funds has been instituted according to Article 103 of Regulation No 1083/2006. 7 Regulation 1083/2006 has been revised according to the following Regulations: Commission Regulation (EC) No 846/2009, Regulation (EC) No 284/2009, Regulation (EU) No 539/2010 and Regulation (EU) No 1310/2011. 8 Regulation 108o/2006 has been revised according to the following Regulations: Regulation (EC) No 846/2009 and Regulation (EC) No 397/2009. 9 Regulation No 1083/2006 has been revised according to the following Regulations: Regulation (EC) No 846/2009 and Regulation (EU) No 1236/2011.
Regulation1083/2006 art. 44
General Regulation on Structural Funds including the opportunity to activate Financial Engineering Instruments in order to sustain sustainable development interventions
Regulation1828/2006
art. da 43 a 46
COCOFFinancial
Engineering
Rules for the Implementation of the Regulations on Structural Funds, illustrating how to design , implement
and manage Financial Engineering Instruments
COCOF guidance notes clarifying provisions and regulations on the commitment, management and
monitoring of Regional Operating Programmes and FEIs
Multiregional Study
11
Section 1 - Eligibility of expenditure on housing
Article 47 “Interventions in the field of housing”
The European legislation does not provide a strict legal framework on FEIs in European Union (“EU”) Member States. As a result, EU Member States are able to leverage from FEIs flexible nature to properly adapt them to specific, local contexts and conditions.
The interpretation of the European Commission Regulations on FEIs has been integrated with three COCOF guidance notes:
1. “Guidance Note No 1 on Financial Engineering in the 2007-2013 programming period” (16th July 2007), including guidance on the definition of “beneficiary” and “operations” in the case of FEI under Article 44 of Regulation 1083/2006, as well as on the implementation process of FEI (selection of holding funds, selection of FEI, selection of operations, management costs, major projects) and on the relation between State aid and FEI;
2. “Guidance Note No 2 on Financial Engineering” (22nd December 2008), which defines the guidelines for the Contributions to holding funds, other FEIs and enterprises, public private partnerships (PPPs) and projects (such as, for instance, venture capital, loans, guarantees and Urban Development Funds) (see Section A note). The note provides a guidance on other implementation issues related to financial engineering, such as the possibility to combine interest subsidies and FEIs, the definition of “Integrated urban development plans”, the audit trail for contributions from operational programmes to urban development funds investing in projects which include components that are not eligible for the Structural Funds, the interaction between rules on revenue-generating projects and financial engineering under Article 44 of Regulation (EC) No 1083/2006;
3. “Guidance Note No 3 on Financial Engineering Instruments under Article 44 of Council Regulation (EC) No 1083/2006” (21st February 2011 (COCOF 10-0014-04-EN) and 8th Februry 2012 (COCOF 10-0014-05-EN)), summarises and consolidates the previous notes, clarifying further the set-up and implementation of FEIs10. It also provides technical information and presents good practices on common issues, which might arise during the implementation process, from the starting phase and decisional process to the closure of the operational programme. The note also clarifies several definitions related to FEI, in particular distinguishing the “Beneficiary” from the “Final Recipient”. The note has been lately modified on 2012 February 8th11, in order to take account of the modifications introduced to Article 45 of the Implementing Regulation 1828/2006, as amended by Commission Regulation (EC) No. 1236/2011, regarding investments through FEI.
It is noteworthy that the scope of FEIs co-financed by Structural Funds (in particular to ERDF) has finally been extended in order to include energy efficiency and renewable energy interventions12, coherently with Regulation no. 397/2009 of the European Parliament and the Council, amending Regulation (EC) no. 1080/2006 on the ERDF as regards the eligibility of energy efficiency and renewable energy investments in housing.
The need to provide explanatory notes, both on General and Implementing Regulations on FEIs, reveals uncertainty around the legal framework regulating such instruments. For instance, concerns rose up during:
the FEIs design and implementation phase, on possibilities and blending manners of the non repayable resources and private finance;
the FEIs management phase, concerning operations and beneficiary definition, distinction between beneficiary and final recipient of the resources;
the FEIs certification and monitoring of expenses phase, whether the expenditure declaration includes the total expenditures to constitute FEI or to contribute to them (in accordance with Article 78
10 According to the principle of sound financial management, Article 14 of the General Regulation (day-to-day administration) underlines the applicability of Article 38 (2) of the Financial Regulation No 1 to Structural Funds, stating that: “The Member States shall cooperate with the Commission so that the appropriations are used in accordance with the principle of sound financial management”. 11 See “Revised Guidance Note on Financial Engineering Instruments under Article 44 of Council Regulation (EC) No 1083/2006” , Revised version, 2012 February 08th. http://ec.europa.eu/regional_policy/thefunds/doc/instruments/jeremie/guidance2012.pdf 12 For further information please see the “Guidance note on eligibility of energy efficiency and renewable energies interventions under the ERDF and the Cohesion Fund (2007-2013) in the building sector including housing” (2008 October 29th).

Multiregional Study
12
of Regulation (EC) 1083/2006); while, eligible expenditures at the closure of the OP correspond to the total amount of payments made by FEIs to Final Recipients. Nevertheless, neither the Regulations nor the COCOF notes clarify the concept of “payments”, not specifying whether it refers to the FEI transferring to Final Recipients rather than to the expenditures of the Final Recipients related to the project.
The general provisions on the ERDF, the ESF and the Cohesion Fund for the 2007-2013 programming period
states that:
“It is appropriate to ensure that improved access to finance and innovative financial engineering are
available primarily to micro, small and medium-sized enterprises and for investing in public-private
partnerships and other projects included in an integrated plan for sustainable urban
development…”(considerandum no. 41, Council Regulation no. 1083/2006)
In particular, the programme should ensure coordination among Funds, existing FEIs and the EIB, and
European Investment Fund (“EIF”).
According to Article 44 of the General Regulation, “as part of an operational programme, the Structural Funds
may finance expenditure in respect of an operation comprising contributions to support financial engineering
instruments for enterprises…”. Since the definition of Structural Funds, provided in Article 1 of the General
Regulation, includes only the ERDF and the ESF, FEIs cannot receive any contributions from the Cohesion
Fund for the 2007-2013 programming period.
Table 1 – Structural Funds according to the 2007-2013 programme (Art. 1 of the General Regulation)
European Regional Development Fund (Regulation (EC) No. 1080/2006 of the European Parliament, 5th July 2006, related to the European Regional Development Fund)
The ERDF aims to reduce the gap between the levels of development of EU Regions and the extent to which the less-favoured ones are lagging behind. More in detail, the ERDF helps reinforcing economic and social cohesion by redressing regional imbalances and supporting the development and structural adjustment of regional economies. In particular, it contributes financing: productive investment which contributes to creating and safeguarding sustainable jobs, primarily through direct aid to investment primarily in small and medium-sized enterprises (SMEs); investment in infrastructure; FEIs, which support regional and local development. These measures include support for and services to enterprises (in particular SMEs), creation and development of financing instruments such as venture capital, loan and guarantee funds, local development funds, interest subsidies, networking, cooperation and exchange of experience between regions, towns, and relevant social, economic and environmental actors; technical assistance. The ERDF may intervene within the three main objectives: Convergence; Regional competitiveness and Employment; European territorial cooperation.
European Social Fund (Regulation (EC) No. 1081/2006 of the European Parliament and Council, 5th July 2006, related to the European Social Fund and repealing Regulation (EC) No. 1784/1999)
The ESF contributes to the priorities of the Community as regards strengthening economic and social cohesion by improving employment and job opportunities, encouraging a high level of employment and more and better jobs. As such, the Fund pursues the following objectives: «Convergence» and «Regional Competitiveness and Employment». The ESF Member States' policies aiming to achieve full employment and quality and productivity at work, promote social inclusion, including the access of disadvantaged people to employment and reduce national, regional and local employment disparities. More in detail, the ESF supports actions in Member States under the priorities listed below: increasing adaptability of workers, enterprises and entrepreneurs with a view to improving the anticipation and positive management of economic change (e.g. lifelong learning and increased investment in human resources by enterprises, design and dissemination of innovative and more productive forms of work organization); enhancing access to employment and the sustainable inclusion in the labour market of job seekers and inactive people, preventing unemployment (in particular long-term and youth unemployment), encouraging active ageing and longer working lives and increasing participation in the labour market (e.g. modernisation and strengthening of labour market institutions, specific action to improve access to employment, specific action to increase the participation of migrants in employment, etc.); reinforcing the social inclusion of disadvantaged people with a view to their sustainable integration in employment and combating all forms of discrimination in the labour market (e.g. pathways to integration and re-entry into employment for disadvantaged people, acceptance of diversity in the workplace); enhancing human capital (e.g. design and introduction of reforms in education and training systems, networking activities); promoting partnerships, pacts and initiatives through networking of relevant stakeholders; expanding and improving investment in human capital (e.g. reforms in education and training systems, increased participation in education and training, development of human potential in research and innovation); strengthening institutional capacity and the efficiency of public administrations (e.g. mechanisms to improve good policy and programme design, monitoring and evaluation, capacity building).
Multiregional Study
13
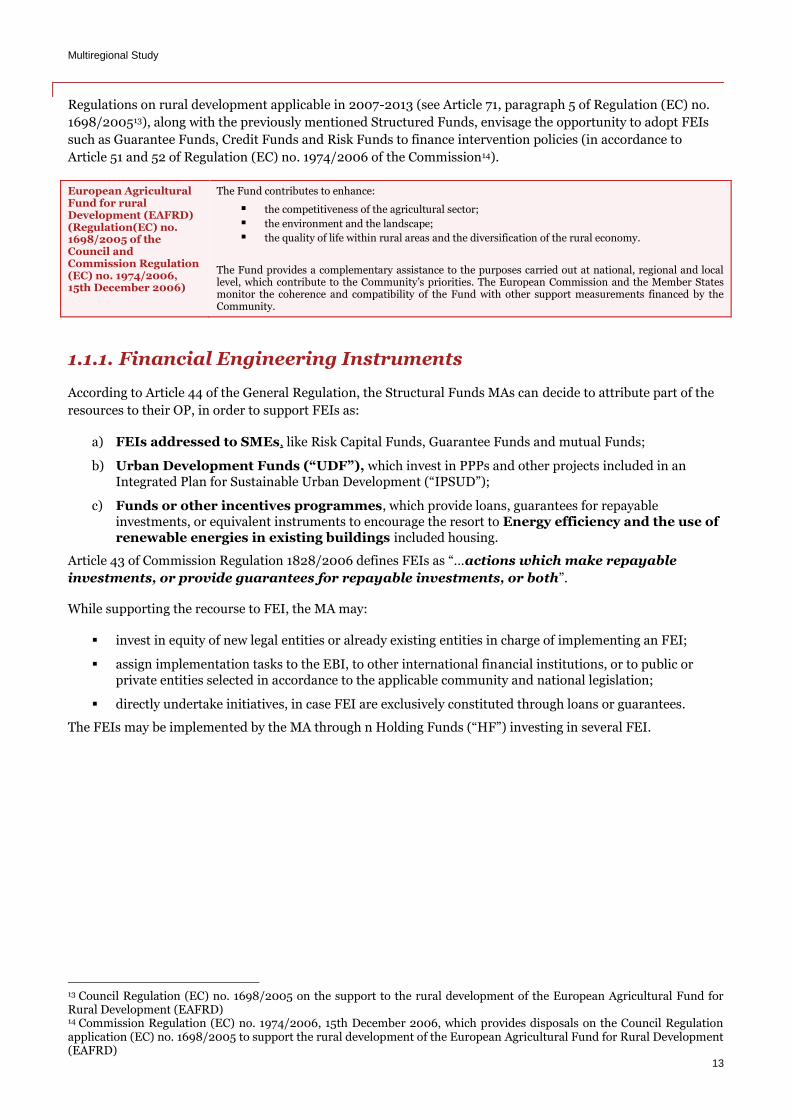
Regulations on rural development applicable in 2007-2013 (see Article 71, paragraph 5 of Regulation (EC) no.
1698/200513), along with the previously mentioned Structured Funds, envisage the opportunity to adopt FEIs
such as Guarantee Funds, Credit Funds and Risk Funds to finance intervention policies (in accordance to
Article 51 and 52 of Regulation (EC) no. 1974/2006 of the Commission14).
European Agricultural Fund for rural Development (EAFRD) (Regulation(EC) no. 1698/2005 of the Council and Commission Regulation (EC) no. 1974/2006, 15th December 2006)
The Fund contributes to enhance:
the competitiveness of the agricultural sector;
the environment and the landscape;
the quality of life within rural areas and the diversification of the rural economy.
The Fund provides a complementary assistance to the purposes carried out at national, regional and local level, which contribute to the Community’s priorities. The European Commission and the Member States monitor the coherence and compatibility of the Fund with other support measurements financed by the Community.
1.1.1. Financial Engineering Instruments
According to Article 44 of the General Regulation, the Structural Funds MAs can decide to attribute part of the
resources to their OP, in order to support FEIs as:
a) FEIs addressed to SMEs, like Risk Capital Funds, Guarantee Funds and mutual Funds;
b) Urban Development Funds (“UDF”), which invest in PPPs and other projects included in an Integrated Plan for Sustainable Urban Development (“IPSUD”);
c) Funds or other incentives programmes, which provide loans, guarantees for repayable investments, or equivalent instruments to encourage the resort to Energy efficiency and the use of renewable energies in existing buildings included housing.
Article 43 of Commission Regulation 1828/2006 defines FEIs as “…actions which make repayable
investments, or provide guarantees for repayable investments, or both”.
While supporting the recourse to FEI, the MA may:
invest in equity of new legal entities or already existing entities in charge of implementing an FEI;
assign implementation tasks to the EBI, to other international financial institutions, or to public or private entities selected in accordance to the applicable community and national legislation;
directly undertake initiatives, in case FEI are exclusively constituted through loans or guarantees.
The FEIs may be implemented by the MA through n Holding Funds (“HF”) investing in several FEI.
13 Council Regulation (EC) no. 1698/2005 on the support to the rural development of the European Agricultural Fund for Rural Development (EAFRD) 14 Commission Regulation (EC) no. 1974/2006, 15th December 2006, which provides disposals on the Council Regulation application (EC) no. 1698/2005 to support the rural development of the European Agricultural Fund for Rural Development (EAFRD)
Multiregional Study
14
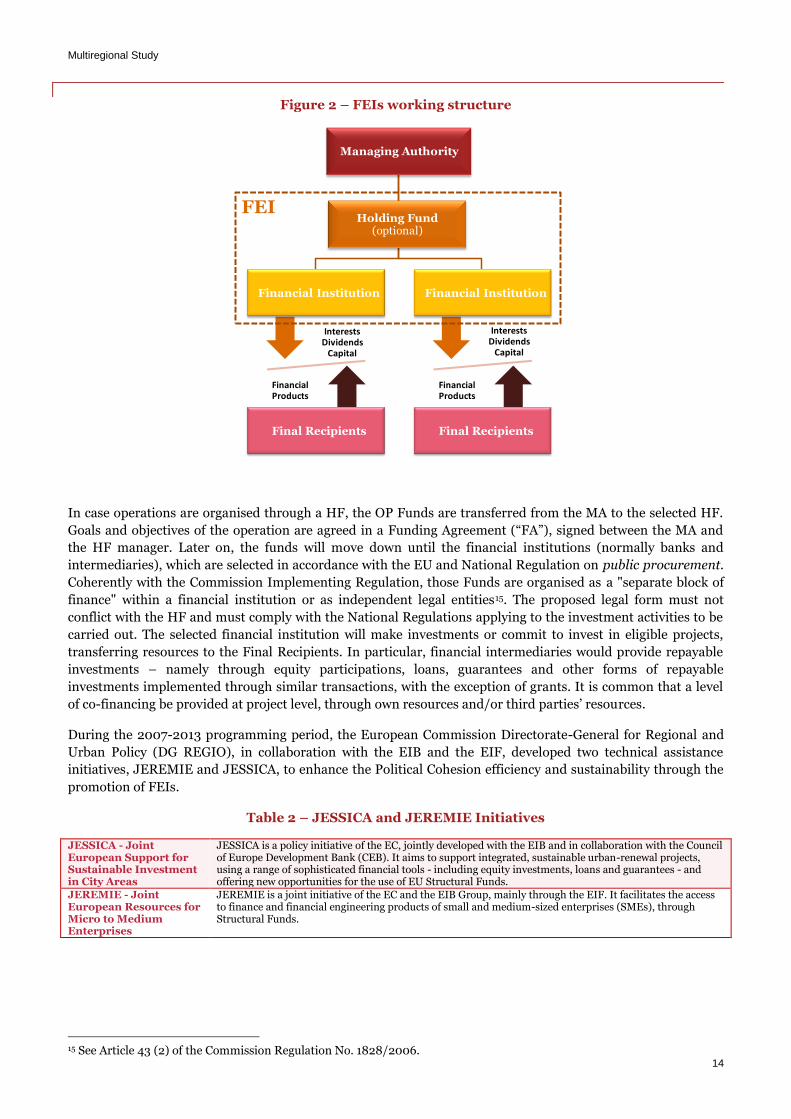
Figure 2 – FEIs working structure
In case operations are organised through a HF, the OP Funds are transferred from the MA to the selected HF.
Goals and objectives of the operation are agreed in a Funding Agreement (“FA”), signed between the MA and
the HF manager. Later on, the funds will move down until the financial institutions (normally banks and
intermediaries), which are selected in accordance with the EU and National Regulation on public procurement.
Coherently with the Commission Implementing Regulation, those Funds are organised as a "separate block of
finance" within a financial institution or as independent legal entities15. The proposed legal form must not
conflict with the HF and must comply with the National Regulations applying to the investment activities to be
carried out. The selected financial institution will make investments or commit to invest in eligible projects,
transferring resources to the Final Recipients. In particular, financial intermediaries would provide repayable
investments – namely through equity participations, loans, guarantees and other forms of repayable
investments implemented through similar transactions, with the exception of grants. It is common that a level
of co-financing be provided at project level, through own resources and/or third parties’ resources.
During the 2007-2013 programming period, the European Commission Directorate-General for Regional and
Urban Policy (DG REGIO), in collaboration with the EIB and the EIF, developed two technical assistance
initiatives, JEREMIE and JESSICA, to enhance the Political Cohesion efficiency and sustainability through the
promotion of FEIs.
Table 2 – JESSICA and JEREMIE Initiatives
JESSICA - Joint European Support for Sustainable Investment in City Areas
JESSICA is a policy initiative of the EC, jointly developed with the EIB and in collaboration with the Council of Europe Development Bank (CEB). It aims to support integrated, sustainable urban-renewal projects, using a range of sophisticated financial tools - including equity investments, loans and guarantees - and offering new opportunities for the use of EU Structural Funds.
JEREMIE - Joint European Resources for Micro to Medium Enterprises
JEREMIE is a joint initiative of the EC and the EIB Group, mainly through the EIF. It facilitates the access to finance and financial engineering products of small and medium-sized enterprises (SMEs), through Structural Funds.
15 See Article 43 (2) of the Commission Regulation No. 1828/2006.
Managing Authority
Holding Fund(optional)
InterestsDividends
Capital
Financial Products
InterestsDividends
Capital
Financial Products
Financial Institution Financial Institution
Final Recipients Final Recipients
FEI
Multiregional Study
15
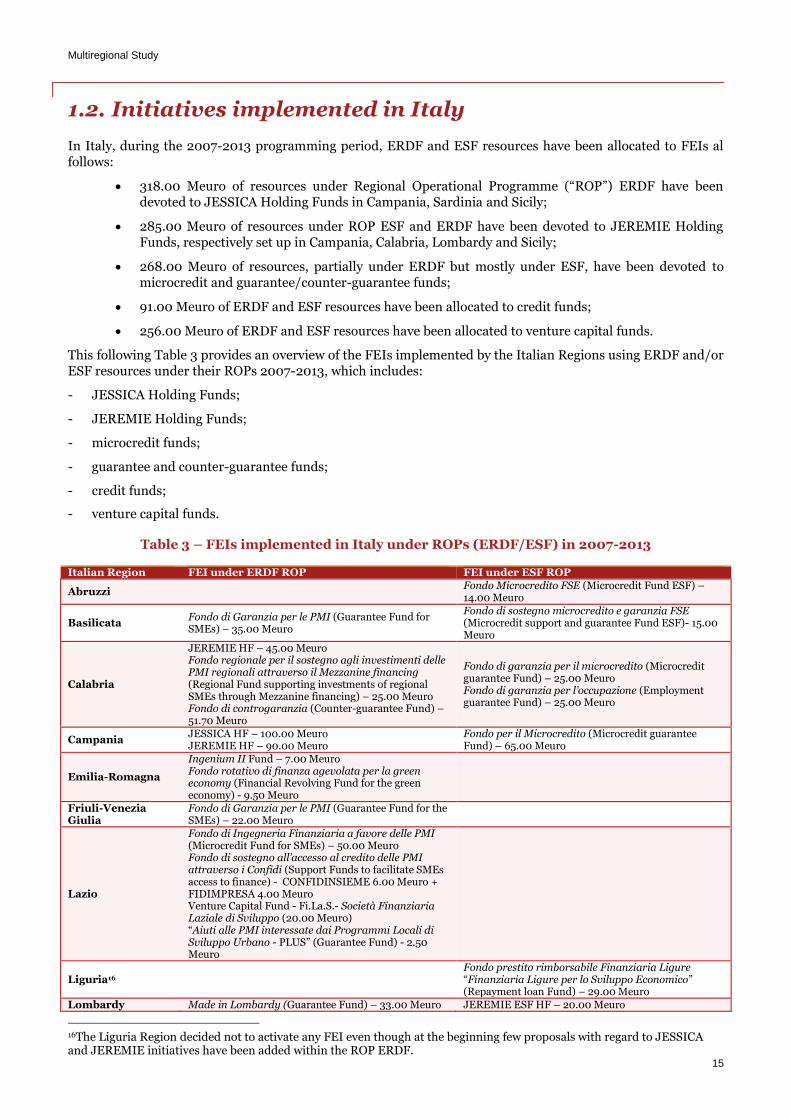
1.2. Initiatives implemented in Italy
In Italy, during the 2007-2013 programming period, ERDF and ESF resources have been allocated to FEIs al follows:
318.00 Meuro of resources under Regional Operational Programme (“ROP”) ERDF have been devoted to JESSICA Holding Funds in Campania, Sardinia and Sicily;
285.00 Meuro of resources under ROP ESF and ERDF have been devoted to JEREMIE Holding Funds, respectively set up in Campania, Calabria, Lombardy and Sicily;
268.00 Meuro of resources, partially under ERDF but mostly under ESF, have been devoted to microcredit and guarantee/counter-guarantee funds;
91.00 Meuro of ERDF and ESF resources have been allocated to credit funds;
256.00 Meuro of ERDF and ESF resources have been allocated to venture capital funds.
This following Table 3 provides an overview of the FEIs implemented by the Italian Regions using ERDF and/or ESF resources under their ROPs 2007-2013, which includes:
- JESSICA Holding Funds;
- JEREMIE Holding Funds;
- microcredit funds;
- guarantee and counter-guarantee funds;
- credit funds;
- venture capital funds.
Table 3 – FEIs implemented in Italy under ROPs (ERDF/ESF) in 2007-2013
Italian Region FEI under ERDF ROP FEI under ESF ROP
Abruzzi Fondo Microcredito FSE (Microcredit Fund ESF) – 14.00 Meuro
Basilicata Fondo di Garanzia per le PMI (Guarantee Fund for SMEs) – 35.00 Meuro
Fondo di sostegno microcredito e garanzia FSE (Microcredit support and guarantee Fund ESF)- 15.00 Meuro
Calabria
JEREMIE HF – 45.00 Meuro Fondo regionale per il sostegno agli investimenti delle PMI regionali attraverso il Mezzanine financing (Regional Fund supporting investments of regional SMEs through Mezzanine financing) – 25.00 Meuro Fondo di controgaranzia (Counter-guarantee Fund) – 51.70 Meuro
Fondo di garanzia per il microcredito (Microcredit guarantee Fund) – 25.00 Meuro Fondo di garanzia per l’occupazione (Employment guarantee Fund) – 25.00 Meuro
Campania JESSICA HF – 100.00 Meuro JEREMIE HF – 90.00 Meuro
Fondo per il Microcredito (Microcredit guarantee Fund) – 65.00 Meuro
Emilia-Romagna
Ingenium II Fund – 7.00 Meuro Fondo rotativo di finanza agevolata per la green economy (Financial Revolving Fund for the green economy) - 9.50 Meuro
Friuli-Venezia Giulia
Fondo di Garanzia per le PMI (Guarantee Fund for the SMEs) – 22.00 Meuro
Lazio
Fondo di Ingegneria Finanziaria a favore delle PMI (Microcredit Fund for SMEs) – 50.00 Meuro Fondo di sostegno all’accesso al credito delle PMI attraverso i Confidi (Support Funds to facilitate SMEs access to finance) - CONFIDINSIEME 6.00 Meuro + FIDIMPRESA 4.00 Meuro Venture Capital Fund - Fi.La.S.- Società Finanziaria Laziale di Sviluppo (20.00 Meuro) “Aiuti alle PMI interessate dai Programmi Locali di Sviluppo Urbano - PLUS” (Guarantee Fund) - 2.50 Meuro
Liguria16 Fondo prestito rimborsabile Finanziaria Ligure “Finanziaria Ligure per lo Sviluppo Economico” (Repayment loan Fund) – 29.00 Meuro
Lombardy Made in Lombardy (Guarantee Fund) – 33.00 Meuro JEREMIE ESF HF – 20.00 Meuro
16The Liguria Region decided not to activate any FEI even though at the beginning few proposals with regard to JESSICA and JEREMIE initiatives have been added within the ROP ERDF.
Multiregional Study
16
Italian Region FEI under ERDF ROP FEI under ESF ROP
JEREMIE ERDF HF – 20.00 Meuro Fondo di rotazione per l’imprenditorialità (Revolving Fund for Entrepreneurship) – 35.00 Meuro + 25.50 Meuro
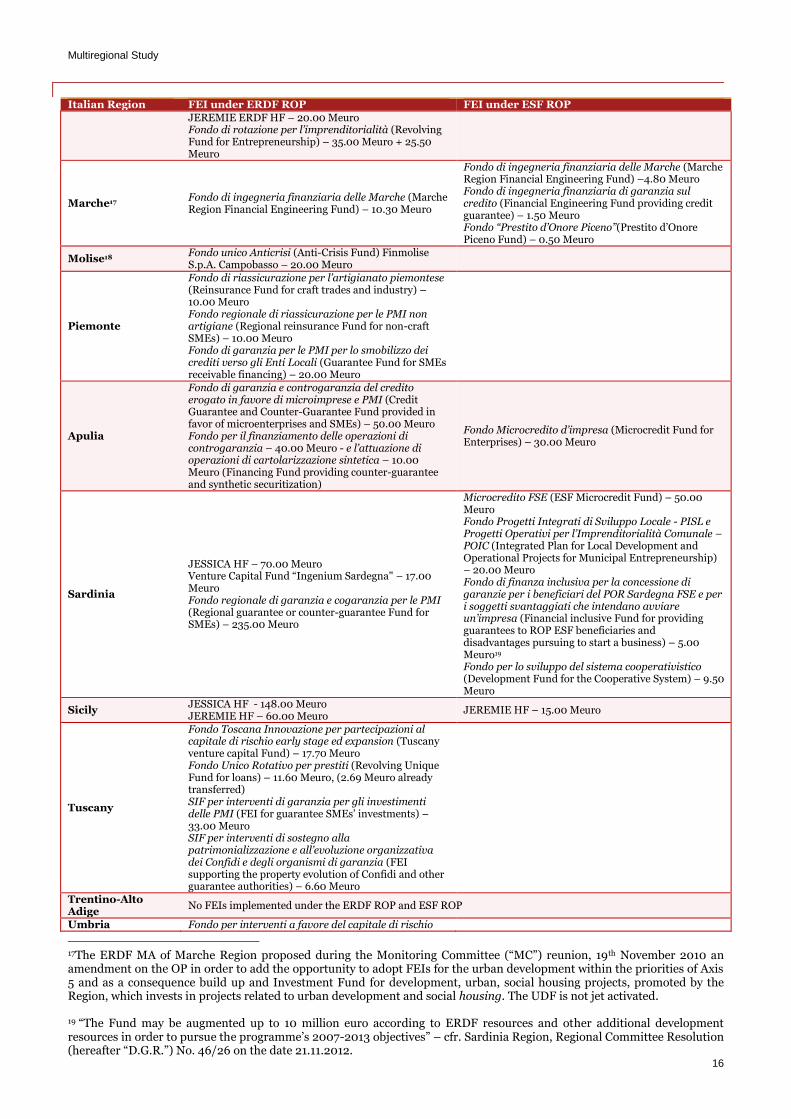
Marche17 Fondo di ingegneria finanziaria delle Marche (Marche Region Financial Engineering Fund) – 10.30 Meuro
Fondo di ingegneria finanziaria delle Marche (Marche Region Financial Engineering Fund) –4.80 Meuro Fondo di ingegneria finanziaria di garanzia sul credito (Financial Engineering Fund providing credit guarantee) – 1.50 Meuro Fondo “Prestito d’Onore Piceno”(Prestito d’Onore Piceno Fund) – 0.50 Meuro
Molise18 Fondo unico Anticrisi (Anti-Crisis Fund) Finmolise S.p.A. Campobasso – 20.00 Meuro
Piemonte
Fondo di riassicurazione per l’artigianato piemontese (Reinsurance Fund for craft trades and industry) – 10.00 Meuro Fondo regionale di riassicurazione per le PMI non artigiane (Regional reinsurance Fund for non-craft SMEs) – 10.00 Meuro Fondo di garanzia per le PMI per lo smobilizzo dei crediti verso gli Enti Locali (Guarantee Fund for SMEs receivable financing) – 20.00 Meuro
Apulia
Fondo di garanzia e controgaranzia del credito erogato in favore di microimprese e PMI (Credit Guarantee and Counter-Guarantee Fund provided in favor of microenterprises and SMEs) – 50.00 Meuro Fondo per il finanziamento delle operazioni di controgaranzia – 40.00 Meuro - e l’attuazione di operazioni di cartolarizzazione sintetica – 10.00 Meuro (Financing Fund providing counter-guarantee and synthetic securitization)
Fondo Microcredito d’impresa (Microcredit Fund for Enterprises) – 30.00 Meuro
Sardinia
JESSICA HF – 70.00 Meuro Venture Capital Fund “Ingenium Sardegna" – 17.00 Meuro Fondo regionale di garanzia e cogaranzia per le PMI (Regional guarantee or counter-guarantee Fund for SMEs) – 235.00 Meuro
Microcredito FSE (ESF Microcredit Fund) – 50.00 Meuro Fondo Progetti Integrati di Sviluppo Locale - PISL e Progetti Operativi per l’Imprenditorialità Comunale – POIC (Integrated Plan for Local Development and Operational Projects for Municipal Entrepreneurship) – 20.00 Meuro Fondo di finanza inclusiva per la concessione di garanzie per i beneficiari del POR Sardegna FSE e per i soggetti svantaggiati che intendano avviare un’impresa (Financial inclusive Fund for providing guarantees to ROP ESF beneficiaries and disadvantages pursuing to start a business) – 5.00 Meuro19 Fondo per lo sviluppo del sistema cooperativistico (Development Fund for the Cooperative System) – 9.50 Meuro
Sicily JESSICA HF - 148.00 Meuro JEREMIE HF – 60.00 Meuro
JEREMIE HF – 15.00 Meuro
Tuscany
Fondo Toscana Innovazione per partecipazioni al capitale di rischio early stage ed expansion (Tuscany venture capital Fund) – 17.70 Meuro Fondo Unico Rotativo per prestiti (Revolving Unique Fund for loans) – 11.60 Meuro, (2.69 Meuro already transferred) SIF per interventi di garanzia per gli investimenti delle PMI (FEI for guarantee SMEs’ investments) – 33.00 Meuro SIF per interventi di sostegno alla patrimonializzazione e all’evoluzione organizzativa dei Confidi e degli organismi di garanzia (FEI supporting the property evolution of Confidi and other guarantee authorities) – 6.60 Meuro
Trentino-Alto Adige
No FEIs implemented under the ERDF ROP and ESF ROP
Umbria Fondo per interventi a favore del capitale di rischio
17The ERDF MA of Marche Region proposed during the Monitoring Committee (“MC”) reunion, 19th November 2010 an amendment on the OP in order to add the opportunity to adopt FEIs for the urban development within the priorities of Axis 5 and as a consequence build up and Investment Fund for development, urban, social housing projects, promoted by the Region, which invests in projects related to urban development and social housing. The UDF is not jet activated. 19 “The Fund may be augmented up to 10 million euro according to ERDF resources and other additional development resources in order to pursue the programme’s 2007-2013 objectives” – cfr. Sardinia Region, Regional Committee Resolution (hereafter “D.G.R.”) No. 46/26 on the date 21.11.2012.
Multiregional Study
17
Italian Region FEI under ERDF ROP FEI under ESF ROP
delle PMI (Funds for interventions in favor of SME equità) – 13.20 Meuro Fondo per la concessione di garanzie a favore di PMI (Guarantee Funds in favor of SME) – 8.80 Meuro
Valle d'Aosta No FEIs implemented under the ERDF ROP and ESF ROP
Veneto
Sistema delle garanzie per investimenti nell'innovazione e per l'imprenditorialità (Guarantees for innovation and entrepreneurship investments) – 35.00 Meuro Fondo di rotazione per l'innovazione tecnologica nelle PMI (Revolving Fund for SMEs innovation technology) – 45.00 Meuro Fondo di Venture Capital per le PMI innovative (Venture Capital Fund for innovative SMEs) – 15.00 Meuro Fondo di rotazione per investimenti finalizzati al contenimento dei consumi energetici (Revolving Fund for energy consumption savings) – 38.80 Meuro
Note: The amounts reported in the above table (in millions of euro- Meuro) only include the gross transfer of resources from ROP to FEI
(fee management costs are included), and they do not include the co-financing amount of the FEI manager or third parties.
Source: Information available at “Summary report on the progress made in financing and implementing financial engineering
instruments co-financed by Structural Funds” EC (31/12/2011), updated according to the recent AIRs, ROPs and/or other official regional
documents (deliberations, decrees, determines etc. included).
Along with FEIs adopted at regional level, listed in Table 3, nation-wide FEIs have been implemented in Italy in
2007-2013. Those are, in particular:
the Fondi rotativi di finanziamento agevolato ai sensi del Decreto Ministeriale (Decree of the Ministry – hereafter “D.M.”) 06 Agosto 2010 - Linea di attività 1.1 e 2.1, del D.M. 13 Dicembre 2011 - Linea di attività 1.1 - e del D.M. 27 Luglio 2009 - Piano Operativo Nazionale – “PON” Ricerca & Competitività (Revolving Funds of facilitated financing Ministerial Decree - 06 August 2010, Activity lines 1.1 and 2.1, Ministerial Decree 13 December 2011 - Activity lines 1.1 - and Ministerial Decree 27 July 2009 - National Operational Plan Research and Competitiveness) respectively amounting to 159.00 Meuro, 70.00 Meuro, 202.00 Meuro;
the Fondo centrale di Garanzia - Riserva separata del Piano Operativo Interregionale (the central guarantee Fund - separated reserve Interregional Operational Plan) - Activity lines 1.1, 1.2, 1.4, 2.1 and 2.5 - amounting to 96.00 Meuro;
the Fondo per l’innovazione tecnologica - FIT PON (Technological Innovation Fund) and the Pacchetto integrato di Agevolazioni - PIA (Integrated Package of Facilitation) up to 130.00 Meuro and 108.00 Meuro respectively;
the Fondo garanzia Riserva PON (Guarantee Fund National Operational Plan Reserve), for an amount of 150.00 Meuro.
All Funds listed above are managed in accordance with FAs signed between the Ministry of Economic
Development (hereafter “MED”) – acting as MA or as Intermediate Body - and the fund manager.
1.2.1. The JESSICA Initiative in Italy
JESSICA (Joint European Support for Sustainable Investment in City Areas) is a technical assistance
initiative of the EC, developed jointly with the EIB and in collaboration with the Council of Europe development
bank (CEB). It aims to promote sustainable investment, growth and jobs in urban areas in the EU.
The initiative addresses urban regeneration and investment needs, including projects in energy efficiency and
renewable energies in cities. The long-term sustainability of urban investment supported by JESSICA is
ensured by the revolving nature of FEIs.
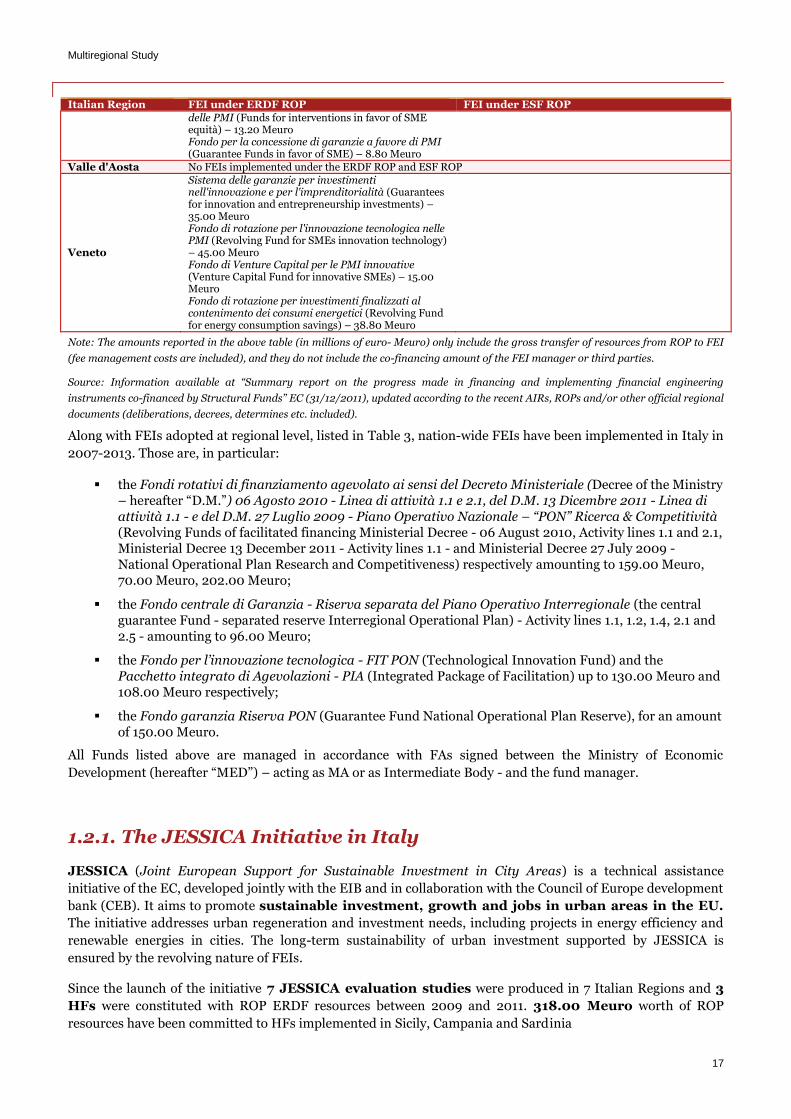
Since the launch of the initiative 7 JESSICA evaluation studies were produced in 7 Italian Regions and 3
HFs were constituted with ROP ERDF resources between 2009 and 2011. 318.00 Meuro worth of ROP
resources have been committed to HFs implemented in Sicily, Campania and Sardinia
Multiregional Study
18
Figure 3 – Evaluation study and implementation of the JESSICA Initiative in Italy, in 2007-2013
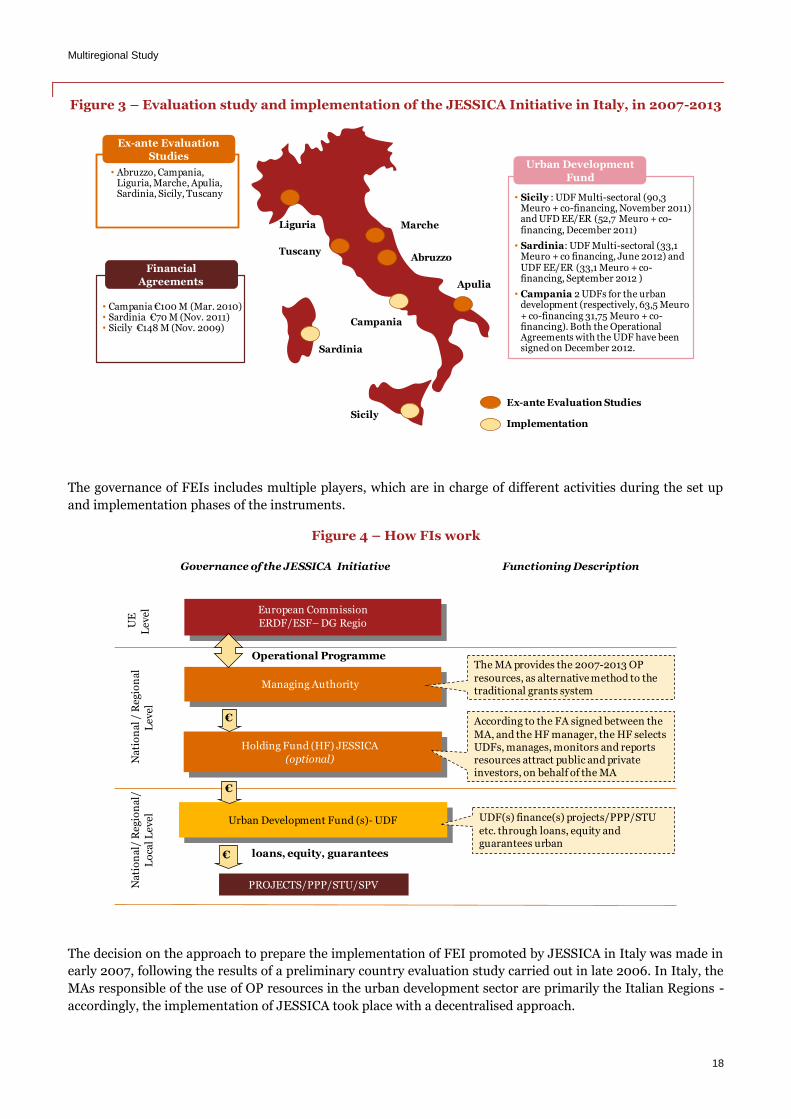
The governance of FEIs includes multiple players, which are in charge of different activities during the set up
and implementation phases of the instruments.
Figure 4 – How FIs work
The decision on the approach to prepare the implementation of FEI promoted by JESSICA in Italy was made in
early 2007, following the results of a preliminary country evaluation study carried out in late 2006. In Italy, the
MAs responsible of the use of OP resources in the urban development sector are primarily the Italian Regions -
accordingly, the implementation of JESSICA took place with a decentralised approach.
Implementation
Ex-ante Evaluation Studies
Apulia
Liguria
Campania
Sicily
AbruzzoTuscany
Marche
Sardinia
• Sicily : UDF Multi-sectoral (90,3 Meuro + co-financing, November 2011) and UFD EE/ER (52,7 Meuro + co-financing, December 2011)
• Sardinia: UDF Multi-sectoral (33,1 Meuro + co financing, June 2012) and UDF EE/ER (33,1 Meuro + co-financing, September 2012 )
• Campania 2 UDFs for the urban development (respectively, 63,5 Meuro+ co-financing 31,75 Meuro + co-financing). Both the Operational Agreements with the UDF have been signed on December 2012.
Urban Development
Fund
• Campania €100 M (Mar. 2010)• Sardinia €70 M (Nov. 2011)• Sicily €148 M (Nov. 2009)
Financial
Agreements
• Abruzzo, Campania, Liguria, Marche, Apulia, Sardinia, Sicily, Tuscany
Ex-ante Evaluation
Studies
€
European Commission
ERDF/ESF– DG Regio
Managing Authority
UE
Le
ve
lN
ati
on
al
/ R
eg
ion
al
Le
ve
l
Holding Fund (HF) JESSICA
(optional)
Urban Development Fund (s)- UDF
Na
tio
na
l/ R
eg
ion
al/
Lo
cal
Le
ve
l
€
PROJECTS/PPP/STU/SPV
loans, equity, guarantees
The MA provides the 2007-2013 OP
resources, as alternative method to the traditional grants system
According to the FA signed between the
MA, and the HF manager, the HF selects UDFs, manages, monitors and reports resources attract public and private investors, on behalf of the MA
Operational Programme
UDF(s) finance(s) projects/PPP/STU
etc. through loans, equity and guarantees urban
€
Governance of the JESSICA Initiative Functioning Description
Multiregional Study
19
1.2.2. The JEREMIE Initiative in Italy
JEREMIE (Joint European Resources for Micro to Medium Enterprises) is a joint technical assistance
initiative of the EC developed jointly with the EIF, which is part of the EIB Group. FEIs promoted through
JEREMIE allow regional and national MAs of EU Member States to employ part of their Structural Funds
allocations (both ERDF and ESF20) to establish revolving instruments designed to enhance SMEs access to
credit. This objective is achieved, through equity, loans and/or guarantees.
Within the JEREMIE initiative, the MA can allocate resources under its ROP to a HF (the “JEREMIE HF”),
whose management may be assigned to the EIF or other financial institutions, selected in accordance with
applicable procurement rules.
The JEREMIE HF sets the investment strategy and designs partnerships with financial institutions of varying
types21 (selected by call for expression of interest). It provides them with specific financial products to support
SMEs, such as guarantees, co-guarantees and counter-guarantees, guarantees on capital holding, (micro) loans,
operations of securitisation, equity and other investment products. Financial institutions then provide SMEs
(the final recipients of the initiative) with loans and equity.
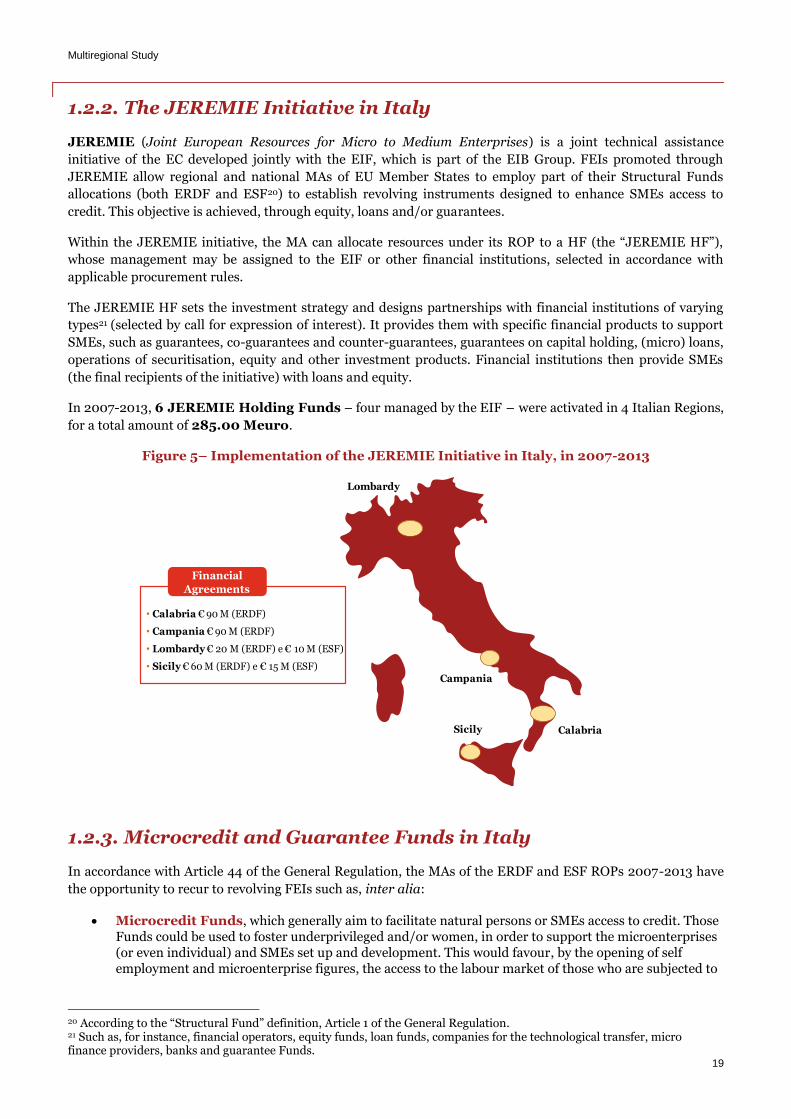
In 2007-2013, 6 JEREMIE Holding Funds – four managed by the EIF – were activated in 4 Italian Regions,
for a total amount of 285.00 Meuro.
Figure 5– Implementation of the JEREMIE Initiative in Italy, in 2007-2013
1.2.3. Microcredit and Guarantee Funds in Italy
In accordance with Article 44 of the General Regulation, the MAs of the ERDF and ESF ROPs 2007-2013 have
the opportunity to recur to revolving FEIs such as, inter alia:
Microcredit Funds, which generally aim to facilitate natural persons or SMEs access to credit. Those Funds could be used to foster underprivileged and/or women, in order to support the microenterprises (or even individual) and SMEs set up and development. This would favour, by the opening of self employment and microenterprise figures, the access to the labour market of those who are subjected to
20 According to the “Structural Fund” definition, Article 1 of the General Regulation. 21 Such as, for instance, financial operators, equity funds, loan funds, companies for the technological transfer, micro finance providers, banks and guarantee Funds.
Campania
Sicily
Lombardy
Calabria
• Calabria € 90 M (ERDF)
• Campania € 90 M (ERDF)
• Lombardy € 20 M (ERDF) e € 10 M (ESF)
• Sicily € 60 M (ERDF) e € 15 M (ESF)
Financial
Agreements
Multiregional Study
20
a disadvantaged conditions (long term disadvantages, non-active younger, women excluded from the labour market).
Guarantee and Counter-guarantee Funds, set up through Structural Funds resources (ERDF/ESF). The functioning mechanism of those Funds sanctions that the Fund would guarantee or counter guarantee the financial intermediary (i.e. the Bank) up to a certain percentage (usually 40% up to 80%) of the funding requested by the final recipients for approved investment schemes.
The management of those Funds is delegated from the MA to managers selected by public calls or – where
compatible with European and national public procurement rules – directly attributed to in-house companies.
Both microcredit and guarantee Funds normally offer final recipients conditions more convenient than those
prevailing in the market, by applying de minimis rules (under Commission Regulation (EC) no. 1998/2006 or
its successor Regulation) or exploiting Commission Regulation EC 800/200822 (or its successor Regulation),
which concerns State aid schemes that are compatible with the common market, established by Articles 87 and
88 of the Treaty (General Block Exemption Regulation).
Figures below report the microcredit and guarantee Funds implemented in Italy during the 2007-2013 period.
In the case of Funds working with both lines - microcredit and guarantee - Regions are mapped in both the
figures (Figure 6 and Figure 7).
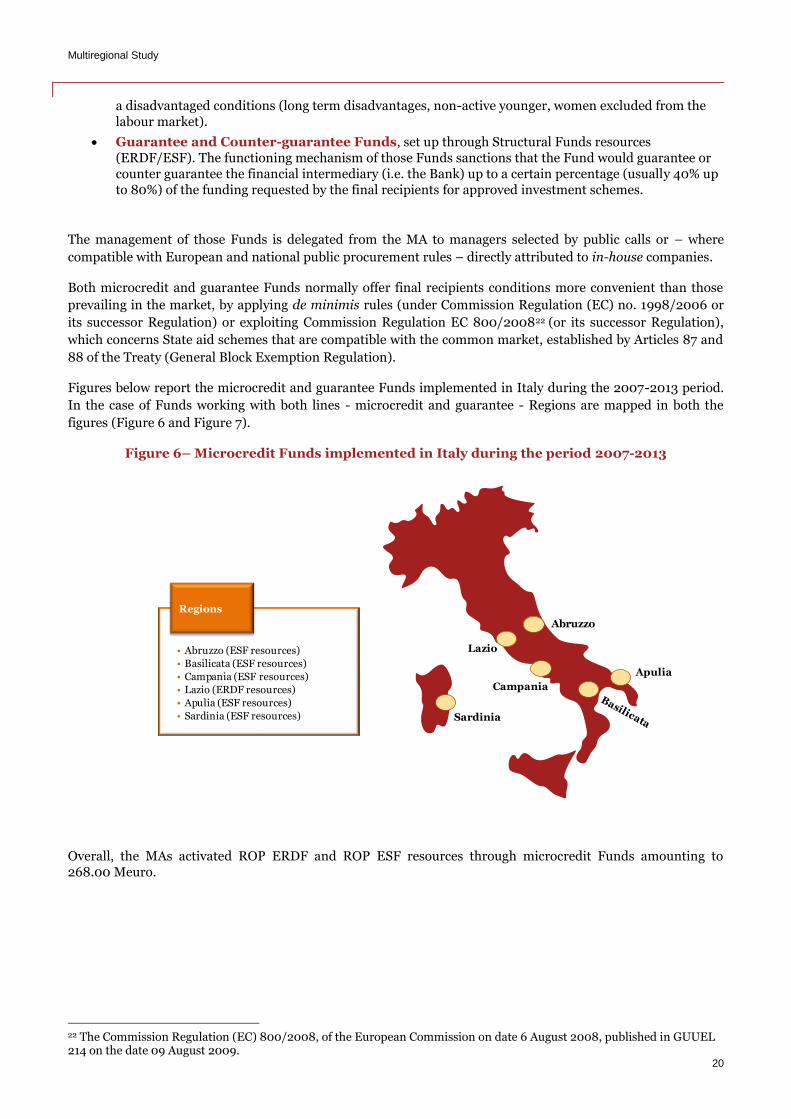
Figure 6– Microcredit Funds implemented in Italy during the period 2007-2013
Overall, the MAs activated ROP ERDF and ROP ESF resources through microcredit Funds amounting to 268.00 Meuro.
22 The Commission Regulation (EC) 800/2008, of the European Commission on date 6 August 2008, published in GUUEL 214 on the date 09 August 2009.
Campania
Abruzzo
Sardinia
Lazio• Abruzzo (ESF resources)
• Basilicata (ESF resources)
• Campania (ESF resources)
• Lazio (ERDF resources)
• Apulia (ESF resources)
• Sardinia (ESF resources)
Regions
Apulia
Multiregional Study
21
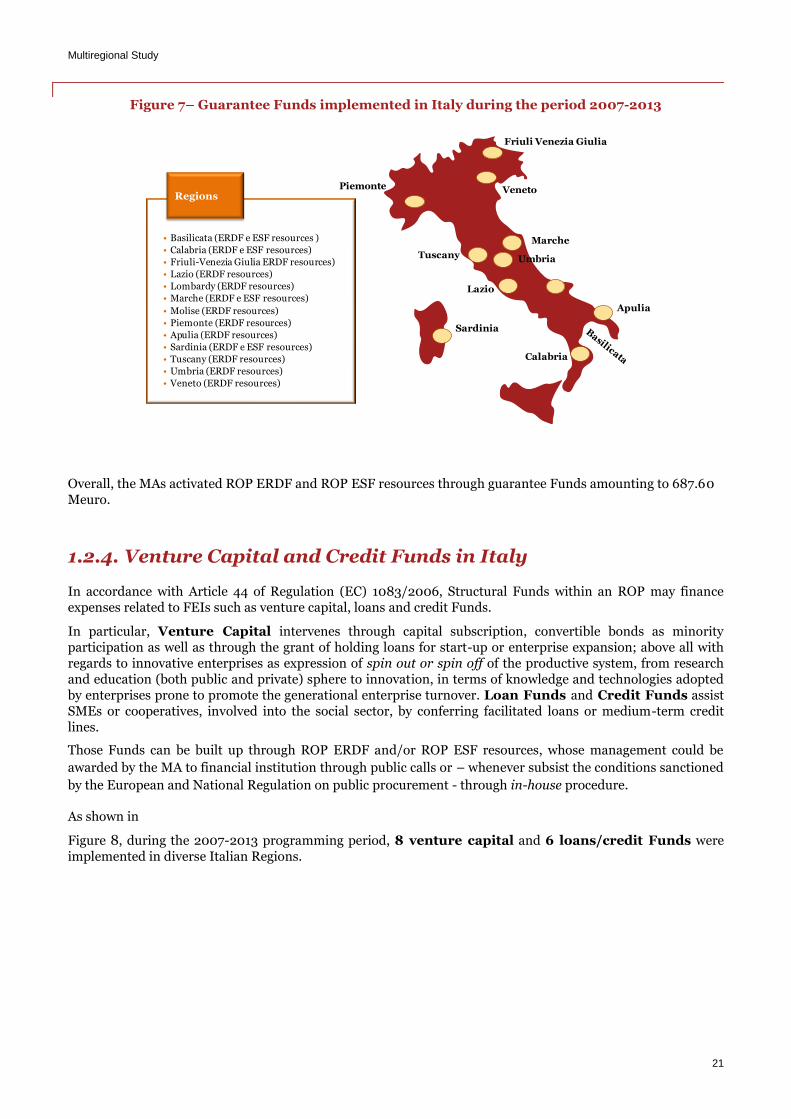
Figure 7– Guarantee Funds implemented in Italy during the period 2007-2013
Overall, the MAs activated ROP ERDF and ROP ESF resources through guarantee Funds amounting to 687.60 Meuro.
1.2.4. Venture Capital and Credit Funds in Italy
In accordance with Article 44 of Regulation (EC) 1083/2006, Structural Funds within an ROP may finance expenses related to FEIs such as venture capital, loans and credit Funds.
In particular, Venture Capital intervenes through capital subscription, convertible bonds as minority participation as well as through the grant of holding loans for start-up or enterprise expansion; above all with regards to innovative enterprises as expression of spin out or spin off of the productive system, from research and education (both public and private) sphere to innovation, in terms of knowledge and technologies adopted by enterprises prone to promote the generational enterprise turnover. Loan Funds and Credit Funds assist SMEs or cooperatives, involved into the social sector, by conferring facilitated loans or medium-term credit lines.
Those Funds can be built up through ROP ERDF and/or ROP ESF resources, whose management could be
awarded by the MA to financial institution through public calls or – whenever subsist the conditions sanctioned
by the European and National Regulation on public procurement - through in-house procedure.
As shown in
Figure 8, during the 2007-2013 programming period, 8 venture capital and 6 loans/credit Funds were implemented in diverse Italian Regions.
Lombardia
Calabria
Sardinia
Lazio
• Basilicata (ERDF e ESF resources )
• Calabria (ERDF e ESF resources)
• Friuli-Venezia Giulia ERDF resources)
• Lazio (ERDF resources)
• Lombardy (ERDF resources)
• Marche (ERDF e ESF resources)
• Molise (ERDF resources)
• Piemonte (ERDF resources)
• Apulia (ERDF resources)
• Sardinia (ERDF e ESF resources)
• Tuscany (ERDF resources)
• Umbria (ERDF resources)
• Veneto (ERDF resources)
Regions
Apulia
Marche
Friuli Venezia Giulia
Piemonte
Tuscany Umbria
Veneto
Multiregional Study
22
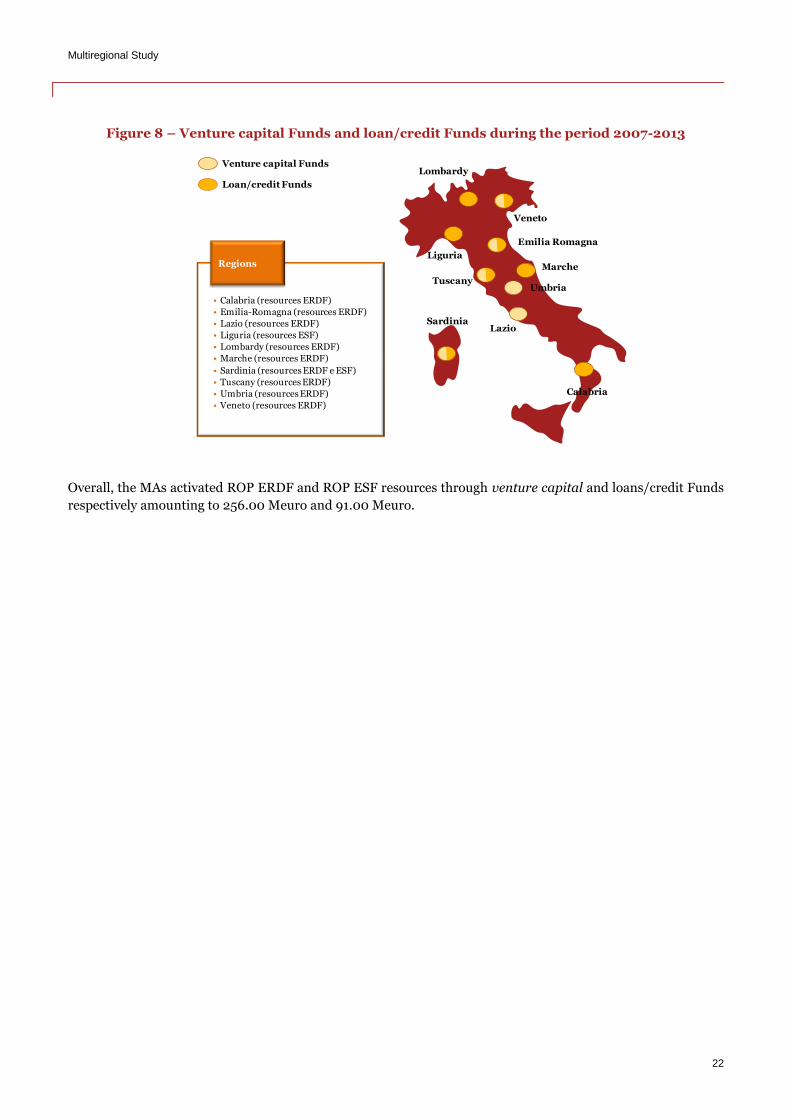
Figure 8 – Venture capital Funds and loan/credit Funds during the period 2007-2013
Overall, the MAs activated ROP ERDF and ROP ESF resources through venture capital and loans/credit Funds
respectively amounting to 256.00 Meuro and 91.00 Meuro.
Lombardia
Tuscany
Emilia Romagna
Venture capital Funds
Calabria
Sardinia
• Calabria (resources ERDF)
• Emilia-Romagna (resources ERDF)
• Lazio (resources ERDF)
• Liguria (resources ESF)
• Lombardy (resources ERDF)
• Marche (resources ERDF)
• Sardinia (resources ERDF e ESF)
• Tuscany (resources ERDF)
• Umbria (resources ERDF)
• Veneto (resources ERDF)
Regions Marche
Loan/credit Funds
Lombardy
Umbria
Veneto
Lazio
Liguria
Multiregional Study
23
1.3. Lessons learned
The experience matured in setting-up, managing and monitoring FEIs in Italy and the rest of the EU have
highlighted both barriers and success factors. This experience may be useful to design and improve, in the next
programming period, the setting up and management of FI.
In particular, the following aspects impacted on the implementation of FEIs in the Italian context. Some impacted on all FEIs; other aspects were more relevant for urban development FEIs:
Regulatory Framework
EU rules on FEIs evolved during the 2007-2013 programming period. Specific aspects with impact on the setting up of FEIs (e.g. widening the scope to energy efficiency in buildings, notion of final recipient and beneficiary) were not fully clear since the beginning of the programming period,.. (Impact on all FEIs, more on urban development FEIs).
EU legislation on Structural Funds requires FEIs to comply with State Aid rules. It implies that FEIs operate at market conditions, except when allowed under specific State Aid rules (e.g. de minimis regime, EU Regulation 800/2008). None of the Italian Managing Authorities decided to notify a specific State Aid regime for the FEIs. The impact on the implementation of FEIs is twofold. From one side, the need to comply with pari passu rules imposes that the same criteria are applied for the investment of resources coming from the ROP and the Financial Intermediaries own-funds (when co-financing is envisaged). This limits the possibility of Financial Intermediaries to finance Final Recipients, when bankability criteria are not met. Moreover, the application of market terms (e.g. interest rates, duration of loans) and the eligibility and reporting requirements of the Final Recipients set by the Structural Funds regulations limited the overall benefits of FEIs to the Final Recipients. However, where specific State Aid JESSICA regimes were notified by MA to EC (e.g. UK, Andalusia) their practical application was often considered excessively complex. (Impact on all FEIs, more on urban development FEIs).
Complexity in matching the State Aid legislation and the provisions of Italian public
procurement rules reduced the possibility of FEIs to finance companies that were awarded the
concession of public infrastructures before the establishment of the FEIs. (Impact on urban
development FEIs).
Administrative procedures and Regional Operational Programmes
In the 2007-2013 programming period the majority of ROPs did not envisage the adoption on FEIs, in particular for urban development, and were designed for providing traditional form of support (e.g. grants). Later on, MAs revised ROPs to include the possibility to implements FEIs and aligned control procedures (“piste di controllo”) with specific requirements of FEIs. Not all MAs, however, designed specific criteria used to verify eligibility of projects to the ROPs in case of initiatives supported by FEIs. As a result, projects supported by FEIs had to comply with rigorous eligibility criteria established for grant supported initiatives (among which nature of Final Recipients of resources, typology of projects, project design phase) and to be financially viable at the same time. In contexts where the absorption rate of structural funds is very low, the consequence is a poor pipeline available for FEIs investment (or at least very long lasting assessment procedures); even when financially viable projects aligned with ROP priorities were identified by FEIs. (Impact on urban development FEIs).
Integrated Urban Development Planning was envisaged in the ROPs. However, it was structured as an integrated approach for allocating grant resources. The process started with the definition of plans by Municipalities. Then the MA required Municipalities to identify projects to reach the goals of the plans, with the ultimate objective to select initiatives for receiving grant support from ROPs. The 2007-2013 EU legislative package requires Urban Development FEIs to invest in projects included in Integrated Plans for Sustainable Urban Development, but leaves freedom to MA and the MS to define such Integrated Plans. Several problems were encountered in the identification of an adequate pipeline for FEIs support, given that projects included in Integrated Plans were mostly designed for grant support. (Impact on urban development FEIs).
Multiregional Study
24
Commitment, Capabilities and Experiences
Commitment. A successful implementation of FEI is the outcome of a coordinated and result oriented approach from all parties involved. Strong commitment is then required by all players of the process. (Impact on all FEIs).
Capabilities. The following capabilities are required to set-up, implement and manage FEIs: financial expertise, legal and administrative expertise, technical expertise, project management capabilities. The observation of the experience demonstrated that successful FEIs were implemented when such capabilities were available at all FEIs levels: MA, HF manager, Financial Institution, Final Recipients and Local Authorities. As far as the JESSICA-like FEIs are concerned, major bottlenecks occurred when capabilities of Local Authorities did not cover all the listed aspects, since it was an obstacle to the availability of suitable projects. (Impact on all FEIs, more on urban development FEIs).
Experiences. Ability to capitalise on past experience resulted to be an important success factor in the implementation of FEIs. Although FEIs were introduced in the 2007-2013 programming period, experiences of revolving instruments co-financed by EU or regional resources can be found in earlier programming periods (e.g. Infrastructure Fund in Lombardy). When players could benefit from specific experience, the implementation process was facilitated. Availability of supporting documentation (such as procedures, call for expression of interests, terms and conditions of agreements) and establishment network of contacts (e.g. network of financial intermediaries) are among major tangible benefits achieved by capitalising on experience in previous programming periods. (Impact on all FEIs).
Multiregional Study
25
2. Main Opportunities of the 2014-2020 Programme
2.1. Legal and policy framework
In accordance with CPR, the European strategic approach for the 2014-2020 aims to maximize the policy impact, implementing the European priorities and defining the programming objectives, in line with the “European Strategy 2020”.
The Thematic Objectives of the 2014-2020 Programme:
1) strengthening research, technological development and innovation;
2) enhancing access to and use and quality of ICT;
3) enhancing the competitiveness of SMEs, of the agricultural sector (for the EAFRD) and of the fishery and
aquaculture sector (for the EMFF);
4) supporting the shift towards a low-carbon economy in all sectors;
5) promoting climate change adaptation, risk prevention and management;
6) preserving and protecting the environment and promoting resources efficiency;
7) promoting sustainable transport and removing bottlenecks in key network infrastructures;
8) promoting sustainable and quality employment and supporting labour mobility;
9) promoting social inclusion, combating poverty and any discrimination;
10) investing in education, training and vocational training for skills and lifelong learning;
11) enhancing institutional capacity of public authorities and stakeholders and efficient public administration.
The Thematic Objectives are at the basis of the European strategy for smart, sustainable and inclusive growth, as provided in the “Common Strategic Framework”23 (CSF), proposed by the EC on 2012 March 14th, with the aim to facilitate the planning of the next period 2014-2020 within Member States and Regions. The CSF strategic objectives are translated into actions, within the ERDF, the Cohesion Fund, the ESF, the EAFRD and the EMFF (the “ESI Funds”).
2.1.1. EU Cohesion Policy 2014-2020: Financial Instruments
In the new programming period 2014-2020, the EC seeks to extend and strengthen the adoption of FIs, while
streamlining the implementation procedures and increasing the flexibility of such instruments. As a result, the
leverage effect of the European actions is expected to be maximised within the framework of the CSF.
The new 2014-2020 Regulation intends to solve some issues and ambiguities related to FEIs design and
implementation, in order to strengthen the legal certainty. The CPR includes a Title specifically on FIs: Title IV
“Financial Instruments”.
Financial instruments shall be implemented to support investments which are expected to be financially viable
and do not give rise to sufficient funding from market sources. When applying this Title, the managing
authority, the fund of funds, and the bodies implementing the financial instrument shall comply with applicable
Union and national law, in particular on state aid and public procurement.
23 Personal working document on the Common Strategic Framework, presented by the European Commission on 14 May 2012, following the Cohesion Policies proposal on 6 October 2011, aiming to encourage member States to be prepared for the next programming period 2014-2020. http://ec.europa.eu/regional_policy/what/future/index_it.cfm#1
Multiregional Study
26
Within this context, and in order to encourage the use of FIs within the Cohesion Policy framework 2014-2020,
the Commission proposes:
more flexibility to EU Member States and Regions in terms of Thematic Objectives and implementation opportunities;
a more solid implementation framework composed of clear and detailed rules based on the analysis of current sectoral trends and past experience;
increased synergy between FIs and other instruments, in particular grants;
compatibility with other FIs set up at EU level and managed by the Commission, in line with the Financial Regulation (direct management).
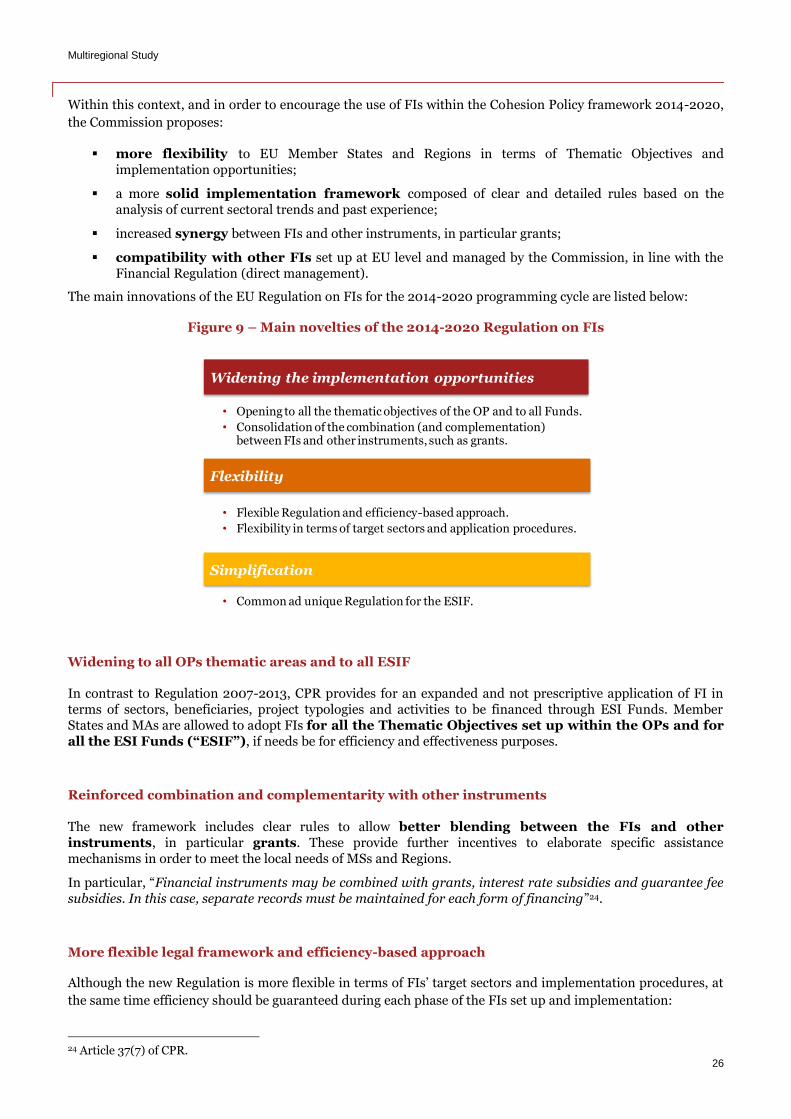
The main innovations of the EU Regulation on FIs for the 2014-2020 programming cycle are listed below:
Figure 9 – Main novelties of the 2014-2020 Regulation on FIs
Widening to all OPs thematic areas and to all ESIF
In contrast to Regulation 2007-2013, CPR provides for an expanded and not prescriptive application of FI in terms of sectors, beneficiaries, project typologies and activities to be financed through ESI Funds. Member States and MAs are allowed to adopt FIs for all the Thematic Objectives set up within the OPs and for all the ESI Funds (“ESIF”), if needs be for efficiency and effectiveness purposes.
Reinforced combination and complementarity with other instruments
The new framework includes clear rules to allow better blending between the FIs and other instruments, in particular grants. These provide further incentives to elaborate specific assistance mechanisms in order to meet the local needs of MSs and Regions.
In particular, “Financial instruments may be combined with grants, interest rate subsidies and guarantee fee subsidies. In this case, separate records must be maintained for each form of financing”24.
More flexible legal framework and efficiency-based approach
Although the new Regulation is more flexible in terms of FIs’ target sectors and implementation procedures, at
the same time efficiency should be guaranteed during each phase of the FIs set up and implementation:
24 Article 37(7) of CPR.
Widening the implementation opportunities
• Opening to all the thematic objectives of the OP and to all Funds.
• Consolidation of the combination (and complementation) between FIs and other instruments, such as grants.
Flexibility
• Flexible Regulation and efficiency-based approach.
• Flexibility in terms of target sectors and application procedures.
Simplification
• Common ad unique Regulation for the ESIF.
Multiregional Study
27
FIs design: the CPR contains a new provision whereas FIs can be set up only on the basis of an ex-ante assessment, to enable the detection of market gaps and related frameworks where investments are not efficient, the investment needs, the likely private sector participation and the coherent added value expected from the individual FI.
FIs incentives: two incentive mechanisms are introduced to stimulate the use of FIs. Benefits for MAs implementing FIs include: a 10% increase of the maximum EU co-financing rate at Axis level, where the whole of a priority axis is delivered through financial instruments, or through community-led local development (Art. 120 (5)(7)); the possibility to set, within an OP, a separated Priority Axis with a co-financing rate up to 100% where the FI is set up at EU level and directly or indirectly managed by the European Commission.
FIs phased payments: the total amount of programme contributions committed to the financial instrument under the relevant funding agreement will be paid to the FI in phases, according to the conditions spelled out in Art. 41 of the CPR, on the basis of applications for interim payments submitted during the period of eligibility as explained below in this document (page 34, “Requests for payment”).
FIs eligible expenditure at closure: in the OP closure phase, the eligible expenditure of the FI shall be the total amount of programme contributions effectively paid or, in the case of guarantees, committed by the FI within the eligibility period (Art. 42 of CPR).
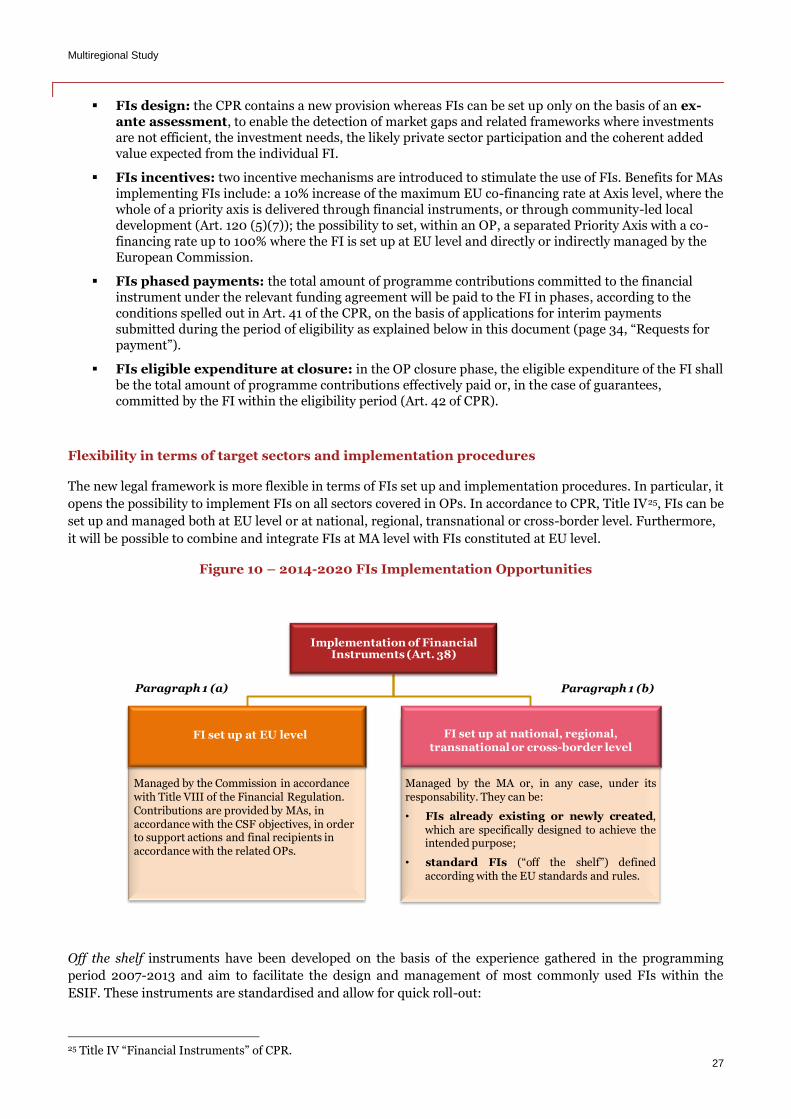
Flexibility in terms of target sectors and implementation procedures
The new legal framework is more flexible in terms of FIs set up and implementation procedures. In particular, it
opens the possibility to implement FIs on all sectors covered in OPs. In accordance to CPR, Title IV25, FIs can be
set up and managed both at EU level or at national, regional, transnational or cross-border level. Furthermore,
it will be possible to combine and integrate FIs at MA level with FIs constituted at EU level.
Figure 10 – 2014-2020 FIs Implementation Opportunities
Off the shelf instruments have been developed on the basis of the experience gathered in the programming
period 2007-2013 and aim to facilitate the design and management of most commonly used FIs within the
ESIF. These instruments are standardised and allow for quick roll-out:
25 Title IV “Financial Instruments” of CPR.
Implementation of Financial Instruments (Art. 38)
Managed by the Commission in accordance with Title VIII of the Financial Regulation. Contributions are provided by MAs, in accordance with the CSF objectives, in order to support actions and final recipients in accordance with the related OPs.
FI set up at EU level
Managed by the MA or, in any case, under itsresponsability. They can be:
• FIs already existing or newly created,which are specifically designed to achieve theintended purpose;
• standard FIs (“off the shelf”) definedaccording with the EU standards and rules.
FI set up at national, regional, transnational or cross-border level
Paragraph 1 (a) Paragraph 1 (b)
Multiregional Study
28
1. Risk-Sharing Loan. Loan for SMEs based on a portfolio risk sharing loan model. It is designed to support SMEs growth in case of limited availability of funding or little appetite for certain SMEs sectors or types. It results in a loan to co-finance a portfolio of newly originated loans.
2. Capped guarantee. Consisting in a support to loans to SMEs through the provision of credit risk protection (first loss portfolio capped guarantee), to ease SMEs access to finance.
3. Co-investment facility. Equity investment fund for SMEs and start-up companies based on a co-investment model.
4. Renovation Loan. Loan for energy efficiency and renewable energies in the residential building sector.
5. UD Loan (under development). Loan for sustainable urban development.
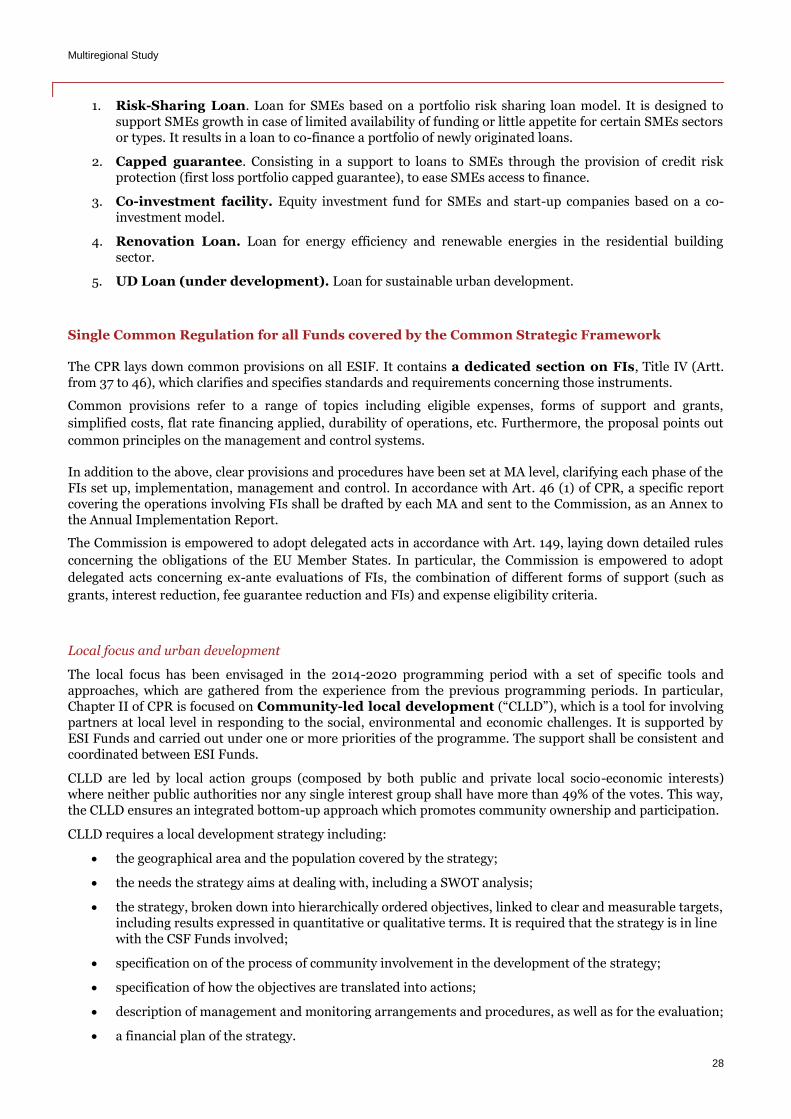
Single Common Regulation for all Funds covered by the Common Strategic Framework
The CPR lays down common provisions on all ESIF. It contains a dedicated section on FIs, Title IV (Artt. from 37 to 46), which clarifies and specifies standards and requirements concerning those instruments.
Common provisions refer to a range of topics including eligible expenses, forms of support and grants,
simplified costs, flat rate financing applied, durability of operations, etc. Furthermore, the proposal points out
common principles on the management and control systems.
In addition to the above, clear provisions and procedures have been set at MA level, clarifying each phase of the FIs set up, implementation, management and control. In accordance with Art. 46 (1) of CPR, a specific report covering the operations involving FIs shall be drafted by each MA and sent to the Commission, as an Annex to the Annual Implementation Report.
The Commission is empowered to adopt delegated acts in accordance with Art. 149, laying down detailed rules
concerning the obligations of the EU Member States. In particular, the Commission is empowered to adopt
delegated acts concerning ex-ante evaluations of FIs, the combination of different forms of support (such as
grants, interest reduction, fee guarantee reduction and FIs) and expense eligibility criteria.
Local focus and urban development
The local focus has been envisaged in the 2014-2020 programming period with a set of specific tools and approaches, which are gathered from the experience from the previous programming periods. In particular, Chapter II of CPR is focused on Community-led local development (“CLLD”), which is a tool for involving partners at local level in responding to the social, environmental and economic challenges. It is supported by ESI Funds and carried out under one or more priorities of the programme. The support shall be consistent and coordinated between ESI Funds.
CLLD are led by local action groups (composed by both public and private local socio-economic interests) where neither public authorities nor any single interest group shall have more than 49% of the votes. This way, the CLLD ensures an integrated bottom-up approach which promotes community ownership and participation.
CLLD requires a local development strategy including:
the geographical area and the population covered by the strategy;
the needs the strategy aims at dealing with, including a SWOT analysis;
the strategy, broken down into hierarchically ordered objectives, linked to clear and measurable targets, including results expressed in quantitative or qualitative terms. It is required that the strategy is in line with the CSF Funds involved;
specification on of the process of community involvement in the development of the strategy;
specification of how the objectives are translated into actions;
description of management and monitoring arrangements and procedures, as well as for the evaluation;
a financial plan of the strategy.
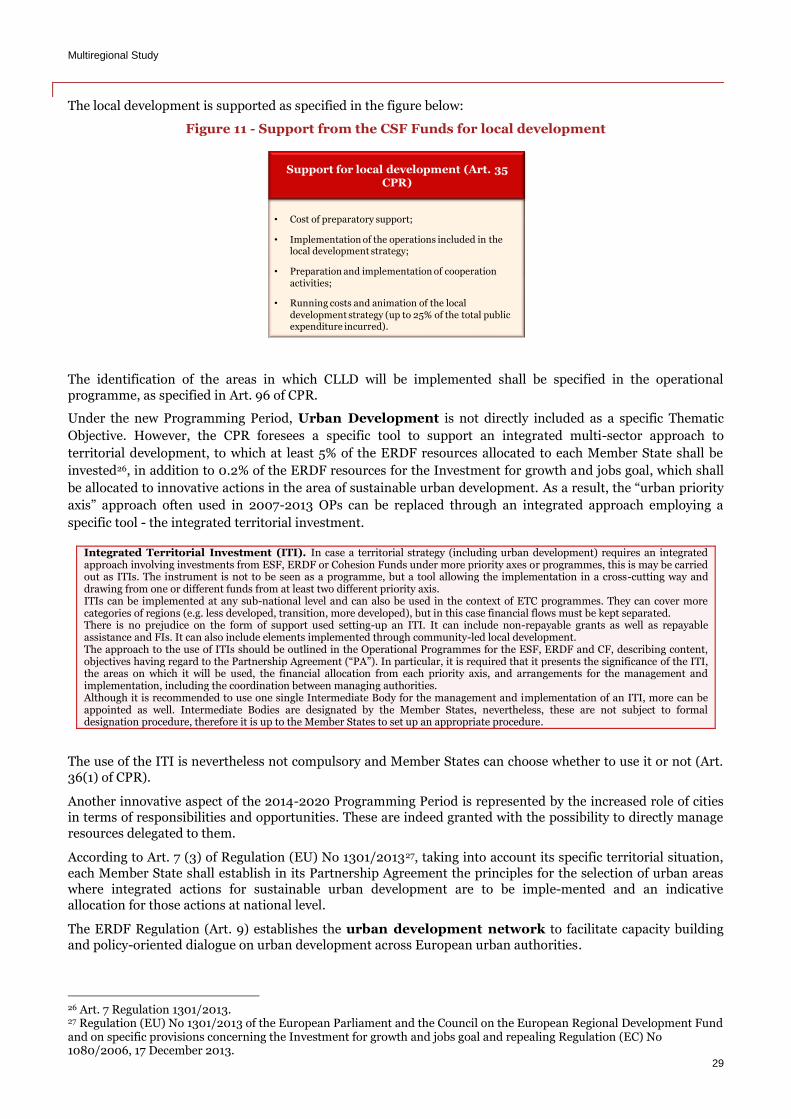
Multiregional Study
29
The local development is supported as specified in the figure below:
Figure 11 - Support from the CSF Funds for local development
The identification of the areas in which CLLD will be implemented shall be specified in the operational programme, as specified in Art. 96 of CPR.
Under the new Programming Period, Urban Development is not directly included as a specific Thematic
Objective. However, the CPR foresees a specific tool to support an integrated multi-sector approach to
territorial development, to which at least 5% of the ERDF resources allocated to each Member State shall be
invested26, in addition to 0.2% of the ERDF resources for the Investment for growth and jobs goal, which shall
be allocated to innovative actions in the area of sustainable urban development. As a result, the “urban priority
axis” approach often used in 2007-2013 OPs can be replaced through an integrated approach employing a
specific tool - the integrated territorial investment.
Integrated Territorial Investment (ITI). In case a territorial strategy (including urban development) requires an integrated approach involving investments from ESF, ERDF or Cohesion Funds under more priority axes or programmes, this is may be carried out as ITIs. The instrument is not to be seen as a programme, but a tool allowing the implementation in a cross-cutting way and drawing from one or different funds from at least two different priority axis. ITIs can be implemented at any sub-national level and can also be used in the context of ETC programmes. They can cover more categories of regions (e.g. less developed, transition, more developed), but in this case financial flows must be kept separated. There is no prejudice on the form of support used setting-up an ITI. It can include non-repayable grants as well as repayable assistance and FIs. It can also include elements implemented through community-led local development. The approach to the use of ITIs should be outlined in the Operational Programmes for the ESF, ERDF and CF, describing content, objectives having regard to the Partnership Agreement (“PA”). In particular, it is required that it presents the significance of the ITI, the areas on which it will be used, the financial allocation from each priority axis, and arrangements for the management and implementation, including the coordination between managing authorities. Although it is recommended to use one single Intermediate Body for the management and implementation of an ITI, more can be appointed as well. Intermediate Bodies are designated by the Member States, nevertheless, these are not subject to formal designation procedure, therefore it is up to the Member States to set up an appropriate procedure.
The use of the ITI is nevertheless not compulsory and Member States can choose whether to use it or not (Art. 36(1) of CPR).
Another innovative aspect of the 2014-2020 Programming Period is represented by the increased role of cities in terms of responsibilities and opportunities. These are indeed granted with the possibility to directly manage resources delegated to them.
According to Art. 7 (3) of Regulation (EU) No 1301/201327, taking into account its specific territorial situation, each Member State shall establish in its Partnership Agreement the principles for the selection of urban areas where integrated actions for sustainable urban development are to be implemented and an indicative allocation for those actions at national level.
The ERDF Regulation (Art. 9) establishes the urban development network to facilitate capacity building and policy-oriented dialogue on urban development across European urban authorities.
26 Art. 7 Regulation 1301/2013. 27 Regulation (EU) No 1301/2013 of the European Parliament and the Council on the European Regional Development Fund and on specific provisions concerning the Investment for growth and jobs goal and repealing Regulation (EC) No 1080/2006, 17 December 2013.
• Cost of preparatory support;
• Implementation of the operations included in the local development strategy;
• Preparation and implementation of cooperation activities;
• Running costs and animation of the local development strategy (up to 25% of the total public expenditure incurred).
Support for local development (Art. 35 CPR)
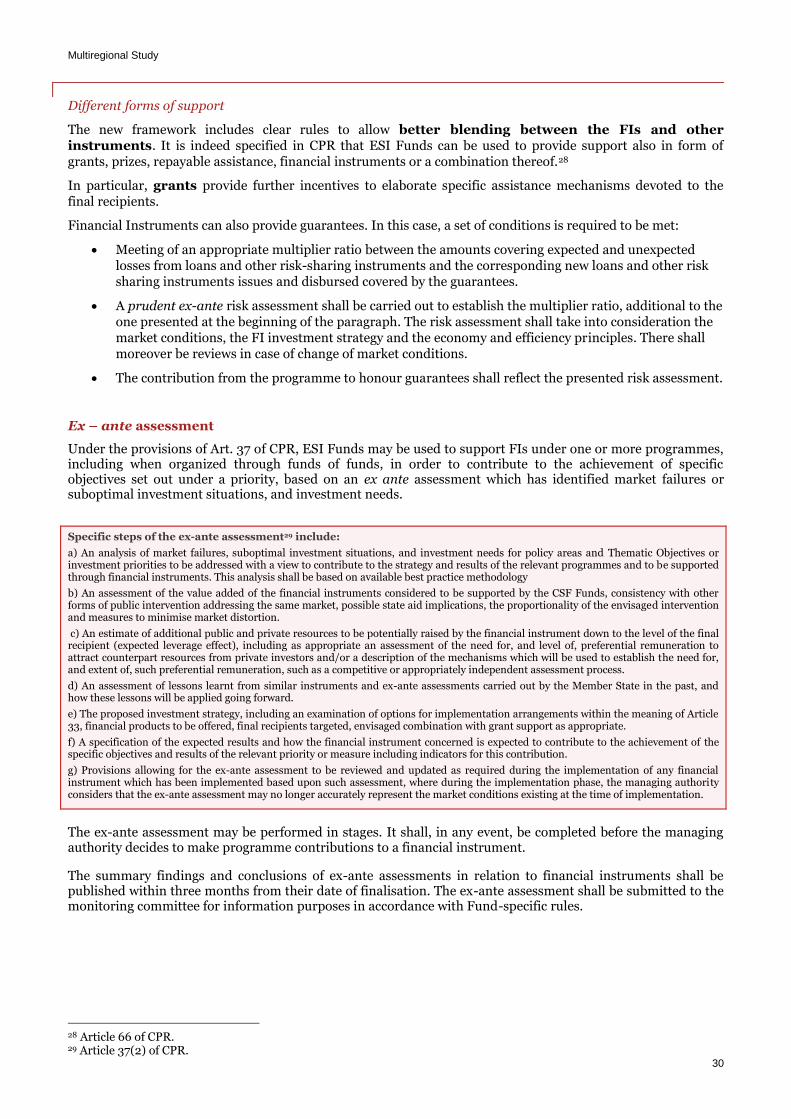
Multiregional Study
30
Different forms of support
The new framework includes clear rules to allow better blending between the FIs and other instruments. It is indeed specified in CPR that ESI Funds can be used to provide support also in form of grants, prizes, repayable assistance, financial instruments or a combination thereof.28
In particular, grants provide further incentives to elaborate specific assistance mechanisms devoted to the final recipients.
Financial Instruments can also provide guarantees. In this case, a set of conditions is required to be met:
Meeting of an appropriate multiplier ratio between the amounts covering expected and unexpected losses from loans and other risk-sharing instruments and the corresponding new loans and other risk sharing instruments issues and disbursed covered by the guarantees.
A prudent ex-ante risk assessment shall be carried out to establish the multiplier ratio, additional to the one presented at the beginning of the paragraph. The risk assessment shall take into consideration the market conditions, the FI investment strategy and the economy and efficiency principles. There shall moreover be reviews in case of change of market conditions.
The contribution from the programme to honour guarantees shall reflect the presented risk assessment.
Ex – ante assessment
Under the provisions of Art. 37 of CPR, ESI Funds may be used to support FIs under one or more programmes, including when organized through funds of funds, in order to contribute to the achievement of specific objectives set out under a priority, based on an ex ante assessment which has identified market failures or suboptimal investment situations, and investment needs.
Specific steps of the ex-ante assessment29 include:
a) An analysis of market failures, suboptimal investment situations, and investment needs for policy areas and Thematic Objectives or investment priorities to be addressed with a view to contribute to the strategy and results of the relevant programmes and to be supported through financial instruments. This analysis shall be based on available best practice methodology
b) An assessment of the value added of the financial instruments considered to be supported by the CSF Funds, consistency with other forms of public intervention addressing the same market, possible state aid implications, the proportionality of the envisaged intervention and measures to minimise market distortion.
c) An estimate of additional public and private resources to be potentially raised by the financial instrument down to the level of the final recipient (expected leverage effect), including as appropriate an assessment of the need for, and level of, preferential remuneration to attract counterpart resources from private investors and/or a description of the mechanisms which will be used to establish the need for, and extent of, such preferential remuneration, such as a competitive or appropriately independent assessment process.
d) An assessment of lessons learnt from similar instruments and ex-ante assessments carried out by the Member State in the past, and how these lessons will be applied going forward.
e) The proposed investment strategy, including an examination of options for implementation arrangements within the meaning of Article 33, financial products to be offered, final recipients targeted, envisaged combination with grant support as appropriate.
f) A specification of the expected results and how the financial instrument concerned is expected to contribute to the achievement of the specific objectives and results of the relevant priority or measure including indicators for this contribution.
g) Provisions allowing for the ex-ante assessment to be reviewed and updated as required during the implementation of any financial instrument which has been implemented based upon such assessment, where during the implementation phase, the managing authority considers that the ex-ante assessment may no longer accurately represent the market conditions existing at the time of implementation.
The ex-ante assessment may be performed in stages. It shall, in any event, be completed before the managing authority decides to make programme contributions to a financial instrument.
The summary findings and conclusions of ex-ante assessments in relation to financial instruments shall be published within three months from their date of finalisation. The ex-ante assessment shall be submitted to the monitoring committee for information purposes in accordance with Fund-specific rules.
28 Article 66 of CPR. 29 Article 37(2) of CPR.
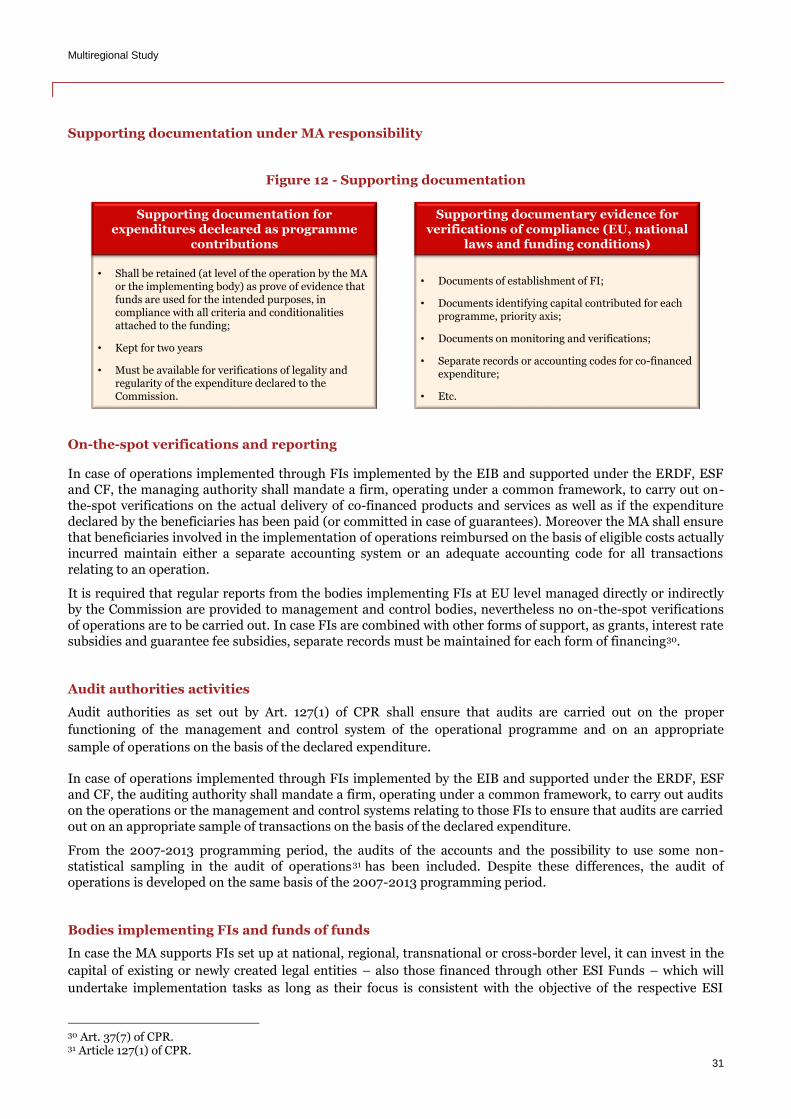
Multiregional Study
31
Supporting documentation under MA responsibility
Figure 12 - Supporting documentation
On-the-spot verifications and reporting
In case of operations implemented through FIs implemented by the EIB and supported under the ERDF, ESF and CF, the managing authority shall mandate a firm, operating under a common framework, to carry out on-the-spot verifications on the actual delivery of co-financed products and services as well as if the expenditure declared by the beneficiaries has been paid (or committed in case of guarantees). Moreover the MA shall ensure that beneficiaries involved in the implementation of operations reimbursed on the basis of eligible costs actually incurred maintain either a separate accounting system or an adequate accounting code for all transactions relating to an operation.
It is required that regular reports from the bodies implementing FIs at EU level managed directly or indirectly by the Commission are provided to management and control bodies, nevertheless no on-the-spot verifications of operations are to be carried out. In case FIs are combined with other forms of support, as grants, interest rate subsidies and guarantee fee subsidies, separate records must be maintained for each form of financing30.
Audit authorities activities
Audit authorities as set out by Art. 127(1) of CPR shall ensure that audits are carried out on the proper
functioning of the management and control system of the operational programme and on an appropriate
sample of operations on the basis of the declared expenditure.
In case of operations implemented through FIs implemented by the EIB and supported under the ERDF, ESF and CF, the auditing authority shall mandate a firm, operating under a common framework, to carry out audits on the operations or the management and control systems relating to those FIs to ensure that audits are carried out on an appropriate sample of transactions on the basis of the declared expenditure.
From the 2007-2013 programming period, the audits of the accounts and the possibility to use some non-statistical sampling in the audit of operations31 has been included. Despite these differences, the audit of operations is developed on the same basis of the 2007-2013 programming period.
Bodies implementing FIs and funds of funds
In case the MA supports FIs set up at national, regional, transnational or cross-border level, it can invest in the
capital of existing or newly created legal entities – also those financed through other ESI Funds – which will
undertake implementation tasks as long as their focus is consistent with the objective of the respective ESI
30 Art. 37(7) of CPR. 31 Article 127(1) of CPR.
• Shall be retained (at level of the operation by the MA or the implementing body) as prove of evidence that funds are used for the intended purposes, in compliance with all criteria and conditionalitiesattached to the funding;
• Kept for two years
• Must be available for verifications of legality and regularity of the expenditure declared to the Commission.
Supporting documentation for expenditures decleared as programme
contributions
• Documents of establishment of FI;
• Documents identifying capital contributed for each programme, priority axis;
• Documents on monitoring and verifications;
• Separate records or accounting codes for co-financed expenditure;
• Etc.
Supporting documentary evidence for verifications of compliance (EU, national
laws and funding conditions)
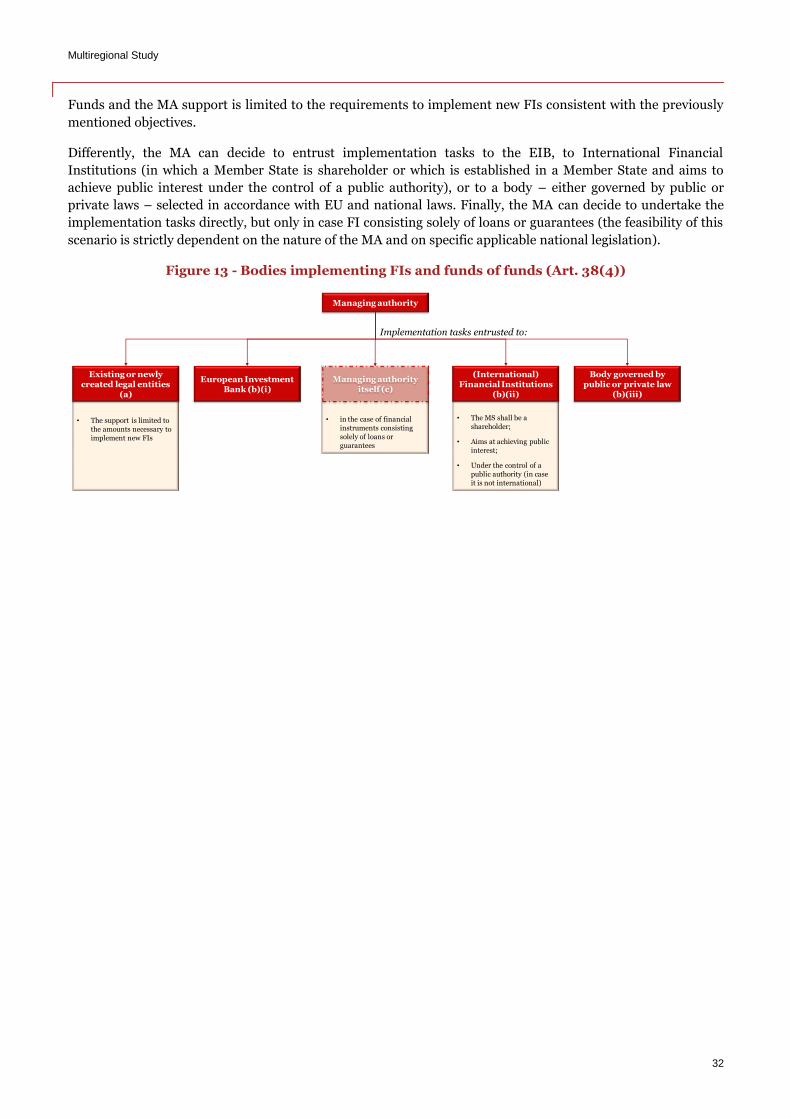
Multiregional Study
32
Funds and the MA support is limited to the requirements to implement new FIs consistent with the previously
mentioned objectives.
Differently, the MA can decide to entrust implementation tasks to the EIB, to International Financial
Institutions (in which a Member State is shareholder or which is established in a Member State and aims to
achieve public interest under the control of a public authority), or to a body – either governed by public or
private laws – selected in accordance with EU and national laws. Finally, the MA can decide to undertake the
implementation tasks directly, but only in case FI consisting solely of loans or guarantees (the feasibility of this
scenario is strictly dependent on the nature of the MA and on specific applicable national legislation).
Figure 13 - Bodies implementing FIs and funds of funds (Art. 38(4))
• in the case of financial
instruments consisting
solely of loans or
guarantees
• The MS shall be a
shareholder;
• Aims at achieving public
interest;
• Under the control of a
public authority (in case
it is not international)
• The support is limited to
the amounts necessary to
implement new FIs
Managing authority
Existing or newly created legal entities
(a)
European Investment Bank (b)(i)
(International) Financial Institutions
(b)(ii)
Body governed by public or private law
(b)(iii)
Managing authority itself (c)
Implementation tasks entrusted to:
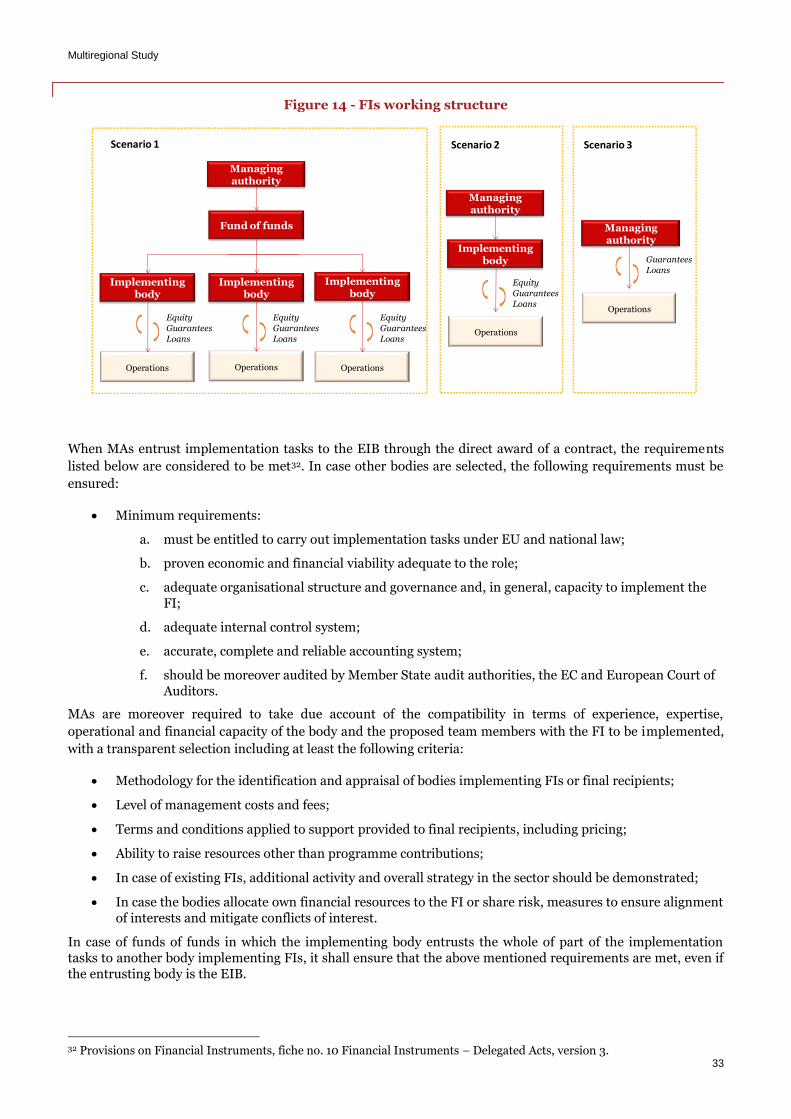
Multiregional Study
33
Figure 14 - FIs working structure
When MAs entrust implementation tasks to the EIB through the direct award of a contract, the requirements
listed below are considered to be met32. In case other bodies are selected, the following requirements must be
ensured:
Minimum requirements:
a. must be entitled to carry out implementation tasks under EU and national law;
b. proven economic and financial viability adequate to the role;
c. adequate organisational structure and governance and, in general, capacity to implement the FI;
d. adequate internal control system;
e. accurate, complete and reliable accounting system;
f. should be moreover audited by Member State audit authorities, the EC and European Court of Auditors.
MAs are moreover required to take due account of the compatibility in terms of experience, expertise,
operational and financial capacity of the body and the proposed team members with the FI to be implemented,
with a transparent selection including at least the following criteria:
Methodology for the identification and appraisal of bodies implementing FIs or final recipients;
Level of management costs and fees;
Terms and conditions applied to support provided to final recipients, including pricing;
Ability to raise resources other than programme contributions;
In case of existing FIs, additional activity and overall strategy in the sector should be demonstrated;
In case the bodies allocate own financial resources to the FI or share risk, measures to ensure alignment of interests and mitigate conflicts of interest.
In case of funds of funds in which the implementing body entrusts the whole of part of the implementation tasks to another body implementing FIs, it shall ensure that the above mentioned requirements are met, even if the entrusting body is the EIB.
32 Provisions on Financial Instruments, fiche no. 10 Financial Instruments – Delegated Acts, version 3.
Operations
Managing authority
Fund of funds
Implementing body
Implementing body
Implementing body
OperationsOperations
Equity
Guarantees
Loans
Equity
Guarantees
Loans
Equity
Guarantees
LoansOperations
Managing authority
Implementing body
Equity
Guarantees
Loans
Scenario 1 Scenario 2 Scenario 3
Managing authority
Operations
Guarantees
Loans
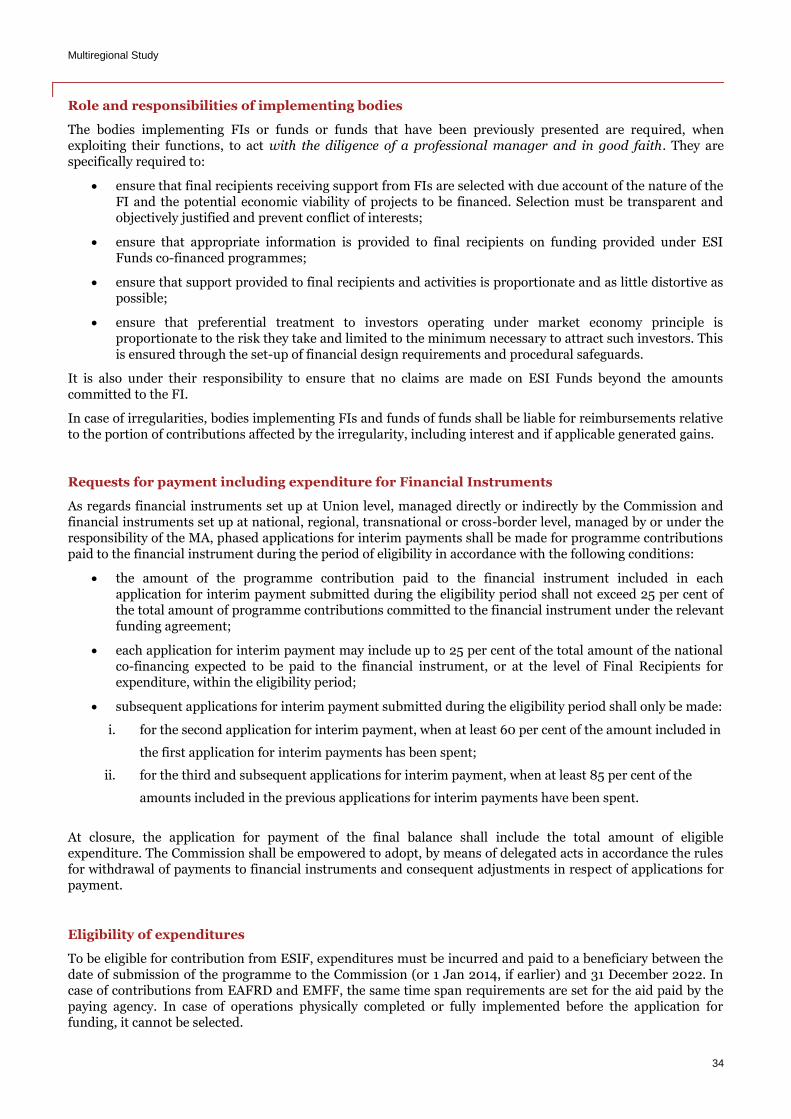
Multiregional Study
34
Role and responsibilities of implementing bodies
The bodies implementing FIs or funds or funds that have been previously presented are required, when exploiting their functions, to act with the diligence of a professional manager and in good faith. They are specifically required to:
ensure that final recipients receiving support from FIs are selected with due account of the nature of the FI and the potential economic viability of projects to be financed. Selection must be transparent and objectively justified and prevent conflict of interests;
ensure that appropriate information is provided to final recipients on funding provided under ESI Funds co-financed programmes;
ensure that support provided to final recipients and activities is proportionate and as little distortive as possible;
ensure that preferential treatment to investors operating under market economy principle is proportionate to the risk they take and limited to the minimum necessary to attract such investors. This is ensured through the set-up of financial design requirements and procedural safeguards.
It is also under their responsibility to ensure that no claims are made on ESI Funds beyond the amounts committed to the FI.
In case of irregularities, bodies implementing FIs and funds of funds shall be liable for reimbursements relative to the portion of contributions affected by the irregularity, including interest and if applicable generated gains.
Requests for payment including expenditure for Financial Instruments
As regards financial instruments set up at Union level, managed directly or indirectly by the Commission and financial instruments set up at national, regional, transnational or cross-border level, managed by or under the responsibility of the MA, phased applications for interim payments shall be made for programme contributions paid to the financial instrument during the period of eligibility in accordance with the following conditions:
the amount of the programme contribution paid to the financial instrument included in each application for interim payment submitted during the eligibility period shall not exceed 25 per cent of the total amount of programme contributions committed to the financial instrument under the relevant funding agreement;
each application for interim payment may include up to 25 per cent of the total amount of the national co-financing expected to be paid to the financial instrument, or at the level of Final Recipients for expenditure, within the eligibility period;
subsequent applications for interim payment submitted during the eligibility period shall only be made:
i. for the second application for interim payment, when at least 60 per cent of the amount included in
the first application for interim payments has been spent;
ii. for the third and subsequent applications for interim payment, when at least 85 per cent of the
amounts included in the previous applications for interim payments have been spent.
At closure, the application for payment of the final balance shall include the total amount of eligible expenditure. The Commission shall be empowered to adopt, by means of delegated acts in accordance the rules for withdrawal of payments to financial instruments and consequent adjustments in respect of applications for payment.
Eligibility of expenditures
To be eligible for contribution from ESIF, expenditures must be incurred and paid to a beneficiary between the date of submission of the programme to the Commission (or 1 Jan 2014, if earlier) and 31 December 2022. In case of contributions from EAFRD and EMFF, the same time span requirements are set for the aid paid by the paying agency. In case of operations physically completed or fully implemented before the application for funding, it cannot be selected.
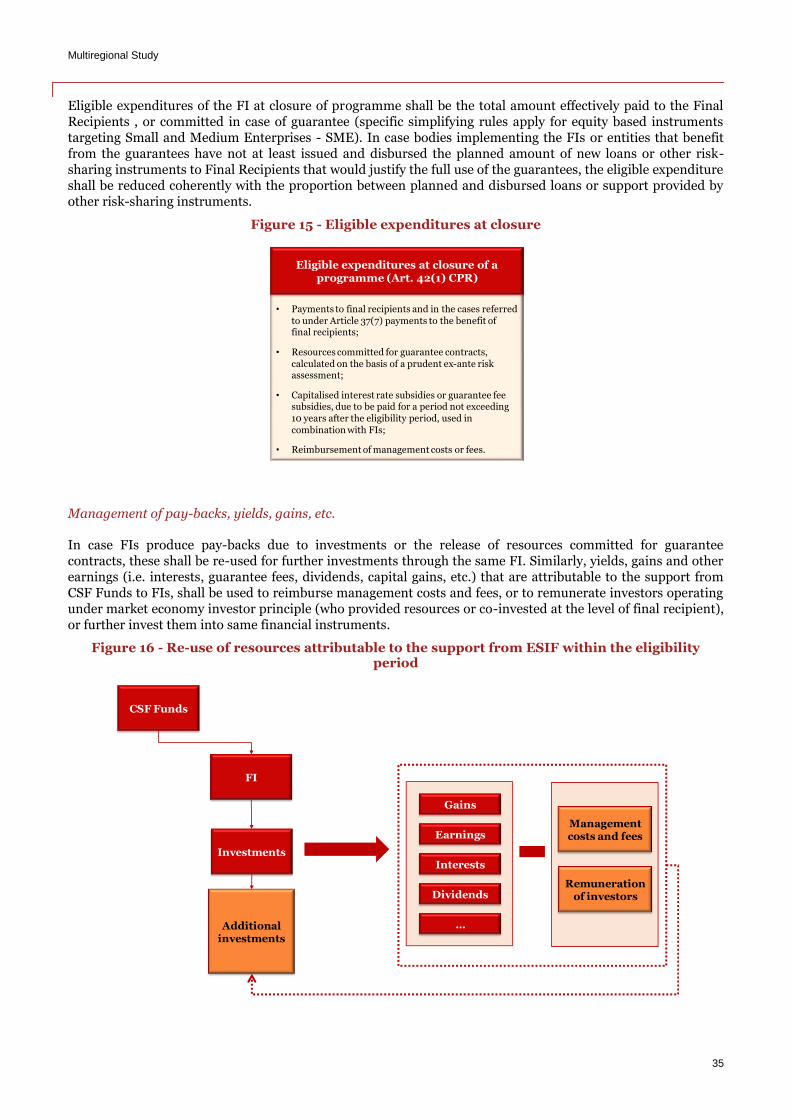
Multiregional Study
35
Eligible expenditures of the FI at closure of programme shall be the total amount effectively paid to the Final Recipients , or committed in case of guarantee (specific simplifying rules apply for equity based instruments targeting Small and Medium Enterprises - SME). In case bodies implementing the FIs or entities that benefit from the guarantees have not at least issued and disbursed the planned amount of new loans or other risk-sharing instruments to Final Recipients that would justify the full use of the guarantees, the eligible expenditure shall be reduced coherently with the proportion between planned and disbursed loans or support provided by other risk-sharing instruments.
Figure 15 - Eligible expenditures at closure
Management of pay-backs, yields, gains, etc.
In case FIs produce pay-backs due to investments or the release of resources committed for guarantee contracts, these shall be re-used for further investments through the same FI. Similarly, yields, gains and other earnings (i.e. interests, guarantee fees, dividends, capital gains, etc.) that are attributable to the support from CSF Funds to FIs, shall be used to reimburse management costs and fees, or to remunerate investors operating under market economy investor principle (who provided resources or co-invested at the level of final recipient), or further invest them into same financial instruments.
Figure 16 - Re-use of resources attributable to the support from ESIF within the eligibility period
• Payments to final recipients and in the cases referred to under Article 37(7) payments to the benefit of final recipients;
• Resources committed for guarantee contracts, calculated on the basis of a prudent ex-ante risk assessment;
• Capitalised interest rate subsidies or guarantee fee subsidies, due to be paid for a period not exceeding 10 years after the eligibility period, used in combination with FIs;
• Reimbursement of management costs or fees.
Eligible expenditures at closure of a programme (Art. 42(1) CPR)
CSF Funds
FI
Investments
Gains
Interests
Earnings
Dividends
…Additional investments
Management costs and fees
Remuneration of investors
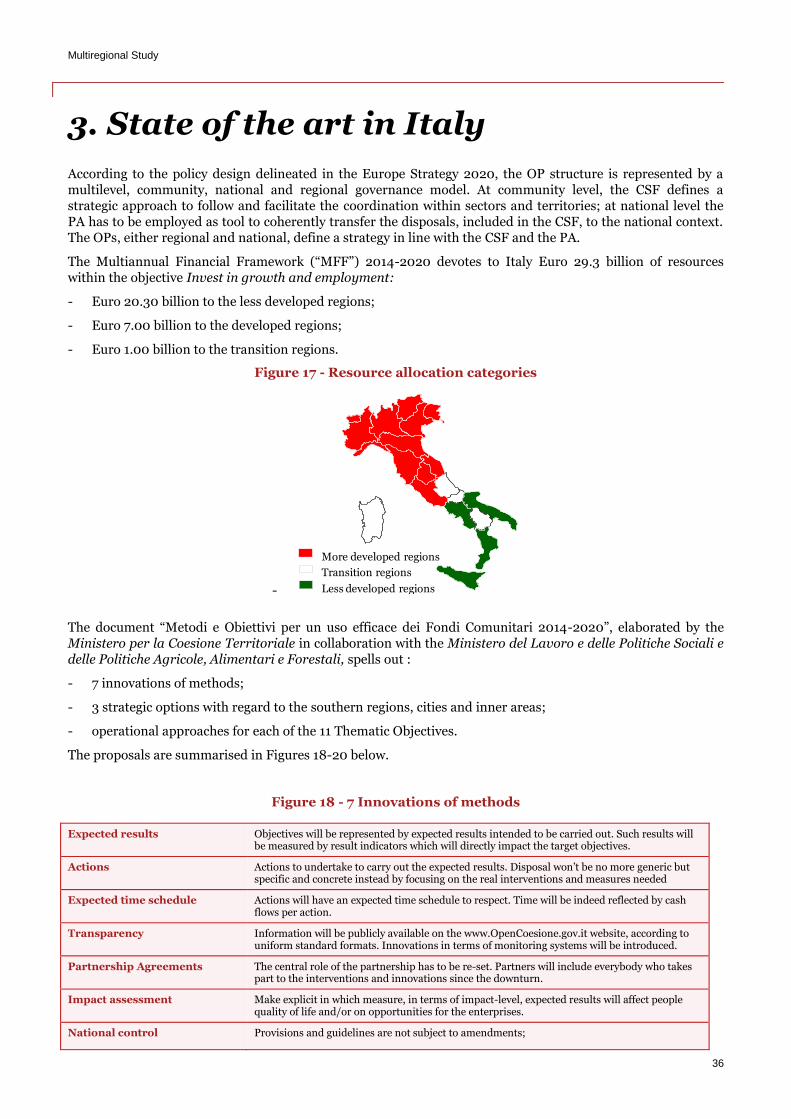
Multiregional Study
36
3. State of the art in Italy
According to the policy design delineated in the Europe Strategy 2020, the OP structure is represented by a multilevel, community, national and regional governance model. At community level, the CSF defines a strategic approach to follow and facilitate the coordination within sectors and territories; at national level the PA has to be employed as tool to coherently transfer the disposals, included in the CSF, to the national context. The OPs, either regional and national, define a strategy in line with the CSF and the PA.
The Multiannual Financial Framework (“MFF”) 2014-2020 devotes to Italy Euro 29.3 billion of resources within the objective Invest in growth and employment:
- Euro 20.30 billion to the less developed regions;
- Euro 7.00 billion to the developed regions;
- Euro 1.00 billion to the transition regions.
Figure 17 - Resource allocation categories
-
The document “Metodi e Obiettivi per un uso efficace dei Fondi Comunitari 2014-2020”, elaborated by the Ministero per la Coesione Territoriale in collaboration with the Ministero del Lavoro e delle Politiche Sociali e delle Politiche Agricole, Alimentari e Forestali, spells out :
- 7 innovations of methods;
- 3 strategic options with regard to the southern regions, cities and inner areas;
- operational approaches for each of the 11 Thematic Objectives.
The proposals are summarised in Figures 18-20 below.
Figure 18 - 7 Innovations of methods
Expected results Objectives will be represented by expected results intended to be carried out. Such results will be measured by result indicators which will directly impact the target objectives.
Actions Actions to undertake to carry out the expected results. Disposal won’t be no more generic but specific and concrete instead by focusing on the real interventions and measures needed
Expected time schedule Actions will have an expected time schedule to respect. Time will be indeed reflected by cash flows per action.
Transparency Information will be publicly available on the www.OpenCoesione.gov.it website, according to uniform standard formats. Innovations in terms of monitoring systems will be introduced.
Partnership Agreements The central role of the partnership has to be re-set. Partners will include everybody who takes part to the interventions and innovations since the downturn.
Impact assessment Make explicit in which measure, in terms of impact-level, expected results will affect people quality of life and/or on opportunities for the enterprises.
National control Provisions and guidelines are not subject to amendments;
More developed regions
Transition regions
Less developed regions
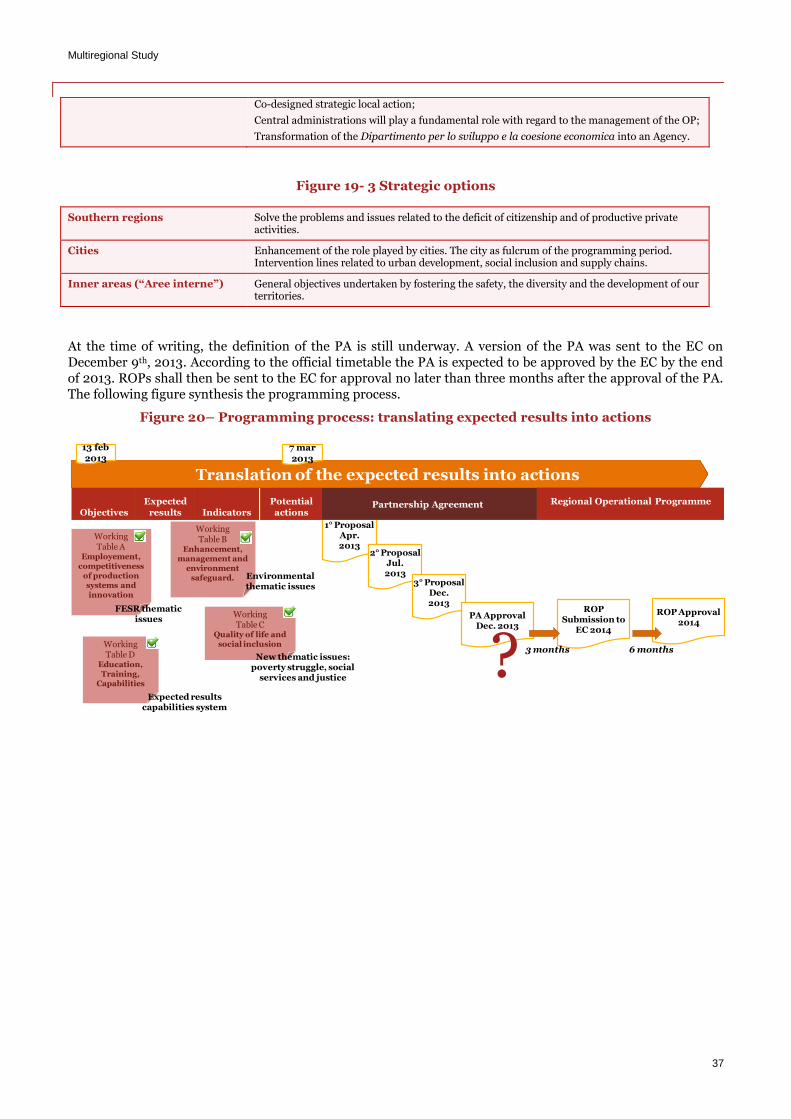
Multiregional Study
37
Co-designed strategic local action;
Central administrations will play a fundamental role with regard to the management of the OP;
Transformation of the Dipartimento per lo sviluppo e la coesione economica into an Agency.
Figure 19- 3 Strategic options
Southern regions Solve the problems and issues related to the deficit of citizenship and of productive private activities.
Cities Enhancement of the role played by cities. The city as fulcrum of the programming period. Intervention lines related to urban development, social inclusion and supply chains.
Inner areas (“Aree interne”) General objectives undertaken by fostering the safety, the diversity and the development of our territories.
At the time of writing, the definition of the PA is still underway. A version of the PA was sent to the EC on December 9th, 2013. According to the official timetable the PA is expected to be approved by the EC by the end of 2013. ROPs shall then be sent to the EC for approval no later than three months after the approval of the PA. The following figure synthesis the programming process.
Figure 20– Programming process: translating expected results into actions
1° ProposalApr.2013
Partnership AgreementObjectives
Expectedresults Indicators
Potentialactions
Translation of the expected results into actions
7 mar
2013
13 feb
2013
WorkingTable A
Employement, competitiveness
of production systems and innovation
WorkingTable B
Enhancement, management and
environmentsafeguard.
WorkingTable C
Quality of life and social inclusionWorking
Table DEducation, Training,
Capabilities
FESR thematicissues
New thematic issues: poverty struggle, social
services and justice
Environmentalthematic issues
ROP Submission to
EC 2014
Regional Operational Programme
Expected resultscapabilities system
2° ProposalJul.2013
3° ProposalDec.2013
ROP Approval2014
6 months
PA ApprovalDec. 2013
? 3 months
Multiregional Study
38
4. Methodology proposed for the regional analysis
The opportunities for FIs’ implementation offered in the coming programming period and lessons learnt from past experiences suggest the following methodology for a preliminary assessment of the opportunity to implement FIs at regional level:
- Analysis of the 2014-2020 ERDF ROPs, to identify regional priorities. A strong commitment by all parties involved in FIs implementation can be reached only if FIs target priority sectors. A successful implementation of FIs is partially dependent on the way ROPs are designed. The analysis will identify priorities and describe the structure of each ERDF ROP, with a specific focus of the way it is intended to support the goals of the Urban Agenda.
- Analysis of the regional context, with a specific focus on the defined regional priority sectors. The analysis will include market trends, operators, experiences, potential funding sources. Aim of the analysis will be the identification of potential market of the FI, the identification of market failure and inadequate investment situations and the description of potential benefits coming from the introduction of FIs including, where applicable, the need to reinforce capabilities of market players.
- Proposal for the implementation of FIs within the region, including expected results, an outline of the proposed investment strategy and roadmap for the implementation.
Each regional study may provide recommendations for the improvement of the design of ROPs, in order to maximise the benefits coming from the adoption of FIs. Specific attention will be given to urban development / territorial aspects.

Multiregional Study
39
Section 2 - Regional studies
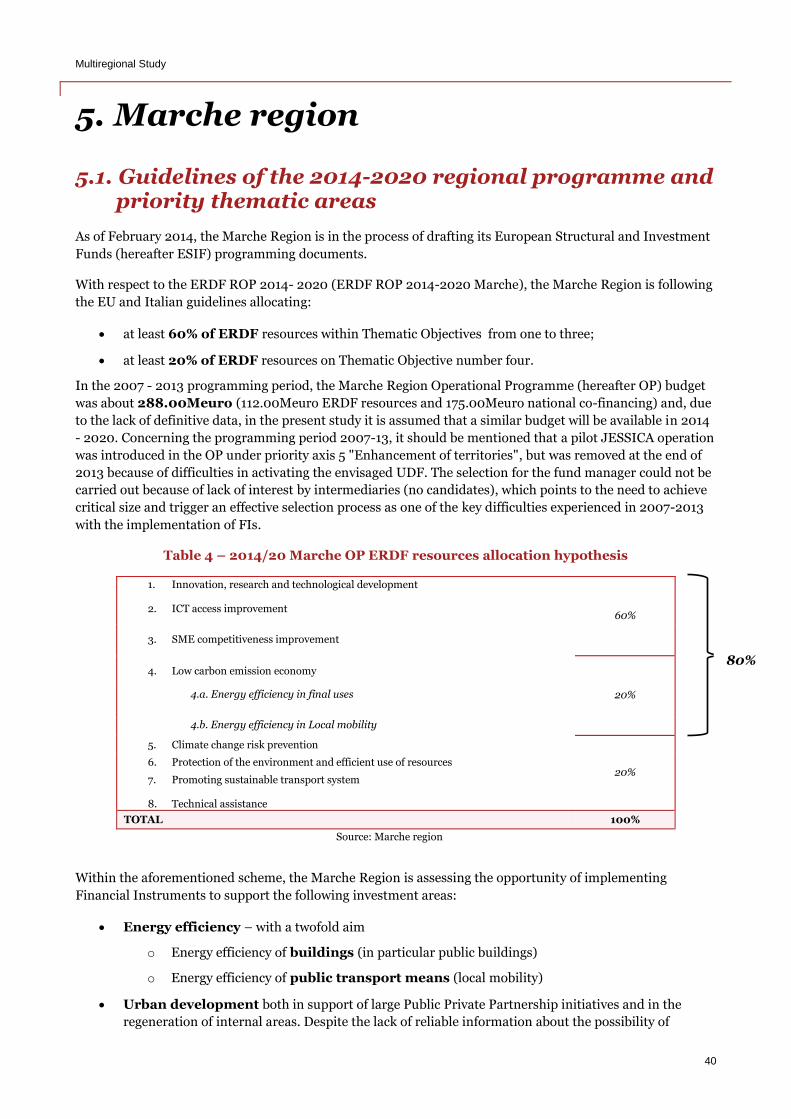
Multiregional Study
40
5. Marche region
5.1. Guidelines of the 2014-2020 regional programme and priority thematic areas
As of February 2014, the Marche Region is in the process of drafting its European Structural and Investment
Funds (hereafter ESIF) programming documents.
With respect to the ERDF ROP 2014- 2020 (ERDF ROP 2014-2020 Marche), the Marche Region is following
the EU and Italian guidelines allocating:
at least 60% of ERDF resources within Thematic Objectives from one to three;
at least 20% of ERDF resources on Thematic Objective number four.
In the 2007 - 2013 programming period, the Marche Region Operational Programme (hereafter OP) budget
was about 288.00Meuro (112.00Meuro ERDF resources and 175.00Meuro national co-financing) and, due
to the lack of definitive data, in the present study it is assumed that a similar budget will be available in 2014
- 2020. Concerning the programming period 2007-13, it should be mentioned that a pilot JESSICA operation
was introduced in the OP under priority axis 5 "Enhancement of territories", but was removed at the end of
2013 because of difficulties in activating the envisaged UDF. The selection for the fund manager could not be
carried out because of lack of interest by intermediaries (no candidates), which points to the need to achieve
critical size and trigger an effective selection process as one of the key difficulties experienced in 2007-2013
with the implementation of FIs.
Table 4 – 2014/20 Marche OP ERDF resources allocation hypothesis
1. Innovation, research and technological development
60% 2. ICT access improvement
3. SME competitiveness improvement
4. Low carbon emission economy
20% 4.a. Energy efficiency in final uses
4.b. Energy efficiency in Local mobility
5. Climate change risk prevention
20% 6. Protection of the environment and efficient use of resources
7. Promoting sustainable transport system
8. Technical assistance
TOTAL 100%
Source: Marche region
Within the aforementioned scheme, the Marche Region is assessing the opportunity of implementing
Financial Instruments to support the following investment areas:
Energy efficiency – with a twofold aim
o Energy efficiency of buildings (in particular public buildings)
o Energy efficiency of public transport means (local mobility)
Urban development both in support of large Public Private Partnership initiatives and in the
regeneration of internal areas. Despite the lack of reliable information about the possibility of
80%

Multiregional Study
41
financing these investments, at time being the Marche region is considering the implementation of a
FI in this sector.
5.2. Sectors, financial requirements and suboptimal investment conditions
5.2.1. Urban regeneration
Demography
The Marche region has a resident population of 1.54 million inhabitants, with an increase during the 2001 -
2011 period of about 100,000 inhabitants, largely due to the flow of foreigners in the major urban systems.
The majority of the regional population (over 70%) is concentrated in 11 urban systems (about 50% of
residents in the provinces of Ancona and Pesaro-Urbino) mainly located along the coast, each consisting of a
set of contiguous municipalities with a common "core".
The figure below shows how the most populated centres are concentrated along the coastal area. The area
between Fabriano-Ancona and Macerata is rather sparsely populated and also the inland provinces of
Macerata, Fermo, Ascoli Piceno and Pesaro-Urbino (with the exception of the peripheral zone to the City of
Urbino).
Figure 21 – Marche region population distribution
Source: ISTAT (2012)
The composition of the population is characterized by an active population accounting for 65% of the
total, while the share of over-65 and under-14 is equal respectively to 22.5% and 13%.
Regional economy
The Marche economy recorded between 2007 and 2012 a GDP decline larger than the national level. This
was due to the wide spread presence of small medium enterprises oriented to manufacturing production.
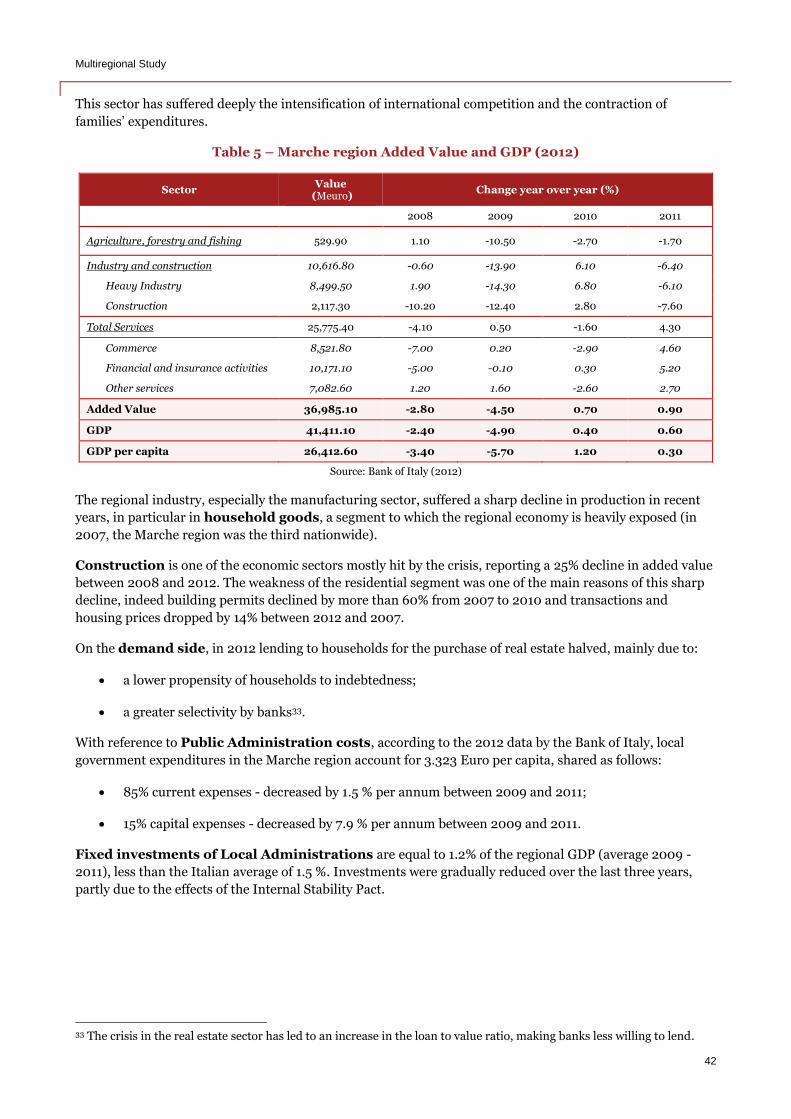
Multiregional Study
42
This sector has suffered deeply the intensification of international competition and the contraction of
families’ expenditures.
Table 5 – Marche region Added Value and GDP (2012)
Sector Value
(Meuro) Change year over year (%)
2008 2009 2010 2011
Agriculture, forestry and fishing 529.90 1.10 -10.50 -2.70 -1.70
Industry and construction 10,616.80 -0.60 -13.90 6.10 -6.40
Heavy Industry 8,499.50 1.90 -14.30 6.80 -6.10
Construction 2,117.30 -10.20 -12.40 2.80 -7.60
Total Services 25,775.40 -4.10 0.50 -1.60 4.30
Commerce 8,521.80 -7.00 0.20 -2.90 4.60
Financial and insurance activities 10,171.10 -5.00 -0.10 0.30 5.20
Other services 7,082.60 1.20 1.60 -2.60 2.70
Added Value 36,985.10 -2.80 -4.50 0.70 0.90
GDP 41,411.10 -2.40 -4.90 0.40 0.60
GDP per capita 26,412.60 -3.40 -5.70 1.20 0.30
Source: Bank of Italy (2012)
The regional industry, especially the manufacturing sector, suffered a sharp decline in production in recent
years, in particular in household goods, a segment to which the regional economy is heavily exposed (in
2007, the Marche region was the third nationwide).
Construction is one of the economic sectors mostly hit by the crisis, reporting a 25% decline in added value
between 2008 and 2012. The weakness of the residential segment was one of the main reasons of this sharp
decline, indeed building permits declined by more than 60% from 2007 to 2010 and transactions and
housing prices dropped by 14% between 2012 and 2007.
On the demand side, in 2012 lending to households for the purchase of real estate halved, mainly due to:
a lower propensity of households to indebtedness;
a greater selectivity by banks33.
With reference to Public Administration costs, according to the 2012 data by the Bank of Italy, local
government expenditures in the Marche region account for 3.323 Euro per capita, shared as follows:
85% current expenses - decreased by 1.5 % per annum between 2009 and 2011;
15% capital expenses - decreased by 7.9 % per annum between 2009 and 2011.
Fixed investments of Local Administrations are equal to 1.2% of the regional GDP (average 2009 -
2011), less than the Italian average of 1.5 %. Investments were gradually reduced over the last three years,
partly due to the effects of the Internal Stability Pact.
33 The crisis in the real estate sector has led to an increase in the loan to value ratio, making banks less willing to lend.

Multiregional Study
43
Urban development initiatives
Urban Development initiatives include public infrastructure, regeneration of brownfield areas, real estate
renewal, etc. The Marche region, through an active legislative action, indicated as a priority (in line with EU
and National strategy) the regeneration of the existing stock, in particular regional Law No. 22 of 2011
promotes:
urban transformation improving the life quality, reducing the land consumption;
the creation of high quality public spaces;
the modernization of infrastructure networks and the improvement of energy efficiency.
It is clear that the wide range of interventions makes it difficult to define the size of investments needs in
urban development at the regional level, therefore a preliminary distinction could be made:
1. Urban development initiatives with very low or no economic and financial sustainability
(e.g. road maintenance, regeneration of public spaces, etc.) where Local Authorities operate with
traditional public procurement.
2. Urban development initiatives with medium economic and financial sustainability where
Local Authorities can operate with Public Private Partnerships (PPP).
Financial instruments can operate in both segments, with different methodologies, constraints and impacts,
as reported briefly in the scheme below. The impact of FI, however, is maximized when operating in Public
Private Partnerships and therefore in financially sustainable projects.
Table 6 – FI interventions and constraints
Project typologies Public procedures FI intervention and constrains
Initiatives with no economic and
financial sustainability
Traditional public procurement (Appal to) where the Local Authorities has to pay the builder for the works
FI intervention: issue of soft loans to Local Authorities
Constraints: Difficulties in lending to Local Authorities because of financial distress and Stability Pact
Opportunities: contract standardization and consolidated banking procedures
FI impact: low because no additional financing is raised
Initiatives with medium economic
and financial sustainability
Public Private Partnerships (Concessione) where works are paid (mainly) by the private partner (concession holder)
FI intervention: investment (equity/loans) in private concessions
Constraints: private partners and/or project weakness
Opportunities: the leverage effect that FI can produce is maximized
FI impact: high in particular in the case of equity investments
Sinloc Analysis
Urban development initiatives preliminary pipeline
During 2012 – 2013 period, the Marche region supported larger Municipalities in structuring medium to
large urban development projects, that could be considered a potential investment pipeline for a Financial
Instrument.
On the basis of considerations reported in previous paragraph, FIs can maximize their contribution to urban
development when operating through PPPs, therefore investment pipeline was defined as urban

Multiregional Study
44
development initiatives promoted by Local Authorities but deployed by private companies (Project Vehicles)
selected via PPP procedures (e.g. concessions).
In order to select projects, the Marche region operated with larger Municipalities as follows:
in 2011 it conducted a survey that mapped about 28 urban development projects with a significant
size (ranging from 5.00 to about 300.00 Meuro);
in 2012, it supported larger Municipalities in structuring financially sustainable projects, to be
financed also with the contribution of Financial Instruments, with the following results:
o total investment of about 290.00 Meuro;
o a total project area of about 257,000 square meters;
o provision of social housing initiatives for about 21,000 square meters.
The project pipeline is shown in the following table.

Multiregional Study
45
Table 7 – Project pipeline
Municipality Project Surface (sqm) Cost (meuro)
Fermo Integrated project foreseeing underground parking (Piazzale Carducci), offices (former Market Hall), social housing, an
exhibition hall, Hotel (palazzo Trevisani and Casina delle Rose), a museum, public spaces, etc. 25,700 24.80
Civitanova Marche (MC)
Renovation of public spaces (municipal offices, public center) and regeneration of underused public areas with the building
of residential (mainly social housing ) and commercial buildings 22,600 22.10
Fabriano (AN) Regeneration and refurbishment of three former monasteries for touristic uses, and development of the sports complex
(swimming pool and sport fields) 21,690 31.60
Jesi (AN) Regeneration of a large portion of the city, with the building of: residential buildings, commercial buildings, social housing
and offices 25,000 29.10
Ancona Redevelopment of the area named Piazza d’Armi, with the creation of: a public square, park, underground parking spaces,
public offices, commercial, residential and tertiary buildings 55,200 53.40
Falconara (AN) Construction of a parking structure , regeneration of the city market, redevelopment of a public building (Fanesi) for the
development of offices and commercial spaces and building of social housing spaces 8,850 11.30
Fano (PU) Building of two schools, regeneration of three public building (Monastero di Sant'Archangelo and two former school ) for
residential and commercial uses 17,160 27.90
Pesaro Redevelopment of the former court to be allocated to public offices, building of residential and social housing functions 9,400 7.30
Macerata Redevelopment of the public building Villa Lauri for touristic uses, building of social housing spaces and energy efficiency
initiatives on public buildings 9,200 16.00
Senigallia (AN) Social Housing initiatives to be developed in a suburban area of the city 5,000 6.80
San Benedetto del Tronto (AP)
Regeneration of several urban areas (Ballarin stadium and Piazza S. Giovanni) with the building of underground parking
spaces, streets, commercial and tertiary spaces 50,380 41.90
Ascoli Piceno Social Housing initiative on a former industrial area (SGL Carbon) in a suburban area 6,400 11.10
Source: Marche region (2013)
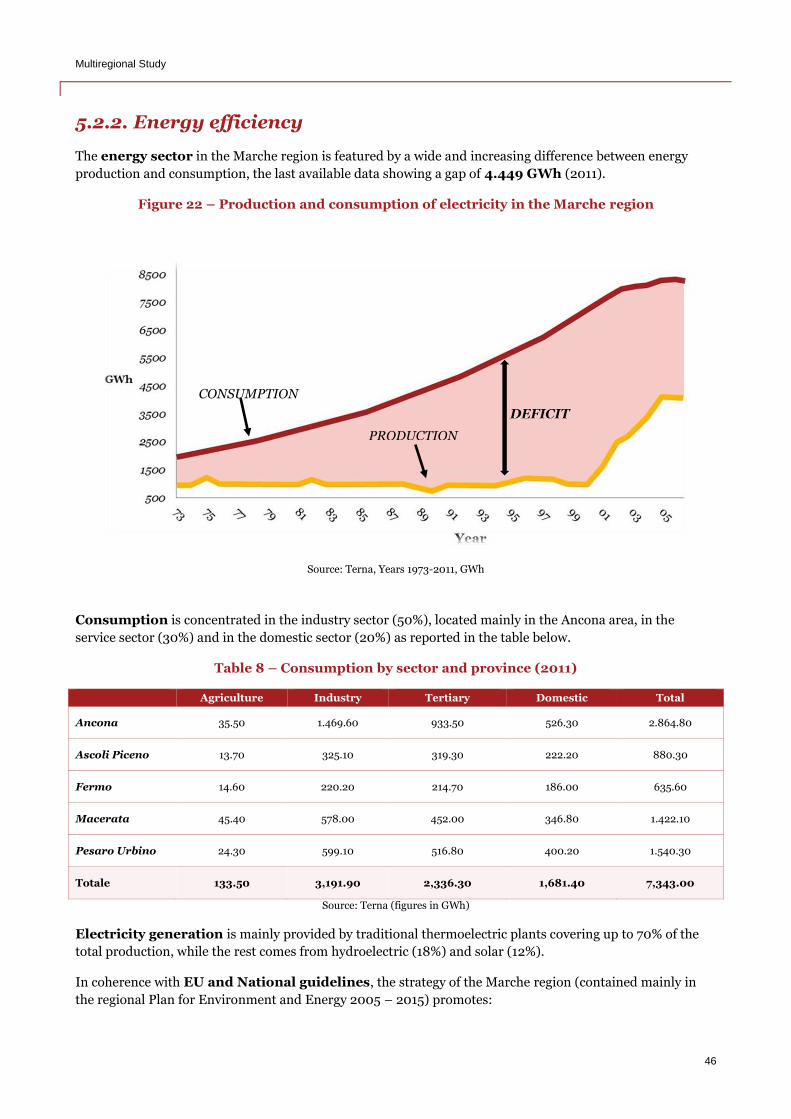
Multiregional Study
46
5.2.2. Energy efficiency
The energy sector in the Marche region is featured by a wide and increasing difference between energy
production and consumption, the last available data showing a gap of 4.449 GWh (2011).
Figure 22 – Production and consumption of electricity in the Marche region
Source: Terna, Years 1973-2011, GWh
Consumption is concentrated in the industry sector (50%), located mainly in the Ancona area, in the
service sector (30%) and in the domestic sector (20%) as reported in the table below.
Table 8 – Consumption by sector and province (2011)
Agriculture Industry Tertiary Domestic Total
Ancona 35.50 1.469.60 933.50 526.30 2.864.80
Ascoli Piceno 13.70 325.10 319.30 222.20 880.30
Fermo 14.60 220.20 214.70 186.00 635.60
Macerata 45.40 578.00 452.00 346.80 1.422.10
Pesaro Urbino 24.30 599.10 516.80 400.20 1.540.30
Totale 133.50 3,191.90 2,336.30 1,681.40 7,343.00
Source: Terna (figures in GWh)
Electricity generation is mainly provided by traditional thermoelectric plants covering up to 70% of the
total production, while the rest comes from hydroelectric (18%) and solar (12%).
In coherence with EU and National guidelines, the strategy of the Marche region (contained mainly in
the regional Plan for Environment and Energy 2005 – 2015) promotes:
PRODUCTION
CONSUMPTION
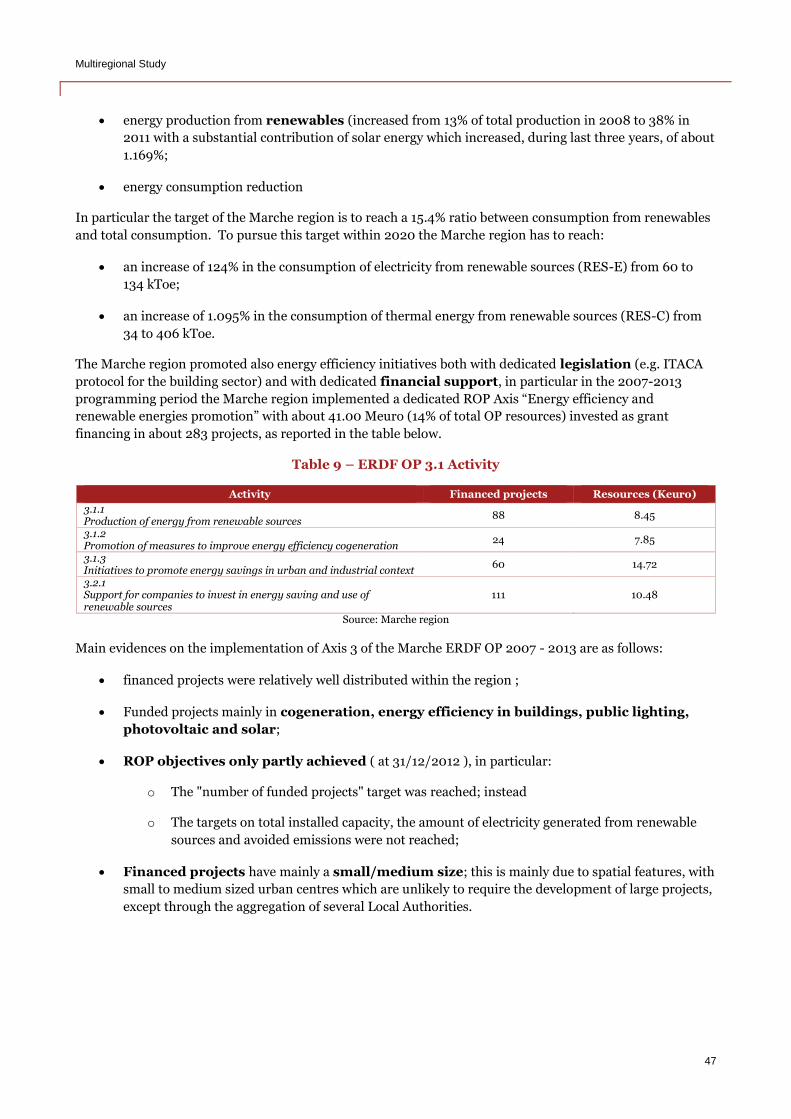
Multiregional Study
47
energy production from renewables (increased from 13% of total production in 2008 to 38% in
2011 with a substantial contribution of solar energy which increased, during last three years, of about
1.169%;
energy consumption reduction
In particular the target of the Marche region is to reach a 15.4% ratio between consumption from renewables
and total consumption. To pursue this target within 2020 the Marche region has to reach:
an increase of 124% in the consumption of electricity from renewable sources (RES-E) from 60 to
134 kToe;
an increase of 1.095% in the consumption of thermal energy from renewable sources (RES-C) from
34 to 406 kToe.
The Marche region promoted also energy efficiency initiatives both with dedicated legislation (e.g. ITACA
protocol for the building sector) and with dedicated financial support, in particular in the 2007-2013
programming period the Marche region implemented a dedicated ROP Axis “Energy efficiency and
renewable energies promotion” with about 41.00 Meuro (14% of total OP resources) invested as grant
financing in about 283 projects, as reported in the table below.
Table 9 – ERDF OP 3.1 Activity
Activity Financed projects Resources (Keuro)
3.1.1 Production of energy from renewable sources
88 8.45
3.1.2 Promotion of measures to improve energy efficiency cogeneration
24 7.85
3.1.3 Initiatives to promote energy savings in urban and industrial context
60 14.72
3.2.1 Support for companies to invest in energy saving and use of renewable sources
111 10.48
Source: Marche region
Main evidences on the implementation of Axis 3 of the Marche ERDF OP 2007 - 2013 are as follows:
financed projects were relatively well distributed within the region ;
Funded projects mainly in cogeneration, energy efficiency in buildings, public lighting,
photovoltaic and solar;
ROP objectives only partly achieved ( at 31/12/2012 ), in particular:
o The "number of funded projects" target was reached; instead
o The targets on total installed capacity, the amount of electricity generated from renewable
sources and avoided emissions were not reached;
Financed projects have mainly a small/medium size; this is mainly due to spatial features, with
small to medium sized urban centres which are unlikely to require the development of large projects,
except through the aggregation of several Local Authorities.
Multiregional Study
48
Energy initiatives
As reported in previous paragraphs, the Marche region intends to focus the FI strategy in the 2014 - 2020
programming period on energy efficiency initiatives.
These initiatives will contribute to reach the 2020 Marche region target of a consumption cut of about 100
kToe in 2020 (to reach the target ratio of consumption from renewables/total consumption of at least 15.4%).
The FI will focus on energy efficiency in buildings and in local transport and the consumption cut
that could be reached can be estimated at about 10% of the total consumption (10 kToe).
This parametric estimate was obtained assuming that:
the reduction of energy consumption attributable to the tertiary sector is about 30 kToe as it
accounts for 30% of the regional consumption;
The FI will be focused only on a small part of tertiary sector which is public buildings34 and lighting.
Considering this, the consumption cut can be estimated in 10 kToe
In order to achieve this consumption reduction by means of active and passive energy efficiency
schemes in buildings, an investment ranging from 200.00 to 300.00 Meuro would be needed, under the
following parametric assumptions for energy efficiency interventions:
consumption before intervention between 110 and 130 kWh/sqm per year;
overall cost of energy efficiency interventions ranging between 100 and 150 Euro/sqm;
reduction in consumption due to the intervention between 25% and 35%;
intervention on about 1.000 buildings with a surface of about 2.000 sqm each.
On the basis of experience in energy-efficiency initiatives of this type, it can be assumed that private investors
(market sources) would not provide funding to the total investments, as the cost (100 - 150 Euro/sqm) is not
financially sustainable. It can be assumed the market could finance only the financially viable part
of the investment such as boilers, lightings, energy management schemes, etc.
Assuming that financially sustainable schemes are approximately 20 – 30% of a total
investment of about 200.00 – 300.00 Meuro, the investment gap can be estimated at
approximately 140.00 – 240.00 Meuro.
Energy initiatives preliminary pipeline
On the basis of the investment needs estimated in the previous section and in order to identify a preliminary
project pipeline, an analysis of energy efficiency opportunities was conducted focusing on:
energy efficiency of public buildings,
public lighting
the renewal of the Local Public Transport fleet.
34 Estimates of this chapter are preliminary and parametric, based on case studies and general analysis, in order to obtain more consistent esteems a detailed analysis is needed, that is beyond the aims of this study
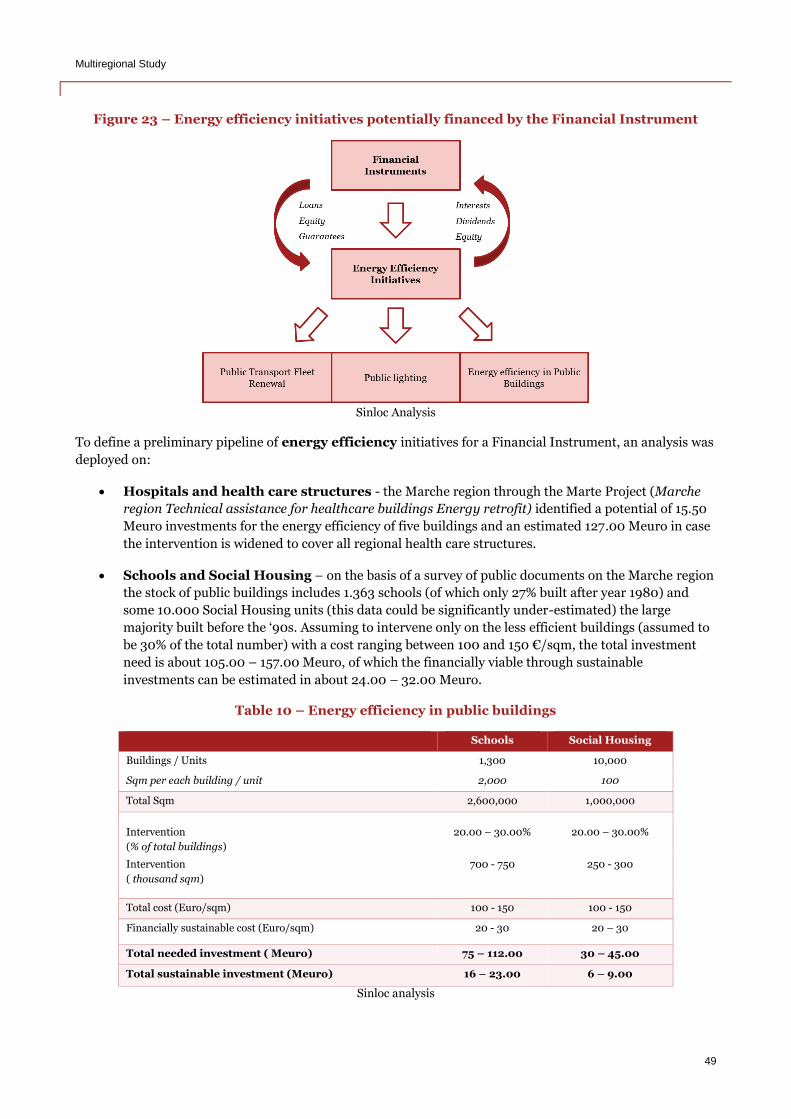
Multiregional Study
49
Figure 23 – Energy efficiency initiatives potentially financed by the Financial Instrument
Sinloc Analysis
To define a preliminary pipeline of energy efficiency initiatives for a Financial Instrument, an analysis was
deployed on:
Hospitals and health care structures - the Marche region through the Marte Project (Marche
region Technical assistance for healthcare buildings Energy retrofit) identified a potential of 15.50
Meuro investments for the energy efficiency of five buildings and an estimated 127.00 Meuro in case
the intervention is widened to cover all regional health care structures.
Schools and Social Housing – on the basis of a survey of public documents on the Marche region
the stock of public buildings includes 1.363 schools (of which only 27% built after year 1980) and
some 10.000 Social Housing units (this data could be significantly under-estimated) the large
majority built before the ‘90s. Assuming to intervene only on the less efficient buildings (assumed to
be 30% of the total number) with a cost ranging between 100 and 150 €/sqm, the total investment
need is about 105.00 – 157.00 Meuro, of which the financially viable through sustainable
investments can be estimated in about 24.00 – 32.00 Meuro.
Table 10 – Energy efficiency in public buildings
Schools Social Housing
Buildings / Units 1,300 10,000
Sqm per each building / unit 2,000 100
Total Sqm 2,600,000 1,000,000
Intervention
(% of total buildings)
20.00 – 30.00% 20.00 – 30.00%
Intervention
( thousand sqm)
700 - 750 250 - 300
Total cost (Euro/sqm) 100 - 150 100 - 150
Financially sustainable cost (Euro/sqm) 20 - 30 20 – 30
Total needed investment ( Meuro) 75 – 112.00 30 – 45.00
Total sustainable investment (Meuro) 16 – 23.00 6 – 9.00
Sinloc analysis
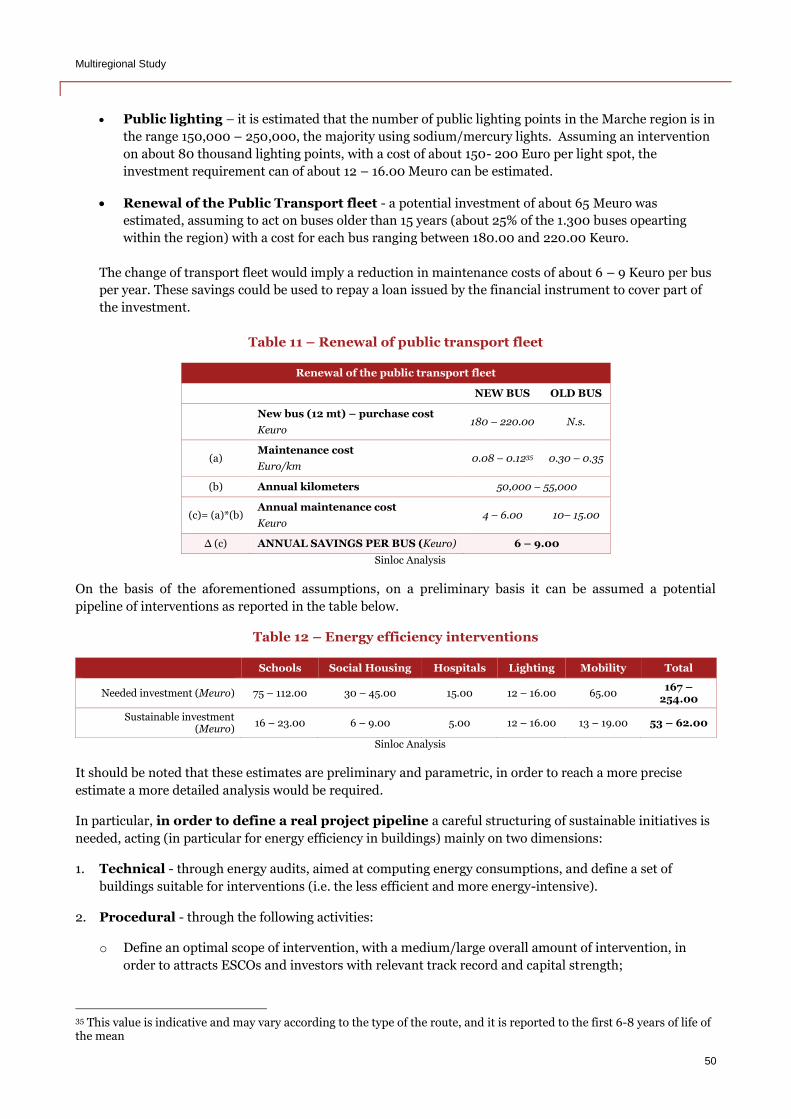
Multiregional Study
50
Public lighting – it is estimated that the number of public lighting points in the Marche region is in
the range 150,000 – 250,000, the majority using sodium/mercury lights. Assuming an intervention
on about 80 thousand lighting points, with a cost of about 150- 200 Euro per light spot, the
investment requirement can of about 12 – 16.00 Meuro can be estimated.
Renewal of the Public Transport fleet - a potential investment of about 65 Meuro was
estimated, assuming to act on buses older than 15 years (about 25% of the 1.300 buses opearting
within the region) with a cost for each bus ranging between 180.00 and 220.00 Keuro.
The change of transport fleet would imply a reduction in maintenance costs of about 6 – 9 Keuro per bus
per year. These savings could be used to repay a loan issued by the financial instrument to cover part of
the investment.
Table 11 – Renewal of public transport fleet
Renewal of the public transport fleet
NEW BUS OLD BUS
New bus (12 mt) – purchase cost
Keuro 180 – 220.00 N.s.
(a) Maintenance cost
Euro/km 0.08 – 0.1235 0.30 – 0.35
(b) Annual kilometers 50,000 – 55,000
(c)= (a)*(b) Annual maintenance cost
Keuro 4 – 6.00 10– 15.00
∆ (c) ANNUAL SAVINGS PER BUS (Keuro) 6 – 9.00
Sinloc Analysis
On the basis of the aforementioned assumptions, on a preliminary basis it can be assumed a potential
pipeline of interventions as reported in the table below.
Table 12 – Energy efficiency interventions
Schools Social Housing Hospitals Lighting Mobility Total
Needed investment (Meuro) 75 – 112.00 30 – 45.00 15.00 12 – 16.00 65.00 167 –
254.00
Sustainable investment (Meuro)
16 – 23.00 6 – 9.00 5.00 12 – 16.00 13 – 19.00 53 – 62.00
Sinloc Analysis
It should be noted that these estimates are preliminary and parametric, in order to reach a more precise
estimate a more detailed analysis would be required.
In particular, in order to define a real project pipeline a careful structuring of sustainable initiatives is
needed, acting (in particular for energy efficiency in buildings) mainly on two dimensions:
1. Technical - through energy audits, aimed at computing energy consumptions, and define a set of
buildings suitable for interventions (i.e. the less efficient and more energy-intensive).
2. Procedural - through the following activities:
o Define an optimal scope of intervention, with a medium/large overall amount of intervention, in
order to attracts ESCOs and investors with relevant track record and capital strength;
35 This value is indicative and may vary according to the type of the route, and it is reported to the first 6-8 years of life of the mean
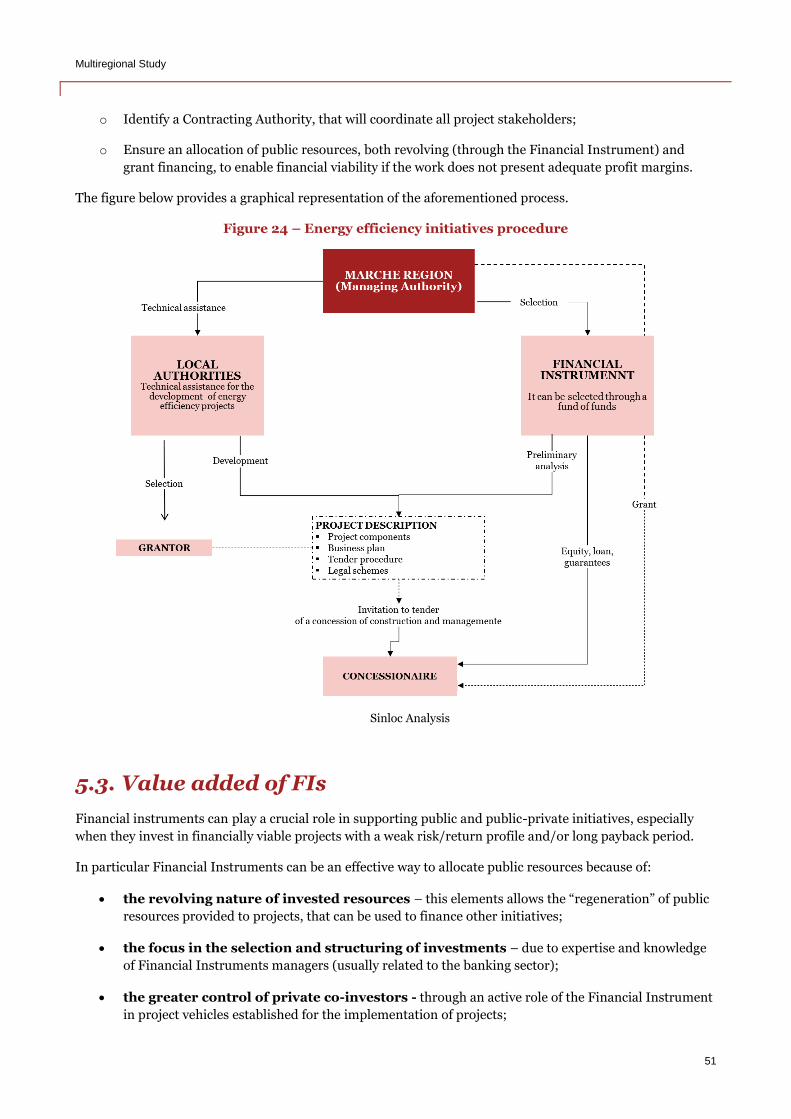
Multiregional Study
51
o Identify a Contracting Authority, that will coordinate all project stakeholders;
o Ensure an allocation of public resources, both revolving (through the Financial Instrument) and
grant financing, to enable financial viability if the work does not present adequate profit margins.
The figure below provides a graphical representation of the aforementioned process.
Figure 24 – Energy efficiency initiatives procedure
Sinloc Analysis
5.3. Value added of FIs
Financial instruments can play a crucial role in supporting public and public-private initiatives, especially
when they invest in financially viable projects with a weak risk/return profile and/or long payback period.
In particular Financial Instruments can be an effective way to allocate public resources because of:
the revolving nature of invested resources – this elements allows the “regeneration” of public
resources provided to projects, that can be used to finance other initiatives;
the focus in the selection and structuring of investments – due to expertise and knowledge
of Financial Instruments managers (usually related to the banking sector);
the greater control of private co-investors - through an active role of the Financial Instrument
in project vehicles established for the implementation of projects;
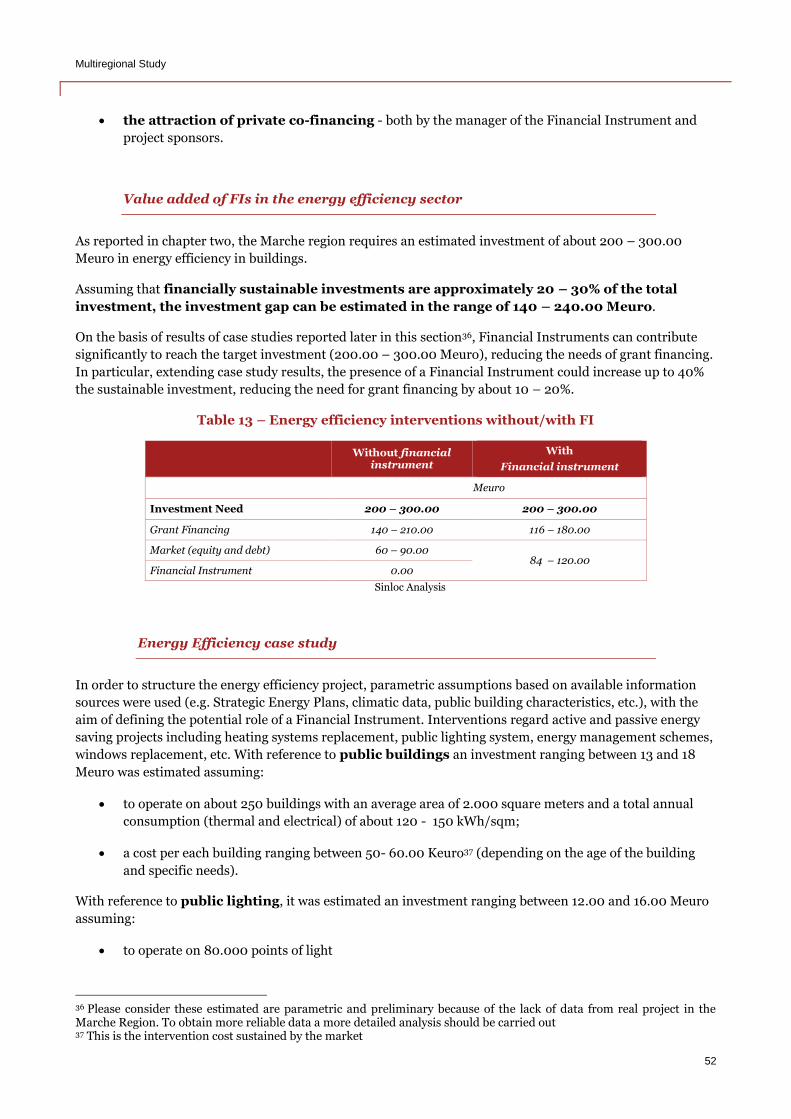
Multiregional Study
52
the attraction of private co-financing - both by the manager of the Financial Instrument and
project sponsors.
Value added of FIs in the energy efficiency sector
As reported in chapter two, the Marche region requires an estimated investment of about 200 – 300.00
Meuro in energy efficiency in buildings.
Assuming that financially sustainable investments are approximately 20 – 30% of the total
investment, the investment gap can be estimated in the range of 140 – 240.00 Meuro.
On the basis of results of case studies reported later in this section36, Financial Instruments can contribute
significantly to reach the target investment (200.00 – 300.00 Meuro), reducing the needs of grant financing.
In particular, extending case study results, the presence of a Financial Instrument could increase up to 40%
the sustainable investment, reducing the need for grant financing by about 10 – 20%.
Table 13 – Energy efficiency interventions without/with FI
Without financial
instrument
With
Financial instrument
Meuro
Investment Need 200 – 300.00 200 – 300.00
Grant Financing 140 – 210.00 116 – 180.00
Market (equity and debt) 60 – 90.00 84 – 120.00
Financial Instrument 0.00
Sinloc Analysis
Energy Efficiency case study
In order to structure the energy efficiency project, parametric assumptions based on available information
sources were used (e.g. Strategic Energy Plans, climatic data, public building characteristics, etc.), with the
aim of defining the potential role of a Financial Instrument. Interventions regard active and passive energy
saving projects including heating systems replacement, public lighting system, energy management schemes,
windows replacement, etc. With reference to public buildings an investment ranging between 13 and 18
Meuro was estimated assuming:
to operate on about 250 buildings with an average area of 2.000 square meters and a total annual
consumption (thermal and electrical) of about 120 - 150 kWh/sqm;
a cost per each building ranging between 50- 60.00 Keuro37 (depending on the age of the building
and specific needs).
With reference to public lighting, it was estimated an investment ranging between 12.00 and 16.00 Meuro
assuming:
to operate on 80.000 points of light
36 Please consider these estimated are parametric and preliminary because of the lack of data from real project in the Marche Region. To obtain more reliable data a more detailed analysis should be carried out 37 This is the intervention cost sustained by the market
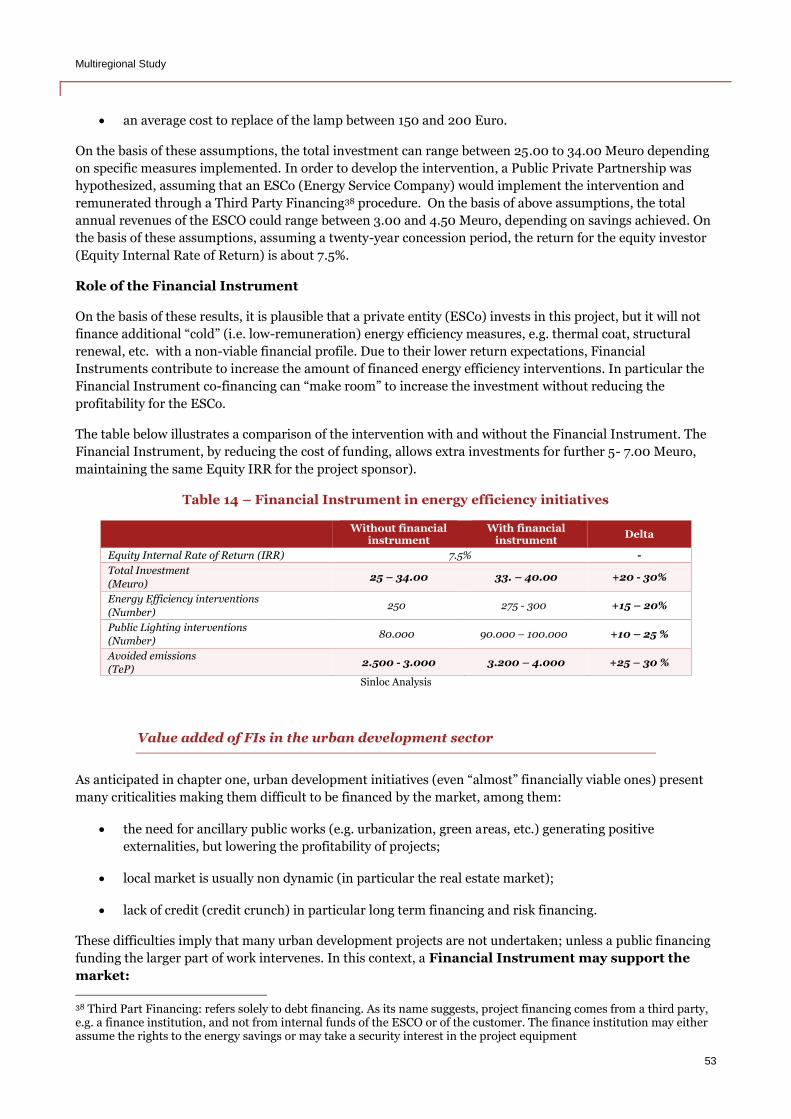
Multiregional Study
53
an average cost to replace of the lamp between 150 and 200 Euro.
On the basis of these assumptions, the total investment can range between 25.00 to 34.00 Meuro depending
on specific measures implemented. In order to develop the intervention, a Public Private Partnership was
hypothesized, assuming that an ESCo (Energy Service Company) would implement the intervention and
remunerated through a Third Party Financing38 procedure. On the basis of above assumptions, the total
annual revenues of the ESCO could range between 3.00 and 4.50 Meuro, depending on savings achieved. On
the basis of these assumptions, assuming a twenty-year concession period, the return for the equity investor
(Equity Internal Rate of Return) is about 7.5%.
Role of the Financial Instrument
On the basis of these results, it is plausible that a private entity (ESCo) invests in this project, but it will not
finance additional “cold” (i.e. low-remuneration) energy efficiency measures, e.g. thermal coat, structural
renewal, etc. with a non-viable financial profile. Due to their lower return expectations, Financial
Instruments contribute to increase the amount of financed energy efficiency interventions. In particular the
Financial Instrument co-financing can “make room” to increase the investment without reducing the
profitability for the ESCo.
The table below illustrates a comparison of the intervention with and without the Financial Instrument. The
Financial Instrument, by reducing the cost of funding, allows extra investments for further 5- 7.00 Meuro,
maintaining the same Equity IRR for the project sponsor).
Table 14 – Financial Instrument in energy efficiency initiatives
Without financial
instrument With financial
instrument Delta
Equity Internal Rate of Return (IRR) 7.5% -
Total Investment
(Meuro) 25 – 34.00 33. – 40.00 +20 - 30%
Energy Efficiency interventions
(Number) 250 275 - 300 +15 – 20%
Public Lighting interventions
(Number) 80.000 90.000 – 100.000 +10 – 25 %
Avoided emissions
(TeP) 2.500 - 3.000 3.200 – 4.000 +25 – 30 %
Sinloc Analysis
Value added of FIs in the urban development sector
As anticipated in chapter one, urban development initiatives (even “almost” financially viable ones) present
many criticalities making them difficult to be financed by the market, among them:
the need for ancillary public works (e.g. urbanization, green areas, etc.) generating positive
externalities, but lowering the profitability of projects;
local market is usually non dynamic (in particular the real estate market);
lack of credit (credit crunch) in particular long term financing and risk financing.
These difficulties imply that many urban development projects are not undertaken; unless a public financing
funding the larger part of work intervenes. In this context, a Financial Instrument may support the
market:
38 Third Part Financing: refers solely to debt financing. As its name suggests, project financing comes from a third party, e.g. a finance institution, and not from internal funds of the ESCO or of the customer. The finance institution may either assume the rights to the energy savings or may take a security interest in the project equipment
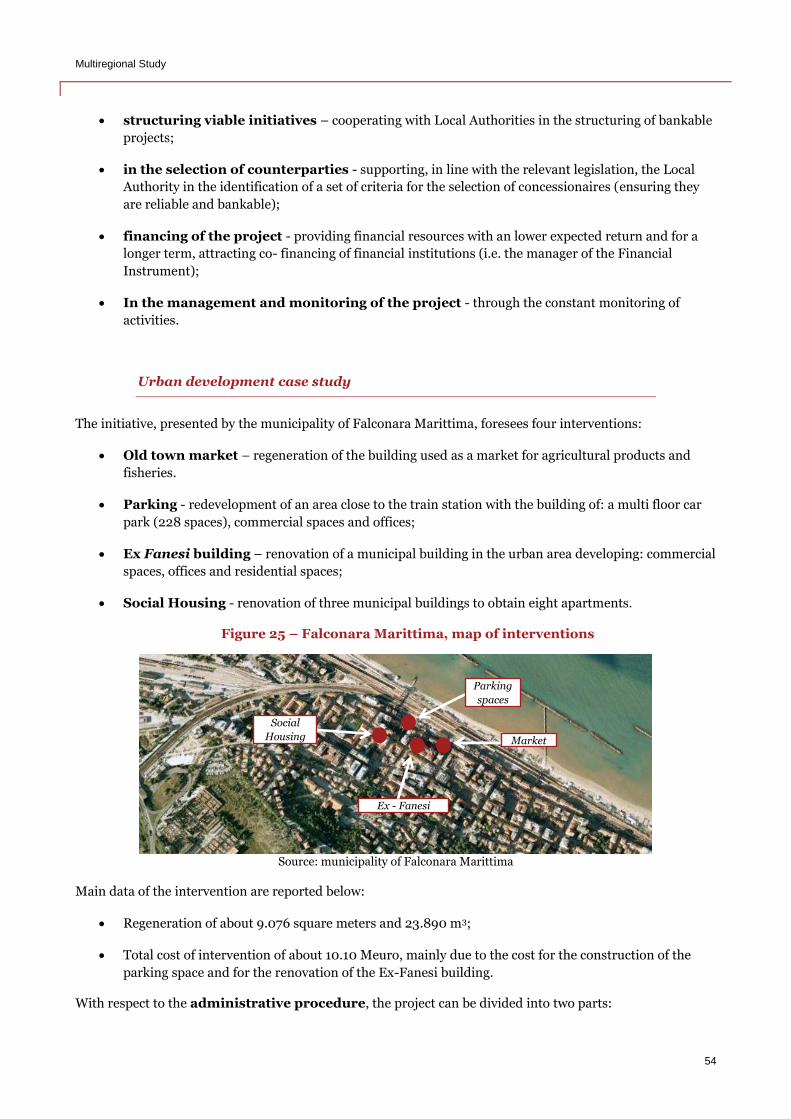
Multiregional Study
54
structuring viable initiatives – cooperating with Local Authorities in the structuring of bankable
projects;
in the selection of counterparties - supporting, in line with the relevant legislation, the Local
Authority in the identification of a set of criteria for the selection of concessionaires (ensuring they
are reliable and bankable);
financing of the project - providing financial resources with an lower expected return and for a
longer term, attracting co- financing of financial institutions (i.e. the manager of the Financial
Instrument);
In the management and monitoring of the project - through the constant monitoring of
activities.
Urban development case study
The initiative, presented by the municipality of Falconara Marittima, foresees four interventions:
Old town market – regeneration of the building used as a market for agricultural products and
fisheries.
Parking - redevelopment of an area close to the train station with the building of: a multi floor car
park (228 spaces), commercial spaces and offices;
Ex Fanesi building – renovation of a municipal building in the urban area developing: commercial
spaces, offices and residential spaces;
Social Housing - renovation of three municipal buildings to obtain eight apartments.
Figure 25 – Falconara Marittima, map of interventions
Source: municipality of Falconara Marittima
Main data of the intervention are reported below:
Regeneration of about 9.076 square meters and 23.890 m3;
Total cost of intervention of about 10.10 Meuro, mainly due to the cost for the construction of the
parking space and for the renovation of the Ex-Fanesi building.
With respect to the administrative procedure, the project can be divided into two parts:
Social
Housing
Ex - Fanesi
Parking
spaces
Market
Multiregional Study
55
1. Parking spaces - The municipality of Falconara Marittima already selected a concessionaire who will
build and operate the initiative. The project appears to have a good economic and financial sustainability
, but the work has not yet been funded partly due to the credit crunch, in particular:
o Cost of investment 3.80 Meuro;
o annual revenues of management ( at maturity) equal to about 2.00 Meuro, resulting mainly from
revenue from park on the street and in the parking lot (equal to 70% of the total) ;
o annual costs of management ( in the scheme) amounted to 0,90 Meuro, resulting mainly from the
municipal fee (equal to approximately 70% of the total) and the staff (about 22% of the total) ;
o nominal IRR of the project ( net of tax ) of approximately 13%.
2. Market and Ex Fanesi - a Public Private Partnership procedure is assumed feasible when the
municipality transfers to the concessionaire the surface or property right in return for works, however
the projects appear to be not fully financially sustainable and therefore the risk of market failure is high,
in particular:
o Cost of investment 4.30 Meuro;
o Revenues from sales of about 2.00 Meuro;
o Rental revenues of about Euro 210.00 Keuro per year;
o Operative costs of about 50.00 Keuro per year;
o Project post-tax nominal IRR of about 1.60%
Role of the Financial Instrument
On the basis of above results, it is plausible to expect that no projects are currently financially viable, because
of the credit crunch (first project) and of the real estate market dynamics (second project). The Financial
Instrument could give a significant contribution to the sustainability acting as follows:
Parking spaces financing – the FI can finance at a lower interest rate than the banking system.
The reduction of interest costs allows the Local Authority to impose additional costs to the
concessionaire (estimated at about 80.00-100.00 Keuro per year) without reducing the equity IRR.
The local authority can transfer these additional resources to projects with a low profitability;
Market and Ex Fanesi financing - in order to reach a minimum financial viability (project IRR
ranging from 6.50 to 7.00%) the following activities must be put in place:
o Financial Instrument co-financing 90% of the amount of debt;
o 20% reduction in construction costs.
The analysis highlights two crucial aspects:
the joint intervention of the Financial Instrument and a more financially sustainable project design
can increase project sustainability and attract private capital;
project profitability in real estate projects remains very low due to the strong crisis of the sector in
particular in small/medium urban areas.
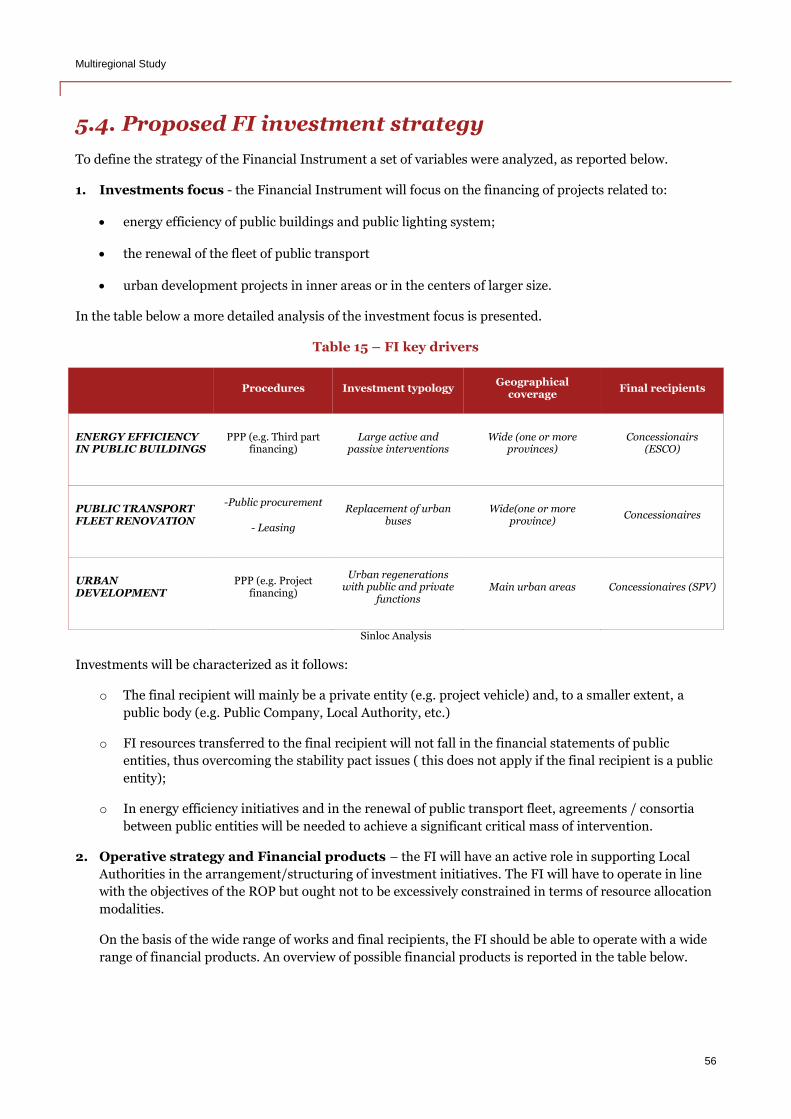
Multiregional Study
56
5.4. Proposed FI investment strategy
To define the strategy of the Financial Instrument a set of variables were analyzed, as reported below.
1. Investments focus - the Financial Instrument will focus on the financing of projects related to:
energy efficiency of public buildings and public lighting system;
the renewal of the fleet of public transport
urban development projects in inner areas or in the centers of larger size.
In the table below a more detailed analysis of the investment focus is presented.
Table 15 – FI key drivers
Procedures Investment typology
Geographical coverage
Final recipients
ENERGY EFFICIENCY IN PUBLIC BUILDINGS
PPP (e.g. Third part financing)
Large active and passive interventions
Wide (one or more provinces)
Concessionairs (ESCO)
PUBLIC TRANSPORT FLEET RENOVATION
-Public procurement
- Leasing
Replacement of urban buses
Wide(one or more province)
Concessionaires
URBAN DEVELOPMENT
PPP (e.g. Project financing)
Urban regenerations with public and private
functions Main urban areas Concessionaires (SPV)
Sinloc Analysis
Investments will be characterized as it follows:
o The final recipient will mainly be a private entity (e.g. project vehicle) and, to a smaller extent, a
public body (e.g. Public Company, Local Authority, etc.)
o FI resources transferred to the final recipient will not fall in the financial statements of public
entities, thus overcoming the stability pact issues ( this does not apply if the final recipient is a public
entity);
o In energy efficiency initiatives and in the renewal of public transport fleet, agreements / consortia
between public entities will be needed to achieve a significant critical mass of intervention.
2. Operative strategy and Financial products – the FI will have an active role in supporting Local
Authorities in the arrangement/structuring of investment initiatives. The FI will have to operate in line
with the objectives of the ROP but ought not to be excessively constrained in terms of resource allocation
modalities.
On the basis of the wide range of works and final recipients, the FI should be able to operate with a wide
range of financial products. An overview of possible financial products is reported in the table below.
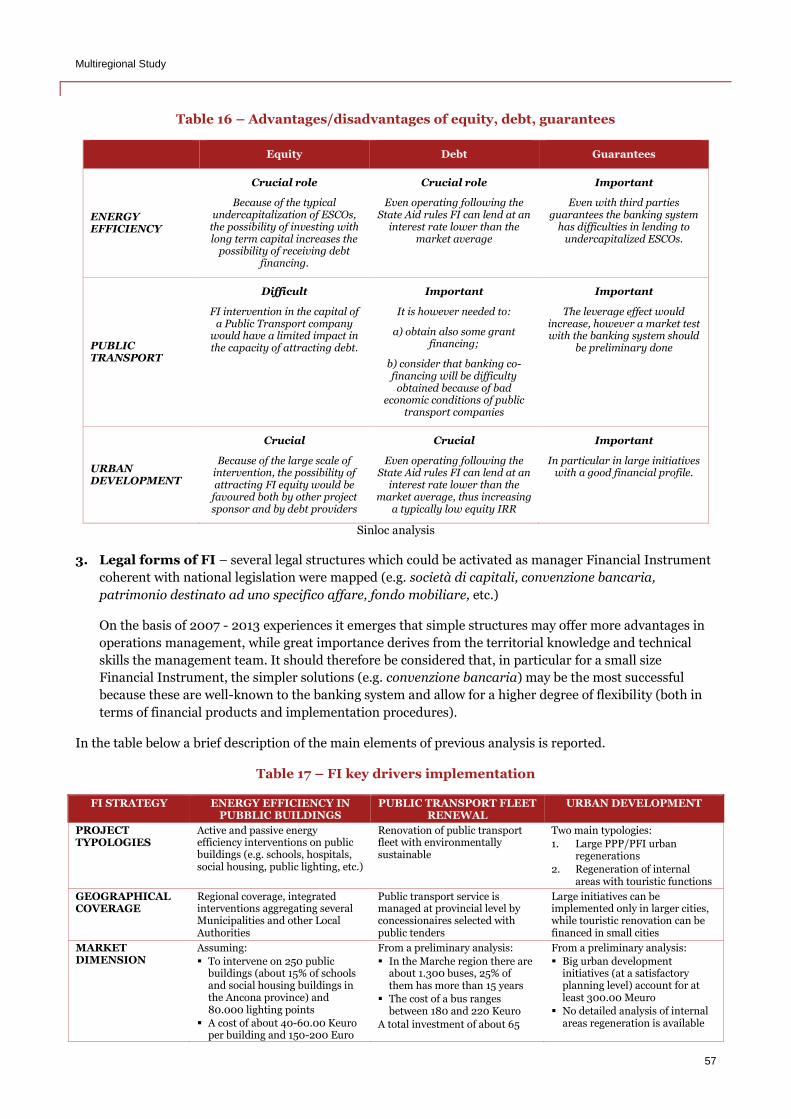
Multiregional Study
57
Table 16 – Advantages/disadvantages of equity, debt, guarantees
Equity Debt Guarantees
ENERGY EFFICIENCY
Crucial role
Because of the typical undercapitalization of ESCOs,
the possibility of investing with long term capital increases the
possibility of receiving debt financing.
Crucial role
Even operating following the State Aid rules FI can lend at an
interest rate lower than the market average
Important
Even with third parties guarantees the banking system
has difficulties in lending to undercapitalized ESCOs.
PUBLIC TRANSPORT
Difficult
FI intervention in the capital of a Public Transport company
would have a limited impact in the capacity of attracting debt.
Important
It is however needed to:
a) obtain also some grant financing;
b) consider that banking co-financing will be difficulty
obtained because of bad economic conditions of public
transport companies
Important
The leverage effect would increase, however a market test with the banking system should
be preliminary done
URBAN DEVELOPMENT
Crucial
Because of the large scale of intervention, the possibility of attracting FI equity would be
favoured both by other project sponsor and by debt providers
Crucial
Even operating following the State Aid rules FI can lend at an
interest rate lower than the market average, thus increasing
a typically low equity IRR
Important
In particular in large initiatives with a good financial profile.
Sinloc analysis
3. Legal forms of FI – several legal structures which could be activated as manager Financial Instrument
coherent with national legislation were mapped (e.g. società di capitali, convenzione bancaria,
patrimonio destinato ad uno specifico affare, fondo mobiliare, etc.)
On the basis of 2007 - 2013 experiences it emerges that simple structures may offer more advantages in
operations management, while great importance derives from the territorial knowledge and technical
skills the management team. It should therefore be considered that, in particular for a small size
Financial Instrument, the simpler solutions (e.g. convenzione bancaria) may be the most successful
because these are well-known to the banking system and allow for a higher degree of flexibility (both in
terms of financial products and implementation procedures).
In the table below a brief description of the main elements of previous analysis is reported.
Table 17 – FI key drivers implementation
FI STRATEGY ENERGY EFFICIENCY IN PUBBLIC BUILDINGS
PUBLIC TRANSPORT FLEET RENEWAL
URBAN DEVELOPMENT
PROJECT TYPOLOGIES
Active and passive energy efficiency interventions on public buildings (e.g. schools, hospitals, social housing, public lighting, etc.)
Renovation of public transport fleet with environmentally sustainable
Two main typologies:
1. Large PPP/PFI urban regenerations
2. Regeneration of internal areas with touristic functions
GEOGRAPHICAL COVERAGE
Regional coverage, integrated interventions aggregating several Municipalities and other Local Authorities
Public transport service is managed at provincial level by concessionaires selected with public tenders
Large initiatives can be implemented only in larger cities, while touristic renovation can be financed in small cities
MARKET DIMENSION
Assuming:
To intervene on 250 public buildings (about 15% of schools and social housing buildings in the Ancona province) and 80.000 lighting points
A cost of about 40-60.00 Keuro per building and 150-200 Euro
From a preliminary analysis:
In the Marche region there are about 1.300 buses, 25% of them has more than 15 years
The cost of a bus ranges between 180 and 220 Keuro
A total investment of about 65
From a preliminary analysis:
Big urban development initiatives (at a satisfactory planning level) account for at least 300.00 Meuro
No detailed analysis of internal areas regeneration is available
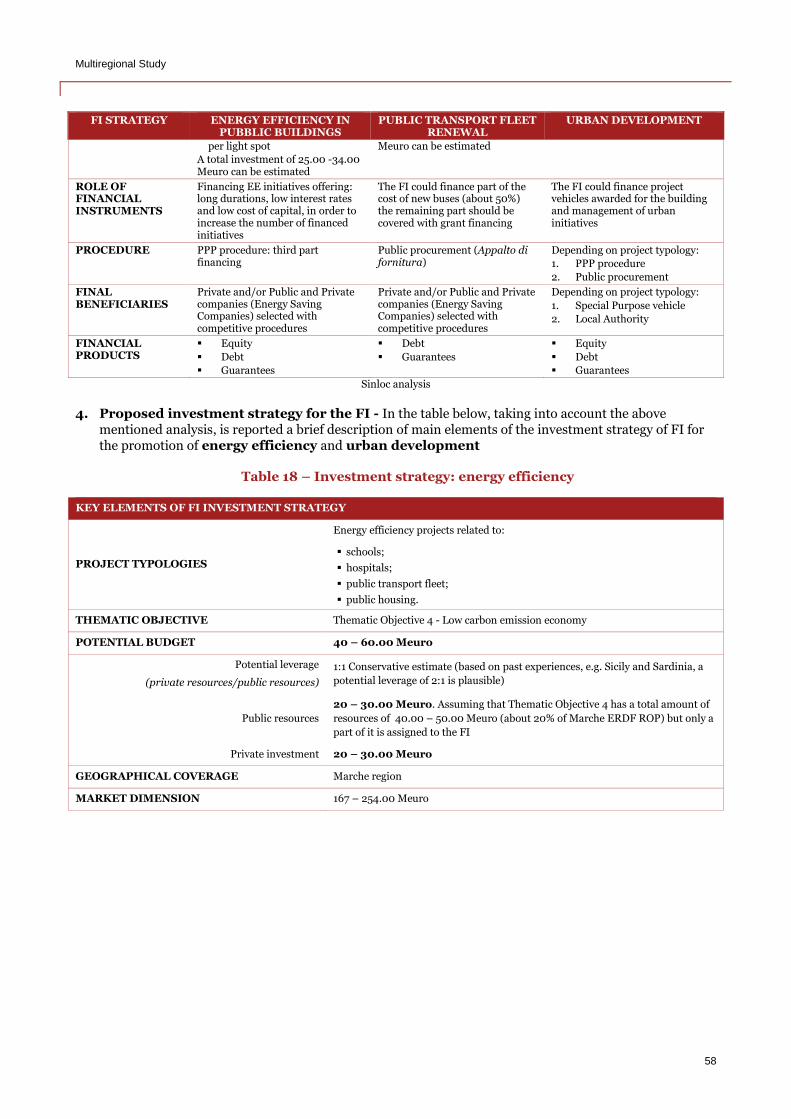
Multiregional Study
58
FI STRATEGY ENERGY EFFICIENCY IN PUBBLIC BUILDINGS
PUBLIC TRANSPORT FLEET RENEWAL
URBAN DEVELOPMENT
per light spot
A total investment of 25.00 -34.00 Meuro can be estimated
Meuro can be estimated
ROLE OF FINANCIAL INSTRUMENTS
Financing EE initiatives offering: long durations, low interest rates and low cost of capital, in order to increase the number of financed initiatives
The FI could finance part of the cost of new buses (about 50%) the remaining part should be covered with grant financing
The FI could finance project vehicles awarded for the building and management of urban initiatives
PROCEDURE PPP procedure: third part financing
Public procurement (Appalto di fornitura)
Depending on project typology:
1. PPP procedure
2. Public procurement
FINAL BENEFICIARIES
Private and/or Public and Private companies (Energy Saving Companies) selected with competitive procedures
Private and/or Public and Private companies (Energy Saving Companies) selected with competitive procedures
Depending on project typology:
1. Special Purpose vehicle
2. Local Authority
FINANCIAL PRODUCTS
Equity
Debt
Guarantees
Debt
Guarantees
Equity
Debt
Guarantees
Sinloc analysis
4. Proposed investment strategy for the FI - In the table below, taking into account the above mentioned analysis, is reported a brief description of main elements of the investment strategy of FI for the promotion of energy efficiency and urban development
Table 18 – Investment strategy: energy efficiency
KEY ELEMENTS OF FI INVESTMENT STRATEGY
PROJECT TYPOLOGIES
Energy efficiency projects related to:
schools;
hospitals;
public transport fleet;
public housing.
THEMATIC OBJECTIVE Thematic Objective 4 - Low carbon emission economy
POTENTIAL BUDGET 40 – 60.00 Meuro
Potential leverage
(private resources/public resources)
1:1 Conservative estimate (based on past experiences, e.g. Sicily and Sardinia, a
potential leverage of 2:1 is plausible)
Public resources
20 – 30.00 Meuro. Assuming that Thematic Objective 4 has a total amount of
resources of 40.00 – 50.00 Meuro (about 20% of Marche ERDF ROP) but only a
part of it is assigned to the FI
Private investment 20 – 30.00 Meuro
GEOGRAPHICAL COVERAGE Marche region
MARKET DIMENSION 167 – 254.00 Meuro
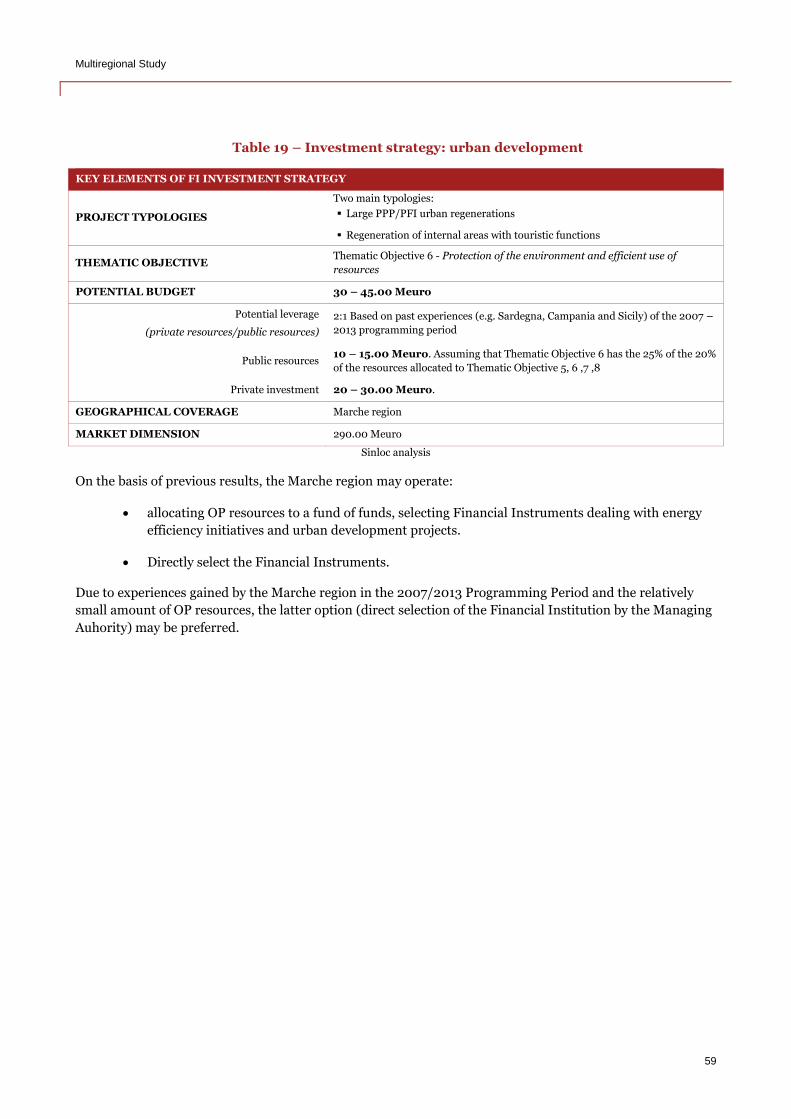
Multiregional Study
59
Table 19 – Investment strategy: urban development
KEY ELEMENTS OF FI INVESTMENT STRATEGY
PROJECT TYPOLOGIES
Two main typologies:
Large PPP/PFI urban regenerations
Regeneration of internal areas with touristic functions
THEMATIC OBJECTIVE Thematic Objective 6 - Protection of the environment and efficient use of
resources
POTENTIAL BUDGET 30 – 45.00 Meuro
Potential leverage
(private resources/public resources)
2:1 Based on past experiences (e.g. Sardegna, Campania and Sicily) of the 2007 –
2013 programming period
Public resources 10 – 15.00 Meuro. Assuming that Thematic Objective 6 has the 25% of the 20%
of the resources allocated to Thematic Objective 5, 6 ,7 ,8
Private investment 20 – 30.00 Meuro.
GEOGRAPHICAL COVERAGE Marche region
MARKET DIMENSION 290.00 Meuro
Sinloc analysis
On the basis of previous results, the Marche region may operate:
allocating OP resources to a fund of funds, selecting Financial Instruments dealing with energy
efficiency initiatives and urban development projects.
Directly select the Financial Instruments.
Due to experiences gained by the Marche region in the 2007/2013 Programming Period and the relatively
small amount of OP resources, the latter option (direct selection of the Financial Institution by the Managing
Auhority) may be preferred.
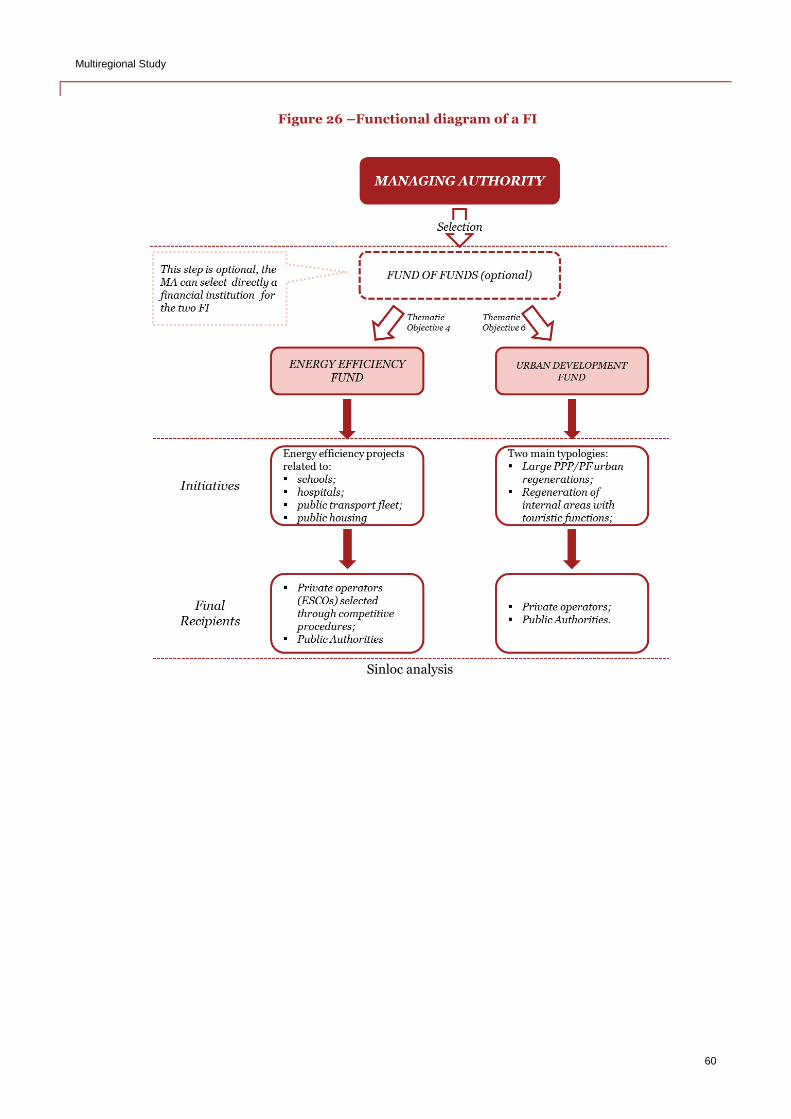
Multiregional Study
60
Figure 26 –Functional diagram of a FI
Sinloc analysis
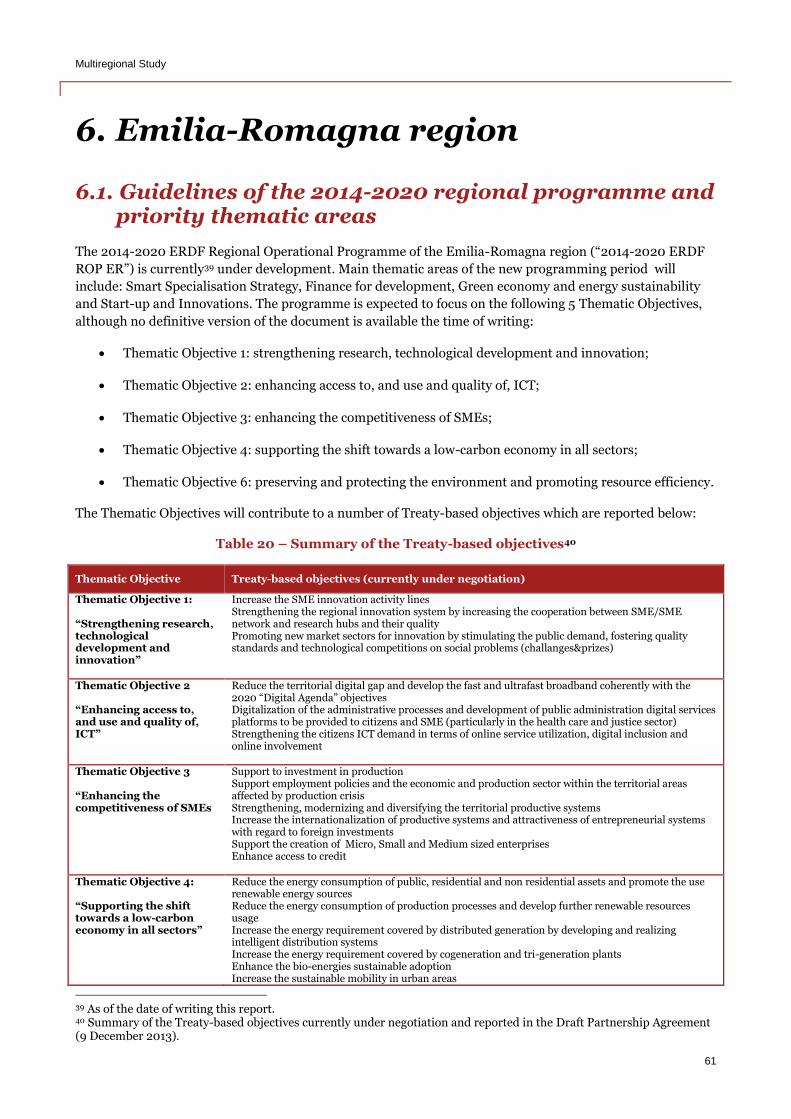
Multiregional Study
61
6. Emilia-Romagna region
6.1. Guidelines of the 2014-2020 regional programme and priority thematic areas
The 2014-2020 ERDF Regional Operational Programme of the Emilia-Romagna region (“2014-2020 ERDF
ROP ER”) is currently39 under development. Main thematic areas of the new programming period will
include: Smart Specialisation Strategy, Finance for development, Green economy and energy sustainability
and Start-up and Innovations. The programme is expected to focus on the following 5 Thematic Objectives,
although no definitive version of the document is available the time of writing:
Thematic Objective 1: strengthening research, technological development and innovation;
Thematic Objective 2: enhancing access to, and use and quality of, ICT;
Thematic Objective 3: enhancing the competitiveness of SMEs;
Thematic Objective 4: supporting the shift towards a low-carbon economy in all sectors;
Thematic Objective 6: preserving and protecting the environment and promoting resource efficiency.
The Thematic Objectives will contribute to a number of Treaty-based objectives which are reported below:
Table 20 – Summary of the Treaty-based objectives40
Thematic Objective Treaty-based objectives (currently under negotiation)
Thematic Objective 1: “Strengthening research, technological development and innovation”
Increase the SME innovation activity lines Strengthening the regional innovation system by increasing the cooperation between SME/SME network and research hubs and their quality Promoting new market sectors for innovation by stimulating the public demand, fostering quality standards and technological competitions on social problems (challanges&prizes)
Thematic Objective 2 “Enhancing access to, and use and quality of, ICT”
Reduce the territorial digital gap and develop the fast and ultrafast broadband coherently with the 2020 “Digital Agenda” objectives Digitalization of the administrative processes and development of public administration digital services platforms to be provided to citizens and SME (particularly in the health care and justice sector) Strengthening the citizens ICT demand in terms of online service utilization, digital inclusion and online involvement
Thematic Objective 3 “Enhancing the competitiveness of SMEs
Support to investment in production Support employment policies and the economic and production sector within the territorial areas affected by production crisis Strengthening, modernizing and diversifying the territorial productive systems Increase the internationalization of productive systems and attractiveness of entrepreneurial systems with regard to foreign investments Support the creation of Micro, Small and Medium sized enterprises Enhance access to credit
Thematic Objective 4: “Supporting the shift towards a low-carbon economy in all sectors”
Reduce the energy consumption of public, residential and non residential assets and promote the use renewable energy sources Reduce the energy consumption of production processes and develop further renewable resources usage Increase the energy requirement covered by distributed generation by developing and realizing intelligent distribution systems Increase the energy requirement covered by cogeneration and tri-generation plants Enhance the bio-energies sustainable adoption Increase the sustainable mobility in urban areas
39 As of the date of writing this report. 40 Summary of the Treaty-based objectives currently under negotiation and reported in the Draft Partnership Agreement (9 December 2013).
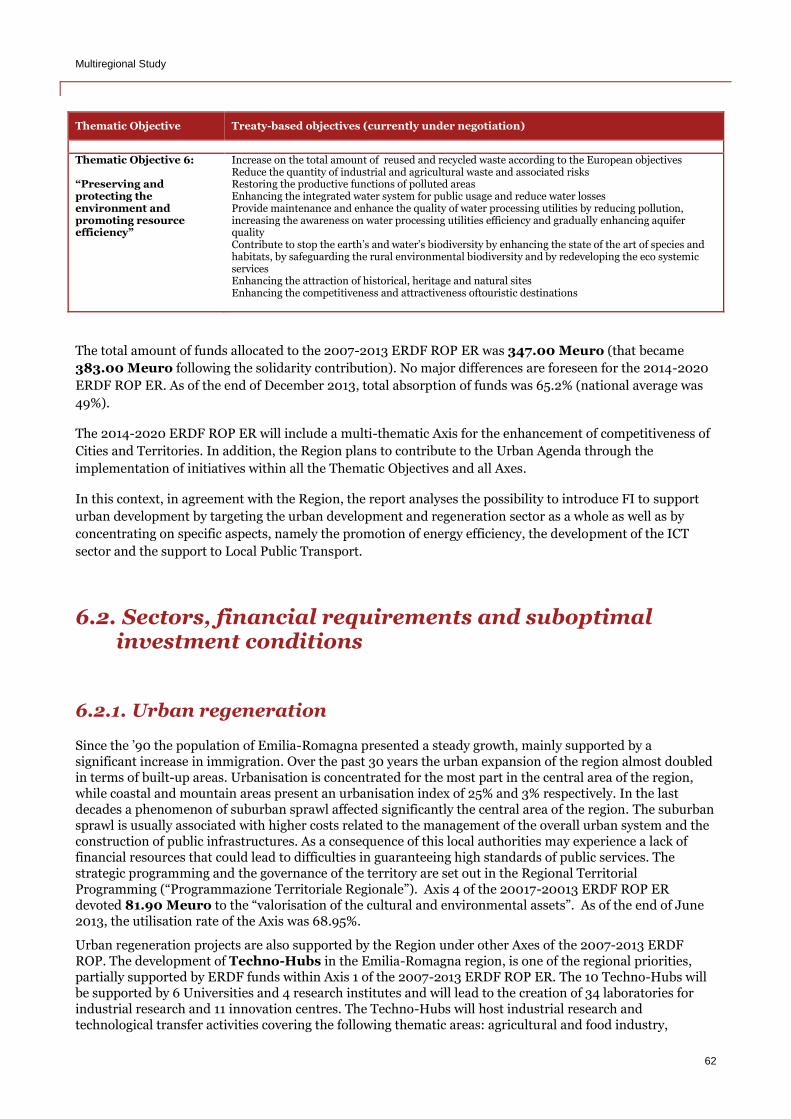
Multiregional Study
62
Thematic Objective Treaty-based objectives (currently under negotiation)
Thematic Objective 6: “Preserving and protecting the environment and promoting resource efficiency”
Increase on the total amount of reused and recycled waste according to the European objectives Reduce the quantity of industrial and agricultural waste and associated risks Restoring the productive functions of polluted areas Enhancing the integrated water system for public usage and reduce water losses Provide maintenance and enhance the quality of water processing utilities by reducing pollution, increasing the awareness on water processing utilities efficiency and gradually enhancing aquifer quality Contribute to stop the earth’s and water’s biodiversity by enhancing the state of the art of species and habitats, by safeguarding the rural environmental biodiversity and by redeveloping the eco systemic services Enhancing the attraction of historical, heritage and natural sites Enhancing the competitiveness and attractiveness oftouristic destinations
The total amount of funds allocated to the 2007-2013 ERDF ROP ER was 347.00 Meuro (that became
383.00 Meuro following the solidarity contribution). No major differences are foreseen for the 2014-2020
ERDF ROP ER. As of the end of December 2013, total absorption of funds was 65.2% (national average was
49%).
The 2014-2020 ERDF ROP ER will include a multi-thematic Axis for the enhancement of competitiveness of
Cities and Territories. In addition, the Region plans to contribute to the Urban Agenda through the
implementation of initiatives within all the Thematic Objectives and all Axes.
In this context, in agreement with the Region, the report analyses the possibility to introduce FI to support
urban development by targeting the urban development and regeneration sector as a whole as well as by
concentrating on specific aspects, namely the promotion of energy efficiency, the development of the ICT
sector and the support to Local Public Transport.
6.2. Sectors, financial requirements and suboptimal investment conditions
6.2.1. Urban regeneration
Since the ’90 the population of Emilia-Romagna presented a steady growth, mainly supported by a significant increase in immigration. Over the past 30 years the urban expansion of the region almost doubled in terms of built-up areas. Urbanisation is concentrated for the most part in the central area of the region, while coastal and mountain areas present an urbanisation index of 25% and 3% respectively. In the last decades a phenomenon of suburban sprawl affected significantly the central area of the region. The suburban sprawl is usually associated with higher costs related to the management of the overall urban system and the construction of public infrastructures. As a consequence of this local authorities may experience a lack of financial resources that could lead to difficulties in guaranteeing high standards of public services. The strategic programming and the governance of the territory are set out in the Regional Territorial Programming (“Programmazione Territoriale Regionale”). Axis 4 of the 20017-20013 ERDF ROP ER devoted 81.90 Meuro to the “valorisation of the cultural and environmental assets”. As of the end of June 2013, the utilisation rate of the Axis was 68.95%.
Urban regeneration projects are also supported by the Region under other Axes of the 2007-2013 ERDF ROP. The development of Techno-Hubs in the Emilia-Romagna region, is one of the regional priorities, partially supported by ERDF funds within Axis 1 of the 2007-2o13 ERDF ROP ER. The 10 Techno-Hubs will be supported by 6 Universities and 4 research institutes and will lead to the creation of 34 laboratories for industrial research and 11 innovation centres. The Techno-Hubs will host industrial research and technological transfer activities covering the following thematic areas: agricultural and food industry,
Multiregional Study
63
construction, energy and environment, ICT and design, mechanics of materials, life sciences. The Techno-Hub network is coordinated by Aster, a consortium composed by the Region, Universities, research institutes and regional trade associations. The main priority of Aster is to support the development of the network’s thematic platforms, the laboratories and to maintain the relations with SMEs. Aster will serve as the hub of the network, promoting and coordinating its activities at regional, national and international level.
Within this context a relevant role is played by the Smart Specialisation Strategy, a policy developed by the European Commission with the aim of promoting the efficient and effective use of public investment in research. Its main goal is to foster regional innovation by avoiding the dispersion of resources across several technological fields. Given the commercial support and technological transfer required by these initiatives, SMEs are deeply involved in the development of the Smart Specialisation Strategy and the High-Technology Network.
Financial requirements and potential sources of funding
The total investment related to the development of the Techno-Hubs amounts to 241.00 Meuro and it is
divided as follows:
94.00 Meuro from ERDF resources;
43.00 Meuro from regional resources;
93.00 Meuro from Universities and research institutes;
11.00 Meuro from Local Authorities.
Of the total amount of resources, 69.00 Meuro will be invested for the realisation of infrastructures and
48.00 Meuro for the purchase of scientific equipment.
At present only 1 Techno-Hub was developed out of 10 (“Officine Reggiane” in the province of Reggio-
Emilia). The investment related to the realisation of the infrastructures amounted to 5.50 Meuro while
11.70 Meuro will be disbursed to finance the research programmes. Therefore the current utilisation rate
of the resources devoted to the Techno-Hubs project amounts to 7.6%, considering the infrastructures only
and 6.7 % overall.
Project characteristics and suboptimal investment condition
The Techno-hubs represent one of the main urban regeneration projects planned by the Emilia-Romagna Region. The infrastructures hosting the Techno-Hubs mainly regard the regeneration of buildings located in the periphery of cities and in abandoned industrial areas. The Techno-Hubs project has been mainly financed through European, regional and local resources, with a relevant contribution provided by Universities and research institutes. The introduction of the Budgetary Stability Pact placed local authorities in serious financial difficulties, limiting their ability to invest and meet payment deadlines. Potential delays in the disbursement of regional and local resources will impact negatively on project implementation. Furthermore the private sector was not involved in the financing of the project, mainly because of the low financial attractiveness of the investment and the long payback period.
6.2.2. Energy efficiency
The energy balance of the Emilia-Romagna Region is highly dependent on the import of fossil fuel that covers more than 90% of its overall energy demand. Therefore the production of electricity mainly relies on
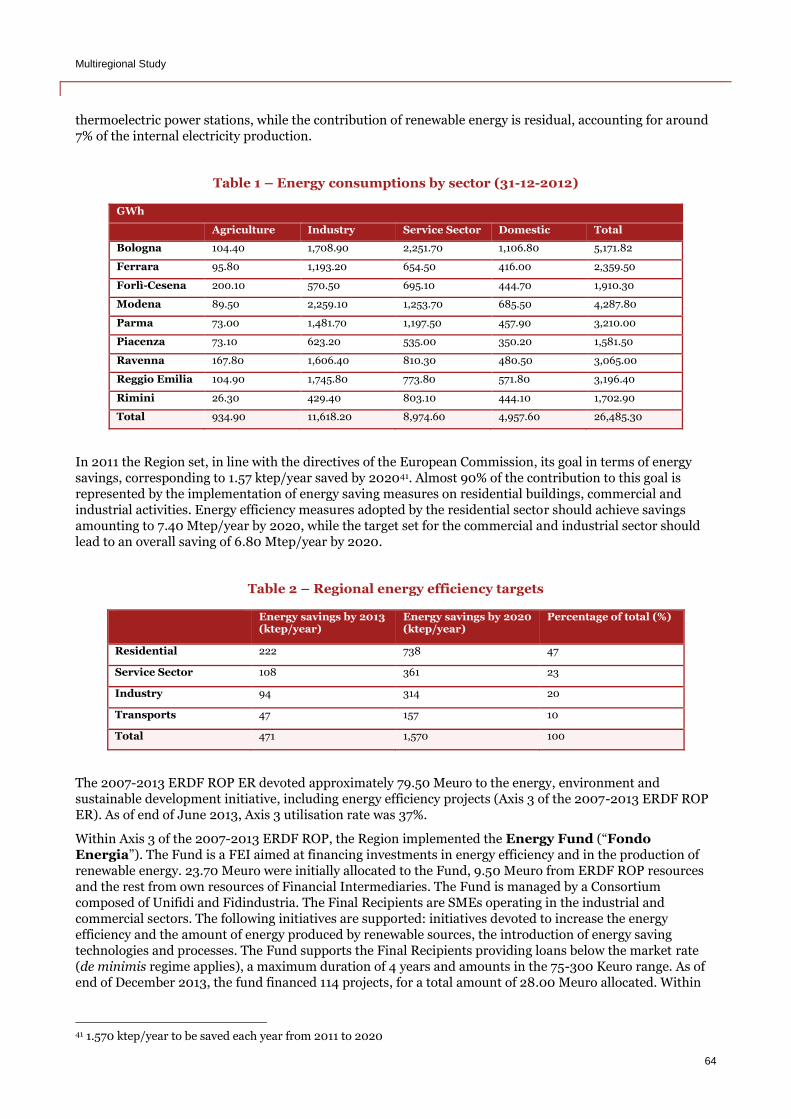
Multiregional Study
64
thermoelectric power stations, while the contribution of renewable energy is residual, accounting for around 7% of the internal electricity production.
Table 1 – Energy consumptions by sector (31-12-2012)
GWh
Agriculture Industry Service Sector Domestic Total
Bologna 104.40 1,708.90 2,251.70 1,106.80 5,171.82
Ferrara 95.80 1,193.20 654.50 416.00 2,359.50
Forlì-Cesena 200.10 570.50 695.10 444.70 1,910.30
Modena 89.50 2,259.10 1,253.70 685.50 4,287.80
Parma 73.00 1,481.70 1,197.50 457.90 3,210.00
Piacenza 73.10 623.20 535.00 350.20 1,581.50
Ravenna 167.80 1,606.40 810.30 480.50 3,065.00
Reggio Emilia 104.90 1,745.80 773.80 571.80 3,196.40
Rimini 26.30 429.40 803.10 444.10 1,702.90
Total 934.90 11,618.20 8,974.60 4,957.60 26,485.30
In 2011 the Region set, in line with the directives of the European Commission, its goal in terms of energy savings, corresponding to 1.57 ktep/year saved by 202041. Almost 90% of the contribution to this goal is represented by the implementation of energy saving measures on residential buildings, commercial and industrial activities. Energy efficiency measures adopted by the residential sector should achieve savings amounting to 7.40 Mtep/year by 2020, while the target set for the commercial and industrial sector should lead to an overall saving of 6.80 Mtep/year by 2020.
Table 2 – Regional energy efficiency targets
Energy savings by 2013 (ktep/year)
Energy savings by 2020 (ktep/year)
Percentage of total (%)
Residential 222 738 47
Service Sector 108 361 23
Industry 94 314 20
Transports 47 157 10
Total 471 1,570 100
The 2007-2013 ERDF ROP ER devoted approximately 79.50 Meuro to the energy, environment and sustainable development initiative, including energy efficiency projects (Axis 3 of the 2007-2013 ERDF ROP ER). As of end of June 2013, Axis 3 utilisation rate was 37%.
Within Axis 3 of the 2007-2013 ERDF ROP, the Region implemented the Energy Fund (“Fondo Energia”). The Fund is a FEI aimed at financing investments in energy efficiency and in the production of renewable energy. 23.70 Meuro were initially allocated to the Fund, 9.50 Meuro from ERDF ROP resources and the rest from own resources of Financial Intermediaries. The Fund is managed by a Consortium composed of Unifidi and Fidindustria. The Final Recipients are SMEs operating in the industrial and commercial sectors. The following initiatives are supported: initiatives devoted to increase the energy efficiency and the amount of energy produced by renewable sources, the introduction of energy saving technologies and processes. The Fund supports the Final Recipients providing loans below the market rate (de minimis regime applies), a maximum duration of 4 years and amounts in the 75-300 Keuro range. As of end of December 2013, the fund financed 114 projects, for a total amount of 28.00 Meuro allocated. Within
41 1.570 ktep/year to be saved each year from 2011 to 2020
Multiregional Study
65
the same Axis, the Region provided almost 40.00 Meuro to support energy efficiency plans of SME operating in the “technologically equipped areas” (APEA) of the region.
From 2009 to 2012 the Region contributed to the achievement of the goals set in the Regional Energy Plan (“PER”) by devoting 60.00 Meuro from the regional budget to support initiatives coherent with the municipal three year investment plans (“Piani Triennali”). Regional resources were devoted to projects presented by 139 Municipalities, through grant co-financing of the investment costs (up to 30% of the total) or in the form of interest rate subsidies. All Municipalities asked for the first form of support (due to the limits imposed to the municipality by the Budgetary Stability Pact in terms of recourse to debt).
In the period 2007-2013 the provinces of Emilia-Romagna carried out, within the PAES initiative, energy efficiency projects amounting to 50.00 Meuro, financed by the private operators (mainly Hera Luce) for the larger part and by public funds (regional and national contributions) for a small portion. More specifically, Municipalities in the provinces of Bologna and Reggio-Emilia realised energy efficiency projects in public buildings amounting to 27.00 Meuro, while in the same period Municipalities in the provinces of Bologna, Reggio-Emilia, Piacenza and Forlì invested 21.00 Meuro in photovoltaic projects. Energy efficiency projects in public buildings were mainly financed by public sources (ACERs, public entities in charge of building and maintaining social housing units), while private operators invested resources in photovoltaic projects and public lighting (HERA, IREN).
In 2012 the energy sector led the PPP regional market, with 57 tenders for an overall funding of 129.00 Meuro, mainly represented by renewable energy and energy efficiency projects, the majority in public lighting. Between 2011 and 2013 14 published tenders related to the planning, construction and management of photovoltaic power plants could not be awarded. Almost all the PPP tenders in the energy sector concerned small-sized projects (around 1.00 Meuro) and were issued by Municipalities.
Financial requirements and potential sources of funding
In order to reach energy saving targets by 2020, a number of energy efficiency measures on residential buildings, commercial and industrial activities should be implemented in the region. Financial requirements to improve the efficiency of the public residential real estate amount to nearly 200.00 Meuro. The PER foresees the improvement of energy efficiency in public residential buildings. The total investment cost for improving the energy efficiency of 58,000 apartments managed by the ACERs amounts to 100-150.0042
Meuro while the total investment cost for improving the energy efficiency of 15,000 apartments managed by the “Cooperative a proprietà indivisa” amounts to 28-40.0043 Meuro.
In order to reach the goals set in the Sustainable Energy Action Plans (SEAP) developed by the provinces of Emilia-Romagna, Municipalities are expected to realise energy efficiency interventions on public buildings for a total amount of 70.00 Meuro by 2020.
No information is currently available to estimate financial requirements related to the improvement of energy efficiency in the industrial and commercial sectors.
A broad selection of funds at European, national and regional level may contribute to finance energy efficiency projects. Apart from the support provided through ESI funds, the European Commission offers support via the European Energy Efficiency Fund (EEEF). At national level a vital role is played by national subsidies and by tax allowances related to energy efficiency measures on buildings. At regional level, initiatives could be supported by the Fondo Energia.
42 Assuming an average cost of the investment in the range of 1900-3000 €/ apartment, excluding structural interventions (http://www.fondazionesvilupposostenibile.org/f/Documenti/Seminario_EPBD/slides_Corradi_ACER_Federcasa_26_maggio.pdf). 43 Assuming an average cost of the investment in the range of 1900-3000 €/ apartment, excluding structural interventions (http://www.fondazionesvilupposostenibile.org/f/Documenti/Seminario_EPBD/slides_Corradi_ACER_Federcasa_26_maggio.pdf).
Multiregional Study
66
Projects characteristics and suboptimal investment conditions
Energy saving measures on residential buildings are often characterised by small scale interventions financed by private owners that benefit directly from the financial savings produced. When such interventions are applied to public residential assets, they can generate large scale investments, borne by a single public operator that is not the direct beneficiary of the savings. The same applies to the managers of large semi-public or non-profit residential real estate portfolios. In both cases rent rates/facility management fees are kept low by law and are insufficient to cover investment costs needed to improve energy efficiency. In case of public sector owners, the Budgetary Stability Pact limits the ability of the public entity to make investments and/or recur to loans. At the same time the involvement of the private sector (e.g. Energy Service Companies) is complicated due to high initial investment costs compared to the energy costs savings and to the difficulties of companies in accessing credit from banks.
The industrial and commercial players in the region are mainly SME. Measures for improving the energy efficiency imply investment costs to be borne with no positive impact on their core business and limited economic benefits (energy savings) in the medium run. Due to the economic downturn and the restricted access to finance, SMEs’ financial resources for investment are limited and concentrated to increase business viability. Thus SMEs prefer or are forced to implement cost reduction measures other than energy efficiency interventions.
6.2.3. Information and Communication Technology (ICT)
In the past the Emilia-Romagna Region was characterized by the highest degree of digital divide at national level. Such gap has been progressively reduced in recent years: currently the Region presents an internet coverage of 97.4% and an ADSL coverage of 90.5%. The Digital Agenda for Europe (DEA) sets further goals as regards the development of fast and ultra-fast internet access. The targets established by the agenda can be summarised as follows:
Basic broadband for all by 2013 (target met - satellite broadband is available to raise the coverage to 100% in every Member State);
Next Generation Networks (NGN) (30 Mbps or more) for all by 2020;
50% of households having 100 Mbps subscriptions or higher.
The strategic scheduling programme in the field of ICT is implemented through the Emilia-Romagna Telematic Plan (“Piano Telematico dell’Emilia-Romagna”). The plan is developed along five guidelines, that serve as a basis for the definition of operative programmes (OP). Through the OP the Region sets the actions and budgets required for the achievements of the defined objectives.
At European level projects in the field of Information and Communication Technology can be financed by the ERDF. One of the main funding priorities of the ERDF, included in the regional competitiveness and employment objective in 2007-2013, is to provide access to telecommunications services of general economic interest, with a special focus on secondary networks, and encourage the access to ICT for SMEs. Within the 20o7-2013 ERDF ROP, the Region devoted an initial amount of 69.59 Meuro to Axis 244 to support innovative actions and promotion of the introduction of new technologies in the PMI sector. As of the end of June 2013, the sum was completely absorbed and the Region allocated additional resources up to a total amount of 103.00 Meuro.
The Ingenium Emilia-Romagna II is a FEI set up in the framework of Axis 245 of the 2007-ERDF ROP ER . The fund encourages innovative start-up companies, in particular those operating in the high-tech sectors, and supports the development strategy of already existing companies in the manufacturing sector. In particular the fund is aimed at sustaining entrepreneurial initiatives that encounter difficulties to access venture capital private market or other more traditional sources of funding. The resources of the fund amount to 14.00 Meuro and the financial support is provided through temporary acquisition of minority
44 2007-2013 ERDF ROP, Axis 2 includes the following lines of activities: support of ICT projects within SMEs, support of projects and services aimed to develop technological and organizational innovations within SMEs and a SME network establishment, and promotion and support of innovative financial management tools adoption by the SMEs. 45 Line of activity II.1.3. “promotion and support of innovative financial management tools adoption by the SMEs”
Multiregional Study
67
stakes to innovative businesses based in the region. As of January 2013, the fund supported 6 companies, for a total investment of 5.00 Meuro. More than 87 companies required support to the fund.
Financial requirements and potential sources of funding
In line with the provisions of the Piano Telematico dell’Emilia-Romagna, almost 128.00 Meuro were invested to reduce the regional digital divide in the period 2011-2013 (54.00 Meuro from the ER budget, 74.00 Meuro from resources devoted by Lepida to improve and extend its broadband network). The Piano Telematico dell’Emilia-Romagna 2013 includes 41 projects, of which 34 related to on-going initiatives and 7 concerning new initiatives. Overall the financial requirement of the projects amounts to 79.00 Meuro.
Beside the Piano Telematico dell’Emilia-Romagna, the Region is planning to develop 4 regional data centres
(and related network connections) in order to ensure the connection of the Public Administration to the high
technology network and to introduce broadband networks in the district and APEA areas. The investment
costs of such projects in not known.
Project characteristics and Suboptimal investment conditions
The key ICT projects in the Emilia-Romagna Region are linked to the development of the fast and ultrafast broadband in the productive districts and APEA areas of the Region. The implementation of this technology is meant to guarantee a reliable and efficient connection to Laboratories, Universities, Research institutes, Hi-Tech incubators part of the High Technology Network. The ultrafast broadband is a key investment also for the competitiveness of SMEs, that require a reliable and fast connection in order to provide sales and post-sales services to international clients.
The difficulties in accessing credit negatively affected the ability of SMEs to invest in ICT. In addition the implementation of strict budgetary rules included in the Stability Pact led to a reduction in ICT investments planned by municipalities. The combined effect of these factors could provoke delays in the implementation of the Digital Agenda for Europe (DAU) at regional level. Investments in early-stage technologies as the fast and ultrafast technologies are generally characterised by long payback period. The reason lies in the capital-intensive investments required to build the digital infrastructure compared to the potential number of users at the launch of the service. Spatial sprawl also plays a major role in limiting the attractiveness of investments in the ultrafast broadband, since projects developed in sparsely populated areas have a weaker financial performance.
6.2.4. Local Public Transport
The public transport in Emilia-Romagna serves a population of 4.4 million citizens distributed across 9 provinces and 348 municipalities. In 2012 approximately 254 million passengers benefited from the regional public transport (0.4% more than the previous year). In the last years public transport services in Emilia-Romagna decreased in terms of vehicle*km: 3% in 2011 and 1.6% in 2012. Such contraction is highly dependent on the process of rationalisation that followed the implementation of the 2011-2013 Pact for Local Public Transport.
The current conditions of the regional transport are characterised by a level of service frequently inadequate and below the standards. This is mainly due to the scarcity of financial resources that should be required to renew the vehicle fleet and improve the quality of the service.
The vehicle fleet of the regional public transport counts 3,282 vehicles with an average age of 11 years. Recent investments led to an increase in the number of natural gas vehicles (from 8% to 26%) and a reduction in the number of the diesel-powered ones (from 74% to 52%).
At European level projects of local public transport can be funded by the European Regional Development Fund (ERDF) and by the European Energy Efficiency Fund (EEEF), which supports also investments in
Multiregional Study
68
clean urban transport. At national level public transport can be financed by the Development and Cohesion Fund.
In the period 1995-2010 the Region co-financed 395 projects of public transport for 176.00 Meuro. In the period 2007-2010, the Region approved the co-financing of further 51 projects with an amount of 12.70 Meuro. It has been estimated that 1,400 vehicles of the Local Public Transport fleet need replacement (total estimated investment is 280.00 Meuro46).
Project characteristics and suboptimal investment conditions
Investments in local public transport are characterised by a high degree of capital intensity and long payback periods, with external benefits which cannot be fully captured through user charges. The difficulties in accessing credit and the implementation of the Budgetary Stability Pact led to a reduction in the capacity to invest of local authorities and public operators of local public transport.
6.3. Value added of FIs
Results of the analysis against evaluation criteria
Basing on the 2007-2013 programming period experience, the opportunity to introduce FI to support urban
development has been assessed against the following criteria:
2014-2020 - ERDF ROP ER, in terms of financial availability, suitability of the design of the ROP (and its procedures) with the operating requirements of the FI;
Initiatives and project pipeline, meaning the availability of a pipeline of mature projects or initiatives that might be supported via FI;
Technical, administrative managing and capabilities and experience of the Public Administration, in terms of managing EU funds as well as planning, developing, procuring projects as well as managing contracts;
Suboptimal investment conditions and value added, in terms of valued added FI might bring in a context of suboptimal investment conditions (that is a pre-requisite for FI implementation). Value added identification partially comes from the results of case studies.
The above mentioned analysis has been carried out for 3 target sectors: urban regeneration, energy
efficiency, ICT. The analysis of the Local Public Transport sector highlighted investment requirements to
replace the fleet of vehicles with a more energy efficient one. Thus, for the purpose of this report, the analysis
of the perspective of FI in the Local Public Transport sector has been merged with the energy efficiency one.
Results of the analysis are summarised below:
The limited amount of resources that will be available for the 2014-2020 ERDF ROP ER, likely to be less than 400.00 Meuro, might be a constraint for the implementation of FI. Such limitation is mitigated for the Thematic Objective 4, which includes energy efficiency interventions. Thematic concentration requires 20% of total resources to be devoted to Thematic Objective 4 (almost 80 Meuro). In the 2007-2013 programming period, the Region contributed around 4% of ERDF ROP ER resources to FEIs. Assuming that the Region will give more importance to FI in the future by increasing the allocation of resources to FI by a factor of two or three, the total amount of ERDF funds would be approximately 50-60.00 Meuro.
The 2014-2020 ERDF ROP ER is under development. For the time being, it is not possible to assess the compliance of its design and related procedures with the operating requirements of the FI.
A number of initiatives in each sector resulted to be potentially eligible for ERDF funding: development of Tecno Hubs, Improvement of the energy efficiency in social housing, energy
46 200 Keuro per vehicle
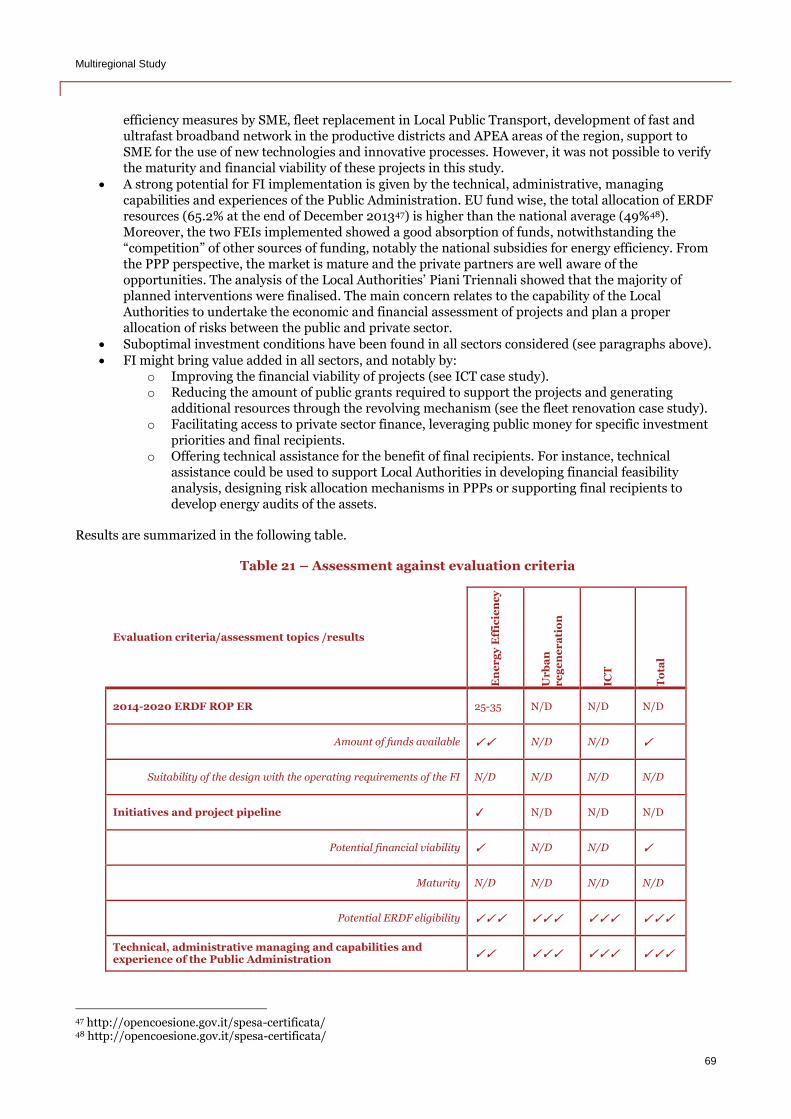
Multiregional Study
69
efficiency measures by SME, fleet replacement in Local Public Transport, development of fast and ultrafast broadband network in the productive districts and APEA areas of the region, support to SME for the use of new technologies and innovative processes. However, it was not possible to verify the maturity and financial viability of these projects in this study.
A strong potential for FI implementation is given by the technical, administrative, managing capabilities and experiences of the Public Administration. EU fund wise, the total allocation of ERDF resources (65.2% at the end of December 201347) is higher than the national average (49%48). Moreover, the two FEIs implemented showed a good absorption of funds, notwithstanding the “competition” of other sources of funding, notably the national subsidies for energy efficiency. From the PPP perspective, the market is mature and the private partners are well aware of the opportunities. The analysis of the Local Authorities’ Piani Triennali showed that the majority of planned interventions were finalised. The main concern relates to the capability of the Local Authorities to undertake the economic and financial assessment of projects and plan a proper allocation of risks between the public and private sector.
Suboptimal investment conditions have been found in all sectors considered (see paragraphs above).
FI might bring value added in all sectors, and notably by: o Improving the financial viability of projects (see ICT case study). o Reducing the amount of public grants required to support the projects and generating
additional resources through the revolving mechanism (see the fleet renovation case study). o Facilitating access to private sector finance, leveraging public money for specific investment
priorities and final recipients. o Offering technical assistance for the benefit of final recipients. For instance, technical
assistance could be used to support Local Authorities in developing financial feasibility analysis, designing risk allocation mechanisms in PPPs or supporting final recipients to develop energy audits of the assets.
Results are summarized in the following table.
Table 21 – Assessment against evaluation criteria
Evaluation criteria/assessment topics /results
En
er
gy
Eff
icie
nc
y
Ur
ba
n
re
ge
ne
ra
tio
n
ICT
To
tal
2014-2020 ERDF ROP ER 25-35 N/D N/D N/D
Amount of funds available ✓✓ N/D N/D ✓
Suitability of the design with the operating requirements of the FI N/D N/D N/D N/D
Initiatives and project pipeline ✓ N/D N/D N/D
Potential financial viability ✓ N/D N/D ✓
Maturity N/D N/D N/D N/D
Potential ERDF eligibility ✓✓✓ ✓✓✓ ✓✓✓ ✓✓✓
Technical, administrative managing and capabilities and experience of the Public Administration
✓✓ ✓✓✓ ✓✓✓ ✓✓✓
47 http://opencoesione.gov.it/spesa-certificata/ 48 http://opencoesione.gov.it/spesa-certificata/
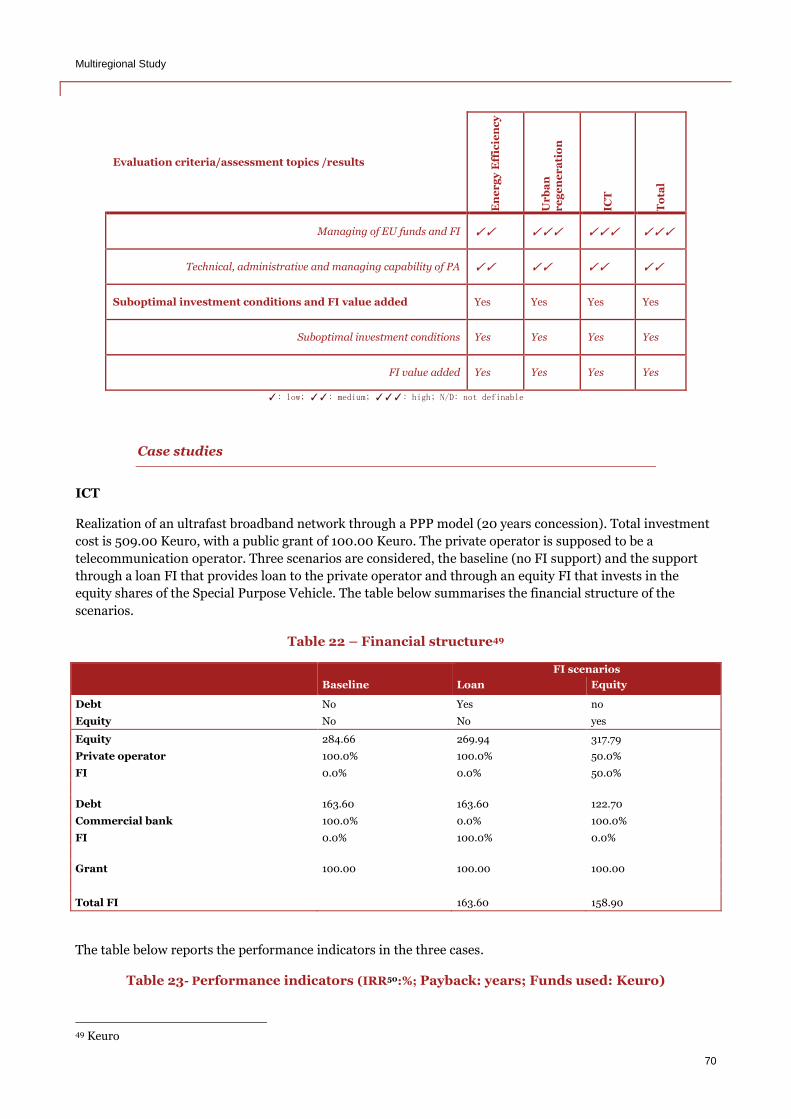
Multiregional Study
70
Evaluation criteria/assessment topics /results
En
er
gy
Eff
icie
nc
y
Ur
ba
n
re
ge
ne
ra
tio
n
ICT
To
tal
Managing of EU funds and FI ✓✓ ✓✓✓ ✓✓✓ ✓✓✓
Technical, administrative and managing capability of PA ✓✓ ✓✓ ✓✓ ✓✓
Suboptimal investment conditions and FI value added Yes Yes Yes Yes
Suboptimal investment conditions Yes Yes Yes Yes
FI value added Yes Yes Yes Yes
✓: low; ✓✓: medium; ✓✓✓: high; N/D: not definable
Case studies
ICT
Realization of an ultrafast broadband network through a PPP model (20 years concession). Total investment
cost is 509.00 Keuro, with a public grant of 100.00 Keuro. The private operator is supposed to be a
telecommunication operator. Three scenarios are considered, the baseline (no FI support) and the support
through a loan FI that provides loan to the private operator and through an equity FI that invests in the
equity shares of the Special Purpose Vehicle. The table below summarises the financial structure of the
scenarios.
Table 22 – Financial structure49
FI scenarios
Baseline Loan Equity
Debt No Yes no
Equity No No yes
Equity 284.66 269.94 317.79
Private operator 100.0% 100.0% 50.0%
FI 0.0% 0.0% 50.0%
Debt 163.60 163.60 122.70
Commercial bank 100.0% 0.0% 100.0%
FI 0.0% 100.0% 0.0%
Grant 100.00 100.00 100.00
Total FI
163.60 158.90
The table below reports the performance indicators in the three cases.
Table 23- Performance indicators (IRR50:%; Payback: years; Funds used: Keuro)
49 Keuro
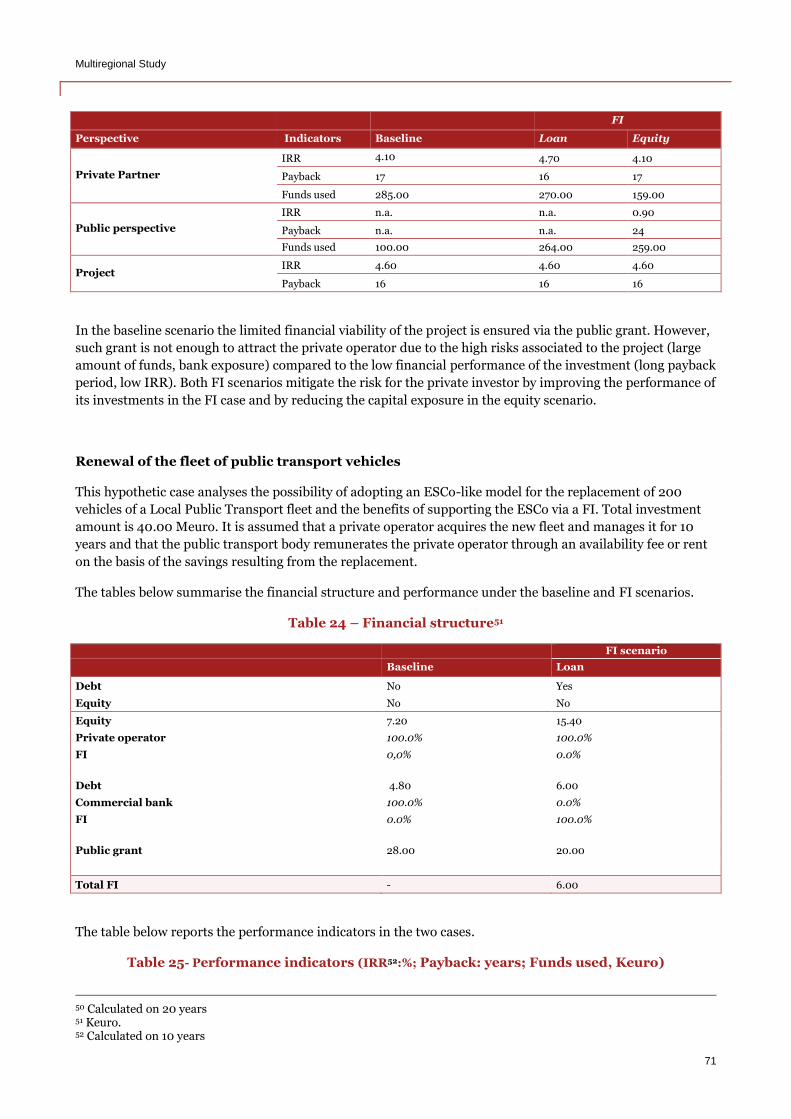
Multiregional Study
71
FI
Perspective Indicators Baseline Loan Equity
Private Partner
IRR 4.10 4.70 4.10
Payback 17 16 17
Funds used 285.00 270.00 159.00
Public perspective
IRR n.a. n.a. 0.90
Payback n.a. n.a. 24
Funds used 100.00 264.00 259.00
Project IRR 4.60 4.60 4.60
Payback 16 16 16
In the baseline scenario the limited financial viability of the project is ensured via the public grant. However,
such grant is not enough to attract the private operator due to the high risks associated to the project (large
amount of funds, bank exposure) compared to the low financial performance of the investment (long payback
period, low IRR). Both FI scenarios mitigate the risk for the private investor by improving the performance of
its investments in the FI case and by reducing the capital exposure in the equity scenario.
Renewal of the fleet of public transport vehicles
This hypothetic case analyses the possibility of adopting an ESCo-like model for the replacement of 200
vehicles of a Local Public Transport fleet and the benefits of supporting the ESCo via a FI. Total investment
amount is 40.00 Meuro. It is assumed that a private operator acquires the new fleet and manages it for 10
years and that the public transport body remunerates the private operator through an availability fee or rent
on the basis of the savings resulting from the replacement.
The tables below summarise the financial structure and performance under the baseline and FI scenarios.
Table 24 – Financial structure51
FI scenario
Baseline Loan
Debt No Yes
Equity No No
Equity 7.20 15.40
Private operator 100.0% 100.0%
FI 0,0% 0.0%
Debt 4.80 6.00
Commercial bank 100.0% 0.0%
FI 0.0% 100.0%
Public grant 28.00 20.00
Total FI - 6.00
The table below reports the performance indicators in the two cases.
Table 25- Performance indicators (IRR52:%; Payback: years; Funds used, Keuro)
50 Calculated on 20 years 51 Keuro. 52 Calculated on 10 years
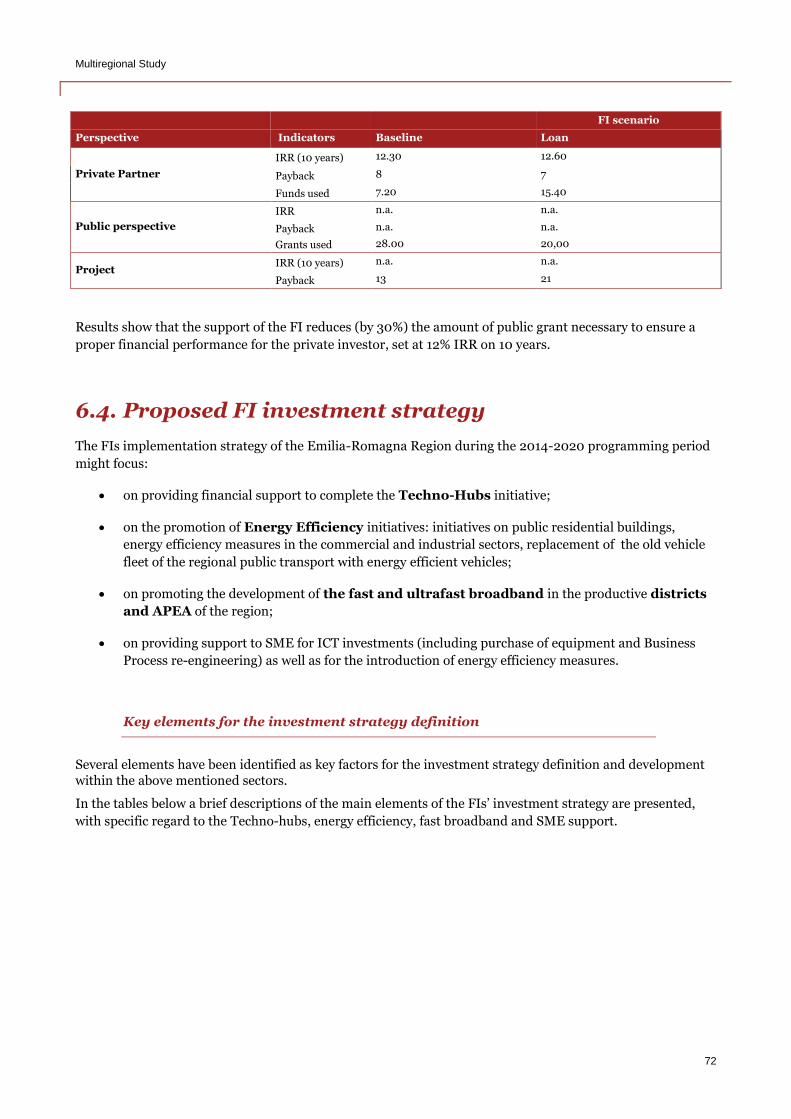
Multiregional Study
72
FI scenario
Perspective Indicators Baseline Loan
Private Partner
IRR (10 years) 12.30 12.60
Payback 8 7
Funds used 7.20 15.40
Public perspective
IRR n.a. n.a.
Payback n.a. n.a.
Grants used 28.00 20,00
Project IRR (10 years) n.a. n.a.
Payback 13 21
Results show that the support of the FI reduces (by 30%) the amount of public grant necessary to ensure a
proper financial performance for the private investor, set at 12% IRR on 10 years.
6.4. Proposed FI investment strategy
The FIs implementation strategy of the Emilia-Romagna Region during the 2014-2020 programming period
might focus:
on providing financial support to complete the Techno-Hubs initiative;
on the promotion of Energy Efficiency initiatives: initiatives on public residential buildings,
energy efficiency measures in the commercial and industrial sectors, replacement of the old vehicle
fleet of the regional public transport with energy efficient vehicles;
on promoting the development of the fast and ultrafast broadband in the productive districts
and APEA of the region;
on providing support to SME for ICT investments (including purchase of equipment and Business
Process re-engineering) as well as for the introduction of energy efficiency measures.
Key elements for the investment strategy definition
Several elements have been identified as key factors for the investment strategy definition and development within the above mentioned sectors.
In the tables below a brief descriptions of the main elements of the FIs’ investment strategy are presented,
with specific regard to the Techno-hubs, energy efficiency, fast broadband and SME support.

Multiregional Study
73
Table 26 – Investment strategy key factors: techno-hubs
ELEMENTS OF FI STRATEGY URBAN REGENERATION
PROJECT TYPOLOGIES Realisation of Techno-hubs schemes included in the high technology network
THEMATIC OBJECTIVE Thematic Objective 1 (to be checked)
GEOGRAPHICAL COVERAGE Regional coverage
MARKET DIMENSION 9 Techno-hubs to realise, for a total investment of more than 70 Meuro
FINAL BENEFICIARIES Concessionaries selected through public tender
FINANCIAL PRODUCTS Debt, Guarantees, Equity (ex-ante assessment shall define the most appropriate one )
TECHNICAL ASSISTANCE Technical assistance to the benefit of Final Recipients to develop financial feasibility studies
Table 27 –Investment strategy key elements: energy efficiency sector
ELEMENTS OF FI STRATEGY
PUBLIC RESIDENTIAL ASSETS SUSTAINABLE REGIONAL PUBLIC TRANSPORT
PROJECT TYPOLOGIES Energy efficiency projects related to social housing assets.
Fleet renovation
THEMATIC OBJECTIVE Thematic Objective 4
GEOGRAPHICAL COVERAGE
To reach a significant investment size, integrated interventions are needed, aggregating several assets located all over the region.
Regional coverage
MARKET DIMENSION 190-260.00 Meuro 280.00 Meuro (1.400 vehicles)
FINAL BENEFICIARIES Final Recipients may be natural or legal persons (including a provider of Services of General Economic Interest e.g. social housing) or independent professionals (economic activity), as well as administrators or other legal bodies acting on behalf and for the benefit of owners, owning premises (apartment or individual household) implementing energy efficiency or renewable measures .
Private operators
FINANCIAL PRODUCTS Debt, Guarantees, Equity Debt, Guarantees, Equity
TECHNICAL ASSISTANCE Technical assistance to the benefit of Final Recipients to carry out energy audits and develop projects
Technical assistance to the benefit of public Final Recipients to organize fleets renovation plans and for the arrangement of the operation with the ESCo
NOTES To be checked if “off the shelf” renovation loan conditions apply
Table 28 –Investment strategy key elements: fast and ultrafast broadband
ELEMENTS OF FI STRATEGY NETWORK
PROJECT TYPOLOGIES Realisation of the fast and ultra fast broadband network
THEMATIC OBJECTIVE Thematic Objective 2
GEOGRAPHICAL COVERAGE Districts /APEA
MARKET DIMENSION Not yet defined

Multiregional Study
74
ELEMENTS OF FI STRATEGY NETWORK
FINAL BENEFICIARIES Private operators
TECHNICAL ASSISTANCE Technical assistance to the benefit of Final Recipients to speed up procurement procedures
FINANCIAL PRODUCTS Debt, Equity, Guarantees
In the table below a brief description of main elements of the FIs’ investment strategy for the support to
SME.
Table 29 –Investment strategy key elements: support to SME
ELEMENTS OF FI STRATEGY ENERGY EFFICIENCY ICT
PROJECT TYPOLOGIES Integrated actions for energy efficiency (e.g. smart grids, technology networks, etc..)
Business Process Re-engineering (BPR) initiatives aimed at promoting the use of technology oriented business processes Purchase of technology equipment
THEMATIC OBJECTIVE Thematic Objective 3
GEOGRAPHICAL COVERAGE Districts/APEA/Techno Hubs
MARKET DIMENSION Not yet defined Not yet defined
FINAL BENEFICIARIES SME
TECHNICAL ASSISTANCE Technical assistance to prepare documents to be submitted to the FI
FINANCIAL PRODUCTS Debt, Guarantees, Equity (start-up)
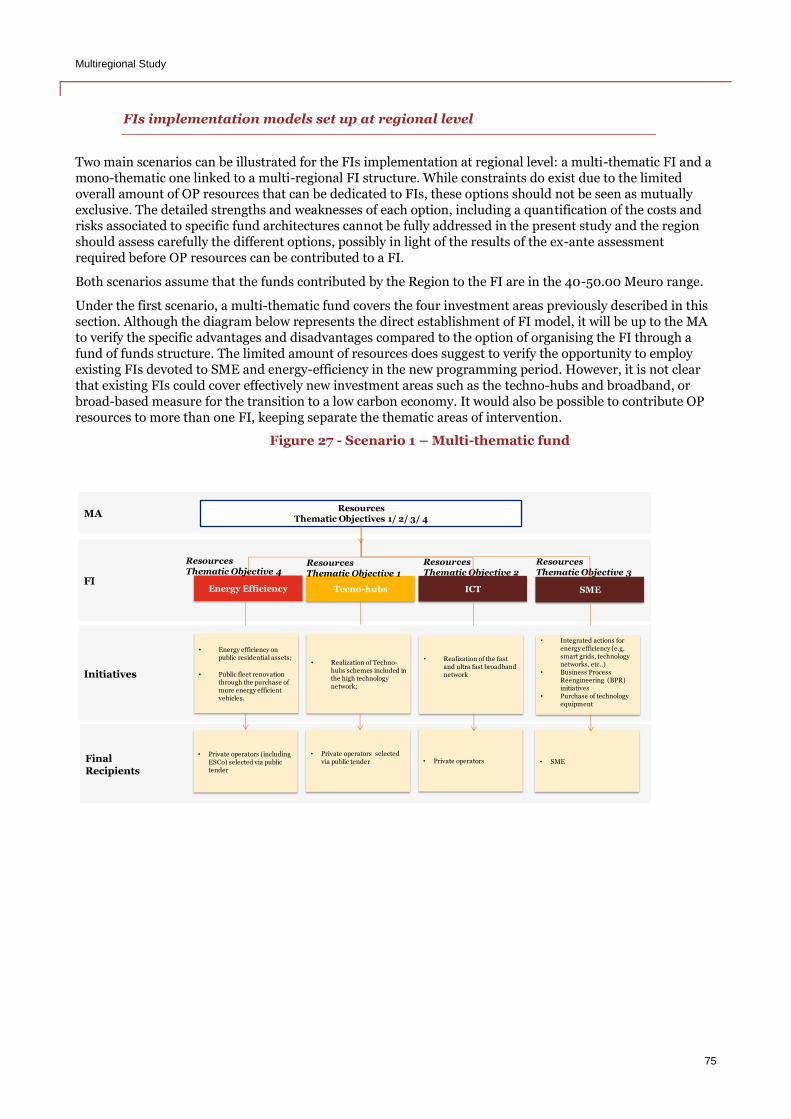
Multiregional Study
75
FIs implementation models set up at regional level
Two main scenarios can be illustrated for the FIs implementation at regional level: a multi-thematic FI and a mono-thematic one linked to a multi-regional FI structure. While constraints do exist due to the limited overall amount of OP resources that can be dedicated to FIs, these options should not be seen as mutually exclusive. The detailed strengths and weaknesses of each option, including a quantification of the costs and risks associated to specific fund architectures cannot be fully addressed in the present study and the region should assess carefully the different options, possibly in light of the results of the ex-ante assessment required before OP resources can be contributed to a FI.
Both scenarios assume that the funds contributed by the Region to the FI are in the 40-50.00 Meuro range.
Under the first scenario, a multi-thematic fund covers the four investment areas previously described in this section. Although the diagram below represents the direct establishment of FI model, it will be up to the MA to verify the specific advantages and disadvantages compared to the option of organising the FI through a fund of funds structure. The limited amount of resources does suggest to verify the opportunity to employ existing FIs devoted to SME and energy-efficiency in the new programming period. However, it is not clear that existing FIs could cover effectively new investment areas such as the techno-hubs and broadband, or broad-based measure for the transition to a low carbon economy. It would also be possible to contribute OP resources to more than one FI, keeping separate the thematic areas of intervention.
Figure 27 - Scenario 1 – Multi-thematic fund
Initiatives
MA
FIEnergy Efficiency
ResourcesThematic Objectives 1/ 2/ 3/ 4
Tecno-hubs ICT
Final
Recipients
• Private operators (including ESCo) selected via public tender
• Private operators selectedvia public tender • Private operators
ResourcesThematic Objective 4
ResourcesThematic Objective 1
ResourcesThematic Objective 2
SME
• SME
ResourcesThematic Objective 3
• Energy efficiency on public residential assets;
• Public fleet renovation through the purchase of more energy efficient vehicles.
• Realization of Techno-hubs schemes included in the high technology network;
• Realization of the fast and ultra fast broadband network
• Integrated actions for energy efficiency (e.g. smart grids, technology networks, etc..)
• Business Process Reengineering (BPR) initiatives
• Purchase of technology equipment
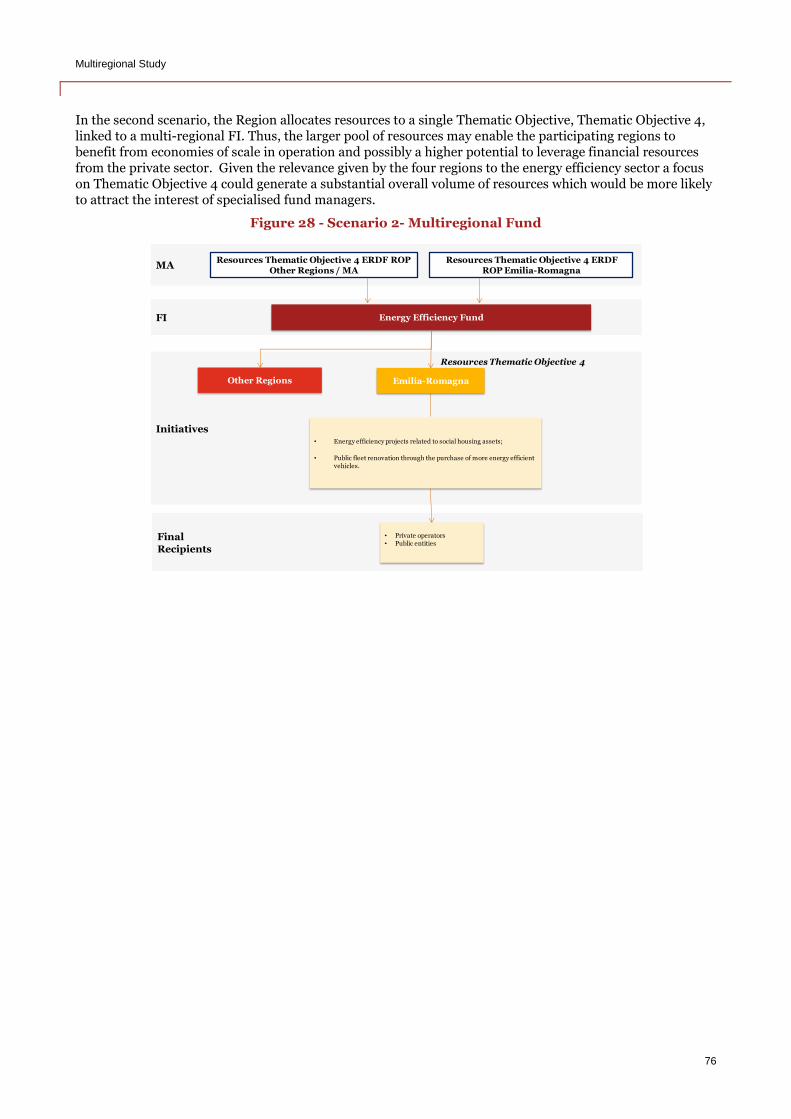
Multiregional Study
76
In the second scenario, the Region allocates resources to a single Thematic Objective, Thematic Objective 4, linked to a multi-regional FI. Thus, the larger pool of resources may enable the participating regions to benefit from economies of scale in operation and possibly a higher potential to leverage financial resources from the private sector. Given the relevance given by the four regions to the energy efficiency sector a focus on Thematic Objective 4 could generate a substantial overall volume of resources which would be more likely to attract the interest of specialised fund managers.
Figure 28 - Scenario 2- Multiregional Fund
Initiatives
MA
FI Energy Efficiency Fund
Other Regions
Resources Thematic Objective 4 ERDF ROP Emilia-Romagna
• Energy efficiency projects related to social housing assets;
• Public fleet renovation through the purchase of more energy efficient vehicles.
Final
Recipients
• Private operators• Public entities
Resources Thematic Objective 4
Resources Thematic Objective 4 ERDF ROP Other Regions / MA
Emilia-Romagna
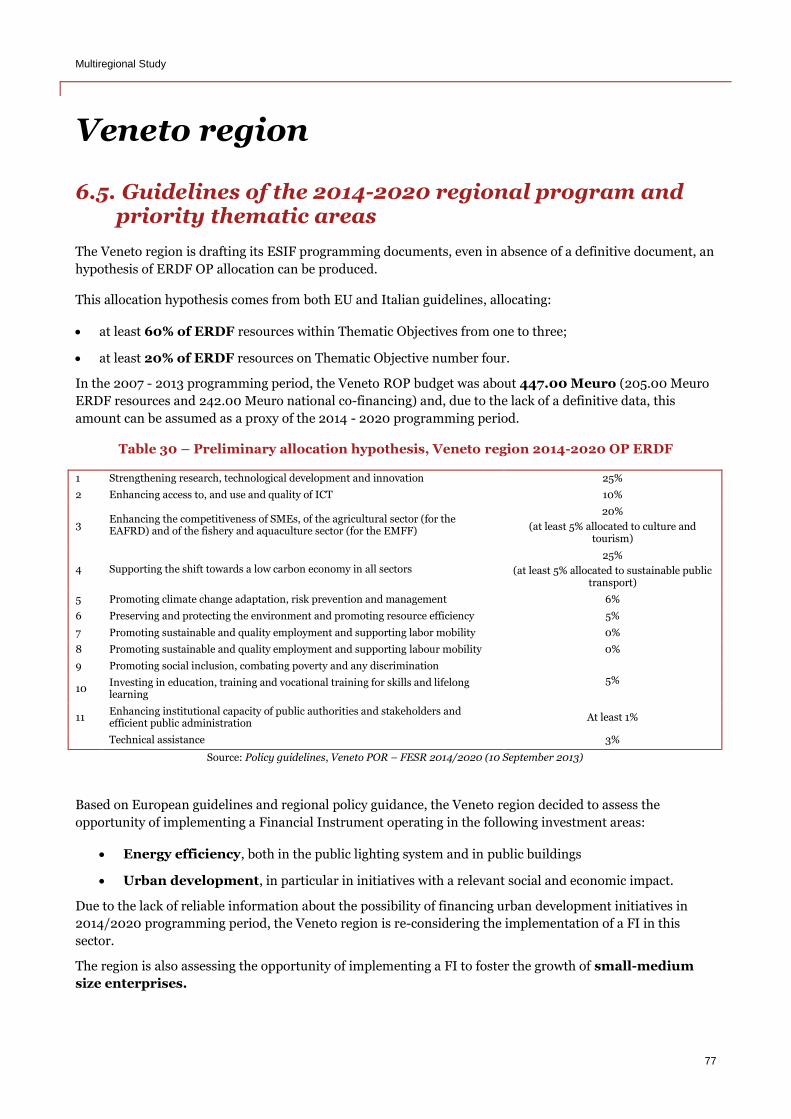
Multiregional Study
77
Veneto region
6.5. Guidelines of the 2014-2020 regional program and priority thematic areas
The Veneto region is drafting its ESIF programming documents, even in absence of a definitive document, an
hypothesis of ERDF OP allocation can be produced.
This allocation hypothesis comes from both EU and Italian guidelines, allocating:
at least 60% of ERDF resources within Thematic Objectives from one to three;
at least 20% of ERDF resources on Thematic Objective number four.
In the 2007 - 2013 programming period, the Veneto ROP budget was about 447.00 Meuro (205.00 Meuro
ERDF resources and 242.00 Meuro national co-financing) and, due to the lack of a definitive data, this
amount can be assumed as a proxy of the 2014 - 2020 programming period.
Table 30 – Preliminary allocation hypothesis, Veneto region 2014-2020 OP ERDF
1 Strengthening research, technological development and innovation 25%
2 Enhancing access to, and use and quality of ICT 10%
3 Enhancing the competitiveness of SMEs, of the agricultural sector (for the EAFRD) and of the fishery and aquaculture sector (for the EMFF)
20%
(at least 5% allocated to culture and tourism)
4 Supporting the shift towards a low carbon economy in all sectors
25%
(at least 5% allocated to sustainable public transport)
5 Promoting climate change adaptation, risk prevention and management 6%
6 Preserving and protecting the environment and promoting resource efficiency 5%
7 Promoting sustainable and quality employment and supporting labor mobility 0%
8 Promoting sustainable and quality employment and supporting labour mobility 0%
9 Promoting social inclusion, combating poverty and any discrimination
5% 10
Investing in education, training and vocational training for skills and lifelong learning
11 Enhancing institutional capacity of public authorities and stakeholders and efficient public administration
At least 1%
Technical assistance 3%
Source: Policy guidelines, Veneto POR – FESR 2014/2020 (10 September 2013)
Based on European guidelines and regional policy guidance, the Veneto region decided to assess the
opportunity of implementing a Financial Instrument operating in the following investment areas:
Energy efficiency, both in the public lighting system and in public buildings
Urban development, in particular in initiatives with a relevant social and economic impact.
Due to the lack of reliable information about the possibility of financing urban development initiatives in
2014/2020 programming period, the Veneto region is re-considering the implementation of a FI in this
sector.
The region is also assessing the opportunity of implementing a FI to foster the growth of small-medium
size enterprises.
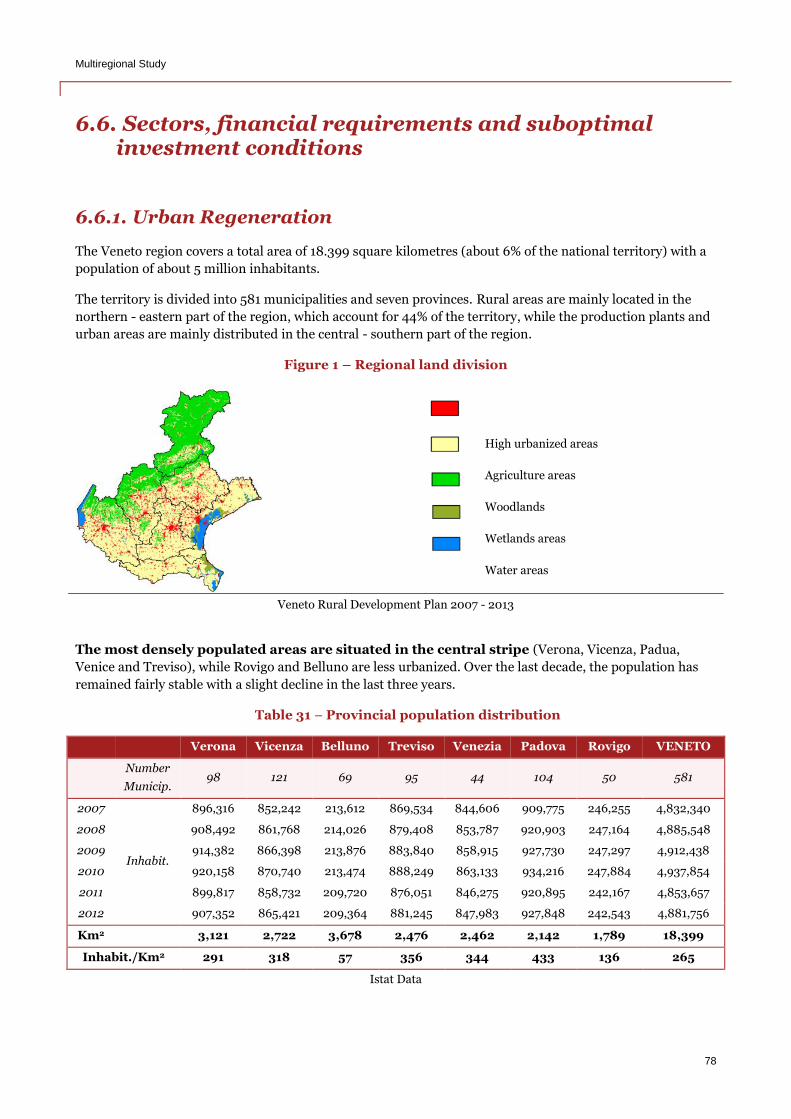
Multiregional Study
78
6.6. Sectors, financial requirements and suboptimal investment conditions
6.6.1. Urban Regeneration
The Veneto region covers a total area of 18.399 square kilometres (about 6% of the national territory) with a
population of about 5 million inhabitants.
The territory is divided into 581 municipalities and seven provinces. Rural areas are mainly located in the
northern - eastern part of the region, which account for 44% of the territory, while the production plants and
urban areas are mainly distributed in the central - southern part of the region.
Figure 1 – Regional land division
Veneto Rural Development Plan 2007 - 2013
The most densely populated areas are situated in the central stripe (Verona, Vicenza, Padua,
Venice and Treviso), while Rovigo and Belluno are less urbanized. Over the last decade, the population has
remained fairly stable with a slight decline in the last three years.
Table 31 – Provincial population distribution
Verona Vicenza Belluno Treviso Venezia Padova Rovigo VENETO
Number
Municip. 98 121 69 95 44 104 50 581
2007
Inhabit.
896,316 852,242 213,612 869,534 844,606 909,775 246,255 4,832,340
2008 908,492 861,768 214,026 879,408 853,787 920,903 247,164 4,885,548
2009 914,382 866,398 213,876 883,840 858,915 927,730 247,297 4,912,438
2010 920,158 870,740 213,474 888,249 863,133 934,216 247,884 4,937,854
2011 899,817 858,732 209,720 876,051 846,275 920,895 242,167 4,853,657
2012 907,352 865,421 209,364 881,245 847,983 927,848 242,543 4,881,756
Km2
3,121 2,722 3,678 2,476 2,462 2,142 1,789 18,399
Inhabit./Km2 291 318 57 356 344 433 136 265
Istat Data
High urbanized areas
Agriculture areas
Woodlands
Wetlands areas
Water areas

Multiregional Study
79
Demography
Over the last decade the composition of the population has been almost stable, the percentage of the active
population is about 66,70% of the total, while the share of over- 65 and under - 14 remained respectively
19.80% and 14.00%.
Table 32 – Population distribution
Istat data
However, as highlighted in the table above, the internal variation in the active population has been
significant. In particular, despite the “aging index” and the “Index of the active population replacement”
have been quite stationary, the working age is shifting more and more towards the top and the
generational change is not adequately compensated (i.e. the “index of the active population
structure” shows that there are more old workers and less young workers).
Table 33 – Demographic indicators
Year Aging Index 53 Index of structural
dependency 54 Index of the active
population replacement 55 Index of the active
population structure56
2002 135.20 46.60 134.30 95.30
2012 144.20 53.90 134.20 126.60
Var. 2012/2002 7.00% 15.00% 0.00% 33.00%
ISTAT 2012
53 Aging index = (population over 65)/(population under 14) 54 Index of structural dependency = (population over 65 + population under 14)/(population between 15-64) 55 Index of the active population replacement = (population 55-64)/(population 15-24) 56 Index of the active population structure = (population 40 - 64)/(population 15 - 39)
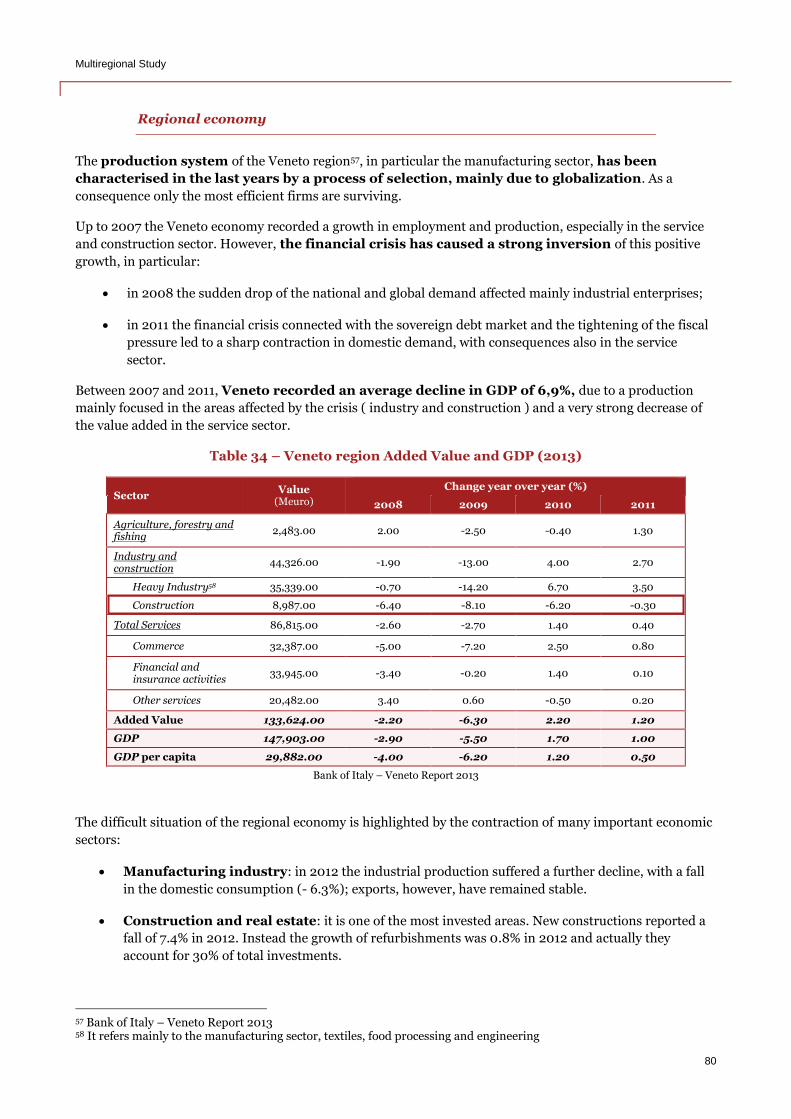
Multiregional Study
80
Regional economy
The production system of the Veneto region57, in particular the manufacturing sector, has been
characterised in the last years by a process of selection, mainly due to globalization. As a
consequence only the most efficient firms are surviving.
Up to 2007 the Veneto economy recorded a growth in employment and production, especially in the service
and construction sector. However, the financial crisis has caused a strong inversion of this positive
growth, in particular:
in 2008 the sudden drop of the national and global demand affected mainly industrial enterprises;
in 2011 the financial crisis connected with the sovereign debt market and the tightening of the fiscal
pressure led to a sharp contraction in domestic demand, with consequences also in the service
sector.
Between 2007 and 2011, Veneto recorded an average decline in GDP of 6,9%, due to a production
mainly focused in the areas affected by the crisis ( industry and construction ) and a very strong decrease of
the value added in the service sector.
Table 34 – Veneto region Added Value and GDP (2013)
Sector Value
(Meuro)
Change year over year (%)
2008 2009 2010 2011
Agriculture, forestry and fishing
2,483.00 2.00 -2.50 -0.40 1.30
Industry and construction
44,326.00 -1.90 -13.00 4.00 2.70
Heavy Industry58 35,339.00 -0.70 -14.20 6.70 3.50
Construction 8,987.00 -6.40 -8.10 -6.20 -0.30
Total Services 86,815.00 -2.60 -2.70 1.40 0.40
Commerce 32,387.00 -5.00 -7.20 2.50 0.80
Financial and insurance activities
33,945.00 -3.40 -0.20 1.40 0.10
Other services 20,482.00 3.40 0.60 -0.50 0.20
Added Value 133,624.00 -2.20 -6.30 2.20 1.20
GDP 147,903.00 -2.90 -5.50 1.70 1.00
GDP per capita 29,882.00 -4.00 -6.20 1.20 0.50
Bank of Italy – Veneto Report 2013
The difficult situation of the regional economy is highlighted by the contraction of many important economic
sectors:
Manufacturing industry: in 2012 the industrial production suffered a further decline, with a fall
in the domestic consumption (- 6.3%); exports, however, have remained stable.
Construction and real estate: it is one of the most invested areas. New constructions reported a
fall of 7.4% in 2012. Instead the growth of refurbishments was 0.8% in 2012 and actually they
account for 30% of total investments.
57 Bank of Italy – Veneto Report 2013 58 It refers mainly to the manufacturing sector, textiles, food processing and engineering
Multiregional Study
81
Services: the weakness of the domestic demand had a negative impact on firms, which are
experiencing declining revenues and turnovers (-4.8%). However, hospitality is one of the few areas
not affected by the decline in consumption.
Urban Development initiatives
The urban recovery and development are central issues in European and national policy. In the Veneto
region, as a result of its strong industrial urbanization, there are at least 95 areas at high industrial
risk. Most of them are located in the most populated zones, in particular in the urban belt of Padua,
Verona, Vicenza and in the industrial area of Porto Marghera.
One of the objectives outlined in the ROP was the recovery and development of degraded areas near urban
centres. Axis 3 "Environment and development of the territory" has been dedicated to the solution of this
issue with the aim of protecting the environment in order to:
contain the negative externalities of industrial activities ;
save and recover the soil;
reduce the consumption of environmental resources ;
enhance the cultural and environmental heritage for economic purposes.
The axis was divided in two operational objectives:
3.1 stimulating investment for the recovery of the environment and the development of
measures to prevent and manage natural and technological risks: beneficiaries were local
authorities and public institutions. The target was:
o Remediation of contaminated sites, including industrial sites no longer in use;
o Environmental protection, soil conservation and control of technological risks.
3.2 enhancement and promotion of cultural heritage: this objective focused on the development
of cultural networks and the preservation of cultural identity.
The total amount of resources (objective 3.1) was about 30.00 Meuro and two typologies of actions
were financed:
Action 3.1.1 - detection, characterization and remediation of soil, pollution of underground and
surface water and environmental regeneration of polluted areas;
Action 3.1.2 - reduction, monitoring and mitigation of flood risk, realization of controlled flooding
areas, water drainage and restoration works morphological and environmental waterways,
interventions of coastal defences and interventions to prevent the risk of landslides and avalanches.
At December 31, 2012, the legally binding commitments amounted to 45.00 Meuro, while
payments were about 25.00 Meuro. The majority of interventions were focused on the recovery of
soil, rather than the redevelopment of brownfield sites. Indeed, this subject is central to the Regional
Territorial Coordination Plan of 2013. Its task is to provide an overview of the constraints and
opportunities for the development of the regional territory. Some of its the priorities are:
reorganization of Regional Landscape Plans, Natural Parks Plans, Environmental Plans;
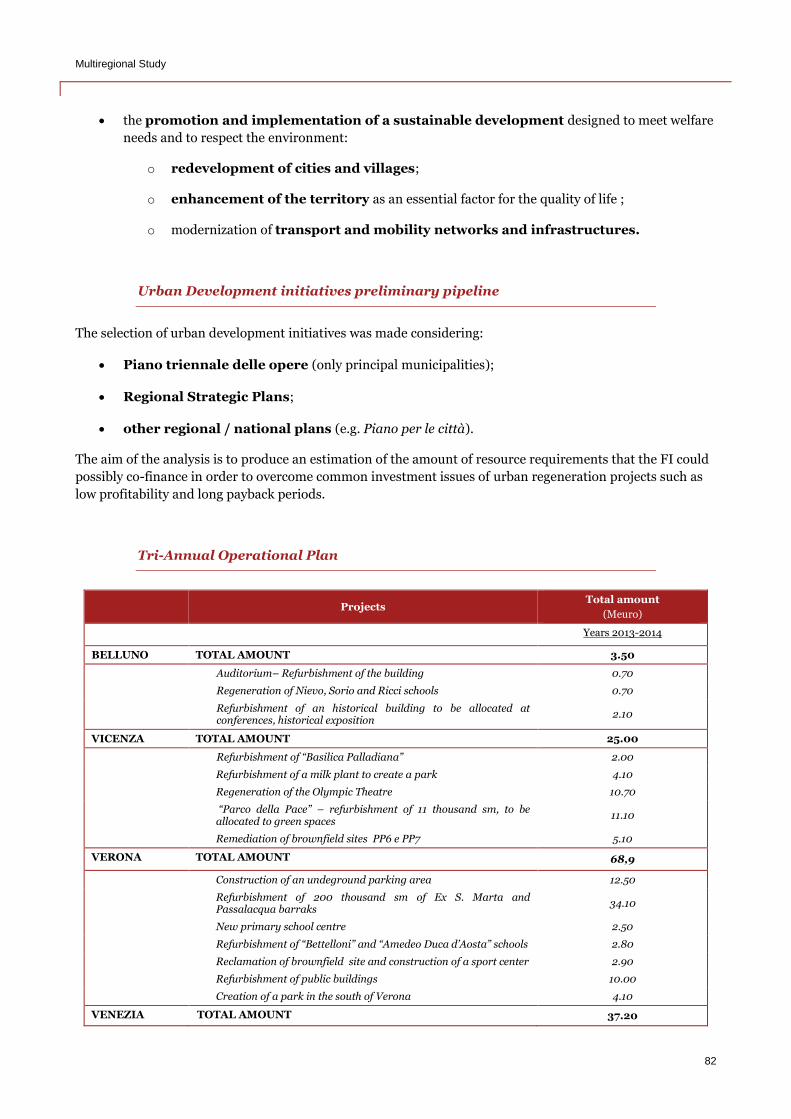
Multiregional Study
82
the promotion and implementation of a sustainable development designed to meet welfare
needs and to respect the environment:
o redevelopment of cities and villages;
o enhancement of the territory as an essential factor for the quality of life ;
o modernization of transport and mobility networks and infrastructures.
Urban Development initiatives preliminary pipeline
The selection of urban development initiatives was made considering:
Piano triennale delle opere (only principal municipalities);
Regional Strategic Plans;
other regional / national plans (e.g. Piano per le città).
The aim of the analysis is to produce an estimation of the amount of resource requirements that the FI could
possibly co-finance in order to overcome common investment issues of urban regeneration projects such as
low profitability and long payback periods.
Tri-Annual Operational Plan
Projects Total amount
(Meuro)
Years 2013-2014
BELLUNO TOTAL AMOUNT 3.50
Auditorium– Refurbishment of the building 0.70
Regeneration of Nievo, Sorio and Ricci schools 0.70
Refurbishment of an historical building to be allocated at conferences, historical exposition
2.10
VICENZA TOTAL AMOUNT 25.00
Refurbishment of “Basilica Palladiana” 2.00
Refurbishment of a milk plant to create a park 4.10
Regeneration of the Olympic Theatre 10.70
“Parco della Pace” – refurbishment of 11 thousand sm, to be allocated to green spaces
11.10
Remediation of brownfield sites PP6 e PP7 5.10
VERONA TOTAL AMOUNT 68,9
Construction of an undeground parking area 12.50
Refurbishment of 200 thousand sm of Ex S. Marta and Passalacqua barraks
34.10
New primary school centre 2.50
Refurbishment of “Bettelloni” and “Amedeo Duca d’Aosta” schools 2.80
Reclamation of brownfield site and construction of a sport center 2.90
Refurbishment of public buildings 10.00
Creation of a park in the south of Verona 4.10
VENEZIA TOTAL AMOUNT 37.20
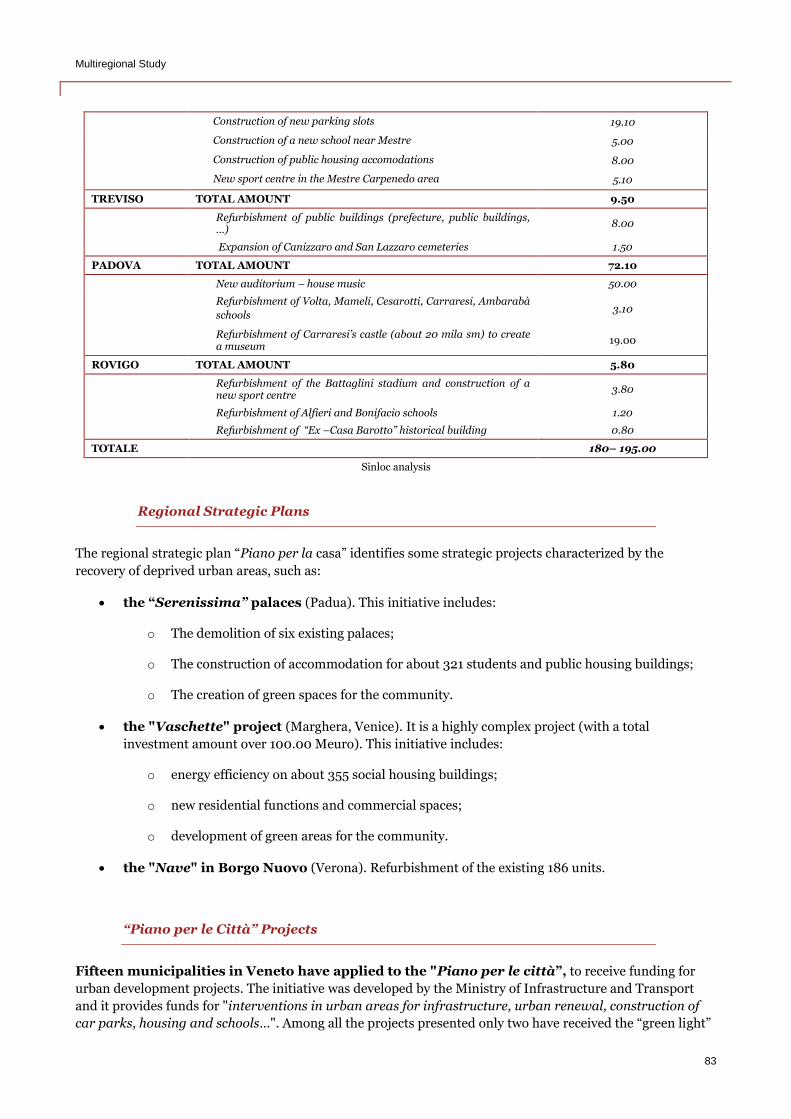
Multiregional Study
83
Construction of new parking slots 19.10
Construction of a new school near Mestre 5.00
Construction of public housing accomodations 8.00
New sport centre in the Mestre Carpenedo area 5.10
TREVISO TOTAL AMOUNT 9.50
Refurbishment of public buildings (prefecture, public buildings, …)
8.00
Expansion of Canizzaro and San Lazzaro cemeteries 1.50
PADOVA TOTAL AMOUNT 72.10
New auditorium – house music 50.00
Refurbishment of Volta, Mameli, Cesarotti, Carraresi, Ambarabà
schools 3.10
Refurbishment of Carraresi’s castle (about 20 mila sm) to create a museum
19.00
ROVIGO TOTAL AMOUNT 5.80
Refurbishment of the Battaglini stadium and construction of a new sport centre
3.80
Refurbishment of Alfieri and Bonifacio schools 1.20
Refurbishment of “Ex –Casa Barotto” historical building 0.80
TOTALE 180– 195.00
Sinloc analysis
Regional Strategic Plans
The regional strategic plan “Piano per la casa” identifies some strategic projects characterized by the
recovery of deprived urban areas, such as:
the “Serenissima” palaces (Padua). This initiative includes:
o The demolition of six existing palaces;
o The construction of accommodation for about 321 students and public housing buildings;
o The creation of green spaces for the community.
the "Vaschette" project (Marghera, Venice). It is a highly complex project (with a total
investment amount over 100.00 Meuro). This initiative includes:
o energy efficiency on about 355 social housing buildings;
o new residential functions and commercial spaces;
o development of green areas for the community.
the "Nave" in Borgo Nuovo (Verona). Refurbishment of the existing 186 units.
“Piano per le Città” Projects
Fifteen municipalities in Veneto have applied to the "Piano per le città”, to receive funding for
urban development projects. The initiative was developed by the Ministry of Infrastructure and Transport
and it provides funds for "interventions in urban areas for infrastructure, urban renewal, construction of
car parks, housing and schools…". Among all the projects presented only two have received the “green light”
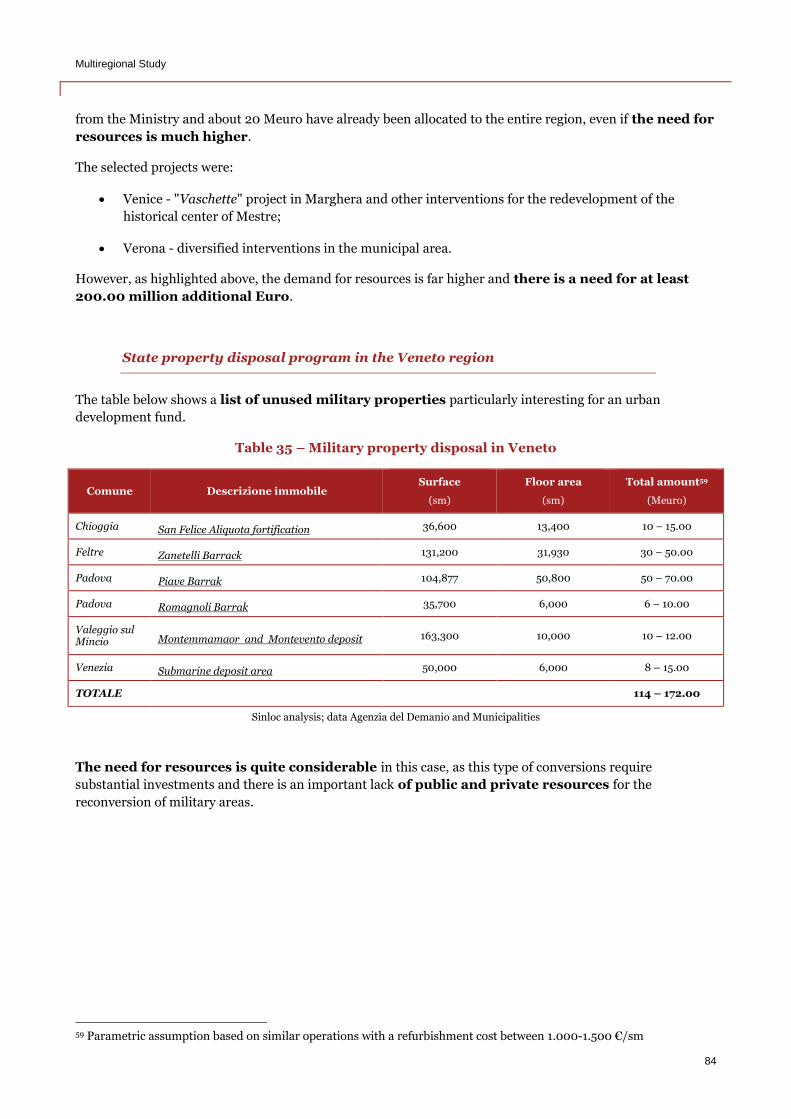
Multiregional Study
84
from the Ministry and about 20 Meuro have already been allocated to the entire region, even if the need for
resources is much higher.
The selected projects were:
Venice - "Vaschette" project in Marghera and other interventions for the redevelopment of the
historical center of Mestre;
Verona - diversified interventions in the municipal area.
However, as highlighted above, the demand for resources is far higher and there is a need for at least
200.00 million additional Euro.
State property disposal program in the Veneto region
The table below shows a list of unused military properties particularly interesting for an urban
development fund.
Table 35 – Military property disposal in Veneto
Comune Descrizione immobile Surface
(sm)
Floor area
(sm)
Total amount59
(Meuro)
Chioggia San Felice Aliquota fortification 36,600 13,400 10 – 15.00
Feltre Zanetelli Barrack 131,200 31,930 30 – 50.00
Padova Piave Barrak 104,877 50,800 50 – 70.00
Padova Romagnoli Barrak 35,700 6,000 6 – 10.00
Valeggio sul Mincio Montemmamaor and Montevento deposit 163,300 10,000 10 – 12.00
Venezia Submarine deposit area 50,000 6,000 8 – 15.00
TOTALE 114 – 172.00
Sinloc analysis; data Agenzia del Demanio and Municipalities
The need for resources is quite considerable in this case, as this type of conversions require
substantial investments and there is an important lack of public and private resources for the
reconversion of military areas.
59 Parametric assumption based on similar operations with a refurbishment cost between 1.000-1.500 €/sm
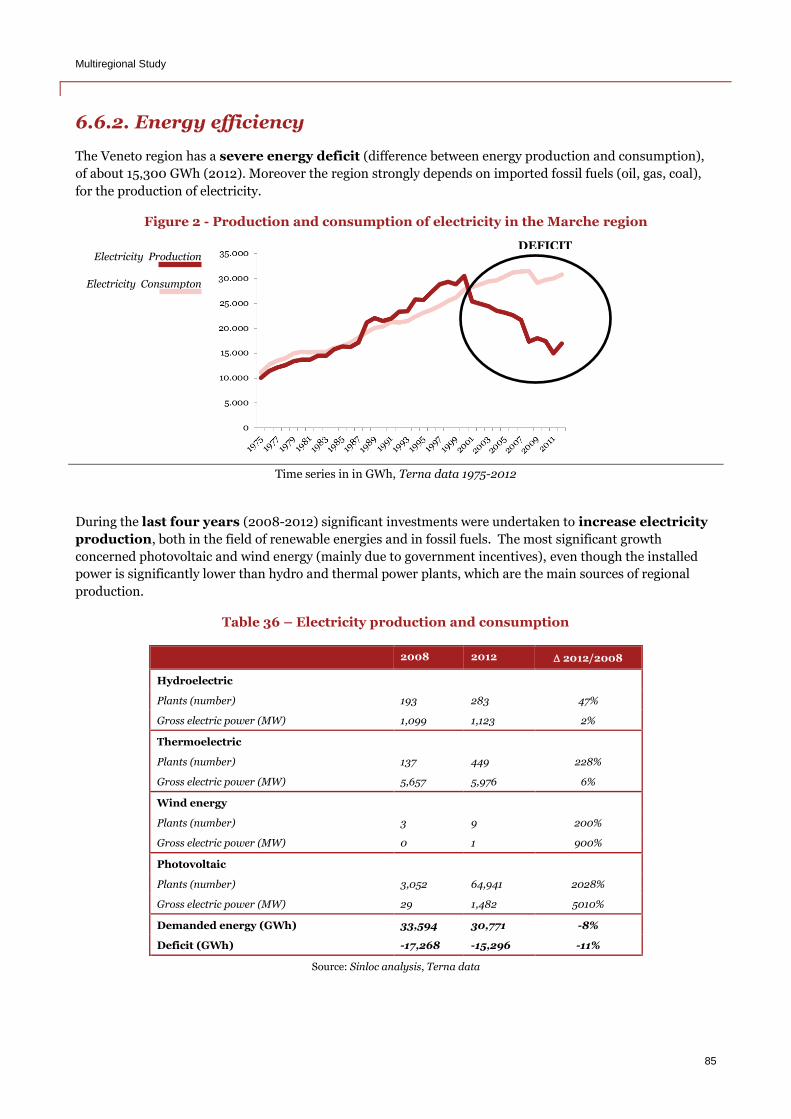
Multiregional Study
85
6.6.2. Energy efficiency
The Veneto region has a severe energy deficit (difference between energy production and consumption),
of about 15,300 GWh (2012). Moreover the region strongly depends on imported fossil fuels (oil, gas, coal),
for the production of electricity.
Figure 2 - Production and consumption of electricity in the Marche region
Time series in in GWh, Terna data 1975-2012
During the last four years (2008-2012) significant investments were undertaken to increase electricity
production, both in the field of renewable energies and in fossil fuels. The most significant growth
concerned photovoltaic and wind energy (mainly due to government incentives), even though the installed
power is significantly lower than hydro and thermal power plants, which are the main sources of regional
production.
Table 36 – Electricity production and consumption
2008 2012 2012/2008
Hydroelectric
Plants (number) 193 283 47%
Gross electric power (MW) 1,099 1,123 2%
Thermoelectric
Plants (number) 137 449 228%
Gross electric power (MW) 5,657 5,976 6%
Wind energy
Plants (number) 3 9 200%
Gross electric power (MW) 0 1 900%
Photovoltaic
Plants (number) 3,052 64,941 2028%
Gross electric power (MW) 29 1,482 5010%
Demanded energy (GWh) 33,594 30,771 -8%
Deficit (GWh) -17,268 -15,296 -11%
Source: Sinloc analysis, Terna data
Electricity Production
Electricity Consumpton
DEFICIT
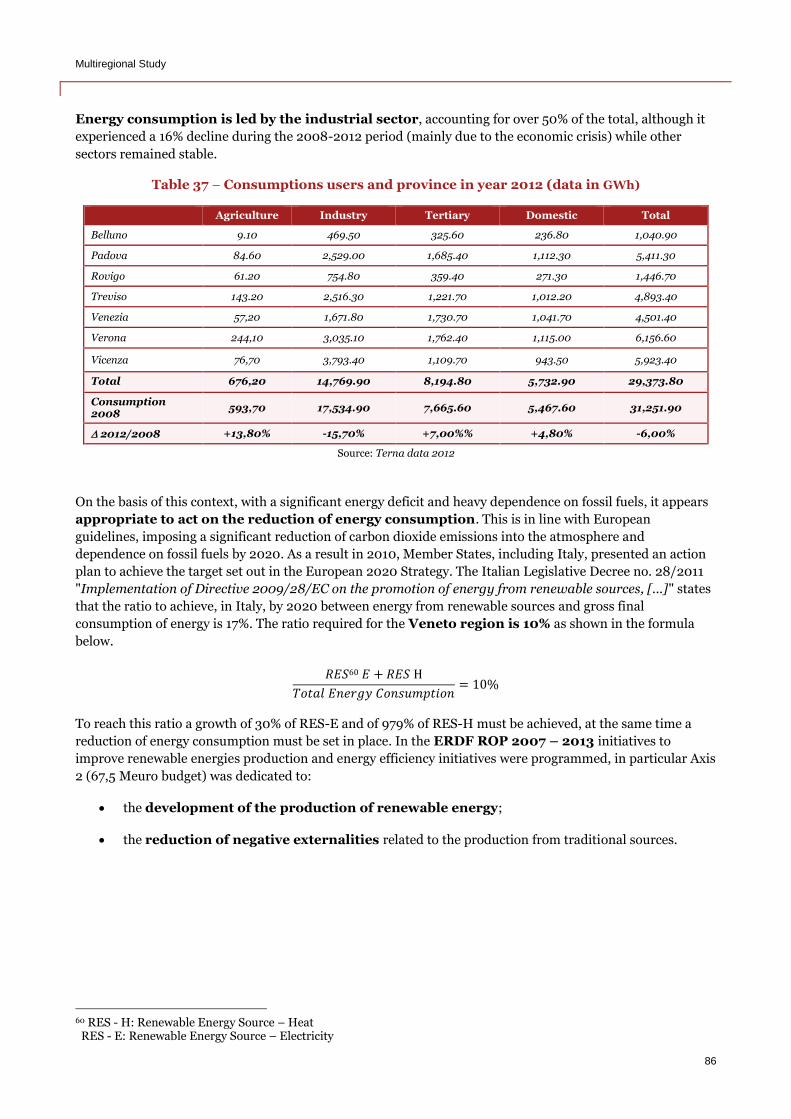
Multiregional Study
86
Energy consumption is led by the industrial sector, accounting for over 50% of the total, although it
experienced a 16% decline during the 2008-2012 period (mainly due to the economic crisis) while other
sectors remained stable.
Table 37 – Consumptions users and province in year 2012 (data in GWh)
Agriculture Industry Tertiary Domestic Total
Belluno 9.10 469.50 325.60 236.80 1,040.90
Padova 84.60 2,529.00 1,685.40 1,112.30 5,411.30
Rovigo 61.20 754.80 359.40 271.30 1,446.70
Treviso 143.20 2,516.30 1,221.70 1,012.20 4,893.40
Venezia 57,20 1,671.80 1,730.70 1,041.70 4,501.40
Verona 244,10 3,035.10 1,762.40 1,115.00 6,156.60
Vicenza 76,70 3,793.40 1,109.70 943.50 5,923.40
Total 676,20 14,769.90 8,194.80 5,732.90 29,373.80
Consumption 2008
593,70 17,534.90 7,665.60 5,467.60 31,251.90
2012/2008 +13,80% -15,70% +7,00%% +4,80% -6,00%
Source: Terna data 2012
On the basis of this context, with a significant energy deficit and heavy dependence on fossil fuels, it appears
appropriate to act on the reduction of energy consumption. This is in line with European
guidelines, imposing a significant reduction of carbon dioxide emissions into the atmosphere and
dependence on fossil fuels by 2020. As a result in 2010, Member States, including Italy, presented an action
plan to achieve the target set out in the European 2020 Strategy. The Italian Legislative Decree no. 28/2011
"Implementation of Directive 2009/28/EC on the promotion of energy from renewable sources, [...]" states
that the ratio to achieve, in Italy, by 2020 between energy from renewable sources and gross final
consumption of energy is 17%. The ratio required for the Veneto region is 10% as shown in the formula
below.
60
To reach this ratio a growth of 30% of RES-E and of 979% of RES-H must be achieved, at the same time a
reduction of energy consumption must be set in place. In the ERDF ROP 2007 – 2013 initiatives to
improve renewable energies production and energy efficiency initiatives were programmed, in particular Axis
2 (67,5 Meuro budget) was dedicated to:
the development of the production of renewable energy;
the reduction of negative externalities related to the production from traditional sources.
60 RES - H: Renewable Energy Source – Heat RES - E: Renewable Energy Source – Electricity
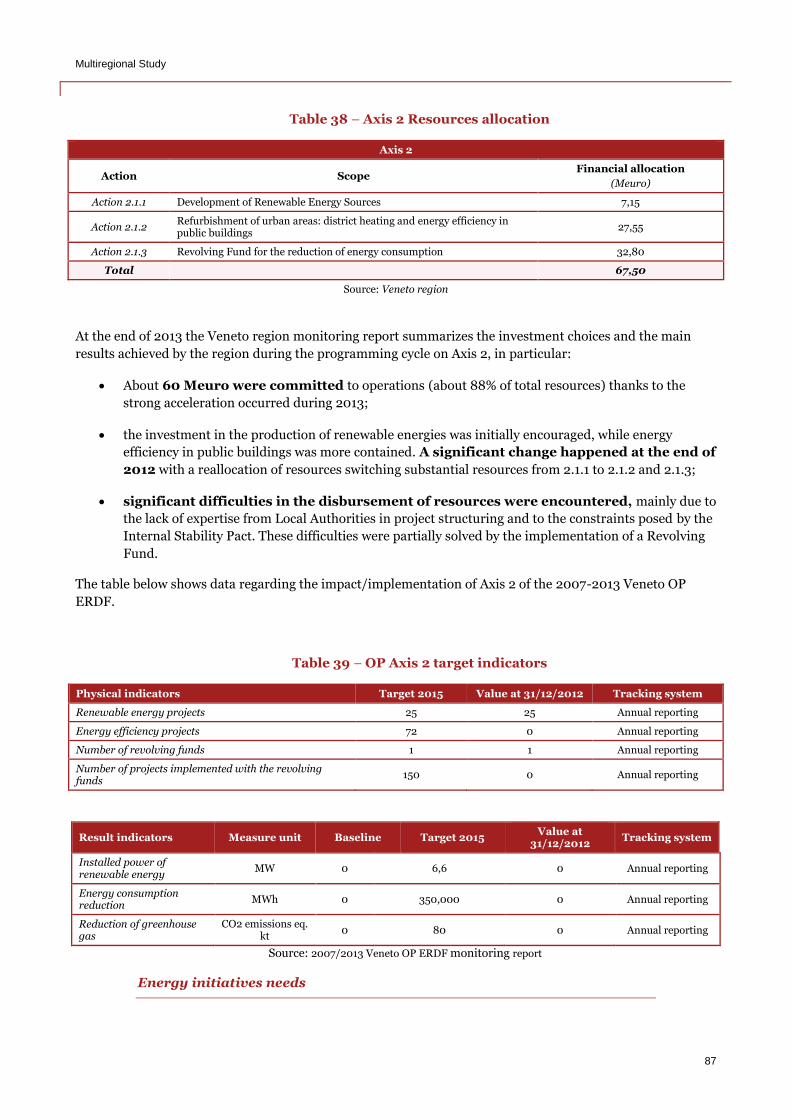
Multiregional Study
87
Table 38 – Axis 2 Resources allocation
Axis 2
Action Scope Financial allocation
(Meuro)
Action 2.1.1 Development of Renewable Energy Sources 7,15
Action 2.1.2 Refurbishment of urban areas: district heating and energy efficiency in public buildings
27,55
Action 2.1.3 Revolving Fund for the reduction of energy consumption 32,80
Total 67,50
Source: Veneto region
At the end of 2013 the Veneto region monitoring report summarizes the investment choices and the main
results achieved by the region during the programming cycle on Axis 2, in particular:
About 60 Meuro were committed to operations (about 88% of total resources) thanks to the
strong acceleration occurred during 2013;
the investment in the production of renewable energies was initially encouraged, while energy
efficiency in public buildings was more contained. A significant change happened at the end of
2012 with a reallocation of resources switching substantial resources from 2.1.1 to 2.1.2 and 2.1.3;
significant difficulties in the disbursement of resources were encountered, mainly due to
the lack of expertise from Local Authorities in project structuring and to the constraints posed by the
Internal Stability Pact. These difficulties were partially solved by the implementation of a Revolving
Fund.
The table below shows data regarding the impact/implementation of Axis 2 of the 2007-2013 Veneto OP
ERDF.
Table 39 – OP Axis 2 target indicators
Physical indicators Target 2015 Value at 31/12/2012 Tracking system
Renewable energy projects 25 25 Annual reporting
Energy efficiency projects 72 0 Annual reporting
Number of revolving funds 1 1 Annual reporting
Number of projects implemented with the revolving funds
150 0 Annual reporting
Result indicators Measure unit Baseline Target 2015 Value at
31/12/2012 Tracking system
Installed power of renewable energy
MW 0 6,6 0 Annual reporting
Energy consumption reduction
MWh 0 350,000 0 Annual reporting
Reduction of greenhouse gas
CO2 emissions eq. kt
0 80 0 Annual reporting
Source: 2007/2013 Veneto OP ERDF monitoring report
Energy initiatives needs

Multiregional Study
88
As reported in previous paragraphs, the Veneto region intends to focus the FI strategy in the 2014 - 2020
programming period on energy efficiency initiatives, in particular on:
public lighting system
public buildings
o public housing managed by ATER (Agenzia Territoriale Edilizia Residenziale) and
Municipalities;
o Other public buildings (e.g. public offices, schools, etc.)
These actions have significant positive externalities, thus ensuring: reduction of energy costs for
public administration and better comfort to final users.
These initiatives usually present economic and financial sustainability issues; indeed public
intervention is often required and the support of Financial Instruments can play a role through grants,
subsidized loans and guarantees.
In the following paragraph some preliminary investment amounts for each area of intervention
are quantified.
Public lighting
Even in the absence of a detailed map for the consumption of light spots, it is possible to quantify the number
and the consumption of light points on the region using parametric analysis together with the potential need
for intervention. In particular the following hypothesis and computation were made:
assuming an average number of 4 - 5 inhabitants per light point, the number of light points at
regional level is between 900 thousand and 1 million;
the type of used lamps can be divided as follows:
o High pressure sodium, accounting for 50% of installed capacity ;
o mercury lamps, accounting for 42% of installed capacity ;
o Metal iodide lamps, accounting for 6% of installed capacity ;
o Other types of lamps (fluorescent, incandescent, mixed light, low-pressure sodium and LED)
play a negligible part.
Through the replacement of mercury lamps, which have a high energy consumption and a low luminous
efficiency, with modern lighting systems like LED or High Pressure Sodium, an average savings of 30-40 %
on current consumption could be achieved.
In order to estimate the needs for intervention, the following assumptions were made:
substitution of 40% of the regional light points (e.g. the totality of mercury vapour light
points);
cost of intervention between 150-200 Euro for the replacement of the lamp body61.
On this basis a total investment of 60-80.00 Meuro can be estimated in public lighting initiatives.
61 This value is inclusive of all costs
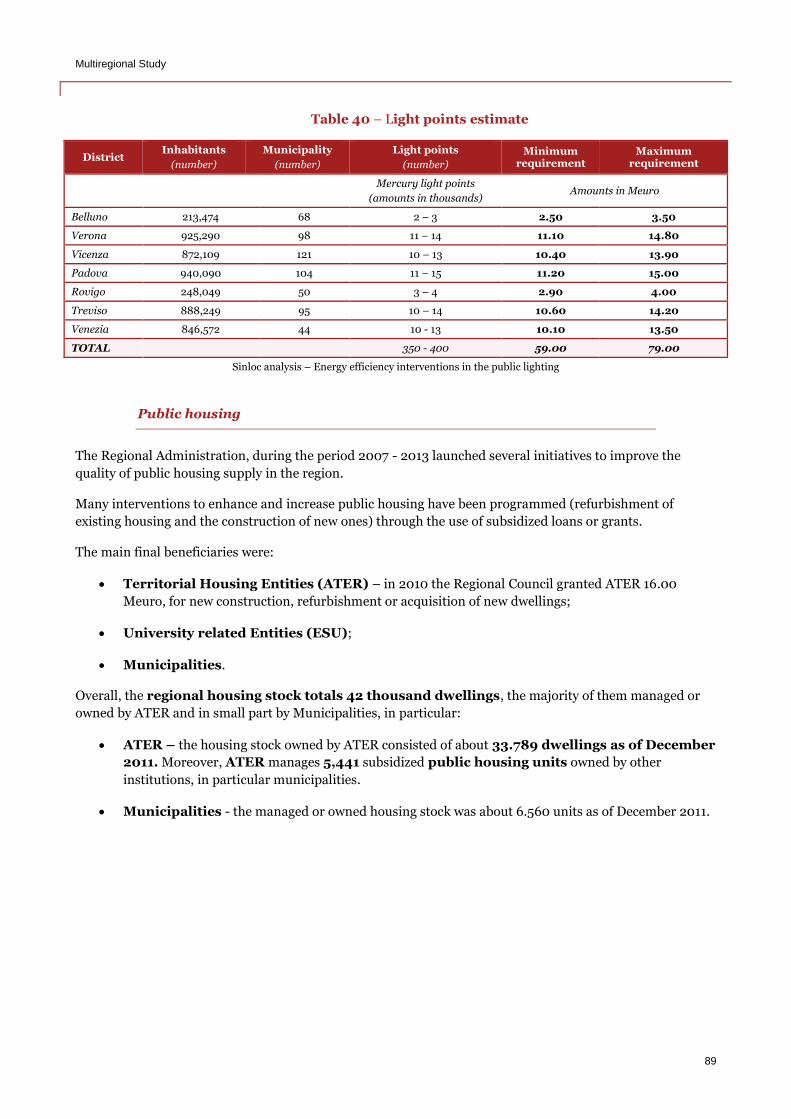
Multiregional Study
89
Table 40 – Light points estimate
District Inhabitants
(number)
Municipality
(number)
Light points
(number)
Minimum requirement
Maximum requirement
Mercury light points
(amounts in thousands) Amounts in Meuro
Belluno 213,474 68 2 – 3 2.50 3.50
Verona 925,290 98 11 – 14 11.10 14.80
Vicenza 872,109 121 10 – 13 10.40 13.90
Padova 940,090 104 11 – 15 11.20 15.00
Rovigo 248,049 50 3 – 4 2.90 4.00
Treviso 888,249 95 10 – 14 10.60 14.20
Venezia 846,572 44 10 - 13 10.10 13.50
TOTAL
350 - 400 59.00 79.00
Sinloc analysis – Energy efficiency interventions in the public lighting
Public housing
The Regional Administration, during the period 2007 - 2013 launched several initiatives to improve the
quality of public housing supply in the region.
Many interventions to enhance and increase public housing have been programmed (refurbishment of
existing housing and the construction of new ones) through the use of subsidized loans or grants.
The main final beneficiaries were:
Territorial Housing Entities (ATER) – in 2010 the Regional Council granted ATER 16.00
Meuro, for new construction, refurbishment or acquisition of new dwellings;
University related Entities (ESU);
Municipalities.
Overall, the regional housing stock totals 42 thousand dwellings, the majority of them managed or
owned by ATER and in small part by Municipalities, in particular:
ATER – the housing stock owned by ATER consisted of about 33.789 dwellings as of December
2011. Moreover, ATER manages 5,441 subsidized public housing units owned by other
institutions, in particular municipalities.
Municipalities - the managed or owned housing stock was about 6.560 units as of December 2011.
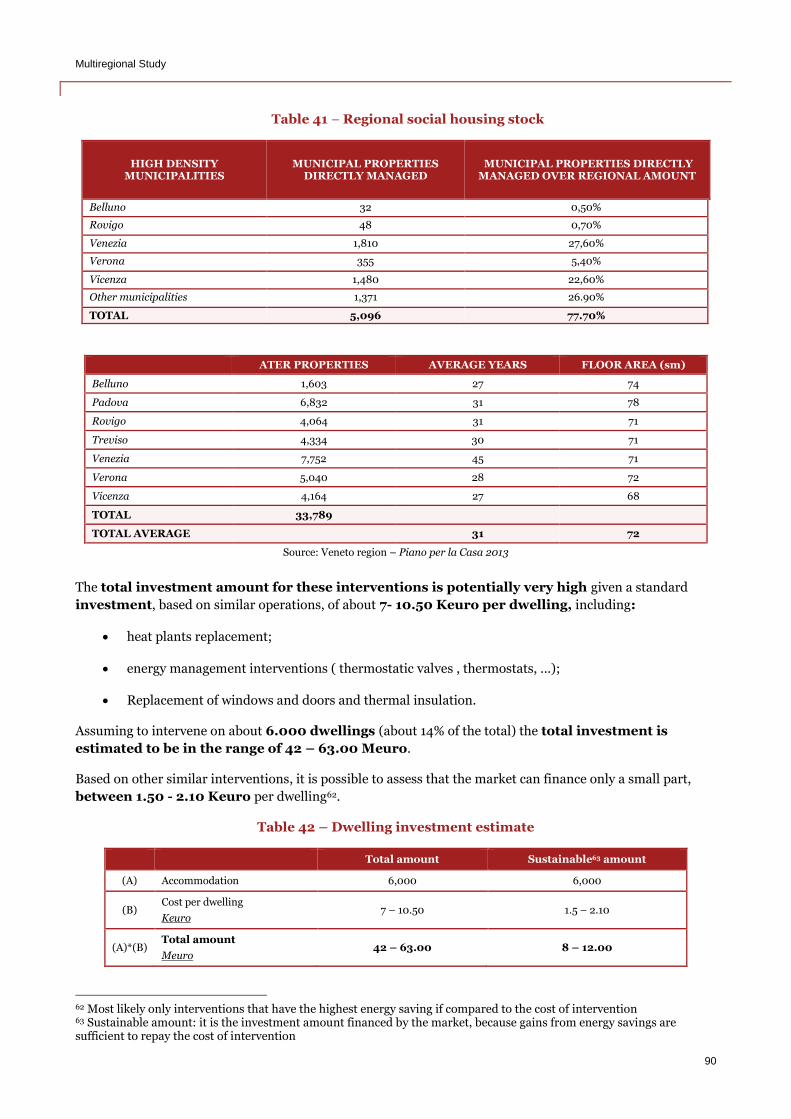
Multiregional Study
90
Table 41 – Regional social housing stock
HIGH DENSITY MUNICIPALITIES
MUNICIPAL PROPERTIES DIRECTLY MANAGED
MUNICIPAL PROPERTIES DIRECTLY MANAGED OVER REGIONAL AMOUNT
Belluno 32 0,50%
Rovigo 48 0,70%
Venezia 1,810 27,60%
Verona 355 5,40%
Vicenza 1,480 22,60%
Other municipalities 1,371 26.90%
TOTAL 5,096 77.70%
ATER PROPERTIES AVERAGE YEARS FLOOR AREA (sm)
Belluno 1,603 27 74
Padova 6,832 31 78
Rovigo 4,064 31 71
Treviso 4,334 30 71
Venezia 7,752 45 71
Verona 5,040 28 72
Vicenza 4,164 27 68
TOTAL 33,789
TOTAL AVERAGE 31 72
Source: Veneto region – Piano per la Casa 2013
The total investment amount for these interventions is potentially very high given a standard
investment, based on similar operations, of about 7- 10.50 Keuro per dwelling, including:
heat plants replacement;
energy management interventions ( thermostatic valves , thermostats, ...);
Replacement of windows and doors and thermal insulation.
Assuming to intervene on about 6.000 dwellings (about 14% of the total) the total investment is
estimated to be in the range of 42 – 63.00 Meuro.
Based on other similar interventions, it is possible to assess that the market can finance only a small part,
between 1.50 - 2.10 Keuro per dwelling62.
Table 42 – Dwelling investment estimate
Total amount Sustainable63 amount
(A) Accommodation 6,000 6,000
(B) Cost per dwelling
Keuro 7 – 10.50 1.5 – 2.10
(A)*(B) Total amount
Meuro 42 – 63.00 8 – 12.00
62 Most likely only interventions that have the highest energy saving if compared to the cost of intervention 63 Sustainable amount: it is the investment amount financed by the market, because gains from energy savings are sufficient to repay the cost of intervention
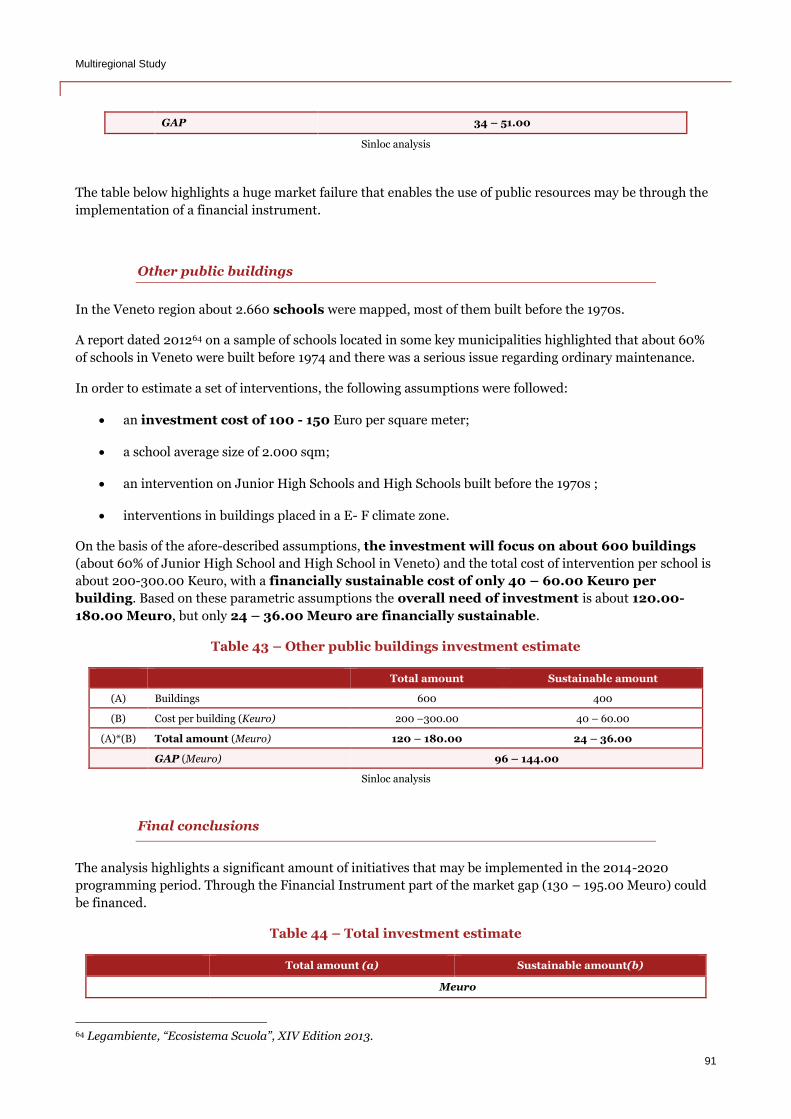
Multiregional Study
91
GAP 34 – 51.00
Sinloc analysis
The table below highlights a huge market failure that enables the use of public resources may be through the
implementation of a financial instrument.
Other public buildings
In the Veneto region about 2.660 schools were mapped, most of them built before the 1970s.
A report dated 201264 on a sample of schools located in some key municipalities highlighted that about 60%
of schools in Veneto were built before 1974 and there was a serious issue regarding ordinary maintenance.
In order to estimate a set of interventions, the following assumptions were followed:
an investment cost of 100 - 150 Euro per square meter;
a school average size of 2.000 sqm;
an intervention on Junior High Schools and High Schools built before the 1970s ;
interventions in buildings placed in a E- F climate zone.
On the basis of the afore-described assumptions, the investment will focus on about 600 buildings
(about 60% of Junior High School and High School in Veneto) and the total cost of intervention per school is
about 200-300.00 Keuro, with a financially sustainable cost of only 40 – 60.00 Keuro per
building. Based on these parametric assumptions the overall need of investment is about 120.00-
180.00 Meuro, but only 24 – 36.00 Meuro are financially sustainable.
Table 43 – Other public buildings investment estimate
Total amount Sustainable amount
(A) Buildings 600 400
(B) Cost per building (Keuro) 200 –300.00 40 – 60.00
(A)*(B) Total amount (Meuro) 120 – 180.00 24 – 36.00
GAP (Meuro) 96 – 144.00
Sinloc analysis
Final conclusions
The analysis highlights a significant amount of initiatives that may be implemented in the 2014-2020
programming period. Through the Financial Instrument part of the market gap (130 – 195.00 Meuro) could
be financed.
Table 44 – Total investment estimate
Total amount (a) Sustainable amount(b)
Meuro
64 Legambiente, “Ecosistema Scuola”, XIV Edition 2013.
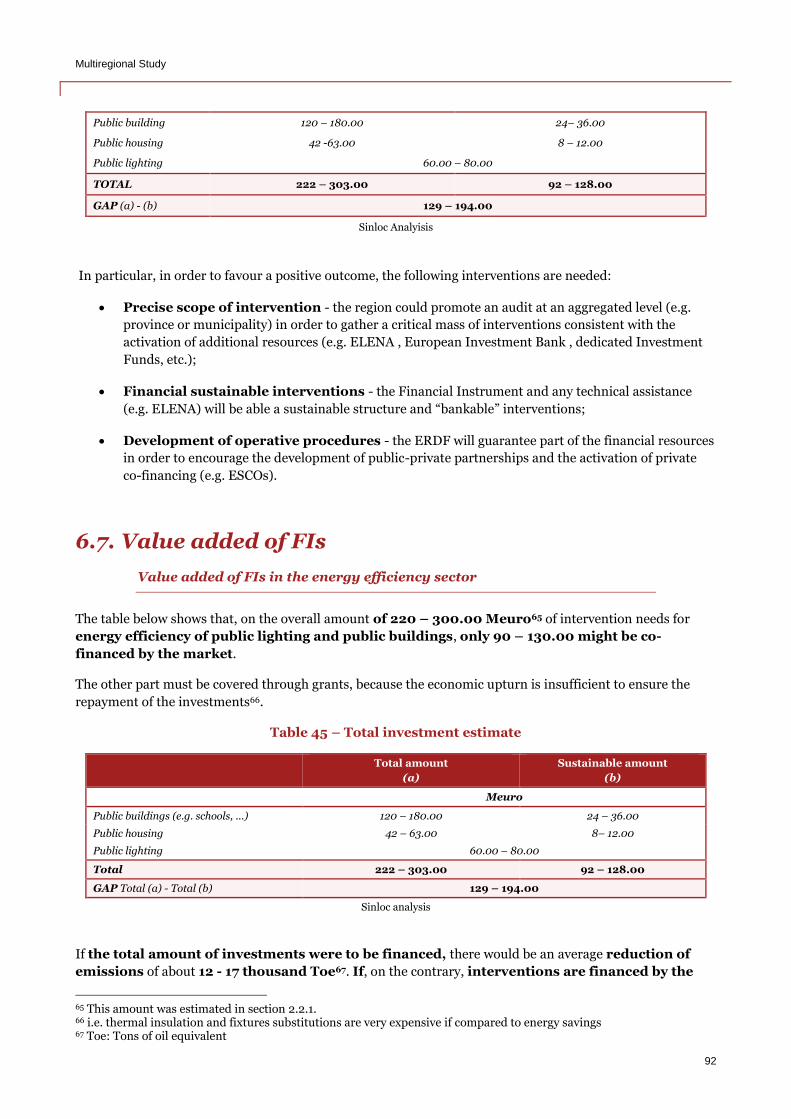
Multiregional Study
92
Public building 120 – 180.00 24– 36.00
Public housing 42 -63.00 8 – 12.00
Public lighting 60.00 – 80.00
TOTAL 222 – 303.00 92 – 128.00
GAP (a) - (b) 129 – 194.00
Sinloc Analyisis
In particular, in order to favour a positive outcome, the following interventions are needed:
Precise scope of intervention - the region could promote an audit at an aggregated level (e.g.
province or municipality) in order to gather a critical mass of interventions consistent with the
activation of additional resources (e.g. ELENA , European Investment Bank , dedicated Investment
Funds, etc.);
Financial sustainable interventions - the Financial Instrument and any technical assistance
(e.g. ELENA) will be able a sustainable structure and “bankable” interventions;
Development of operative procedures - the ERDF will guarantee part of the financial resources
in order to encourage the development of public-private partnerships and the activation of private
co-financing (e.g. ESCOs).
6.7. Value added of FIs
Value added of FIs in the energy efficiency sector
The table below shows that, on the overall amount of 220 – 300.00 Meuro65 of intervention needs for
energy efficiency of public lighting and public buildings, only 90 – 130.00 might be co-
financed by the market.
The other part must be covered through grants, because the economic upturn is insufficient to ensure the
repayment of the investments66.
Table 45 – Total investment estimate
Total amount
(a)
Sustainable amount
(b)
Meuro
Public buildings (e.g. schools, ...) 120 – 180.00 24 – 36.00
Public housing 42 – 63.00 8– 12.00
Public lighting 60.00 – 80.00
Total 222 – 303.00 92 – 128.00
GAP Total (a) - Total (b) 129 – 194.00
Sinloc analysis
If the total amount of investments were to be financed, there would be an average reduction of
emissions of about 12 - 17 thousand Toe67. If, on the contrary, interventions are financed by the
65 This amount was estimated in section 2.2.1. 66 i.e. thermal insulation and fixtures substitutions are very expensive if compared to energy savings 67 Toe: Tons of oil equivalent
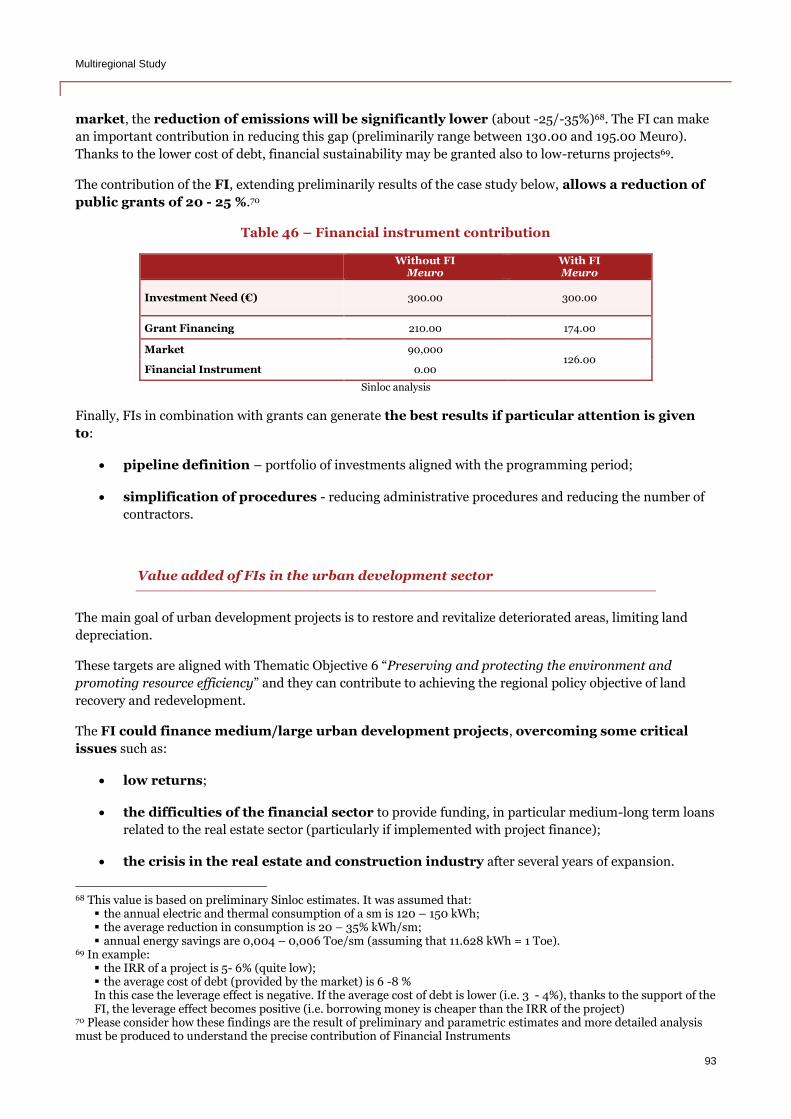
Multiregional Study
93
market, the reduction of emissions will be significantly lower (about -25/-35%)68. The FI can make
an important contribution in reducing this gap (preliminarily range between 130.00 and 195.00 Meuro).
Thanks to the lower cost of debt, financial sustainability may be granted also to low-returns projects69.
The contribution of the FI, extending preliminarily results of the case study below, allows a reduction of
public grants of 20 - 25 %.70
Table 46 – Financial instrument contribution
Without FI
Meuro With FI Meuro
Investment Need (€) 300.00 300.00
Grant Financing 210.00 174.00
Market 90,000 126.00
Financial Instrument 0.00
Sinloc analysis
Finally, FIs in combination with grants can generate the best results if particular attention is given
to:
pipeline definition – portfolio of investments aligned with the programming period;
simplification of procedures - reducing administrative procedures and reducing the number of
contractors.
Value added of FIs in the urban development sector
The main goal of urban development projects is to restore and revitalize deteriorated areas, limiting land
depreciation.
These targets are aligned with Thematic Objective 6 “Preserving and protecting the environment and
promoting resource efficiency” and they can contribute to achieving the regional policy objective of land
recovery and redevelopment.
The FI could finance medium/large urban development projects, overcoming some critical
issues such as:
low returns;
the difficulties of the financial sector to provide funding, in particular medium-long term loans
related to the real estate sector (particularly if implemented with project finance);
the crisis in the real estate and construction industry after several years of expansion.
68 This value is based on preliminary Sinloc estimates. It was assumed that:
the annual electric and thermal consumption of a sm is 120 – 150 kWh; the average reduction in consumption is 20 – 35% kWh/sm; annual energy savings are 0,004 – 0,006 Toe/sm (assuming that 11.628 kWh = 1 Toe).
69 In example: the IRR of a project is 5- 6% (quite low); the average cost of debt (provided by the market) is 6 -8 % In this case the leverage effect is negative. If the average cost of debt is lower (i.e. 3 - 4%), thanks to the support of the FI, the leverage effect becomes positive (i.e. borrowing money is cheaper than the IRR of the project)
70 Please consider how these findings are the result of preliminary and parametric estimates and more detailed analysis must be produced to understand the precise contribution of Financial Instruments
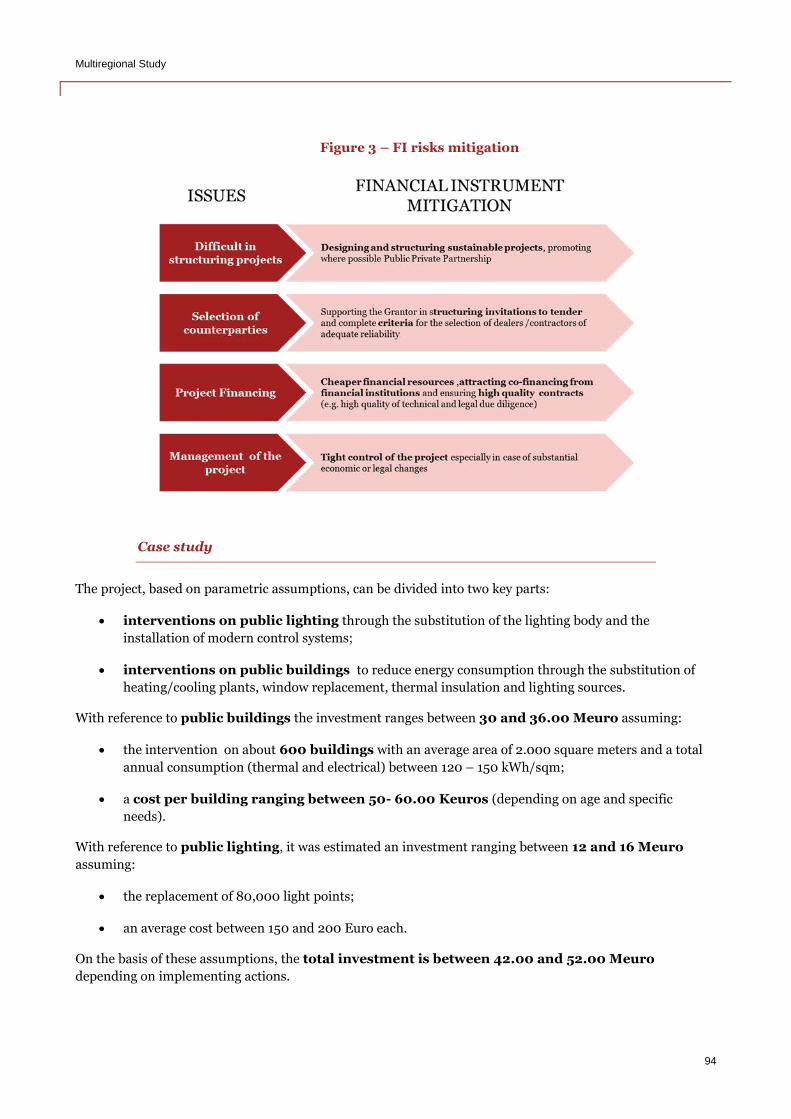
Multiregional Study
94
Figure 3 – FI risks mitigation
Case study
The project, based on parametric assumptions, can be divided into two key parts:
interventions on public lighting through the substitution of the lighting body and the
installation of modern control systems;
interventions on public buildings to reduce energy consumption through the substitution of
heating/cooling plants, window replacement, thermal insulation and lighting sources.
With reference to public buildings the investment ranges between 30 and 36.00 Meuro assuming:
the intervention on about 600 buildings with an average area of 2.000 square meters and a total
annual consumption (thermal and electrical) between 120 – 150 kWh/sqm;
a cost per building ranging between 50- 60.00 Keuros (depending on age and specific
needs).
With reference to public lighting, it was estimated an investment ranging between 12 and 16 Meuro
assuming:
the replacement of 80,000 light points;
an average cost between 150 and 200 Euro each.
On the basis of these assumptions, the total investment is between 42.00 and 52.00 Meuro
depending on implementing actions.
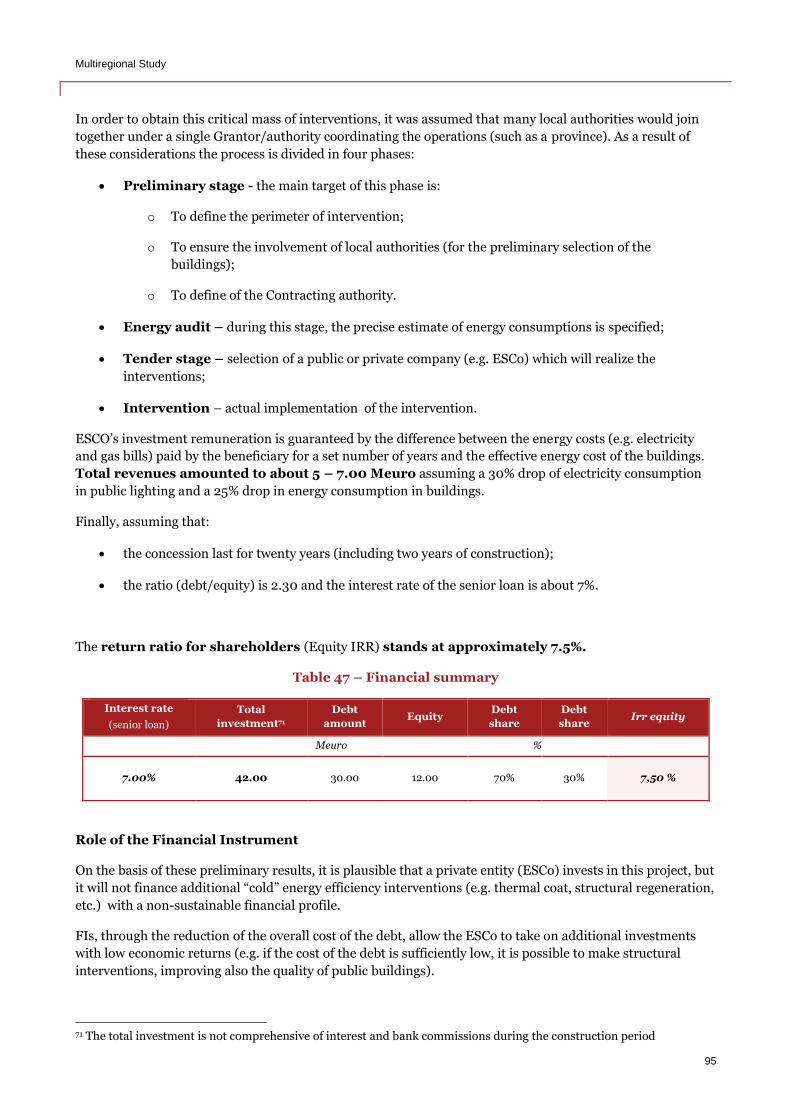
Multiregional Study
95
In order to obtain this critical mass of interventions, it was assumed that many local authorities would join
together under a single Grantor/authority coordinating the operations (such as a province). As a result of
these considerations the process is divided in four phases:
Preliminary stage - the main target of this phase is:
o To define the perimeter of intervention;
o To ensure the involvement of local authorities (for the preliminary selection of the
buildings);
o To define of the Contracting authority.
Energy audit – during this stage, the precise estimate of energy consumptions is specified;
Tender stage – selection of a public or private company (e.g. ESCo) which will realize the
interventions;
Intervention – actual implementation of the intervention.
ESCO’s investment remuneration is guaranteed by the difference between the energy costs (e.g. electricity
and gas bills) paid by the beneficiary for a set number of years and the effective energy cost of the buildings.
Total revenues amounted to about 5 – 7.00 Meuro assuming a 30% drop of electricity consumption
in public lighting and a 25% drop in energy consumption in buildings.
Finally, assuming that:
the concession last for twenty years (including two years of construction);
the ratio (debt/equity) is 2.30 and the interest rate of the senior loan is about 7%.
The return ratio for shareholders (Equity IRR) stands at approximately 7.5%.
Table 47 – Financial summary
Interest rate
(senior loan)
Total
investment71
Debt
amount Equity
Debt
share
Debt
share Irr equity
Meuro %
7.00% 42.00 30.00 12.00 70% 30% 7,50 %
Role of the Financial Instrument
On the basis of these preliminary results, it is plausible that a private entity (ESCo) invests in this project, but
it will not finance additional “cold” energy efficiency interventions (e.g. thermal coat, structural regeneration,
etc.) with a non-sustainable financial profile.
FIs, through the reduction of the overall cost of the debt, allow the ESCo to take on additional investments
with low economic returns (e.g. if the cost of the debt is sufficiently low, it is possible to make structural
interventions, improving also the quality of public buildings).
71 The total investment is not comprehensive of interest and bank commissions during the construction period
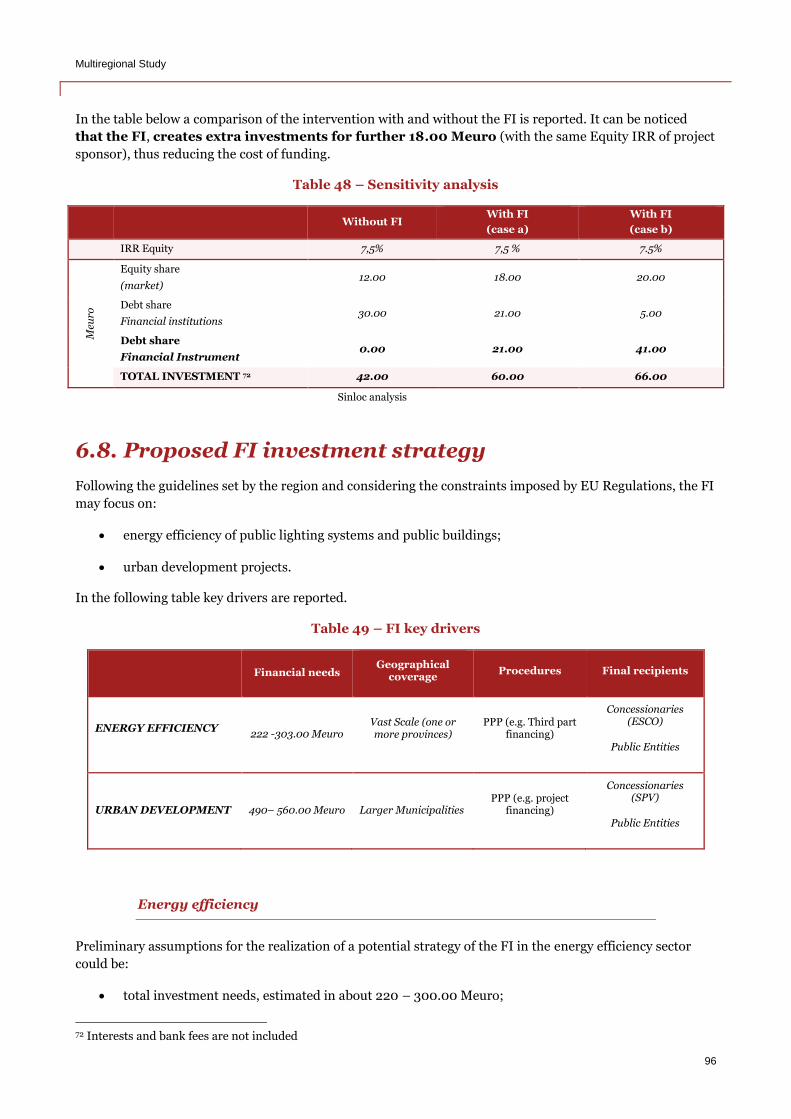
Multiregional Study
96
In the table below a comparison of the intervention with and without the FI is reported. It can be noticed
that the FI, creates extra investments for further 18.00 Meuro (with the same Equity IRR of project
sponsor), thus reducing the cost of funding.
Table 48 – Sensitivity analysis
Without FI With FI
(case a)
With FI
(case b)
IRR Equity 7,5% 7,5 % 7.5%
Meu
ro
Equity share
(market) 12.00 18.00 20.00
Debt share
Financial institutions 30.00 21.00 5.00
Debt share
Financial Instrument 0.00 21.00 41.00
TOTAL INVESTMENT 72 42.00 60.00 66.00
Sinloc analysis
6.8. Proposed FI investment strategy
Following the guidelines set by the region and considering the constraints imposed by EU Regulations, the FI
may focus on:
energy efficiency of public lighting systems and public buildings;
urban development projects.
In the following table key drivers are reported.
Table 49 – FI key drivers
Financial needs
Geographical coverage
Procedures Final recipients
ENERGY EFFICIENCY 222 -303.00 Meuro
Vast Scale (one or more provinces)
PPP (e.g. Third part financing)
Concessionaries (ESCO)
Public Entities
URBAN DEVELOPMENT 490– 560.00 Meuro Larger Municipalities PPP (e.g. project
financing)
Concessionaries (SPV)
Public Entities
Energy efficiency
Preliminary assumptions for the realization of a potential strategy of the FI in the energy efficiency sector
could be:
total investment needs, estimated in about 220 – 300.00 Meuro;
72 Interests and bank fees are not included
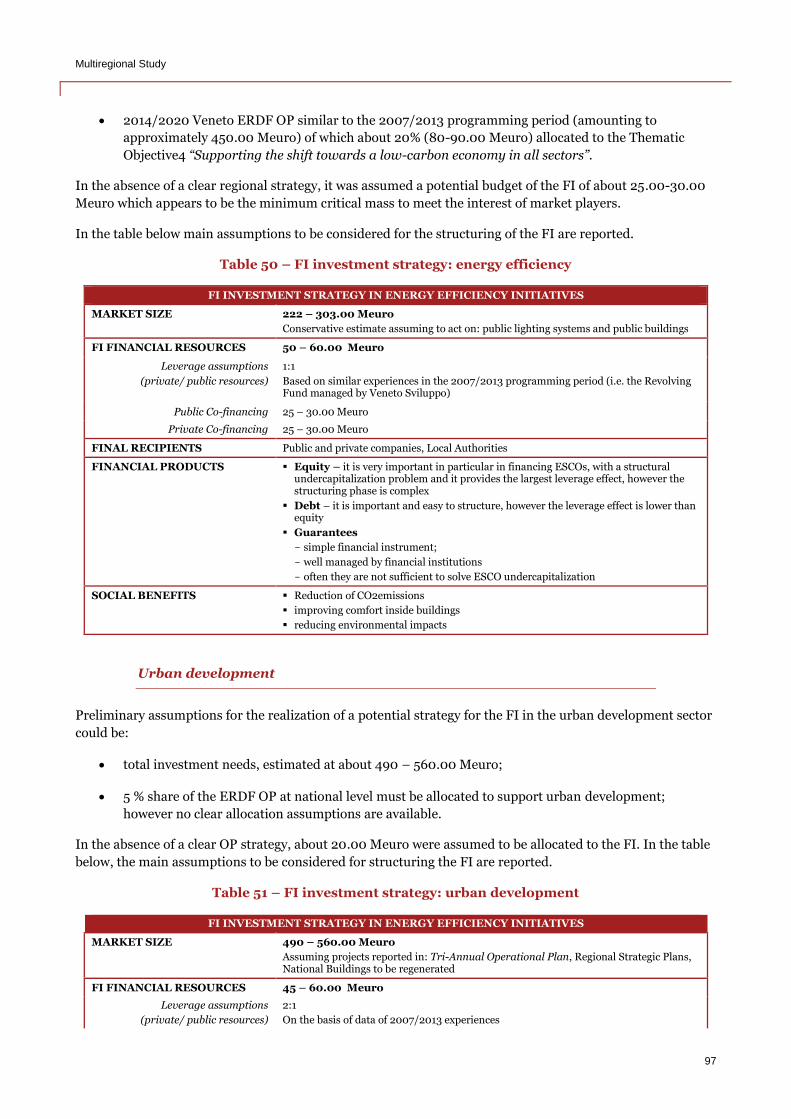
Multiregional Study
97
2014/2020 Veneto ERDF OP similar to the 2007/2013 programming period (amounting to
approximately 450.00 Meuro) of which about 20% (80-90.00 Meuro) allocated to the Thematic
Objective4 “Supporting the shift towards a low-carbon economy in all sectors”.
In the absence of a clear regional strategy, it was assumed a potential budget of the FI of about 25.00-30.00
Meuro which appears to be the minimum critical mass to meet the interest of market players.
In the table below main assumptions to be considered for the structuring of the FI are reported.
Table 50 – FI investment strategy: energy efficiency
FI INVESTMENT STRATEGY IN ENERGY EFFICIENCY INITIATIVES
MARKET SIZE 222 – 303.00 Meuro
Conservative estimate assuming to act on: public lighting systems and public buildings
FI FINANCIAL RESOURCES 50 – 60.00 Meuro
Leverage assumptions
(private/ public resources)
1:1
Based on similar experiences in the 2007/2013 programming period (i.e. the Revolving Fund managed by Veneto Sviluppo)
Public Co-financing 25 – 30.00 Meuro
Private Co-financing 25 – 30.00 Meuro
FINAL RECIPIENTS Public and private companies, Local Authorities
FINANCIAL PRODUCTS Equity – it is very important in particular in financing ESCOs, with a structural undercapitalization problem and it provides the largest leverage effect, however the structuring phase is complex
Debt – it is important and easy to structure, however the leverage effect is lower than equity
Guarantees
- simple financial instrument;
- well managed by financial institutions
- often they are not sufficient to solve ESCO undercapitalization
SOCIAL BENEFITS Reduction of CO2emissions
improving comfort inside buildings
reducing environmental impacts
Urban development
Preliminary assumptions for the realization of a potential strategy for the FI in the urban development sector
could be:
total investment needs, estimated at about 490 – 560.00 Meuro;
5 % share of the ERDF OP at national level must be allocated to support urban development;
however no clear allocation assumptions are available.
In the absence of a clear OP strategy, about 20.00 Meuro were assumed to be allocated to the FI. In the table
below, the main assumptions to be considered for structuring the FI are reported.
Table 51 – FI investment strategy: urban development
FI INVESTMENT STRATEGY IN ENERGY EFFICIENCY INITIATIVES
MARKET SIZE 490 – 560.00 Meuro
Assuming projects reported in: Tri-Annual Operational Plan, Regional Strategic Plans, National Buildings to be regenerated
FI FINANCIAL RESOURCES 45 – 60.00 Meuro
Leverage assumptions
(private/ public resources)
2:1
On the basis of data of 2007/2013 experiences
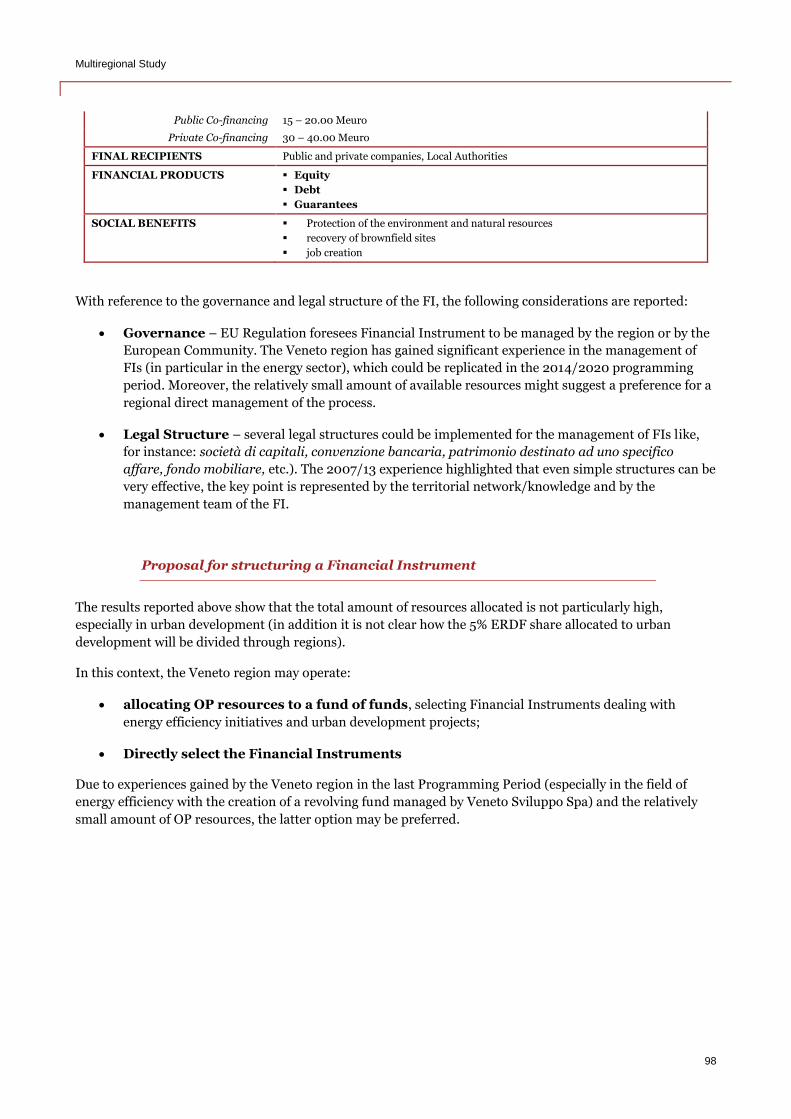
Multiregional Study
98
Public Co-financing 15 – 20.00 Meuro
Private Co-financing 30 – 40.00 Meuro
FINAL RECIPIENTS Public and private companies, Local Authorities
FINANCIAL PRODUCTS Equity
Debt
Guarantees
SOCIAL BENEFITS Protection of the environment and natural resources
recovery of brownfield sites
job creation
With reference to the governance and legal structure of the FI, the following considerations are reported:
Governance – EU Regulation foresees Financial Instrument to be managed by the region or by the
European Community. The Veneto region has gained significant experience in the management of
FIs (in particular in the energy sector), which could be replicated in the 2014/2020 programming
period. Moreover, the relatively small amount of available resources might suggest a preference for a
regional direct management of the process.
Legal Structure – several legal structures could be implemented for the management of FIs like,
for instance: società di capitali, convenzione bancaria, patrimonio destinato ad uno specifico
affare, fondo mobiliare, etc.). The 2007/13 experience highlighted that even simple structures can be
very effective, the key point is represented by the territorial network/knowledge and by the
management team of the FI.
Proposal for structuring a Financial Instrument
The results reported above show that the total amount of resources allocated is not particularly high,
especially in urban development (in addition it is not clear how the 5% ERDF share allocated to urban
development will be divided through regions).
In this context, the Veneto region may operate:
allocating OP resources to a fund of funds, selecting Financial Instruments dealing with
energy efficiency initiatives and urban development projects;
Directly select the Financial Instruments
Due to experiences gained by the Veneto region in the last Programming Period (especially in the field of
energy efficiency with the creation of a revolving fund managed by Veneto Sviluppo Spa) and the relatively
small amount of OP resources, the latter option may be preferred.
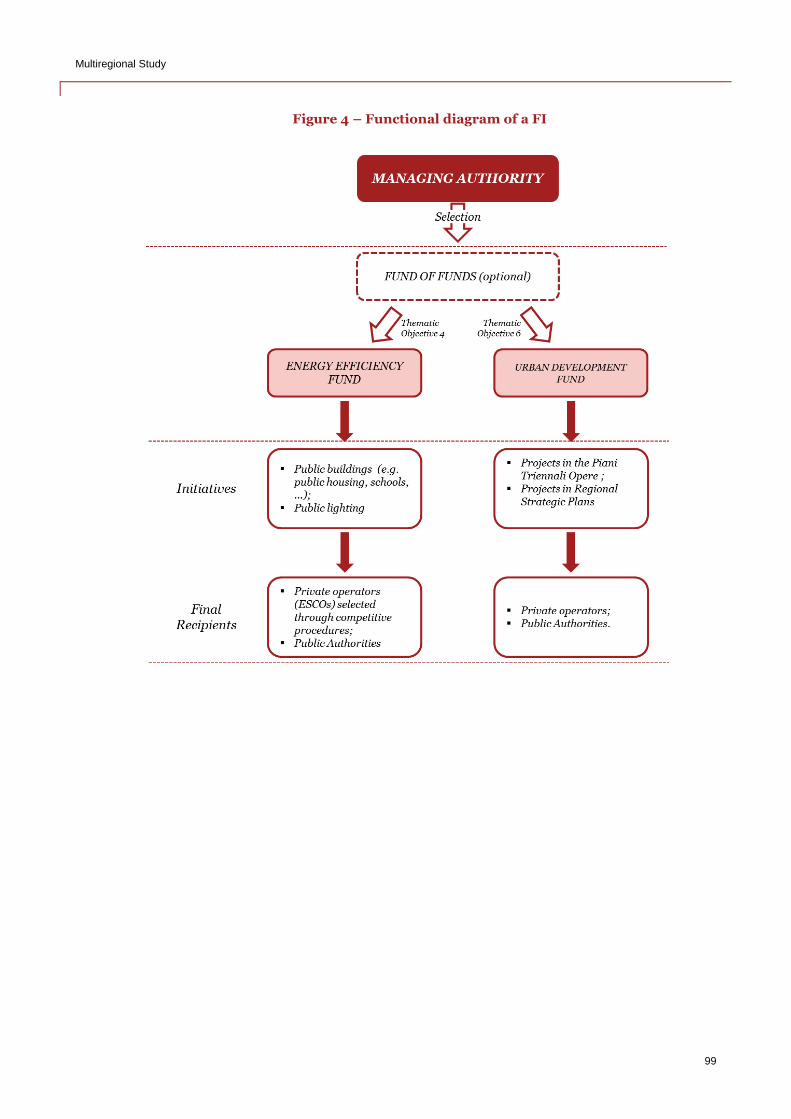
Multiregional Study
99
Figure 4 – Functional diagram of a FI
Multiregional Study
100
7. Lazio region
7.1. Guidelines of the 2014-2020 regional programme and priority thematic areas
The 2014-2020 ERDF Regional Operational Programme of the Lazio Region (“2014-2020 ERDF ROP Lazio”)
is currently73 under development and no information is available on the priority thematic areas.
However, main ROP thematic areas of the Lazio region shall be determined in accordance with the 11
Thematic Objectives set out for the 2014-2020 programming period.
In light of the CPR thematic concentration provisions, the Thematic Objectives set out in the first paragraph
of Article 9 of Regulation (EU) No 1303/2013 and the corresponding investment priorities set out in Article 5
of the CPR to which the ERDF may contribute under the Investment for growth and jobs goal, shall be
concentrated as follows:
at least 80 % of the total ERDF resources at national level shall be allocated to two or more of the Thematic Objectives set out in points 1, 2, 3 and 4 of the first paragraph of Article 9 of Regulation (EU) No 1303/2013; and
at least 20 % of the total ERDF resources at national level shall be allocated to the Thematic Objective set out in point 4 of the first paragraph of Article 9 of Regulation (EU) No 1303/2013.
The investment priorities on which the Region should focus in order to reach the forecasted outcomes might
at least concern the following Thematic Objectives:
Thematic Objective 1: strengthening research, technological development and innovation;
Thematic Objective 2: enhancing access to, and use and quality of ICT;
Thematic Objective 3: enhancing the competitiveness of SMEs;
Thematic Objective 4: supporting the shift towards a low-carbon economy in all sectors.
Table 52 – Summary of the Treaty-based objectives74
Thematic Objective Treaty-based objectives (currently under negotiation)
Thematic Objective 1: “Strengthening research, technological development and innovation”
Increase the SME innovation activity lines Strengthening the regional innovation system by increasing the cooperation between SME/SME network and research hubs and their quality Promoting new market sectors for innovation by stimulating the public demand, fostering quality standards and technological competitions on social problems (challanges&prizes)
Thematic Objective 2 “Enhancing access to, and use and quality of, ICT”
Reduce the digital gap in the territories and develop the fast and ultrafast broadband coherently with the 2020 “Digital Agenda” objectives Digitalization of the administrative processes and development of public administration digital services platforms to be provided to citizens and SME (particularly in the health care and justice sector) Strengthening the citizens ICT demand in terms of online service utilization, digital inclusion and online involvement
Thematic Objective 3
Support to investment in production Support employment policies and the economic and production sector within the territorial areas
73 As of the date of writing this report. 74 Summary of the Tratey-based objectives currently under negotiation and reported in the Draft Partnership Agreement (9 December 2013).
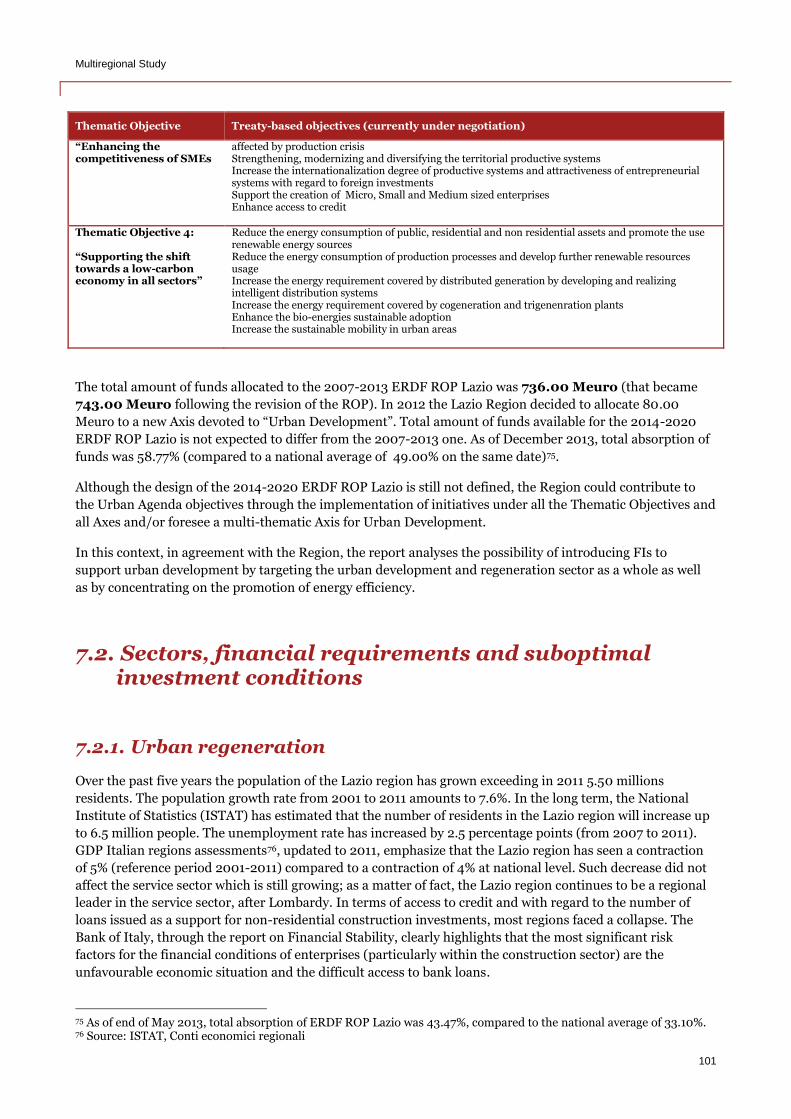
Multiregional Study
101
Thematic Objective Treaty-based objectives (currently under negotiation)
“Enhancing the competitiveness of SMEs
affected by production crisis Strengthening, modernizing and diversifying the territorial productive systems Increase the internationalization degree of productive systems and attractiveness of entrepreneurial systems with regard to foreign investments Support the creation of Micro, Small and Medium sized enterprises Enhance access to credit
Thematic Objective 4: “Supporting the shift towards a low-carbon economy in all sectors”
Reduce the energy consumption of public, residential and non residential assets and promote the use renewable energy sources Reduce the energy consumption of production processes and develop further renewable resources usage Increase the energy requirement covered by distributed generation by developing and realizing intelligent distribution systems Increase the energy requirement covered by cogeneration and trigenenration plants Enhance the bio-energies sustainable adoption Increase the sustainable mobility in urban areas
The total amount of funds allocated to the 2007-2013 ERDF ROP Lazio was 736.00 Meuro (that became
743.00 Meuro following the revision of the ROP). In 2012 the Lazio Region decided to allocate 80.00
Meuro to a new Axis devoted to “Urban Development”. Total amount of funds available for the 2014-2020
ERDF ROP Lazio is not expected to differ from the 2007-2013 one. As of December 2013, total absorption of
funds was 58.77% (compared to a national average of 49.00% on the same date)75.
Although the design of the 2014-2020 ERDF ROP Lazio is still not defined, the Region could contribute to
the Urban Agenda objectives through the implementation of initiatives under all the Thematic Objectives and
all Axes and/or foresee a multi-thematic Axis for Urban Development.
In this context, in agreement with the Region, the report analyses the possibility of introducing FIs to
support urban development by targeting the urban development and regeneration sector as a whole as well
as by concentrating on the promotion of energy efficiency.
7.2. Sectors, financial requirements and suboptimal investment conditions
7.2.1. Urban regeneration
Over the past five years the population of the Lazio region has grown exceeding in 2011 5.50 millions
residents. The population growth rate from 2001 to 2011 amounts to 7.6%. In the long term, the National
Institute of Statistics (ISTAT) has estimated that the number of residents in the Lazio region will increase up
to 6.5 million people. The unemployment rate has increased by 2.5 percentage points (from 2007 to 2011).
GDP Italian regions assessments76, updated to 2011, emphasize that the Lazio region has seen a contraction
of 5% (reference period 2001-2011) compared to a contraction of 4% at national level. Such decrease did not
affect the service sector which is still growing; as a matter of fact, the Lazio region continues to be a regional
leader in the service sector, after Lombardy. In terms of access to credit and with regard to the number of
loans issued as a support for non-residential construction investments, most regions faced a collapse. The
Bank of Italy, through the report on Financial Stability, clearly highlights that the most significant risk
factors for the financial conditions of enterprises (particularly within the construction sector) are the
unfavourable economic situation and the difficult access to bank loans.
75 As of end of May 2013, total absorption of ERDF ROP Lazio was 43.47%, compared to the national average of 33.10%. 76 Source: ISTAT, Conti economici regionali
Multiregional Study
102
Tourism sector
The tourism sector in Italy represents the niche where most economic interests are currently concentrated.
Congress tourism in Italy recorded 21.5 million participants and 35.5 million of days-presence in 2009. The
hotel and transport industry constitute the main beneficiaries of this sector’s revenues, accounting for 28%
and 36% respectively of the global conference sales. In the metropolitan area of Rome, the supply of congress
hospitality is made up 66% by hotels, 8% by convention centres, 8% by historical residences; and the
remaining 18% by other kind of congress rooms. The number of accommodations in Rome ranging between
300-1000 beds is above the national average while accommodations ranging below 300 beds showed to be
below the national average.
Student accommodation sector
The current trend on students’ halls of residence in the Lazio region shows considerable difficulties. Although
the student population in Lazio is comparable in absolute terms to the Lombardy one, the availability of
accommodation places is 70%-80% lower. While in the last ten years the number of accommodation places
has almost doubled in Veneto, Lombardy and Trentino, the Lazio region has only seen an increase of
approximately 10%. Furthermore, the region was ranked third last at national level in terms of beds supply in
2011; only 17.8% of eligible students had the chance to receive accommodation (against a national average of
50%). The LAZIODISU, manages a real estate portfolio which includes 18 residences. Their experience shows
that most of the measures aimed to widen the current regional student housing supply carried out faced
problems in terms of limited co-ordination capacity within the local authorities and slow in the
administrative process, moving from the planning phase to the implementation one.
Financial requirements and potential sources of funding
Tourism sector
The tourism sector has historically contributed to foster the economic development of the region. However,
there is a need to create a balance between the tourist offer provided by the most popular locations and the
services in the less known parts of the region. The financial requirements in this sense are currently not
known.
Student accommodation sector
The context analysis shows the need to develop additional student accommodation in order to align the
supply of the region to that of comparable situations. The planned interventions related to the student social
housing sector in previous years, should have brought an increase in the number of the existing buildings and
an increase in the number of accommodation places available by 700 beds. Most of the projects received the
co-financing resources under the Piani Triennali (Law 338/2000) but these have never been finalized. Due to
such critical factors, the Lazio Region has lost almost 72.00 Meuro of national co-financing resources.
Project characteristics and suboptimal investment situations
Tourism sector
Most of the private operators of the tourism sector in the Lazio Region are represented by large firms, which
operate in few tourist locations, especially where the tourism attraction is greater. SMEs represent a small
share of the market and their investment capacity is jeopardized by the limited resource availability and
access to credit. An opportunity for FI implementation is presented by investments in de-centralised areas
characterised by a lower degree of tourist attractiveness and higher payback periods. In the Lazio Region
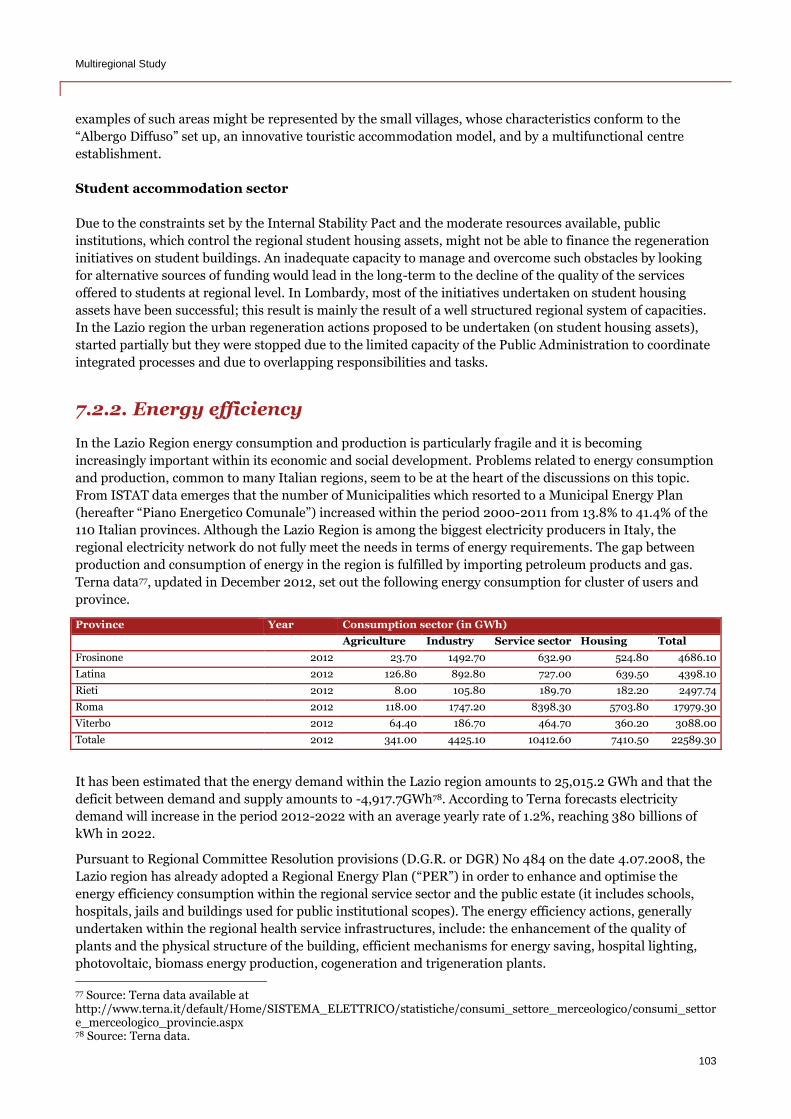
Multiregional Study
103
examples of such areas might be represented by the small villages, whose characteristics conform to the
“Albergo Diffuso” set up, an innovative touristic accommodation model, and by a multifunctional centre
establishment.
Student accommodation sector
Due to the constraints set by the Internal Stability Pact and the moderate resources available, public
institutions, which control the regional student housing assets, might not be able to finance the regeneration
initiatives on student buildings. An inadequate capacity to manage and overcome such obstacles by looking
for alternative sources of funding would lead in the long-term to the decline of the quality of the services
offered to students at regional level. In Lombardy, most of the initiatives undertaken on student housing
assets have been successful; this result is mainly the result of a well structured regional system of capacities.
In the Lazio region the urban regeneration actions proposed to be undertaken (on student housing assets),
started partially but they were stopped due to the limited capacity of the Public Administration to coordinate
integrated processes and due to overlapping responsibilities and tasks.
7.2.2. Energy efficiency
In the Lazio Region energy consumption and production is particularly fragile and it is becoming
increasingly important within its economic and social development. Problems related to energy consumption
and production, common to many Italian regions, seem to be at the heart of the discussions on this topic.
From ISTAT data emerges that the number of Municipalities which resorted to a Municipal Energy Plan
(hereafter “Piano Energetico Comunale”) increased within the period 2000-2011 from 13.8% to 41.4% of the
110 Italian provinces. Although the Lazio Region is among the biggest electricity producers in Italy, the
regional electricity network do not fully meet the needs in terms of energy requirements. The gap between
production and consumption of energy in the region is fulfilled by importing petroleum products and gas.
Terna data77, updated in December 2012, set out the following energy consumption for cluster of users and
province.
Province Year Consumption sector (in GWh)
Agriculture Industry Service sector Housing Total
Frosinone 2012 23.70 1492.70 632.90 524.80 4686.10
Latina 2012 126.80 892.80 727.00 639.50 4398.10
Rieti 2012 8.00 105.80 189.70 182.20 2497.74
Roma 2012 118.00 1747.20 8398.30 5703.80 17979.30
Viterbo 2012 64.40 186.70 464.70 360.20 3088.00
Totale 2012 341.00 4425.10 10412.60 7410.50 22589.30
It has been estimated that the energy demand within the Lazio region amounts to 25,015.2 GWh and that the
deficit between demand and supply amounts to -4,917.7GWh78. According to Terna forecasts electricity
demand will increase in the period 2012-2022 with an average yearly rate of 1.2%, reaching 380 billions of
kWh in 2022.
Pursuant to Regional Committee Resolution provisions (D.G.R. or DGR) No 484 on the date 4.07.2008, the
Lazio region has already adopted a Regional Energy Plan (“PER”) in order to enhance and optimise the
energy efficiency consumption within the regional service sector and the public estate (it includes schools,
hospitals, jails and buildings used for public institutional scopes). The energy efficiency actions, generally
undertaken within the regional health service infrastructures, include: the enhancement of the quality of
plants and the physical structure of the building, efficient mechanisms for energy saving, hospital lighting,
photovoltaic, biomass energy production, cogeneration and trigeneration plants.
77 Source: Terna data available at http://www.terna.it/default/Home/SISTEMA_ELETTRICO/statistiche/consumi_settore_merceologico/consumi_settore_merceologico_provincie.aspx 78 Source: Terna data.
Multiregional Study
104
Hospitals infrastructures are characterised by their high requirement of electricity, heating and mechanical
energy. According to the analysis carried out for the development of the PER, each hospital bed (in large size
hospitals) consumes on average 12.5 ton79 of primary energy while 4-6 ton are consumed by each bed in
hospitals with less than 100 beds. The Lazio Region was the first Italian Region to adopt an integrated
approach to the management of technological systems for healthcare assets. In 2006 the Region signed 4
multiannual contracts with multiservice companies for the management of the technological systems of 4
groups of healthcare assets. Contracts included the energy audit of the assets and the development of a plan
for the implementation of energy saving interventions. Contacts will expire in 2014. The Region will issue a
new tender for procuring multiannual contracts for the same kind of services.
The 2007-2013 ERDF ROP of Lazio devoted almost 220.00 Meuro to support Axis II “Environment and risk
prevention”, which includes energy efficiency projects. As of 31 May 2013 the Region allocated 50.2% of the
resources available from Axis II. More than 340 projects aimed at promoting the improvement of energy
efficiency and use of renewable energy were supported via grants, out of 600 projects considered eligible.
The Lazio Region established a FI in 2012 aimed at supporting energy efficiency investments in private and
public buildings and contributed with 100.00 Meuro to its financing, half of which from Axis II. This
experience faced difficulties in attracting financial intermediaries for the management of funds. No bids were
submitted in relation to the tender issued by Sviluppo Lazio (“in house” company of the Lazio Region). In
2013 the Regions had to reshape the initiative completely. So far no data on projects supported are available.
Within the same Axis II, the Region supported energy efficiency interventions realized by Municipalities
through ESCos and aimed to improve public lighting. The measure foresaw an initial grant support to
Municipalities to carry out energy audits and a further form of support to cover part of the fees to the ESCos.
The majority of Municipalities that received funds for the audits did not procure the service to an ESCo.
Financial requirements and potential sources of funding
In order to reach the energy saving targets by 2020, initiatives related to energy efficiency should target the
service sector, which shows the highest energy consumption rates. Hospitals and other health care
infrastructures show the highest energy consumption levels within the service sector. Assets with low energy
efficiency level host almost 16.000 hospital beds. The energy efficiency improvements applied to the health
care sector of the Lazio Region might require investments in the range of 300-500.00 Meuro (excluding
heavy structural interventions). As described above, energy audits of the assets and energy efficiency
improvement intervention plans might have been developed by the multiservice contractors, however, no
details were provided by the Region in the course of the study. It is foreseeable that a number of
interventions will be included in the new contracts, where the contractors might operate as ESCos.
A broad selection of funds at European, national and regional level may contribute to finance energy
efficiency projects. Apart from the support provided through ESI Funds, the European Commission offers
support via the European Energy Efficiency Fund (EEEF).
Projects characteristics and Suboptimal investment situations
Measures to improve the energy efficiency of old and poorly maintained public health care assets require
large scale investments. Regional public health care assets are currently managed by facility managers
(playing the role of ESCos), which are in charge of undertaking energy audits and designing intervention
plans. Currently, in order to finance interventions, only corporate loans at high market rates are offered to
facility managers. This condition represents a constraint for ESCos’ financial capacity, and as a consequence,
it reduces the likelihood of undertaking and financing the planned interventions. Most of the implemented
79 Unit of energy: tonne of oil equivalent
Multiregional Study
105
measures mainly concerned the realization and management of cogeneration and trigeneration plants. Other
interventions (such as structural interventions), more likely to lower management costs of public health care
assets, have not been carried out because they are unpredictable, not easily measurable and not economically
viable from the private investors’ side. While undertaking such interventions, facility managers are thus
particularly exposed to financial risks.
7.3. Value added of FIs
Results of the analysis against evaluation criteria
Based on the 2007-2013 programming period experience, the opportunity to introduce FIs to support Urban
Development has been assessed against the following criteria:
2014-2020 - ERDF ROP Lazio, in terms of financial availability, suitability of the design of the ROP (and its procedures) with the operating requirements of the FI.
Initiatives and project pipeline, meaning the availability of a pipeline of projects or initiatives that might be supported via FI.
Technical, administrative management and capacity and experience of the Public Administration, in terms of managing EU funds, planning, developing and procuring projects as well as managing contracts.
Suboptimal investment situations and value added, in terms of value added, FI might bring in a context of suboptimal investment situations (that is a pre-requisite for FI implementation). Value added identification partially comes from the results of case studies.
The above mentioned analysis has been carried out for the 2 target sectors: urban regeneration and energy
efficiency. Results of the analysis are summarised below:
The amount of funds that are foreseen for the 2014-2020 ERDF ROP Lazio might justify the implementation of a FI. In the 2007-2013 programming period, the Region contributed more than 10% of ERDF ROP Lazio resources to FIs. Assuming that the Region maintains the same allocation of resources, the total amount of ERDF funds devoted to FIs could be higher than 100.00 Meuro.
The 2014-2020 ERDF ROP Lazio is under development. For the time being, it is not possible to assess the compliance of its design and related procedures with the operating requirements of the FI.
The context analysis highlighted opportunities for the development of student housing and projects related to the tourism sector. However, no information on initiatives already in place or planned is available. The eligibility of such kind of project for ERDF financing is linked to the nature of the interventions and to the priority thematic areas that will be chosen by the Region. Opportunities have also been identified in the improvement of energy efficiency of healthcare assets. Although energy audits and intervention plans should have already been prepared, no information was provided by the Region. Such interventions would be eligible for ERDF funding under Thematic Objective 4. Due to the lack of information, it was not possible to verify the maturity of such initiatives in the course of the study. The same applies to their financial viability.
In relation to EU funding, the total allocation of ERDF resources (58.77% at the end of December 201380) is higher than the national average (49%81). However, experience in implementing FIs shows a low appetite for this type of instruments from the financial sector, at least when they are aimed at SMEs.
In relation to the Public Administration difficulties in coordinating integrated processes and to the limited experience of Local Authorities to procure PPPs and use ESCo type models, the analysis of the Local Authorities’ Piani Triennali showed that the majority of planned interventions were not finalized. Reasons for the delays are mainly connected to the lack of funds, to the long lasting administrative procedures and to the limited involvement of private operators in the planning process.
Suboptimal investment situations have been found in all sectors considered (see paragraph 7.2).
80 http://opencoesione.gov.it/spesa-certificata/ 81 http://opencoesione.gov.it/spesa-certificata/
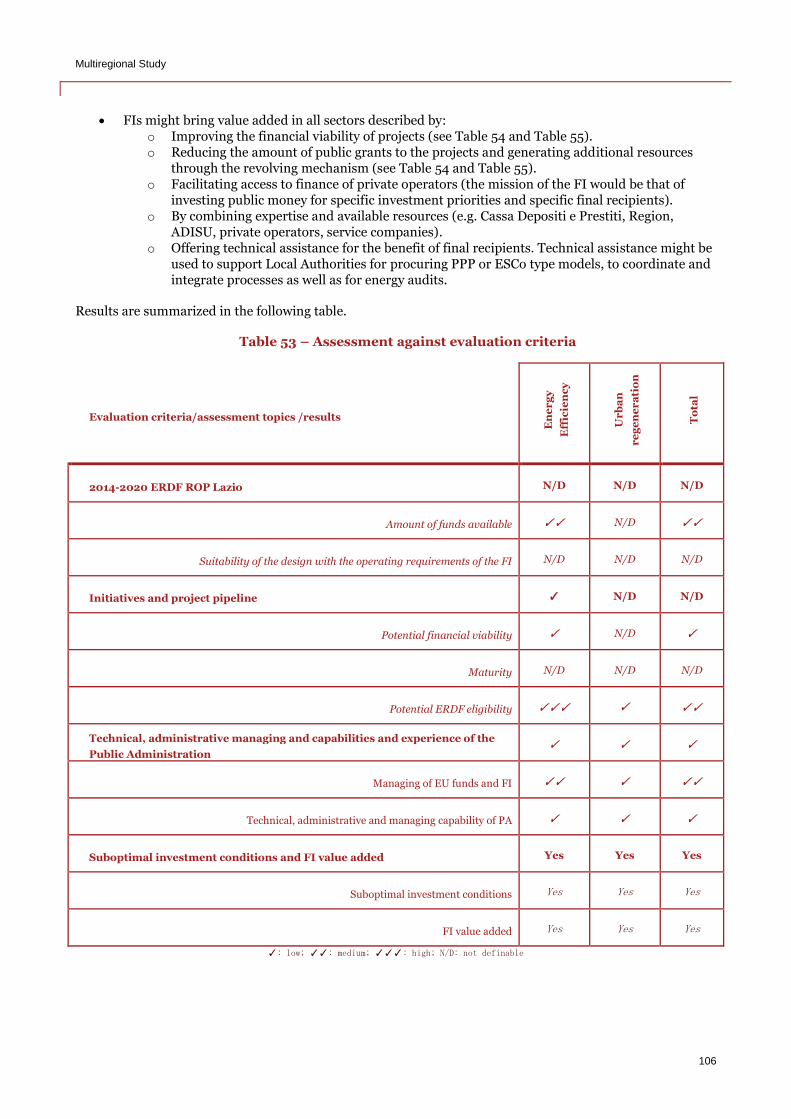
Multiregional Study
106
FIs might bring value added in all sectors described by: o Improving the financial viability of projects (see Table 54 and Table 55). o Reducing the amount of public grants to the projects and generating additional resources
through the revolving mechanism (see Table 54 and Table 55). o Facilitating access to finance of private operators (the mission of the FI would be that of
investing public money for specific investment priorities and specific final recipients). o By combining expertise and available resources (e.g. Cassa Depositi e Prestiti, Region,
ADISU, private operators, service companies). o Offering technical assistance for the benefit of final recipients. Technical assistance might be
used to support Local Authorities for procuring PPP or ESCo type models, to coordinate and integrate processes as well as for energy audits.
Results are summarized in the following table.
Table 53 – Assessment against evaluation criteria
Evaluation criteria/assessment topics /results
En
er
gy
Eff
icie
nc
y
Ur
ba
n
re
ge
ne
ra
tio
n
To
tal
2014-2020 ERDF ROP Lazio N/D N/D N/D
Amount of funds available ✓✓ N/D ✓✓
Suitability of the design with the operating requirements of the FI N/D N/D N/D
Initiatives and project pipeline ✓ N/D N/D
Potential financial viability ✓ N/D ✓
Maturity N/D N/D N/D
Potential ERDF eligibility ✓✓✓ ✓ ✓✓
Technical, administrative managing and capabilities and experience of the
Public Administration ✓ ✓ ✓
Managing of EU funds and FI ✓✓ ✓ ✓✓
Technical, administrative and managing capability of PA ✓ ✓ ✓
Suboptimal investment conditions and FI value added Yes Yes Yes
Suboptimal investment conditions Yes Yes Yes
FI value added Yes Yes Yes
✓: low; ✓✓: medium; ✓✓✓: high; N/D: not definable
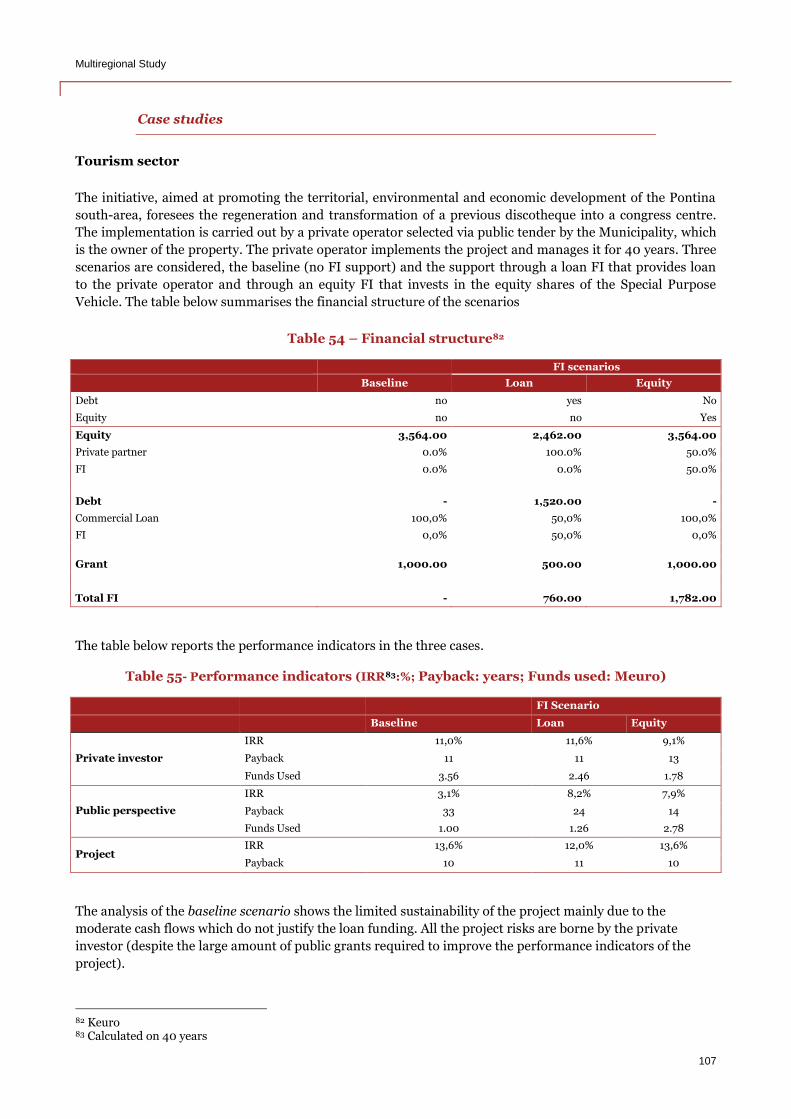
Multiregional Study
107
Case studies
Tourism sector
The initiative, aimed at promoting the territorial, environmental and economic development of the Pontina
south-area, foresees the regeneration and transformation of a previous discotheque into a congress centre.
The implementation is carried out by a private operator selected via public tender by the Municipality, which
is the owner of the property. The private operator implements the project and manages it for 40 years. Three
scenarios are considered, the baseline (no FI support) and the support through a loan FI that provides loan
to the private operator and through an equity FI that invests in the equity shares of the Special Purpose
Vehicle. The table below summarises the financial structure of the scenarios
Table 54 – Financial structure82
FI scenarios
Baseline Loan Equity
Debt no yes No
Equity no no Yes
Equity 3,564.00 2,462.00 3,564.00
Private partner 0.0% 100.0% 50.0%
FI 0.0% 0.0% 50.0%
Debt - 1,520.00 -
Commercial Loan 100,0% 50,0% 100,0%
FI 0,0% 50,0% 0,0%
Grant 1,000.00 500.00 1,000.00
Total FI - 760.00 1,782.00
The table below reports the performance indicators in the three cases.
Table 55- Performance indicators (IRR83:%; Payback: years; Funds used: Meuro)
FI Scenario
Baseline Loan Equity
Private investor
IRR 11,0% 11,6% 9,1%
Payback 11 11 13
Funds Used 3.56 2.46 1.78
Public perspective
IRR 3,1% 8,2% 7,9%
Payback 33 24 14
Funds Used 1.00 1.26 2.78
Project IRR 13,6% 12,0% 13,6%
Payback 10 11 10
The analysis of the baseline scenario shows the limited sustainability of the project mainly due to the
moderate cash flows which do not justify the loan funding. All the project risks are borne by the private
investor (despite the large amount of public grants required to improve the performance indicators of the
project).
82 Keuro 83 Calculated on 40 years
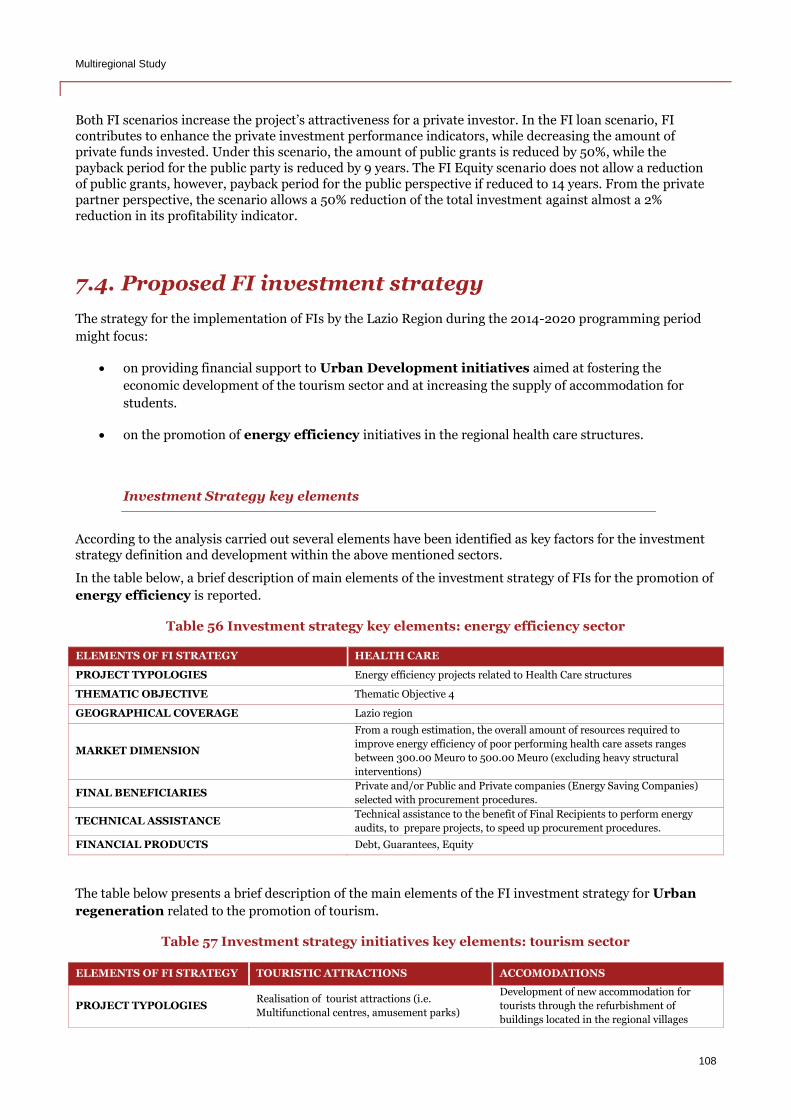
Multiregional Study
108
Both FI scenarios increase the project’s attractiveness for a private investor. In the FI loan scenario, FI contributes to enhance the private investment performance indicators, while decreasing the amount of private funds invested. Under this scenario, the amount of public grants is reduced by 50%, while the payback period for the public party is reduced by 9 years. The FI Equity scenario does not allow a reduction of public grants, however, payback period for the public perspective if reduced to 14 years. From the private partner perspective, the scenario allows a 50% reduction of the total investment against almost a 2% reduction in its profitability indicator.
7.4. Proposed FI investment strategy
The strategy for the implementation of FIs by the Lazio Region during the 2014-2020 programming period
might focus:
on providing financial support to Urban Development initiatives aimed at fostering the
economic development of the tourism sector and at increasing the supply of accommodation for
students.
on the promotion of energy efficiency initiatives in the regional health care structures.
Investment Strategy key elements
According to the analysis carried out several elements have been identified as key factors for the investment strategy definition and development within the above mentioned sectors.
In the table below, a brief description of main elements of the investment strategy of FIs for the promotion of
energy efficiency is reported.
Table 56 Investment strategy key elements: energy efficiency sector
ELEMENTS OF FI STRATEGY HEALTH CARE
PROJECT TYPOLOGIES Energy efficiency projects related to Health Care structures
THEMATIC OBJECTIVE Thematic Objective 4
GEOGRAPHICAL COVERAGE Lazio region
MARKET DIMENSION
From a rough estimation, the overall amount of resources required to
improve energy efficiency of poor performing health care assets ranges
between 300.00 Meuro to 500.00 Meuro (excluding heavy structural
interventions)
FINAL BENEFICIARIES Private and/or Public and Private companies (Energy Saving Companies)
selected with procurement procedures.
TECHNICAL ASSISTANCE Technical assistance to the benefit of Final Recipients to perform energy
audits, to prepare projects, to speed up procurement procedures.
FINANCIAL PRODUCTS Debt, Guarantees, Equity
The table below presents a brief description of the main elements of the FI investment strategy for Urban
regeneration related to the promotion of tourism.
Table 57 Investment strategy initiatives key elements: tourism sector
ELEMENTS OF FI STRATEGY TOURISTIC ATTRACTIONS ACCOMODATIONS
PROJECT TYPOLOGIES Realisation of tourist attractions (i.e.
Multifunctional centres, amusement parks)
Development of new accommodation for
tourists through the refurbishment of
buildings located in the regional villages
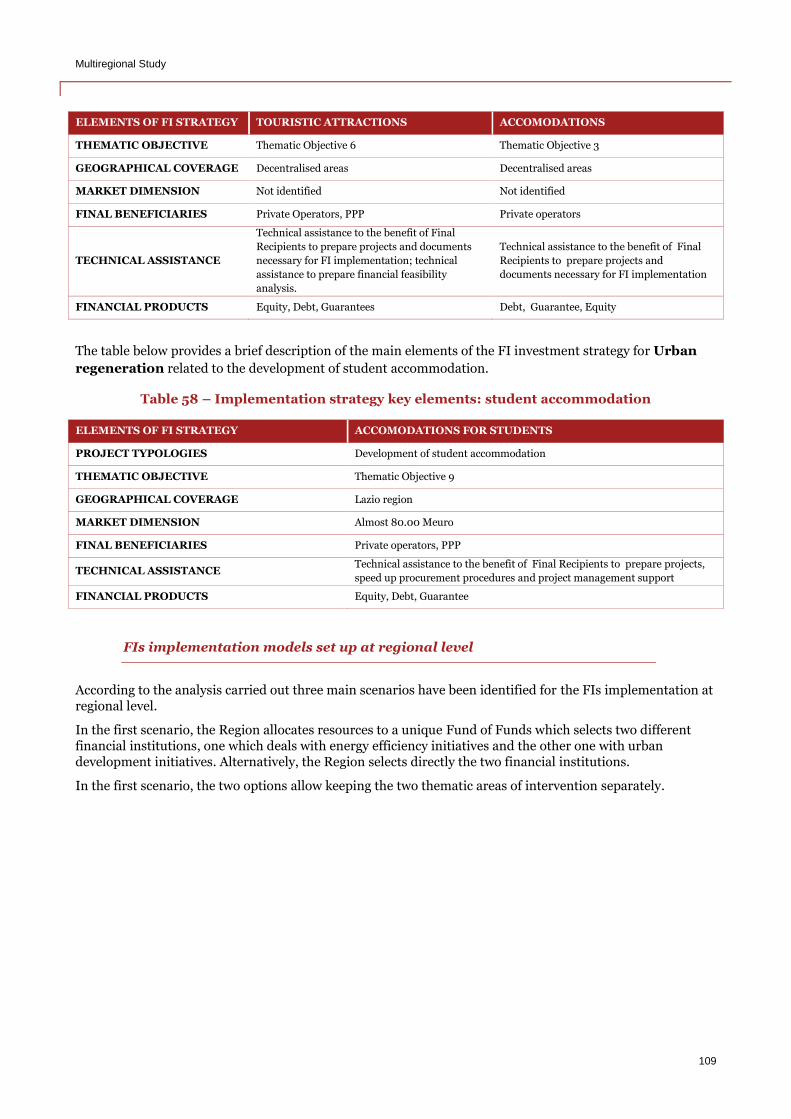
Multiregional Study
109
ELEMENTS OF FI STRATEGY TOURISTIC ATTRACTIONS ACCOMODATIONS
THEMATIC OBJECTIVE Thematic Objective 6 Thematic Objective 3
GEOGRAPHICAL COVERAGE Decentralised areas Decentralised areas
MARKET DIMENSION Not identified Not identified
FINAL BENEFICIARIES Private Operators, PPP Private operators
TECHNICAL ASSISTANCE
Technical assistance to the benefit of Final
Recipients to prepare projects and documents
necessary for FI implementation; technical
assistance to prepare financial feasibility
analysis.
Technical assistance to the benefit of Final
Recipients to prepare projects and
documents necessary for FI implementation
FINANCIAL PRODUCTS Equity, Debt, Guarantees Debt, Guarantee, Equity
The table below provides a brief description of the main elements of the FI investment strategy for Urban
regeneration related to the development of student accommodation.
Table 58 – Implementation strategy key elements: student accommodation
ELEMENTS OF FI STRATEGY ACCOMODATIONS FOR STUDENTS
PROJECT TYPOLOGIES Development of student accommodation
THEMATIC OBJECTIVE Thematic Objective 9
GEOGRAPHICAL COVERAGE Lazio region
MARKET DIMENSION Almost 80.00 Meuro
FINAL BENEFICIARIES Private operators, PPP
TECHNICAL ASSISTANCE Technical assistance to the benefit of Final Recipients to prepare projects,
speed up procurement procedures and project management support
FINANCIAL PRODUCTS Equity, Debt, Guarantee
FIs implementation models set up at regional level
According to the analysis carried out three main scenarios have been identified for the FIs implementation at regional level.
In the first scenario, the Region allocates resources to a unique Fund of Funds which selects two different financial institutions, one which deals with energy efficiency initiatives and the other one with urban development initiatives. Alternatively, the Region selects directly the two financial institutions.
In the first scenario, the two options allow keeping the two thematic areas of intervention separately.
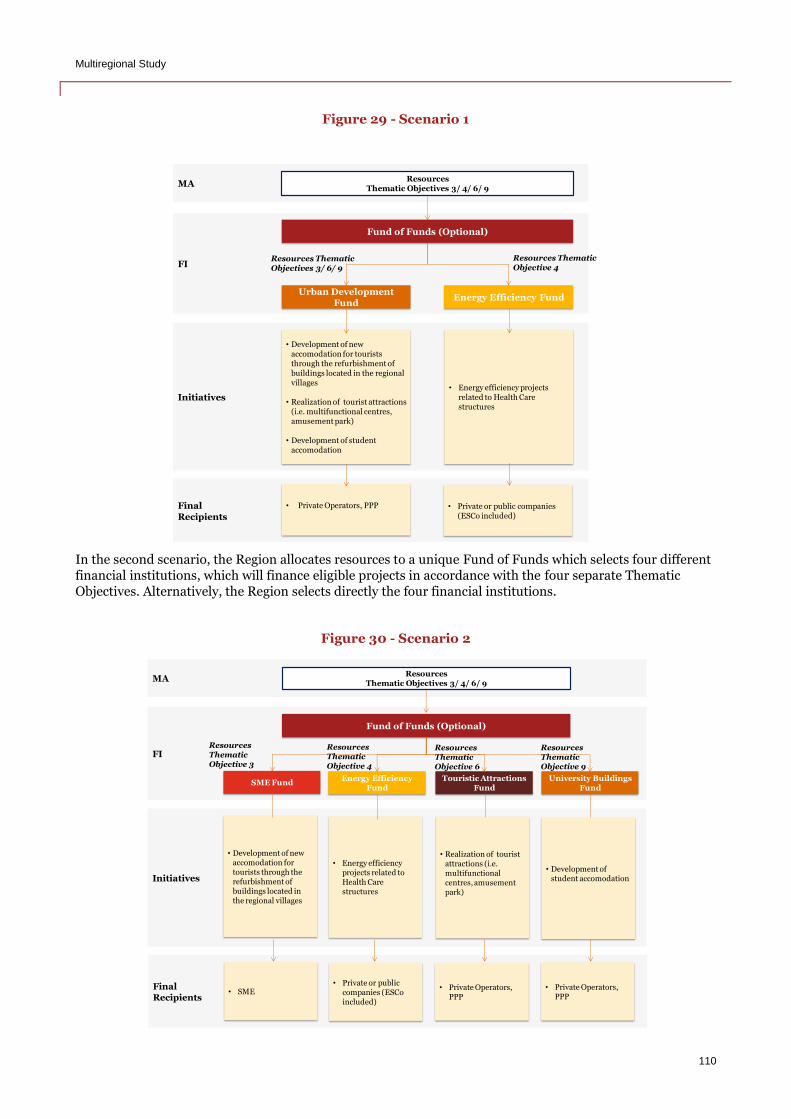
Multiregional Study
110
Figure 29 - Scenario 1
In the second scenario, the Region allocates resources to a unique Fund of Funds which selects four different financial institutions, which will finance eligible projects in accordance with the four separate Thematic Objectives. Alternatively, the Region selects directly the four financial institutions.
Figure 30 - Scenario 2
FinalRecipients
Initiatives
MA
FI
Fund of Funds (Optional)
Urban DevelopmentFund
ResourcesThematic Objectives 3/ 4/ 6/ 9
Energy Efficiency Fund
• Development of new accomodation for tourists through the refurbishment of buildings located in the regional villages
• Realization of tourist attractions(i.e. multifunctional centres, amusement park)
• Development of student accomodation
• Energy efficiency projects related to Health Care structures
Resources ThematicObjectives 3/ 6/ 9
Resources ThematicObjective 4
• Private Operators, PPP • Private or public companies (ESCo included)
Initiatives
MA
FI
Fund of Funds (Optional)
SME Fund
ResourcesThematic Objectives 3/ 4/ 6/ 9
• Development of new accomodation for tourists through the refurbishment of buildings located in the regional villages
Energy EfficiencyFund
• Energy efficiency projects related to Health Care structures
Touristic AttractionsFund
• Realization of touristattractions (i.e. multifunctionalcentres, amusementpark)
University BuildingsFund
• Development of student accomodation
ResourcesThematicObjective 3
ResourcesThematicObjective 4
ResourcesThematicObjective 6
ResourcesThematicObjective 9
Final
Recipients• SME
• Private or public companies (ESCoincluded)
• Private Operators, PPP
• Private Operators, PPP
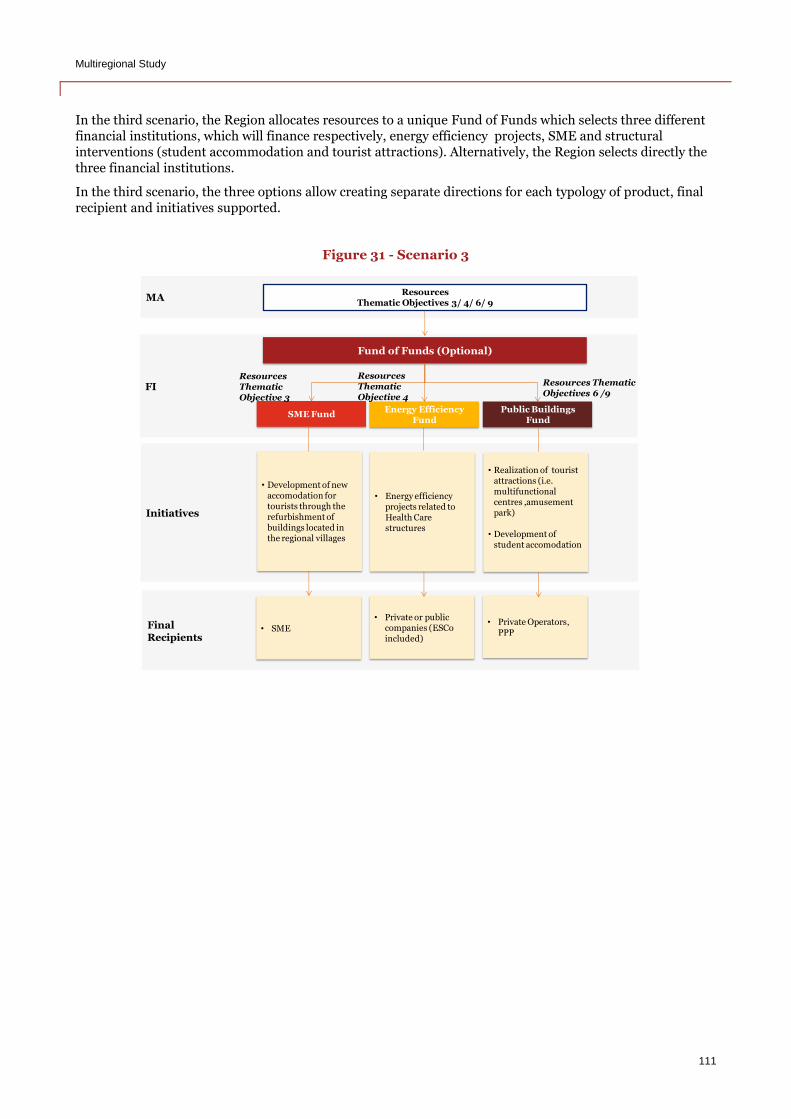
Multiregional Study
111
In the third scenario, the Region allocates resources to a unique Fund of Funds which selects three different financial institutions, which will finance respectively, energy efficiency projects, SME and structural interventions (student accommodation and tourist attractions). Alternatively, the Region selects directly the three financial institutions.
In the third scenario, the three options allow creating separate directions for each typology of product, final recipient and initiatives supported.
Figure 31 - Scenario 3
Initiatives
MA
FI
Fund of Funds (Optional)
SME Fund
ResourcesThematic Objectives 3/ 4/ 6/ 9
• Development of new accomodation for tourists through the refurbishment of buildings located in the regional villages
Energy EfficiencyFund
• Energy efficiency projects related to Health Care structures
Public BuildingsFund
• Realization of touristattractions (i.e. multifunctionalcentres ,amusementpark)
• Development of student accomodation
Final
Recipients• SME
• Private or public companies (ESCoincluded)
• Private Operators, PPP
ResourcesThematicObjective 3
ResourcesThematicObjective 4
Resources ThematicObjectives 6 /9

Multiregional Study
112