jesse jones - william j. hughes technical center · 2009-03-11 · marker, middle marker, and outer...
TRANSCRIPT

Mark 20 Category IIJIII In~trument
Land-MiiSslernliiftQerational Test
~ ~ ~
~
~ ~
~ This do available to the pUhlin)It through the Na ilisclmiItnf
Jesse Jones
Evaluation Func al and erformance Test Repo
Service Springfield Virginia 22161
~ bull Us Department ofTransportation ~ Federal Aviation Administration
Technical Center Atlantic City Airport NJ 08405
DOTFAA CT-TN 9444 c 2
~
DOTFAA Jones Jesse CT-TN Mark 20 category IIII 9544 instrument landing sys~
c 1 tern
fl~li[~lil~i~1111Ii~~lilllif~[~~ 00015385
This ( of the U informati assumes
The United States Govemment does not endorse products or manufacturers Trade or manufacturers names appear herefn sofery because they are considered essential to the objective of this report
Technical Report Documentation Page 1 Report No 2 Government Accession No 3 Recipients Catalog No
DOTFAAlCT-TN 9544
4 Title and Subtitle 5 Report Date
Mark 20 Category IIIII Instrument Landing System Operational Test and October 1995
Evaluation Functional and Performance Test Report 6 Performing Organization Code
ACT-36D
7 Author(s) 8 Performing Organization Report No
Jesse Jones Benjamin Bennett Raytheon Service Co DOTFAAlCT-TN9544
Byron Robins SAIC
9 Performing Organization Name and Address 10 Work Unit No (TRAIS)
US Department of Transportation
Federal Aviation Administration 11 Contract or Grant No
Technical Center
Atlantic City International Airport NJ 08405 13 Type of Report and Period Covered
12 Sponsoring Agency Name and Address Technical Note
US Department of Transportation July 1994 - March 1995
Federal Aviation Administration 14 Sponsoring Agency Code
Technical Center
Atlantic City International Airport NJ 08405
15 Supplementary Notes
This effort was performed in cooperation with FAA Technical Center (ACT-360) personnel and project personnel from
Raytheon Service Company in Pleasantville New Jersey
16 Abstract
This test report documents the results of the Operational Test and Evaluation (OTampE) Functional and Performance tests conducted on the Category IIIII Mark 20 Instrument Landing System (ILS) at the FAA Technical Center Atlantic City International Airport Atlantic City NJ The Mark 20 ILS modular design is based on a new generation of microprocessors and software With Remote Maintenance Monitoring (RMM) capability and the concept of remove and replace maintenance it will provide major airway facilities throughout the US with a more reliable and easily maintained system
The report contains the system configuration test descriptions test equipment used data collection and analysis methods test results and conclusions Based on testing performed at the FAA Technical Center it is recommended that the Mark 20 ILS be accepted for deployment
17 Key Words 18 Distribution Statement
This documentation is available to the public through the Instrument Landing System (ILS) National Technical Information Service Springfield VA 22161Category IIIII
Mark 20
21 No of Pages 22 Price20 Security Classif (of this page)19 Security Classif (of this report)
74Unclassified Unclassified
Form DOT F 17007 (8-72) Reproduction of completed page authorized
TABLE OF CONTENTS
EXECUTIVE SUMMARY
Page
vii
1 INTRODUCTION 1
11 Purpose of Report 1 12 Scope of Report 1
2 REFERENCE DOCUMENTS 1
3 SYSTEM DESCRIPTION 2
31 Mission Review 2 32 Test System Configuration 2 33 Interfaces 4
4 TEST AND EVALUATION DESCRIPTION 4
41 Test Schedules and Locations 4 42 Participants 5 43 Test and Specialized Equipment 5 44 Test ObjectivesCriteria 5 45 Test Descriptions 8 46 Data Collection and Analysis Method 10
5 RESULTS AND DISCUSSION 16
51 ILS Installation and Alignment 16 52 Flight Inspection 16 53 System Reliability and Maintainability 16 54 Remote Status and Interlock Unit 26 55 Standby Power 29
6 CONCLUSIONS 29
7 RECOMMENDATIONS 30
8 ACRONYMS 31
APPENDIXES
A Oklahoma City Flight Inspection Field Office Flight Inspection Report
B Test Trouble Reports
C Stability Data
iii
LIST OF ILLUSTRATIONS
Figure Page
1 Mark 20 ILS OTampE Test Setup 3
Approach and Far Field Monitor Data Was Collected
Path RF Level for January 30 1995
Amplitude of Glide Slope Antennas During Ice Loading Testing
Localizer Environment
Localizer Environment
2 RCSU and LCU to Subsystem Connect Diagram 4
3 Locations of Boeing 727 While Airborne Localizer 15
4 Localizer Approach Guidance Error Plot 17
5 Localizer Orbit 17
6 Glide Slope Approach Guidance Error Plot 18
7 Glide Slope Level Run 18
8 Correlation of Temperature and Monitored Glide Slope 19
9 Test Configuration for Measuring VSWR Phase and 20
10 Far Field Monitor 1 Readings with a B727 in the 28
11 Far Field Monitor 2 Readings with a B727 in the 28
iv
LIST OF TABLES
Table Page
1 Glide Slope Antenna Measurements During Ice Loading 21 Testing
Adjusted from 0 to 100 in 5 Increments
Adjusted from 50 to 90 in 5 Increments
2 Glide Slope Clearance RF Level and SDM as SBO Level is 22
3 Glide Slope Clearance RF Level and SDM as CLR SDM is 23
4 Glide Slope Clearance RF Level and SDM as CLR RF Level 23 is Adjusted from oOOW to 050W in O05W Increments
5 Fault Diagnostic Results 24
6 Log of the Position of the B727 During Far Field 27 Monitor Testing
7 Mark 20 Subsystem Standby Power Test Results and 29 Requirements
EXECUTIVE SUMMARY
The Federal Aviation Administration (FAA) contracted Wilcox Electric Inc to produce five category IIIII Instrument Landing Systems (ILS) with an option to purchase more based on successful completion of testing One system was installed for operational test and evaluation on runway 04 at the FAA Technical Center at the Atlantic City International Airport The FAA Technical Center operational test and evaluation period was July 1994 through March 1995
The ILS successfully passed a category III type flight check conducted by the Oklahoma City Flight Inspection Field Office and periodic flight checks conducted by the FAA Technical Center test team The few subsystem outages that occurred during testing were easily identified and corrected Weather effects on the Mark 20 were studied over a period of time and found to have little or no affect on operation All subsystems exceeded their respective minimum time requirement for operating on battery standby power
All critical test issues were addressed and resolved during the testing period Based on testing performed at the FAA Technical Center it is recommended that the Mark 20 ILS be accepted for deployment
vii
1 INTRODUCTION
11 PURPOSE OF REPORT
The purpose of this test report is to document and summarize the results of the Operational Test and Evaluation (OTampE) Functional and Performance tests conducted on the Category IIIII Mark 20 Instrument Landing System (ILS) at the Federal Aviation Administration (FAA) Technical Center Atlantic City International Airport Integration testing was performed by ACNshy100D at the FAA Technical Center and at TamiamiKendell Executive Airport in Miami FL (TMB) The integration testing results are contained in a separate report
12 SCOPE OF REPORT
This report is prepared in accordance with the format specified in FAA-STD-024B dated August 22 1994 The report contains the system configuration test descriptions test equipment used data collection and analysis methods test results and conclusions and recommendations
2 REFERENCE DOCUMENTS
FAA-E-2852 Category IIIII Instrument Landing System with RMS January 25 1993
NAS-SS-1000 NAS System Specification Functional and Performance Requirements for the National Airspace System General February 1991
NAS-SS-1000 NAS System Specification Ground to Air Element VOL III February 1991
OA P 82001 uS Standard Flight Inspection Manual Change 46 January 1991
ILS Test Plan Category IIIII Instrument Landing SystemRMS Operational Test amp EvaluationIntegration Test Plan August 1993
Test Procedures ILSRMS Operational Test amp Evaluation Functional and Performance Test Procedures March 1994
TI 6750180 Localizer Electronic Subsystem Draft 10294
TI 6750181 Glide Slope Electronic Subsystem Draft 10294
TI 6750182 Remote Indication amp Control Equipment Draft 10294
TI 6750183 Link Control Unit Group Draft 10294
1
TI 6750184 Far Field Monitor Kit Draft 10294
TI 6750185 Portable ILS Signal Analyzer Group Draft 10294
3 SYSTEM DESCRIPTION
31 MISSION REVIEW
An ILS provides a means for safely landing aircraft at airports under conditions of low ceilings and limited visibility Category (CAT) IIIII ILS provides highly accurate lateral and vertical guidance information in the form of amplitude modulated radio frequency transmissions to specialized radio reception equipment on board the aircraft A CAT II ILS provides acceptable guidance information from the coverage limits of the ILS to 50 feet above the runway threshold while a CAT III ILS provides acceptable guidance to and along the surface of the runway The CAT IIIII ILS under test is the Mark 20 system produced by Wilcox Electric Inc The Mark 20 ILS modular design is based on a new generation of microprocessors and software With Remote Maintenance Monitoring (RMM) capability and the concept of remove and replace maintenance it will provide major airway facilities throughout the US with a more reliable and easily maintained system
32 TEST SYSTEM CONFIGURATION
The Mark 20 ILS consists of a localizer a glide slope and inner middle and outer markers providing lateral vertical and distance to threshold guidance respectively The Mark 20 ILS also includes a localizer Far Field Monitor (FFM) a Link Control Unit (LCU) Remote Control and Status Unit (RCSU) and Remote Status and Interlock Unit (RSIU) Maintenance equipment provided with the Mark 20 ILS are the Portable ILS Receiver (PIR) and the Portable Maintenance Data Terminal software (PMDT)
321 Localizer Subsystem Configuration
The localizer is a Very High Frequency (VHF) dual frequency capture effect system consisting of dual course and clearance transmitters (on air and hot standby) dual integral monitoring equipment (executive and standby) dual FFMs 14 element log periodic dipole antenna array and a Radio Frequency (RF) distribution unit and combining unit The localizer antenna array is located 1005 feet from the stop end of Atlantic City International Airport NJ (ACY) runway 04 on the extended centerline (figure 1)
322 Glide Slope Subsystem Configuration
The glide slope is an Ultra High Frequency (UHF) dual frequency capture effect system consisting of dual path and clearance transmitters (on air and hot standby) dual integral monitoring equipment (executive and standby) a three-element imaging
2
antenna array and an RF distribution and combining unit The glide slope antenna array is set back 875 feet from the threshold of ACY runway 04 with a Northwest offset of 400 feet from the runway centerline (figure 1)
323 Marker Beacon Subsystem Configuration
The marker beacons are a VHF system consisting of an inner marker middle marker and outer marker Each marker beacon includes a single transmitter single monitor and a single Yagi antenna element for the inner and middle marker and a dual Yagi antenna configuration for the outer marker Each marker beacon is configurable to perform as an inner middle or outer marker The inner middle and outer marker antennas are located 1086 feet 3500 feet and 4800 feet from the ACY runway 04 threshold respectively Due to property restraints the outer marker was not positioned in a normal operating location The inner marker is located on the extended runway centerline the middle marker is offset by 15 feet and the outer marker 41 feet both to the Northwest side of the extended centerline (figure 1)
14-1lOO5-w--_~1f-- -=6=144=middot-----------+141 1086 _I 2414 _I 1300 _I
I~----------~ ---------rshy - - - - -~I 14 Element LPD Looal1zer Array 400
plusmnGl1de Slope -~ VAnteJlna
FIGURE 1 MARK 20 ILS OTampE TEST SETUP
324 Remote Indication and Control Equipment Configuration
The Remote Indication and Control Equipment (RICE) consists of an RCSU and an RSIU The RCSU is directly connected to the localizer glide slope and each marker beacon (figure 2) Through this connection transmitter and monitor information for each subsystem is updated constantly at the RCSU Onoff reset and FFM bypass control are also provided at the RCSU The RSIU provides category of operation indication localizer glide slope and marker beacon transmitter status interlock control and display and FFM status and bypass control Power and ILS status are provided to the RSIU from the RCSU In an operational environment the RCSU would be located in the airport tower equipment room and the RSIU in the airport control tower cab
3
33 INTERFACES
The LCU provides a communications link between the Mark 20 and its associated Maintenance Processing System (MPS) The LCU is directly connected to the localizer glide slope and each marker beacon (figure 2) This connection is distinct and separate from the connection from the subsystems to the RCSU The decoder module running the MPS was developed by FAAUNISYS and tested by ACN-100D during integration testing at the FAA Technical Center The MPS is a remote system that is used to monitor all National Airspace System (NAS) facilities that have Remote Maintenance System (RMS) capabilities Remote control of each subsystem is provided directly from the LCU An operational LCU would usually be located in the airport tower equipment room For test purposes the LCU was located in room 306 of building 301 at the FAA Technical Center
IAirport Control Tor RSIUI
RCSU IEquipment RoomI
I Mtto~J II I I ~~~ I I ~~~ I I Mr~~ I I gl~~~ I I Locze~
II Far- FieldI MOoIt021
I I LeU IEquipment Room
MPSI I FIGURE 2 RCSU AND LCD TO SUBSYSTEM CONNECT DIAGRAM
4 TEST AND EVALUATION DESCRIPTION
41 TEST SCHEDULES AND LOCATIONS
All tests were performed at the FAA Technical Center Atlantic City International Airport New Jersey The sequence of events and time frame are as follows
EVENT
Localizer antenna installation November-December 1993 Glide Slope antenna installation January 1994 Electronic equipment arrival April 21 1994 ILS RMSIntegration testing May-August 1994 Alignment May-June 1994 Commissioning Type Flight Inspection July 12-13 1994 System Reliability and Maintainability July 1994-March 1995
4
42 PARTICIPANTS
The following FAA Region and FAA Technical Center personnel participated in the Mark 20 ILS installation and test
REGION ACTIVITY
Dave Goffinet Great Lakes Installation amp Alignment Daryl Fridge Great Lakes Installation Mark Collins Great Lakes Installation RO Campbell Western Pacific Installation amp Alignment Simon Sohn Eastern Installation Reggie Carter Eastern Installation Robert Dunlap Alaskan Installation Paul Everman WashDC Installation amp Alignment Jesse Jones Technical Center Installation Alignment amp Test Ben Bennett Technical Center Installation Alignment amp Test Byron Robins Technical Center Installation Alignment amp Test Ed Zyzys (Ret) Technical Center Associate Program Manager
for Test (APMT) Jack Townsend Technical Center APMT
43 TEST AND SPECIALIZED EQUIPMENT
MODEL DESCRIPTION
BIRD Analog Wattmeter NARDA 3020A Directional Coupler HP 8508A Vector Voltmeter (CAL 92293) HP 1725A Oscilloscope Fluke 8050A Digital Multimeter HP 8640B Signal Generator (CAL 61793) HP Protocol Analyzer Wilcox Portable ILS Receiver IBM Portable Maintenance Data Terminal
Instrumented Test Aircraft Laser Tracking System NIKE Radar Tracking System
44 TEST OBJECTIVESCRITERIA
441 ILS Installation and Alignment
The purpose of the installation and alignment procedure is to verify that the Mark 20 ILS can be properly installed aligned and made ready for a flight inspection using the draft technical documentation supplied by the contractor The following functional requirements outlined in paragraph 4311 of the ILS Test Plan were verified during the installation and alignment process
a The ILS shall broadcast lateral guidance along a fixed path referenced to the extended runway centerline
5
b The ILS shall broadcast vertical guidance along a fixed signal path referenced to the nominal final approach path to the runway
c The ILS shall broadcast a morse code facility ID code except when the facility is removed from service
d ILS lateral guidance transmissions shall discontinue automatically if parameters monitored at the localizer exceed predefined limits
e ILS vertical guidance transmissions shall discontinue automatically if parameters monitored at the glide slope exceed predefined limits
f The NAS shall provide for the shutdown of electronic precision landing systems for the purpose of National Defense
g The ILS shall monitor its operational status and certification and diagnostic test data
442 Flight Inspection
This test demonstrates the ability of the Mark 20 ILS to meet the requirements of a Commissioning Type Inspection as set forth in the US Standard Flight Inspection Manual OA P 82001 Change 46 dated 11891 and DOTFAA Order 824047 dated 51083 The following performance requirements of NAS-SS-I000 outlined in paragraph 4321 of the ILS Test Plan will be verified by the flight inspection
a The ILS shall provide lateral guidance throughout the descent path from at least 18 nautical miles (nmi) from the antenna to the lowest authorized decision height
b The ILS shall provide lateral guidance throughout the volume of space shown in Volume III of NAS-SS-1000 figures 32141211-1 and 1-2
c The ILS shall provide a mean course line within limits equivalent to the following displacements from the runway center line at the ILS reference datum
CAT II +- 25 feet CAT III +- 10 feet
d The ILS shall provide vertical guidance throughout the glide path from at least 10 nmi from the antenna to the lowest authorized decision height
e The ILS shall provide vertical guidance throughout the volume of space shown in Volume III of NAS-SS-1000 figure 32141221-1
6
f The ILS vertical guidance signal shall be adjustable to glide path angles between 2deg and 4deg
g The ILS shall maintain the glide path angle within
CAT II 75 percent of commissioned angle CAT III 40 percent of commissioned angle
h The lateral portion for ILS guidance shall be accurate to within the following at the reference datum
CAT II +- 25 feet CAT III +- 10 feet
i The ILS shall broadcast a morse code facility ID signal at least six times a minute except when collocated with Distance Measuring Equipment (DME) or a Microwave Landing System (MLS)Precision Distance Measuring Equipment (DMEP)
j The ILS marker beacons shall provide coverage over the following distances measured on the glide path and localizer course line
Inner Marker 500 +- 160 feet Middle Marker 1000 +- 325 feet Outer Marker 2000 +- 650 feet
k The marker beacons shall broadcast the following identification
Outer Marker Continuous dashes keyed at the rate of 2 per second
Middle Marker Alternate dots and dashes keyed at a rate of 95 dotdash combinations per minute
Inner Marker Continuous dots keyed at a rate of 6 dots per second
1 The ILS components shall discontinue operation automatically within the following time periods when their performance does not meet the required accuracy
Guidance Lateral Vertical
CAT II 5 seconds 2 seconds CAT III 2 seconds 2 seconds
m The ILS shall operate in the 75 Megahertz (MHz) 108-112 MHz and 329-335 MHz radio frequency bands
7
443 System Reliability and Maintainability
The purpose of this procedure is to ensure that the ILS signal quality does not vary as a function of time (eg temperature variations adverse weather conditions etc) and to evaluate the users ability to restore normal operation following system failure or malfunction There are no specific requirements outlined in NAS-SS-1000 for this procedure However OTampE policy requires that the system be evaluated for operational effectiveness and maintainability of equipment
444 Operation of Remote Status and Interlock Unit
The purpose of this performance test is to monitor status and demonstrate control of the ILS from an Air Traffic Control (ATC) facility using the RSIU The operational test will verify the following requirements as described in the ILS Test Plan
a The ILS shall respond to operational control from the Airport Traffic Control Tower (ATCT)
b The ILS shall transmit operational status to the ATCT
445 Standby Power
The purpose of the standby power test is to ensure that the battery power system provides for the continued uninterrupted normal operation if the primary power fails and upon restoration of power that the batteries recharge in the allotted time frame The standby power test will verify the following requirements
a The ILS shall have a continuously engaged backup power supply system which enables normal operation for at least 3 hours subsequent to failure of primary AC power input
b Landing facilities with backup power shall be capable of automatically switching to backup power within 1 second for those facilities serving CAT II and CAT III runways
45 TEST DESCRIPTIONS
451 ILS Installation and Alignment
All site preparation shall be inspected and approved prior to the commencement of the installation and alignment effort Test team personnel shall accomplish the installation and alignment in accordance with applicable Mark 20 draft instruction books and associated FAA ILS installation procedures Installation of the Mark 20 ILS will establish the test configuration for all testing There are no critical issues identified for the installation and alignment process A contractors representative shall be on call during this process for technical assistance if required
8
452 Flight Inspection
This test shall demonstrate the ability of the Mark 20 ILS to meet the requirements of a Commissioning Type Inspection as specified in the US Standard Flight Inspection Manual OA P 82001 Section 217 Standard flight patterns will be flown to determine that facility performance for the required parameters meets CAT IIIII tolerances All subsystems of the Mark 20 ILS shall be in normal operation and during the inspection configured per requirements specified in the flight inspection manual A flight inspection aircraft with crew and appropriate equipment to record and verify ILS commissioning toleranceslimits will be required Project personnel with appropriate equipment including a communications transceiver will make the required equipment configuration changes during the flight inspection The critical issue addressed during the flight inspection will be to determine if the Mark 20 ILS can meet the requirements of a Commissioning Type Inspection
453 System Reliability and Maintainability
4531 ILS System Reliability
Each subsystem will be monitored throughout the test period to determine operational reliability and stability Temperature variations and adverse weather conditions will be monitored to determine impact on each subsystem All equipment outages will be investigated to determine probable cause Each outage will be recorded on the DiscrepancyFailureImprovement Form The overall operational impact will be determined and summarized
4532 Freezing Rain Environment on Glide Slope Antennas
The outside temperature at the airport will be monitored for proper freezing conditions to conduct this test Reference Voltage Standing Wave Ratio (VSWR) monitor probe voltageI
amplitude and phase measurements will be obtained under normal conditions (ie the heaters off) Rain will be simulated (water spray) under freezing conditions and VSWR amplitude and phase will be measured with ice on the radomes and the heaters off The test will be repeated with the heaters on For safety purposes only the lower glide slope antenna will loaded with ice
4533 MaintainabilityFault Diagnostics
This phase of testing will be conducted in conjunction with the RMSlntegration testing of the ILS Emphasis will be placed on maintainability of the system functions of the PMDT elements of the ILS RMS for each subsystem and the interface to the MPS All failures (natural and induced) will be evaluated The adequacy of ILS technical instructions manuals and test equipment to provide useful and helpful trouble shooting information will be determined Corrective maintenance actions and fault diagnostic procedures will be as stated in the
9
appropriate section of the draft instruction manuals Induced faults will be nondestructive faults selected from the MK20 Maintainability Demonstration Task population and Failure Mode Selection List used in the factory maintainability demonstration
454 Operation of Remote Status and Interlock Unit
This test demonstrates the ability to control and monitor the status of the ILS from an ATC facility using the RSIU The RSIU is located in the test laboratory at the FAA hanger along with the RCSU and the LCU The RSIU was checked daily and monitored during various tests to verify
a ILS category of operation indication b Far Field Monitor status indication c Far Field Monitor bypass switch d Auralvisual alarm indication and control e Runway select switch f Recognition of a localizer course alignment shift g Subsystem onoff indication
455 Standby Power
Primary power shall be interrupted using the main Alternating Current (AC) breaker at each subsystem of the ILS and the automatic switchover to battery power observed and the elapsed time recorded All subsystems will operate on standby power for an extended period of time System operation will be monitored and the time period each subsystem operated on batteries (to shutdown) will be recorded Upon restoration of primary power the ability of each subsystem to restore batteries to a full charge condition shall be observed
46 DATA COLLECTION AND ANALYSIS METHOD
461 ILS Installation and Alignment
There are no specific analysis requirements for the installation and alignment of the ILS All instructions and procedures (portions used at the FAA Technical Center) in the contractor-provided draft technical instruction books were checked for accuracy and discrepancies reported to the program office and the contractor
462 Flight Inspection
4621 FAA Flight Inspection
The FAA flight inspection was performed by an aircraft and crew from the Flight Inspection Field Office (FIFO) located at Oklahoma City Oklahoma Commissioning flight inspection criteria and tolerances specific to ILS CAT II operation were applied for this inspection This data was collected using the Automatic Flight Inspection System (AFIS) aboard the aircraft Because the system was located at a test site location the ILS
10
facility data was manually entered into the AFIS data base The recorded data was analyzed by FIFO personnel using standard flight inspection report procedures The flight inspection report is attached as appendix A
4622 FAA Technical Center Flight Evaluations
Periodic flight measurement missions were conducted on the Mark 20 using FAA Technical Center aircraft and data collection packages Tracking data for these flights were collected using the FAA Technical Center NIKE radar andor laser tracking systems The formatted tracking data was provided to ACT-360 personnel on 9-track tapes The tracking data was transferred to the VAX system located in building 301 using the program trkshyibm-to-vaxexe The tracker data was then smoothed using the program smoothexe l1 The smoothed tracker data was thenbull
translated and rotated to put the origin of the tracking coordinate system at the base of the glide slope mast using the program trarotlexe A control file containing the latitude longitude and Mean Sea Level (MSL) elevation of the tracker and the point that the tracker data is translated and rotated to is required to run the program
These combined tracker and airborne data were then transferred to a local PC using Kermit The data contained in these files are time tracked x tracked y tracked z and receiver DDM Guidance error was then calculated from this data on an AST Premmia 466d computer This guidance error was calculated by converting the tracked aircraft location to a Difference in Depth of Modulation (DDM) value The two equations used were
DDM VALUE = 0155 (ddm) TAN-1( Y-400) For Localizer 28 0 x+6274+71
DDM VALUE 00875 (~dm) [3 0 -TAN-1( z+4 42 l] For Glide Slope032 ~X2+y2
Where x y and z are the Cartesian coordinates of the tracked aircraft position with the origin located at the base of the glide slope mast the positive x-axis parallel to the runway 04 centerline and in the direction of threshold and the positive yshyaxis in the direction of the runway 04 centerline The 6274 feet added to the x coordinates and the 400 feet added to the y coordinates in the localizer calculations are to move the origin of the tracking data to the phase center of the localizer antenna array 442 feet was added to the z coordinates in the glide slope calculations and 71 feet was added to the x coordinates in the localizer calculations to compensate for the difference in the location of the tracking point and the glide slopelocalizer antennas The DDM values were calculated using the measured coursepath widths of 28 0 and 064 0 for the localizer and the glide slope respectively The calculated DDM values are then
11
subtracted from the receiver DDM value to provide the guidance error This error is then converted to micro amps and analyzed using CAT IIIII tolerances provided in the us Standard Flight Inspection Manual OA P 82001
463 System Reliability and Maintainability
4631 Stability During Extreme Weather Conditions
A computer program was developed by FAA Technical Center personnel to record data serially from a Heath ID-5001 Weather Computer and the Mark 20 LCU This program is a stand-alone program in that the Wilcox PMDT software is not required in order to collect data from the ILS
The code was compiled and linked using Borlands Turbo CC++ version 30 The source code used for this project is not ANSI C compatible
The following weather conditions and Mark 20 monitor readings are collected
Heath Weather Station
Outside temperature (OF) Instantaneous rain rate (inhr) Barometric pressure (inches of Hg) Wind speed (MPH) Wind direction (degrees from true north)
Localizer Executive Monitor 1 and 2 and Standby Monitor 1
Course RF level () Course width (DDM) Course SDM () Course DDM (DDM) Course to Clearance frequency difference (kHz) Clearance RF level () Clearance width 1 (DDM) Clearance width 2 (DDM) Ident modulation percentage () (Executive monitors only)
Glide Slope Executive Monitor 1 and 2 and Standby Monitor 1
Path RF level () Path width (DDM) Path SDM () Path DDM (DDM) Course to Clearance frequency difference (kHz) Clearance RF level ( )
12
Inner Middle and Outer Marker Beacons
RF level () Voltage standing wave ratio (no units) Ident modulation percentage () Ident keying (0 = off 8 = keyed 16 = continuous)
Analysis of this data involves plotting all weather and ILS parameters against time and noting unusual changes Abrupt changes in monitored ILS parameters are compared to weather parameters to determine if a correlation exists Extreme changes in weather over short periods of time are also noted and compared to ILS performance during that same time period to evaluate the ILS performance during varying changes in weather
4632 Ice Loading Effects on Glide Slope Antenna Elements
The outside temperature at the airport was monitored for proper freezing conditions to conduct this test The two parameters to be measured during this test were the antenna VSWR and RF phase on the monitor line The VSWR was measured on the antenna feed lines to the lower and middle glide slope antennas and the relative RF phase difference was measured between the equipment side of the antenna feed cable and the monitor return cable These data were collected using an HP 8405A vector voltmeter Several baseline measurements were made during varying weather conditions before the ice tests were conducted These baseline measurements were also made immediately before loading the glide slope antennas with ice The measurements taken with ice formed on the antennas were analyzed by comparing the data to the baseline measurements Any significant deviation from the baseline would constitute a failure
4633 Glide Slope Clearance Monitoring
Revision m of the localizer and glide slope monitor software was replaced with revision n This software release addressed the glide slope clearance RF level and Sum of the Depth of Modulation (SDM) monitoring errors (deployment critical) For test purposes the new software was initially installed in monitor 1 with revision m remaining in monitor 2 This allowed for comparison of monitor readings of both software versions as transmitter parameters were varied Sidebands Only (SBO) level clearance SDM and clearance RF levels were independently stepped from their normal operating values to both high and low extreme levels As these transmitter parameters were adjusted the clearance RF level and SDM were recorded from both monitors This allowed for easy data collection by the PMDT as both monitors readings could be viewed at the same time
13
4634 Fault Diagnostics Evaluation
The data collected for this test is the result of manual diagnostics after a fault is inserted into the system Failure of this test would be an unacceptable rate of erroneous indications of the Line Replaceable Unit (LRU) causing the system malfunctions
464 Remote Status and Interlock Unit
4641 ILS Category of Operation Indication
The localizer course DDM was changed to 0050 DDM using the PMDT from the LCU The time was measured from when the DDM change took effect and when the RSIU indication changed from CAT III to CAT II The time was also measured between the CAT II indication and the CAT I indication These time values were then compared to the RCSU CAT III to CAT II and CAT II to CAT I downgrade time settings
4642 Far Field Monitor
A computer program was developed to record FFM readings serially from the Mark 20 localizer This program is a stand-alone program in that the Wilcox PMDT software is not required in order to collect data from the localizer The code was compiled and linked using Borlands Turbo CC++ version 30 The source code used for this project is not ANSI C compatible
The program is hard-coded for the Mark 20 localizer PMDT port to be connected to the computers communications port 1 This program cannot be used to collect Mark 20 data remotely The cable used to connect the computer to the localizer is a standard null modem cable Pins 2 and 3 are switched ie pin 2 of one side of the cable goes to pin 3 of the other side and vice versa Pin 5 is used for the signal ground for DB-9 connectors and pin 7 for DB-25 connectors The communications parameters for the localizer are no parity eight data bits and one stop bit The program is hard-coded to communicate with the localizer at a data rate of 4800 baud
To begin the program run FFMEXE by typing ffm at the DOS prompt The program will log onto the localizer and begin collecting FFM readings immediately The FFM readings will be displayed on the screen as the data is being collected The program is terminated by pressing any key The collected data will include the monitored DDM and RF level as well as the date and time of the reading This data will be recorded on disk in space delineated ASCII format The filenames of the data collected will be the time when the file was closed with an extension of FF1 for FFM 1 and FF2 for FFM 2 ie files that were closed at 0952 hours will be named 0952FF1 and 0952FF2
14
The program records a DDM and RF level reading from each FFM at a rate of approximately two times per second
Localizer approach data was collected by a Convair 580 with a Boeing 727 (B727) located at various test locations along the runway including the ILS critical area An approach was flown and airborne data collected while the B727 taxied from the threshold to the stop end of runway 04 A handwritten log was generated to note the time that the B727 had arrived or departed a test location The test locations are shown in figure 3 The recorded DDM measurements for each FFM are plotted versus time and compared to flight measurements collected while the B727 was located at that position Any abnormal disturbances discovered in the airborne data that is caused by the presence of the B727 should also be detected by the FFM in higher than normal DDM readings and the appropriate indication at the RSIU
pound1
TIDdBegln
PosIIlon4 PopoundIUonl3 poslUonn
31
TlIldEnd) PopoundUonl
FIGURE 3 LOCATIONS OF B727 WHILE AIRBORNE LOCALIZER APPROACH AND FAR FIELD MONITOR DATA WAS COLLECTED
465 Standby Power
An AC power failure was simulated by turninthe equipment shelters for each subsystem
g off the AC The time of
power the
to
induced power failure was recorded along with the switchover to battery power Data was collected from each subsystem while operating on battery power by recording all monitor alarms that were sent to the MPS Unacceptable results would be any monitored parameter of any subsystem going out of tolerance while operating on battery power To verify compliance with the minimum time requirement for operating on standby power the total time on batteries for each subsystem was obtained by recording the time that an LCU communications fault occurred This fault is the only indication that the batteries had reached the cut off voltage This time was then compared to the recorded AC power failure time and evaluated
15
5 RESULTS AND DISCUSSION
51 ILS INSTALLATION AND ALIGNMENT
Each subsystem of the Mark 20 ILS (localizer glide slope marker beacons and the FFMs) were installed by FAA region and FAA Technical Center personnel The initial draft technical instruction books provided by the contractor were lacking in specific instructions required to complete the installation The experience and knowledge of the FampE personnel involved in the installation allowed the process to continue Recommended changesadditions were forwarded to the program office AOS-240 and the contractor Subsequent updates of the manuals resulted in acceptable manuals The alignment process verified that the system was ready for the FAA flight inspection The system met required flight inspection criteria
52 FLIGHT INSPECTION
521 FAA Flight Inspection
The Mark 20 ILS under test passed all CAT IIIII commissioning flight tests conducted by the Oklahoma City FIFO See appendix A for the flight inspection report
522 FAA Technical Center Flight Evaluation
FAA Technical Center flight evaluations met CAT IIIII flight inspection criteria Figure 4 shows a localizer approach Figure 5 shows a localizer orbit Figure 6 shows a glide slope approach Figure 7 shows a glide slope level run
53 SYSTEM RELIABILITY AND MAINTAINABILITY
During reliability and maintainability testing the following LRUs were replaced due to equipment failure
Localizer (1) RF relay on the transfer switch assembly (1) RMM cca
Glide Slope (1) Transient Suppressor Board
Marker Beacons (1) ACDC converter
Test Trouble Reports (TTRs) generated during testing and their resolution are contained in appendix B
16
---Localizer Approach
CAT 11111 Tolerance Flown 311085 (AM)
30 ~ 0 agt
20
10 ~ 2shy 0
0 ~
middot10
-20
~ 0 middot30 ~
middot2 -1 0
Distance from Threshold (NM)
y
76532
~~ 1-
r
i
Run 11
FIGURE 4 LOCALIZER APPROACH GUIDANCE ERROR PLOT
m
25lJ ~ 0 agt 200
150
100
50
0
50
100
150
200
~
~ 0 25lJ ~
m
Run iI6
Localizer Orbit Flown 31085 (AM)
V~r v- --
~
Course Width = 567deg
rshy - middotmiddot1middotmiddot
-- ~
~
y ~~ middot30 -20 middot10 o 10 20
Angle from centerline
FIGURE 5 LOCALIZER ORBIT
17
Glide Slope ApproachCAT IVIII Tolerance
Flown 310195 (AM)
40 ~-
N 3J middotmiddotmiddotmiddotmiddotmiddotr bull ~ i ~ - -
2Or-+-----+-----+-~--t-____ 1___+___+-~middotmiddotmiddotmiddot pf~ middot + ~ 10 I-+---~=--+_--+-----I------l---_t-~
Path angle =304middot
~ 0 ~ 0 middotMAmiddot hi~1 JiJI NhltJ jii fi ~ 1 V~middotiltJ~ ~~)VI ~ ~ ~ ~ l~lk
2OI---l++I----+--+---+------LI----+--tHf-f---1 11
~ 50 r-+- -+__ _t----+-_
_ _ f- __ --f- _ --1_ -1_ _
LC)
o 2 3 4 5 6 7
Distance from Threshold (NM)
Run 11
FIGURE 6 GLIDE SLOPE APPROACH GUIDANCE ERROR PLOT
Glide Slope Level Run Flown 310195 (AM)
250 I---+---+------+---+---t------+--r-~ J 1 CJ Width = 64middot bull
Cgt 200 Symmatry= 5545 150 e__path Angle = 304middot rmiddotmiddotmiddot 100
~ ~ 50 fo------+----+----+-~---+-~-gt-----+------+-------i
~ 0 ~
y 501--~+-7--+-----14-~+------t-~--+~-I--~
100 middot 7
~ imiddotmiddotmiddotmiddot middotmiddot middot -
250 --~L-~---~L_~---~----------_L--J
200 225 250 275 300 325 350 375 400
Elevation Angle
Run tJ
FIGURE 7 GLIDE SLOPE LEVEL RUN
18
531 Stability During Extreme Weather Conditions
The only observed correlation between weather and the Mark 20 performance was temperature and the course and clearance RF power for the localizer and glide slope This correlation shows an approximate 2 percent change in RF level to a 20 0 Fahrenheit change in temperature This change is relatively insignificant but could be a problem depending on the recalibration schedule The monitors were calibrated at the test site during the summer months Due to the change in average temperature during the winter months the average RF levels were in the vicinity of 104 percent The daily fluctuation in temperature varied the RF levels between 103 percent and 106 percent At facilities with colder winter temperatures a subsystem calibrated during the summer may drift out of RF level tolerance during the winter and vice versa Only output power of the subsystem is affected as the impedance characteristics of exposed cable and antennas change with the temperature This condition will not affect the quality of guidance because Carrier and Sidebands (CSB) and SBO signals are attenuated at the same rate but some outages could occur due to RF levels exceeding alarm limits Figure 8 shows the temperature and glide slope path RF level for January 30 1995 The monitored weather and Mark 20 parameters for the month of January 1995 are contained in appendix C
Temperature and Glide Slope Path RF Level 01f3JJ35
r~-- bull ~-- - - ----- ---- bull-r-~-- - - - - ----T -- shy-- shy
P~~ yVbull~
~ ~ hv-~U 104 ~ ~ IV ~ ~ 50 f----+----+----+---+--~-+__-____I 103
~ i ~ ~ ~~~ rbull~ ~
~ 40 r---t---t----7---b------t- --t-----_ 102 a t shy
30 - 101 - - -
~ - ~ ~ 20 --L-_L------_L------_L------_l-----_l----i-----l 100
o 400 IDl 1200 1~ 2cm 24m
Temperature Time
-- RF Level
FIGURE 8 CORRELATION OF TEMPERATURE AND MONITORED GLIDE SLOPE PATH RF LEVEL FOR JANUARY 30 1995
19
532 Ice Loading Effects on Glide Slope Antenna Elements
Figure 9 shows the configuration for testing ice loading effects Table 1 indicates the date time conditions VSWR phase and magnitude of the measurements made on the antennas This data indicates that no significant changes in measured parameters were observed during ice loading or antenna heater operation The maximum variations from the baseline measurements were VSWR 003 Phase 13deg and magnitude 028 dB Based on these measurements it appears that the antenna heaters are not required The data collected also indicates that antenna heater operation does not affect the radiated signal During this testing period (8 months) no antenna heater failures occurred Because the glide slope electronic equipment had not been delivered at the time of this test these measurements were obtained using a signal generator for the provided signal thus no signal in space measurements were possible and no determination of actual provided guidance can be made
CINe Ilape AIIl DemIllll
~DiI1_
c (NARDA3Ol1lAl
I I ~
I r--r shy S10luo SipdGe I
(RPM I I I I(IuUlIplilodo)
I (VSWR) IL__________
81Irb HPVecll VaIlm
FIGURE 9 TEST CONFIGURATION FOR MEASURING VSWR AND AMPLITUDE OF GLIDE SLOPE ANTENNAS LOADING TESTING
PHASE DURING ICE
533 Glide Slope Clearance Monitoring
During the Technical Interchange Meeting held in Oklahoma City in August 1994 only one deployment critical issue was raised the glide slope clearance detector did not compensate for SBO energy that might be present This accounted for inaccurate Clearance RF Level and Clearance SDM monitor readings
20
TABLE 1 GLIDE SLOPE ANTENNA MEASUREMENTS DURING ICE LOADING TESTING
I
I-
I DATE I CONDITIONS I ANTENNA I VSWR I PHASE I MAGNITUDE I 0127 No ice on antenna 18degF (normal)
Ice formed on antenna from hand sprayer 18degF Time 0941
Second reading with ice Time 1000
Heater turned on at 1005 Measurement taken at 1045 Antenna partially de-iced 30
Antenna partially de-iced 60 Time 1225
Antenna partially de-iced 80 Time 1400
Heater on for 4 days Antennas dry 24degF Time 0900 (normal)
Heaters on for 5 days Antennas dry 31degF Time 1340 (normal)
Heaters on for 6 days Antennas dry 18degF Time 0917 (normal)
Heaters on (hardwired) Water sprayed on antennas Ice formed on reflectors and icicles hanging from sides of radomes No ice formed on top of radomes 18degF Time 0948
Same conditions as above entry Time 1007
No ice on antenna 18degF (normal)
No ice on antenna Heaters on for 4 hours 18degF
Heater on for 4 days Antennas dry 24degF Time 0900 (normal)
Heaters on for 5 days Antennas dry 31degF Time 1340 (normal)
Heaters on for 6 days Antennas dry 18degF Time 0914 (normal)
Lower
Lower
Lower
Lower
Lower
Lower
Lower
Lower
Lower
Lower
Lower
Middle
Middle
Middle
Middle
Middle
1157
1165
1168
1174
1177
1169
1162
1187
1164
117
1171
1080
1080
1090
1113
-220deg 493 dB
490 dB
492 dB
481 dB
475 dB
465 dB
466 dB
472 dB
466 dB
467 dB
465 dB
505 dB
482 dB
482 dB
492 dB
486 dB
0127 -221deg
0127 -219deg
0127 -209deg
0127 -209deg
0127 -209deg
0131 -207deg
0201 -212deg
0202 -211deg
0202 -213deg
0202 -216deg
0127 306deg
0127 311deg
0131 317deg
0201 315deg
0202 1079 313deg
Wilcox agreed to simultaneously pursue both a hardware and a software correction for this problem If the software correction which could be implemented sooner than a hardware correction was satisfactory it would be implemented and the effort on the hardware correction would cease
On September 3 1994 revision m of the localizer and glide slope monitor software was replaced with revision n This software release addressed the deployment critical issue mentioned above For test purposes the new software was initially installed in monitor 1 only This allowed for easy comparison of monitor readings of both software versions as transmitter parameters were varied Tables 2 through 4 show the data that were collected
Normal transmitter parameters are Path RF Level = 266 Watts SBO Amplitude = 55 CLR RF Level 020 Watts
TABLE 2 GLIDE SLOPE CLEARANCE RF LEVEL AND SDM AS SBO LEVEL IS ADJUSTED FROM 0 TO 100 IN 5 INCREMENTS
II I Monitor 1 I Monitor 2
Transmitter Clearance Clearance
800
754
765
780
790
794
798
802
805
805
805
804
805
804
803
804
802
801
Clearance Clearance
800
597
638
680
725
748
775
831
859
891
920
950
982
1008
1037
1059
1075
1083
Normal (55 ) 1000 1000
SBO Level 100
SBO Level 90
SBO Level 80
SBO Level 70
SBO Level 65
SBO Level 60
SBO Level 50
SBO Level 45
SBO Level 40
SBO Level 35
SBO Level 30
SBO Level 25
SBO Level 20
SBO Level 15
SBO Level 10
SBO Level 5
SBO Level 0
1026 1174
101 8 1133
1008 1094
1002 1052
1001 1034
1001 1016
996 983
994 968
994 954
993 941
992 928
992 917
992 907
993 898
993 891
994 886
994 883
22
TABLE 3 GLIDE SLOPE CLEARANCE RF LEVEL AND SDM AS CLR SDM IS ADJUSTED FROM 50 TO 90 IN 5 INCREMENTS
Monitor 1 (New Software)
Monitor 2 (Old Software)
Transmitter Setting
Clearance RF Level
Clearance SOM
Clearance RF Level
Clearance SOM
Normal (40 )
1000 800 1000 800
CLR SDM 90 1002 884 1007 882
CLR SDM 85 998 845 1005 845
CLR SDM 75 996 752 995 757
CLR SDM 70 996 706 993 71 6
CLR SDM 65 996 657 989 670
CLR SDM 60 995 611 986 622
CLR SDM 55 993 558 984 571
CLR SDM 50 997 510 984 520
TABLE 4 GLIDE SLOPE CLEARANCE RF LEVEL AND SDM AS CLR RF LEVEL IS ADJUSTED FROM OOOW TO 050W IN 005W INCREMENTS
CLR
CLR
CLR
CLR
CLR
CLR
CLR
CLR
CLR
Transmitter Setting
Normal (020 W)
RF 50 W
RF 45 W
RF 40 W
RF 35 W
RF 30 W
RF 25 W
RF 15 W
RF 10 W
CLR RF 05 W
RF 000 W
Monitor 1 (New Software)
Monitor 2 (Old Software)
Clearance RF Level
Clearance SOM
Clearance RF Level
Clearance SOM
1000 800 1000 800
1454 800 1363 901
1402 816 1326 91 3
1331 825 1276 918
1263 821 121 8 903
1188 818 1157 881
1086
879
749
577
262
807
781
751
681
412
1072
903
798
6625
433
840
742
650
485
116
23
These results demonstrate that the software correction to the glide slope clearance monitoring issue is an acceptable solution
534 Fault Diagnostic Evaluation
Fault diagnostic testing resulted in an unacceptable percentage of erroneous LRU indications A total of 23 faults were induced on Mark 20 subsystems with 17 correct results for a success rate of 7391 percent Table 5 indicates the faults that were introduced the LRU affected and the results of the fault diagnostics algorithm All incorrect LRU indications at the glide slope and localizer involved faults which shutdown both transmitters such as detector faults antenna subsystem faults or distribution unit faults During regression testing all faulty LRU indications were retested and found to be corrected
TABLE 5 FAULT DIAGNOSTIC RESULTS
LRU affected
Localizer Audio Generator
Localizer AC-DC Converter 1 AC-DC Converter 2
Localizer RMM cca
Localizer Transfer Switch Assembly
Localizer Distribution Unit
Localizer Integral Detector
Fault Introduced
Bent out pin 9 of U11
Adjusted Vadj on AC-DC converter 1 and 2 until the lion batteries II LED was illuminated
Removed jumpers from J2
Removed CLR CSB feed line to the RF relay
Disconnected the 1L antenna feed line in the DUCU
Connected all gain jumpers to the course position detector ie pins 5-6 7-8 and 9-10
Fault Diagnostics Results
Audio Generator
AC-DC Converter 1 AC-DC Converter 2
Fault diagnostics could not be performed because the fault affected PMDT communications The LED on the RMM card was blinking indicating a fault
Transfer Switch Assembly
Fault diagnostics would not run from the PMDT or the MPS
Fault diagnostics would not run from the PMDT or the MPS
24
TABLE 5 FAULT DIAGNOSTIC RESULTS (Continued)
Localizer Antenna Subsystem
Far Field Monitor
Glide Slope Audio Generator 1 Audio Generator 2
Glide Slope Interface cca
Glide Slope ACDC Converter
Glide Slope RMM cca
Transfer Switch Assembly
Glide slope DUCU Carrier power divider
Glide slope integral detector
Glide slope antenna element
Disconnected the 1R monitor line from the DUCU
Adjusted R83 (CHPAUD level adjust) fully clock wise
Bent out pin 9 of U11
Bent out pin 28 of U29
Adjusted Vadj on the ACDC converter until the on batteries LED was illuminated
Removed jumpers from J2
Removed the CLR CSB line from the RF relay
Loosened the OUT 1 TNC connector on the CSB power divider Zl
Connected all gain jumpers to the course position detector ie pins 5-6 7-8 and 9-10
Disconnected upper antenna feed line at the wattmeter body
25
Fault diagnostics would not run from the PMDT or the MPS
Far Field Monitor
Audio Generator 1 Audio Generator 2
Interface cca
ACDC converter
Fault diagnostics could not be performed because the fault affected PMDT communications The LED on the RMM card was blinking indicating a fault
Transfer Switch Assembly
Fault diagnostics would not run from the PMDT or the MPS
Fault diagnostics would not run from the PMDT or the MPS
Fault diagnostics would not run from the PMDT or the MPS
TABLE 5 FAULT DIAGNOSTIC RESULTS (Continued)
Marker beacon ModPA
Marker beacon ModPA
Adjusted R55 counter clock wise until the voltage at R53 was at a minimum
Adjusted R37 clock wise until the voltage at pin 6 of J2 was at a minimum then replaced the jumper
ModPA
ModPA
Marker Beacon ACDC Converter
Adjusted Vadj until the on batteries LED illuminated on front panel
was the
ACDC converter
Marker Beacon DCDC converter
Changed the alarm limits for the +5V supply to put the monitor into alarm
DCDC converter
Antenna assembly Disconnected the antenna feed line at the antenna
Antenna assembly
54 REMOTE STATUS AND INTERLOCK UNIT
541 ILS Category of Operation Indication
During the test period the RSIU accurately displayed the category of operation over varying operational conditions The category downgrade timer was tested and found to be accurate
542 Far Field Monitor
Table 6 indicates the position of the B727 during testing Figures 10 and 11 contain DDM values measured by each FFM versus time FFM 1 is located at the inner marker and FFM 2 at the middle marker The data collected indicate that minimal interference was detected by the FFMs The large DDM spikes at 092145 and 095438 are when the B727 was at the stop end of runway 04 and turning to face the taxiway The spikes however were not of sufficient magnitude to put the FFM into alarm (The FFM alarm settings were set to plusmn 0009 DDM and the spikes were only -0004 and -0005 DDM for FFM 1 and 2 respectively) Airborne data collected indicates that no effect on provided guidance was caused by the presence of the B727 in positions 1 2 3 or 4 (figure 3)
26
TABLE 6 LOG OF THE POSITION OF THE B727 DURING FAR FIELD MONITOR TESTING
I Time I B727 Location I 091525 727 in position 1
019645 727 begins to taxi forward to put the nose wheel on centerline keeping the fuselage perpendicular to centerline
019647 727 nose wheel on centerline
092122 727 begins a the taxiway
180 degree pivot on centerline to return to
092145 727 completes the pivot and is on the taxiway
092742 727 in position 2
093053 727 begins to taxi forward to put the nose wheel on centerline keeping the fuselage perpendicular to the centerline
093114 727 nose wheel on centerline Another 727 type aircraft is taxiing on runway 04 between the FAA B727 and the runway 04 threshold
0931 43 The other aircraft turns off the runway to a perpendicular taxiway at the threshold of 04
093416 The B727 begins a 180 degree pivot return to the taxiway
on centerline to
093435 The B727 completes the pivot and is on the taxiway
093625 The B727 begins taxiing from position 2 on the taxiway
to position 3
093716 B727 in position 3
093943 B727 begins centerline centerline
to taxi forward to put the nose wheel keeping the fuselage perpendicular to
on the
094033 The B727 begins a 180 degree pivot return to the taxiway
on centerline to
094229 B727 in position 4
094845 A King Air type aircraft taxis runway 22 and takes off
to the threshold of
094952 A Bonanza type aircraft taxis 22 and takes off
to the threshold of runway
0951 46 B727 begins 04
to taxi to centerline at threshold of runway
095202 B727 begins to taxi from the threshold centerline of runway 04
to stop end on
095438 B727 ends taxi the stop end
on centerline and turns off runway 04 at
27
Far Field Mon~or 1 (Inner Marker) 210195
8727 Taxi test
0001 f------7-1h--f-----r1lr-nrr-l-------I--middot-middotJmiddotir-------t----t----j
~ Imiddotmiddot H~H middot~lIIJHmiddot8 01))) f---~ff---J-r-fyf-U~ffe
-0001 r---~f-----1f-----H-j-t -- tt-----J--1
-0004 f------f--7--I------f----i----~-1f------I----- shybullbull----------+------1
- middot-imiddot-middot ltj
-0005 ---iiLUiiLUii---wlW---lW---LLL---LLL---LIJ
90 91 92 93 94 95 96 97 98 99 100
Time (hours)
FIGURE 10 FAR FIELD MONITOR 1 READINGS WITH A B727 IN THE LOCALIZER ENVIRONMENT
Far Field Monitor tf2 (Middle Marker) 2110195
8727 Taxi test 0005 C-Cfmiddot gtltmiddot1middotmiddotmiddotmiddot gtmiddotmiddotmiddot-middotImiddotlt-middotmiddotmiddotjmiddotmiddot-middotmiddotmiddot middotmiddot1middot gt
-middotmiddot-imiddotmiddot j 0004 1-----11---1-----1----i---i-------+------+------+---i
j -
middotmiddotmiddotmiddot1middotmiddot o(m r--1--t-+~i---~~+ -f-f--4
- imiddot imiddot j i- imiddot j bull bull bullbull imiddot i j bullbull jmiddoti
-0005 Liii--JLiii--JLiiiiJLiiiiJiJ-------l---l
90 91 92 93 94 95 96 97 98 99 100
Time (hours)
FIGURE 11 FAR FIELD MONITOR 2 READINGS WITH A B727 IN THE LOCALIZER ENVIRONMENT
28
55 STANDBY POWER
All subsystems (localizer glide slope inner marker middle marker outer marker and RCSU) exceeded the specified time operation requirement for operation on standby power No anomalous monitor readings were observed during standby power operation Table 7 shows the amount of time each subsystem operated on standby power and its respective requirement
The localizer glide slope and RCSU subsystems recharged their respective batteries without incident The marker beacons however could not recharge their batteries to full charge without shutting down This is due to the high current draw required to recharge the batteries which in turn overheated the power supplies and caused them to turn off The failed power supply was returned to Wilcox for analysis
TABLE 7 MARK 20 SUBSYSTEM STANDBY POWER TEST RESULTS AND REQUIREMENTS
Mark 20 Subsystem Time operated on standby power
(hours)
Standby Power Requirement (hours)
4
4
72
72
72
1
Localizer 11
Glide Slope 165
Inner Marker 172
Middle Marker 168
Outer Marker 162
RCSU 25
6 CONCLUSIONS
All testing conducted on the Mark 20 Instrument Landing System (ILS) concluded in satisfactory performance of the system Although the initial draft instruction books provided by the contractor were incomplete subsequent revisions to the manuals resulted in an acceptable product The alignment process outlined in the manuals verified that the system was ready for the FAA flight inspection
The Mark 20 ILS successfully met required Category IIIII criteria during the flight inspection conducted by the Oklahoma City Flight Information Field Office (FIFO) Additional flight evaluations were conducted by the FAA Technical Center test team utilizing FAA Technical Center aircraft flight measurement equipment and radarlaser tracking systems All FAA Technical Center evaluations were within Category IIIII tolerances
29
System reliability and maintainability were verified in that the few subsystem outages that occurred were easily identified and corrected The Mark 20 remained operational throughout the entire test period except for interruptions to conduct required testing The system is extremely stable Weather conditions were recorded and analysis indicated that weather had little or no affect on operation of the system
The Remote Status and Interlock Unit (RSIU) was monitored during various test scenarios and accurately displayed the correct category of operation (This is the monitordisplay unit that is placed in an Air Traffic Control [ATC] facility)
All subsystems (localizer glide slope inner marker middle marker outer marker and Remote Control and Status Unit [RCSU]) exceeded the specified time requirement for operation on standby battery power
During the test period there were no indications that the integration of the Remote Maintenance Monitoring (RMM) System into the ILS affected the operational effectiveness of the Mark 20
7 RECOMMENDATIONS
Based on the results documented in this report the Mark 20 is recommended for deploYment in the National Airspace System (NAS) It is further recommended that a correction to the outer marker battery charging problem as stated in TTR 09 be resolved
30
8 ACRONYMS
AC ACY AFIS APMT ATC ATCT B727 CAT CLR CSB DDM DME DMEP DUCU FAA FFM FIFO ILS LCU LED LRU MHz MLS MPS MSL ModPA NAS nmi OTampE PIR PMDT RCSU RF RICE RMM RMS RSIU SBO SDM TMB TTR UHF VHF VSWR
Alternating Current Atlantic City International Airport NJ Automatic Flight Inspection System Associate Program Manager for Test Air Traffic Control Airport Traffic Control Tower Boeing 727 Category Clearance Carrier and Sidebands Difference in Depth of Modulation Distance Measuring Equipment Precision Distance Measuring Equipment Distribution Unit and Combining Unit Federal Aviation Administration Far Field Monitor Flight Inspection Field Office Instrument Landing System Link Control Unit Light Emitting Diode Line Replaceable Unit Megahertz Microwave Landing System Maintenance Processing System Mean Sea Level Modulator and Power Amplifier National Airspace System nautical miles Operational Test and Evaluation Portable Instrument Landing System Receiver Portable Maintenance Data Terminal Remote Control and Status Unit Radio Frequency Remote Indication and Control Equipment Remote Maintenance and Monitoring Remote Monitoring System Remote Status and Interlock Unit Sidebands Only Sum of the Depth of Modulation TamiamiKendall Executive Airport FL Test Trouble Report Ultra High Frequency Very High Frequency Voltage Standing Wave Ratio
31
APPENDIX A Oklahoma City Flight Inspection Field Office
Flight Inspection Report
n PAGE 1 ef 5 I REVIEW INITIALS FLIGHT INSPECTION REPORTmiddot-INSTRUMENT LANDING SYSTEM
2 IDENT XJF1 LOCATlON ATLANnC CITY NJ
4 DATE DATES OF 5 OWNER F 3 COMMON SYSTEM shy 712-13194INSPECTlON
SITE EVALUATION XPERIODIC SPECIAL MR 6 TYPE OF INSPECTlON
COMMISSIONING INCOMPLETESURVEILLANCE X LOCALIZER I ISDF GLIDE SLOPE 75 MHz MARKERSX X7 RUNWAY IB FACILITY
NO 04 INSPECTED COMPASS LOCATORS LOA I IDME LlGHTlNG SYSTEM
9 LOCALIZER FRONT COURSE BACK COURSE
TX 1 COMO WIDTH 560
TX 2 TX 2TX 1 CATEGORY II INITIAL FINALOT INITIAL INITIAL FINAL OTFINAL OT INITIAL FINAL OT
563 561 COURSE WIDTH
390 386 MODULATION
2361324 260iS8 CLEARANCE 1 5 0
2341323 270iS8 CLEARANCE 90
1458 21n COURSE STRUCTtJREmiddotZ 1
1064 0058 COURSE STRUClUREmiddotZ 2
11003 1015 COURSE STRUCTtJREmiddotZ 3
COURSE STRUCTtJREmiddotZ 4
COURSE STRUCTtJREmiddotZ 5
085 VERTlCAL POLARIZATION
530 499 SYMME1RY
3R 1L ALIGNMENT
VOICE
S S IDENTIFICATlON 18 USABLE DISTANCE
DATE MONITORDATE DATEDATE 490 493 COURSE WIDTH (NMrow)
648 651 COURSE WIDTH ~)
237132 26565 CLEARANCE 150
22658 231158 CLEARANCE 90 9 ALIGNMENT 150
9 ALIGNMENT 90-11 GENERAL
1)( 1 10 GLIDE SLOPE
1)(2 UNSAT
OT
COMD ANGLE 300 SAT
CATEGORY II 75 MHz MARKERS INITIAL ANAL OT INITIAL XANAL 301 ANGLE COMPASS LOCATORS
790 DMEMODULATION 067 W1DlH UGHTlNG SYSTEMS
CLEARANCE BELOW PAlH 12 FACIUTY STAlUS
210 STRUCTtJRE BELOW PATH FC GIS BIC 41634 PAlH SlRUClUREmiddotZ 1 UNRESTRICTED
sn68 RESTRICTED
4016
PATH STRUClUREmiddotZ2
PAlH STRUClUREmiddotZ 3 UNUSABLE X X 10 USABLE DISTANCE NOTAMs
SYMMETRY
DATE MONITORDATE
13 REMARKS SPECIAL INSPECTION THIS WAS A SPECIAL INSPECTION (MAiNT REQUESl) FOR EVALUATION OF A UK 20 ILS SYSTEM AS INSTALLED AT A TEST SITE LOCATION COMMISSIONING FLIGHT INSPECTION CRmRIA AND TOLERANCES SPECIFIC TO ILS CATAGORY II OPERATION WAS APPLIED FOR THIS INSPECTION
GLIDE SLOPE TRANSMITTER NO 2 NOT CHECKED INSPECTION TERMINATED WITH MAINT CONCRRENCE DUE TO AIRCRAFT AVAILABILITY AND HIGHER PRIORITY MISSION REQUIREMENTS
(SEE CONTINUAnON SHEET FAA FORM 8240middot15 ATTACHED) A S~TU~ AIRCRAFT NOIREGION AEA F~IGNA~R [ -y J tr-~FIFO ACY N-4S9V-
FAA FORM 8240middot7 (590)
A-I
475
n FLIGHT INSPECTION REPORT--INSTRUMENT LANDING SYSTEM
SUPPLEMENTAL SHEET
1 LOCATION ATLANTIC CITY NJ shy
ltih DATE DATES OF INSPECTION 712-1394 middotmiddotmiddotraquol
4 GLIDE SLOPE
PATH ANGLE 4a GLIDE SLOPE lYPE CAP EFFECT
TXl TX2
ADVANCE TX 1 TX2
15 305
4b DEPHASE
RETARD TX 1 TX2
15 308
4c PATH ANGLE LOWERED TO UMIT
4d PATH ANGLE RAISED TO UMIT
4e PATH WIDTH NARROWED TO UMIT 304
4f PATH WIDTH WIDENED TO UMIT
4g CLEARANCE TX MODULATION DECREASED 300TO UMITmiddot (PRIMARY TX WIDE UMln
4h ATTENUATE MIDDLE TXl TX2 ANTENNA TO UMIT 04OB
302
4i ATTENUATE UPPER TXl TX2 ANTENNA TO UMIT 297
1ODB
I CAS SECTOR FAFALT
4j TRANSVERSE STRUCTURE I EDGE SECTOR FAFALT
4k MODULATION BALANCE TX1
41 PHASING TXl
4m FRONT COURSE AREA WHERE PHASING WAS CONDUClED
4n CLEARANCE BELOW PATH TXl S
5 REMARKS CORRECTION FACTOR OF + 003 APPLIED TO REPORlED LEVEL RUN ANGLE DATA
FAA FORM 8240 - 16 (590) A-2
PATH WIDTH
TX 1
075
076
056
075
075
071
TX2
shyPAGE 2 of 5 REVIEW INITIALS
2 IDENT XJF
STRUCTURE BELOW PATH
TX 1 TX2
22i
117
22i
22i
193
212
070 BElOW PATH
070 BElOW PATH
TX2
TX2
NM MSL
lX2
PAGE 3 OF 5 PAGES
1 REVIEW INITIALS FLIGHT INSPECTION REPORT-CONTINUATION SHEET
1 LOCATION ATLANTIC CITY NJ 12 IDENT XHF
3 FACILl1Y 1YPE ILS 14 DATEDATES OF INSPECllON 712-1394
1 USEABLE DISTANCE CHECKS PERFORMED ON LOCALIZER TRANSMITTER NO 2 AND GLIDE SLOPE TRANSMITTER NO 1 ONLY
2 LOCALIZER ALIGNMENT MONITORS CHECKED ON GROUND (AWY 04) ON TRANSMITTER NO 2 ONLY
3 MARKER WIDTH MM 1137 AND 1M 626
4 ILS (XJF) FACILITY DATA WAS MANUALLY ENTERED INTO THE AAS DATA BASE WIlli CHANE OF DISTANCE TO THE OUTTER MARKER TO 31595 (52 NM) TO FACILITATE MANUAL POSITION UPDATING FOR LEVEL RUN ANGLE RESULTS (ILS 2)
S GLIDE SLOPE MEAN SYMMETRY WAS CHECKED AT487 90HZ ON PATH ANGLE 301middot BELOW PATH ANGLE 264 - ABOVE PATH ANGLE UOmiddot MEAN WIDTH 076 DEGREES
6 ANTENNA TILT CHECK ANGLE S8P WIDTH SYMMETRY
90HZ 299 210 069 478 150HZ 293 209 065 514
FAA FORM 8240 - 15 (590) A-3
0 FLIGHT INSPECTION REPORT-LOCALIZER CLEARANCE PLOT
1 lOCATION
3 DATEIDATES OF INSPECTION 712-1394
6 iX 7 CFG 8 AlT 9 RADIUS
N -
10NM1 17
12 400
90 Hz
300
fI)
~ 200 w 0shyE lt0100 II 0 ~
0 got 70 SO 40 30 20 10 0
6 iX 7 CFG 8 AlT 9 RADIUS 1 B 17 10NM
12 400
90Hz
300
()
~ 200 w 0shyE lt o 100a 0 ~
0
90 70 SO 40 30 20 10 0
6 lX 7 CFG 8 ALT 9 RADIUS 1 C 17 10HM
12 400
90Hz
300
fI)
~200 w 0shyE 0lt
0100a 0 ~
0
90 70 SO 40 30 20 10 0
13 REMARKS TEST SITE HAD NO BACK COURSE FOR EVAlUATION
REGION AEA FLIGHT INSPECTORS SIGNATURE TE~~ AFOACY NlA
4 ANT TYPE
10 WIDTH FC 563
10 20
10 WIDTH FC 648
lot 20
10 WIDTH FC 490
1(l11P 20
----r 1lt-
ATlANTIC CITY NJ
11 WIDTH Be NlA
middotV
FAA FORM 8240 - 18 (590) A-4
~l~ L _- _ Y shy
PAGE 4 of 5 0
2 IDENT XJF
5 SITE ElEV 870
CODE FC -- shyBC ____
150 Hz
30 40 SO 70 90V
11 WIDTH BC
NA
150Hz
30 40 SO
11 WIDTH BC
NlA
30V 40 SO
CODE
70
CODE
150Hz
70
FC BC __
90V
bullbull
FC-shyBe_ bullbull
90
AIRCRAFT NO
N~t
0 PAGE ) of 5 I FLIGHT INSPECTION REPORT-LOCALIZER CLEARANCE PLOT
DATEIDATES OF INSPECTlON
90 Hz 150Hz
9()9
9()9
9()9
13 REMARKS TEST SITE HAD NO BACK COURSE FOR EVALUATION
1 LOCATlON
3
6 lX 2
12 400
300
(I)
~200 w a laquo o 100 cr u E
0
6 lX 2
12 400
300
(I)
~ 200 w a laquo o 100 cr u E
0
6 TX 2
12 400
300
(I)
~ 200 w a laquo 0100 cr U E
0
REGION ApoundA
AFO ACY
90 Hz 150 Hz
712-1394 14 ANT lYPE shy
7 CFG 9 RADIUS [10 WIDTH FC N 17
18 ALT
10NM 51
ATlANTIC CITY NJ
11 WIDTH BC
NlA
709 509 409 3()0 209 109 0 10 209 30 40 SOO
7 CFG 18 ALT 19 RADIUS 110 WIDTH FC B 17 10NM ~I
70 sao 40 30 209 10 0 1(Jl1 20
7 CFG 18 ALT 19 RADIUS 110 WIDTH FC C 17 10NM 11j
90Hz
709 SOO 400 300 20 10 0 10 20 3Ii 40 SOV
FLIGHT INSPECTORS SIGNATURE
NA
11 WIDTH BC
NlA
30 40 SOV
11 WlDlH BC
NlA
_ l I
TECHNICIAMS Irn~ ~~E -
2 IDENT XJF
5 SITE ELEV 870
CODE FC BC bull __ bull
709 909
ICODE FC BC bull __ bull
70 90
I FCCODE BC ____
150Hz
-7rJI 90
AIRCRAFT NO
N~g
FAA FORM 8240middot 18 (590) A-5
ILS WORKSHEET
1 IDENT XJF 12 DATE 712-13194 3 TYPE CHECK SPECIAL SITE
4 CREW DRAPERICOLESIKENNEDY 5 AIRCRAFT NO N~9114 -
6 NOTES OPERATIONAL TEST AND EVALUATION OF THEMK 20 ILS INSTALLATION AT AlLANTIC CITY NJ (KACY) RWY 04_
UMITED COMMISSIONING PROFILE FLOWN AT MAINTENANCE REQUEST
RINY 04
FREQ 10U5
LOCTYPE DUAL
CWo 160
ANGLE 300
GNDTEMP 83
CAT 2 OAT 22
GS TYPE CAP EFF BARO 3002
ALTITUDE
7 RUN
1
cm
1N
PAorALN
3 1N
4 1S
5 1S
6 1S
7 18
8 18
t 18
10 1N
11 25
12 2S
13 28
14 2N
1
1
2N
2N
17
18
18
20
2N
2N
1N
1N
456
298
21 1NL
1NG
1L
298
190 JLA
2M
191
PWorCW
571
U9
00000
490
558
669
148
563 -
483
559
651
1161
1167
573
NIA
163
092
90Hz SYM
498
496
499
499
NlA
494
530
491
501
419
4
494
100
NlA
498
FLAG or MOD
38
386
390
790
REMARKS 1OTHER DATA
INITlAL NORMAL CLEARANCES SATlSFACTORY 35 middot35
ADJUSTED NORMAL CLEARANCES SATISFACTORY
NO ANNOUNCED COURSE WIDTHmiddot SYSlEM FAULT
COURSE NARROW~LEARANCEWIDE
COURSENORMAL~LEARANCENARROW
COURSE WIDE CLEARANCE NORMAL OTWIDE
SYSTEM FAULT
COURSE WIDE CLEARANCE NORMAL
NORMALCONAGURATION
COURSENARROW~LEARANCEWIDE
COURSENORMAL~LEARANCENARROW
COURSE WIDE CLEARANCE NORMAL
NORMALCONAGURATION
RF ALARM 18NM AT LCA USEABLE DISTANCE CHECK 1010
RF ALARM 18NM AT 4500 FT 10middot10
APCH RF ALARM 18NMTO TlfRESHOLD bull SAT
10NM ARC RF ALARM CLEARANCES SAT
SYSTEM FAULT 8AD UPDAlE DATA - RECHECK
CHANGE DATA FOR A Ii2 NM MANUAL UPDATE
ILS 3 LOCAUZER Z1zn7 Z2a OIO58 23-110115
ILS 3 GIS Z1=416366 Z2=31O58 13=71017
FAA FORM 8240middot21 (590) A-6
ILS WORKSHEET
1 IDENT XJF 2 DATE712middot13J94
4 CREW DRAPERICOLESIKENNEDY
6 NOTES OPERATIONAL TEST AND EVALUAll0N OF THE P1K 20 ILS INSTALLAll0N AT ATLAN11C CITY NJ (KACY) RWY04
UMiTED COMMISSIONING PROFILE FLOWN AT MAINTENANCE REQUEST
3 TYPE CHECK SPECIAL SITE
5 AIRCRAFT NO N-89184
RWf 04 CW 560
FREQ 109amp5 ANGLE 300
LOCTYPE DUAL GNDTEMP 83
OAT 22
GSTYPE CAPEFF
CAT 2
BARO 3002
ALTITUDE
7 RUN
22
CFQ
iN
iN
iN
PAorALN
1L
9UA
9UA
19O~ PWorCW 90Hz SYM
FLAG or MOD
REMARKS OTHER DATA
~UGNMENTMONITORS NORMAL
ALIGNMENT MONITORS 160 HZ
AUGNMENT MONITORS 90 HZ
1-18
1
2
3
4
I
bull 7
bull bull 10
11
12
13
14
16
1
TX1
iN
iN
iN
is
1B
1M
1A
1R
1U
1U
iN
iN
iN
RF
RF
RF
297
304
301
297
299
302
301
2A3
294
301
293
299
207
229
113
229
117
212
210
209
210
067
648
066
076
075
076
G76
071
067
066
069
476
494
513
493
461
493
431
140
521
471
514
478
796
788
789
BEGIN GUDE SLOPE 71394
SYSTEM FAULTmiddot NO UPDATEmiddot SEE 2
INITIAL NORMAlmiddot REFERENCE
GIS STRUCTURE Z1- 41712 22= 9060 Z3= 41016
NARROW ALARM
COURSE WIDE ClEARANCE MOD ALARM
MIDDLE ANTENNA ATTENUATED TO ALARMmiddot GADB
DDLE ANTENNA ADVANCE PHASE 16 DEGREES
DDLE ANTENNA RETARD PHASE 15 DEGREES
SYSTEM FAULTmiddot NO DATA
UPPER ANTENNA ATTENUATED 1DB
NORMALmiddot LEVEL RUN
TUT CHECK middot150 HZ SIDE (lOCAUZER EXlRErtT1ES)
1LT CHECKmiddot 90 HZ SIDE (lOCAUZER EXTRErt11ES)
USEABLE DISTANCE FROM 10 NM bull 150HZ SIDE (8 DEGREES)
USEABLE DISTANCE FROM 10 NM bull 90HZ SIDE (8 DEGREES)
USEABlE DISTANCE FROM 10 NM bull ON COURSE
FAA FORM 8240 - 21 (590)
A-7
ILS WORKSHEET
1 IDENT XJF 12 DATE 7112middot13194 3 TYPE CHECK SPECIAL SITE
4 CREW DRAPERICOLESIKENNEDY - 5 AIRCRAFT NO N~184
6 NOTES OPERATIONAL TEST AND EVALUA1l0N Of lliEMK 20 ILS RWY 04 CW amp60 INSTALLATION AT ATLANTIC CITY NJ (KACY) RWYMmiddot
FREQ 10966 ANGLE 300
UMiTED COMMISSIONING PROFILE FLOWN AT MAINTENANCE REQUEST LOCTYPE DUAL GNDTEMP 83
CAT 2 OAT 22
GS TYPE CAP EFF BARD 3002
ALTITUDE
7 RUN CFG PAorALN 190 JampA PWorCW 90Hz SYM
FLAG or MOD
REMARKS I OTHER DATA
11 1N 301 MEAN WlDlliSYMMETRY ON PATH
18 1N 264 487 MEAN WlDlliSYMMETRY BELOW PATH (90HZ)
18 1N 340 MEAN WIDTHSYMMETRY ABOVE PATH (160HZ)
A 8
1 INSTRUMENT LANDING SYSTEM a State New Jersey b City Atlantic City c Airport Atlantic city International Airport d Category of Operation Category III e Associated runway~ Runway 04 f Approach bearing 02800 deg true h Engineering drawing na i Localizer
1 Latitude and longitude of antenna 39 deg 28 0103 N I 074 deg 34 2522 W
2 Antenna Type 14 element LPD 3 Distance from stop end of runway to antenna 1005 4 Distance from approach end of runway to antenna
7149 5 Distance and direction from runway centerline on cl 6 Ground elevation at center of antenna array 664msl 7 Identifier I-XJF 8 Frequency 10955 mhz 9 Voice availability na
10 Course width 56 deg 11 Course width over threshold 700 ft 12 Back course status Not available 13 Restrictions None 14 Remote monitor Far field monitor 15 Commissioning date na
j Glide Slope 1 Latitude and longitude of antenna
39 deg 27 0813 N I 74 deg 35 0727 W 2 Ground elevation of antenna mast 6584 msl 3 Elevation of runway centerline abeam glide slope
antenna 670 msl 4 Frequency 33245 mhz 5 Type of facility Capture effect antenna system 6 Distance of antenna from approach end of runway875 7 Distance and direction from runway cl 400 left 8 Glide angle 300 deg 9 Restrictions na
10 Remote monitor na 11 Commissioning date na
k outer Marker 1 Latitude and longitude of antenna
39 deg 29 5362 N I 074 deg 40 2048 W 2 Ground elevation of antenna 48 msl 3 Distance from runway threshold 4804 4 Distance from runway centerline extended on cl 5 Locator classification OM 6 Remote monitor na 7 Commissioning date na
A-9
APPENDIXB Test Trouble Reports
TTR__-=-O=l _ CAT IIIII ILSRMS TEST TROUBLE REPORT FORM
TESTER Ben BennettPaul Evermon LOCATION _~A=CY _
TEST SCENARIO Installation DATE June 94
TTR CLASSIFICATION CRITICAL SIGNIFICANT MINOR x
DESCRIPTION OF PROBLEM OR FAILURE During installation a problem was detected with one of the FFMs The signal from this monitor had considerable 60 Hz interference The monitor was returned to the factory for repair The 60 Hz interference could not be repeated at the factory and the unit appeared to be working fine under lab conditions When the FFM was returned to ACY the problem surfaced again In the field it was discovered that when an audio transformer was placed in the line from the FFM to the localizer the FFM worked fine From this it is assumed that the FFM has a bad transformer
RECOMMENDED SOLUTION Wilcox should develop a production test procedure for the FFM to test the audio transformer in the future
RESOLUTION Wilcox has added a procedure to test the audio transformer in their production acceptance tests
IMPROVEMENT RECOMMENDATION MODIFICATION TO HARDWARE MODIFICATION TO SOFTWARE CHANGE IN TEST PROCEDURE CHANGE IN OPERATIONS
B-1
TTR__~O==2 _ CAT IIIII ILSjRMS TEST TROUBLE REPORT FORM
TESTER Ben Bennett LOCATION _=A=C-Y _
TEST SCENARIO _~A~l=ig~n~m~en~t_ _ DATE June 1994
TTR CLASSIFICATION CRITICAL x SIGNIFICANT MINOR
DESCRIPTION OF PROBLEM OR FAILURE After calibrating the glide slope detectors the clearance RF level reads 113 and the clearance SDM reads 75 This is due to path SBO signals not being canceled out before the detection process
RECOMMENDED SOLUTION Wilcox must isolate the path SBO signal from the clearance signal before detection This can be accomplished by either hardware or software changes
RESOLUTION Wilcox addressed this issue with a new monitor software release This software release was tested at ACY and TMB and found to be an acceptable solution to the problem See paragraph 533
IMPROVEMENT RECOMMENDATION MODIFICATION TO HARDWARE or MODIFICATION TO SOFTWARE
CHANGE IN TEST PROCEDURE CHANGE IN OPERATIONS
B-2
TTR__O=3 _ CAT IIIII ILSRMS TEST TROUBLE REPORT FORM
TESTER Ben Bennett LOCATION _A=CY _
TEST SCENARIO Installation DATE June 1994
TTR CLASSIFICATION CRITICAL SIGNIFICANT MINOR x
DESCRIPTION OF PROBLEM OR FAILURE The ON BATTERY and LOW BATTERY LEDs do not illuminate when the TEST button is pressed on the RCSU
RECOMMENDED SOLUTION
RESOLUTION It will be documented in the RCSU user manual that the LEDs will not light
IMPROVEMENT RECOMMENDATION -Kshy MODIFICATION TO HARDWARE or -Kshy MODIFICATION TO SOFTWARE
CHANGE IN TEST PROCEDURE CHANGE IN OPERATIONS
B-3
TTR__=O-=4 _ CAT IIIII ILSRMS TEST TROUBLE REPORT FORM
TESTER Ben BennettByron Robins LOCATION _~A~C~Y _
TEST SCENARIO Normal Operation DATE June 94
TTR CLASSIFICATION CRITICAL SIGNIFICANT x MINOR
DESCRIPTION OF PROBLEM OR FAILURE The glide slope and localizer integrity check will fail if the standby monitor alarm delay time is set too low
RECOMMENDED SOLUTION Software change to not allow a standby monitor alarm delay time too low for the integrity check to pass
RESOLUTION The PMDT software was changed to not allow the user to set the standby monitor alarm time too low
IMPROVEMENT RECOMMENDATION MODIFICATION TO HARDWARE -K- MODIFICATION TO SOFTWARE
CHANGE IN TEST PROCEDURE CHANGE IN OPERATIONS
B-4
TTR__--O=S _ CAT IIIII ILSRMS TEST TROUBLE REPORT FORM
TESTER Ben Bennett LOcATION----A~CY _
TEST SCENARIO Integration testing DATE July 1994
TTR CLASSIFICATION CRITICAL SIGNIFICANT x MINOR
DESCRIPTION OF PROBLEM OR FAILURE The localizer and glide slope manual fault diagnostics will not run after a fault has been introduced that causes both transmitters to shut down
RECOMMENDED SOLUTION Correct in software
RESOLUTION Software revisions by Wilcox corrected this problem
IMPROVEMENT RECOMMENDATION MODIFICATION TO HARDWARE -K- MODIFICATION TO SOFTWARE
CHANGE IN TEST PROCEDURE CHANGE IN OPERATIONS
B-S
TTR__--O--6 _ CAT IIIII ILSRMS TEST TROUBLE REPORT FORM
TESTER Ben Bennett LOCATION _=A=C-=Y _
TEST SCENARIO Integration testing DATE July 1994
TTR CLASSIFICATION CRITICAL SIGNIFICANT x MINOR
DESCRIPTION OF PROBLEM OR FAILURE Auto fault diagnostics for the localizer glide slope and the marker beacons do not accurately identify the faulted LRU
RECOMMENDED SOLUTION Correct in software
RESOLUTION Automatic diagnostics is not as accurate as manual because in order to accurately diagnose the subsystem faulty signals must be radiated This can only be done manually
IMPROVEMENT RECOMMENDATION MODIFICATION TO HARDWARE -X- MODIFICATION TO SOFTWARE
CHANGE IN TEST PROCEDURE CHANGE IN OPERATIONS
B-6
TTR__O~7 _ CAT IIIII ILSRMS TEST TROUBLE REPORT FORM
TESTER Ben BennettByron Robins LOCATION _A=C--Y _
TEST SCENARIO Normal Operations DATE 8894
TTR CLASSIFICATION CRITICAL SIGNIFICANT x MINOR
DESCRIPTION OF PROBLEM OR FAILURE Localizer shut down The executive monitor course DDM went out of tolerance causing both transmitters to shut down indicating a possible problem in the DUCU or antenna subsystems
RECOMMENDED SOLUTION
RESOLUTION It has not been determined what caused this outage
IMPROVEMENT RECOMMENDATION MODIFICATION TO HARDWARE MODIFICATION TO SOFTWARE CHANGE IN TEST PROCEDURE CHANGE IN OPERATIONS
B-7
TTR__~O~8 _ CAT IIIII ILSRMS TEST TROUBLE REPORT FORM
TESTER Ben BennettByron Robins LOCATION _~A~CY _
TEST SCENARIO Standby power test DATE 82994
TTR CLASSIFICATION CRITICAL SIGNIFICANT x MINOR
DESCRIPTION OF PROBLEM OR FAILURE The marker beacon front panel displays on batteries and maintenance alert after the batteries have been discharged and AC power restored to the system
RECOMMENDED SOLUTION The project office will have this problem corrected by Wilcox through ECP16
IMPROVEMENT RECOMMENDATION MODIFICATION TO HARDWARE or MODIFICATION TO SOFTWARE
CHANGE IN TEST PROCEDURE CHANGE IN OPERATIONS
B-8
TTR__-=0=9 _ CAT IIIII ILSRMS TEST TROUBLE REPORT FORM
TESTER Ben BennettByron Robins LOCATION _~A~C-=-Y _
TEST SCENARIO Standby power test DATE 83094
TTR CLASSIFICATION CRITICAL SIGNIFICANT x MINOR
DESCRIPTION OF PROBLEM OR FAILURE After the batteries were discharged AC power was restored with only one of two sets of batteries on line to reduce charge current As a result of this condition the outer marker ACDC power supply shut itself down due to too much power being supplied The ACDC converter is not powerful enough to charge even one set of batteries after they have been discharged
RECOMMENDED SOLUTION Raise the battery cut off voltage so that the marker beacons shut down at a state of discharge that the ACDC converter can recharge the batteries without damage At the current cut off voltage the marker beacons remained on the air for well over 176 hours The requirement is only 72 hours
IMPROVEMENT RECOMMENDATION MODIFICATION TO HARDWARE MODIFICATION TO SOFTWARE CHANGE IN TEST PROCEDURE CHANGE IN OPERATIONS
B-9
TTR__lO _ CAT IIIII ILSRMS TEST TROUBLE REPORT FORM
TESTER Ben BennettByron Robins LOCATION _A=C-=Y _
TEST SCENARIO Normal Operations DATE 9694
TTR CLASSIFICATION CRITICAL SIGNIFICANT x MINOR
DESCRIPTION OF PROBLEM OR FAILURE This is a repeat of the TTR 07 he executive monitor course ddm started to fluctuate around 810 pm on ~ September It went into alarm several times but went back to normal before the 2 second alarm delay time had expired The executive monitor remained stable until approximately 820 am 6 September The course ddm and course width ddm went into alarm but went back to normal before the alarm delay timer expired again At 908 am the course path and width ddm began to oscillate between alarm and normal This continued until 930 am when the course ddm remained in alarm condition until the delay timer expired causing both transmitters to shut down No abnormal weather conditions were present at the time of shutdown
RECOMMENDED SOLUTION
RESOLUTION The cause of this outage has not been determined
IMPROVEMENT RECOMMENDATION MODIFICATION TO HARDWARE MODIFICATION TO SOFTWARE CHANGE IN TEST PROCEDURE CHANGE IN OPERATIONS
B-10
TTR__=l=l _ CAT IIIII ILSRMS TEST TROUBLE REPORT FORM
TESTER Ben BennettByron Robbins LOCATION _poundlA=CY _
TEST SCENARIO Normal Operations DATE 112194
TTR CLASSIFICATION CRITICAL SIGNIFICANT x MINOR
DESCRIPTION OF PROBLEM OR FAILURE The inner marker AC to DC converter failed The power was turned off for approximately 5 hours and then turned back on with no effect The AC to DC converter from the middle marker worked in the inner marker The converter was returned to Wilcox who will send it to Lambda for analysis
RECOMMENDED SOLUTION
RESOLUTION The ACDC converter was returned to Wilcox for analysis
IMPROVEMENT RECOMMENDATION MODIFICATION TO HARDWARE MODIFICATION TO SOFTWARE CHANGE IN TEST PROCEDURE CHANGE IN OPERATIONS
B-ll
TTR__1=2 _ CAT IIIII ILSRMS TEST TROUBLE REPORT FORM
TESTER Ben BennettByron Robbins LOCATION _~AC=Y _
TEST SCENARIO Normal Operations DATE 112194
TTR CLASSIFICATION CRITICAL SIGNIFICANT x MINOR
DESCRIPTION OF PROBLEM OR FAILURE Unknown failure of the RMM board on the glide slope RMM boards were swapped from the localizer to the glide slope and the communication errors followed the RMM board to the localizer A new spare RMM board was installed which corrected the errors
RECOMMENDED SOLUTION
RESOLUTION Normal corrective maintenance
IMPROVEMENT RECOMMENDATION MODIFICATION TO HARDWARE MODIFICATION TO SOFTWARE CHANGE IN TEST PROCEDURE CHANGE IN OPERATIONS
B-12
TTR__=1=3 _ CAT IIIII ILSRMS TEST TROUBLE REPORT FORM
TESTER Ben Bennett LOCATION ACY Runway 04 Localizer
TEST SCENARIO Normal Operation DATE 020395
TTR CLASSIFICATION CRITICAL SIGNIFICANT MINOR x
DESCRIPTION OF PROBLEM OR FAILURE With transmitter 2 selected as main the localizer would switch to transmitter 1 and remain on the air The switch over would occur within 24 hours of start up This anomaly only existed when transmitter 2 was selected as main
The conditions of the fault were clearance RF level dropping to 448 clearance width 1 dropping from 0293 ddm to 0000 ddm clearance width 2 dropping from 0226 ddm to 0000 ddm and the clearance SDM dropping from 407 to 00
When transmitter 2 was brought back on line the monitors would be within alarm tolerances This condition indicated an intermittent problem as well as prevented fault diagnostics from identifying the faulty LRU Trouble shooting revealed that the clearance CSB RF relay on the transfer assembly was intermittent and was replaced with a new relay from the spares kit
RECOMMENDED SOLUTION
RESOLUTION Normal corrective maintenance
IMPROVEMENT RECOMMENDATION MODIFICATION TO HARDWARE MODIFICATION TO SOFTWARE CHANGE IN TEST PROCEDURE CHANGE IN OPERATIONS
B-13
APPENDIXC Stability Data
Temperature
~ i ~ ~ i bull i
Day of Month of January 1995
FIGURE C-l MEASURED OUTSIDE TEMPERATURE FOR THE MONTH OF JANUARY 1995
Barometric Pressure
~ JIJO
~ 298
g 296
294
~
IJ4 f----+----+----+----+----+--__t_ middot1middotflAmiddotmiddotmiddotmiddotmiddotmiddotmiddotmiddotmiddotmiddot P
IJ2middotmiddotmiddotmiddotmiddotAmiddotmiddotmiddotmiddotmiddotmiddotlr-Nmiddotmiddott 1 middotmiddotmiddotfi
J t ~ ~ 1 1 ~
I -(
y
Day of Month of January 1995
FIGURE C-2 MEASURED BAROMETRIC PRESSURE FOR THE MONTH OF JANUARY 1995
C-1
Wind Speed
50
40
-I a 30 ~ - C 0) 0)
200 (I)
C t
~ 10
0
5 10 15 20 25 30
Day of Month of January 1995
FIGURE C-3 MEASURED WIND SPEED FOR THE MONTH OF JANUARY 1995
Rain Rate
~
middot middot middot
03 1-----7+--+-----+---------+-----------+------~-+-7 --~~-i
- J L
o 02 1-------+--+-----+---------+---~-+--------f-----+_I
CIl c
- ~VI CIl ~ g 01 H---~--~--~~-~H+_+_----+__1
~ - ~
5 10 15 20 25
Day of Month of January 1995
FIGURE C-4 MEASURED RAIN RATE FOR THE MONTH OF JANUARY 1995
C-2
Localizer Course DDM
0000 middot
OOCE
bullbullbullbullbullbullbull M bullbull ON OM H bullbullbullbullbullbullbullbullbullbull M M 0004
0002
~ 0000
o (JOO2 middot
~ ~ ~ ~
(J004
(Jom
(Jooo
bull ~ i shy i ~ bull - bull
i
5 10 15 20 25 3D
Day of Month of January 1995
FIGURE C-5 MONITORED
Localizer Course RF Level
middot 100 I----~ +-~ -----+--~~~~--~-t-~----~~----~+-
~
~
102 ~n y1J 100 ~~~V~r~j-IfVvYv I1J
~ ~ ~ 98
~ 96~------+----------+----------+-----------r----------~------H LL 0 9-4 r---r--~~r-----~--+--- -+--1 middot
bullbullbull M bullbull M bullbull M M bullbull M
~ bull i i imiddot imiddotmiddot i 00 ---~----~~JL~~ ~~L~~ ~~~
5 10 15 20 25
Day of Month of January 1995
FIGURE C-6 MONITORED LOCALIZER COURSE RF LEVEL FOR THE MONTH OF JANUARY 1995
C-3
localizer Course Width
0175 1-----+---+----1------1-----+-----+-1
~ 0 165 1------t-~~~+-~~-I-~--1I--~~-+-~~--+-I -middot o ~ ~
Cl 0160 ~ ~ Jilll~ bullbulliJ bull1 jj 1l1~~ _J
0155 ~ ~ ~ ~~~~I~~ ~~~~~_~~~_~ M ~lD 0 150
middot imiddot - i ~ - - ~ g 0145~ ~+---bull-+bull-i--~~---+--~-1 o
ON 0 N _ 0 bullbullbullbullbullbullbull 0 bullbullbullbullbullbullbullbullbullbullbullbullbullbull
middot ~ ~ ~ ~ ~ ~ ~ ~ ~ ~ ~ ~ 0131 L-i~----1lt------Li-~-----i--iiJL-i-------i--iLJ
5 10 15 20 25
Day of Month of January 1995
FIGURE C-7 MONITORED COURSE WIDTH FOR THE MONTH OF JANUARY 1995
localizer Course SDM
~ gt ~ -
middot ~ ~ ~ ~ ~ ~ ~ ~ ~
42 ~t~+--- ---+---+--~~ -+-1 middot - _~ - E
io 41 ~----+~~~+-------~-+-~~~~ -----~+- --c-----+-l
1 bullbull 1 bullbullbullbull bullbull bullbullbullbullbullbullbullbullbullbullbullbullbullbullbull bullbullbullbullbull 1 bullbull bullbullbullbullbullbullbullbullbullbull bullbullbullbull bullbullbullbull 1 bullbull 1 bullbullbullbull3 [~ o 40 ~ ~_ bull ~ bull ~ ~ ~ ~ ~ ~ - 39 ~----+~--------+-------~-+------------~-----+-- --------+-l E ~ bull Cl (I) 38 J---------+------------1---------+---------1---------1----------+-l
-- - - - -
~ ~~O-~~~~~ ---~---J ~J----~ L-J
5 10 15 20 25
Day of Month of January 1995
FIGURE C-8 MONITORED LOCALIZER COURSE SDM FOR THE MONTH OF JANUARY 1995
C-4
bullbull
Localizer Clearance RF Power Level
~ middot ~ IIll I-----~---------+-------+---+------t-I
_ - i c 104 I---------tr----~~I---~~+--~~-+~~~~~~t-I
middot~middotjmiddot1 W~M A~ ~~ fi1N ~ ~jT tv~~~ltiMfv~~l~--~( ~ t _ _- _ ) ~ _ j 98
~ 96 1-----+---~I------+--7-+----7----~----------t-I LI 0 94 1---r~I-----+----~-+~----+----t-I ~ w N W bull OMow N bull ~ bullbull N bullbullbullbullbullbullbullbullbullbullbull
middot middot ~ bull i ~ - bull
00 ~--~---iJLi ~I-i-------------------L-- ~JJ
5 10 15 20 25 3J
Day of Month of January 1995
FIGURE C-9 MONITORED LOCALIZER CLEARANCE RF LEVEL FOR THE MONTH OF JANUARY 1995
Localizer Clearance Width 1
middot bull bullbull bullbullbullbull bull bull bullbull bullbull bull bullbullbullbullbull bull bull bullbullbullbullbullbullbull bull bull 0 bull bullbull ~ bullbullbull bullbull bull bullbull
039 r---+middot-+-~+----- t----+-+--1
bull bull bullbull ~ bull bullbullbullbull bull bullbull bull bull bull bullbull bull bullbullbullbull bullbullbull bull bull bull bullbullbullbull 0 0 0 bullbull I bullbull bullbull
bull bull ~ bull 0 bull bullbullbullbull bullbullbull bullbull bullbullbull i ~ bullbull 0 bull bullbullbull bullbull j bullbull bullbull bull bullbull bullbull 03J ~-------ii---------ii------ii---i----_i-LJ
5 10 15 20 25 3J
Day of Month of January 1995
FIGURE C-10 MONITORED LOCALIZER CLEARANCE WIDTH 1 FOR THE MONTH OF JANUARY 1995
C-5
Localizer Clearance Width 2
middot ~
middot
-p bull bullbullbullbullbullbull _ bullbull middot middot
I~ bullbullbullbull bullbullbullbullbullbullbullbullbullbullbullbullbullbullbullbullbullbullbullbullbull bullbull bullbull
~ 033 r--------+-~--+-------+------~------+-------+-1 middot ~o B 029 j MJ= 028 _ 11~lr 111 IlHiJ ii ~ LJIIlIn
~ bullbull -- 1---- T~~+ -1 +-+----+---~v~IIVm
027 r-------r----+--7----+-tH---------r------7+---t-1 -middot
- imiddotmiddot ~ - - bull - bull i middot 024 ---~ -J-~~~~~_~----~~JL-o~_~ L-J
5 10 15 20 25
Day of Month of January 1995
FIGURE C-11 MONITORED LOCALIZER CLEARANCE WIDTH 2 FOR THE MONTH OF JANUARY 1995
Localizer CourseClearance Frequency Difference
~ ~ ~ ~ ~ ~ ~ ~ ~
N 83 ~j--T--T-+-- -+---+j-H
g bullbull p _ bullbullbullbullbull - - - bullbull ~ - bullbull _ bullbullbullbullbull shy _ - bullbull _ bullbullbullbullbull shy
B2 middot II) 1middotmiddotmiddot middotmiddotmiddot bullbullbullbullbull middotmiddotbullmiddotmiddotmiddot middotmiddotmiddotmiddot1middotmiddot
U amp Bl 1---t----------+---------+----r------f-----------t-----------+-1II) ~ BO ~- __ --+-0shy I---t--j is gt- 79 1---~t-~-+----~-+-t---~~-t-~-~-1 middot middot u ~ amp ~ 7B I------t----------+--------+----------f-------t-~~-I
~ - - - - - cr
77 ~j--T-_r~ -+-~-t--T-~-I 11
bullbullbull bullbull bullbullbull bullbullbullbullbull bullbullbull bullbullbull bullbullbullbullbull j bullbullbull bullbullbull bullbullbullbullbullbullbullbull bullbull bullbull bullbullbull bullbullbullbullbullbullbull bullbullbullbullbullbull bullbullbullbullbullbullbull bullbullbull j bullbull j bullbull middot 75 -------Li-i---Li--------------J---i-JJ
5 10 15 20 25
Day of Month of January 1995
FIGURE C-12 MONITORED LOCALIZER COURSECLEARANCE FREQUENCY DIFFERENCE FOR THE MONTH OF JANUARY 1995
Localizer Ident Depth of Modulation
~~~ ~ ~ ~ _ 10 f----+----+-----t--- -+-------+----------------+-1 fl -
9 f-------+-----~~f---77~---+----~-+-~-----+---~___+-I
c ~~ - ~ m 11 8 ~-- l-IIIIbull~L--+-~ ~------F-u---JL---fL----amp---t-I lo ~ 7f-----------+-------------If---7------+--------+-----------+----------+-I3 C
~ 6 1------------+------------+------------+-------------+-------------+----------+-1
- -- - -
4----~_____~~~Lo~~-----~~____~~----L~~~l-J
5 10 15 20 25
Day of Month of January 1995
FIGURE C-13 MONITORED LOCALIZER IDENTIFICATION DEPTH OF MODULATION FOR THE MONTH OF JANUARY 1995
Glide Slope Path DDM
~ ~ ~ ~ 0020 ~----+-----f--- -----+------+----+-+-1
~ ~ ~ ~
0005 ~---+-----f----+---~-I---++-I
~ ~ ~ ~ ~ _
bullbull bullbullbull bullbull bullbullbullbull bullbullbull bullbullbull bullbullbull bullbullbullbull bullbullbull bullbullbull bullbullbullbullbullbullbullbull bullbullbull bullbull bullbullbull bullbullbullbull bullbull bullbullbull bullbullbull bullbullbullbullbullbullbullbull bullbull j bullbull j bullbullbullbull -0025 ----~~~~----~~-----~~~------~~----~~~L-J
5 10 15 20 25
Day of Month of January 1995
FIGURE C-14 MONITORED GLIDE SLOPE PATH DDM FOR THE MONTH OF JANUARY 1995
C-7
Glide Slope Path RFLevel
100 ~--+~---If----+----+----+---H - - - -
~ 98 i j c bullbullbull bull -bull ~ bull bull ~ bull bullbull bullbull bullbullbull i bullbull i bullbull i
~ U 0
~
94 - - shy - bull ~ ~ - - ~ ~ bull - bull bullbull - bull bullbull bull
1--------+---------71--------+----------+--------+------7--1---
bullbullbullbullbullbullbull ~ bull OM OM bull bull middot N bull M amp bull O bull bullbull bullbull bullbull
middot-middotmiddotmiddotimiddotmiddotmiddotmiddotmiddotmiddot
OC)----JJ--JJ----L-1------LL------------------LJ
5 10 15 20 25 30
Day of Month of January 1995
FIGURE C-15 MONITORED GLIDE SLOPE PATH RF LEVEL FOR THE MONTH OF JANUARY 1995
Glide Slope Path Width
0205 ----r-1---r-T---TT--r-TT--r--r-r---r-r----
02fIl 1---~~~~~--~-t--~tH ~ ~ ~ ~ ~ ~
0195 ~---+--~~ --------l-----+------t----- H ~ ~ ~ ~ ~middot
0100 ~-----+-------~~-----=- -t-------=-----=--t--------+------=---+--1
O 1B5 r----j----t-------j----I-----+------t-i middot ~ ~
~ 0100 lila ~ r~~~L ~Li~~~~ bullbullbullbullbull ~r~ ~ 0165 r----~~~I---~+-~~-t--~t --t-i
middot i imiddot - - - i bull ~ imiddot i i
0160 r-----~----- -+-~--t---~---t---- ------~-----t-i
0155 1-----+-~~~~~~-t--~t~H
middot i bull ~ i bull bullbullbullbull - ~ bull i ~ ~ I bullbull I bullbull bullbull
o150 I-----f--_~I-----------+--_--+-------+-------+-H middot bull~ ~ middot
0145 ~~~---J ~~L-o~~~~~ ~~------
5 10 15 20 25
Day of Month of January 1995
FIGURE C-16 MONITORED GLIDE SLOPE PATH WIDTH FOR THE MONTH OF JANUARY 1995
C-8
82
-
Glide Slope Path SOM
~ ~ ~ ~ ~ ~ ~-~ ---- -+--+--+- -----t---+-I
~ ~
- ~ ~ ~ ~ ~
5 10 15 20 25 3J
Day of Month of January 1995
FIGURE C-17 MONITORED GLIDE SLOPE PATH SDM FOR THE MONTH OF JANUARY 1995
Glide Slope Clearance RF Level
middot
40
~ ~ - - - 2()
~ - tIE ~
W 1[UJljtJ~~ ~V middot+Imiddotf1t i~~~ middot~ftH~ E ~t~ r~nr Lrllll fU~ ld~~~~1middot 1 BJ ~ 102 fT TT ~yrlni~f l 0 100 j~ ~JJ ~ ~ ~ ilt
~ 00 ~ $ 1-shy ----+---+---+--~-+- -H U 0 94
middot bull d bullbull N
~ bull i shy bull - bullbull - i i middot 00 _iJ-------JLi----iLi-i----i----J---------- 0
5 10 15 20 25 3J
Day of Month of January 1995
FIGURE C-18 MONITORED GLIDE SLOPE CLEARANCE RF LEVEL FOR THE MONTH OF JANUARY 1995
C-9
Glide Slope PathClearance Frequency Difference
middot ~ ~ ~ ~ 84 j-------=--~--=-- ~ ~ -+--~---+-I
bullbullbullbullbull bullbull ~ bullbullbull bullbull bull bullbullbullbullbullbull bullbull I bullbull
i bull i - ~ bullbull bullbull bullbull - bull i i middot 75 Li----------iJ-----------I-i--ii-i-l-i-i----------------L-I
5 10 15 20 25 30
Day of Month of January 1995
FIGURE C-19 MONITORED GLIDE SLOPE PATHCLEARANCE FREQUENCY DIFFERENCE FOR THE MONTH OF JANUARY 1995
Inner Marker Beacon RF Level
~ ~ ~ ~ ~ ~ middot
100 j---------+---t---------+------+-----~--+-l
-middot
- ~ - _ _ iiishybull~ 104
~ 102 1------+----------11-------+--------+--+---H
0 100 middotmiddotmiddotfTmiddotrmiddotmiddot middotmiddotmiddotmiddotmiddotmiddot~middotTmiddot~middotmiddotmiddotmiddot(middotlrmiddotmiddotmiddotmiddotmiddotmiddotmiddotifC l ~ ~lI jIUHPLLUJ) ) )1)11 1) lI)I) l
98 ~ middotmiddotmiddotmiddotmiddotmiddotmiddottmiddotmiddotmiddotmiddot
~ Ii ---~-+--~---II-----~~+---~-+----+----H u D 94 ~-rmiddotmiddot~~r---~-+~--H
middot - _ - _ ~ ~
- middotmiddotmiddotmiddotmiddotmiddotmiddot-middotmiddotimiddotmiddot j bullbull bullbullbull bullbullbull bullbullbullbull bullbullbull bull bullbullbull bullbullbullbullbullbull bullbullbull bullbull bullbull bullbullbullbullbullbullbull bullbull j bullbull bullbull middot 9J -----i-i-I-i----l-i-i--------i-i-i-L-i--i-i-iL-i-i_i-I-J
5 10 15 20 25 30
Day of Month of January 1995
FIGURE C-20 MONITORED INNER MARKER BEACON RF LEVEL FOR THE MONTH OF JANUARY 1995
C-10
Inner Marker Beacon Modulation
M OM M M M bullbull _ bullbullbull OM M M
102 middot
bull bull bullbull ~ bullbull bull bullbull bullbullbull bullbullbull bullbull I bull ~ bullbull bull bull ~ bull bullbull ~ bull bullbull bull I bullbull I bullbull 100 I----~-t-~----I---------+---- 7---+-7------+------+-1
bullbull bullbull ~ bullbull bullbullbull I bull bullbull bullbull bull bullbull I bullbull I bullbull bullbull
Bl3 1----+----11----------+------------+-----+---H ~ ~ ~ ~
5 10 15 20 25
Day of Month of January 1995
FIGURE C-21 MONITORED INNER MARKER BEACON DEPTH OF MODULATION FOR THE MONTH OF JANUARY 1995
Inner Marker Beacon Vo~age Standing Wm Ratio
raquo 1 B 1-----+------~-+-~--+---------+-------+------+-1
middot bullbullbullbullbullbullbullbullbullbullbull bullbull M _ bullbull M bullbullbullbullbull _
i ~ - - ~ i t bullbull bullmiddot 100 L--ii-i--------ii-----------Ji--i-i--li-i----i----i-i----LJ
5 10 15 20 25
Day of Month of January 1995
FIGURE C-22 MONITORED INNER MARKER BEACON VOLTAGE STANDING WAVE RATIO FOR THE MONTH OF JANUARY 1995
C-11
Inner Marker Beacon Idenl Keying
100
95 J 0 J Cg 0 - II
(0
90
85
C
~ OJ ~
II CD
80
75
~ 0 II
0
70
65
60 5 10 15 20 25
Day of Month of January 1995
FIGURE C-23 MONITORED INNER MARKER BEACON IDENT KEYING STATUS FOR THE MONTH OF JANUARY 1995
C-12
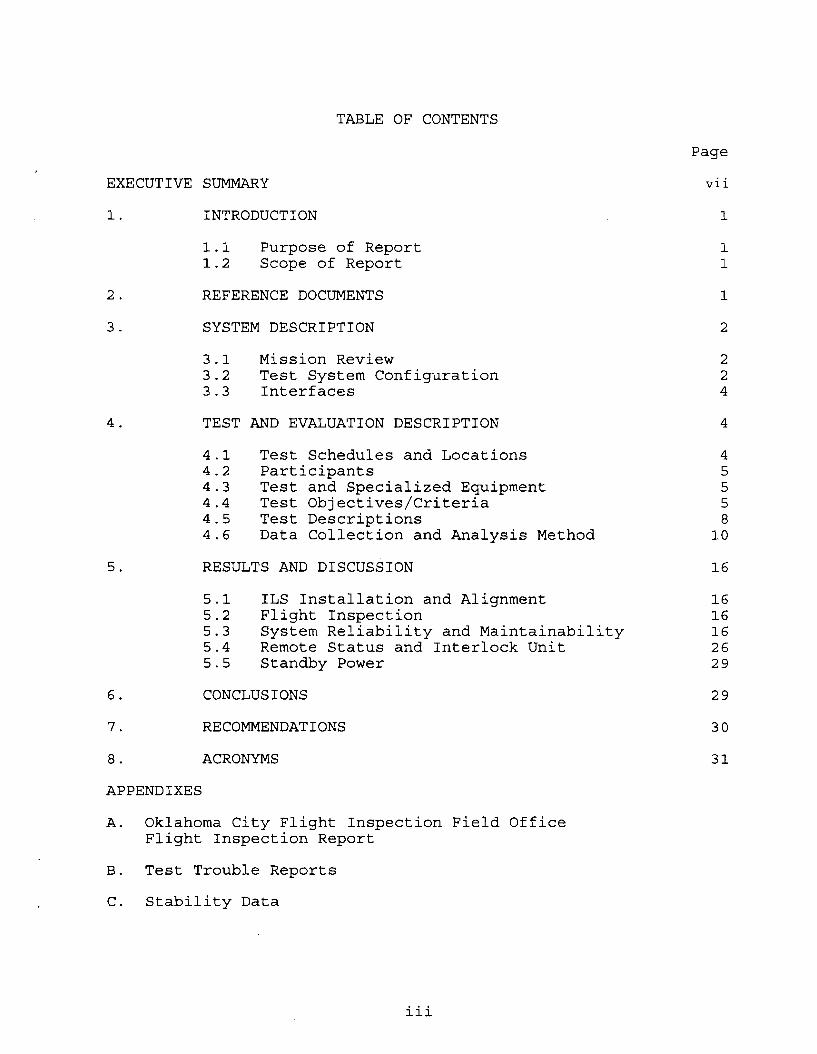
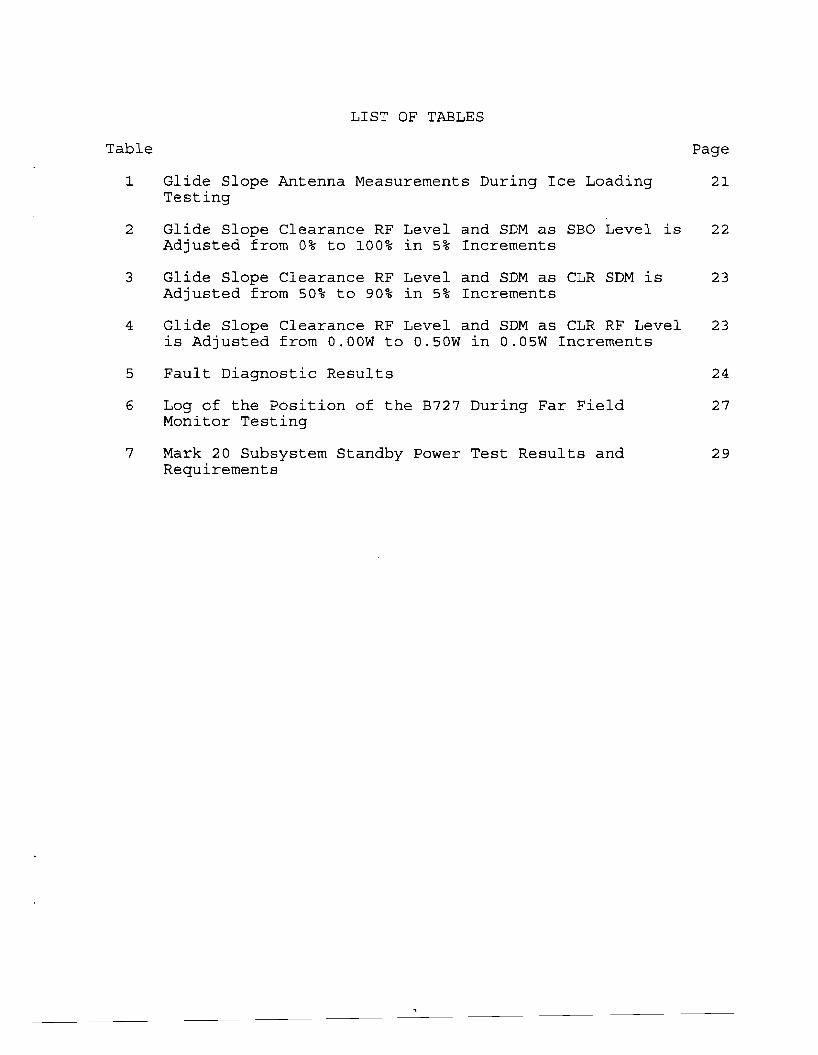
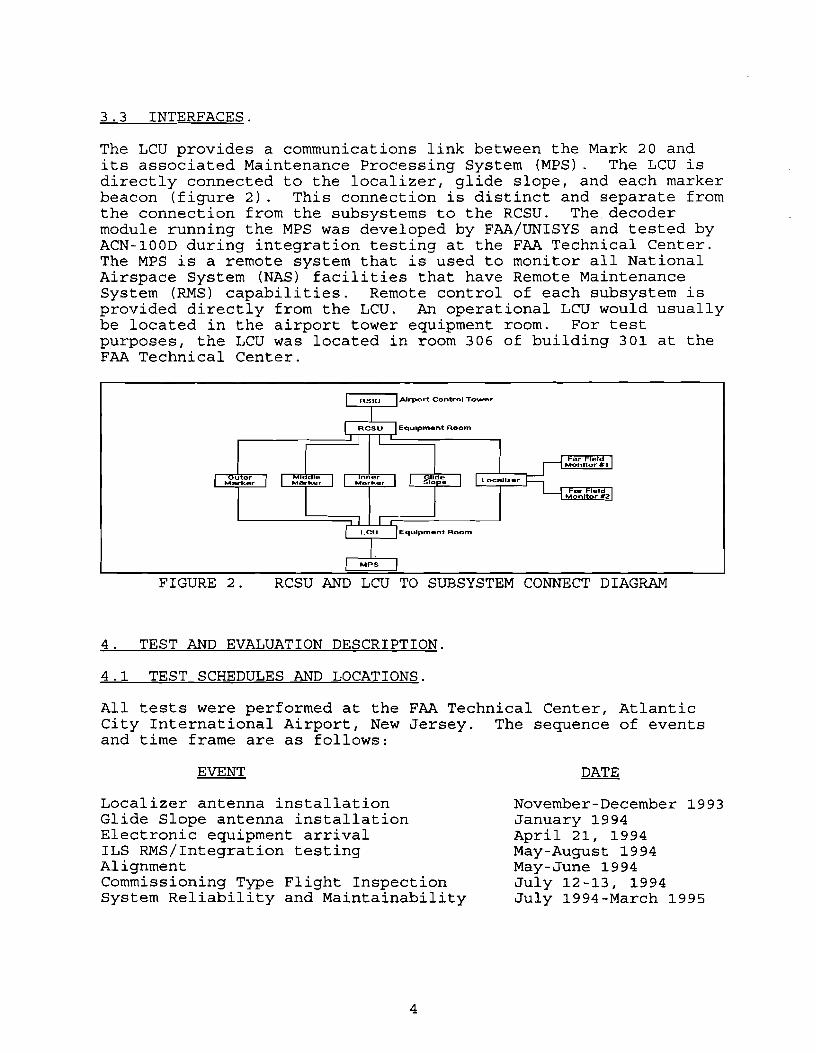
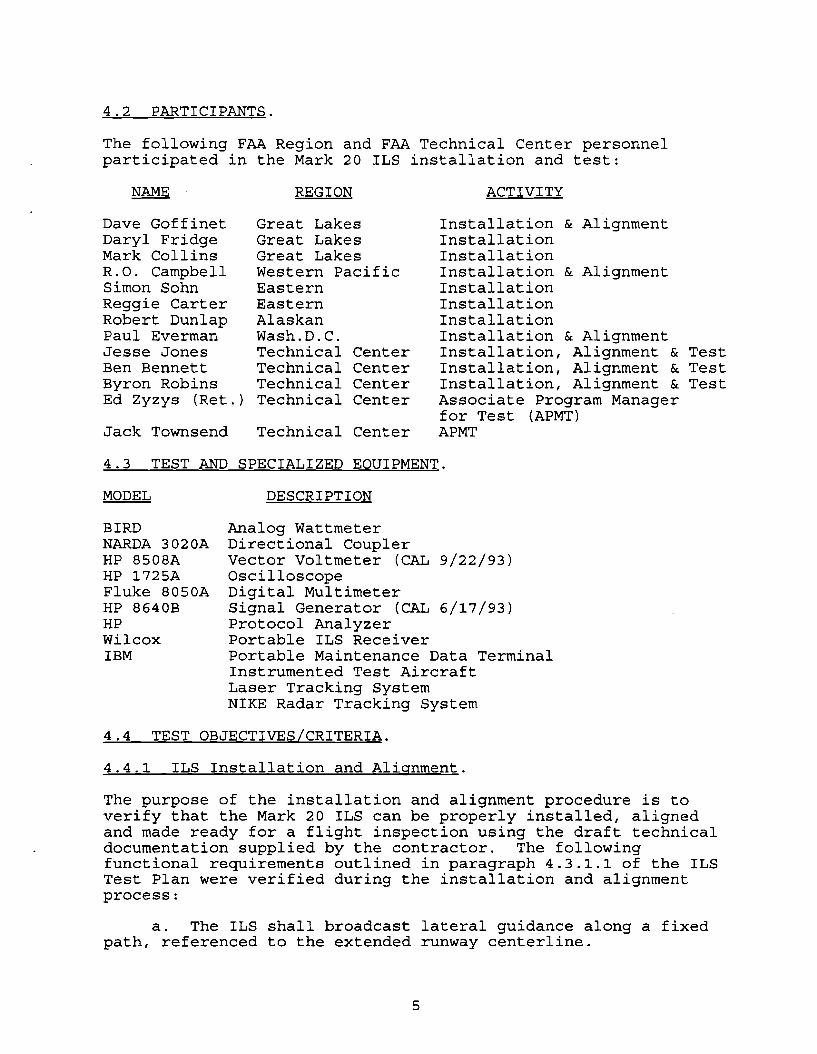
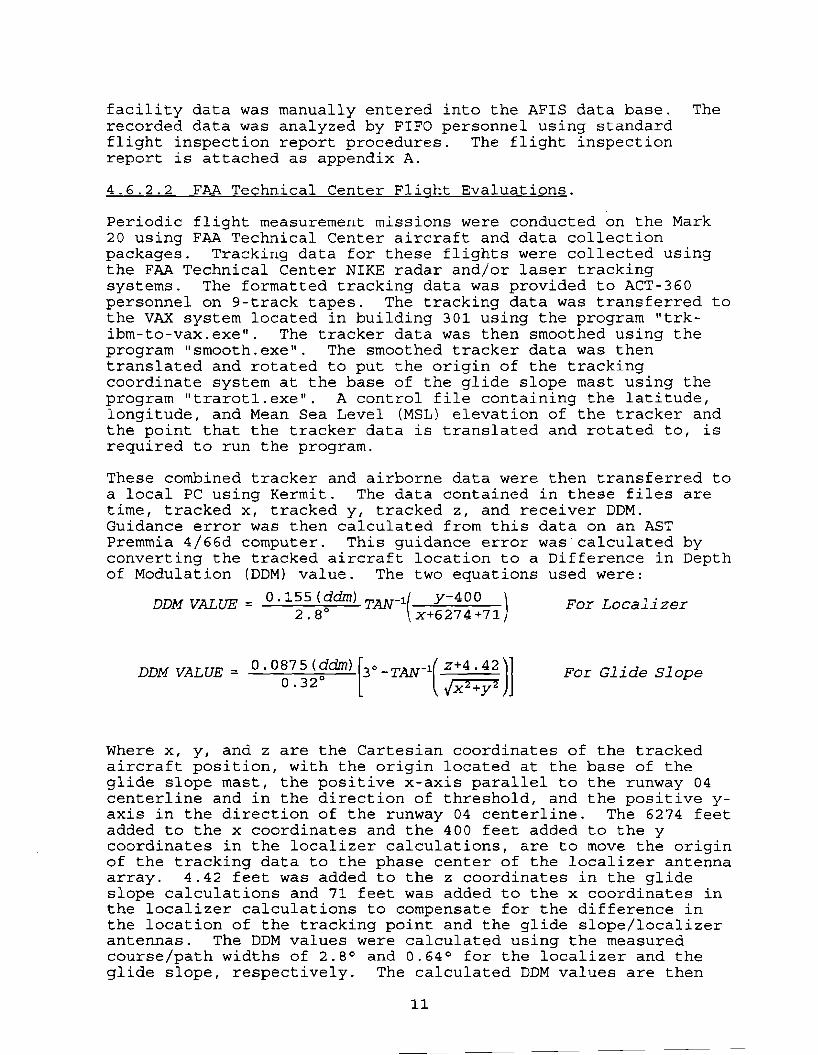
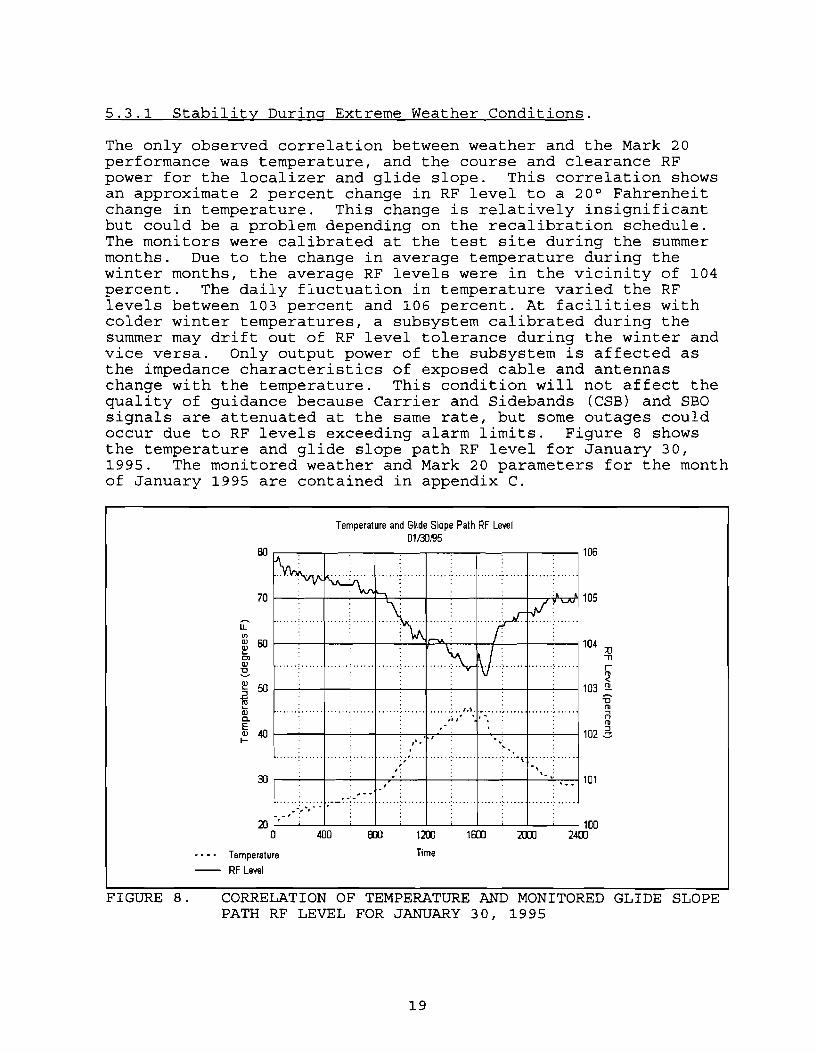
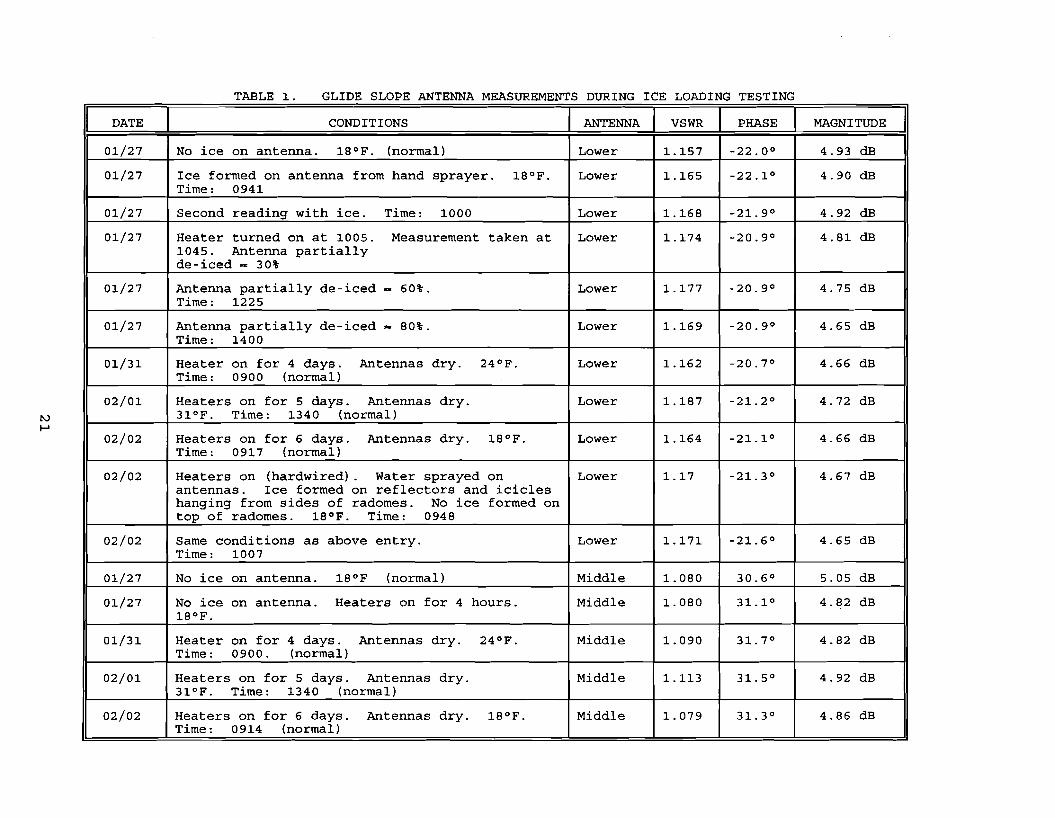
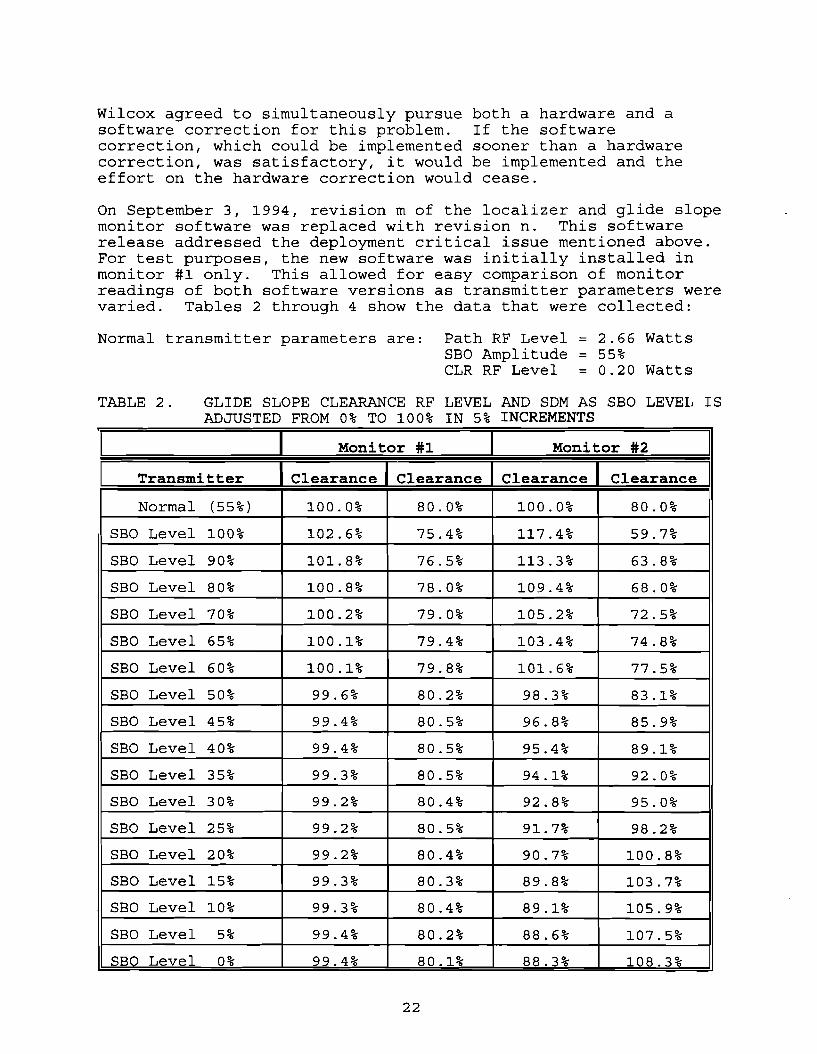
TABLE 5 FAULT DIAGNOSTIC RESULTS (Continued)
Localizer Antenna Subsystem
Far Field Monitor
Glide Slope Audio Generator 1 Audio Generator 2
Glide Slope Interface cca
Glide Slope ACDC Converter
Glide Slope RMM cca
Transfer Switch Assembly
Glide slope DUCU Carrier power divider
Glide slope integral detector
Glide slope antenna element
Disconnected the 1R monitor line from the DUCU
Adjusted R83 (CHPAUD level adjust) fully clock wise
Bent out pin 9 of U11
Bent out pin 28 of U29
Adjusted Vadj on the ACDC converter until the on batteries LED was illuminated
Removed jumpers from J2
Removed the CLR CSB line from the RF relay
Loosened the OUT 1 TNC connector on the CSB power divider Zl
Connected all gain jumpers to the course position detector ie pins 5-6 7-8 and 9-10
Disconnected upper antenna feed line at the wattmeter body
25
Fault diagnostics would not run from the PMDT or the MPS
Far Field Monitor
Audio Generator 1 Audio Generator 2
Interface cca
ACDC converter
Fault diagnostics could not be performed because the fault affected PMDT communications The LED on the RMM card was blinking indicating a fault
Transfer Switch Assembly
Fault diagnostics would not run from the PMDT or the MPS
Fault diagnostics would not run from the PMDT or the MPS
Fault diagnostics would not run from the PMDT or the MPS
TABLE 5 FAULT DIAGNOSTIC RESULTS (Continued)
Marker beacon ModPA
Marker beacon ModPA
Adjusted R55 counter clock wise until the voltage at R53 was at a minimum
Adjusted R37 clock wise until the voltage at pin 6 of J2 was at a minimum then replaced the jumper
ModPA
ModPA
Marker Beacon ACDC Converter
Adjusted Vadj until the on batteries LED illuminated on front panel
was the
ACDC converter
Marker Beacon DCDC converter
Changed the alarm limits for the +5V supply to put the monitor into alarm
DCDC converter
Antenna assembly Disconnected the antenna feed line at the antenna
Antenna assembly
54 REMOTE STATUS AND INTERLOCK UNIT
541 ILS Category of Operation Indication
During the test period the RSIU accurately displayed the category of operation over varying operational conditions The category downgrade timer was tested and found to be accurate
542 Far Field Monitor
Table 6 indicates the position of the B727 during testing Figures 10 and 11 contain DDM values measured by each FFM versus time FFM 1 is located at the inner marker and FFM 2 at the middle marker The data collected indicate that minimal interference was detected by the FFMs The large DDM spikes at 092145 and 095438 are when the B727 was at the stop end of runway 04 and turning to face the taxiway The spikes however were not of sufficient magnitude to put the FFM into alarm (The FFM alarm settings were set to plusmn 0009 DDM and the spikes were only -0004 and -0005 DDM for FFM 1 and 2 respectively) Airborne data collected indicates that no effect on provided guidance was caused by the presence of the B727 in positions 1 2 3 or 4 (figure 3)
26
TABLE 6 LOG OF THE POSITION OF THE B727 DURING FAR FIELD MONITOR TESTING
I Time I B727 Location I 091525 727 in position 1
019645 727 begins to taxi forward to put the nose wheel on centerline keeping the fuselage perpendicular to centerline
019647 727 nose wheel on centerline
092122 727 begins a the taxiway
180 degree pivot on centerline to return to
092145 727 completes the pivot and is on the taxiway
092742 727 in position 2
093053 727 begins to taxi forward to put the nose wheel on centerline keeping the fuselage perpendicular to the centerline
093114 727 nose wheel on centerline Another 727 type aircraft is taxiing on runway 04 between the FAA B727 and the runway 04 threshold
0931 43 The other aircraft turns off the runway to a perpendicular taxiway at the threshold of 04
093416 The B727 begins a 180 degree pivot return to the taxiway
on centerline to
093435 The B727 completes the pivot and is on the taxiway
093625 The B727 begins taxiing from position 2 on the taxiway
to position 3
093716 B727 in position 3
093943 B727 begins centerline centerline
to taxi forward to put the nose wheel keeping the fuselage perpendicular to
on the
094033 The B727 begins a 180 degree pivot return to the taxiway
on centerline to
094229 B727 in position 4
094845 A King Air type aircraft taxis runway 22 and takes off
to the threshold of
094952 A Bonanza type aircraft taxis 22 and takes off
to the threshold of runway
0951 46 B727 begins 04
to taxi to centerline at threshold of runway
095202 B727 begins to taxi from the threshold centerline of runway 04
to stop end on
095438 B727 ends taxi the stop end
on centerline and turns off runway 04 at
27
Far Field Mon~or 1 (Inner Marker) 210195
8727 Taxi test
0001 f------7-1h--f-----r1lr-nrr-l-------I--middot-middotJmiddotir-------t----t----j
~ Imiddotmiddot H~H middot~lIIJHmiddot8 01))) f---~ff---J-r-fyf-U~ffe
-0001 r---~f-----1f-----H-j-t -- tt-----J--1
-0004 f------f--7--I------f----i----~-1f------I----- shybullbull----------+------1
- middot-imiddot-middot ltj
-0005 ---iiLUiiLUii---wlW---lW---LLL---LLL---LIJ
90 91 92 93 94 95 96 97 98 99 100
Time (hours)
FIGURE 10 FAR FIELD MONITOR 1 READINGS WITH A B727 IN THE LOCALIZER ENVIRONMENT
Far Field Monitor tf2 (Middle Marker) 2110195
8727 Taxi test 0005 C-Cfmiddot gtltmiddot1middotmiddotmiddotmiddot gtmiddotmiddotmiddot-middotImiddotlt-middotmiddotmiddotjmiddotmiddot-middotmiddotmiddot middotmiddot1middot gt
-middotmiddot-imiddotmiddot j 0004 1-----11---1-----1----i---i-------+------+------+---i
j -
middotmiddotmiddotmiddot1middotmiddot o(m r--1--t-+~i---~~+ -f-f--4
- imiddot imiddot j i- imiddot j bull bull bullbull imiddot i j bullbull jmiddoti
-0005 Liii--JLiii--JLiiiiJLiiiiJiJ-------l---l
90 91 92 93 94 95 96 97 98 99 100
Time (hours)
FIGURE 11 FAR FIELD MONITOR 2 READINGS WITH A B727 IN THE LOCALIZER ENVIRONMENT
28
55 STANDBY POWER
All subsystems (localizer glide slope inner marker middle marker outer marker and RCSU) exceeded the specified time operation requirement for operation on standby power No anomalous monitor readings were observed during standby power operation Table 7 shows the amount of time each subsystem operated on standby power and its respective requirement
The localizer glide slope and RCSU subsystems recharged their respective batteries without incident The marker beacons however could not recharge their batteries to full charge without shutting down This is due to the high current draw required to recharge the batteries which in turn overheated the power supplies and caused them to turn off The failed power supply was returned to Wilcox for analysis
TABLE 7 MARK 20 SUBSYSTEM STANDBY POWER TEST RESULTS AND REQUIREMENTS
Mark 20 Subsystem Time operated on standby power
(hours)
Standby Power Requirement (hours)
4
4
72
72
72
1
Localizer 11
Glide Slope 165
Inner Marker 172
Middle Marker 168
Outer Marker 162
RCSU 25
6 CONCLUSIONS
All testing conducted on the Mark 20 Instrument Landing System (ILS) concluded in satisfactory performance of the system Although the initial draft instruction books provided by the contractor were incomplete subsequent revisions to the manuals resulted in an acceptable product The alignment process outlined in the manuals verified that the system was ready for the FAA flight inspection
The Mark 20 ILS successfully met required Category IIIII criteria during the flight inspection conducted by the Oklahoma City Flight Information Field Office (FIFO) Additional flight evaluations were conducted by the FAA Technical Center test team utilizing FAA Technical Center aircraft flight measurement equipment and radarlaser tracking systems All FAA Technical Center evaluations were within Category IIIII tolerances
29
System reliability and maintainability were verified in that the few subsystem outages that occurred were easily identified and corrected The Mark 20 remained operational throughout the entire test period except for interruptions to conduct required testing The system is extremely stable Weather conditions were recorded and analysis indicated that weather had little or no affect on operation of the system
The Remote Status and Interlock Unit (RSIU) was monitored during various test scenarios and accurately displayed the correct category of operation (This is the monitordisplay unit that is placed in an Air Traffic Control [ATC] facility)
All subsystems (localizer glide slope inner marker middle marker outer marker and Remote Control and Status Unit [RCSU]) exceeded the specified time requirement for operation on standby battery power
During the test period there were no indications that the integration of the Remote Maintenance Monitoring (RMM) System into the ILS affected the operational effectiveness of the Mark 20
7 RECOMMENDATIONS
Based on the results documented in this report the Mark 20 is recommended for deploYment in the National Airspace System (NAS) It is further recommended that a correction to the outer marker battery charging problem as stated in TTR 09 be resolved
30
8 ACRONYMS
AC ACY AFIS APMT ATC ATCT B727 CAT CLR CSB DDM DME DMEP DUCU FAA FFM FIFO ILS LCU LED LRU MHz MLS MPS MSL ModPA NAS nmi OTampE PIR PMDT RCSU RF RICE RMM RMS RSIU SBO SDM TMB TTR UHF VHF VSWR
Alternating Current Atlantic City International Airport NJ Automatic Flight Inspection System Associate Program Manager for Test Air Traffic Control Airport Traffic Control Tower Boeing 727 Category Clearance Carrier and Sidebands Difference in Depth of Modulation Distance Measuring Equipment Precision Distance Measuring Equipment Distribution Unit and Combining Unit Federal Aviation Administration Far Field Monitor Flight Inspection Field Office Instrument Landing System Link Control Unit Light Emitting Diode Line Replaceable Unit Megahertz Microwave Landing System Maintenance Processing System Mean Sea Level Modulator and Power Amplifier National Airspace System nautical miles Operational Test and Evaluation Portable Instrument Landing System Receiver Portable Maintenance Data Terminal Remote Control and Status Unit Radio Frequency Remote Indication and Control Equipment Remote Maintenance and Monitoring Remote Monitoring System Remote Status and Interlock Unit Sidebands Only Sum of the Depth of Modulation TamiamiKendall Executive Airport FL Test Trouble Report Ultra High Frequency Very High Frequency Voltage Standing Wave Ratio
31
APPENDIX A Oklahoma City Flight Inspection Field Office
Flight Inspection Report
n PAGE 1 ef 5 I REVIEW INITIALS FLIGHT INSPECTION REPORTmiddot-INSTRUMENT LANDING SYSTEM
2 IDENT XJF1 LOCATlON ATLANnC CITY NJ
4 DATE DATES OF 5 OWNER F 3 COMMON SYSTEM shy 712-13194INSPECTlON
SITE EVALUATION XPERIODIC SPECIAL MR 6 TYPE OF INSPECTlON
COMMISSIONING INCOMPLETESURVEILLANCE X LOCALIZER I ISDF GLIDE SLOPE 75 MHz MARKERSX X7 RUNWAY IB FACILITY
NO 04 INSPECTED COMPASS LOCATORS LOA I IDME LlGHTlNG SYSTEM
9 LOCALIZER FRONT COURSE BACK COURSE
TX 1 COMO WIDTH 560
TX 2 TX 2TX 1 CATEGORY II INITIAL FINALOT INITIAL INITIAL FINAL OTFINAL OT INITIAL FINAL OT
563 561 COURSE WIDTH
390 386 MODULATION
2361324 260iS8 CLEARANCE 1 5 0
2341323 270iS8 CLEARANCE 90
1458 21n COURSE STRUCTtJREmiddotZ 1
1064 0058 COURSE STRUClUREmiddotZ 2
11003 1015 COURSE STRUCTtJREmiddotZ 3
COURSE STRUCTtJREmiddotZ 4
COURSE STRUCTtJREmiddotZ 5
085 VERTlCAL POLARIZATION
530 499 SYMME1RY
3R 1L ALIGNMENT
VOICE
S S IDENTIFICATlON 18 USABLE DISTANCE
DATE MONITORDATE DATEDATE 490 493 COURSE WIDTH (NMrow)
648 651 COURSE WIDTH ~)
237132 26565 CLEARANCE 150
22658 231158 CLEARANCE 90 9 ALIGNMENT 150
9 ALIGNMENT 90-11 GENERAL
1)( 1 10 GLIDE SLOPE
1)(2 UNSAT
OT
COMD ANGLE 300 SAT
CATEGORY II 75 MHz MARKERS INITIAL ANAL OT INITIAL XANAL 301 ANGLE COMPASS LOCATORS
790 DMEMODULATION 067 W1DlH UGHTlNG SYSTEMS
CLEARANCE BELOW PAlH 12 FACIUTY STAlUS
210 STRUCTtJRE BELOW PATH FC GIS BIC 41634 PAlH SlRUClUREmiddotZ 1 UNRESTRICTED
sn68 RESTRICTED
4016
PATH STRUClUREmiddotZ2
PAlH STRUClUREmiddotZ 3 UNUSABLE X X 10 USABLE DISTANCE NOTAMs
SYMMETRY
DATE MONITORDATE
13 REMARKS SPECIAL INSPECTION THIS WAS A SPECIAL INSPECTION (MAiNT REQUESl) FOR EVALUATION OF A UK 20 ILS SYSTEM AS INSTALLED AT A TEST SITE LOCATION COMMISSIONING FLIGHT INSPECTION CRmRIA AND TOLERANCES SPECIFIC TO ILS CATAGORY II OPERATION WAS APPLIED FOR THIS INSPECTION
GLIDE SLOPE TRANSMITTER NO 2 NOT CHECKED INSPECTION TERMINATED WITH MAINT CONCRRENCE DUE TO AIRCRAFT AVAILABILITY AND HIGHER PRIORITY MISSION REQUIREMENTS
(SEE CONTINUAnON SHEET FAA FORM 8240middot15 ATTACHED) A S~TU~ AIRCRAFT NOIREGION AEA F~IGNA~R [ -y J tr-~FIFO ACY N-4S9V-
FAA FORM 8240middot7 (590)
A-I
475
n FLIGHT INSPECTION REPORT--INSTRUMENT LANDING SYSTEM
SUPPLEMENTAL SHEET
1 LOCATION ATLANTIC CITY NJ shy
ltih DATE DATES OF INSPECTION 712-1394 middotmiddotmiddotraquol
4 GLIDE SLOPE
PATH ANGLE 4a GLIDE SLOPE lYPE CAP EFFECT
TXl TX2
ADVANCE TX 1 TX2
15 305
4b DEPHASE
RETARD TX 1 TX2
15 308
4c PATH ANGLE LOWERED TO UMIT
4d PATH ANGLE RAISED TO UMIT
4e PATH WIDTH NARROWED TO UMIT 304
4f PATH WIDTH WIDENED TO UMIT
4g CLEARANCE TX MODULATION DECREASED 300TO UMITmiddot (PRIMARY TX WIDE UMln
4h ATTENUATE MIDDLE TXl TX2 ANTENNA TO UMIT 04OB
302
4i ATTENUATE UPPER TXl TX2 ANTENNA TO UMIT 297
1ODB
I CAS SECTOR FAFALT
4j TRANSVERSE STRUCTURE I EDGE SECTOR FAFALT
4k MODULATION BALANCE TX1
41 PHASING TXl
4m FRONT COURSE AREA WHERE PHASING WAS CONDUClED
4n CLEARANCE BELOW PATH TXl S
5 REMARKS CORRECTION FACTOR OF + 003 APPLIED TO REPORlED LEVEL RUN ANGLE DATA
FAA FORM 8240 - 16 (590) A-2
PATH WIDTH
TX 1
075
076
056
075
075
071
TX2
shyPAGE 2 of 5 REVIEW INITIALS
2 IDENT XJF
STRUCTURE BELOW PATH
TX 1 TX2
22i
117
22i
22i
193
212
070 BElOW PATH
070 BElOW PATH
TX2
TX2
NM MSL
lX2
PAGE 3 OF 5 PAGES
1 REVIEW INITIALS FLIGHT INSPECTION REPORT-CONTINUATION SHEET
1 LOCATION ATLANTIC CITY NJ 12 IDENT XHF
3 FACILl1Y 1YPE ILS 14 DATEDATES OF INSPECllON 712-1394
1 USEABLE DISTANCE CHECKS PERFORMED ON LOCALIZER TRANSMITTER NO 2 AND GLIDE SLOPE TRANSMITTER NO 1 ONLY
2 LOCALIZER ALIGNMENT MONITORS CHECKED ON GROUND (AWY 04) ON TRANSMITTER NO 2 ONLY
3 MARKER WIDTH MM 1137 AND 1M 626
4 ILS (XJF) FACILITY DATA WAS MANUALLY ENTERED INTO THE AAS DATA BASE WIlli CHANE OF DISTANCE TO THE OUTTER MARKER TO 31595 (52 NM) TO FACILITATE MANUAL POSITION UPDATING FOR LEVEL RUN ANGLE RESULTS (ILS 2)
S GLIDE SLOPE MEAN SYMMETRY WAS CHECKED AT487 90HZ ON PATH ANGLE 301middot BELOW PATH ANGLE 264 - ABOVE PATH ANGLE UOmiddot MEAN WIDTH 076 DEGREES
6 ANTENNA TILT CHECK ANGLE S8P WIDTH SYMMETRY
90HZ 299 210 069 478 150HZ 293 209 065 514
FAA FORM 8240 - 15 (590) A-3
0 FLIGHT INSPECTION REPORT-LOCALIZER CLEARANCE PLOT
1 lOCATION
3 DATEIDATES OF INSPECTION 712-1394
6 iX 7 CFG 8 AlT 9 RADIUS
N -
10NM1 17
12 400
90 Hz
300
fI)
~ 200 w 0shyE lt0100 II 0 ~
0 got 70 SO 40 30 20 10 0
6 iX 7 CFG 8 AlT 9 RADIUS 1 B 17 10NM
12 400
90Hz
300
()
~ 200 w 0shyE lt o 100a 0 ~
0
90 70 SO 40 30 20 10 0
6 lX 7 CFG 8 ALT 9 RADIUS 1 C 17 10HM
12 400
90Hz
300
fI)
~200 w 0shyE 0lt
0100a 0 ~
0
90 70 SO 40 30 20 10 0
13 REMARKS TEST SITE HAD NO BACK COURSE FOR EVAlUATION
REGION AEA FLIGHT INSPECTORS SIGNATURE TE~~ AFOACY NlA
4 ANT TYPE
10 WIDTH FC 563
10 20
10 WIDTH FC 648
lot 20
10 WIDTH FC 490
1(l11P 20
----r 1lt-
ATlANTIC CITY NJ
11 WIDTH Be NlA
middotV
FAA FORM 8240 - 18 (590) A-4
~l~ L _- _ Y shy
PAGE 4 of 5 0
2 IDENT XJF
5 SITE ElEV 870
CODE FC -- shyBC ____
150 Hz
30 40 SO 70 90V
11 WIDTH BC
NA
150Hz
30 40 SO
11 WIDTH BC
NlA
30V 40 SO
CODE
70
CODE
150Hz
70
FC BC __
90V
bullbull
FC-shyBe_ bullbull
90
AIRCRAFT NO
N~t
0 PAGE ) of 5 I FLIGHT INSPECTION REPORT-LOCALIZER CLEARANCE PLOT
DATEIDATES OF INSPECTlON
90 Hz 150Hz
9()9
9()9
9()9
13 REMARKS TEST SITE HAD NO BACK COURSE FOR EVALUATION
1 LOCATlON
3
6 lX 2
12 400
300
(I)
~200 w a laquo o 100 cr u E
0
6 lX 2
12 400
300
(I)
~ 200 w a laquo o 100 cr u E
0
6 TX 2
12 400
300
(I)
~ 200 w a laquo 0100 cr U E
0
REGION ApoundA
AFO ACY
90 Hz 150 Hz
712-1394 14 ANT lYPE shy
7 CFG 9 RADIUS [10 WIDTH FC N 17
18 ALT
10NM 51
ATlANTIC CITY NJ
11 WIDTH BC
NlA
709 509 409 3()0 209 109 0 10 209 30 40 SOO
7 CFG 18 ALT 19 RADIUS 110 WIDTH FC B 17 10NM ~I
70 sao 40 30 209 10 0 1(Jl1 20
7 CFG 18 ALT 19 RADIUS 110 WIDTH FC C 17 10NM 11j
90Hz
709 SOO 400 300 20 10 0 10 20 3Ii 40 SOV
FLIGHT INSPECTORS SIGNATURE
NA
11 WIDTH BC
NlA
30 40 SOV
11 WlDlH BC
NlA
_ l I
TECHNICIAMS Irn~ ~~E -
2 IDENT XJF
5 SITE ELEV 870
CODE FC BC bull __ bull
709 909
ICODE FC BC bull __ bull
70 90
I FCCODE BC ____
150Hz
-7rJI 90
AIRCRAFT NO
N~g
FAA FORM 8240middot 18 (590) A-5
ILS WORKSHEET
1 IDENT XJF 12 DATE 712-13194 3 TYPE CHECK SPECIAL SITE
4 CREW DRAPERICOLESIKENNEDY 5 AIRCRAFT NO N~9114 -
6 NOTES OPERATIONAL TEST AND EVALUATION OF THEMK 20 ILS INSTALLATION AT AlLANTIC CITY NJ (KACY) RWY 04_
UMITED COMMISSIONING PROFILE FLOWN AT MAINTENANCE REQUEST
RINY 04
FREQ 10U5
LOCTYPE DUAL
CWo 160
ANGLE 300
GNDTEMP 83
CAT 2 OAT 22
GS TYPE CAP EFF BARO 3002
ALTITUDE
7 RUN
1
cm
1N
PAorALN
3 1N
4 1S
5 1S
6 1S
7 18
8 18
t 18
10 1N
11 25
12 2S
13 28
14 2N
1
1
2N
2N
17
18
18
20
2N
2N
1N
1N
456
298
21 1NL
1NG
1L
298
190 JLA
2M
191
PWorCW
571
U9
00000
490
558
669
148
563 -
483
559
651
1161
1167
573
NIA
163
092
90Hz SYM
498
496
499
499
NlA
494
530
491
501
419
4
494
100
NlA
498
FLAG or MOD
38
386
390
790
REMARKS 1OTHER DATA
INITlAL NORMAL CLEARANCES SATlSFACTORY 35 middot35
ADJUSTED NORMAL CLEARANCES SATISFACTORY
NO ANNOUNCED COURSE WIDTHmiddot SYSlEM FAULT
COURSE NARROW~LEARANCEWIDE
COURSENORMAL~LEARANCENARROW
COURSE WIDE CLEARANCE NORMAL OTWIDE
SYSTEM FAULT
COURSE WIDE CLEARANCE NORMAL
NORMALCONAGURATION
COURSENARROW~LEARANCEWIDE
COURSENORMAL~LEARANCENARROW
COURSE WIDE CLEARANCE NORMAL
NORMALCONAGURATION
RF ALARM 18NM AT LCA USEABLE DISTANCE CHECK 1010
RF ALARM 18NM AT 4500 FT 10middot10
APCH RF ALARM 18NMTO TlfRESHOLD bull SAT
10NM ARC RF ALARM CLEARANCES SAT
SYSTEM FAULT 8AD UPDAlE DATA - RECHECK
CHANGE DATA FOR A Ii2 NM MANUAL UPDATE
ILS 3 LOCAUZER Z1zn7 Z2a OIO58 23-110115
ILS 3 GIS Z1=416366 Z2=31O58 13=71017
FAA FORM 8240middot21 (590) A-6
ILS WORKSHEET
1 IDENT XJF 2 DATE712middot13J94
4 CREW DRAPERICOLESIKENNEDY
6 NOTES OPERATIONAL TEST AND EVALUAll0N OF THE P1K 20 ILS INSTALLAll0N AT ATLAN11C CITY NJ (KACY) RWY04
UMiTED COMMISSIONING PROFILE FLOWN AT MAINTENANCE REQUEST
3 TYPE CHECK SPECIAL SITE
5 AIRCRAFT NO N-89184
RWf 04 CW 560
FREQ 109amp5 ANGLE 300
LOCTYPE DUAL GNDTEMP 83
OAT 22
GSTYPE CAPEFF
CAT 2
BARO 3002
ALTITUDE
7 RUN
22
CFQ
iN
iN
iN
PAorALN
1L
9UA
9UA
19O~ PWorCW 90Hz SYM
FLAG or MOD
REMARKS OTHER DATA
~UGNMENTMONITORS NORMAL
ALIGNMENT MONITORS 160 HZ
AUGNMENT MONITORS 90 HZ
1-18
1
2
3
4
I
bull 7
bull bull 10
11
12
13
14
16
1
TX1
iN
iN
iN
is
1B
1M
1A
1R
1U
1U
iN
iN
iN
RF
RF
RF
297
304
301
297
299
302
301
2A3
294
301
293
299
207
229
113
229
117
212
210
209
210
067
648
066
076
075
076
G76
071
067
066
069
476
494
513
493
461
493
431
140
521
471
514
478
796
788
789
BEGIN GUDE SLOPE 71394
SYSTEM FAULTmiddot NO UPDATEmiddot SEE 2
INITIAL NORMAlmiddot REFERENCE
GIS STRUCTURE Z1- 41712 22= 9060 Z3= 41016
NARROW ALARM
COURSE WIDE ClEARANCE MOD ALARM
MIDDLE ANTENNA ATTENUATED TO ALARMmiddot GADB
DDLE ANTENNA ADVANCE PHASE 16 DEGREES
DDLE ANTENNA RETARD PHASE 15 DEGREES
SYSTEM FAULTmiddot NO DATA
UPPER ANTENNA ATTENUATED 1DB
NORMALmiddot LEVEL RUN
TUT CHECK middot150 HZ SIDE (lOCAUZER EXlRErtT1ES)
1LT CHECKmiddot 90 HZ SIDE (lOCAUZER EXTRErt11ES)
USEABLE DISTANCE FROM 10 NM bull 150HZ SIDE (8 DEGREES)
USEABLE DISTANCE FROM 10 NM bull 90HZ SIDE (8 DEGREES)
USEABlE DISTANCE FROM 10 NM bull ON COURSE
FAA FORM 8240 - 21 (590)
A-7
ILS WORKSHEET
1 IDENT XJF 12 DATE 7112middot13194 3 TYPE CHECK SPECIAL SITE
4 CREW DRAPERICOLESIKENNEDY - 5 AIRCRAFT NO N~184
6 NOTES OPERATIONAL TEST AND EVALUA1l0N Of lliEMK 20 ILS RWY 04 CW amp60 INSTALLATION AT ATLANTIC CITY NJ (KACY) RWYMmiddot
FREQ 10966 ANGLE 300
UMiTED COMMISSIONING PROFILE FLOWN AT MAINTENANCE REQUEST LOCTYPE DUAL GNDTEMP 83
CAT 2 OAT 22
GS TYPE CAP EFF BARD 3002
ALTITUDE
7 RUN CFG PAorALN 190 JampA PWorCW 90Hz SYM
FLAG or MOD
REMARKS I OTHER DATA
11 1N 301 MEAN WlDlliSYMMETRY ON PATH
18 1N 264 487 MEAN WlDlliSYMMETRY BELOW PATH (90HZ)
18 1N 340 MEAN WIDTHSYMMETRY ABOVE PATH (160HZ)
A 8
1 INSTRUMENT LANDING SYSTEM a State New Jersey b City Atlantic City c Airport Atlantic city International Airport d Category of Operation Category III e Associated runway~ Runway 04 f Approach bearing 02800 deg true h Engineering drawing na i Localizer
1 Latitude and longitude of antenna 39 deg 28 0103 N I 074 deg 34 2522 W
2 Antenna Type 14 element LPD 3 Distance from stop end of runway to antenna 1005 4 Distance from approach end of runway to antenna
7149 5 Distance and direction from runway centerline on cl 6 Ground elevation at center of antenna array 664msl 7 Identifier I-XJF 8 Frequency 10955 mhz 9 Voice availability na
10 Course width 56 deg 11 Course width over threshold 700 ft 12 Back course status Not available 13 Restrictions None 14 Remote monitor Far field monitor 15 Commissioning date na
j Glide Slope 1 Latitude and longitude of antenna
39 deg 27 0813 N I 74 deg 35 0727 W 2 Ground elevation of antenna mast 6584 msl 3 Elevation of runway centerline abeam glide slope
antenna 670 msl 4 Frequency 33245 mhz 5 Type of facility Capture effect antenna system 6 Distance of antenna from approach end of runway875 7 Distance and direction from runway cl 400 left 8 Glide angle 300 deg 9 Restrictions na
10 Remote monitor na 11 Commissioning date na
k outer Marker 1 Latitude and longitude of antenna
39 deg 29 5362 N I 074 deg 40 2048 W 2 Ground elevation of antenna 48 msl 3 Distance from runway threshold 4804 4 Distance from runway centerline extended on cl 5 Locator classification OM 6 Remote monitor na 7 Commissioning date na
A-9
APPENDIXB Test Trouble Reports
TTR__-=-O=l _ CAT IIIII ILSRMS TEST TROUBLE REPORT FORM
TESTER Ben BennettPaul Evermon LOCATION _~A=CY _
TEST SCENARIO Installation DATE June 94
TTR CLASSIFICATION CRITICAL SIGNIFICANT MINOR x
DESCRIPTION OF PROBLEM OR FAILURE During installation a problem was detected with one of the FFMs The signal from this monitor had considerable 60 Hz interference The monitor was returned to the factory for repair The 60 Hz interference could not be repeated at the factory and the unit appeared to be working fine under lab conditions When the FFM was returned to ACY the problem surfaced again In the field it was discovered that when an audio transformer was placed in the line from the FFM to the localizer the FFM worked fine From this it is assumed that the FFM has a bad transformer
RECOMMENDED SOLUTION Wilcox should develop a production test procedure for the FFM to test the audio transformer in the future
RESOLUTION Wilcox has added a procedure to test the audio transformer in their production acceptance tests
IMPROVEMENT RECOMMENDATION MODIFICATION TO HARDWARE MODIFICATION TO SOFTWARE CHANGE IN TEST PROCEDURE CHANGE IN OPERATIONS
B-1
TTR__~O==2 _ CAT IIIII ILSjRMS TEST TROUBLE REPORT FORM
TESTER Ben Bennett LOCATION _=A=C-Y _
TEST SCENARIO _~A~l=ig~n~m~en~t_ _ DATE June 1994
TTR CLASSIFICATION CRITICAL x SIGNIFICANT MINOR
DESCRIPTION OF PROBLEM OR FAILURE After calibrating the glide slope detectors the clearance RF level reads 113 and the clearance SDM reads 75 This is due to path SBO signals not being canceled out before the detection process
RECOMMENDED SOLUTION Wilcox must isolate the path SBO signal from the clearance signal before detection This can be accomplished by either hardware or software changes
RESOLUTION Wilcox addressed this issue with a new monitor software release This software release was tested at ACY and TMB and found to be an acceptable solution to the problem See paragraph 533
IMPROVEMENT RECOMMENDATION MODIFICATION TO HARDWARE or MODIFICATION TO SOFTWARE
CHANGE IN TEST PROCEDURE CHANGE IN OPERATIONS
B-2
TTR__O=3 _ CAT IIIII ILSRMS TEST TROUBLE REPORT FORM
TESTER Ben Bennett LOCATION _A=CY _
TEST SCENARIO Installation DATE June 1994
TTR CLASSIFICATION CRITICAL SIGNIFICANT MINOR x
DESCRIPTION OF PROBLEM OR FAILURE The ON BATTERY and LOW BATTERY LEDs do not illuminate when the TEST button is pressed on the RCSU
RECOMMENDED SOLUTION
RESOLUTION It will be documented in the RCSU user manual that the LEDs will not light
IMPROVEMENT RECOMMENDATION -Kshy MODIFICATION TO HARDWARE or -Kshy MODIFICATION TO SOFTWARE
CHANGE IN TEST PROCEDURE CHANGE IN OPERATIONS
B-3
TTR__=O-=4 _ CAT IIIII ILSRMS TEST TROUBLE REPORT FORM
TESTER Ben BennettByron Robins LOCATION _~A~C~Y _
TEST SCENARIO Normal Operation DATE June 94
TTR CLASSIFICATION CRITICAL SIGNIFICANT x MINOR
DESCRIPTION OF PROBLEM OR FAILURE The glide slope and localizer integrity check will fail if the standby monitor alarm delay time is set too low
RECOMMENDED SOLUTION Software change to not allow a standby monitor alarm delay time too low for the integrity check to pass
RESOLUTION The PMDT software was changed to not allow the user to set the standby monitor alarm time too low
IMPROVEMENT RECOMMENDATION MODIFICATION TO HARDWARE -K- MODIFICATION TO SOFTWARE
CHANGE IN TEST PROCEDURE CHANGE IN OPERATIONS
B-4
TTR__--O=S _ CAT IIIII ILSRMS TEST TROUBLE REPORT FORM
TESTER Ben Bennett LOcATION----A~CY _
TEST SCENARIO Integration testing DATE July 1994
TTR CLASSIFICATION CRITICAL SIGNIFICANT x MINOR
DESCRIPTION OF PROBLEM OR FAILURE The localizer and glide slope manual fault diagnostics will not run after a fault has been introduced that causes both transmitters to shut down
RECOMMENDED SOLUTION Correct in software
RESOLUTION Software revisions by Wilcox corrected this problem
IMPROVEMENT RECOMMENDATION MODIFICATION TO HARDWARE -K- MODIFICATION TO SOFTWARE
CHANGE IN TEST PROCEDURE CHANGE IN OPERATIONS
B-S
TTR__--O--6 _ CAT IIIII ILSRMS TEST TROUBLE REPORT FORM
TESTER Ben Bennett LOCATION _=A=C-=Y _
TEST SCENARIO Integration testing DATE July 1994
TTR CLASSIFICATION CRITICAL SIGNIFICANT x MINOR
DESCRIPTION OF PROBLEM OR FAILURE Auto fault diagnostics for the localizer glide slope and the marker beacons do not accurately identify the faulted LRU
RECOMMENDED SOLUTION Correct in software
RESOLUTION Automatic diagnostics is not as accurate as manual because in order to accurately diagnose the subsystem faulty signals must be radiated This can only be done manually
IMPROVEMENT RECOMMENDATION MODIFICATION TO HARDWARE -X- MODIFICATION TO SOFTWARE
CHANGE IN TEST PROCEDURE CHANGE IN OPERATIONS
B-6
TTR__O~7 _ CAT IIIII ILSRMS TEST TROUBLE REPORT FORM
TESTER Ben BennettByron Robins LOCATION _A=C--Y _
TEST SCENARIO Normal Operations DATE 8894
TTR CLASSIFICATION CRITICAL SIGNIFICANT x MINOR
DESCRIPTION OF PROBLEM OR FAILURE Localizer shut down The executive monitor course DDM went out of tolerance causing both transmitters to shut down indicating a possible problem in the DUCU or antenna subsystems
RECOMMENDED SOLUTION
RESOLUTION It has not been determined what caused this outage
IMPROVEMENT RECOMMENDATION MODIFICATION TO HARDWARE MODIFICATION TO SOFTWARE CHANGE IN TEST PROCEDURE CHANGE IN OPERATIONS
B-7
TTR__~O~8 _ CAT IIIII ILSRMS TEST TROUBLE REPORT FORM
TESTER Ben BennettByron Robins LOCATION _~A~CY _
TEST SCENARIO Standby power test DATE 82994
TTR CLASSIFICATION CRITICAL SIGNIFICANT x MINOR
DESCRIPTION OF PROBLEM OR FAILURE The marker beacon front panel displays on batteries and maintenance alert after the batteries have been discharged and AC power restored to the system
RECOMMENDED SOLUTION The project office will have this problem corrected by Wilcox through ECP16
IMPROVEMENT RECOMMENDATION MODIFICATION TO HARDWARE or MODIFICATION TO SOFTWARE
CHANGE IN TEST PROCEDURE CHANGE IN OPERATIONS
B-8
TTR__-=0=9 _ CAT IIIII ILSRMS TEST TROUBLE REPORT FORM
TESTER Ben BennettByron Robins LOCATION _~A~C-=-Y _
TEST SCENARIO Standby power test DATE 83094
TTR CLASSIFICATION CRITICAL SIGNIFICANT x MINOR
DESCRIPTION OF PROBLEM OR FAILURE After the batteries were discharged AC power was restored with only one of two sets of batteries on line to reduce charge current As a result of this condition the outer marker ACDC power supply shut itself down due to too much power being supplied The ACDC converter is not powerful enough to charge even one set of batteries after they have been discharged
RECOMMENDED SOLUTION Raise the battery cut off voltage so that the marker beacons shut down at a state of discharge that the ACDC converter can recharge the batteries without damage At the current cut off voltage the marker beacons remained on the air for well over 176 hours The requirement is only 72 hours
IMPROVEMENT RECOMMENDATION MODIFICATION TO HARDWARE MODIFICATION TO SOFTWARE CHANGE IN TEST PROCEDURE CHANGE IN OPERATIONS
B-9
TTR__lO _ CAT IIIII ILSRMS TEST TROUBLE REPORT FORM
TESTER Ben BennettByron Robins LOCATION _A=C-=Y _
TEST SCENARIO Normal Operations DATE 9694
TTR CLASSIFICATION CRITICAL SIGNIFICANT x MINOR
DESCRIPTION OF PROBLEM OR FAILURE This is a repeat of the TTR 07 he executive monitor course ddm started to fluctuate around 810 pm on ~ September It went into alarm several times but went back to normal before the 2 second alarm delay time had expired The executive monitor remained stable until approximately 820 am 6 September The course ddm and course width ddm went into alarm but went back to normal before the alarm delay timer expired again At 908 am the course path and width ddm began to oscillate between alarm and normal This continued until 930 am when the course ddm remained in alarm condition until the delay timer expired causing both transmitters to shut down No abnormal weather conditions were present at the time of shutdown
RECOMMENDED SOLUTION
RESOLUTION The cause of this outage has not been determined
IMPROVEMENT RECOMMENDATION MODIFICATION TO HARDWARE MODIFICATION TO SOFTWARE CHANGE IN TEST PROCEDURE CHANGE IN OPERATIONS
B-10
TTR__=l=l _ CAT IIIII ILSRMS TEST TROUBLE REPORT FORM
TESTER Ben BennettByron Robbins LOCATION _poundlA=CY _
TEST SCENARIO Normal Operations DATE 112194
TTR CLASSIFICATION CRITICAL SIGNIFICANT x MINOR
DESCRIPTION OF PROBLEM OR FAILURE The inner marker AC to DC converter failed The power was turned off for approximately 5 hours and then turned back on with no effect The AC to DC converter from the middle marker worked in the inner marker The converter was returned to Wilcox who will send it to Lambda for analysis
RECOMMENDED SOLUTION
RESOLUTION The ACDC converter was returned to Wilcox for analysis
IMPROVEMENT RECOMMENDATION MODIFICATION TO HARDWARE MODIFICATION TO SOFTWARE CHANGE IN TEST PROCEDURE CHANGE IN OPERATIONS
B-ll
TTR__1=2 _ CAT IIIII ILSRMS TEST TROUBLE REPORT FORM
TESTER Ben BennettByron Robbins LOCATION _~AC=Y _
TEST SCENARIO Normal Operations DATE 112194
TTR CLASSIFICATION CRITICAL SIGNIFICANT x MINOR
DESCRIPTION OF PROBLEM OR FAILURE Unknown failure of the RMM board on the glide slope RMM boards were swapped from the localizer to the glide slope and the communication errors followed the RMM board to the localizer A new spare RMM board was installed which corrected the errors
RECOMMENDED SOLUTION
RESOLUTION Normal corrective maintenance
IMPROVEMENT RECOMMENDATION MODIFICATION TO HARDWARE MODIFICATION TO SOFTWARE CHANGE IN TEST PROCEDURE CHANGE IN OPERATIONS
B-12
TTR__=1=3 _ CAT IIIII ILSRMS TEST TROUBLE REPORT FORM
TESTER Ben Bennett LOCATION ACY Runway 04 Localizer
TEST SCENARIO Normal Operation DATE 020395
TTR CLASSIFICATION CRITICAL SIGNIFICANT MINOR x
DESCRIPTION OF PROBLEM OR FAILURE With transmitter 2 selected as main the localizer would switch to transmitter 1 and remain on the air The switch over would occur within 24 hours of start up This anomaly only existed when transmitter 2 was selected as main
The conditions of the fault were clearance RF level dropping to 448 clearance width 1 dropping from 0293 ddm to 0000 ddm clearance width 2 dropping from 0226 ddm to 0000 ddm and the clearance SDM dropping from 407 to 00
When transmitter 2 was brought back on line the monitors would be within alarm tolerances This condition indicated an intermittent problem as well as prevented fault diagnostics from identifying the faulty LRU Trouble shooting revealed that the clearance CSB RF relay on the transfer assembly was intermittent and was replaced with a new relay from the spares kit
RECOMMENDED SOLUTION
RESOLUTION Normal corrective maintenance
IMPROVEMENT RECOMMENDATION MODIFICATION TO HARDWARE MODIFICATION TO SOFTWARE CHANGE IN TEST PROCEDURE CHANGE IN OPERATIONS
B-13
APPENDIXC Stability Data
Temperature
~ i ~ ~ i bull i
Day of Month of January 1995
FIGURE C-l MEASURED OUTSIDE TEMPERATURE FOR THE MONTH OF JANUARY 1995
Barometric Pressure
~ JIJO
~ 298
g 296
294
~
IJ4 f----+----+----+----+----+--__t_ middot1middotflAmiddotmiddotmiddotmiddotmiddotmiddotmiddotmiddotmiddotmiddot P
IJ2middotmiddotmiddotmiddotmiddotAmiddotmiddotmiddotmiddotmiddotmiddotlr-Nmiddotmiddott 1 middotmiddotmiddotfi
J t ~ ~ 1 1 ~
I -(
y
Day of Month of January 1995
FIGURE C-2 MEASURED BAROMETRIC PRESSURE FOR THE MONTH OF JANUARY 1995
C-1
Wind Speed
50
40
-I a 30 ~ - C 0) 0)
200 (I)
C t
~ 10
0
5 10 15 20 25 30
Day of Month of January 1995
FIGURE C-3 MEASURED WIND SPEED FOR THE MONTH OF JANUARY 1995
Rain Rate
~
middot middot middot
03 1-----7+--+-----+---------+-----------+------~-+-7 --~~-i
- J L
o 02 1-------+--+-----+---------+---~-+--------f-----+_I
CIl c
- ~VI CIl ~ g 01 H---~--~--~~-~H+_+_----+__1
~ - ~
5 10 15 20 25
Day of Month of January 1995
FIGURE C-4 MEASURED RAIN RATE FOR THE MONTH OF JANUARY 1995
C-2
Localizer Course DDM
0000 middot
OOCE
bullbullbullbullbullbullbull M bullbull ON OM H bullbullbullbullbullbullbullbullbullbull M M 0004
0002
~ 0000
o (JOO2 middot
~ ~ ~ ~
(J004
(Jom
(Jooo
bull ~ i shy i ~ bull - bull
i
5 10 15 20 25 3D
Day of Month of January 1995
FIGURE C-5 MONITORED
Localizer Course RF Level
middot 100 I----~ +-~ -----+--~~~~--~-t-~----~~----~+-
~
~
102 ~n y1J 100 ~~~V~r~j-IfVvYv I1J
~ ~ ~ 98
~ 96~------+----------+----------+-----------r----------~------H LL 0 9-4 r---r--~~r-----~--+--- -+--1 middot
bullbullbull M bullbull M bullbull M M bullbull M
~ bull i i imiddot imiddotmiddot i 00 ---~----~~JL~~ ~~L~~ ~~~
5 10 15 20 25
Day of Month of January 1995
FIGURE C-6 MONITORED LOCALIZER COURSE RF LEVEL FOR THE MONTH OF JANUARY 1995
C-3
localizer Course Width
0175 1-----+---+----1------1-----+-----+-1
~ 0 165 1------t-~~~+-~~-I-~--1I--~~-+-~~--+-I -middot o ~ ~
Cl 0160 ~ ~ Jilll~ bullbulliJ bull1 jj 1l1~~ _J
0155 ~ ~ ~ ~~~~I~~ ~~~~~_~~~_~ M ~lD 0 150
middot imiddot - i ~ - - ~ g 0145~ ~+---bull-+bull-i--~~---+--~-1 o
ON 0 N _ 0 bullbullbullbullbullbullbull 0 bullbullbullbullbullbullbullbullbullbullbullbullbullbull
middot ~ ~ ~ ~ ~ ~ ~ ~ ~ ~ ~ ~ 0131 L-i~----1lt------Li-~-----i--iiJL-i-------i--iLJ
5 10 15 20 25
Day of Month of January 1995
FIGURE C-7 MONITORED COURSE WIDTH FOR THE MONTH OF JANUARY 1995
localizer Course SDM
~ gt ~ -
middot ~ ~ ~ ~ ~ ~ ~ ~ ~
42 ~t~+--- ---+---+--~~ -+-1 middot - _~ - E
io 41 ~----+~~~+-------~-+-~~~~ -----~+- --c-----+-l
1 bullbull 1 bullbullbullbull bullbull bullbullbullbullbullbullbullbullbullbullbullbullbullbullbull bullbullbullbullbull 1 bullbull bullbullbullbullbullbullbullbullbullbull bullbullbullbull bullbullbullbull 1 bullbull 1 bullbullbullbull3 [~ o 40 ~ ~_ bull ~ bull ~ ~ ~ ~ ~ ~ - 39 ~----+~--------+-------~-+------------~-----+-- --------+-l E ~ bull Cl (I) 38 J---------+------------1---------+---------1---------1----------+-l
-- - - - -
~ ~~O-~~~~~ ---~---J ~J----~ L-J
5 10 15 20 25
Day of Month of January 1995
FIGURE C-8 MONITORED LOCALIZER COURSE SDM FOR THE MONTH OF JANUARY 1995
C-4
bullbull
Localizer Clearance RF Power Level
~ middot ~ IIll I-----~---------+-------+---+------t-I
_ - i c 104 I---------tr----~~I---~~+--~~-+~~~~~~t-I
middot~middotjmiddot1 W~M A~ ~~ fi1N ~ ~jT tv~~~ltiMfv~~l~--~( ~ t _ _- _ ) ~ _ j 98
~ 96 1-----+---~I------+--7-+----7----~----------t-I LI 0 94 1---r~I-----+----~-+~----+----t-I ~ w N W bull OMow N bull ~ bullbull N bullbullbullbullbullbullbullbullbullbullbull
middot middot ~ bull i ~ - bull
00 ~--~---iJLi ~I-i-------------------L-- ~JJ
5 10 15 20 25 3J
Day of Month of January 1995
FIGURE C-9 MONITORED LOCALIZER CLEARANCE RF LEVEL FOR THE MONTH OF JANUARY 1995
Localizer Clearance Width 1
middot bull bullbull bullbullbullbull bull bull bullbull bullbull bull bullbullbullbullbull bull bull bullbullbullbullbullbullbull bull bull 0 bull bullbull ~ bullbullbull bullbull bull bullbull
039 r---+middot-+-~+----- t----+-+--1
bull bull bullbull ~ bull bullbullbullbull bull bullbull bull bull bull bullbull bull bullbullbullbull bullbullbull bull bull bull bullbullbullbull 0 0 0 bullbull I bullbull bullbull
bull bull ~ bull 0 bull bullbullbullbull bullbullbull bullbull bullbullbull i ~ bullbull 0 bull bullbullbull bullbull j bullbull bullbull bull bullbull bullbull 03J ~-------ii---------ii------ii---i----_i-LJ
5 10 15 20 25 3J
Day of Month of January 1995
FIGURE C-10 MONITORED LOCALIZER CLEARANCE WIDTH 1 FOR THE MONTH OF JANUARY 1995
C-5
Localizer Clearance Width 2
middot ~
middot
-p bull bullbullbullbullbullbull _ bullbull middot middot
I~ bullbullbullbull bullbullbullbullbullbullbullbullbullbullbullbullbullbullbullbullbullbullbullbullbull bullbull bullbull
~ 033 r--------+-~--+-------+------~------+-------+-1 middot ~o B 029 j MJ= 028 _ 11~lr 111 IlHiJ ii ~ LJIIlIn
~ bullbull -- 1---- T~~+ -1 +-+----+---~v~IIVm
027 r-------r----+--7----+-tH---------r------7+---t-1 -middot
- imiddotmiddot ~ - - bull - bull i middot 024 ---~ -J-~~~~~_~----~~JL-o~_~ L-J
5 10 15 20 25
Day of Month of January 1995
FIGURE C-11 MONITORED LOCALIZER CLEARANCE WIDTH 2 FOR THE MONTH OF JANUARY 1995
Localizer CourseClearance Frequency Difference
~ ~ ~ ~ ~ ~ ~ ~ ~
N 83 ~j--T--T-+-- -+---+j-H
g bullbull p _ bullbullbullbullbull - - - bullbull ~ - bullbull _ bullbullbullbullbull shy _ - bullbull _ bullbullbullbullbull shy
B2 middot II) 1middotmiddotmiddot middotmiddotmiddot bullbullbullbullbull middotmiddotbullmiddotmiddotmiddot middotmiddotmiddotmiddot1middotmiddot
U amp Bl 1---t----------+---------+----r------f-----------t-----------+-1II) ~ BO ~- __ --+-0shy I---t--j is gt- 79 1---~t-~-+----~-+-t---~~-t-~-~-1 middot middot u ~ amp ~ 7B I------t----------+--------+----------f-------t-~~-I
~ - - - - - cr
77 ~j--T-_r~ -+-~-t--T-~-I 11
bullbullbull bullbull bullbullbull bullbullbullbullbull bullbullbull bullbullbull bullbullbullbullbull j bullbullbull bullbullbull bullbullbullbullbullbullbullbull bullbull bullbull bullbullbull bullbullbullbullbullbullbull bullbullbullbullbullbull bullbullbullbullbullbullbull bullbullbull j bullbull j bullbull middot 75 -------Li-i---Li--------------J---i-JJ
5 10 15 20 25
Day of Month of January 1995
FIGURE C-12 MONITORED LOCALIZER COURSECLEARANCE FREQUENCY DIFFERENCE FOR THE MONTH OF JANUARY 1995
Localizer Ident Depth of Modulation
~~~ ~ ~ ~ _ 10 f----+----+-----t--- -+-------+----------------+-1 fl -
9 f-------+-----~~f---77~---+----~-+-~-----+---~___+-I
c ~~ - ~ m 11 8 ~-- l-IIIIbull~L--+-~ ~------F-u---JL---fL----amp---t-I lo ~ 7f-----------+-------------If---7------+--------+-----------+----------+-I3 C
~ 6 1------------+------------+------------+-------------+-------------+----------+-1
- -- - -
4----~_____~~~Lo~~-----~~____~~----L~~~l-J
5 10 15 20 25
Day of Month of January 1995
FIGURE C-13 MONITORED LOCALIZER IDENTIFICATION DEPTH OF MODULATION FOR THE MONTH OF JANUARY 1995
Glide Slope Path DDM
~ ~ ~ ~ 0020 ~----+-----f--- -----+------+----+-+-1
~ ~ ~ ~
0005 ~---+-----f----+---~-I---++-I
~ ~ ~ ~ ~ _
bullbull bullbullbull bullbull bullbullbullbull bullbullbull bullbullbull bullbullbull bullbullbullbull bullbullbull bullbullbull bullbullbullbullbullbullbullbull bullbullbull bullbull bullbullbull bullbullbullbull bullbull bullbullbull bullbullbull bullbullbullbullbullbullbullbull bullbull j bullbull j bullbullbullbull -0025 ----~~~~----~~-----~~~------~~----~~~L-J
5 10 15 20 25
Day of Month of January 1995
FIGURE C-14 MONITORED GLIDE SLOPE PATH DDM FOR THE MONTH OF JANUARY 1995
C-7
Glide Slope Path RFLevel
100 ~--+~---If----+----+----+---H - - - -
~ 98 i j c bullbullbull bull -bull ~ bull bull ~ bull bullbull bullbull bullbullbull i bullbull i bullbull i
~ U 0
~
94 - - shy - bull ~ ~ - - ~ ~ bull - bull bullbull - bull bullbull bull
1--------+---------71--------+----------+--------+------7--1---
bullbullbullbullbullbullbull ~ bull OM OM bull bull middot N bull M amp bull O bull bullbull bullbull bullbull
middot-middotmiddotmiddotimiddotmiddotmiddotmiddotmiddotmiddot
OC)----JJ--JJ----L-1------LL------------------LJ
5 10 15 20 25 30
Day of Month of January 1995
FIGURE C-15 MONITORED GLIDE SLOPE PATH RF LEVEL FOR THE MONTH OF JANUARY 1995
Glide Slope Path Width
0205 ----r-1---r-T---TT--r-TT--r--r-r---r-r----
02fIl 1---~~~~~--~-t--~tH ~ ~ ~ ~ ~ ~
0195 ~---+--~~ --------l-----+------t----- H ~ ~ ~ ~ ~middot
0100 ~-----+-------~~-----=- -t-------=-----=--t--------+------=---+--1
O 1B5 r----j----t-------j----I-----+------t-i middot ~ ~
~ 0100 lila ~ r~~~L ~Li~~~~ bullbullbullbullbull ~r~ ~ 0165 r----~~~I---~+-~~-t--~t --t-i
middot i imiddot - - - i bull ~ imiddot i i
0160 r-----~----- -+-~--t---~---t---- ------~-----t-i
0155 1-----+-~~~~~~-t--~t~H
middot i bull ~ i bull bullbullbullbull - ~ bull i ~ ~ I bullbull I bullbull bullbull
o150 I-----f--_~I-----------+--_--+-------+-------+-H middot bull~ ~ middot
0145 ~~~---J ~~L-o~~~~~ ~~------
5 10 15 20 25
Day of Month of January 1995
FIGURE C-16 MONITORED GLIDE SLOPE PATH WIDTH FOR THE MONTH OF JANUARY 1995
C-8
82
-
Glide Slope Path SOM
~ ~ ~ ~ ~ ~ ~-~ ---- -+--+--+- -----t---+-I
~ ~
- ~ ~ ~ ~ ~
5 10 15 20 25 3J
Day of Month of January 1995
FIGURE C-17 MONITORED GLIDE SLOPE PATH SDM FOR THE MONTH OF JANUARY 1995
Glide Slope Clearance RF Level
middot
40
~ ~ - - - 2()
~ - tIE ~
W 1[UJljtJ~~ ~V middot+Imiddotf1t i~~~ middot~ftH~ E ~t~ r~nr Lrllll fU~ ld~~~~1middot 1 BJ ~ 102 fT TT ~yrlni~f l 0 100 j~ ~JJ ~ ~ ~ ilt
~ 00 ~ $ 1-shy ----+---+---+--~-+- -H U 0 94
middot bull d bullbull N
~ bull i shy bull - bullbull - i i middot 00 _iJ-------JLi----iLi-i----i----J---------- 0
5 10 15 20 25 3J
Day of Month of January 1995
FIGURE C-18 MONITORED GLIDE SLOPE CLEARANCE RF LEVEL FOR THE MONTH OF JANUARY 1995
C-9
Glide Slope PathClearance Frequency Difference
middot ~ ~ ~ ~ 84 j-------=--~--=-- ~ ~ -+--~---+-I
bullbullbullbullbull bullbull ~ bullbullbull bullbull bull bullbullbullbullbullbull bullbull I bullbull
i bull i - ~ bullbull bullbull bullbull - bull i i middot 75 Li----------iJ-----------I-i--ii-i-l-i-i----------------L-I
5 10 15 20 25 30
Day of Month of January 1995
FIGURE C-19 MONITORED GLIDE SLOPE PATHCLEARANCE FREQUENCY DIFFERENCE FOR THE MONTH OF JANUARY 1995
Inner Marker Beacon RF Level
~ ~ ~ ~ ~ ~ middot
100 j---------+---t---------+------+-----~--+-l
-middot
- ~ - _ _ iiishybull~ 104
~ 102 1------+----------11-------+--------+--+---H
0 100 middotmiddotmiddotfTmiddotrmiddotmiddot middotmiddotmiddotmiddotmiddotmiddot~middotTmiddot~middotmiddotmiddotmiddot(middotlrmiddotmiddotmiddotmiddotmiddotmiddotmiddotifC l ~ ~lI jIUHPLLUJ) ) )1)11 1) lI)I) l
98 ~ middotmiddotmiddotmiddotmiddotmiddotmiddottmiddotmiddotmiddotmiddot
~ Ii ---~-+--~---II-----~~+---~-+----+----H u D 94 ~-rmiddotmiddot~~r---~-+~--H
middot - _ - _ ~ ~
- middotmiddotmiddotmiddotmiddotmiddotmiddot-middotmiddotimiddotmiddot j bullbull bullbullbull bullbullbull bullbullbullbull bullbullbull bull bullbullbull bullbullbullbullbullbull bullbullbull bullbull bullbull bullbullbullbullbullbullbull bullbull j bullbull bullbull middot 9J -----i-i-I-i----l-i-i--------i-i-i-L-i--i-i-iL-i-i_i-I-J
5 10 15 20 25 30
Day of Month of January 1995
FIGURE C-20 MONITORED INNER MARKER BEACON RF LEVEL FOR THE MONTH OF JANUARY 1995
C-10
Inner Marker Beacon Modulation
M OM M M M bullbull _ bullbullbull OM M M
102 middot
bull bull bullbull ~ bullbull bull bullbull bullbullbull bullbullbull bullbull I bull ~ bullbull bull bull ~ bull bullbull ~ bull bullbull bull I bullbull I bullbull 100 I----~-t-~----I---------+---- 7---+-7------+------+-1
bullbull bullbull ~ bullbull bullbullbull I bull bullbull bullbull bull bullbull I bullbull I bullbull bullbull
Bl3 1----+----11----------+------------+-----+---H ~ ~ ~ ~
5 10 15 20 25
Day of Month of January 1995
FIGURE C-21 MONITORED INNER MARKER BEACON DEPTH OF MODULATION FOR THE MONTH OF JANUARY 1995
Inner Marker Beacon Vo~age Standing Wm Ratio
raquo 1 B 1-----+------~-+-~--+---------+-------+------+-1
middot bullbullbullbullbullbullbullbullbullbullbull bullbull M _ bullbull M bullbullbullbullbull _
i ~ - - ~ i t bullbull bullmiddot 100 L--ii-i--------ii-----------Ji--i-i--li-i----i----i-i----LJ
5 10 15 20 25
Day of Month of January 1995
FIGURE C-22 MONITORED INNER MARKER BEACON VOLTAGE STANDING WAVE RATIO FOR THE MONTH OF JANUARY 1995
C-11
Inner Marker Beacon Idenl Keying
100
95 J 0 J Cg 0 - II
(0
90
85
C
~ OJ ~
II CD
80
75
~ 0 II
0
70
65
60 5 10 15 20 25
Day of Month of January 1995
FIGURE C-23 MONITORED INNER MARKER BEACON IDENT KEYING STATUS FOR THE MONTH OF JANUARY 1995
C-12
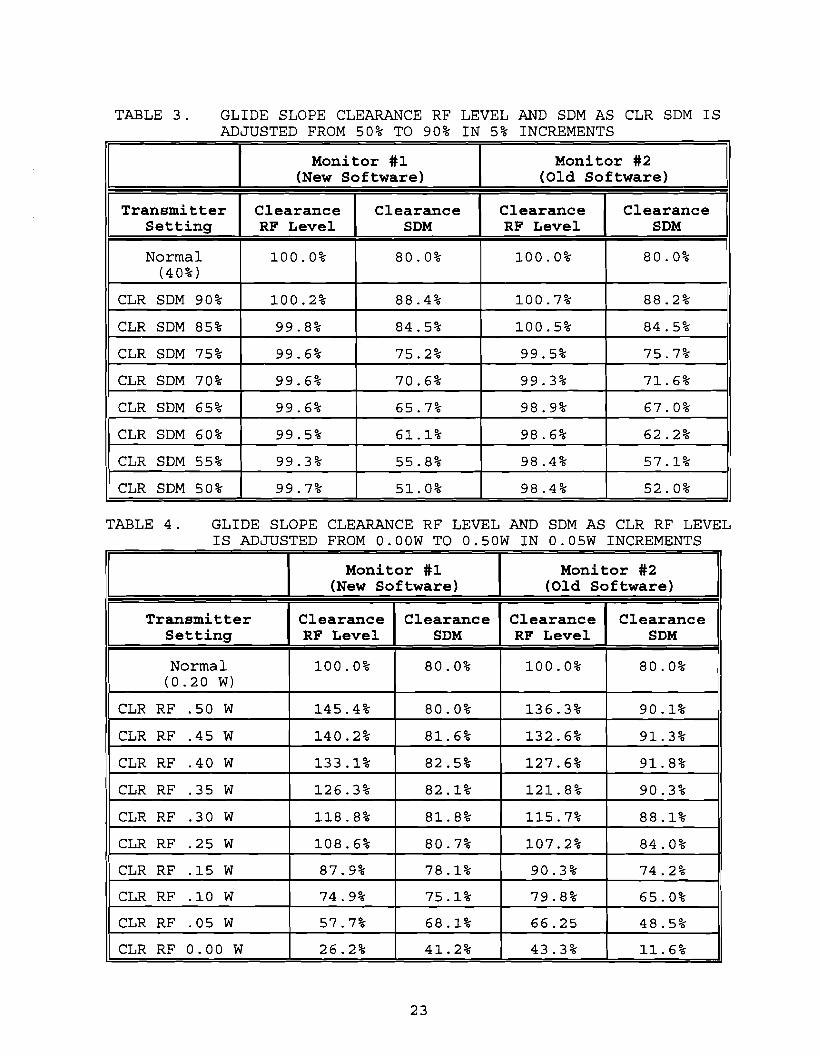
TABLE 5 FAULT DIAGNOSTIC RESULTS (Continued)
Marker beacon ModPA
Marker beacon ModPA
Adjusted R55 counter clock wise until the voltage at R53 was at a minimum
Adjusted R37 clock wise until the voltage at pin 6 of J2 was at a minimum then replaced the jumper
ModPA
ModPA
Marker Beacon ACDC Converter
Adjusted Vadj until the on batteries LED illuminated on front panel
was the
ACDC converter
Marker Beacon DCDC converter
Changed the alarm limits for the +5V supply to put the monitor into alarm
DCDC converter
Antenna assembly Disconnected the antenna feed line at the antenna
Antenna assembly
54 REMOTE STATUS AND INTERLOCK UNIT
541 ILS Category of Operation Indication
During the test period the RSIU accurately displayed the category of operation over varying operational conditions The category downgrade timer was tested and found to be accurate
542 Far Field Monitor
Table 6 indicates the position of the B727 during testing Figures 10 and 11 contain DDM values measured by each FFM versus time FFM 1 is located at the inner marker and FFM 2 at the middle marker The data collected indicate that minimal interference was detected by the FFMs The large DDM spikes at 092145 and 095438 are when the B727 was at the stop end of runway 04 and turning to face the taxiway The spikes however were not of sufficient magnitude to put the FFM into alarm (The FFM alarm settings were set to plusmn 0009 DDM and the spikes were only -0004 and -0005 DDM for FFM 1 and 2 respectively) Airborne data collected indicates that no effect on provided guidance was caused by the presence of the B727 in positions 1 2 3 or 4 (figure 3)
26
TABLE 6 LOG OF THE POSITION OF THE B727 DURING FAR FIELD MONITOR TESTING
I Time I B727 Location I 091525 727 in position 1
019645 727 begins to taxi forward to put the nose wheel on centerline keeping the fuselage perpendicular to centerline
019647 727 nose wheel on centerline
092122 727 begins a the taxiway
180 degree pivot on centerline to return to
092145 727 completes the pivot and is on the taxiway
092742 727 in position 2
093053 727 begins to taxi forward to put the nose wheel on centerline keeping the fuselage perpendicular to the centerline
093114 727 nose wheel on centerline Another 727 type aircraft is taxiing on runway 04 between the FAA B727 and the runway 04 threshold
0931 43 The other aircraft turns off the runway to a perpendicular taxiway at the threshold of 04
093416 The B727 begins a 180 degree pivot return to the taxiway
on centerline to
093435 The B727 completes the pivot and is on the taxiway
093625 The B727 begins taxiing from position 2 on the taxiway
to position 3
093716 B727 in position 3
093943 B727 begins centerline centerline
to taxi forward to put the nose wheel keeping the fuselage perpendicular to
on the
094033 The B727 begins a 180 degree pivot return to the taxiway
on centerline to
094229 B727 in position 4
094845 A King Air type aircraft taxis runway 22 and takes off
to the threshold of
094952 A Bonanza type aircraft taxis 22 and takes off
to the threshold of runway
0951 46 B727 begins 04
to taxi to centerline at threshold of runway
095202 B727 begins to taxi from the threshold centerline of runway 04
to stop end on
095438 B727 ends taxi the stop end
on centerline and turns off runway 04 at
27
Far Field Mon~or 1 (Inner Marker) 210195
8727 Taxi test
0001 f------7-1h--f-----r1lr-nrr-l-------I--middot-middotJmiddotir-------t----t----j
~ Imiddotmiddot H~H middot~lIIJHmiddot8 01))) f---~ff---J-r-fyf-U~ffe
-0001 r---~f-----1f-----H-j-t -- tt-----J--1
-0004 f------f--7--I------f----i----~-1f------I----- shybullbull----------+------1
- middot-imiddot-middot ltj
-0005 ---iiLUiiLUii---wlW---lW---LLL---LLL---LIJ
90 91 92 93 94 95 96 97 98 99 100
Time (hours)
FIGURE 10 FAR FIELD MONITOR 1 READINGS WITH A B727 IN THE LOCALIZER ENVIRONMENT
Far Field Monitor tf2 (Middle Marker) 2110195
8727 Taxi test 0005 C-Cfmiddot gtltmiddot1middotmiddotmiddotmiddot gtmiddotmiddotmiddot-middotImiddotlt-middotmiddotmiddotjmiddotmiddot-middotmiddotmiddot middotmiddot1middot gt
-middotmiddot-imiddotmiddot j 0004 1-----11---1-----1----i---i-------+------+------+---i
j -
middotmiddotmiddotmiddot1middotmiddot o(m r--1--t-+~i---~~+ -f-f--4
- imiddot imiddot j i- imiddot j bull bull bullbull imiddot i j bullbull jmiddoti
-0005 Liii--JLiii--JLiiiiJLiiiiJiJ-------l---l
90 91 92 93 94 95 96 97 98 99 100
Time (hours)
FIGURE 11 FAR FIELD MONITOR 2 READINGS WITH A B727 IN THE LOCALIZER ENVIRONMENT
28
55 STANDBY POWER
All subsystems (localizer glide slope inner marker middle marker outer marker and RCSU) exceeded the specified time operation requirement for operation on standby power No anomalous monitor readings were observed during standby power operation Table 7 shows the amount of time each subsystem operated on standby power and its respective requirement
The localizer glide slope and RCSU subsystems recharged their respective batteries without incident The marker beacons however could not recharge their batteries to full charge without shutting down This is due to the high current draw required to recharge the batteries which in turn overheated the power supplies and caused them to turn off The failed power supply was returned to Wilcox for analysis
TABLE 7 MARK 20 SUBSYSTEM STANDBY POWER TEST RESULTS AND REQUIREMENTS
Mark 20 Subsystem Time operated on standby power
(hours)
Standby Power Requirement (hours)
4
4
72
72
72
1
Localizer 11
Glide Slope 165
Inner Marker 172
Middle Marker 168
Outer Marker 162
RCSU 25
6 CONCLUSIONS
All testing conducted on the Mark 20 Instrument Landing System (ILS) concluded in satisfactory performance of the system Although the initial draft instruction books provided by the contractor were incomplete subsequent revisions to the manuals resulted in an acceptable product The alignment process outlined in the manuals verified that the system was ready for the FAA flight inspection
The Mark 20 ILS successfully met required Category IIIII criteria during the flight inspection conducted by the Oklahoma City Flight Information Field Office (FIFO) Additional flight evaluations were conducted by the FAA Technical Center test team utilizing FAA Technical Center aircraft flight measurement equipment and radarlaser tracking systems All FAA Technical Center evaluations were within Category IIIII tolerances
29
System reliability and maintainability were verified in that the few subsystem outages that occurred were easily identified and corrected The Mark 20 remained operational throughout the entire test period except for interruptions to conduct required testing The system is extremely stable Weather conditions were recorded and analysis indicated that weather had little or no affect on operation of the system
The Remote Status and Interlock Unit (RSIU) was monitored during various test scenarios and accurately displayed the correct category of operation (This is the monitordisplay unit that is placed in an Air Traffic Control [ATC] facility)
All subsystems (localizer glide slope inner marker middle marker outer marker and Remote Control and Status Unit [RCSU]) exceeded the specified time requirement for operation on standby battery power
During the test period there were no indications that the integration of the Remote Maintenance Monitoring (RMM) System into the ILS affected the operational effectiveness of the Mark 20
7 RECOMMENDATIONS
Based on the results documented in this report the Mark 20 is recommended for deploYment in the National Airspace System (NAS) It is further recommended that a correction to the outer marker battery charging problem as stated in TTR 09 be resolved
30
8 ACRONYMS
AC ACY AFIS APMT ATC ATCT B727 CAT CLR CSB DDM DME DMEP DUCU FAA FFM FIFO ILS LCU LED LRU MHz MLS MPS MSL ModPA NAS nmi OTampE PIR PMDT RCSU RF RICE RMM RMS RSIU SBO SDM TMB TTR UHF VHF VSWR
Alternating Current Atlantic City International Airport NJ Automatic Flight Inspection System Associate Program Manager for Test Air Traffic Control Airport Traffic Control Tower Boeing 727 Category Clearance Carrier and Sidebands Difference in Depth of Modulation Distance Measuring Equipment Precision Distance Measuring Equipment Distribution Unit and Combining Unit Federal Aviation Administration Far Field Monitor Flight Inspection Field Office Instrument Landing System Link Control Unit Light Emitting Diode Line Replaceable Unit Megahertz Microwave Landing System Maintenance Processing System Mean Sea Level Modulator and Power Amplifier National Airspace System nautical miles Operational Test and Evaluation Portable Instrument Landing System Receiver Portable Maintenance Data Terminal Remote Control and Status Unit Radio Frequency Remote Indication and Control Equipment Remote Maintenance and Monitoring Remote Monitoring System Remote Status and Interlock Unit Sidebands Only Sum of the Depth of Modulation TamiamiKendall Executive Airport FL Test Trouble Report Ultra High Frequency Very High Frequency Voltage Standing Wave Ratio
31
APPENDIX A Oklahoma City Flight Inspection Field Office
Flight Inspection Report
n PAGE 1 ef 5 I REVIEW INITIALS FLIGHT INSPECTION REPORTmiddot-INSTRUMENT LANDING SYSTEM
2 IDENT XJF1 LOCATlON ATLANnC CITY NJ
4 DATE DATES OF 5 OWNER F 3 COMMON SYSTEM shy 712-13194INSPECTlON
SITE EVALUATION XPERIODIC SPECIAL MR 6 TYPE OF INSPECTlON
COMMISSIONING INCOMPLETESURVEILLANCE X LOCALIZER I ISDF GLIDE SLOPE 75 MHz MARKERSX X7 RUNWAY IB FACILITY
NO 04 INSPECTED COMPASS LOCATORS LOA I IDME LlGHTlNG SYSTEM
9 LOCALIZER FRONT COURSE BACK COURSE
TX 1 COMO WIDTH 560
TX 2 TX 2TX 1 CATEGORY II INITIAL FINALOT INITIAL INITIAL FINAL OTFINAL OT INITIAL FINAL OT
563 561 COURSE WIDTH
390 386 MODULATION
2361324 260iS8 CLEARANCE 1 5 0
2341323 270iS8 CLEARANCE 90
1458 21n COURSE STRUCTtJREmiddotZ 1
1064 0058 COURSE STRUClUREmiddotZ 2
11003 1015 COURSE STRUCTtJREmiddotZ 3
COURSE STRUCTtJREmiddotZ 4
COURSE STRUCTtJREmiddotZ 5
085 VERTlCAL POLARIZATION
530 499 SYMME1RY
3R 1L ALIGNMENT
VOICE
S S IDENTIFICATlON 18 USABLE DISTANCE
DATE MONITORDATE DATEDATE 490 493 COURSE WIDTH (NMrow)
648 651 COURSE WIDTH ~)
237132 26565 CLEARANCE 150
22658 231158 CLEARANCE 90 9 ALIGNMENT 150
9 ALIGNMENT 90-11 GENERAL
1)( 1 10 GLIDE SLOPE
1)(2 UNSAT
OT
COMD ANGLE 300 SAT
CATEGORY II 75 MHz MARKERS INITIAL ANAL OT INITIAL XANAL 301 ANGLE COMPASS LOCATORS
790 DMEMODULATION 067 W1DlH UGHTlNG SYSTEMS
CLEARANCE BELOW PAlH 12 FACIUTY STAlUS
210 STRUCTtJRE BELOW PATH FC GIS BIC 41634 PAlH SlRUClUREmiddotZ 1 UNRESTRICTED
sn68 RESTRICTED
4016
PATH STRUClUREmiddotZ2
PAlH STRUClUREmiddotZ 3 UNUSABLE X X 10 USABLE DISTANCE NOTAMs
SYMMETRY
DATE MONITORDATE
13 REMARKS SPECIAL INSPECTION THIS WAS A SPECIAL INSPECTION (MAiNT REQUESl) FOR EVALUATION OF A UK 20 ILS SYSTEM AS INSTALLED AT A TEST SITE LOCATION COMMISSIONING FLIGHT INSPECTION CRmRIA AND TOLERANCES SPECIFIC TO ILS CATAGORY II OPERATION WAS APPLIED FOR THIS INSPECTION
GLIDE SLOPE TRANSMITTER NO 2 NOT CHECKED INSPECTION TERMINATED WITH MAINT CONCRRENCE DUE TO AIRCRAFT AVAILABILITY AND HIGHER PRIORITY MISSION REQUIREMENTS
(SEE CONTINUAnON SHEET FAA FORM 8240middot15 ATTACHED) A S~TU~ AIRCRAFT NOIREGION AEA F~IGNA~R [ -y J tr-~FIFO ACY N-4S9V-
FAA FORM 8240middot7 (590)
A-I
475
n FLIGHT INSPECTION REPORT--INSTRUMENT LANDING SYSTEM
SUPPLEMENTAL SHEET
1 LOCATION ATLANTIC CITY NJ shy
ltih DATE DATES OF INSPECTION 712-1394 middotmiddotmiddotraquol
4 GLIDE SLOPE
PATH ANGLE 4a GLIDE SLOPE lYPE CAP EFFECT
TXl TX2
ADVANCE TX 1 TX2
15 305
4b DEPHASE
RETARD TX 1 TX2
15 308
4c PATH ANGLE LOWERED TO UMIT
4d PATH ANGLE RAISED TO UMIT
4e PATH WIDTH NARROWED TO UMIT 304
4f PATH WIDTH WIDENED TO UMIT
4g CLEARANCE TX MODULATION DECREASED 300TO UMITmiddot (PRIMARY TX WIDE UMln
4h ATTENUATE MIDDLE TXl TX2 ANTENNA TO UMIT 04OB
302
4i ATTENUATE UPPER TXl TX2 ANTENNA TO UMIT 297
1ODB
I CAS SECTOR FAFALT
4j TRANSVERSE STRUCTURE I EDGE SECTOR FAFALT
4k MODULATION BALANCE TX1
41 PHASING TXl
4m FRONT COURSE AREA WHERE PHASING WAS CONDUClED
4n CLEARANCE BELOW PATH TXl S
5 REMARKS CORRECTION FACTOR OF + 003 APPLIED TO REPORlED LEVEL RUN ANGLE DATA
FAA FORM 8240 - 16 (590) A-2
PATH WIDTH
TX 1
075
076
056
075
075
071
TX2
shyPAGE 2 of 5 REVIEW INITIALS
2 IDENT XJF
STRUCTURE BELOW PATH
TX 1 TX2
22i
117
22i
22i
193
212
070 BElOW PATH
070 BElOW PATH
TX2
TX2
NM MSL
lX2
PAGE 3 OF 5 PAGES
1 REVIEW INITIALS FLIGHT INSPECTION REPORT-CONTINUATION SHEET
1 LOCATION ATLANTIC CITY NJ 12 IDENT XHF
3 FACILl1Y 1YPE ILS 14 DATEDATES OF INSPECllON 712-1394
1 USEABLE DISTANCE CHECKS PERFORMED ON LOCALIZER TRANSMITTER NO 2 AND GLIDE SLOPE TRANSMITTER NO 1 ONLY
2 LOCALIZER ALIGNMENT MONITORS CHECKED ON GROUND (AWY 04) ON TRANSMITTER NO 2 ONLY
3 MARKER WIDTH MM 1137 AND 1M 626
4 ILS (XJF) FACILITY DATA WAS MANUALLY ENTERED INTO THE AAS DATA BASE WIlli CHANE OF DISTANCE TO THE OUTTER MARKER TO 31595 (52 NM) TO FACILITATE MANUAL POSITION UPDATING FOR LEVEL RUN ANGLE RESULTS (ILS 2)
S GLIDE SLOPE MEAN SYMMETRY WAS CHECKED AT487 90HZ ON PATH ANGLE 301middot BELOW PATH ANGLE 264 - ABOVE PATH ANGLE UOmiddot MEAN WIDTH 076 DEGREES
6 ANTENNA TILT CHECK ANGLE S8P WIDTH SYMMETRY
90HZ 299 210 069 478 150HZ 293 209 065 514
FAA FORM 8240 - 15 (590) A-3
0 FLIGHT INSPECTION REPORT-LOCALIZER CLEARANCE PLOT
1 lOCATION
3 DATEIDATES OF INSPECTION 712-1394
6 iX 7 CFG 8 AlT 9 RADIUS
N -
10NM1 17
12 400
90 Hz
300
fI)
~ 200 w 0shyE lt0100 II 0 ~
0 got 70 SO 40 30 20 10 0
6 iX 7 CFG 8 AlT 9 RADIUS 1 B 17 10NM
12 400
90Hz
300
()
~ 200 w 0shyE lt o 100a 0 ~
0
90 70 SO 40 30 20 10 0
6 lX 7 CFG 8 ALT 9 RADIUS 1 C 17 10HM
12 400
90Hz
300
fI)
~200 w 0shyE 0lt
0100a 0 ~
0
90 70 SO 40 30 20 10 0
13 REMARKS TEST SITE HAD NO BACK COURSE FOR EVAlUATION
REGION AEA FLIGHT INSPECTORS SIGNATURE TE~~ AFOACY NlA
4 ANT TYPE
10 WIDTH FC 563
10 20
10 WIDTH FC 648
lot 20
10 WIDTH FC 490
1(l11P 20
----r 1lt-
ATlANTIC CITY NJ
11 WIDTH Be NlA
middotV
FAA FORM 8240 - 18 (590) A-4
~l~ L _- _ Y shy
PAGE 4 of 5 0
2 IDENT XJF
5 SITE ElEV 870
CODE FC -- shyBC ____
150 Hz
30 40 SO 70 90V
11 WIDTH BC
NA
150Hz
30 40 SO
11 WIDTH BC
NlA
30V 40 SO
CODE
70
CODE
150Hz
70
FC BC __
90V
bullbull
FC-shyBe_ bullbull
90
AIRCRAFT NO
N~t
0 PAGE ) of 5 I FLIGHT INSPECTION REPORT-LOCALIZER CLEARANCE PLOT
DATEIDATES OF INSPECTlON
90 Hz 150Hz
9()9
9()9
9()9
13 REMARKS TEST SITE HAD NO BACK COURSE FOR EVALUATION
1 LOCATlON
3
6 lX 2
12 400
300
(I)
~200 w a laquo o 100 cr u E
0
6 lX 2
12 400
300
(I)
~ 200 w a laquo o 100 cr u E
0
6 TX 2
12 400
300
(I)
~ 200 w a laquo 0100 cr U E
0
REGION ApoundA
AFO ACY
90 Hz 150 Hz
712-1394 14 ANT lYPE shy
7 CFG 9 RADIUS [10 WIDTH FC N 17
18 ALT
10NM 51
ATlANTIC CITY NJ
11 WIDTH BC
NlA
709 509 409 3()0 209 109 0 10 209 30 40 SOO
7 CFG 18 ALT 19 RADIUS 110 WIDTH FC B 17 10NM ~I
70 sao 40 30 209 10 0 1(Jl1 20
7 CFG 18 ALT 19 RADIUS 110 WIDTH FC C 17 10NM 11j
90Hz
709 SOO 400 300 20 10 0 10 20 3Ii 40 SOV
FLIGHT INSPECTORS SIGNATURE
NA
11 WIDTH BC
NlA
30 40 SOV
11 WlDlH BC
NlA
_ l I
TECHNICIAMS Irn~ ~~E -
2 IDENT XJF
5 SITE ELEV 870
CODE FC BC bull __ bull
709 909
ICODE FC BC bull __ bull
70 90
I FCCODE BC ____
150Hz
-7rJI 90
AIRCRAFT NO
N~g
FAA FORM 8240middot 18 (590) A-5
ILS WORKSHEET
1 IDENT XJF 12 DATE 712-13194 3 TYPE CHECK SPECIAL SITE
4 CREW DRAPERICOLESIKENNEDY 5 AIRCRAFT NO N~9114 -
6 NOTES OPERATIONAL TEST AND EVALUATION OF THEMK 20 ILS INSTALLATION AT AlLANTIC CITY NJ (KACY) RWY 04_
UMITED COMMISSIONING PROFILE FLOWN AT MAINTENANCE REQUEST
RINY 04
FREQ 10U5
LOCTYPE DUAL
CWo 160
ANGLE 300
GNDTEMP 83
CAT 2 OAT 22
GS TYPE CAP EFF BARO 3002
ALTITUDE
7 RUN
1
cm
1N
PAorALN
3 1N
4 1S
5 1S
6 1S
7 18
8 18
t 18
10 1N
11 25
12 2S
13 28
14 2N
1
1
2N
2N
17
18
18
20
2N
2N
1N
1N
456
298
21 1NL
1NG
1L
298
190 JLA
2M
191
PWorCW
571
U9
00000
490
558
669
148
563 -
483
559
651
1161
1167
573
NIA
163
092
90Hz SYM
498
496
499
499
NlA
494
530
491
501
419
4
494
100
NlA
498
FLAG or MOD
38
386
390
790
REMARKS 1OTHER DATA
INITlAL NORMAL CLEARANCES SATlSFACTORY 35 middot35
ADJUSTED NORMAL CLEARANCES SATISFACTORY
NO ANNOUNCED COURSE WIDTHmiddot SYSlEM FAULT
COURSE NARROW~LEARANCEWIDE
COURSENORMAL~LEARANCENARROW
COURSE WIDE CLEARANCE NORMAL OTWIDE
SYSTEM FAULT
COURSE WIDE CLEARANCE NORMAL
NORMALCONAGURATION
COURSENARROW~LEARANCEWIDE
COURSENORMAL~LEARANCENARROW
COURSE WIDE CLEARANCE NORMAL
NORMALCONAGURATION
RF ALARM 18NM AT LCA USEABLE DISTANCE CHECK 1010
RF ALARM 18NM AT 4500 FT 10middot10
APCH RF ALARM 18NMTO TlfRESHOLD bull SAT
10NM ARC RF ALARM CLEARANCES SAT
SYSTEM FAULT 8AD UPDAlE DATA - RECHECK
CHANGE DATA FOR A Ii2 NM MANUAL UPDATE
ILS 3 LOCAUZER Z1zn7 Z2a OIO58 23-110115
ILS 3 GIS Z1=416366 Z2=31O58 13=71017
FAA FORM 8240middot21 (590) A-6
ILS WORKSHEET
1 IDENT XJF 2 DATE712middot13J94
4 CREW DRAPERICOLESIKENNEDY
6 NOTES OPERATIONAL TEST AND EVALUAll0N OF THE P1K 20 ILS INSTALLAll0N AT ATLAN11C CITY NJ (KACY) RWY04
UMiTED COMMISSIONING PROFILE FLOWN AT MAINTENANCE REQUEST
3 TYPE CHECK SPECIAL SITE
5 AIRCRAFT NO N-89184
RWf 04 CW 560
FREQ 109amp5 ANGLE 300
LOCTYPE DUAL GNDTEMP 83
OAT 22
GSTYPE CAPEFF
CAT 2
BARO 3002
ALTITUDE
7 RUN
22
CFQ
iN
iN
iN
PAorALN
1L
9UA
9UA
19O~ PWorCW 90Hz SYM
FLAG or MOD
REMARKS OTHER DATA
~UGNMENTMONITORS NORMAL
ALIGNMENT MONITORS 160 HZ
AUGNMENT MONITORS 90 HZ
1-18
1
2
3
4
I
bull 7
bull bull 10
11
12
13
14
16
1
TX1
iN
iN
iN
is
1B
1M
1A
1R
1U
1U
iN
iN
iN
RF
RF
RF
297
304
301
297
299
302
301
2A3
294
301
293
299
207
229
113
229
117
212
210
209
210
067
648
066
076
075
076
G76
071
067
066
069
476
494
513
493
461
493
431
140
521
471
514
478
796
788
789
BEGIN GUDE SLOPE 71394
SYSTEM FAULTmiddot NO UPDATEmiddot SEE 2
INITIAL NORMAlmiddot REFERENCE
GIS STRUCTURE Z1- 41712 22= 9060 Z3= 41016
NARROW ALARM
COURSE WIDE ClEARANCE MOD ALARM
MIDDLE ANTENNA ATTENUATED TO ALARMmiddot GADB
DDLE ANTENNA ADVANCE PHASE 16 DEGREES
DDLE ANTENNA RETARD PHASE 15 DEGREES
SYSTEM FAULTmiddot NO DATA
UPPER ANTENNA ATTENUATED 1DB
NORMALmiddot LEVEL RUN
TUT CHECK middot150 HZ SIDE (lOCAUZER EXlRErtT1ES)
1LT CHECKmiddot 90 HZ SIDE (lOCAUZER EXTRErt11ES)
USEABLE DISTANCE FROM 10 NM bull 150HZ SIDE (8 DEGREES)
USEABLE DISTANCE FROM 10 NM bull 90HZ SIDE (8 DEGREES)
USEABlE DISTANCE FROM 10 NM bull ON COURSE
FAA FORM 8240 - 21 (590)
A-7
ILS WORKSHEET
1 IDENT XJF 12 DATE 7112middot13194 3 TYPE CHECK SPECIAL SITE
4 CREW DRAPERICOLESIKENNEDY - 5 AIRCRAFT NO N~184
6 NOTES OPERATIONAL TEST AND EVALUA1l0N Of lliEMK 20 ILS RWY 04 CW amp60 INSTALLATION AT ATLANTIC CITY NJ (KACY) RWYMmiddot
FREQ 10966 ANGLE 300
UMiTED COMMISSIONING PROFILE FLOWN AT MAINTENANCE REQUEST LOCTYPE DUAL GNDTEMP 83
CAT 2 OAT 22
GS TYPE CAP EFF BARD 3002
ALTITUDE
7 RUN CFG PAorALN 190 JampA PWorCW 90Hz SYM
FLAG or MOD
REMARKS I OTHER DATA
11 1N 301 MEAN WlDlliSYMMETRY ON PATH
18 1N 264 487 MEAN WlDlliSYMMETRY BELOW PATH (90HZ)
18 1N 340 MEAN WIDTHSYMMETRY ABOVE PATH (160HZ)
A 8
1 INSTRUMENT LANDING SYSTEM a State New Jersey b City Atlantic City c Airport Atlantic city International Airport d Category of Operation Category III e Associated runway~ Runway 04 f Approach bearing 02800 deg true h Engineering drawing na i Localizer
1 Latitude and longitude of antenna 39 deg 28 0103 N I 074 deg 34 2522 W
2 Antenna Type 14 element LPD 3 Distance from stop end of runway to antenna 1005 4 Distance from approach end of runway to antenna
7149 5 Distance and direction from runway centerline on cl 6 Ground elevation at center of antenna array 664msl 7 Identifier I-XJF 8 Frequency 10955 mhz 9 Voice availability na
10 Course width 56 deg 11 Course width over threshold 700 ft 12 Back course status Not available 13 Restrictions None 14 Remote monitor Far field monitor 15 Commissioning date na
j Glide Slope 1 Latitude and longitude of antenna
39 deg 27 0813 N I 74 deg 35 0727 W 2 Ground elevation of antenna mast 6584 msl 3 Elevation of runway centerline abeam glide slope
antenna 670 msl 4 Frequency 33245 mhz 5 Type of facility Capture effect antenna system 6 Distance of antenna from approach end of runway875 7 Distance and direction from runway cl 400 left 8 Glide angle 300 deg 9 Restrictions na
10 Remote monitor na 11 Commissioning date na
k outer Marker 1 Latitude and longitude of antenna
39 deg 29 5362 N I 074 deg 40 2048 W 2 Ground elevation of antenna 48 msl 3 Distance from runway threshold 4804 4 Distance from runway centerline extended on cl 5 Locator classification OM 6 Remote monitor na 7 Commissioning date na
A-9
APPENDIXB Test Trouble Reports
TTR__-=-O=l _ CAT IIIII ILSRMS TEST TROUBLE REPORT FORM
TESTER Ben BennettPaul Evermon LOCATION _~A=CY _
TEST SCENARIO Installation DATE June 94
TTR CLASSIFICATION CRITICAL SIGNIFICANT MINOR x
DESCRIPTION OF PROBLEM OR FAILURE During installation a problem was detected with one of the FFMs The signal from this monitor had considerable 60 Hz interference The monitor was returned to the factory for repair The 60 Hz interference could not be repeated at the factory and the unit appeared to be working fine under lab conditions When the FFM was returned to ACY the problem surfaced again In the field it was discovered that when an audio transformer was placed in the line from the FFM to the localizer the FFM worked fine From this it is assumed that the FFM has a bad transformer
RECOMMENDED SOLUTION Wilcox should develop a production test procedure for the FFM to test the audio transformer in the future
RESOLUTION Wilcox has added a procedure to test the audio transformer in their production acceptance tests
IMPROVEMENT RECOMMENDATION MODIFICATION TO HARDWARE MODIFICATION TO SOFTWARE CHANGE IN TEST PROCEDURE CHANGE IN OPERATIONS
B-1
TTR__~O==2 _ CAT IIIII ILSjRMS TEST TROUBLE REPORT FORM
TESTER Ben Bennett LOCATION _=A=C-Y _
TEST SCENARIO _~A~l=ig~n~m~en~t_ _ DATE June 1994
TTR CLASSIFICATION CRITICAL x SIGNIFICANT MINOR
DESCRIPTION OF PROBLEM OR FAILURE After calibrating the glide slope detectors the clearance RF level reads 113 and the clearance SDM reads 75 This is due to path SBO signals not being canceled out before the detection process
RECOMMENDED SOLUTION Wilcox must isolate the path SBO signal from the clearance signal before detection This can be accomplished by either hardware or software changes
RESOLUTION Wilcox addressed this issue with a new monitor software release This software release was tested at ACY and TMB and found to be an acceptable solution to the problem See paragraph 533
IMPROVEMENT RECOMMENDATION MODIFICATION TO HARDWARE or MODIFICATION TO SOFTWARE
CHANGE IN TEST PROCEDURE CHANGE IN OPERATIONS
B-2
TTR__O=3 _ CAT IIIII ILSRMS TEST TROUBLE REPORT FORM
TESTER Ben Bennett LOCATION _A=CY _
TEST SCENARIO Installation DATE June 1994
TTR CLASSIFICATION CRITICAL SIGNIFICANT MINOR x
DESCRIPTION OF PROBLEM OR FAILURE The ON BATTERY and LOW BATTERY LEDs do not illuminate when the TEST button is pressed on the RCSU
RECOMMENDED SOLUTION
RESOLUTION It will be documented in the RCSU user manual that the LEDs will not light
IMPROVEMENT RECOMMENDATION -Kshy MODIFICATION TO HARDWARE or -Kshy MODIFICATION TO SOFTWARE
CHANGE IN TEST PROCEDURE CHANGE IN OPERATIONS
B-3
TTR__=O-=4 _ CAT IIIII ILSRMS TEST TROUBLE REPORT FORM
TESTER Ben BennettByron Robins LOCATION _~A~C~Y _
TEST SCENARIO Normal Operation DATE June 94
TTR CLASSIFICATION CRITICAL SIGNIFICANT x MINOR
DESCRIPTION OF PROBLEM OR FAILURE The glide slope and localizer integrity check will fail if the standby monitor alarm delay time is set too low
RECOMMENDED SOLUTION Software change to not allow a standby monitor alarm delay time too low for the integrity check to pass
RESOLUTION The PMDT software was changed to not allow the user to set the standby monitor alarm time too low
IMPROVEMENT RECOMMENDATION MODIFICATION TO HARDWARE -K- MODIFICATION TO SOFTWARE
CHANGE IN TEST PROCEDURE CHANGE IN OPERATIONS
B-4
TTR__--O=S _ CAT IIIII ILSRMS TEST TROUBLE REPORT FORM
TESTER Ben Bennett LOcATION----A~CY _
TEST SCENARIO Integration testing DATE July 1994
TTR CLASSIFICATION CRITICAL SIGNIFICANT x MINOR
DESCRIPTION OF PROBLEM OR FAILURE The localizer and glide slope manual fault diagnostics will not run after a fault has been introduced that causes both transmitters to shut down
RECOMMENDED SOLUTION Correct in software
RESOLUTION Software revisions by Wilcox corrected this problem
IMPROVEMENT RECOMMENDATION MODIFICATION TO HARDWARE -K- MODIFICATION TO SOFTWARE
CHANGE IN TEST PROCEDURE CHANGE IN OPERATIONS
B-S
TTR__--O--6 _ CAT IIIII ILSRMS TEST TROUBLE REPORT FORM
TESTER Ben Bennett LOCATION _=A=C-=Y _
TEST SCENARIO Integration testing DATE July 1994
TTR CLASSIFICATION CRITICAL SIGNIFICANT x MINOR
DESCRIPTION OF PROBLEM OR FAILURE Auto fault diagnostics for the localizer glide slope and the marker beacons do not accurately identify the faulted LRU
RECOMMENDED SOLUTION Correct in software
RESOLUTION Automatic diagnostics is not as accurate as manual because in order to accurately diagnose the subsystem faulty signals must be radiated This can only be done manually
IMPROVEMENT RECOMMENDATION MODIFICATION TO HARDWARE -X- MODIFICATION TO SOFTWARE
CHANGE IN TEST PROCEDURE CHANGE IN OPERATIONS
B-6
TTR__O~7 _ CAT IIIII ILSRMS TEST TROUBLE REPORT FORM
TESTER Ben BennettByron Robins LOCATION _A=C--Y _
TEST SCENARIO Normal Operations DATE 8894
TTR CLASSIFICATION CRITICAL SIGNIFICANT x MINOR
DESCRIPTION OF PROBLEM OR FAILURE Localizer shut down The executive monitor course DDM went out of tolerance causing both transmitters to shut down indicating a possible problem in the DUCU or antenna subsystems
RECOMMENDED SOLUTION
RESOLUTION It has not been determined what caused this outage
IMPROVEMENT RECOMMENDATION MODIFICATION TO HARDWARE MODIFICATION TO SOFTWARE CHANGE IN TEST PROCEDURE CHANGE IN OPERATIONS
B-7
TTR__~O~8 _ CAT IIIII ILSRMS TEST TROUBLE REPORT FORM
TESTER Ben BennettByron Robins LOCATION _~A~CY _
TEST SCENARIO Standby power test DATE 82994
TTR CLASSIFICATION CRITICAL SIGNIFICANT x MINOR
DESCRIPTION OF PROBLEM OR FAILURE The marker beacon front panel displays on batteries and maintenance alert after the batteries have been discharged and AC power restored to the system
RECOMMENDED SOLUTION The project office will have this problem corrected by Wilcox through ECP16
IMPROVEMENT RECOMMENDATION MODIFICATION TO HARDWARE or MODIFICATION TO SOFTWARE
CHANGE IN TEST PROCEDURE CHANGE IN OPERATIONS
B-8
TTR__-=0=9 _ CAT IIIII ILSRMS TEST TROUBLE REPORT FORM
TESTER Ben BennettByron Robins LOCATION _~A~C-=-Y _
TEST SCENARIO Standby power test DATE 83094
TTR CLASSIFICATION CRITICAL SIGNIFICANT x MINOR
DESCRIPTION OF PROBLEM OR FAILURE After the batteries were discharged AC power was restored with only one of two sets of batteries on line to reduce charge current As a result of this condition the outer marker ACDC power supply shut itself down due to too much power being supplied The ACDC converter is not powerful enough to charge even one set of batteries after they have been discharged
RECOMMENDED SOLUTION Raise the battery cut off voltage so that the marker beacons shut down at a state of discharge that the ACDC converter can recharge the batteries without damage At the current cut off voltage the marker beacons remained on the air for well over 176 hours The requirement is only 72 hours
IMPROVEMENT RECOMMENDATION MODIFICATION TO HARDWARE MODIFICATION TO SOFTWARE CHANGE IN TEST PROCEDURE CHANGE IN OPERATIONS
B-9
TTR__lO _ CAT IIIII ILSRMS TEST TROUBLE REPORT FORM
TESTER Ben BennettByron Robins LOCATION _A=C-=Y _
TEST SCENARIO Normal Operations DATE 9694
TTR CLASSIFICATION CRITICAL SIGNIFICANT x MINOR
DESCRIPTION OF PROBLEM OR FAILURE This is a repeat of the TTR 07 he executive monitor course ddm started to fluctuate around 810 pm on ~ September It went into alarm several times but went back to normal before the 2 second alarm delay time had expired The executive monitor remained stable until approximately 820 am 6 September The course ddm and course width ddm went into alarm but went back to normal before the alarm delay timer expired again At 908 am the course path and width ddm began to oscillate between alarm and normal This continued until 930 am when the course ddm remained in alarm condition until the delay timer expired causing both transmitters to shut down No abnormal weather conditions were present at the time of shutdown
RECOMMENDED SOLUTION
RESOLUTION The cause of this outage has not been determined
IMPROVEMENT RECOMMENDATION MODIFICATION TO HARDWARE MODIFICATION TO SOFTWARE CHANGE IN TEST PROCEDURE CHANGE IN OPERATIONS
B-10
TTR__=l=l _ CAT IIIII ILSRMS TEST TROUBLE REPORT FORM
TESTER Ben BennettByron Robbins LOCATION _poundlA=CY _
TEST SCENARIO Normal Operations DATE 112194
TTR CLASSIFICATION CRITICAL SIGNIFICANT x MINOR
DESCRIPTION OF PROBLEM OR FAILURE The inner marker AC to DC converter failed The power was turned off for approximately 5 hours and then turned back on with no effect The AC to DC converter from the middle marker worked in the inner marker The converter was returned to Wilcox who will send it to Lambda for analysis
RECOMMENDED SOLUTION
RESOLUTION The ACDC converter was returned to Wilcox for analysis
IMPROVEMENT RECOMMENDATION MODIFICATION TO HARDWARE MODIFICATION TO SOFTWARE CHANGE IN TEST PROCEDURE CHANGE IN OPERATIONS
B-ll
TTR__1=2 _ CAT IIIII ILSRMS TEST TROUBLE REPORT FORM
TESTER Ben BennettByron Robbins LOCATION _~AC=Y _
TEST SCENARIO Normal Operations DATE 112194
TTR CLASSIFICATION CRITICAL SIGNIFICANT x MINOR
DESCRIPTION OF PROBLEM OR FAILURE Unknown failure of the RMM board on the glide slope RMM boards were swapped from the localizer to the glide slope and the communication errors followed the RMM board to the localizer A new spare RMM board was installed which corrected the errors
RECOMMENDED SOLUTION
RESOLUTION Normal corrective maintenance
IMPROVEMENT RECOMMENDATION MODIFICATION TO HARDWARE MODIFICATION TO SOFTWARE CHANGE IN TEST PROCEDURE CHANGE IN OPERATIONS
B-12
TTR__=1=3 _ CAT IIIII ILSRMS TEST TROUBLE REPORT FORM
TESTER Ben Bennett LOCATION ACY Runway 04 Localizer
TEST SCENARIO Normal Operation DATE 020395
TTR CLASSIFICATION CRITICAL SIGNIFICANT MINOR x
DESCRIPTION OF PROBLEM OR FAILURE With transmitter 2 selected as main the localizer would switch to transmitter 1 and remain on the air The switch over would occur within 24 hours of start up This anomaly only existed when transmitter 2 was selected as main
The conditions of the fault were clearance RF level dropping to 448 clearance width 1 dropping from 0293 ddm to 0000 ddm clearance width 2 dropping from 0226 ddm to 0000 ddm and the clearance SDM dropping from 407 to 00
When transmitter 2 was brought back on line the monitors would be within alarm tolerances This condition indicated an intermittent problem as well as prevented fault diagnostics from identifying the faulty LRU Trouble shooting revealed that the clearance CSB RF relay on the transfer assembly was intermittent and was replaced with a new relay from the spares kit
RECOMMENDED SOLUTION
RESOLUTION Normal corrective maintenance
IMPROVEMENT RECOMMENDATION MODIFICATION TO HARDWARE MODIFICATION TO SOFTWARE CHANGE IN TEST PROCEDURE CHANGE IN OPERATIONS
B-13
APPENDIXC Stability Data
Temperature
~ i ~ ~ i bull i
Day of Month of January 1995
FIGURE C-l MEASURED OUTSIDE TEMPERATURE FOR THE MONTH OF JANUARY 1995
Barometric Pressure
~ JIJO
~ 298
g 296
294
~
IJ4 f----+----+----+----+----+--__t_ middot1middotflAmiddotmiddotmiddotmiddotmiddotmiddotmiddotmiddotmiddotmiddot P
IJ2middotmiddotmiddotmiddotmiddotAmiddotmiddotmiddotmiddotmiddotmiddotlr-Nmiddotmiddott 1 middotmiddotmiddotfi
J t ~ ~ 1 1 ~
I -(
y
Day of Month of January 1995
FIGURE C-2 MEASURED BAROMETRIC PRESSURE FOR THE MONTH OF JANUARY 1995
C-1
Wind Speed
50
40
-I a 30 ~ - C 0) 0)
200 (I)
C t
~ 10
0
5 10 15 20 25 30
Day of Month of January 1995
FIGURE C-3 MEASURED WIND SPEED FOR THE MONTH OF JANUARY 1995
Rain Rate
~
middot middot middot
03 1-----7+--+-----+---------+-----------+------~-+-7 --~~-i
- J L
o 02 1-------+--+-----+---------+---~-+--------f-----+_I
CIl c
- ~VI CIl ~ g 01 H---~--~--~~-~H+_+_----+__1
~ - ~
5 10 15 20 25
Day of Month of January 1995
FIGURE C-4 MEASURED RAIN RATE FOR THE MONTH OF JANUARY 1995
C-2
Localizer Course DDM
0000 middot
OOCE
bullbullbullbullbullbullbull M bullbull ON OM H bullbullbullbullbullbullbullbullbullbull M M 0004
0002
~ 0000
o (JOO2 middot
~ ~ ~ ~
(J004
(Jom
(Jooo
bull ~ i shy i ~ bull - bull
i
5 10 15 20 25 3D
Day of Month of January 1995
FIGURE C-5 MONITORED
Localizer Course RF Level
middot 100 I----~ +-~ -----+--~~~~--~-t-~----~~----~+-
~
~
102 ~n y1J 100 ~~~V~r~j-IfVvYv I1J
~ ~ ~ 98
~ 96~------+----------+----------+-----------r----------~------H LL 0 9-4 r---r--~~r-----~--+--- -+--1 middot
bullbullbull M bullbull M bullbull M M bullbull M
~ bull i i imiddot imiddotmiddot i 00 ---~----~~JL~~ ~~L~~ ~~~
5 10 15 20 25
Day of Month of January 1995
FIGURE C-6 MONITORED LOCALIZER COURSE RF LEVEL FOR THE MONTH OF JANUARY 1995
C-3
localizer Course Width
0175 1-----+---+----1------1-----+-----+-1
~ 0 165 1------t-~~~+-~~-I-~--1I--~~-+-~~--+-I -middot o ~ ~
Cl 0160 ~ ~ Jilll~ bullbulliJ bull1 jj 1l1~~ _J
0155 ~ ~ ~ ~~~~I~~ ~~~~~_~~~_~ M ~lD 0 150
middot imiddot - i ~ - - ~ g 0145~ ~+---bull-+bull-i--~~---+--~-1 o
ON 0 N _ 0 bullbullbullbullbullbullbull 0 bullbullbullbullbullbullbullbullbullbullbullbullbullbull
middot ~ ~ ~ ~ ~ ~ ~ ~ ~ ~ ~ ~ 0131 L-i~----1lt------Li-~-----i--iiJL-i-------i--iLJ
5 10 15 20 25
Day of Month of January 1995
FIGURE C-7 MONITORED COURSE WIDTH FOR THE MONTH OF JANUARY 1995
localizer Course SDM
~ gt ~ -
middot ~ ~ ~ ~ ~ ~ ~ ~ ~
42 ~t~+--- ---+---+--~~ -+-1 middot - _~ - E
io 41 ~----+~~~+-------~-+-~~~~ -----~+- --c-----+-l
1 bullbull 1 bullbullbullbull bullbull bullbullbullbullbullbullbullbullbullbullbullbullbullbullbull bullbullbullbullbull 1 bullbull bullbullbullbullbullbullbullbullbullbull bullbullbullbull bullbullbullbull 1 bullbull 1 bullbullbullbull3 [~ o 40 ~ ~_ bull ~ bull ~ ~ ~ ~ ~ ~ - 39 ~----+~--------+-------~-+------------~-----+-- --------+-l E ~ bull Cl (I) 38 J---------+------------1---------+---------1---------1----------+-l
-- - - - -
~ ~~O-~~~~~ ---~---J ~J----~ L-J
5 10 15 20 25
Day of Month of January 1995
FIGURE C-8 MONITORED LOCALIZER COURSE SDM FOR THE MONTH OF JANUARY 1995
C-4
bullbull
Localizer Clearance RF Power Level
~ middot ~ IIll I-----~---------+-------+---+------t-I
_ - i c 104 I---------tr----~~I---~~+--~~-+~~~~~~t-I
middot~middotjmiddot1 W~M A~ ~~ fi1N ~ ~jT tv~~~ltiMfv~~l~--~( ~ t _ _- _ ) ~ _ j 98
~ 96 1-----+---~I------+--7-+----7----~----------t-I LI 0 94 1---r~I-----+----~-+~----+----t-I ~ w N W bull OMow N bull ~ bullbull N bullbullbullbullbullbullbullbullbullbullbull
middot middot ~ bull i ~ - bull
00 ~--~---iJLi ~I-i-------------------L-- ~JJ
5 10 15 20 25 3J
Day of Month of January 1995
FIGURE C-9 MONITORED LOCALIZER CLEARANCE RF LEVEL FOR THE MONTH OF JANUARY 1995
Localizer Clearance Width 1
middot bull bullbull bullbullbullbull bull bull bullbull bullbull bull bullbullbullbullbull bull bull bullbullbullbullbullbullbull bull bull 0 bull bullbull ~ bullbullbull bullbull bull bullbull
039 r---+middot-+-~+----- t----+-+--1
bull bull bullbull ~ bull bullbullbullbull bull bullbull bull bull bull bullbull bull bullbullbullbull bullbullbull bull bull bull bullbullbullbull 0 0 0 bullbull I bullbull bullbull
bull bull ~ bull 0 bull bullbullbullbull bullbullbull bullbull bullbullbull i ~ bullbull 0 bull bullbullbull bullbull j bullbull bullbull bull bullbull bullbull 03J ~-------ii---------ii------ii---i----_i-LJ
5 10 15 20 25 3J
Day of Month of January 1995
FIGURE C-10 MONITORED LOCALIZER CLEARANCE WIDTH 1 FOR THE MONTH OF JANUARY 1995
C-5
Localizer Clearance Width 2
middot ~
middot
-p bull bullbullbullbullbullbull _ bullbull middot middot
I~ bullbullbullbull bullbullbullbullbullbullbullbullbullbullbullbullbullbullbullbullbullbullbullbullbull bullbull bullbull
~ 033 r--------+-~--+-------+------~------+-------+-1 middot ~o B 029 j MJ= 028 _ 11~lr 111 IlHiJ ii ~ LJIIlIn
~ bullbull -- 1---- T~~+ -1 +-+----+---~v~IIVm
027 r-------r----+--7----+-tH---------r------7+---t-1 -middot
- imiddotmiddot ~ - - bull - bull i middot 024 ---~ -J-~~~~~_~----~~JL-o~_~ L-J
5 10 15 20 25
Day of Month of January 1995
FIGURE C-11 MONITORED LOCALIZER CLEARANCE WIDTH 2 FOR THE MONTH OF JANUARY 1995
Localizer CourseClearance Frequency Difference
~ ~ ~ ~ ~ ~ ~ ~ ~
N 83 ~j--T--T-+-- -+---+j-H
g bullbull p _ bullbullbullbullbull - - - bullbull ~ - bullbull _ bullbullbullbullbull shy _ - bullbull _ bullbullbullbullbull shy
B2 middot II) 1middotmiddotmiddot middotmiddotmiddot bullbullbullbullbull middotmiddotbullmiddotmiddotmiddot middotmiddotmiddotmiddot1middotmiddot
U amp Bl 1---t----------+---------+----r------f-----------t-----------+-1II) ~ BO ~- __ --+-0shy I---t--j is gt- 79 1---~t-~-+----~-+-t---~~-t-~-~-1 middot middot u ~ amp ~ 7B I------t----------+--------+----------f-------t-~~-I
~ - - - - - cr
77 ~j--T-_r~ -+-~-t--T-~-I 11
bullbullbull bullbull bullbullbull bullbullbullbullbull bullbullbull bullbullbull bullbullbullbullbull j bullbullbull bullbullbull bullbullbullbullbullbullbullbull bullbull bullbull bullbullbull bullbullbullbullbullbullbull bullbullbullbullbullbull bullbullbullbullbullbullbull bullbullbull j bullbull j bullbull middot 75 -------Li-i---Li--------------J---i-JJ
5 10 15 20 25
Day of Month of January 1995
FIGURE C-12 MONITORED LOCALIZER COURSECLEARANCE FREQUENCY DIFFERENCE FOR THE MONTH OF JANUARY 1995
Localizer Ident Depth of Modulation
~~~ ~ ~ ~ _ 10 f----+----+-----t--- -+-------+----------------+-1 fl -
9 f-------+-----~~f---77~---+----~-+-~-----+---~___+-I
c ~~ - ~ m 11 8 ~-- l-IIIIbull~L--+-~ ~------F-u---JL---fL----amp---t-I lo ~ 7f-----------+-------------If---7------+--------+-----------+----------+-I3 C
~ 6 1------------+------------+------------+-------------+-------------+----------+-1
- -- - -
4----~_____~~~Lo~~-----~~____~~----L~~~l-J
5 10 15 20 25
Day of Month of January 1995
FIGURE C-13 MONITORED LOCALIZER IDENTIFICATION DEPTH OF MODULATION FOR THE MONTH OF JANUARY 1995
Glide Slope Path DDM
~ ~ ~ ~ 0020 ~----+-----f--- -----+------+----+-+-1
~ ~ ~ ~
0005 ~---+-----f----+---~-I---++-I
~ ~ ~ ~ ~ _
bullbull bullbullbull bullbull bullbullbullbull bullbullbull bullbullbull bullbullbull bullbullbullbull bullbullbull bullbullbull bullbullbullbullbullbullbullbull bullbullbull bullbull bullbullbull bullbullbullbull bullbull bullbullbull bullbullbull bullbullbullbullbullbullbullbull bullbull j bullbull j bullbullbullbull -0025 ----~~~~----~~-----~~~------~~----~~~L-J
5 10 15 20 25
Day of Month of January 1995
FIGURE C-14 MONITORED GLIDE SLOPE PATH DDM FOR THE MONTH OF JANUARY 1995
C-7
Glide Slope Path RFLevel
100 ~--+~---If----+----+----+---H - - - -
~ 98 i j c bullbullbull bull -bull ~ bull bull ~ bull bullbull bullbull bullbullbull i bullbull i bullbull i
~ U 0
~
94 - - shy - bull ~ ~ - - ~ ~ bull - bull bullbull - bull bullbull bull
1--------+---------71--------+----------+--------+------7--1---
bullbullbullbullbullbullbull ~ bull OM OM bull bull middot N bull M amp bull O bull bullbull bullbull bullbull
middot-middotmiddotmiddotimiddotmiddotmiddotmiddotmiddotmiddot
OC)----JJ--JJ----L-1------LL------------------LJ
5 10 15 20 25 30
Day of Month of January 1995
FIGURE C-15 MONITORED GLIDE SLOPE PATH RF LEVEL FOR THE MONTH OF JANUARY 1995
Glide Slope Path Width
0205 ----r-1---r-T---TT--r-TT--r--r-r---r-r----
02fIl 1---~~~~~--~-t--~tH ~ ~ ~ ~ ~ ~
0195 ~---+--~~ --------l-----+------t----- H ~ ~ ~ ~ ~middot
0100 ~-----+-------~~-----=- -t-------=-----=--t--------+------=---+--1
O 1B5 r----j----t-------j----I-----+------t-i middot ~ ~
~ 0100 lila ~ r~~~L ~Li~~~~ bullbullbullbullbull ~r~ ~ 0165 r----~~~I---~+-~~-t--~t --t-i
middot i imiddot - - - i bull ~ imiddot i i
0160 r-----~----- -+-~--t---~---t---- ------~-----t-i
0155 1-----+-~~~~~~-t--~t~H
middot i bull ~ i bull bullbullbullbull - ~ bull i ~ ~ I bullbull I bullbull bullbull
o150 I-----f--_~I-----------+--_--+-------+-------+-H middot bull~ ~ middot
0145 ~~~---J ~~L-o~~~~~ ~~------
5 10 15 20 25
Day of Month of January 1995
FIGURE C-16 MONITORED GLIDE SLOPE PATH WIDTH FOR THE MONTH OF JANUARY 1995
C-8
82
-
Glide Slope Path SOM
~ ~ ~ ~ ~ ~ ~-~ ---- -+--+--+- -----t---+-I
~ ~
- ~ ~ ~ ~ ~
5 10 15 20 25 3J
Day of Month of January 1995
FIGURE C-17 MONITORED GLIDE SLOPE PATH SDM FOR THE MONTH OF JANUARY 1995
Glide Slope Clearance RF Level
middot
40
~ ~ - - - 2()
~ - tIE ~
W 1[UJljtJ~~ ~V middot+Imiddotf1t i~~~ middot~ftH~ E ~t~ r~nr Lrllll fU~ ld~~~~1middot 1 BJ ~ 102 fT TT ~yrlni~f l 0 100 j~ ~JJ ~ ~ ~ ilt
~ 00 ~ $ 1-shy ----+---+---+--~-+- -H U 0 94
middot bull d bullbull N
~ bull i shy bull - bullbull - i i middot 00 _iJ-------JLi----iLi-i----i----J---------- 0
5 10 15 20 25 3J
Day of Month of January 1995
FIGURE C-18 MONITORED GLIDE SLOPE CLEARANCE RF LEVEL FOR THE MONTH OF JANUARY 1995
C-9
Glide Slope PathClearance Frequency Difference
middot ~ ~ ~ ~ 84 j-------=--~--=-- ~ ~ -+--~---+-I
bullbullbullbullbull bullbull ~ bullbullbull bullbull bull bullbullbullbullbullbull bullbull I bullbull
i bull i - ~ bullbull bullbull bullbull - bull i i middot 75 Li----------iJ-----------I-i--ii-i-l-i-i----------------L-I
5 10 15 20 25 30
Day of Month of January 1995
FIGURE C-19 MONITORED GLIDE SLOPE PATHCLEARANCE FREQUENCY DIFFERENCE FOR THE MONTH OF JANUARY 1995
Inner Marker Beacon RF Level
~ ~ ~ ~ ~ ~ middot
100 j---------+---t---------+------+-----~--+-l
-middot
- ~ - _ _ iiishybull~ 104
~ 102 1------+----------11-------+--------+--+---H
0 100 middotmiddotmiddotfTmiddotrmiddotmiddot middotmiddotmiddotmiddotmiddotmiddot~middotTmiddot~middotmiddotmiddotmiddot(middotlrmiddotmiddotmiddotmiddotmiddotmiddotmiddotifC l ~ ~lI jIUHPLLUJ) ) )1)11 1) lI)I) l
98 ~ middotmiddotmiddotmiddotmiddotmiddotmiddottmiddotmiddotmiddotmiddot
~ Ii ---~-+--~---II-----~~+---~-+----+----H u D 94 ~-rmiddotmiddot~~r---~-+~--H
middot - _ - _ ~ ~
- middotmiddotmiddotmiddotmiddotmiddotmiddot-middotmiddotimiddotmiddot j bullbull bullbullbull bullbullbull bullbullbullbull bullbullbull bull bullbullbull bullbullbullbullbullbull bullbullbull bullbull bullbull bullbullbullbullbullbullbull bullbull j bullbull bullbull middot 9J -----i-i-I-i----l-i-i--------i-i-i-L-i--i-i-iL-i-i_i-I-J
5 10 15 20 25 30
Day of Month of January 1995
FIGURE C-20 MONITORED INNER MARKER BEACON RF LEVEL FOR THE MONTH OF JANUARY 1995
C-10
Inner Marker Beacon Modulation
M OM M M M bullbull _ bullbullbull OM M M
102 middot
bull bull bullbull ~ bullbull bull bullbull bullbullbull bullbullbull bullbull I bull ~ bullbull bull bull ~ bull bullbull ~ bull bullbull bull I bullbull I bullbull 100 I----~-t-~----I---------+---- 7---+-7------+------+-1
bullbull bullbull ~ bullbull bullbullbull I bull bullbull bullbull bull bullbull I bullbull I bullbull bullbull
Bl3 1----+----11----------+------------+-----+---H ~ ~ ~ ~
5 10 15 20 25
Day of Month of January 1995
FIGURE C-21 MONITORED INNER MARKER BEACON DEPTH OF MODULATION FOR THE MONTH OF JANUARY 1995
Inner Marker Beacon Vo~age Standing Wm Ratio
raquo 1 B 1-----+------~-+-~--+---------+-------+------+-1
middot bullbullbullbullbullbullbullbullbullbullbull bullbull M _ bullbull M bullbullbullbullbull _
i ~ - - ~ i t bullbull bullmiddot 100 L--ii-i--------ii-----------Ji--i-i--li-i----i----i-i----LJ
5 10 15 20 25
Day of Month of January 1995
FIGURE C-22 MONITORED INNER MARKER BEACON VOLTAGE STANDING WAVE RATIO FOR THE MONTH OF JANUARY 1995
C-11
Inner Marker Beacon Idenl Keying
100
95 J 0 J Cg 0 - II
(0
90
85
C
~ OJ ~
II CD
80
75
~ 0 II
0
70
65
60 5 10 15 20 25
Day of Month of January 1995
FIGURE C-23 MONITORED INNER MARKER BEACON IDENT KEYING STATUS FOR THE MONTH OF JANUARY 1995
C-12
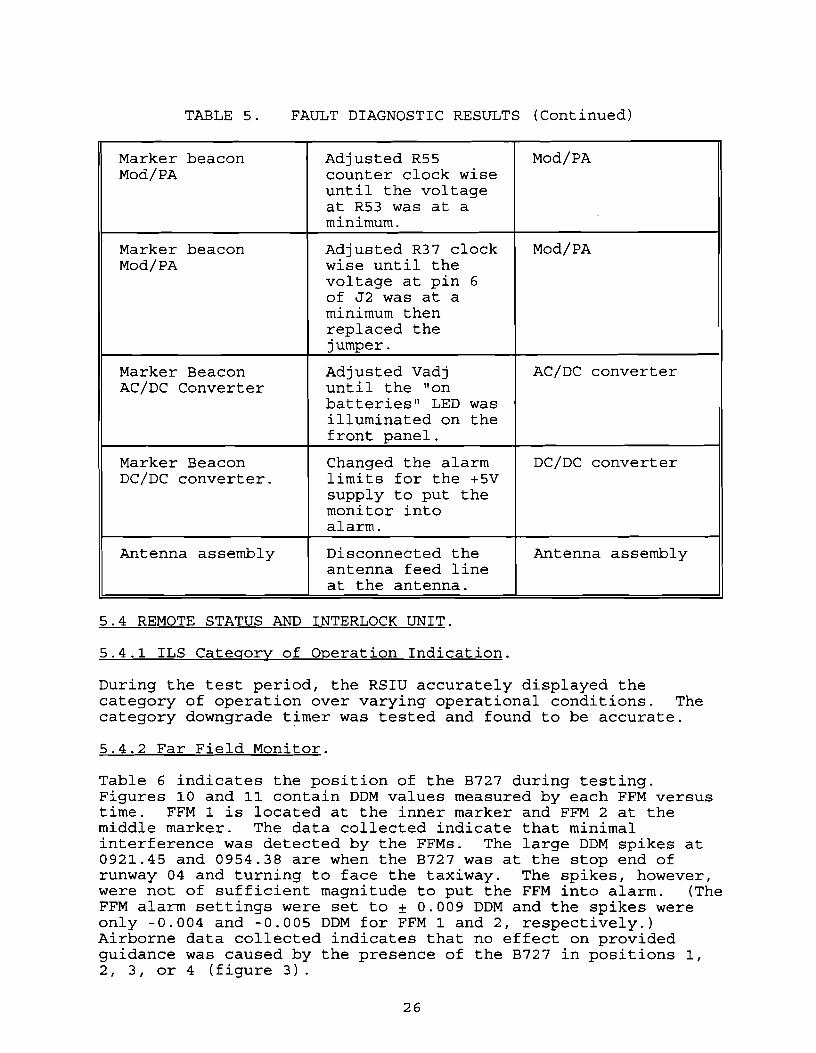
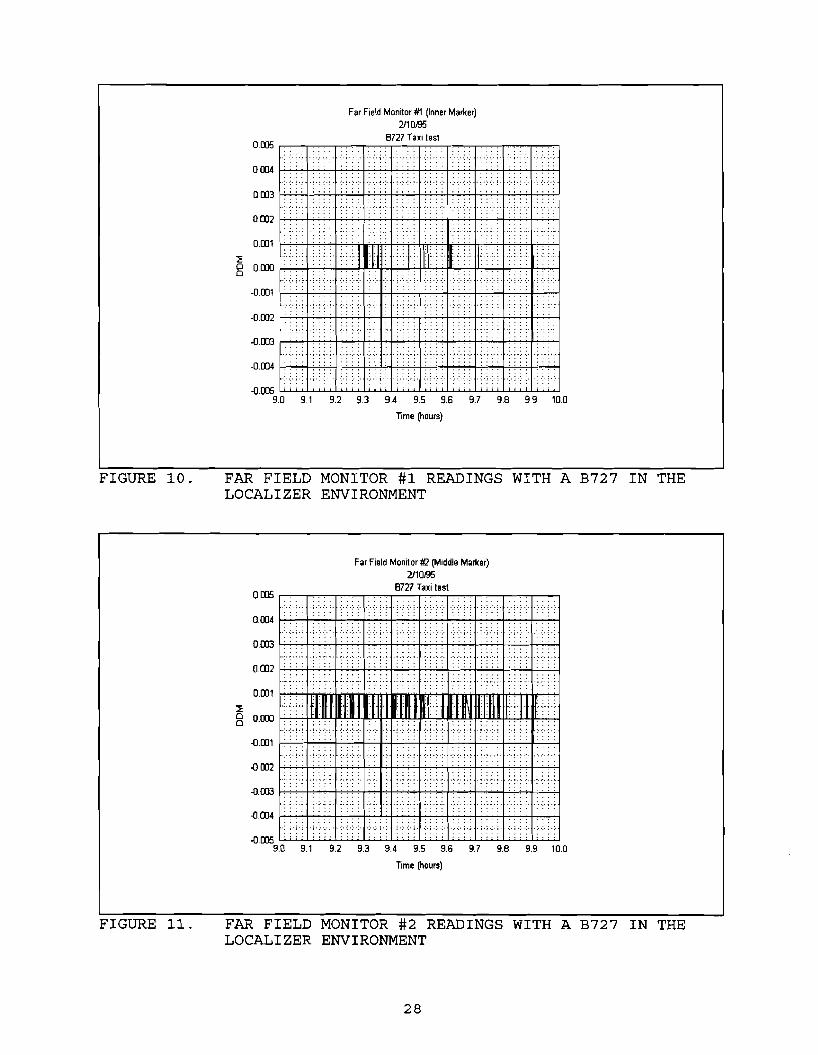

ILS WORKSHEET
1 IDENT XJF 12 DATE 712-13194 3 TYPE CHECK SPECIAL SITE
4 CREW DRAPERICOLESIKENNEDY 5 AIRCRAFT NO N~9114 -
6 NOTES OPERATIONAL TEST AND EVALUATION OF THEMK 20 ILS INSTALLATION AT AlLANTIC CITY NJ (KACY) RWY 04_
UMITED COMMISSIONING PROFILE FLOWN AT MAINTENANCE REQUEST
RINY 04
FREQ 10U5
LOCTYPE DUAL
CWo 160
ANGLE 300
GNDTEMP 83
CAT 2 OAT 22
GS TYPE CAP EFF BARO 3002
ALTITUDE
7 RUN
1
cm
1N
PAorALN
3 1N
4 1S
5 1S
6 1S
7 18
8 18
t 18
10 1N
11 25
12 2S
13 28
14 2N
1
1
2N
2N
17
18
18
20
2N
2N
1N
1N
456
298
21 1NL
1NG
1L
298
190 JLA
2M
191
PWorCW
571
U9
00000
490
558
669
148
563 -
483
559
651
1161
1167
573
NIA
163
092
90Hz SYM
498
496
499
499
NlA
494
530
491
501
419
4
494
100
NlA
498
FLAG or MOD
38
386
390
790
REMARKS 1OTHER DATA
INITlAL NORMAL CLEARANCES SATlSFACTORY 35 middot35
ADJUSTED NORMAL CLEARANCES SATISFACTORY
NO ANNOUNCED COURSE WIDTHmiddot SYSlEM FAULT
COURSE NARROW~LEARANCEWIDE
COURSENORMAL~LEARANCENARROW
COURSE WIDE CLEARANCE NORMAL OTWIDE
SYSTEM FAULT
COURSE WIDE CLEARANCE NORMAL
NORMALCONAGURATION
COURSENARROW~LEARANCEWIDE
COURSENORMAL~LEARANCENARROW
COURSE WIDE CLEARANCE NORMAL
NORMALCONAGURATION
RF ALARM 18NM AT LCA USEABLE DISTANCE CHECK 1010
RF ALARM 18NM AT 4500 FT 10middot10
APCH RF ALARM 18NMTO TlfRESHOLD bull SAT
10NM ARC RF ALARM CLEARANCES SAT
SYSTEM FAULT 8AD UPDAlE DATA - RECHECK
CHANGE DATA FOR A Ii2 NM MANUAL UPDATE
ILS 3 LOCAUZER Z1zn7 Z2a OIO58 23-110115
ILS 3 GIS Z1=416366 Z2=31O58 13=71017
FAA FORM 8240middot21 (590) A-6
ILS WORKSHEET
1 IDENT XJF 2 DATE712middot13J94
4 CREW DRAPERICOLESIKENNEDY
6 NOTES OPERATIONAL TEST AND EVALUAll0N OF THE P1K 20 ILS INSTALLAll0N AT ATLAN11C CITY NJ (KACY) RWY04
UMiTED COMMISSIONING PROFILE FLOWN AT MAINTENANCE REQUEST
3 TYPE CHECK SPECIAL SITE
5 AIRCRAFT NO N-89184
RWf 04 CW 560
FREQ 109amp5 ANGLE 300
LOCTYPE DUAL GNDTEMP 83
OAT 22
GSTYPE CAPEFF
CAT 2
BARO 3002
ALTITUDE
7 RUN
22
CFQ
iN
iN
iN
PAorALN
1L
9UA
9UA
19O~ PWorCW 90Hz SYM
FLAG or MOD
REMARKS OTHER DATA
~UGNMENTMONITORS NORMAL
ALIGNMENT MONITORS 160 HZ
AUGNMENT MONITORS 90 HZ
1-18
1
2
3
4
I
bull 7
bull bull 10
11
12
13
14
16
1
TX1
iN
iN
iN
is
1B
1M
1A
1R
1U
1U
iN
iN
iN
RF
RF
RF
297
304
301
297
299
302
301
2A3
294
301
293
299
207
229
113
229
117
212
210
209
210
067
648
066
076
075
076
G76
071
067
066
069
476
494
513
493
461
493
431
140
521
471
514
478
796
788
789
BEGIN GUDE SLOPE 71394
SYSTEM FAULTmiddot NO UPDATEmiddot SEE 2
INITIAL NORMAlmiddot REFERENCE
GIS STRUCTURE Z1- 41712 22= 9060 Z3= 41016
NARROW ALARM
COURSE WIDE ClEARANCE MOD ALARM
MIDDLE ANTENNA ATTENUATED TO ALARMmiddot GADB
DDLE ANTENNA ADVANCE PHASE 16 DEGREES
DDLE ANTENNA RETARD PHASE 15 DEGREES
SYSTEM FAULTmiddot NO DATA
UPPER ANTENNA ATTENUATED 1DB
NORMALmiddot LEVEL RUN
TUT CHECK middot150 HZ SIDE (lOCAUZER EXlRErtT1ES)
1LT CHECKmiddot 90 HZ SIDE (lOCAUZER EXTRErt11ES)
USEABLE DISTANCE FROM 10 NM bull 150HZ SIDE (8 DEGREES)
USEABLE DISTANCE FROM 10 NM bull 90HZ SIDE (8 DEGREES)
USEABlE DISTANCE FROM 10 NM bull ON COURSE
FAA FORM 8240 - 21 (590)
A-7
ILS WORKSHEET
1 IDENT XJF 12 DATE 7112middot13194 3 TYPE CHECK SPECIAL SITE
4 CREW DRAPERICOLESIKENNEDY - 5 AIRCRAFT NO N~184
6 NOTES OPERATIONAL TEST AND EVALUA1l0N Of lliEMK 20 ILS RWY 04 CW amp60 INSTALLATION AT ATLANTIC CITY NJ (KACY) RWYMmiddot
FREQ 10966 ANGLE 300
UMiTED COMMISSIONING PROFILE FLOWN AT MAINTENANCE REQUEST LOCTYPE DUAL GNDTEMP 83
CAT 2 OAT 22
GS TYPE CAP EFF BARD 3002
ALTITUDE
7 RUN CFG PAorALN 190 JampA PWorCW 90Hz SYM
FLAG or MOD
REMARKS I OTHER DATA
11 1N 301 MEAN WlDlliSYMMETRY ON PATH
18 1N 264 487 MEAN WlDlliSYMMETRY BELOW PATH (90HZ)
18 1N 340 MEAN WIDTHSYMMETRY ABOVE PATH (160HZ)
A 8
1 INSTRUMENT LANDING SYSTEM a State New Jersey b City Atlantic City c Airport Atlantic city International Airport d Category of Operation Category III e Associated runway~ Runway 04 f Approach bearing 02800 deg true h Engineering drawing na i Localizer
1 Latitude and longitude of antenna 39 deg 28 0103 N I 074 deg 34 2522 W
2 Antenna Type 14 element LPD 3 Distance from stop end of runway to antenna 1005 4 Distance from approach end of runway to antenna
7149 5 Distance and direction from runway centerline on cl 6 Ground elevation at center of antenna array 664msl 7 Identifier I-XJF 8 Frequency 10955 mhz 9 Voice availability na
10 Course width 56 deg 11 Course width over threshold 700 ft 12 Back course status Not available 13 Restrictions None 14 Remote monitor Far field monitor 15 Commissioning date na
j Glide Slope 1 Latitude and longitude of antenna
39 deg 27 0813 N I 74 deg 35 0727 W 2 Ground elevation of antenna mast 6584 msl 3 Elevation of runway centerline abeam glide slope
antenna 670 msl 4 Frequency 33245 mhz 5 Type of facility Capture effect antenna system 6 Distance of antenna from approach end of runway875 7 Distance and direction from runway cl 400 left 8 Glide angle 300 deg 9 Restrictions na
10 Remote monitor na 11 Commissioning date na
k outer Marker 1 Latitude and longitude of antenna
39 deg 29 5362 N I 074 deg 40 2048 W 2 Ground elevation of antenna 48 msl 3 Distance from runway threshold 4804 4 Distance from runway centerline extended on cl 5 Locator classification OM 6 Remote monitor na 7 Commissioning date na
A-9
APPENDIXB Test Trouble Reports
TTR__-=-O=l _ CAT IIIII ILSRMS TEST TROUBLE REPORT FORM
TESTER Ben BennettPaul Evermon LOCATION _~A=CY _
TEST SCENARIO Installation DATE June 94
TTR CLASSIFICATION CRITICAL SIGNIFICANT MINOR x
DESCRIPTION OF PROBLEM OR FAILURE During installation a problem was detected with one of the FFMs The signal from this monitor had considerable 60 Hz interference The monitor was returned to the factory for repair The 60 Hz interference could not be repeated at the factory and the unit appeared to be working fine under lab conditions When the FFM was returned to ACY the problem surfaced again In the field it was discovered that when an audio transformer was placed in the line from the FFM to the localizer the FFM worked fine From this it is assumed that the FFM has a bad transformer
RECOMMENDED SOLUTION Wilcox should develop a production test procedure for the FFM to test the audio transformer in the future
RESOLUTION Wilcox has added a procedure to test the audio transformer in their production acceptance tests
IMPROVEMENT RECOMMENDATION MODIFICATION TO HARDWARE MODIFICATION TO SOFTWARE CHANGE IN TEST PROCEDURE CHANGE IN OPERATIONS
B-1
TTR__~O==2 _ CAT IIIII ILSjRMS TEST TROUBLE REPORT FORM
TESTER Ben Bennett LOCATION _=A=C-Y _
TEST SCENARIO _~A~l=ig~n~m~en~t_ _ DATE June 1994
TTR CLASSIFICATION CRITICAL x SIGNIFICANT MINOR
DESCRIPTION OF PROBLEM OR FAILURE After calibrating the glide slope detectors the clearance RF level reads 113 and the clearance SDM reads 75 This is due to path SBO signals not being canceled out before the detection process
RECOMMENDED SOLUTION Wilcox must isolate the path SBO signal from the clearance signal before detection This can be accomplished by either hardware or software changes
RESOLUTION Wilcox addressed this issue with a new monitor software release This software release was tested at ACY and TMB and found to be an acceptable solution to the problem See paragraph 533
IMPROVEMENT RECOMMENDATION MODIFICATION TO HARDWARE or MODIFICATION TO SOFTWARE
CHANGE IN TEST PROCEDURE CHANGE IN OPERATIONS
B-2
TTR__O=3 _ CAT IIIII ILSRMS TEST TROUBLE REPORT FORM
TESTER Ben Bennett LOCATION _A=CY _
TEST SCENARIO Installation DATE June 1994
TTR CLASSIFICATION CRITICAL SIGNIFICANT MINOR x
DESCRIPTION OF PROBLEM OR FAILURE The ON BATTERY and LOW BATTERY LEDs do not illuminate when the TEST button is pressed on the RCSU
RECOMMENDED SOLUTION
RESOLUTION It will be documented in the RCSU user manual that the LEDs will not light
IMPROVEMENT RECOMMENDATION -Kshy MODIFICATION TO HARDWARE or -Kshy MODIFICATION TO SOFTWARE
CHANGE IN TEST PROCEDURE CHANGE IN OPERATIONS
B-3
TTR__=O-=4 _ CAT IIIII ILSRMS TEST TROUBLE REPORT FORM
TESTER Ben BennettByron Robins LOCATION _~A~C~Y _
TEST SCENARIO Normal Operation DATE June 94
TTR CLASSIFICATION CRITICAL SIGNIFICANT x MINOR
DESCRIPTION OF PROBLEM OR FAILURE The glide slope and localizer integrity check will fail if the standby monitor alarm delay time is set too low
RECOMMENDED SOLUTION Software change to not allow a standby monitor alarm delay time too low for the integrity check to pass
RESOLUTION The PMDT software was changed to not allow the user to set the standby monitor alarm time too low
IMPROVEMENT RECOMMENDATION MODIFICATION TO HARDWARE -K- MODIFICATION TO SOFTWARE
CHANGE IN TEST PROCEDURE CHANGE IN OPERATIONS
B-4
TTR__--O=S _ CAT IIIII ILSRMS TEST TROUBLE REPORT FORM
TESTER Ben Bennett LOcATION----A~CY _
TEST SCENARIO Integration testing DATE July 1994
TTR CLASSIFICATION CRITICAL SIGNIFICANT x MINOR
DESCRIPTION OF PROBLEM OR FAILURE The localizer and glide slope manual fault diagnostics will not run after a fault has been introduced that causes both transmitters to shut down
RECOMMENDED SOLUTION Correct in software
RESOLUTION Software revisions by Wilcox corrected this problem
IMPROVEMENT RECOMMENDATION MODIFICATION TO HARDWARE -K- MODIFICATION TO SOFTWARE
CHANGE IN TEST PROCEDURE CHANGE IN OPERATIONS
B-S
TTR__--O--6 _ CAT IIIII ILSRMS TEST TROUBLE REPORT FORM
TESTER Ben Bennett LOCATION _=A=C-=Y _
TEST SCENARIO Integration testing DATE July 1994
TTR CLASSIFICATION CRITICAL SIGNIFICANT x MINOR
DESCRIPTION OF PROBLEM OR FAILURE Auto fault diagnostics for the localizer glide slope and the marker beacons do not accurately identify the faulted LRU
RECOMMENDED SOLUTION Correct in software
RESOLUTION Automatic diagnostics is not as accurate as manual because in order to accurately diagnose the subsystem faulty signals must be radiated This can only be done manually
IMPROVEMENT RECOMMENDATION MODIFICATION TO HARDWARE -X- MODIFICATION TO SOFTWARE
CHANGE IN TEST PROCEDURE CHANGE IN OPERATIONS
B-6
TTR__O~7 _ CAT IIIII ILSRMS TEST TROUBLE REPORT FORM
TESTER Ben BennettByron Robins LOCATION _A=C--Y _
TEST SCENARIO Normal Operations DATE 8894
TTR CLASSIFICATION CRITICAL SIGNIFICANT x MINOR
DESCRIPTION OF PROBLEM OR FAILURE Localizer shut down The executive monitor course DDM went out of tolerance causing both transmitters to shut down indicating a possible problem in the DUCU or antenna subsystems
RECOMMENDED SOLUTION
RESOLUTION It has not been determined what caused this outage
IMPROVEMENT RECOMMENDATION MODIFICATION TO HARDWARE MODIFICATION TO SOFTWARE CHANGE IN TEST PROCEDURE CHANGE IN OPERATIONS
B-7
TTR__~O~8 _ CAT IIIII ILSRMS TEST TROUBLE REPORT FORM
TESTER Ben BennettByron Robins LOCATION _~A~CY _
TEST SCENARIO Standby power test DATE 82994
TTR CLASSIFICATION CRITICAL SIGNIFICANT x MINOR
DESCRIPTION OF PROBLEM OR FAILURE The marker beacon front panel displays on batteries and maintenance alert after the batteries have been discharged and AC power restored to the system
RECOMMENDED SOLUTION The project office will have this problem corrected by Wilcox through ECP16
IMPROVEMENT RECOMMENDATION MODIFICATION TO HARDWARE or MODIFICATION TO SOFTWARE
CHANGE IN TEST PROCEDURE CHANGE IN OPERATIONS
B-8
TTR__-=0=9 _ CAT IIIII ILSRMS TEST TROUBLE REPORT FORM
TESTER Ben BennettByron Robins LOCATION _~A~C-=-Y _
TEST SCENARIO Standby power test DATE 83094
TTR CLASSIFICATION CRITICAL SIGNIFICANT x MINOR
DESCRIPTION OF PROBLEM OR FAILURE After the batteries were discharged AC power was restored with only one of two sets of batteries on line to reduce charge current As a result of this condition the outer marker ACDC power supply shut itself down due to too much power being supplied The ACDC converter is not powerful enough to charge even one set of batteries after they have been discharged
RECOMMENDED SOLUTION Raise the battery cut off voltage so that the marker beacons shut down at a state of discharge that the ACDC converter can recharge the batteries without damage At the current cut off voltage the marker beacons remained on the air for well over 176 hours The requirement is only 72 hours
IMPROVEMENT RECOMMENDATION MODIFICATION TO HARDWARE MODIFICATION TO SOFTWARE CHANGE IN TEST PROCEDURE CHANGE IN OPERATIONS
B-9
TTR__lO _ CAT IIIII ILSRMS TEST TROUBLE REPORT FORM
TESTER Ben BennettByron Robins LOCATION _A=C-=Y _
TEST SCENARIO Normal Operations DATE 9694
TTR CLASSIFICATION CRITICAL SIGNIFICANT x MINOR
DESCRIPTION OF PROBLEM OR FAILURE This is a repeat of the TTR 07 he executive monitor course ddm started to fluctuate around 810 pm on ~ September It went into alarm several times but went back to normal before the 2 second alarm delay time had expired The executive monitor remained stable until approximately 820 am 6 September The course ddm and course width ddm went into alarm but went back to normal before the alarm delay timer expired again At 908 am the course path and width ddm began to oscillate between alarm and normal This continued until 930 am when the course ddm remained in alarm condition until the delay timer expired causing both transmitters to shut down No abnormal weather conditions were present at the time of shutdown
RECOMMENDED SOLUTION
RESOLUTION The cause of this outage has not been determined
IMPROVEMENT RECOMMENDATION MODIFICATION TO HARDWARE MODIFICATION TO SOFTWARE CHANGE IN TEST PROCEDURE CHANGE IN OPERATIONS
B-10
TTR__=l=l _ CAT IIIII ILSRMS TEST TROUBLE REPORT FORM
TESTER Ben BennettByron Robbins LOCATION _poundlA=CY _
TEST SCENARIO Normal Operations DATE 112194
TTR CLASSIFICATION CRITICAL SIGNIFICANT x MINOR
DESCRIPTION OF PROBLEM OR FAILURE The inner marker AC to DC converter failed The power was turned off for approximately 5 hours and then turned back on with no effect The AC to DC converter from the middle marker worked in the inner marker The converter was returned to Wilcox who will send it to Lambda for analysis
RECOMMENDED SOLUTION
RESOLUTION The ACDC converter was returned to Wilcox for analysis
IMPROVEMENT RECOMMENDATION MODIFICATION TO HARDWARE MODIFICATION TO SOFTWARE CHANGE IN TEST PROCEDURE CHANGE IN OPERATIONS
B-ll
TTR__1=2 _ CAT IIIII ILSRMS TEST TROUBLE REPORT FORM
TESTER Ben BennettByron Robbins LOCATION _~AC=Y _
TEST SCENARIO Normal Operations DATE 112194
TTR CLASSIFICATION CRITICAL SIGNIFICANT x MINOR
DESCRIPTION OF PROBLEM OR FAILURE Unknown failure of the RMM board on the glide slope RMM boards were swapped from the localizer to the glide slope and the communication errors followed the RMM board to the localizer A new spare RMM board was installed which corrected the errors
RECOMMENDED SOLUTION
RESOLUTION Normal corrective maintenance
IMPROVEMENT RECOMMENDATION MODIFICATION TO HARDWARE MODIFICATION TO SOFTWARE CHANGE IN TEST PROCEDURE CHANGE IN OPERATIONS
B-12
TTR__=1=3 _ CAT IIIII ILSRMS TEST TROUBLE REPORT FORM
TESTER Ben Bennett LOCATION ACY Runway 04 Localizer
TEST SCENARIO Normal Operation DATE 020395
TTR CLASSIFICATION CRITICAL SIGNIFICANT MINOR x
DESCRIPTION OF PROBLEM OR FAILURE With transmitter 2 selected as main the localizer would switch to transmitter 1 and remain on the air The switch over would occur within 24 hours of start up This anomaly only existed when transmitter 2 was selected as main
The conditions of the fault were clearance RF level dropping to 448 clearance width 1 dropping from 0293 ddm to 0000 ddm clearance width 2 dropping from 0226 ddm to 0000 ddm and the clearance SDM dropping from 407 to 00
When transmitter 2 was brought back on line the monitors would be within alarm tolerances This condition indicated an intermittent problem as well as prevented fault diagnostics from identifying the faulty LRU Trouble shooting revealed that the clearance CSB RF relay on the transfer assembly was intermittent and was replaced with a new relay from the spares kit
RECOMMENDED SOLUTION
RESOLUTION Normal corrective maintenance
IMPROVEMENT RECOMMENDATION MODIFICATION TO HARDWARE MODIFICATION TO SOFTWARE CHANGE IN TEST PROCEDURE CHANGE IN OPERATIONS
B-13
APPENDIXC Stability Data
Temperature
~ i ~ ~ i bull i
Day of Month of January 1995
FIGURE C-l MEASURED OUTSIDE TEMPERATURE FOR THE MONTH OF JANUARY 1995
Barometric Pressure
~ JIJO
~ 298
g 296
294
~
IJ4 f----+----+----+----+----+--__t_ middot1middotflAmiddotmiddotmiddotmiddotmiddotmiddotmiddotmiddotmiddotmiddot P
IJ2middotmiddotmiddotmiddotmiddotAmiddotmiddotmiddotmiddotmiddotmiddotlr-Nmiddotmiddott 1 middotmiddotmiddotfi
J t ~ ~ 1 1 ~
I -(
y
Day of Month of January 1995
FIGURE C-2 MEASURED BAROMETRIC PRESSURE FOR THE MONTH OF JANUARY 1995
C-1
Wind Speed
50
40
-I a 30 ~ - C 0) 0)
200 (I)
C t
~ 10
0
5 10 15 20 25 30
Day of Month of January 1995
FIGURE C-3 MEASURED WIND SPEED FOR THE MONTH OF JANUARY 1995
Rain Rate
~
middot middot middot
03 1-----7+--+-----+---------+-----------+------~-+-7 --~~-i
- J L
o 02 1-------+--+-----+---------+---~-+--------f-----+_I
CIl c
- ~VI CIl ~ g 01 H---~--~--~~-~H+_+_----+__1
~ - ~
5 10 15 20 25
Day of Month of January 1995
FIGURE C-4 MEASURED RAIN RATE FOR THE MONTH OF JANUARY 1995
C-2
Localizer Course DDM
0000 middot
OOCE
bullbullbullbullbullbullbull M bullbull ON OM H bullbullbullbullbullbullbullbullbullbull M M 0004
0002
~ 0000
o (JOO2 middot
~ ~ ~ ~
(J004
(Jom
(Jooo
bull ~ i shy i ~ bull - bull
i
5 10 15 20 25 3D
Day of Month of January 1995
FIGURE C-5 MONITORED
Localizer Course RF Level
middot 100 I----~ +-~ -----+--~~~~--~-t-~----~~----~+-
~
~
102 ~n y1J 100 ~~~V~r~j-IfVvYv I1J
~ ~ ~ 98
~ 96~------+----------+----------+-----------r----------~------H LL 0 9-4 r---r--~~r-----~--+--- -+--1 middot
bullbullbull M bullbull M bullbull M M bullbull M
~ bull i i imiddot imiddotmiddot i 00 ---~----~~JL~~ ~~L~~ ~~~
5 10 15 20 25
Day of Month of January 1995
FIGURE C-6 MONITORED LOCALIZER COURSE RF LEVEL FOR THE MONTH OF JANUARY 1995
C-3
localizer Course Width
0175 1-----+---+----1------1-----+-----+-1
~ 0 165 1------t-~~~+-~~-I-~--1I--~~-+-~~--+-I -middot o ~ ~
Cl 0160 ~ ~ Jilll~ bullbulliJ bull1 jj 1l1~~ _J
0155 ~ ~ ~ ~~~~I~~ ~~~~~_~~~_~ M ~lD 0 150
middot imiddot - i ~ - - ~ g 0145~ ~+---bull-+bull-i--~~---+--~-1 o
ON 0 N _ 0 bullbullbullbullbullbullbull 0 bullbullbullbullbullbullbullbullbullbullbullbullbullbull
middot ~ ~ ~ ~ ~ ~ ~ ~ ~ ~ ~ ~ 0131 L-i~----1lt------Li-~-----i--iiJL-i-------i--iLJ
5 10 15 20 25
Day of Month of January 1995
FIGURE C-7 MONITORED COURSE WIDTH FOR THE MONTH OF JANUARY 1995
localizer Course SDM
~ gt ~ -
middot ~ ~ ~ ~ ~ ~ ~ ~ ~
42 ~t~+--- ---+---+--~~ -+-1 middot - _~ - E
io 41 ~----+~~~+-------~-+-~~~~ -----~+- --c-----+-l
1 bullbull 1 bullbullbullbull bullbull bullbullbullbullbullbullbullbullbullbullbullbullbullbullbull bullbullbullbullbull 1 bullbull bullbullbullbullbullbullbullbullbullbull bullbullbullbull bullbullbullbull 1 bullbull 1 bullbullbullbull3 [~ o 40 ~ ~_ bull ~ bull ~ ~ ~ ~ ~ ~ - 39 ~----+~--------+-------~-+------------~-----+-- --------+-l E ~ bull Cl (I) 38 J---------+------------1---------+---------1---------1----------+-l
-- - - - -
~ ~~O-~~~~~ ---~---J ~J----~ L-J
5 10 15 20 25
Day of Month of January 1995
FIGURE C-8 MONITORED LOCALIZER COURSE SDM FOR THE MONTH OF JANUARY 1995
C-4
bullbull
Localizer Clearance RF Power Level
~ middot ~ IIll I-----~---------+-------+---+------t-I
_ - i c 104 I---------tr----~~I---~~+--~~-+~~~~~~t-I
middot~middotjmiddot1 W~M A~ ~~ fi1N ~ ~jT tv~~~ltiMfv~~l~--~( ~ t _ _- _ ) ~ _ j 98
~ 96 1-----+---~I------+--7-+----7----~----------t-I LI 0 94 1---r~I-----+----~-+~----+----t-I ~ w N W bull OMow N bull ~ bullbull N bullbullbullbullbullbullbullbullbullbullbull
middot middot ~ bull i ~ - bull
00 ~--~---iJLi ~I-i-------------------L-- ~JJ
5 10 15 20 25 3J
Day of Month of January 1995
FIGURE C-9 MONITORED LOCALIZER CLEARANCE RF LEVEL FOR THE MONTH OF JANUARY 1995
Localizer Clearance Width 1
middot bull bullbull bullbullbullbull bull bull bullbull bullbull bull bullbullbullbullbull bull bull bullbullbullbullbullbullbull bull bull 0 bull bullbull ~ bullbullbull bullbull bull bullbull
039 r---+middot-+-~+----- t----+-+--1
bull bull bullbull ~ bull bullbullbullbull bull bullbull bull bull bull bullbull bull bullbullbullbull bullbullbull bull bull bull bullbullbullbull 0 0 0 bullbull I bullbull bullbull
bull bull ~ bull 0 bull bullbullbullbull bullbullbull bullbull bullbullbull i ~ bullbull 0 bull bullbullbull bullbull j bullbull bullbull bull bullbull bullbull 03J ~-------ii---------ii------ii---i----_i-LJ
5 10 15 20 25 3J
Day of Month of January 1995
FIGURE C-10 MONITORED LOCALIZER CLEARANCE WIDTH 1 FOR THE MONTH OF JANUARY 1995
C-5
Localizer Clearance Width 2
middot ~
middot
-p bull bullbullbullbullbullbull _ bullbull middot middot
I~ bullbullbullbull bullbullbullbullbullbullbullbullbullbullbullbullbullbullbullbullbullbullbullbullbull bullbull bullbull
~ 033 r--------+-~--+-------+------~------+-------+-1 middot ~o B 029 j MJ= 028 _ 11~lr 111 IlHiJ ii ~ LJIIlIn
~ bullbull -- 1---- T~~+ -1 +-+----+---~v~IIVm
027 r-------r----+--7----+-tH---------r------7+---t-1 -middot
- imiddotmiddot ~ - - bull - bull i middot 024 ---~ -J-~~~~~_~----~~JL-o~_~ L-J
5 10 15 20 25
Day of Month of January 1995
FIGURE C-11 MONITORED LOCALIZER CLEARANCE WIDTH 2 FOR THE MONTH OF JANUARY 1995
Localizer CourseClearance Frequency Difference
~ ~ ~ ~ ~ ~ ~ ~ ~
N 83 ~j--T--T-+-- -+---+j-H
g bullbull p _ bullbullbullbullbull - - - bullbull ~ - bullbull _ bullbullbullbullbull shy _ - bullbull _ bullbullbullbullbull shy
B2 middot II) 1middotmiddotmiddot middotmiddotmiddot bullbullbullbullbull middotmiddotbullmiddotmiddotmiddot middotmiddotmiddotmiddot1middotmiddot
U amp Bl 1---t----------+---------+----r------f-----------t-----------+-1II) ~ BO ~- __ --+-0shy I---t--j is gt- 79 1---~t-~-+----~-+-t---~~-t-~-~-1 middot middot u ~ amp ~ 7B I------t----------+--------+----------f-------t-~~-I
~ - - - - - cr
77 ~j--T-_r~ -+-~-t--T-~-I 11
bullbullbull bullbull bullbullbull bullbullbullbullbull bullbullbull bullbullbull bullbullbullbullbull j bullbullbull bullbullbull bullbullbullbullbullbullbullbull bullbull bullbull bullbullbull bullbullbullbullbullbullbull bullbullbullbullbullbull bullbullbullbullbullbullbull bullbullbull j bullbull j bullbull middot 75 -------Li-i---Li--------------J---i-JJ
5 10 15 20 25
Day of Month of January 1995
FIGURE C-12 MONITORED LOCALIZER COURSECLEARANCE FREQUENCY DIFFERENCE FOR THE MONTH OF JANUARY 1995
Localizer Ident Depth of Modulation
~~~ ~ ~ ~ _ 10 f----+----+-----t--- -+-------+----------------+-1 fl -
9 f-------+-----~~f---77~---+----~-+-~-----+---~___+-I
c ~~ - ~ m 11 8 ~-- l-IIIIbull~L--+-~ ~------F-u---JL---fL----amp---t-I lo ~ 7f-----------+-------------If---7------+--------+-----------+----------+-I3 C
~ 6 1------------+------------+------------+-------------+-------------+----------+-1
- -- - -
4----~_____~~~Lo~~-----~~____~~----L~~~l-J
5 10 15 20 25
Day of Month of January 1995
FIGURE C-13 MONITORED LOCALIZER IDENTIFICATION DEPTH OF MODULATION FOR THE MONTH OF JANUARY 1995
Glide Slope Path DDM
~ ~ ~ ~ 0020 ~----+-----f--- -----+------+----+-+-1
~ ~ ~ ~
0005 ~---+-----f----+---~-I---++-I
~ ~ ~ ~ ~ _
bullbull bullbullbull bullbull bullbullbullbull bullbullbull bullbullbull bullbullbull bullbullbullbull bullbullbull bullbullbull bullbullbullbullbullbullbullbull bullbullbull bullbull bullbullbull bullbullbullbull bullbull bullbullbull bullbullbull bullbullbullbullbullbullbullbull bullbull j bullbull j bullbullbullbull -0025 ----~~~~----~~-----~~~------~~----~~~L-J
5 10 15 20 25
Day of Month of January 1995
FIGURE C-14 MONITORED GLIDE SLOPE PATH DDM FOR THE MONTH OF JANUARY 1995
C-7
Glide Slope Path RFLevel
100 ~--+~---If----+----+----+---H - - - -
~ 98 i j c bullbullbull bull -bull ~ bull bull ~ bull bullbull bullbull bullbullbull i bullbull i bullbull i
~ U 0
~
94 - - shy - bull ~ ~ - - ~ ~ bull - bull bullbull - bull bullbull bull
1--------+---------71--------+----------+--------+------7--1---
bullbullbullbullbullbullbull ~ bull OM OM bull bull middot N bull M amp bull O bull bullbull bullbull bullbull
middot-middotmiddotmiddotimiddotmiddotmiddotmiddotmiddotmiddot
OC)----JJ--JJ----L-1------LL------------------LJ
5 10 15 20 25 30
Day of Month of January 1995
FIGURE C-15 MONITORED GLIDE SLOPE PATH RF LEVEL FOR THE MONTH OF JANUARY 1995
Glide Slope Path Width
0205 ----r-1---r-T---TT--r-TT--r--r-r---r-r----
02fIl 1---~~~~~--~-t--~tH ~ ~ ~ ~ ~ ~
0195 ~---+--~~ --------l-----+------t----- H ~ ~ ~ ~ ~middot
0100 ~-----+-------~~-----=- -t-------=-----=--t--------+------=---+--1
O 1B5 r----j----t-------j----I-----+------t-i middot ~ ~
~ 0100 lila ~ r~~~L ~Li~~~~ bullbullbullbullbull ~r~ ~ 0165 r----~~~I---~+-~~-t--~t --t-i
middot i imiddot - - - i bull ~ imiddot i i
0160 r-----~----- -+-~--t---~---t---- ------~-----t-i
0155 1-----+-~~~~~~-t--~t~H
middot i bull ~ i bull bullbullbullbull - ~ bull i ~ ~ I bullbull I bullbull bullbull
o150 I-----f--_~I-----------+--_--+-------+-------+-H middot bull~ ~ middot
0145 ~~~---J ~~L-o~~~~~ ~~------
5 10 15 20 25
Day of Month of January 1995
FIGURE C-16 MONITORED GLIDE SLOPE PATH WIDTH FOR THE MONTH OF JANUARY 1995
C-8
82
-
Glide Slope Path SOM
~ ~ ~ ~ ~ ~ ~-~ ---- -+--+--+- -----t---+-I
~ ~
- ~ ~ ~ ~ ~
5 10 15 20 25 3J
Day of Month of January 1995
FIGURE C-17 MONITORED GLIDE SLOPE PATH SDM FOR THE MONTH OF JANUARY 1995
Glide Slope Clearance RF Level
middot
40
~ ~ - - - 2()
~ - tIE ~
W 1[UJljtJ~~ ~V middot+Imiddotf1t i~~~ middot~ftH~ E ~t~ r~nr Lrllll fU~ ld~~~~1middot 1 BJ ~ 102 fT TT ~yrlni~f l 0 100 j~ ~JJ ~ ~ ~ ilt
~ 00 ~ $ 1-shy ----+---+---+--~-+- -H U 0 94
middot bull d bullbull N
~ bull i shy bull - bullbull - i i middot 00 _iJ-------JLi----iLi-i----i----J---------- 0
5 10 15 20 25 3J
Day of Month of January 1995
FIGURE C-18 MONITORED GLIDE SLOPE CLEARANCE RF LEVEL FOR THE MONTH OF JANUARY 1995
C-9
Glide Slope PathClearance Frequency Difference
middot ~ ~ ~ ~ 84 j-------=--~--=-- ~ ~ -+--~---+-I
bullbullbullbullbull bullbull ~ bullbullbull bullbull bull bullbullbullbullbullbull bullbull I bullbull
i bull i - ~ bullbull bullbull bullbull - bull i i middot 75 Li----------iJ-----------I-i--ii-i-l-i-i----------------L-I
5 10 15 20 25 30
Day of Month of January 1995
FIGURE C-19 MONITORED GLIDE SLOPE PATHCLEARANCE FREQUENCY DIFFERENCE FOR THE MONTH OF JANUARY 1995
Inner Marker Beacon RF Level
~ ~ ~ ~ ~ ~ middot
100 j---------+---t---------+------+-----~--+-l
-middot
- ~ - _ _ iiishybull~ 104
~ 102 1------+----------11-------+--------+--+---H
0 100 middotmiddotmiddotfTmiddotrmiddotmiddot middotmiddotmiddotmiddotmiddotmiddot~middotTmiddot~middotmiddotmiddotmiddot(middotlrmiddotmiddotmiddotmiddotmiddotmiddotmiddotifC l ~ ~lI jIUHPLLUJ) ) )1)11 1) lI)I) l
98 ~ middotmiddotmiddotmiddotmiddotmiddotmiddottmiddotmiddotmiddotmiddot
~ Ii ---~-+--~---II-----~~+---~-+----+----H u D 94 ~-rmiddotmiddot~~r---~-+~--H
middot - _ - _ ~ ~
- middotmiddotmiddotmiddotmiddotmiddotmiddot-middotmiddotimiddotmiddot j bullbull bullbullbull bullbullbull bullbullbullbull bullbullbull bull bullbullbull bullbullbullbullbullbull bullbullbull bullbull bullbull bullbullbullbullbullbullbull bullbull j bullbull bullbull middot 9J -----i-i-I-i----l-i-i--------i-i-i-L-i--i-i-iL-i-i_i-I-J
5 10 15 20 25 30
Day of Month of January 1995
FIGURE C-20 MONITORED INNER MARKER BEACON RF LEVEL FOR THE MONTH OF JANUARY 1995
C-10
Inner Marker Beacon Modulation
M OM M M M bullbull _ bullbullbull OM M M
102 middot
bull bull bullbull ~ bullbull bull bullbull bullbullbull bullbullbull bullbull I bull ~ bullbull bull bull ~ bull bullbull ~ bull bullbull bull I bullbull I bullbull 100 I----~-t-~----I---------+---- 7---+-7------+------+-1
bullbull bullbull ~ bullbull bullbullbull I bull bullbull bullbull bull bullbull I bullbull I bullbull bullbull
Bl3 1----+----11----------+------------+-----+---H ~ ~ ~ ~
5 10 15 20 25
Day of Month of January 1995
FIGURE C-21 MONITORED INNER MARKER BEACON DEPTH OF MODULATION FOR THE MONTH OF JANUARY 1995
Inner Marker Beacon Vo~age Standing Wm Ratio
raquo 1 B 1-----+------~-+-~--+---------+-------+------+-1
middot bullbullbullbullbullbullbullbullbullbullbull bullbull M _ bullbull M bullbullbullbullbull _
i ~ - - ~ i t bullbull bullmiddot 100 L--ii-i--------ii-----------Ji--i-i--li-i----i----i-i----LJ
5 10 15 20 25
Day of Month of January 1995
FIGURE C-22 MONITORED INNER MARKER BEACON VOLTAGE STANDING WAVE RATIO FOR THE MONTH OF JANUARY 1995
C-11
Inner Marker Beacon Idenl Keying
100
95 J 0 J Cg 0 - II
(0
90
85
C
~ OJ ~
II CD
80
75
~ 0 II
0
70
65
60 5 10 15 20 25
Day of Month of January 1995
FIGURE C-23 MONITORED INNER MARKER BEACON IDENT KEYING STATUS FOR THE MONTH OF JANUARY 1995
C-12
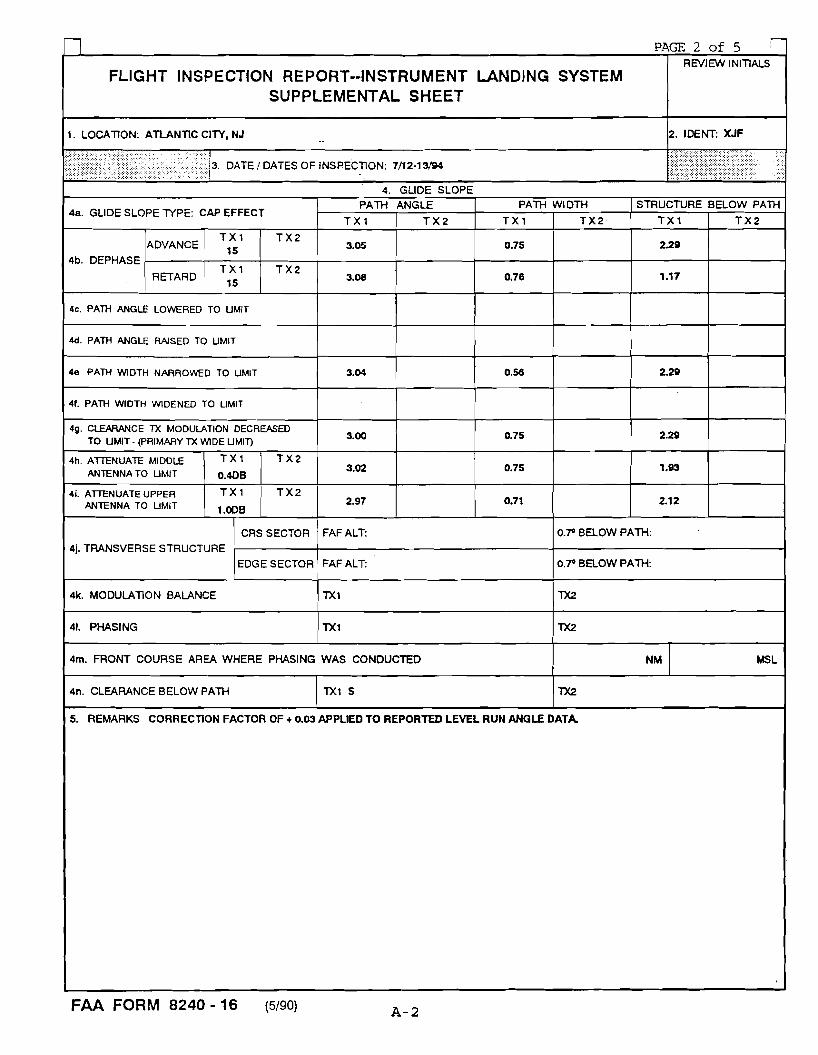
ILS WORKSHEET
1 IDENT XJF 12 DATE 7112middot13194 3 TYPE CHECK SPECIAL SITE
4 CREW DRAPERICOLESIKENNEDY - 5 AIRCRAFT NO N~184
6 NOTES OPERATIONAL TEST AND EVALUA1l0N Of lliEMK 20 ILS RWY 04 CW amp60 INSTALLATION AT ATLANTIC CITY NJ (KACY) RWYMmiddot
FREQ 10966 ANGLE 300
UMiTED COMMISSIONING PROFILE FLOWN AT MAINTENANCE REQUEST LOCTYPE DUAL GNDTEMP 83
CAT 2 OAT 22
GS TYPE CAP EFF BARD 3002
ALTITUDE
7 RUN CFG PAorALN 190 JampA PWorCW 90Hz SYM
FLAG or MOD
REMARKS I OTHER DATA
11 1N 301 MEAN WlDlliSYMMETRY ON PATH
18 1N 264 487 MEAN WlDlliSYMMETRY BELOW PATH (90HZ)
18 1N 340 MEAN WIDTHSYMMETRY ABOVE PATH (160HZ)
A 8
1 INSTRUMENT LANDING SYSTEM a State New Jersey b City Atlantic City c Airport Atlantic city International Airport d Category of Operation Category III e Associated runway~ Runway 04 f Approach bearing 02800 deg true h Engineering drawing na i Localizer
1 Latitude and longitude of antenna 39 deg 28 0103 N I 074 deg 34 2522 W
2 Antenna Type 14 element LPD 3 Distance from stop end of runway to antenna 1005 4 Distance from approach end of runway to antenna
7149 5 Distance and direction from runway centerline on cl 6 Ground elevation at center of antenna array 664msl 7 Identifier I-XJF 8 Frequency 10955 mhz 9 Voice availability na
10 Course width 56 deg 11 Course width over threshold 700 ft 12 Back course status Not available 13 Restrictions None 14 Remote monitor Far field monitor 15 Commissioning date na
j Glide Slope 1 Latitude and longitude of antenna
39 deg 27 0813 N I 74 deg 35 0727 W 2 Ground elevation of antenna mast 6584 msl 3 Elevation of runway centerline abeam glide slope
antenna 670 msl 4 Frequency 33245 mhz 5 Type of facility Capture effect antenna system 6 Distance of antenna from approach end of runway875 7 Distance and direction from runway cl 400 left 8 Glide angle 300 deg 9 Restrictions na
10 Remote monitor na 11 Commissioning date na
k outer Marker 1 Latitude and longitude of antenna
39 deg 29 5362 N I 074 deg 40 2048 W 2 Ground elevation of antenna 48 msl 3 Distance from runway threshold 4804 4 Distance from runway centerline extended on cl 5 Locator classification OM 6 Remote monitor na 7 Commissioning date na
A-9
APPENDIXB Test Trouble Reports
TTR__-=-O=l _ CAT IIIII ILSRMS TEST TROUBLE REPORT FORM
TESTER Ben BennettPaul Evermon LOCATION _~A=CY _
TEST SCENARIO Installation DATE June 94
TTR CLASSIFICATION CRITICAL SIGNIFICANT MINOR x
DESCRIPTION OF PROBLEM OR FAILURE During installation a problem was detected with one of the FFMs The signal from this monitor had considerable 60 Hz interference The monitor was returned to the factory for repair The 60 Hz interference could not be repeated at the factory and the unit appeared to be working fine under lab conditions When the FFM was returned to ACY the problem surfaced again In the field it was discovered that when an audio transformer was placed in the line from the FFM to the localizer the FFM worked fine From this it is assumed that the FFM has a bad transformer
RECOMMENDED SOLUTION Wilcox should develop a production test procedure for the FFM to test the audio transformer in the future
RESOLUTION Wilcox has added a procedure to test the audio transformer in their production acceptance tests
IMPROVEMENT RECOMMENDATION MODIFICATION TO HARDWARE MODIFICATION TO SOFTWARE CHANGE IN TEST PROCEDURE CHANGE IN OPERATIONS
B-1
TTR__~O==2 _ CAT IIIII ILSjRMS TEST TROUBLE REPORT FORM
TESTER Ben Bennett LOCATION _=A=C-Y _
TEST SCENARIO _~A~l=ig~n~m~en~t_ _ DATE June 1994
TTR CLASSIFICATION CRITICAL x SIGNIFICANT MINOR
DESCRIPTION OF PROBLEM OR FAILURE After calibrating the glide slope detectors the clearance RF level reads 113 and the clearance SDM reads 75 This is due to path SBO signals not being canceled out before the detection process
RECOMMENDED SOLUTION Wilcox must isolate the path SBO signal from the clearance signal before detection This can be accomplished by either hardware or software changes
RESOLUTION Wilcox addressed this issue with a new monitor software release This software release was tested at ACY and TMB and found to be an acceptable solution to the problem See paragraph 533
IMPROVEMENT RECOMMENDATION MODIFICATION TO HARDWARE or MODIFICATION TO SOFTWARE
CHANGE IN TEST PROCEDURE CHANGE IN OPERATIONS
B-2
TTR__O=3 _ CAT IIIII ILSRMS TEST TROUBLE REPORT FORM
TESTER Ben Bennett LOCATION _A=CY _
TEST SCENARIO Installation DATE June 1994
TTR CLASSIFICATION CRITICAL SIGNIFICANT MINOR x
DESCRIPTION OF PROBLEM OR FAILURE The ON BATTERY and LOW BATTERY LEDs do not illuminate when the TEST button is pressed on the RCSU
RECOMMENDED SOLUTION
RESOLUTION It will be documented in the RCSU user manual that the LEDs will not light
IMPROVEMENT RECOMMENDATION -Kshy MODIFICATION TO HARDWARE or -Kshy MODIFICATION TO SOFTWARE
CHANGE IN TEST PROCEDURE CHANGE IN OPERATIONS
B-3
TTR__=O-=4 _ CAT IIIII ILSRMS TEST TROUBLE REPORT FORM
TESTER Ben BennettByron Robins LOCATION _~A~C~Y _
TEST SCENARIO Normal Operation DATE June 94
TTR CLASSIFICATION CRITICAL SIGNIFICANT x MINOR
DESCRIPTION OF PROBLEM OR FAILURE The glide slope and localizer integrity check will fail if the standby monitor alarm delay time is set too low
RECOMMENDED SOLUTION Software change to not allow a standby monitor alarm delay time too low for the integrity check to pass
RESOLUTION The PMDT software was changed to not allow the user to set the standby monitor alarm time too low
IMPROVEMENT RECOMMENDATION MODIFICATION TO HARDWARE -K- MODIFICATION TO SOFTWARE
CHANGE IN TEST PROCEDURE CHANGE IN OPERATIONS
B-4
TTR__--O=S _ CAT IIIII ILSRMS TEST TROUBLE REPORT FORM
TESTER Ben Bennett LOcATION----A~CY _
TEST SCENARIO Integration testing DATE July 1994
TTR CLASSIFICATION CRITICAL SIGNIFICANT x MINOR
DESCRIPTION OF PROBLEM OR FAILURE The localizer and glide slope manual fault diagnostics will not run after a fault has been introduced that causes both transmitters to shut down
RECOMMENDED SOLUTION Correct in software
RESOLUTION Software revisions by Wilcox corrected this problem
IMPROVEMENT RECOMMENDATION MODIFICATION TO HARDWARE -K- MODIFICATION TO SOFTWARE
CHANGE IN TEST PROCEDURE CHANGE IN OPERATIONS
B-S
TTR__--O--6 _ CAT IIIII ILSRMS TEST TROUBLE REPORT FORM
TESTER Ben Bennett LOCATION _=A=C-=Y _
TEST SCENARIO Integration testing DATE July 1994
TTR CLASSIFICATION CRITICAL SIGNIFICANT x MINOR
DESCRIPTION OF PROBLEM OR FAILURE Auto fault diagnostics for the localizer glide slope and the marker beacons do not accurately identify the faulted LRU
RECOMMENDED SOLUTION Correct in software
RESOLUTION Automatic diagnostics is not as accurate as manual because in order to accurately diagnose the subsystem faulty signals must be radiated This can only be done manually
IMPROVEMENT RECOMMENDATION MODIFICATION TO HARDWARE -X- MODIFICATION TO SOFTWARE
CHANGE IN TEST PROCEDURE CHANGE IN OPERATIONS
B-6
TTR__O~7 _ CAT IIIII ILSRMS TEST TROUBLE REPORT FORM
TESTER Ben BennettByron Robins LOCATION _A=C--Y _
TEST SCENARIO Normal Operations DATE 8894
TTR CLASSIFICATION CRITICAL SIGNIFICANT x MINOR
DESCRIPTION OF PROBLEM OR FAILURE Localizer shut down The executive monitor course DDM went out of tolerance causing both transmitters to shut down indicating a possible problem in the DUCU or antenna subsystems
RECOMMENDED SOLUTION
RESOLUTION It has not been determined what caused this outage
IMPROVEMENT RECOMMENDATION MODIFICATION TO HARDWARE MODIFICATION TO SOFTWARE CHANGE IN TEST PROCEDURE CHANGE IN OPERATIONS
B-7
TTR__~O~8 _ CAT IIIII ILSRMS TEST TROUBLE REPORT FORM
TESTER Ben BennettByron Robins LOCATION _~A~CY _
TEST SCENARIO Standby power test DATE 82994
TTR CLASSIFICATION CRITICAL SIGNIFICANT x MINOR
DESCRIPTION OF PROBLEM OR FAILURE The marker beacon front panel displays on batteries and maintenance alert after the batteries have been discharged and AC power restored to the system
RECOMMENDED SOLUTION The project office will have this problem corrected by Wilcox through ECP16
IMPROVEMENT RECOMMENDATION MODIFICATION TO HARDWARE or MODIFICATION TO SOFTWARE
CHANGE IN TEST PROCEDURE CHANGE IN OPERATIONS
B-8
TTR__-=0=9 _ CAT IIIII ILSRMS TEST TROUBLE REPORT FORM
TESTER Ben BennettByron Robins LOCATION _~A~C-=-Y _
TEST SCENARIO Standby power test DATE 83094
TTR CLASSIFICATION CRITICAL SIGNIFICANT x MINOR
DESCRIPTION OF PROBLEM OR FAILURE After the batteries were discharged AC power was restored with only one of two sets of batteries on line to reduce charge current As a result of this condition the outer marker ACDC power supply shut itself down due to too much power being supplied The ACDC converter is not powerful enough to charge even one set of batteries after they have been discharged
RECOMMENDED SOLUTION Raise the battery cut off voltage so that the marker beacons shut down at a state of discharge that the ACDC converter can recharge the batteries without damage At the current cut off voltage the marker beacons remained on the air for well over 176 hours The requirement is only 72 hours
IMPROVEMENT RECOMMENDATION MODIFICATION TO HARDWARE MODIFICATION TO SOFTWARE CHANGE IN TEST PROCEDURE CHANGE IN OPERATIONS
B-9
TTR__lO _ CAT IIIII ILSRMS TEST TROUBLE REPORT FORM
TESTER Ben BennettByron Robins LOCATION _A=C-=Y _
TEST SCENARIO Normal Operations DATE 9694
TTR CLASSIFICATION CRITICAL SIGNIFICANT x MINOR
DESCRIPTION OF PROBLEM OR FAILURE This is a repeat of the TTR 07 he executive monitor course ddm started to fluctuate around 810 pm on ~ September It went into alarm several times but went back to normal before the 2 second alarm delay time had expired The executive monitor remained stable until approximately 820 am 6 September The course ddm and course width ddm went into alarm but went back to normal before the alarm delay timer expired again At 908 am the course path and width ddm began to oscillate between alarm and normal This continued until 930 am when the course ddm remained in alarm condition until the delay timer expired causing both transmitters to shut down No abnormal weather conditions were present at the time of shutdown
RECOMMENDED SOLUTION
RESOLUTION The cause of this outage has not been determined
IMPROVEMENT RECOMMENDATION MODIFICATION TO HARDWARE MODIFICATION TO SOFTWARE CHANGE IN TEST PROCEDURE CHANGE IN OPERATIONS
B-10
TTR__=l=l _ CAT IIIII ILSRMS TEST TROUBLE REPORT FORM
TESTER Ben BennettByron Robbins LOCATION _poundlA=CY _
TEST SCENARIO Normal Operations DATE 112194
TTR CLASSIFICATION CRITICAL SIGNIFICANT x MINOR
DESCRIPTION OF PROBLEM OR FAILURE The inner marker AC to DC converter failed The power was turned off for approximately 5 hours and then turned back on with no effect The AC to DC converter from the middle marker worked in the inner marker The converter was returned to Wilcox who will send it to Lambda for analysis
RECOMMENDED SOLUTION
RESOLUTION The ACDC converter was returned to Wilcox for analysis
IMPROVEMENT RECOMMENDATION MODIFICATION TO HARDWARE MODIFICATION TO SOFTWARE CHANGE IN TEST PROCEDURE CHANGE IN OPERATIONS
B-ll
TTR__1=2 _ CAT IIIII ILSRMS TEST TROUBLE REPORT FORM
TESTER Ben BennettByron Robbins LOCATION _~AC=Y _
TEST SCENARIO Normal Operations DATE 112194
TTR CLASSIFICATION CRITICAL SIGNIFICANT x MINOR
DESCRIPTION OF PROBLEM OR FAILURE Unknown failure of the RMM board on the glide slope RMM boards were swapped from the localizer to the glide slope and the communication errors followed the RMM board to the localizer A new spare RMM board was installed which corrected the errors
RECOMMENDED SOLUTION
RESOLUTION Normal corrective maintenance
IMPROVEMENT RECOMMENDATION MODIFICATION TO HARDWARE MODIFICATION TO SOFTWARE CHANGE IN TEST PROCEDURE CHANGE IN OPERATIONS
B-12
TTR__=1=3 _ CAT IIIII ILSRMS TEST TROUBLE REPORT FORM
TESTER Ben Bennett LOCATION ACY Runway 04 Localizer
TEST SCENARIO Normal Operation DATE 020395
TTR CLASSIFICATION CRITICAL SIGNIFICANT MINOR x
DESCRIPTION OF PROBLEM OR FAILURE With transmitter 2 selected as main the localizer would switch to transmitter 1 and remain on the air The switch over would occur within 24 hours of start up This anomaly only existed when transmitter 2 was selected as main
The conditions of the fault were clearance RF level dropping to 448 clearance width 1 dropping from 0293 ddm to 0000 ddm clearance width 2 dropping from 0226 ddm to 0000 ddm and the clearance SDM dropping from 407 to 00
When transmitter 2 was brought back on line the monitors would be within alarm tolerances This condition indicated an intermittent problem as well as prevented fault diagnostics from identifying the faulty LRU Trouble shooting revealed that the clearance CSB RF relay on the transfer assembly was intermittent and was replaced with a new relay from the spares kit
RECOMMENDED SOLUTION
RESOLUTION Normal corrective maintenance
IMPROVEMENT RECOMMENDATION MODIFICATION TO HARDWARE MODIFICATION TO SOFTWARE CHANGE IN TEST PROCEDURE CHANGE IN OPERATIONS
B-13
APPENDIXC Stability Data
Temperature
~ i ~ ~ i bull i
Day of Month of January 1995
FIGURE C-l MEASURED OUTSIDE TEMPERATURE FOR THE MONTH OF JANUARY 1995
Barometric Pressure
~ JIJO
~ 298
g 296
294
~
IJ4 f----+----+----+----+----+--__t_ middot1middotflAmiddotmiddotmiddotmiddotmiddotmiddotmiddotmiddotmiddotmiddot P
IJ2middotmiddotmiddotmiddotmiddotAmiddotmiddotmiddotmiddotmiddotmiddotlr-Nmiddotmiddott 1 middotmiddotmiddotfi
J t ~ ~ 1 1 ~
I -(
y
Day of Month of January 1995
FIGURE C-2 MEASURED BAROMETRIC PRESSURE FOR THE MONTH OF JANUARY 1995
C-1
Wind Speed
50
40
-I a 30 ~ - C 0) 0)
200 (I)
C t
~ 10
0
5 10 15 20 25 30
Day of Month of January 1995
FIGURE C-3 MEASURED WIND SPEED FOR THE MONTH OF JANUARY 1995
Rain Rate
~
middot middot middot
03 1-----7+--+-----+---------+-----------+------~-+-7 --~~-i
- J L
o 02 1-------+--+-----+---------+---~-+--------f-----+_I
CIl c
- ~VI CIl ~ g 01 H---~--~--~~-~H+_+_----+__1
~ - ~
5 10 15 20 25
Day of Month of January 1995
FIGURE C-4 MEASURED RAIN RATE FOR THE MONTH OF JANUARY 1995
C-2
Localizer Course DDM
0000 middot
OOCE
bullbullbullbullbullbullbull M bullbull ON OM H bullbullbullbullbullbullbullbullbullbull M M 0004
0002
~ 0000
o (JOO2 middot
~ ~ ~ ~
(J004
(Jom
(Jooo
bull ~ i shy i ~ bull - bull
i
5 10 15 20 25 3D
Day of Month of January 1995
FIGURE C-5 MONITORED
Localizer Course RF Level
middot 100 I----~ +-~ -----+--~~~~--~-t-~----~~----~+-
~
~
102 ~n y1J 100 ~~~V~r~j-IfVvYv I1J
~ ~ ~ 98
~ 96~------+----------+----------+-----------r----------~------H LL 0 9-4 r---r--~~r-----~--+--- -+--1 middot
bullbullbull M bullbull M bullbull M M bullbull M
~ bull i i imiddot imiddotmiddot i 00 ---~----~~JL~~ ~~L~~ ~~~
5 10 15 20 25
Day of Month of January 1995
FIGURE C-6 MONITORED LOCALIZER COURSE RF LEVEL FOR THE MONTH OF JANUARY 1995
C-3
localizer Course Width
0175 1-----+---+----1------1-----+-----+-1
~ 0 165 1------t-~~~+-~~-I-~--1I--~~-+-~~--+-I -middot o ~ ~
Cl 0160 ~ ~ Jilll~ bullbulliJ bull1 jj 1l1~~ _J
0155 ~ ~ ~ ~~~~I~~ ~~~~~_~~~_~ M ~lD 0 150
middot imiddot - i ~ - - ~ g 0145~ ~+---bull-+bull-i--~~---+--~-1 o
ON 0 N _ 0 bullbullbullbullbullbullbull 0 bullbullbullbullbullbullbullbullbullbullbullbullbullbull
middot ~ ~ ~ ~ ~ ~ ~ ~ ~ ~ ~ ~ 0131 L-i~----1lt------Li-~-----i--iiJL-i-------i--iLJ
5 10 15 20 25
Day of Month of January 1995
FIGURE C-7 MONITORED COURSE WIDTH FOR THE MONTH OF JANUARY 1995
localizer Course SDM
~ gt ~ -
middot ~ ~ ~ ~ ~ ~ ~ ~ ~
42 ~t~+--- ---+---+--~~ -+-1 middot - _~ - E
io 41 ~----+~~~+-------~-+-~~~~ -----~+- --c-----+-l
1 bullbull 1 bullbullbullbull bullbull bullbullbullbullbullbullbullbullbullbullbullbullbullbullbull bullbullbullbullbull 1 bullbull bullbullbullbullbullbullbullbullbullbull bullbullbullbull bullbullbullbull 1 bullbull 1 bullbullbullbull3 [~ o 40 ~ ~_ bull ~ bull ~ ~ ~ ~ ~ ~ - 39 ~----+~--------+-------~-+------------~-----+-- --------+-l E ~ bull Cl (I) 38 J---------+------------1---------+---------1---------1----------+-l
-- - - - -
~ ~~O-~~~~~ ---~---J ~J----~ L-J
5 10 15 20 25
Day of Month of January 1995
FIGURE C-8 MONITORED LOCALIZER COURSE SDM FOR THE MONTH OF JANUARY 1995
C-4
bullbull
Localizer Clearance RF Power Level
~ middot ~ IIll I-----~---------+-------+---+------t-I
_ - i c 104 I---------tr----~~I---~~+--~~-+~~~~~~t-I
middot~middotjmiddot1 W~M A~ ~~ fi1N ~ ~jT tv~~~ltiMfv~~l~--~( ~ t _ _- _ ) ~ _ j 98
~ 96 1-----+---~I------+--7-+----7----~----------t-I LI 0 94 1---r~I-----+----~-+~----+----t-I ~ w N W bull OMow N bull ~ bullbull N bullbullbullbullbullbullbullbullbullbullbull
middot middot ~ bull i ~ - bull
00 ~--~---iJLi ~I-i-------------------L-- ~JJ
5 10 15 20 25 3J
Day of Month of January 1995
FIGURE C-9 MONITORED LOCALIZER CLEARANCE RF LEVEL FOR THE MONTH OF JANUARY 1995
Localizer Clearance Width 1
middot bull bullbull bullbullbullbull bull bull bullbull bullbull bull bullbullbullbullbull bull bull bullbullbullbullbullbullbull bull bull 0 bull bullbull ~ bullbullbull bullbull bull bullbull
039 r---+middot-+-~+----- t----+-+--1
bull bull bullbull ~ bull bullbullbullbull bull bullbull bull bull bull bullbull bull bullbullbullbull bullbullbull bull bull bull bullbullbullbull 0 0 0 bullbull I bullbull bullbull
bull bull ~ bull 0 bull bullbullbullbull bullbullbull bullbull bullbullbull i ~ bullbull 0 bull bullbullbull bullbull j bullbull bullbull bull bullbull bullbull 03J ~-------ii---------ii------ii---i----_i-LJ
5 10 15 20 25 3J
Day of Month of January 1995
FIGURE C-10 MONITORED LOCALIZER CLEARANCE WIDTH 1 FOR THE MONTH OF JANUARY 1995
C-5
Localizer Clearance Width 2
middot ~
middot
-p bull bullbullbullbullbullbull _ bullbull middot middot
I~ bullbullbullbull bullbullbullbullbullbullbullbullbullbullbullbullbullbullbullbullbullbullbullbullbull bullbull bullbull
~ 033 r--------+-~--+-------+------~------+-------+-1 middot ~o B 029 j MJ= 028 _ 11~lr 111 IlHiJ ii ~ LJIIlIn
~ bullbull -- 1---- T~~+ -1 +-+----+---~v~IIVm
027 r-------r----+--7----+-tH---------r------7+---t-1 -middot
- imiddotmiddot ~ - - bull - bull i middot 024 ---~ -J-~~~~~_~----~~JL-o~_~ L-J
5 10 15 20 25
Day of Month of January 1995
FIGURE C-11 MONITORED LOCALIZER CLEARANCE WIDTH 2 FOR THE MONTH OF JANUARY 1995
Localizer CourseClearance Frequency Difference
~ ~ ~ ~ ~ ~ ~ ~ ~
N 83 ~j--T--T-+-- -+---+j-H
g bullbull p _ bullbullbullbullbull - - - bullbull ~ - bullbull _ bullbullbullbullbull shy _ - bullbull _ bullbullbullbullbull shy
B2 middot II) 1middotmiddotmiddot middotmiddotmiddot bullbullbullbullbull middotmiddotbullmiddotmiddotmiddot middotmiddotmiddotmiddot1middotmiddot
U amp Bl 1---t----------+---------+----r------f-----------t-----------+-1II) ~ BO ~- __ --+-0shy I---t--j is gt- 79 1---~t-~-+----~-+-t---~~-t-~-~-1 middot middot u ~ amp ~ 7B I------t----------+--------+----------f-------t-~~-I
~ - - - - - cr
77 ~j--T-_r~ -+-~-t--T-~-I 11
bullbullbull bullbull bullbullbull bullbullbullbullbull bullbullbull bullbullbull bullbullbullbullbull j bullbullbull bullbullbull bullbullbullbullbullbullbullbull bullbull bullbull bullbullbull bullbullbullbullbullbullbull bullbullbullbullbullbull bullbullbullbullbullbullbull bullbullbull j bullbull j bullbull middot 75 -------Li-i---Li--------------J---i-JJ
5 10 15 20 25
Day of Month of January 1995
FIGURE C-12 MONITORED LOCALIZER COURSECLEARANCE FREQUENCY DIFFERENCE FOR THE MONTH OF JANUARY 1995
Localizer Ident Depth of Modulation
~~~ ~ ~ ~ _ 10 f----+----+-----t--- -+-------+----------------+-1 fl -
9 f-------+-----~~f---77~---+----~-+-~-----+---~___+-I
c ~~ - ~ m 11 8 ~-- l-IIIIbull~L--+-~ ~------F-u---JL---fL----amp---t-I lo ~ 7f-----------+-------------If---7------+--------+-----------+----------+-I3 C
~ 6 1------------+------------+------------+-------------+-------------+----------+-1
- -- - -
4----~_____~~~Lo~~-----~~____~~----L~~~l-J
5 10 15 20 25
Day of Month of January 1995
FIGURE C-13 MONITORED LOCALIZER IDENTIFICATION DEPTH OF MODULATION FOR THE MONTH OF JANUARY 1995
Glide Slope Path DDM
~ ~ ~ ~ 0020 ~----+-----f--- -----+------+----+-+-1
~ ~ ~ ~
0005 ~---+-----f----+---~-I---++-I
~ ~ ~ ~ ~ _
bullbull bullbullbull bullbull bullbullbullbull bullbullbull bullbullbull bullbullbull bullbullbullbull bullbullbull bullbullbull bullbullbullbullbullbullbullbull bullbullbull bullbull bullbullbull bullbullbullbull bullbull bullbullbull bullbullbull bullbullbullbullbullbullbullbull bullbull j bullbull j bullbullbullbull -0025 ----~~~~----~~-----~~~------~~----~~~L-J
5 10 15 20 25
Day of Month of January 1995
FIGURE C-14 MONITORED GLIDE SLOPE PATH DDM FOR THE MONTH OF JANUARY 1995
C-7
Glide Slope Path RFLevel
100 ~--+~---If----+----+----+---H - - - -
~ 98 i j c bullbullbull bull -bull ~ bull bull ~ bull bullbull bullbull bullbullbull i bullbull i bullbull i
~ U 0
~
94 - - shy - bull ~ ~ - - ~ ~ bull - bull bullbull - bull bullbull bull
1--------+---------71--------+----------+--------+------7--1---
bullbullbullbullbullbullbull ~ bull OM OM bull bull middot N bull M amp bull O bull bullbull bullbull bullbull
middot-middotmiddotmiddotimiddotmiddotmiddotmiddotmiddotmiddot
OC)----JJ--JJ----L-1------LL------------------LJ
5 10 15 20 25 30
Day of Month of January 1995
FIGURE C-15 MONITORED GLIDE SLOPE PATH RF LEVEL FOR THE MONTH OF JANUARY 1995
Glide Slope Path Width
0205 ----r-1---r-T---TT--r-TT--r--r-r---r-r----
02fIl 1---~~~~~--~-t--~tH ~ ~ ~ ~ ~ ~
0195 ~---+--~~ --------l-----+------t----- H ~ ~ ~ ~ ~middot
0100 ~-----+-------~~-----=- -t-------=-----=--t--------+------=---+--1
O 1B5 r----j----t-------j----I-----+------t-i middot ~ ~
~ 0100 lila ~ r~~~L ~Li~~~~ bullbullbullbullbull ~r~ ~ 0165 r----~~~I---~+-~~-t--~t --t-i
middot i imiddot - - - i bull ~ imiddot i i
0160 r-----~----- -+-~--t---~---t---- ------~-----t-i
0155 1-----+-~~~~~~-t--~t~H
middot i bull ~ i bull bullbullbullbull - ~ bull i ~ ~ I bullbull I bullbull bullbull
o150 I-----f--_~I-----------+--_--+-------+-------+-H middot bull~ ~ middot
0145 ~~~---J ~~L-o~~~~~ ~~------
5 10 15 20 25
Day of Month of January 1995
FIGURE C-16 MONITORED GLIDE SLOPE PATH WIDTH FOR THE MONTH OF JANUARY 1995
C-8
82
-
Glide Slope Path SOM
~ ~ ~ ~ ~ ~ ~-~ ---- -+--+--+- -----t---+-I
~ ~
- ~ ~ ~ ~ ~
5 10 15 20 25 3J
Day of Month of January 1995
FIGURE C-17 MONITORED GLIDE SLOPE PATH SDM FOR THE MONTH OF JANUARY 1995
Glide Slope Clearance RF Level
middot
40
~ ~ - - - 2()
~ - tIE ~
W 1[UJljtJ~~ ~V middot+Imiddotf1t i~~~ middot~ftH~ E ~t~ r~nr Lrllll fU~ ld~~~~1middot 1 BJ ~ 102 fT TT ~yrlni~f l 0 100 j~ ~JJ ~ ~ ~ ilt
~ 00 ~ $ 1-shy ----+---+---+--~-+- -H U 0 94
middot bull d bullbull N
~ bull i shy bull - bullbull - i i middot 00 _iJ-------JLi----iLi-i----i----J---------- 0
5 10 15 20 25 3J
Day of Month of January 1995
FIGURE C-18 MONITORED GLIDE SLOPE CLEARANCE RF LEVEL FOR THE MONTH OF JANUARY 1995
C-9
Glide Slope PathClearance Frequency Difference
middot ~ ~ ~ ~ 84 j-------=--~--=-- ~ ~ -+--~---+-I
bullbullbullbullbull bullbull ~ bullbullbull bullbull bull bullbullbullbullbullbull bullbull I bullbull
i bull i - ~ bullbull bullbull bullbull - bull i i middot 75 Li----------iJ-----------I-i--ii-i-l-i-i----------------L-I
5 10 15 20 25 30
Day of Month of January 1995
FIGURE C-19 MONITORED GLIDE SLOPE PATHCLEARANCE FREQUENCY DIFFERENCE FOR THE MONTH OF JANUARY 1995
Inner Marker Beacon RF Level
~ ~ ~ ~ ~ ~ middot
100 j---------+---t---------+------+-----~--+-l
-middot
- ~ - _ _ iiishybull~ 104
~ 102 1------+----------11-------+--------+--+---H
0 100 middotmiddotmiddotfTmiddotrmiddotmiddot middotmiddotmiddotmiddotmiddotmiddot~middotTmiddot~middotmiddotmiddotmiddot(middotlrmiddotmiddotmiddotmiddotmiddotmiddotmiddotifC l ~ ~lI jIUHPLLUJ) ) )1)11 1) lI)I) l
98 ~ middotmiddotmiddotmiddotmiddotmiddotmiddottmiddotmiddotmiddotmiddot
~ Ii ---~-+--~---II-----~~+---~-+----+----H u D 94 ~-rmiddotmiddot~~r---~-+~--H
middot - _ - _ ~ ~
- middotmiddotmiddotmiddotmiddotmiddotmiddot-middotmiddotimiddotmiddot j bullbull bullbullbull bullbullbull bullbullbullbull bullbullbull bull bullbullbull bullbullbullbullbullbull bullbullbull bullbull bullbull bullbullbullbullbullbullbull bullbull j bullbull bullbull middot 9J -----i-i-I-i----l-i-i--------i-i-i-L-i--i-i-iL-i-i_i-I-J
5 10 15 20 25 30
Day of Month of January 1995
FIGURE C-20 MONITORED INNER MARKER BEACON RF LEVEL FOR THE MONTH OF JANUARY 1995
C-10
Inner Marker Beacon Modulation
M OM M M M bullbull _ bullbullbull OM M M
102 middot
bull bull bullbull ~ bullbull bull bullbull bullbullbull bullbullbull bullbull I bull ~ bullbull bull bull ~ bull bullbull ~ bull bullbull bull I bullbull I bullbull 100 I----~-t-~----I---------+---- 7---+-7------+------+-1
bullbull bullbull ~ bullbull bullbullbull I bull bullbull bullbull bull bullbull I bullbull I bullbull bullbull
Bl3 1----+----11----------+------------+-----+---H ~ ~ ~ ~
5 10 15 20 25
Day of Month of January 1995
FIGURE C-21 MONITORED INNER MARKER BEACON DEPTH OF MODULATION FOR THE MONTH OF JANUARY 1995
Inner Marker Beacon Vo~age Standing Wm Ratio
raquo 1 B 1-----+------~-+-~--+---------+-------+------+-1
middot bullbullbullbullbullbullbullbullbullbullbull bullbull M _ bullbull M bullbullbullbullbull _
i ~ - - ~ i t bullbull bullmiddot 100 L--ii-i--------ii-----------Ji--i-i--li-i----i----i-i----LJ
5 10 15 20 25
Day of Month of January 1995
FIGURE C-22 MONITORED INNER MARKER BEACON VOLTAGE STANDING WAVE RATIO FOR THE MONTH OF JANUARY 1995
C-11
Inner Marker Beacon Idenl Keying
100
95 J 0 J Cg 0 - II
(0
90
85
C
~ OJ ~
II CD
80
75
~ 0 II
0
70
65
60 5 10 15 20 25
Day of Month of January 1995
FIGURE C-23 MONITORED INNER MARKER BEACON IDENT KEYING STATUS FOR THE MONTH OF JANUARY 1995
C-12
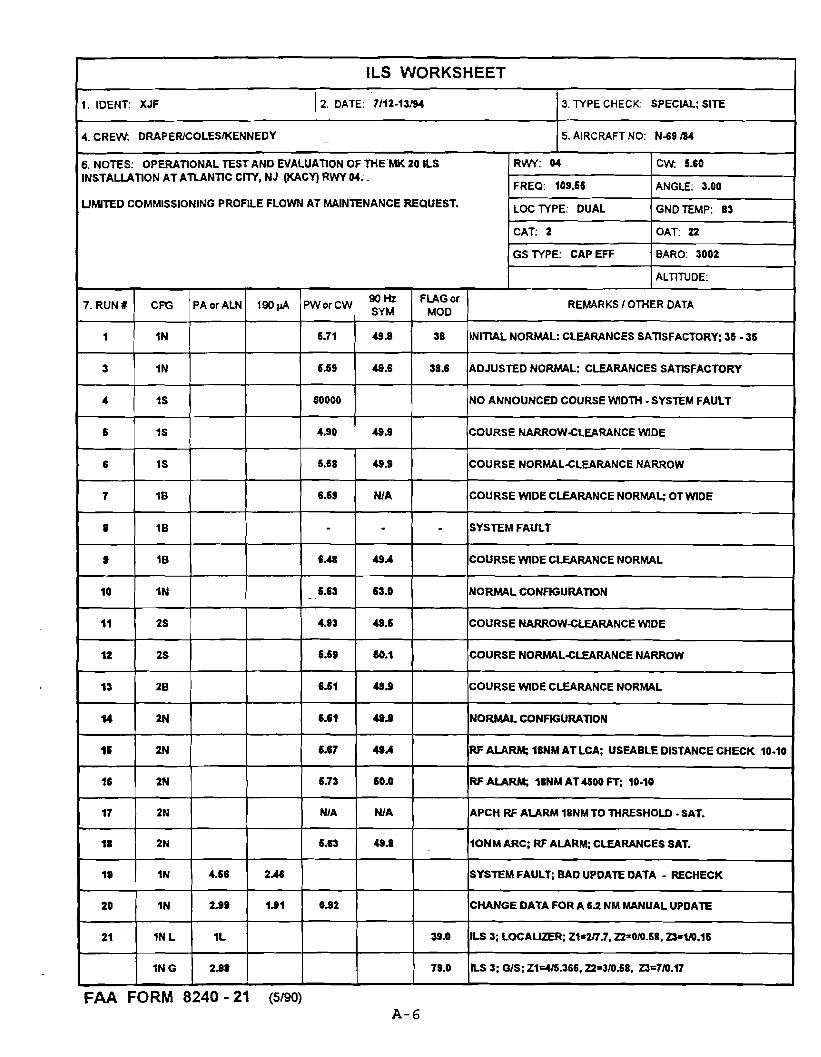
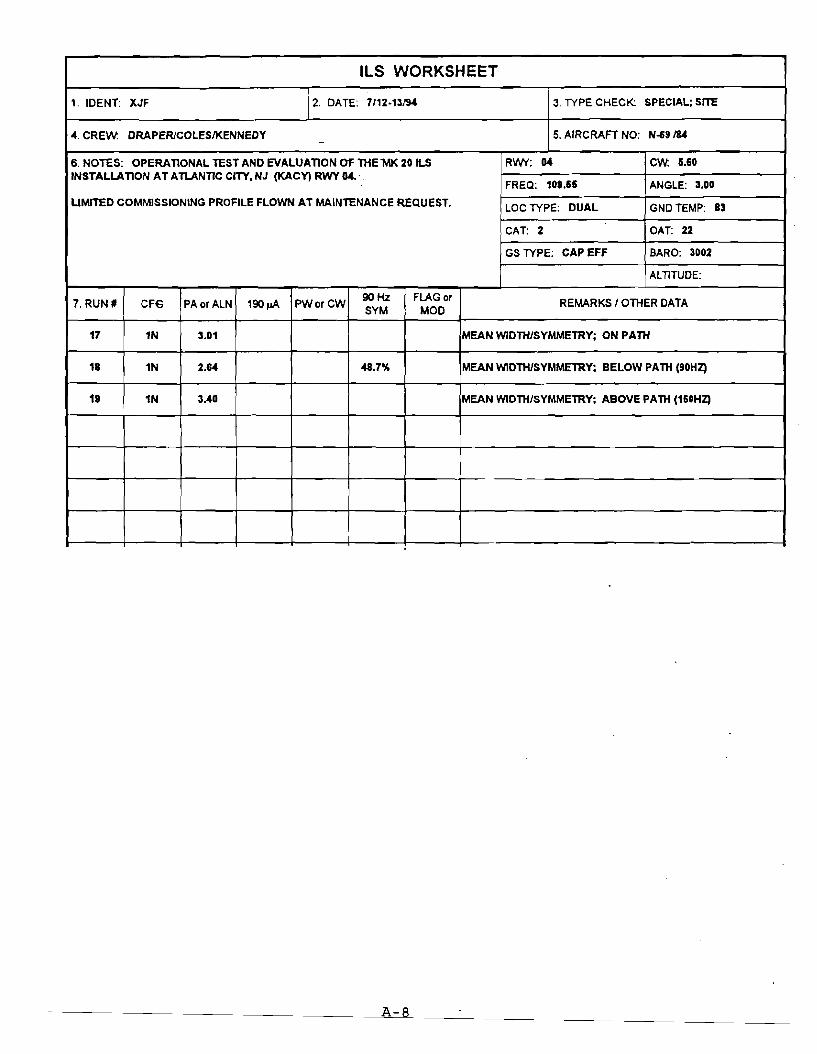
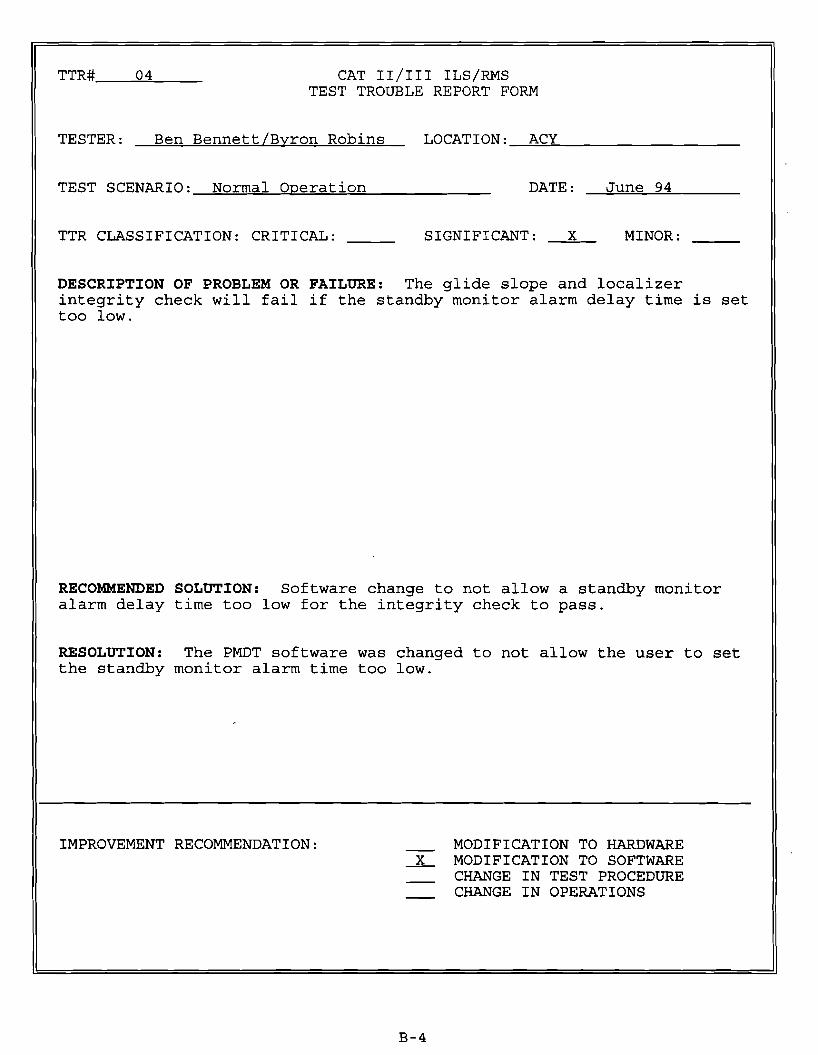
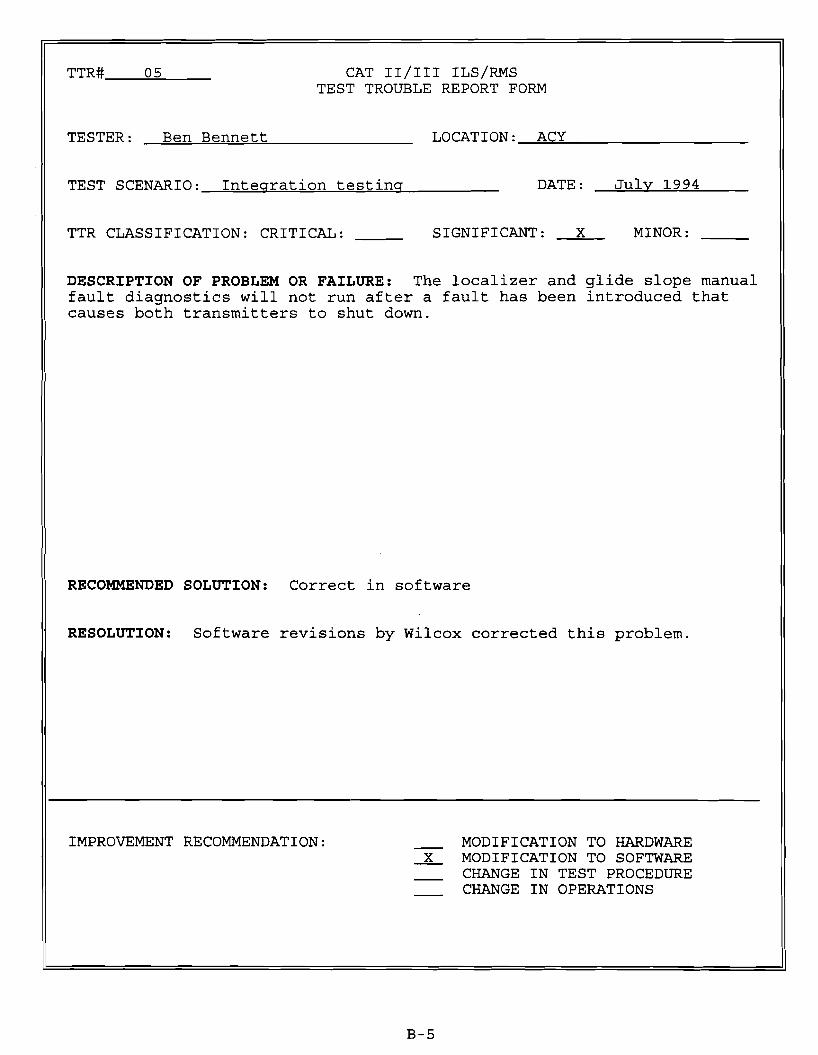
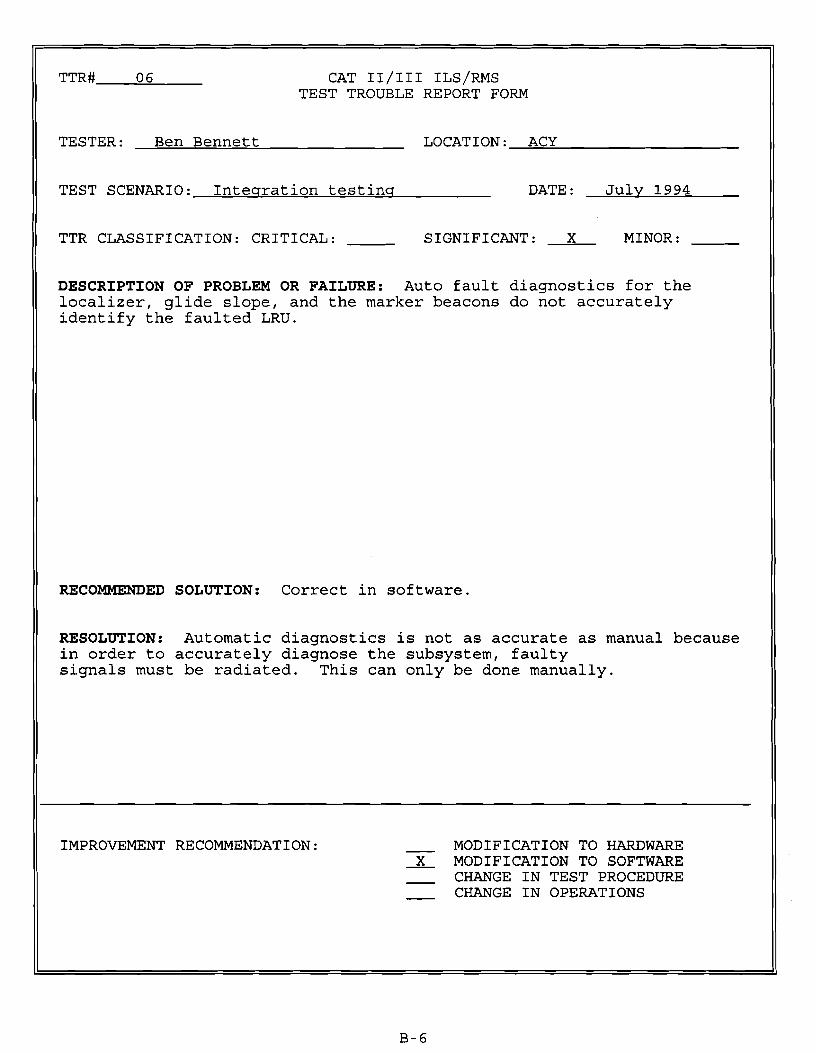
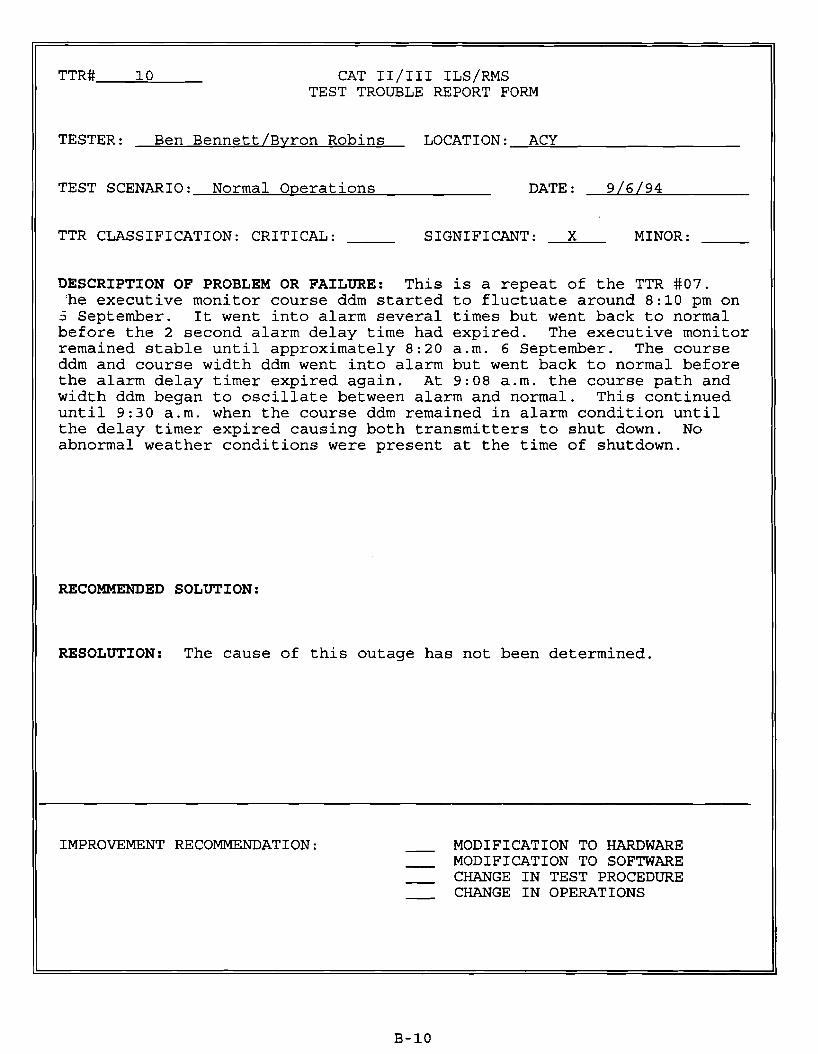
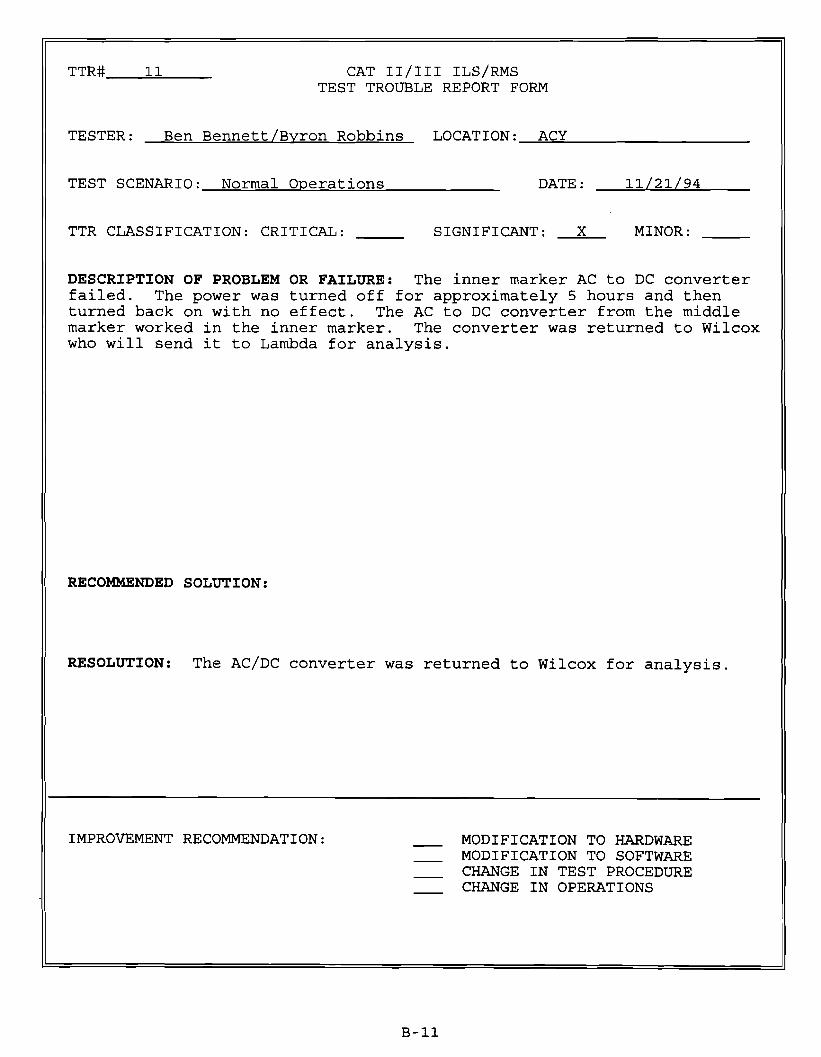
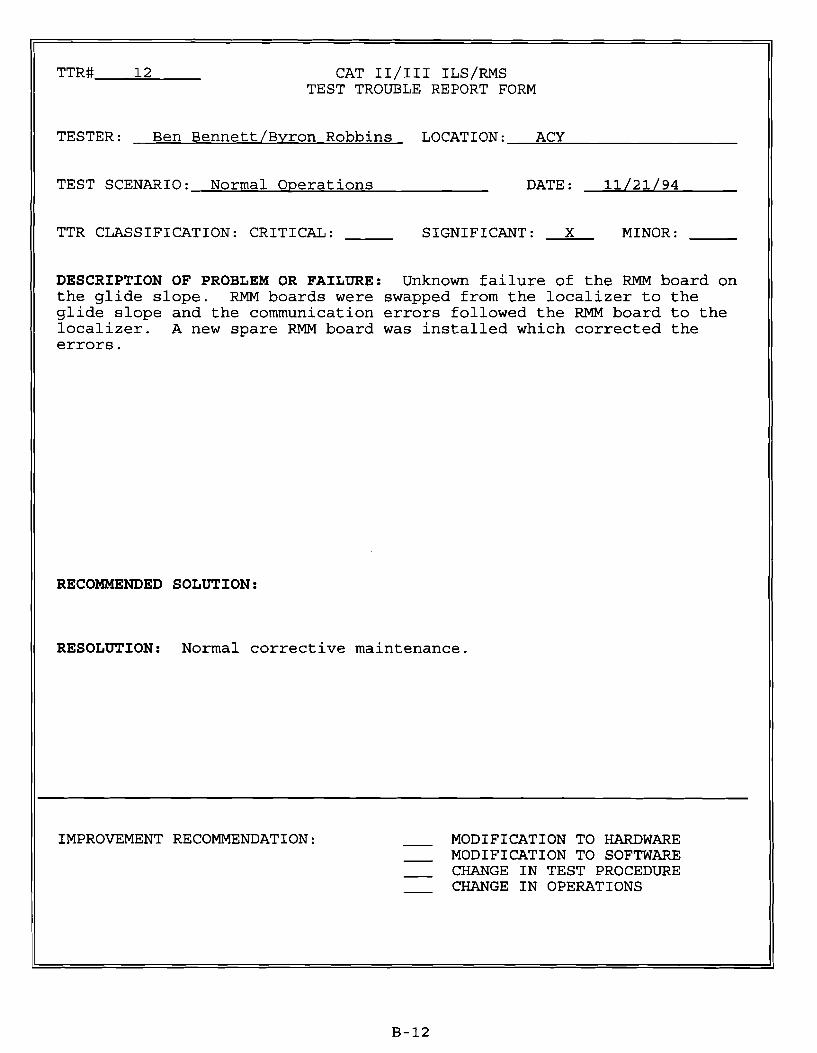
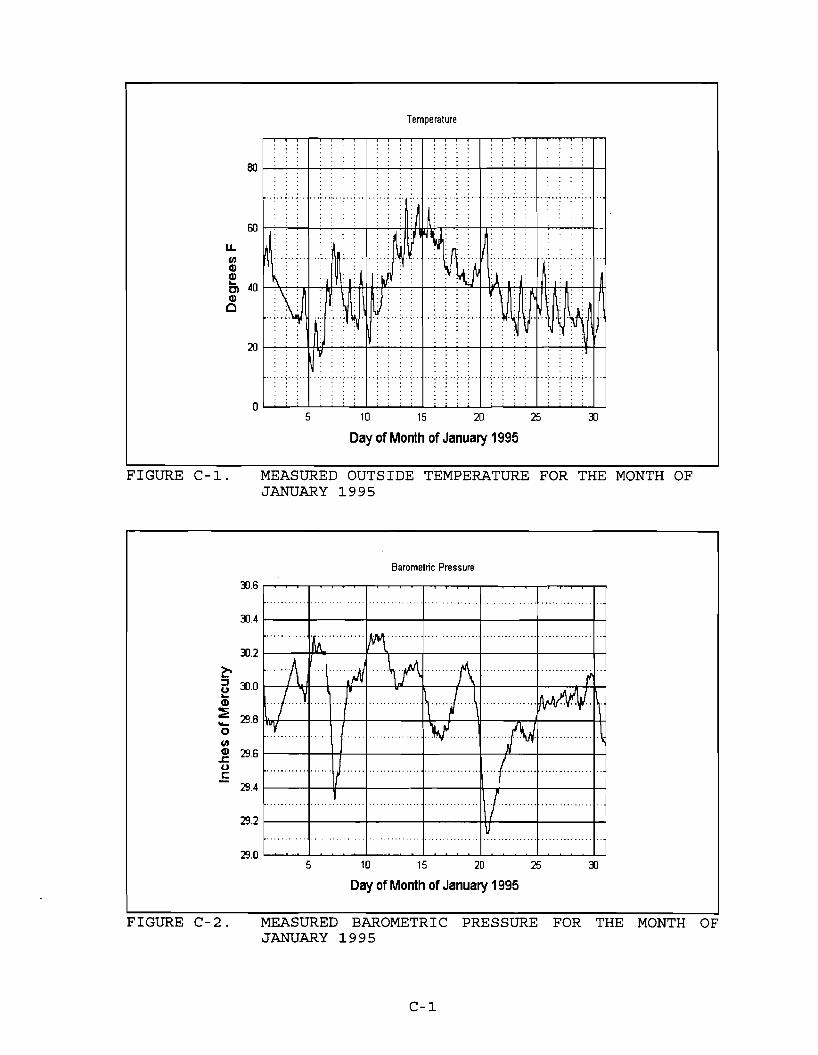

Inner Marker Beacon Idenl Keying
100
95 J 0 J Cg 0 - II
(0
90
85
C
~ OJ ~
II CD
80
75
~ 0 II
0
70
65
60 5 10 15 20 25
Day of Month of January 1995
FIGURE C-23 MONITORED INNER MARKER BEACON IDENT KEYING STATUS FOR THE MONTH OF JANUARY 1995
C-12
