jersey alcohol profile 2016 - government of jersey · source: jass 2010, 2012, 2014 and jols 2016...
TRANSCRIPT

Jersey Alcohol Profile 2016
Statistics Unit
1
Table of Contents
Summary ................................................................................................................... 4
Key findings ............................................................................................................... 4
Introduction ............................................................................................................... 5
Alcohol consumption ..................................................................................................... 6
Alcohol consumption per resident person aged 15 or over ...................................................... 6
Self-reported drinking patterns ..................................................................................... 9
Other characteristics of drinkers ................................................................................... 13
Teetotalism ............................................................................................................ 15
Binge drinking ......................................................................................................... 15
Drinking and pregnancy .............................................................................................. 17
Hazardous or harmful drinking ........................................................................................ 18
FAST .................................................................................................................... 19
Alcohol misuse ........................................................................................................ 22
Hospital admissions due to alcohol consumption ................................................................... 23
Alcohol-specific hospital admissions ............................................................................... 23
Deaths related to alcohol consumption .............................................................................. 25
Alcohol-related deaths (Office for National Statistics measure) .............................................. 25
Alcohol-attributable deaths (Public Health England measure) ................................................ 26
Liver disease ............................................................................................................. 28
Alcohol-related crime .................................................................................................. 29
Domestic violence .................................................................................................... 30
Evening street violence .............................................................................................. 30
Drink-driving .......................................................................................................... 30
Young people and alcohol .............................................................................................. 31
Drinking among children ............................................................................................. 31
Under 18 hospital admissions due to alcohol consumption ..................................................... 32
Social Security expenditure ............................................................................................ 33
Expenditure on benefits due to alcoholism ....................................................................... 33
Expenditure on benefits due to alcohol-related sickness and ailments (including alcoholism) ........... 34
Retail prices .............................................................................................................. 36

2
Household Expenditure ................................................................................................. 37
Overall household expenditure on alcohol ........................................................................ 37
Expenditure by alcohol type ........................................................................................ 38
Household expenditure by age, income and tenure ............................................................. 39
Definitions and glossary of terms ..................................................................................... 42
Background notes ....................................................................................................... 44
Data sources ........................................................................................................... 44
Comparisons ........................................................................................................... 45
Timeliness ............................................................................................................. 46
Methods ................................................................................................................ 46
Accuracy and reliability ............................................................................................. 47
Confidence intervals and statistical significance ................................................................ 47
Data quality and completeness ..................................................................................... 48
Contact details ........................................................................................................ 48
Appendix 1: Public Health England comparable indicators ....................................................... 49
Alcohol-specific hospital admission indicators ................................................................... 49
Alcohol mortality indicators ........................................................................................ 51
Liver disease indicators (including all liver disease and alcoholic liver disease) ............................ 54

3

4
Summary
This report presents statistics and recent trends of alcohol use in Jersey.
Information presented in this report is based on data provided by States of Jersey departments, survey
results and data processed by the Statistics Unit. Detailed information on the nature of sources and data
handling are given in the Background Notes section of this report.
Key findings
In Jersey, in 2016:
an average of 12 litres of pure alcohol was consumed per person aged 15 or over. The level of
consumption is similar to that reported for 2014 and 2015
alcohol consumption is around a sixth (17 per cent) less than a decade earlier, in 2006
Jersey has a similar level of alcohol consumption (per person aged 15 or over) to France,
Ireland and Poland but higher than Portugal and the UK
one in eight (12 per cent) respondents to the Jersey Opinions and Lifestyle Survey reported
that they never drink alcohol
around a quarter (26 per cent) of drinkers were found to be drinking at potentially hazardous
or harmful levels
around two-fifths (39 per cent) of 16 to 34 year old drinkers reported drinking five or more
units on a typical drinking day, exceeding the recommended daily limits for both males and
females
there were 470 referrals to the Drug and Alcohol Service for problematic drinking; of these
two-thirds (65 per cent) were male
almost 20,000 days of sickness and invalidity benefit were claimed for alcoholism in 2016
Over the period 2014 to 2016:
there were 39 alcohol-related deaths (Office for National Statistics definition), representing
2 per cent of all deaths in Jersey. The most common alcohol-related death was alcoholic liver
disease, accounting for two-thirds (64 per cent) of alcohol-related deaths during this period
one in six (16 per cent) of all recorded crimes over the three-year period were recorded as
involving alcohol
In 2017:
between June 2000 and June 2017 the price of alcohol increased at a higher rate than retail
prices generally (17 per cent greater)

5
Introduction
The States of Jersey Statistics Unit now provides population level health statistics.1 This report is the
latest in a series of reports which examines the effect of alcohol on Islanders’ health. It covers topics
such as drinking habits and behaviours among adults (aged 16 or over) and school children (aged 11 to
15), drinking-related ill health and mortality, pricing of alcohol, alcohol-specific hospital admissions and
alcohol-related prices and expenditure. The report contains both previously published information and
new analyses.
A number of States of Jersey Departments have provided data for this report, including the Health and
Social Services Department, Social Security Department and the States of Jersey Police.
Comparisons are presented with data published by Public Health England (PHE), the UK Office for
National Statistics (ONS) and NHS Digital. International comparisons on alcohol consumption are included
using data published by the Organisation for Economic Co-operation and Development (OECD) and the
World Health Organisation (WHO).
Comparisons made between different jurisdictions or between two time periods are tested for statistical
significance. Only statistically significant differences have been described using terms such as ‘higher’,
‘lower’, ‘increase’ or ‘decrease’.
For further details about the analysis, statistical testing and comparison sources, see the Background
Notes section of this report.
1 The analytical function of the Public Health Directorate’s Health Intelligence Unit moved to the Statistics Unit in May 2017.

6
Alcohol consumption
The information presented in this section relates to drinking patterns of:
resident adults (aged 16 or over)
consumption by residents aged 15 or over (excluding visitors and seasonal workers) for
international comparison
The Department of Health in England has recently updated the advice for alcohol consumption:2
Current advice (published January 2016):
The department advises:
men and women should not regularly drink more than 14 units a week
drinking should be spread over three or more days if regularly drinking as much as 14 units a week
pregnant women should avoid alcohol altogether
Previous advice (prior to January 2016):
Drinking more than 2 to 3 units a day for women and 3 to 4 units a day for men was classified as drinking
at increasing risk to health. Drinking twice this amount per day was classified as being at higher risk of
alcohol-related harm.
To allow for the comparison over time this report uses ‘previous’ advice unless explicitly stated.
Alcohol consumption per resident person aged 15 or over
The Statistics Unit uses data from the Customs and Immigration Service on quantities of dutiable goods
imported into the Island each year to produce a measure of pure alcohol consumption per resident
person aged 15 or over. For further information on the methodology used, please see the Background
Notes section of this report.
In 2016, total alcohol consumption was 12 litres of pure alcohol per person aged 15 or over.
2 Department of Health (2016), UK Chief Medical Officers’ Alcohol Guidelines Review: Summary of the proposed new guidelines, published January 2016, www.gov.uk

7
The latest figure available for the UK shows that in 2015 per capita consumption was 10 litres of pure
alcohol per person aged 15 or over.3 The comparable figure for Jersey in 2015 was 2 litres higher, at 12
litres of pure alcohol per person aged 15 or over.
The World Health Organisation (WHO) estimates that in 2010 the worldwide total alcohol consumption
was 6.2 litres of pure alcohol per person aged 15 years or older. Projections by WHO suggest this rose to
6.4 litres in 2016.4
Compared to European countries, per capita consumption of alcohol in Jersey is similar to that in France,
Ireland and Poland but higher than in Portugal and the UK, as shown in Figure 1.
3 Tettenborn, Mark (August 2016), Statistical Handbook 2015, British Beer & Pub Association (BBPA), London, Brewing Publications Limited 4 World Health Organisation, World Health Statistics 2017: monitoring health for the SDGs, Sustainable Development Goals, available from apps.who.int

8
Figure 1: Alcohol consumption in Europe (per person aged 15 or over), 2000-2016
Source: Statistics Unit, OECD
Jersey consumes a greater quantity of alcohol per person aged 15 or over than the average for OECD
countries,5 as shown in Figure 2.
Figure 2: Alcohol consumption compared to average of OECD countries (per person aged 15 or over), 2000-2016
Source: Statistics Unit, OECD
5 Organisation for Economic Co-operation and Development, Non-medical causes of health: alcohol consumption, updated 7 July 2015, available from www.stats.oecd.org
0
2
4
6
8
10
12
14
16
18
2000 2001 2002 2003 2004 2005 2006 2007 2008 2009 2010 2011 2012 2013 2014 2015 2016
LIT
RES O
F P
URE A
LCO
HO
L
Jersey France Ireland Poland Portugal United Kingdom
0
2
4
6
8
10
12
14
16
18
2000 2001 2002 2003 2004 2005 2006 2007 2008 2009 2010 2011 2012 2013 2014 2015 2016
LIT
RES O
F P
URE A
LCO
HO
L
Jersey OECD average

9
Self-reported drinking patterns
The principal source of data on the drinking behaviour of adults in Jersey is the Jersey Opinions and
Lifestyle Survey (JOLS)6 (formerly the Jersey Annual Social Survey, JASS), conducted by the Statistics
Unit. This is an annual survey covering adults aged 16 or over who are living in private households in the
Island.
Source: JASS 2010, 2012, 2014 and JOLS 2016
6 States of Jersey Statistics Unit, Opinion and Lifestyle Survey, published 30 November 2016, available from www.gov.je

10
Respondents to JOLS 2016 were asked about their drinking behaviours. Figure 3 shows that a greater
proportion of males than females drink at least two or more times each week.
Figure 3: How often respondents drink alcohol, by sex 2016
Source: JOLS 2016
The JOLS 2016 survey also asked respondents about the amount of alcohol they drank on a typical
drinking day, in terms of units of alcohol. Figure 4 shows one unit of different types of alcohol.
Figure 4: Alcohol Units
Around two-fifths (39 per cent) of 16 to 34 year old who drank alcohol reported usually drinking five or
more units when they drank, exceeding the previously recommended daily limits for both males and
females. This proportion decreased with age, with fewer than one in ten (8 per cent) of those aged 65 or
over usually drinking five or more units.
9%
15%
15%
20%
23%
26%
33%
26%
20%
13%
0% 20% 40% 60% 80% 100%
Male
Female
Never Once per month 2-4 times per month 2-3 times per week 4 or more times per week
11
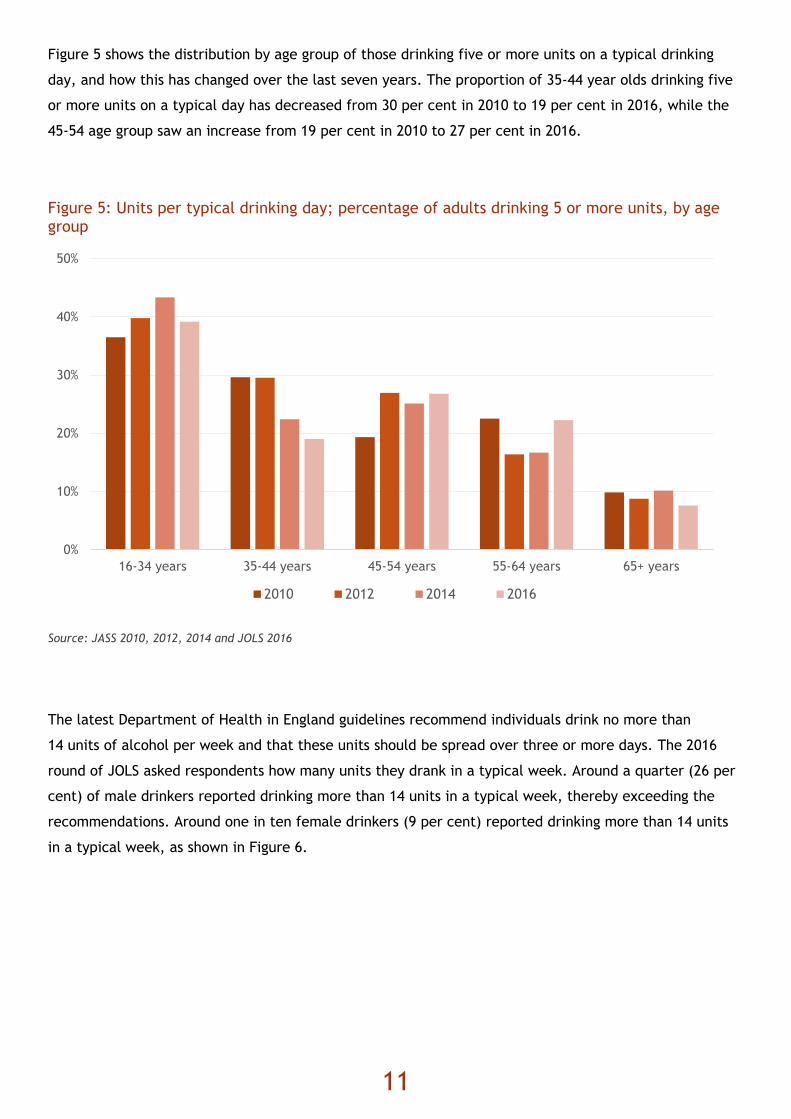
Figure 5 shows the distribution by age group of those drinking five or more units on a typical drinking
day, and how this has changed over the last seven years. The proportion of 35-44 year olds drinking five
or more units on a typical day has decreased from 30 per cent in 2010 to 19 per cent in 2016, while the
45-54 age group saw an increase from 19 per cent in 2010 to 27 per cent in 2016.
Figure 5: Units per typical drinking day; percentage of adults drinking 5 or more units, by age group
Source: JASS 2010, 2012, 2014 and JOLS 2016
The latest Department of Health in England guidelines recommend individuals drink no more than
14 units of alcohol per week and that these units should be spread over three or more days. The 2016
round of JOLS asked respondents how many units they drank in a typical week. Around a quarter (26 per
cent) of male drinkers reported drinking more than 14 units in a typical week, thereby exceeding the
recommendations. Around one in ten female drinkers (9 per cent) reported drinking more than 14 units
in a typical week, as shown in Figure 6.
0%
10%
20%
30%
40%
50%
16-34 years 35-44 years 45-54 years 55-64 years 65+ years
2010 2012 2014 2016

12
Figure 6: Units per typical drinking week, by sex, 2016
Source: JOLS 2016
Around one in three male drinkers between 45 and 64 years of age drank more than the recommended
maximum level. The 45-54 year old age group had the greatest proportion of females drinking more than
the weekly recommended maximum, as shown in Figure 7.
Figure 7: Proportion of drinkers drinking more than 14 units in a typical week, by age and sex
Source: JOLS 2016
27%
47%
25%
27%
22%
16%
13%
6%
13%
3%
0% 20% 40% 60% 80% 100%
Male
Female
1 to 4 5 to 9 10 to 14 15 to 19 20 or more
20%22%
32%
36%
25%
5%
11%
18%
7%
5%
16-34 years 35-44 years 45-54 years 55-64 years 65+ years
Male Female

13
The Department of Health in England recommendations also suggest having several drink-free days each
week.7 Four-fifths (80 per cent) of drinkers reported having three or more drink free days in a typical
week. In contrast, the proportion of those who reported having no drink free days in a typical week was
6 per cent.
A greater proportion of older drinkers, those aged 65 or over, reported having no drink free days
(16 per cent) compared to around 1 per cent of those aged 16 to 44 years, and fewer than one in ten of
those aged 45 to 54 years (8 per cent) and aged 55-64 years (9 per cent).
Of those drinkers who report drinking more than 14 units in a typical week, around four-fifths
(82 per cent) said they had at least one drink free day.
Other characteristics of drinkers
JOLS 2016 data can be used to look at differences in drinking patterns by other characteristics of the
population:
place of birth
o three-fifths (60 per cent) of those born elsewhere in the British Isles and two-fifths
(42 per cent) of Jersey born residents reported drinking at least twice a week. Around a
quarter (27 per cent) of those born outside of the British Isles reported drinking at least
twice a week
occupation
o the percentage of those who drink at least twice a week has decreased in all occupational
groups since 2010. However, there remain differences between groups, with senior
managerial (62 per cent) and technical (60 per cent) groups the highest, and routine
(27 per cent) and clerical (29 per cent) the lowest
smokers and non-smokers
o around two-fifths of those who currently smoke also drink more than 5 units on a typical
drinking day (40 per cent of daily smokers and 42 per cent of occasional smokers). This
compares with around a quarter of ex-smokers (28 per cent of those who used to smoke
daily and 25 per cent of former occasional smokers), and a fifth (20 per cent) of those who
have never smoked
economic activity
o over half (55 per cent) of those unemployed and looking for work who drank reported that
they drank five or more units on a typical drinking day, compared to 28 per cent of
employed persons and 17 per cent of non-economically active respondents (Figure 8)
7 Department of Health (2016), UK Chief Medical Officers’ Alcohol Guidelines Review: Summary of the proposed new guidelines, published January 2016, www.gov.uk

14
Figure 8: Percentage drinking five or more units on a typical drinking day, by employment group, 2016
Source: JOLS 2016
household income
o the proportion of those drinking at least twice a week in the top income bracket
(£90,000 or more) was double that in the lowest income bracket (less than £10,000)
(Figure 9)
o the number of units drunk on a typical day did not show significant variation by household
income, indicating that although those in higher income brackets may drink more
frequently, when they do it is not necessarily at higher levels.
Figure 9: Percentage of adults drinking on two days a week or more, by household income level, 2016
Source: JOLS 2016
28%
17%
55%
Employed Non-economically active (incl.unable to work due to sickness)
Unemployed and looking for work
30%27%
41% 40% 41%44%
56%54%
73%
61%
Less than£10k
£10k-£19k £20k-£29k £30k-£39k £40k-£49k £50k-£59k £60k-£69k £70k-£79k £80k-£89k £90k ormore

15
Teetotalism
One in eight (12 per cent) of respondents to JOLS 2016 reported that they never drink alcohol (9 per cent
of males and 15 per cent of females). This proportion has remained at a similar level since 2008.
The breakdown of those who never drink alcohol by age and sex is shown in Figure 10. Around one in four
(25 per cent) females aged 65 years or over reported never drinking alcohol. In contrast, 5 per cent of
males aged 16 to 34 years reported that they never drink alcohol.
Figure 10: Respondents who reported never drinking alcohol, by age and sex
Source: JOLS 2016
In Great Britain, one in five adults (21 per cent) reported that they do not drink alcohol.8
Binge drinking
In this report, the definition of binge drinking is based on the previous Department of Health in England
alcohol drinking recommendations. Specifically, this concerns males who drink more than 8 units on one
day (around four pints of normal strength beer or three-quarters of a bottle of wine) and females who
drink 6 units or more on one day (around three pints of normal strength beer or two large glasses of
wine).
8 Office for National Statistics, Adult drinking habits in Great Britain: 2005 to 2016, published 3 May 2017, available from www.ons.gov.uk
5%
13%
6%
9%
11%
8%
16%
6%
11%
15%
25%
15%
16-34 years 35-44 years 45-54 years 55-64 years 65+ years All ages
Male Female

16
Figure 11 shows the binge drinking patterns as reported in JOLS 2016: 43 per cent of male drinkers and
26 per cent of female drinkers reported drinking at twice the recommended daily levels at least
monthly.
Figure 11: Frequency of binge drinking, by sex (of those who drink alcohol)
Source: JOLS 2016
Younger age groups were more likely to binge drink than their older counterparts; 45 per cent of
16 to 34 year old drinkers reported binge drinking at least monthly, three times the proportion of
drinkers aged 65 or over (15 per cent). A similar pattern of binge drinking was seen in Great Britain as
reported by the Office for National Statistics.9
The proportion of male drinkers who binge drink at least monthly has risen over the last seven years,
from 32 per cent of males in 2010 to 43 per cent in 2016, while the proportion of female drinkers who
binge drink at least monthly has remained relatively flat over this period.
9 Office for National Statistics, Adults Drinking Habits in Great Britain: 2005 to 2016, published 3 May 2017, available from www.ons.gov.uk
21%
39%
37%
36%
23%
18%
17%
8%
0% 20% 40% 60% 80% 100%
Males
Females
Never Less than monthly Monthly Weekly Daily

17
Drinking and pregnancy
Details about alcohol consumption during pregnancy are collected by the Maternity Department as part
of pre-natal checks.
Of those woman who gave birth in 2016:
95 per cent reported not drinking during pregnancy
more than one in three (37 per cent) reported that they did not drink prior to getting pregnant
those woman who said they drank during pregnancy reported drinking only occasionally

18
Hazardous or harmful drinking
Hazardous drinking, as defined by the WHO,10 is a pattern of alcohol consumption carrying risks of
physical and psychological harm to the individual. Harmful drinking denotes the most hazardous use of
alcohol, at which damage is likely. A potential outcome of harmful drinking is alcohol dependence.
Levels of harmful and hazardous drinking in Jersey have been derived from two data sources:
the findings from JOLS 2016 where respondents were asked to answer a set of questions from a
4-item screening tool (FAST)11
data on referrals to the Drug and Alcohol Service has been analysed to provide information on
problem drinkers and their use of the service.
10 Saunders J.B., Aasland O.G., Babor T.F., et al, Development of the Alcohol Use Disorders Identification Test (AUDIT): WHO Collaborative Project on Early Detection of Persons with Harmful Alcohol Consumption-II, Addiction, 1993;88791- 804 11 Public Health England, Fast Alcohol Screening Test (FAST), Alcohol learning resources, available from www.alcoholearningcentre.org.uk
19
FAST
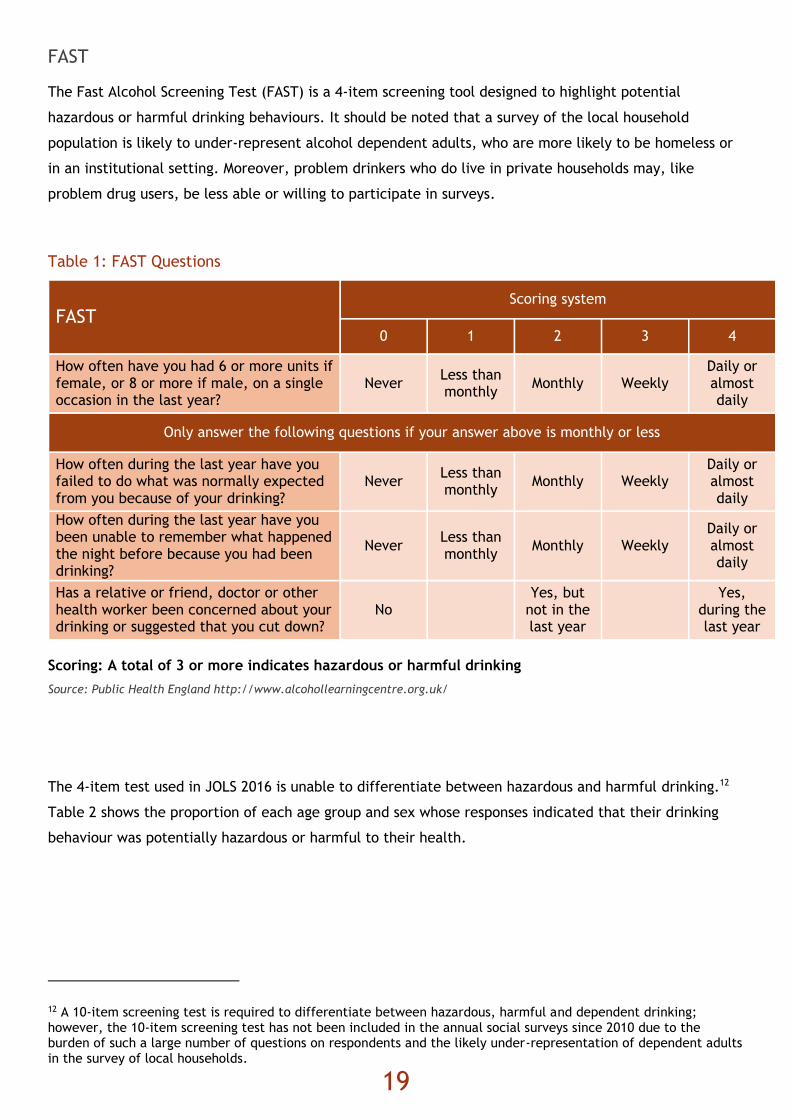
The Fast Alcohol Screening Test (FAST) is a 4-item screening tool designed to highlight potential
hazardous or harmful drinking behaviours. It should be noted that a survey of the local household
population is likely to under-represent alcohol dependent adults, who are more likely to be homeless or
in an institutional setting. Moreover, problem drinkers who do live in private households may, like
problem drug users, be less able or willing to participate in surveys.
Table 1: FAST Questions
FAST Scoring system
0 1 2 3 4
How often have you had 6 or more units if female, or 8 or more if male, on a single occasion in the last year?
Never Less than monthly
Monthly Weekly Daily or almost daily
Only answer the following questions if your answer above is monthly or less
How often during the last year have you failed to do what was normally expected from you because of your drinking?
Never Less than monthly
Monthly Weekly Daily or almost daily
How often during the last year have you been unable to remember what happened the night before because you had been drinking?
Never Less than monthly
Monthly Weekly Daily or almost daily
Has a relative or friend, doctor or other health worker been concerned about your drinking or suggested that you cut down?
No Yes, but
not in the last year
Yes,
during the last year
Scoring: A total of 3 or more indicates hazardous or harmful drinking
Source: Public Health England http://www.alcohollearningcentre.org.uk/
The 4-item test used in JOLS 2016 is unable to differentiate between hazardous and harmful drinking.12
Table 2 shows the proportion of each age group and sex whose responses indicated that their drinking
behaviour was potentially hazardous or harmful to their health.
12 A 10-item screening test is required to differentiate between hazardous, harmful and dependent drinking; however, the 10-item screening test has not been included in the annual social surveys since 2010 due to the burden of such a large number of questions on respondents and the likely under-representation of dependent adults in the survey of local households.

20
Table 2: Percentage of hazardous or harmful drinkers (FAST score of 3 or more, excluding non-drinkers), by age and sex
Age Males (%) Females (%) All Persons (%)
16-34 years 48 25 38
35-44 years 28 17 22
45-54 years 31 22 27
55-64 years 32 10 21
65 years and older 17 2 10
16+ population 34 17 26
Source: JOLS 2016
Around one in four (26 per cent) resident adult drinkers were found to be drinking at potentially
hazardous or harmful levels, with a higher proportion of males (34 per cent) than females (17 per cent).
A greater proportion of drinkers born in Jersey (32 per cent) or elsewhere in the British Isles (25 per
cent) were found to be drinking at hazardous or harmful levels compared to those born elsewhere
(11 per cent). There was little difference in the pattern of hazardous or harmful drinking by education
level or by tenure, but a difference in employment status and profession was found as shown in
Figure 12.

21
Figure 12: Percentage of hazardous or harmful drinkers (FAST score of 3 or more, excluding non-
drinkers), by employment status and profession
Source: JOLS 2016
Notes: Routine work refers to routine, semi-routine, manual or service occupations, such as cleaners, security guards and
receptionists. Technical professions refer to technical or craft occupations such as mechanics, plumbers and electricians.
Clerical or intermediate occupations include, for example, secretaries, clerical workers and nursery nurses. Professional
occupations (normally requiring a professional qualification) include scientists, accountants or social workers. Middle or junior
managers refer to office managers, bank managers and publicans, for example. Senior managers (usually responsible for
planning, organising and co-ordinating work) refer to chief executives or finance managers, for example.
Using the results of JOLS 2016, it is estimated that around 21,000 resident adults have drinking behaviour
that is potentially hazardous or harmful. Of these, around 14,000 are male and around 7,000 are female;
the largest number of these being in the youngest age group, 16-34 years (6,000 males and
3,000 females).
27%
20%
39%
18%
45%
19%
32%
28%
20%
Em
plo
yed
Non-e
conom
ically a
cti
ve
Unem
plo
yed &
lookin
g f
or
work
Routi
ne
Technic
al
Cle
rical
Pro
fess
ional
Mid
dle
managers
Senio
r M
anagers
Employment status Profession

22
Alcohol misuse
There were 640 people referred to the Drug and Alcohol Service in Jersey in 2016; of these 470 were for
problematic or dependent drinking13 (73 per cent). The majority (450 referrals) were for alcohol
treatment only, while around 20 were for alcohol problems alongside other substances.
The number of people seeking help for problems with alcohol has increased over the last 10 years, from
around 320 in 2006 to 470 in 2016, as shown in Figure 13.
Figure 13: Referrals to the Drug and Alcohol Service for problems with alcohol, 2006-2016
Source: Drug & Alcohol Service
Of those referred for alcohol problems, two-thirds (65 per cent) were male; the 40-49 year old age group
comprised the greatest proportion of referrals (28 per cent). Around two-thirds (67 per cent) of 2016
referrals for alcohol problems had been seen before by the service. The majority of those referred for
alcohol problems had been referred by professionals working in health and social services (52 per cent);
around two-fifths (38 per cent) had self-referred to the Service.
13 The Drug and Alcohol Service is available to anyone who would like help with their alcohol consumption; this includes people who have approached the service themselves as they require help to cut down rather than stop drinking, they wish to stop drinking altogether or those who have been referred by medical or other professionals.
320
330
390 410
370 390
400
340
430
490
470
2 0 0 6 2007 2008 2009 2010 2011 2012 2013 2014 2015 2016

23
Hospital admissions due to alcohol consumption
This section presents information on completed hospital admission episodes (referred to here as hospital
admissions) with diseases, injuries and conditions that can be attributed to alcohol consumption.
There are a number of measures of alcohol-attributable hospital admissions available; only alcohol-
specific hospital admissions have been included in this report:14
Alcohol-specific hospital admissions
admissions due to conditions where alcohol is causally implicated in all cases of the conditions
(those conditions wholly attributable); for example, alcohol-induced behavioural disorders and
alcohol-related liver cirrhosis. The alcohol-attributable fraction (AAF) is 1.0 (100 per cent of
cases are considered to be caused by alcohol).
AAFs take account of patient sex, age and diagnosis to estimate the number of admissions attributable to
alcohol consumption. For further information on the methodology used, see the Background Notes
section of this report.
Alcohol-specific hospital admissions
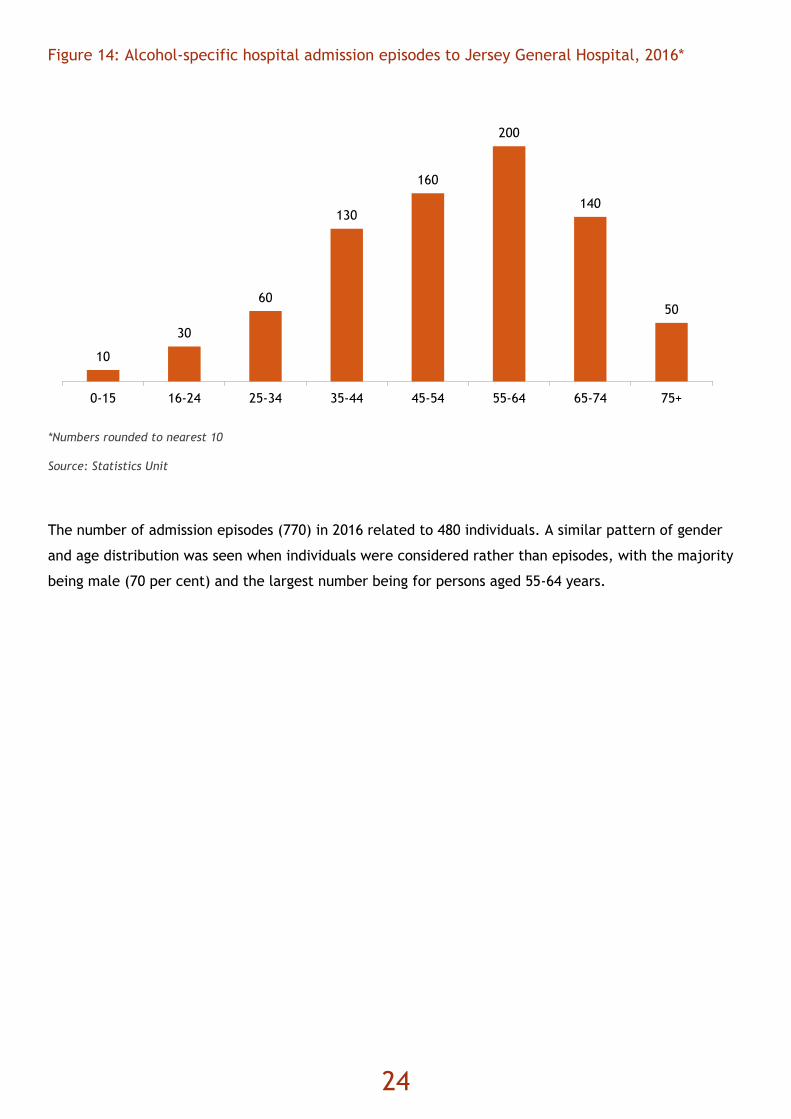
In 2016, there were 770 admission episodes to the Jersey General Hospital for a condition that was
wholly attributable to alcohol (AAF equal to 1.0). This latest number of such admission episodes is
150 fewer than the previous year (920 in 2015) and the lowest number of episodes seen in the last five
years, since 2012. The majority of admissions were male (72 per cent) and the largest number of
admission episodes were for persons aged 55-64 years, as shown in Figure 14.
The alcohol-specific hospital admission age standardised rate for Jersey was 747 per 100,000 population
for calendar year 2016. The rate for hospital admissions of males was significantly higher than that for
females. However, the latest rate for males was significantly lower than the previous four years whereas
the female rate has remained flat over this period.
Public Health England publish figures for England based on financial years; for 2015-16 the alcohol
specific age standardised hospital admissions rate was 583 per 100,000, with English regions ranging from
246 to 1,681 per 100,000.15 Comparisons with the PHE indicators are shown in Appendix 1.
14 A small number of episodes for 2016 were yet to be coded at time of publication. This is unlikely to affect those episodes for alcohol specific admissions, although these should still be treated as provisional. It was deemed more likely that these uncoded admissions may impact on the broader measures of alcohol-hospital admissions which is why they have not been included in this report. 15 Public Health England, Local Alcohol Profile 2017, published 3 May 2017, available from www.lape.org.uk
24
Figure 14: Alcohol-specific hospital admission episodes to Jersey General Hospital, 2016*
*Numbers rounded to nearest 10
Source: Statistics Unit
The number of admission episodes (770) in 2016 related to 480 individuals. A similar pattern of gender
and age distribution was seen when individuals were considered rather than episodes, with the majority
being male (70 per cent) and the largest number being for persons aged 55-64 years.
10
30
60
130
160
200
140
50
0-15 16-24 25-34 35-44 45-54 55-64 65-74 75+

25
Deaths related to alcohol consumption
Alcohol consumption can be related to deaths from certain types of disease, such as cirrhosis of the
liver, and in some cases may be associated with other causes of death, such as strokes.
There are two measures of deaths due to alcohol consumption currently used in the UK;
the first is the National Statistics definition of alcohol-related deaths16 used by the Office for
National Statistics (ONS). This definition only includes those causes regarded as being the most
directly related to alcohol consumption, as well as certain liver diseases, even when alcohol is
not specifically mentioned on the death certificate
the second measure is that produced by Public Health England (PHE) which also includes all
conditions which are considered to be partially caused by alcohol, such as cancer of the mouth
For comparative purposes, both measures have been used to analyse deaths in Jersey linked to alcohol
consumption and are presented alongside UK data calculated using the same methodology.
Alcohol-related deaths (Office for National Statistics measure)
16 Office for National Statistics, Alcohol-Related Deaths in the United Kingdom registered in 2016, published 7 November 2017, available from www.ons.gov.uk

26
The number of alcohol-related deaths for 2014-2016 (39 deaths), is similar to that reported for the
previous three-year period, 2011-2013 (46 deaths) and lower than that reported six years ago, 2008-2010
(60 deaths).
Alcohol-related deaths were responsible for around 500 years of potential life lost17 (YOLL) over the
three-year period, 2014-2016, (400 years of male life and 100 years of female life).
Age-standardised rates (ASRs) can be used to compare mortality rates of different jurisdictions. The
2014-2016 alcohol-related mortality rate for Jersey is 14 per 100,000 population. The latest available
data for the UK shows that in 2016, the alcohol related death rate was similar, at 15 per 100,000
population.18
The Jersey ASR for males for the period 2014-2016 was 18 per 100,000, similar to the 2016 rate for
England of 19 per 100,000.19
Alcohol-attributable deaths (Public Health England measure)
Public Health England (PHE) report alcohol deaths20 using several definitions which aim to capture the
wider burden of alcohol consumption on population health and health service use. These definitions
include conditions where alcohol is the direct cause of all cases (alcohol-specific or wholly-attributable
conditions), as well as conditions where alcohol is causally implicated in some, but not all, cases of the
outcome (alcohol-related or partially-attributable conditions).
Jersey alcohol-specific mortality, chronic liver disease mortality and alcohol-related mortality (the
broader measure of deaths attributable to alcohol, as shown in the infographic) are similar to the
average for England. Alcohol-attributable mortality indicators for Jersey have remained essentially flat
since 2008, as shown in Table A2 and Figure A2 in Appendix 1.
17 Years of Life lost (YOLL) is a measure of premature mortality that quantifies the years not lived by individuals who die under 75 years of age (an arbitrary cut off used to enable comparisons). For more information, see Background Notes. 18 Office for National Statistics, Alcohol-Related Deaths in the United Kingdom registered in 2016, published 7 November 2017, available from www.ons.gov.uk 19 Due to the relatively small number of deaths, annual and female rates have not been calculated for Jersey. 20 Public Health England, Local Alcohol Profile 2017, published 3 May 2017, available from www.lape.org.uk

27
28
Liver disease
Liver disease accounts for around 20 premature deaths a year in Jersey.21 There are three primary risk
factors: alcohol, obesity and viral hepatitis infections. For the purposes of this report, mortality rates
that consider all liver diseases and alcoholic liver disease are compared to comparable Public Health
England rates. For the detailed comparisons and graphs, see Appendix 1.
The premature mortality rate for liver diseases in Jersey (19 per 100,000 population) was similar to the
English average (18 per 100,000) for 2014-2016. For alcoholic liver disease, the premature mortality rate
was also similar to that of the English average. There has been essentially no change in the rate of
premature death for liver disease or alcoholic liver disease in Jersey since 2010, as shown in the Figure
A3 in Appendix 1.
A report released by the Statistics Unit in September 2017 considered the number of currently registered
GP patients recorded on disease registers for long-term conditions and the projected numbers of people
with these conditions over the next 10 and 20 years.22 The report showed that in 2016 there were some
800 people on the disease register for chronic liver disease. This number is projected to increase to
around 900 by 2026.
21 States of Jersey Statistics Unit, Premature Deaths 2013-2015, published 28 March 2017, available from www.gov.je 22 States of Jersey Statistics Unit, Disease Projections 2016-2026, published 14 September 2017, available from www.gov.je

29
Alcohol-related crime
Data on alcohol-related crime was provided by the States of Jersey Police.23
A total of 2,905 crimes were recorded in 2016, giving a crude rate of 28 crimes per 1,000 population.
Table 3 gives the number of crimes recorded over the three-year period 2014-2016, along with the
proportion of those where alcohol was recorded as being involved. For more information on crime
statistics in Jersey see Background Notes.
Around one in six (16 per cent) of all crimes recorded over the latest three-year period, 2014-2016, had
alcohol involvement. Around a quarter (27 per cent) of recorded offences against the person had alcohol
involved; this category includes common assault, grave and criminal assault and indecent assault. More
than two-fifths (44 per cent) of recorded assaults on police and prison officers had alcohol involvement.
23 Some crime figures can be affected by campaigns run by the Police, such as efforts focused on public order offences or licensing enforcement, as well as the reporting and recording of crimes, therefore time series data are not presented here.

30
Table 3: Offences recorded by the States of Jersey Police, 2014-2016
Type of Crime Total Offences Proportion recorded as
involving alcohol (%)
Acquisitive crime 2,300 8
Burglary 500 4
Offences against property 1,600 9
Offences against the person 3,800 27
Drug offences 700 12
Other offences 300 16
Total offences 9,100 16
*Numbers rounded to nearest 100
Source: States of Jersey Police
Domestic violence
In 2016, there were nearly 1,000 domestic violence incidents reported to the States of Jersey Police. Of
these, around 300 were domestic violence assaults. More than two-fifths (44 per cent) of these assaults
were recorded as having alcohol involvement, as recorded by the officer attending the scene. It is likely
that this proportion represents an underestimate since incidents where no suspect or offender is present
are not recorded as involving alcohol.
Evening street violence
The number of recorded incidents of evening street violence has reduced from more than 300 in 2012 to
around 200 in 2016. In the latest year, around 90 incidents were recorded as involving alcohol by the
officer at the scene.
Drink-driving
140 drink-driving incidents were recorded by the States of Jersey Police in 2016; 30 involved a road
traffic collision or hit and run incident. The majority of drink-drive incidents in 2016 were committed by
males (73 per cent); half (52 per cent) were committed by 31-50 year olds (males and females).

31
Young people and alcohol
The information presented in this chapter relates to drinking patterns of children in Jersey. Two main
sources of information are used to describe drinking patterns and the effects of alcohol use by children.
The first source is a survey of school children,24 which asks children about their health and lifestyle
behaviours. This survey was last run in 2014 and data presented in the last 2014 alcohol profile. The
second source is hospital admission data, taken from the Hospital computer system and analysed by the
Statistics Unit. For further information on both of these sources, please see the Background Notes
section of this report.
Drinking among children
The 2014 Young People’s Health and Lifestyle survey report25 contains information on the drinking
behaviour of children aged 12-15 in secondary schools in Jersey.
24 States of Jersey Public Health Intelligence Unit, A picture of Health Jersey 2014: Reflections on the health and lifestyle of young people ages 10-15 years, published 2 March 2015, available from www.gov.je 25 States of Jersey Public Health Intelligence Unit, A picture of Health Jersey 2014: Reflections on the health and lifestyle of young people ages 10-15 years, published 2 March 2015, available from www.gov.je

32
The key findings for 2014 were:
around half (52 per cent) of 12-13 year olds report having never drunk alcohol, decreasing to one
in five (20 per cent) of 14-15 year olds. These proportions have increased since 2010, when 30 per
cent of 12-13 year olds and 9 per cent of 14-15 year olds reported having never drunk alcohol
boys were more likely to have drunk alcohol in the 12-13 age group, while equal proportions of
girls and boys had drunk alcohol in the older age group (14-15 years)
1 in 6 (16 per cent) of 14-15 year olds had drunk alcohol in the seven days prior to the survey.
This proportion has declined steadily since 1998, when 54 per cent of pupils in this age group
reported drinking in the previous week, to 40 per cent of pupils in 2006 and 36 per cent in 2010
the proportion of young people who reported they drank in the previous seven days continues to
be lower than in the UK and lower than in Guernsey
around three-fifths (62 per cent) of pupils who drank alcohol in the last week did so on one day
only
pupils who drank in the previous week drank a mean of 7 units of alcohol. In England this figure
was 8 units of alcohol
cider was drunk by the greatest percentage of young people in the seven days prior to the survey,
followed by spirits and beer. The top three drinks consumed were (in descending order): spirits,
wine and cider by girls and cider, beer and spirits by boys
two-fifths (40 per cent) of 14-15 year olds reported having been “really drunk” at least once in
their life
For more information on the drinking habits of young people in Jersey, see the report ‘A picture of
Health Jersey 2014: Reflections on the health and lifestyle of young people ages 10-15 years’.26 The
next round of the school survey is scheduled to run in 2018.
Under 18 hospital admissions due to alcohol consumption
Over the period 2014-2016, there were 50 episodes of children under 18 admitted to hospital with a
primary or secondary diagnosis for an alcohol-specific condition. The number of episodes related to 40
individuals, with the number of admission episodes per person varying from one to three. Females
accounted for a greater number of episodes (30) than males (20). The number of episodes has remained
essentially flat since 2012.
The crude rate of hospital admission for Jersey is 79 per 100,000 population aged under 18 for the latest
period (2014-2016). Comparable figures to the Public Health England indicators can be found in Table A1
and Figure A1 in Appendix 1. The Jersey rate is significantly higher than the English average (37 per
100,000) for the same period.
26 States of Jersey Public Health Intelligence Unit, A picture of Health Jersey 2014: Reflections on the health and lifestyle of young people ages 10-15 years, published 2 March 2015, available from www.gov.je

33
Social Security expenditure
This section presents information provided by the Social Security Department on claims relating to
alcoholism.
There are three types of sickness benefit provided by the Social Security Department for Jersey
residents.
short term incapacity allowance (STIA) is usually authorised by GP’s and paid to working age
claimants who satisfy the necessary contribution conditions for periods of incapacity lasting
between 2 and 364 days.
long term incapacity allowance (LTIA) is an assessed allowance for working age persons who
satisfy the necessary contribution conditions and have a long term loss of faculty. Claimants
may continue to work while receiving this allowance.
invalidity benefit (INV) is no longer available to new claimants, due to the introduction of
LTIA in 2004, but continues to be paid to those individuals who were in receipt of the benefit
prior to LTIA being introduced. Invalidity benefit does not allow claimants to undertake work
whilst claiming.
Expenditure on benefits due to alcoholism
Figures are presented for claims made for which the illness reported is alcoholism. Such figures are likely
to be an underestimate of the number of people claiming benefit for alcoholism, since an alternative
diagnosis (such as depression) may be recorded in some cases rather than the explicit code for
alcoholism.
In 2016:
a total of £277,200 was paid out by Social Security for alcoholism, comprising: £185,500 for
LTIA; £47,300 for Invalidity benefit; and £44,400 for STIA claimants
the total paid out in 2016 was 3 per cent lower than that paid out for claims due to alcoholism
in the previous year 2015 (£286,100), which had been a 16 per cent decrease on the 2014
figure (£339,900)
over the last three years, 2014-2016, the average annual number of claims for alcoholism for
LTIA was 45, for invalidity benefit was 7 and for STIA was 21; the number of claims
representing a small proportion of the number claims for each benefit annually (1 per cent or
less)
claims for LTIA for alcoholism covered 15,900 days, although claimants may still be working.
STIA claims for alcoholism covered almost 2,000 days, with claimants not working during this

34
time. A total of 19,600 days were claimed for alcoholism in 2016 for STIA, LTIA and invalidity
benefit
between 2007 and 2011, the number of claims, expenditure and days claimed for alcoholism
doubled for LTIA; since 2011, the level of each has remained essentially flat (Figure 15)
the number of claims for invalidity benefit has decreased by around three-quarters since
2007, largely as a result of this benefit no longer accepting new claimants. The number of
claims for STIA has remained essentially flat over the same period
Figure 15: Expenditure+ on STIA, LTIA and INV* for alcoholism, 2007-2016
Source: Social Security Department
+Nominal expenditure (i.e. not adjusted for inflation)
* LTIA was introduced in 2004, with invalidity benefit no longer accepting new claimants from this time.
The total expenditure by the Social Security Department on benefits relating to alcoholism has decreased
by more than £138,300 since 2011.
Expenditure on benefits due to alcohol-related sickness and ailments (including alcoholism)
Alcohol-related sickness and ailments are defined by the Social Security Department as alcoholism,
detox, drug and substance dependency and liver disease (from all causes including alcohol) and cirrhosis.
£0
£50,000
£100,000
£150,000
£200,000
£250,000
£300,000
£350,000
£400,000
£450,000
2007 2008 2009 2010 2011 2012 2013 2014 2015 2016
LTIA Invalidity benefit STIA Total

35
Social Security Department data for alcohol-related sickness and ailments show that for 2016:
£611,500 was paid for a total of 164 claims
this latest total is similar to that for the previous year (2015), 10 per cent lower than two years
previously, 2014 (£678,000), and is the lowest expenditure for a decade (Figure 16)
over half of claims (57 per cent) for alcohol-related sickness and ailments were for LTIA
a total of 42,500 days were claimed in 2016 for alcohol related sickness: 19,600 for alcoholism;
3,000 for detox; 12,800 for drug and substance dependency; and 7,200 for liver disease (from all
causes including alcohol) and cirrhosis
Figure 16: Expenditure+ on alcohol-related sickness and ailments, 2007-2016
+Nominal expenditure (i.e. not adjusted for inflation)
Source: Social Security Department
£757,800
£868,300
£933,900 £946,300
£860,900 £814,800
£757,500
£678,000
£617,300 £611,500
2007 2008 2009 2010 2011 2012 2013 2014 2015 2016

36
Retail prices
Data compiled by the States of Jersey Statistics Unit enables analysis of the price of alcohol over time.
Three indices are considered here:
the all-items Retail Prices Index (RPI) – the main inflation measure in Jersey, compiled using a
representative ‘basket’ of over 500 separate goods and services
Alcohol Price Index (API) – the group level index of the RPI relating to a ‘basket of alcoholic
drinks’ priced by the Statistics Unit and provides a representative measure of the price of alcohol
Relative Alcohol Price Index - defined as API/RPI and provides an indicator of how the average
cost of alcohol has changed in relation to prices overall
Between June 2000 and June 2017, the price of alcohol in Jersey has increased by 17 per cent more than
retail prices generally. Figure 17 shows how prices have changed since June 2000 (an arbitrarily chosen
base quarter), increasing essentially in line with inflation prior to 2008 since when alcohol prices have
increased at a faster rate than retail prices.
Figure 17: Relative alcohol price index: 2000 to 2016
Source: Statistics Unit
0
50
100
150
200
250
Jun
Dec
Jun
Dec
Jun
Dec
Jun
Dec
Jun
Dec
Jun
Dec
Jun
Dec
Jun
Dec
Jun
Dec
Jun
Dec
Jun
Dec
Jun
Dec
Jun
Dec
Jun
Dec
Jun
Dec
Jun
Dec
Jun
Dec
Jun
2000 2001 2002 2003 2004 2005 2006 2007 2008 2009 2010 2011 2012 2013 2014 2015 20162017
Alcohol Price Index (API) Retail Price Index (RPI) Relative Alcohol Price Index (API/RPI)

37
Household Expenditure
The Statistics Unit runs a Household Spending and Income Survey (HSIS) approximately every five years.
The most recent round of the survey ran for twelve months from April 2014 to April 2015. For more
information on household spending, see the States of Jersey Statistics Unit Report Jersey Household
Spending Survey 2014/1527 available from www.gov.je
Overall household expenditure on alcohol
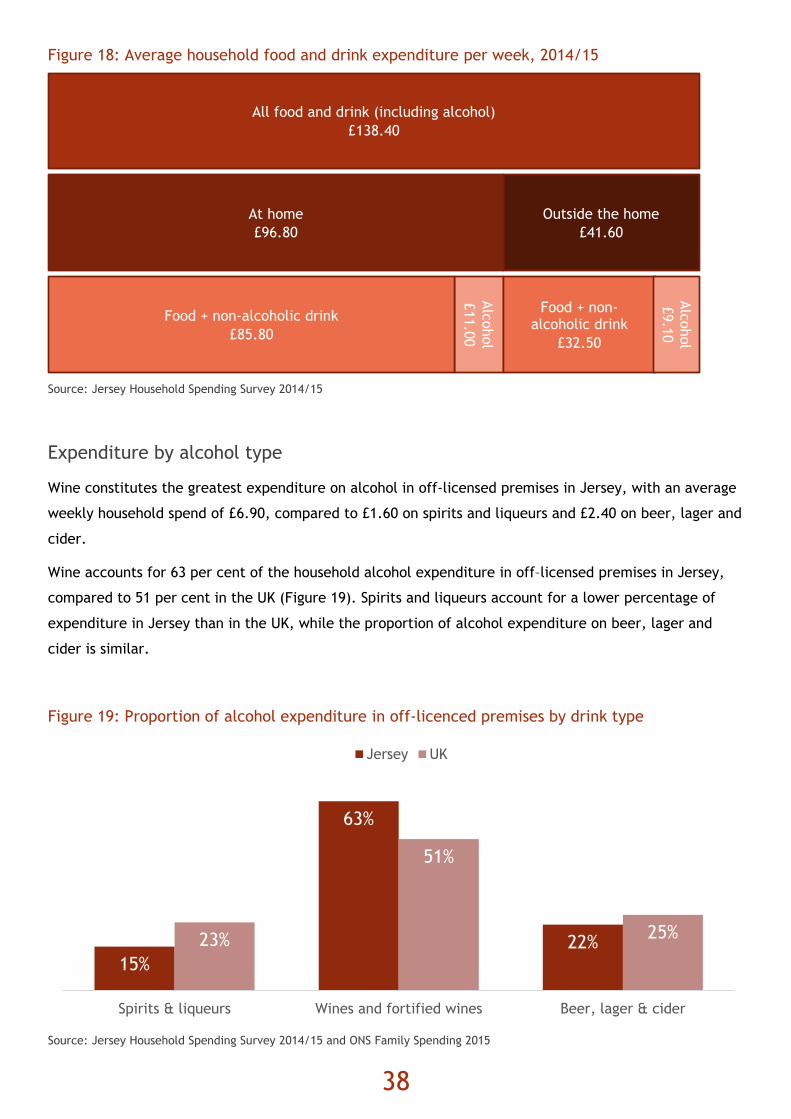
In 2014/2015, households in Jersey spent an average of £138 per week on food and drink both at home
and outside of the home, including alcoholic drinks. Of this total, £20 per week (15 per cent) on average
was spent on alcohol (either off premises or in licensed premises), as shown in Figure 18.
27 States of Jersey Statistics Unit, Jersey Household spending 2014/15, published 27 May 2016, available from www.gov.je
38
Figure 18: Average household food and drink expenditure per week, 2014/15
Source: Jersey Household Spending Survey 2014/15
Expenditure by alcohol type
Wine constitutes the greatest expenditure on alcohol in off-licensed premises in Jersey, with an average
weekly household spend of £6.90, compared to £1.60 on spirits and liqueurs and £2.40 on beer, lager and
cider.
Wine accounts for 63 per cent of the household alcohol expenditure in off–licensed premises in Jersey,
compared to 51 per cent in the UK (Figure 19). Spirits and liqueurs account for a lower percentage of
expenditure in Jersey than in the UK, while the proportion of alcohol expenditure on beer, lager and
cider is similar.
Figure 19: Proportion of alcohol expenditure in off-licenced premises by drink type
Source: Jersey Household Spending Survey 2014/15 and ONS Family Spending 2015
15%
63%
22%23%
51%
25%
Spirits & liqueurs Wines and fortified wines Beer, lager & cider
Jersey UK
All food and drink (including alcohol)
£138.40
Outside the home
£41.60
Alc
ohol
£11.0
0
At home
£96.80
Food + non-alcoholic drink
£85.80
Food + non-alcoholic drink
£32.50
Alc
ohol
£9.1
0

39
Household expenditure by age, income and tenure
Households in Jersey where the head of household is in the 45-54 year-old age group spent the most on
alcohol (average of £27 per week). The next oldest age group, 55-64 year-olds, spent slightly less (£25
per week) but a greater proportion of this was drinking at home (off-premises), rather than drinking out
in licensed premises. Expenditure on alcohol was lowest for the 65 or over age group, at £16 per week.
16-34 year-old’s are the only group that spend more on alcohol in licensed premises than at home.
Figure 20 shows average expenditure for alcohol consumed at home by alcohol type and age of the head
of household.
Figure 20: Expenditure per week on alcohol consumed at home (in off-licensed premises) by age group of head of household
Source: Jersey Household Spending Survey 2014/15
Differences in expenditure were also seen by household income quintile28 (non-equivalised), with
households in the highest income quintile spending the most on alcohol and the highest proportion of
their food and drink expenditure on alcohol (Figure 21).
28 If every household were ordered according to its income, from the lowest to highest, the first 20 per cent of households represent the "first income quintile” of households – i.e. those households which have the lowest income. The second income quintile is the next 20 per cent of households, and so on up to the fifth income quintile, which corresponds to the 20 per cent of households with the highest income.
£1.3
0 £1.6
0
£1.4
0 £2.0
0
£1.9
0
£1.6
0
£3.3
0
£5.8
0
£8.5
0
£10.2
0
£6.6
0
£6.9
0
£2.1
0
£2.4
0
£4.2
0
£2.5
0
£1.1
0
£2.4
0
£0
£2
£4
£6
£8
£10
£12
16-34 35-44 45-54 55-64 65+ All
Spirits & liqueurs Wines & fortified wines Beer, lager & cider

40
Figure 21: Expenditure per week on alcohol by income quintile
Source: Jersey Household Spending Survey 2014/15
Expenditure on alcohol varied by tenure, with owner-occupiers spending three times more per week
(£28.50) than those living in social rental households (£9.40) as shown in Figure 22.
Figure 22: Expenditure per week on alcohol by housing tenure
Source: Jersey Household Spending Survey 2014/15
£7.10 £7.10£10.90 £10.70
£19.40
£11.00
£2.90£5.30
£7.30£10.80
£20.00
£9.10
12%12%
13%14%
17%
15%
0%
2%
4%
6%
8%
10%
12%
14%
16%
18%
£0
£5
£10
£15
£20
£25
£30
£35
£40
£45
Lowest Second Middle Fourth Highest All
Off premises In licensed premises Alcohol as proportion of total food and drink
£12.90£14.00
£10.10£8.20
£4.90
£11.00
£15.60
£7.80
£8.50
£5.70
£4.50
£9.10
Owner-occupierwith mortgage
Owner-occupierwithout
mortgage
Qualified rental Non-qualifiedaccom.
Social rental All
Off premises In licensed premises

41
Figure 23 shows the distribution of expenditure on alcohol by household type. With the exception of
households with ‘other structures’, couples of non-pensionable age spent the most on alcohol.
Figure 23: Expenditure per week on alcohol by household type
Source: Jersey Household Spending Survey 2014/15
£15.40
£11.30
£7.70£6.10
£4.90
£12.70
£17.70
£14.70
£8.60
£1.70
£7.90
£2.60
£8.90
£15.10
0%
2%
4%
6%
8%
10%
12%
14%
16%
18%
20%
£0
£5
£10
£15
£20
£25
£30
£35
Couple, notpensioners
Couple atleast one
dependantchild
Singleparent atleast one
dependant
Person livingalone (notpensioner)
Pensionerliving alone
Two or morepensioners
Other
In licensed premises Off premises Alcohol as a proportion of total food and drink spend

42
Definitions and glossary of terms
Age standardised rates
An age standardised rate is the rate of events that would occur in a population with a standard age
structure if that population were to experience the age-specific rates of the subject population (e.g.
Jersey). The age groups used are 0 to 4, 5 to 9,…85 to 89, 90+ years. The 2013 European Standard
Population has been used to calculate the standardised rates in this report. The same population is used
for males, females and all persons and rates are expressed per 100,000 population.
Alcohol-specific conditions
Alcohol-specific conditions include those conditions where alcohol is causally implicated in all cases of
the condition;29 for example, alcohol-induced behavioural disorders and alcohol-related liver cirrhosis.
The alcohol-attributable fraction is 1.0 since it is considered that all cases from such conditions are
caused by alcohol.
Alcohol-related conditions
Alcohol-related conditions include all alcohol-specific conditions, plus those where alcohol is causally
implicated in some but not all cases of the outcome, for example hypertensive diseases, various cancers
and falls. The attributable fractions for alcohol-related outcomes used here range from between 0 and
less than 1.0. For example, the alcohol-attributable fraction for mortality from pneumonia among males
aged 75 or over is 0.10 because the latest epidemiological data suggest that 10 per cent of pneumonia
cases among this population are due to alcohol.30
Confidence Intervals
A confidence interval gives an indication of the likely statistical uncertainty around a value that has been
calculated. A confidence interval indicates the range within which the true value for the population as a
whole could be expected to lie, taking natural random variation into account. Confidence intervals
should be considered when interpreting results.
29 See Jones L and Bellis MA (2014m Updating England-specific alcohol-attributable fractions, Liverpool: Centre for Public Health, Liverpool John Moores University 30 Public Health England, Local Alcohol Profiles for England 2015 User Guide, published 2 June 2015, available from www.lape.org.uk

43
Conditions
Acute – symptoms appear and change or worsen rapidly.
Chronic – develops and worsens over an extended period of time.
Crude Rates
A crude rate refers to the number of events per 1,000 or 100,000 population.
Drinking frequency
Binge drinking - males are considered to have binged if they drank more than eight units of alcohol on
one day and females if they drank more than six units. These are double the recommendation, from the
Department of Health in England,31 for the amount of units to consume on one day.
Frequent drinking – this is classified as those who drink on five or more days in a week.
Teetotal
Teetotallers are those who say that they do not drink alcohol at all.
Years of Life Lost (YOLL)
Years of life lost is a measure of premature mortality which is used to compare the mortality experience
of different populations for all causes of death and/or particular causes of death by quantifying the
number of years not lived by individuals who die under a given cut-off age. The most frequently used
cut-off age is 75, this having been set as an age that everyone can be expected to reach.
31 Based on Department of Health recommendations prior to January 2016, for more information on the changes to recommendations see: Department of Health (2016), UK Chief Medical Officers’ Alcohol Guidelines Review: Summary of the proposed new guidelines, published January 2016, www.gov.uk

44
Background notes
Data sources
The following data sources have been used in this report:
Alcohol consumption figures use data supplied by Customs and Immigration on volumes of alcohol
imported into the Island, alongside population figures generated by the Statistics Unit, data on
the number of seasonal workers in the Island each year and information from Visit Jersey (and the
Tourism department prior to 2015) on the number of visitors each year
Deaths data is compiled by the Statistics Unit from notifications and registrations reported by
parish registrars to the Superintendent Registrar as required by the Marriage and Civil Status
(Jersey) Law 2001. Coding of cause of deaths of Jersey residents is undertaken by the Office for
National Statistics on a quarterly basis, classified using the International Statistical Classification
of Diseases, Injuries and Causes of Death (tenth revision, ICD-10).
The Jersey Opinions and Lifestyle Survey (JOLS) is a voluntary postal and internet survey run by
the States of Jersey Statistics Unit. The survey is sent to more than 3,000 randomly selected
households each year, and has a high response rate of around 46 per cent. Statistical weighting
techniques are used to compensate for different patterns of non-response from different sub-
groups of the population. The result is that the survey results can be considered broadly accurate
and representative of Jersey’s resident population. As with all sample surveys, there is an
element of statistical uncertainty, typically around ±2.5 percentage points for proportions
relating to the overall population. For further details see www.gov.je/JOLS.
Data on the drinking behaviours of young people in Jersey is taken from the The Young People’s
Health and Lifestyle Survey (formally known as the Health Related Behaviours Survey) which is
run in schools by the States of Jersey Health Intelligence Unit. The latest round ran in 2014, and
the questionnaire was carried out with students in all primary schools with the exception of
schools for children with special need requirements) across the Island at ages 10-11 years (school
year 6) and in all secondary schools across the Island at 12-13 years (school year 8) and 14-15
years (school year 10). A total of 2,675 students completed the survey, representing an 86 per
cent response rate. The survey questions cover a range of health topics including family
background and home life through to specific health issues such as diet, physical activity, drugs,
alcohol, smoking and wellbeing. With the survey methodology used there is 95% confidence that
the sample percentages accurately represent the whole population percentage to ± 2 percentage
points. For further information please see the report on www.gov.je
Household expenditure on alcohol was taken from the Statistics Unit report on the Jersey
Household Spending Survey 2014/15, available from www.gov.je. A total of 1,278 randomly
selected households took part in the survey, representing a response rate of 45 per cent. The
survey spanned a twelve-month period to capture different spending patterns throughout the
year, for example typically higher and different expenditure in the run-up to Christmas. Regular

45
spending (e.g. housing costs, fuel and memberships) and infrequent purchases (e.g. furniture and
vehicles) were collected through a face-to-face interview. In addition, each adult household
member kept a spending diary for two weeks to capture day-to-day spending. More than 170,000
individual purchases were used to compile the spending report, for further information Jersey
Household Spending Survey 2014/15 available from www.gov.je
The Social Security Department have provided information on the number of sickness benefit
claims made to their department. For further information see www.gov.je
Data on hospital admissions is taken from the hospital computer system TRAK which was
implemented in June 2011. Admissions data are classified using the International Classification of
Diseases (ICD-10); each admission can have up to 20 diagnosis fields which provide the reasons
why the patient was admitted to hospital. These diagnosis fields are used in the analysis of
alcohol-specific hospital admissions in this report
Data on the number of people currently living with chronic liver disease is collected from the
General Practice Central Server (GPCS), a computer system introduced into all general practice
(GP) surgeries in Jersey in 2013. Data taken from the GPCS are taken from specific disease
registers which are generated as part of the Jersey Quality Improvement Framework which
incentivises GPs to accurately record patients that meet a set of disease-specific criteria as being
on a particular disease register. As such, the quality of this data is deemed to be greater than
those indicators and disease registers for which GPs are not incentivised to record
Data on substance misuse has been provided by the Drug and Alcohol service on the number of
referrals received each year. For further information about the service see www.gov.je
Details on alcohol-related crime have been provided by the States of Jersey Police. These figures
can be affected by campaigns being run by the Police and are reliant on officers recording when
alcohol has been involved. Figures for Jersey have not been compared on a like-for-like basis to
English crime figures due to differences in the legal systems and recording mechanisms. For
further information on Jersey crime statistics see jersey.police.uk
The Retail Prices Index (RPI) and the group level data for Alcoholic Drinks, as measured quarterly
by the Statistics Unit, has been used to analyse changes in the price of alcohol in comparison to
retail prices overall. The Alcohol Price Index, used to derive the relative alcohol price index,
relates to a ‘basket of alcoholic drinks’ and is used to measure the average change in price of
alcoholic drinks bought by an average household in Jersey. For further information see
www.gov.je/inflation
Comparisons
Comparisons to other jurisdictions are presented in this report to enable benchmarking and comparison
with trends being seen elsewhere. Data is extracted from published reports from the Office for National
Statistics, Public Health England, NHS Digital, OECD and WHO.

46
Timeliness
The data presented in this report refers to 2016 data or earlier periods if national comparison data for
2016 is not currently available. Data for retail prices is presented to June 2017 as this was available at
time of publication.
Methods
Per capita consumption of alcohol
Information supplied by Customs and Immigration on volumes of alcohol imported into the Island is
divided by the population aged 15 or over (excluding visitors and seasonal workers) to generate a
measure of the amount of pure alcohol consumed in litres in a calendar year per resident person.
Conversion factors used to estimate the amount of pure alcohol are: beer and cider, 5 per cent; wine,
12 per cent; and spirits, 20 per cent.
Measures of mortality
Age-standardised rates have been calculated using the number of deaths occurring each year as the
numerator and the mid-year population estimate for that year as the denominator. The rates have been
standardised using the 2013 European Standard Population. The directly age-standardised rates adjust
for differences in age and sex structures between populations to allow comparisons across time and
place.
Annual mortality rates for Jersey are calculated using the average of the two corresponding end-year
population estimates as published by the States of Jersey Statistics Unit. The resulting estimate of the
mid-year population assumes that half of births, deaths and migration occurs in the first half of the
calendar year.
Potential years of life lost (YOLL) estimates the number of years a person would have lived had they not
died prematurely. It is based on the assumption that every individual could expect to live until the age of
75 and premature death before that age may be preventable.
Alcohol-attributable fractions used to calculated alcohol-related mortality and hospital admissions
Attributable fraction values are the proportion of a health condition or external cause that is
attributable to the exposure of a specific risk factor (such as alcohol) in a given population. Attributable
fractions are used in this report to estimate the number of deaths and hospital admissions that are
related to alcohol consumption. The population attributable fraction calculation assumes a causal
association between risk factor and outcome, meaning that the attributable fraction can also be viewed
as the expected proportional reduction in cases of an outcome arising in the population as a result of
removing the exposure, in this case, alcohol. For further information on the methodology see
www.nhsdigital.nhs.uk.
Alcohol attributable fractions (AAFs) are used to calculate the number of hospital admissions attributable
to alcohol. In March 2017, PHE, in response to user feedback, replaced indicators on numbers of people
admitted to hospital due to alcohol with indicators measuring admission episodes instead. The aim of this

47
change was to show the impact on services that admissions due to alcohol have. As such, the indicators
in this report have been updated to reflect the change in methodology and are therefore not comparable
with previous versions of the alcohol profile.
Accuracy and reliability
All figures have been independently rounded to the nearest integer; this is because small numbers are
more susceptible to natural variation. Percentages may not add up to 100 per cent due to rounding.
The data covers all deaths of residents living in Jersey on- and off-Island. A small number of inquests
may still be outstanding for deaths occurring in calendar year 2016; therefore, numbers here should be
treated as provisional. All death numbers have been independently rounded to the nearest 10, to reflect
the provisional nature of these statistics at time of publication.
When the observed total number of deaths is fewer than 10, mortality rates are not calculated, as there
are too few deaths to calculate directly standardised rates reliably. This is an update on previously
published recommendations by PHE.
Data recorded on the GP central server is reliant on GPs and practice staff to accurately record activity
occurring in their individual practices. The Statistics Unit has access, through a data sharing agreement,
to the central server to allow statistical information to be monitored. This information is anonymised and
as a result the data cannot be interrogated to look for errors or duplicates, therefore figures presented
here should be treated with caution. The accuracy and reliability of this data is expected to improve as
data is further shared and interrogated and as coding of the data improves.
Information on hospital admission episodes for 2016 should be treated as provisional due to a small
number of outstanding episodes that are yet to be coded by the Clinical Coding team. This number is
known to be less than 200 general medical episodes.
Confidence intervals and statistical significance
Confidence intervals have been used in this report to compare Jersey mortality rates and hospital
admission rates with those of England. Confidence intervals are a measure of the statistical precision of
an estimate and show the range of uncertainty around the estimated figure. The confidence interval
indicates the range within which the true value for the population as a whole can be expected to lie,
taking natural random variation into account.
Comparisons between rates or over time have been statistically tested to determine whether differences
are likely to be statistically significant or the result of natural random variation. Only those differences
deemed as statistically significant have been described in this report using terms such as ‘increase’,
‘decrease’, ‘higher’ or ‘lower’.

48
Data quality and completeness
A quality assurance process includes checks on data completeness, comparison to previous year data,
comparisons to previous data for the same cohorts and investigation of any large changes.
The data quality and completeness of data extracted from the GP central server cannot be assured;
however where variation between GP practices is identified, this is fed back to individual surgeries for
further checks. Figures are also compared to previous years figures and large changes are investigated.
The number of deaths may differ from previously published figures due to the inclusion of data from
inquests which can take up to 18 months to complete and register. Data on deaths of Jersey residents
that occur outside of the Island may also result in a delay in registering the death with the
Superintendent Registrar. This means that total deaths in a given year should be treated as provisional.
Contact details
All enquiries and feedback should be directed to:
Statistics Unit
Chief Minister’s Department
Cyril Le Marquand House
St Helier
JE4 8QT

49
Appendix 1: Public Health England comparable indicators
Alcohol-specific hospital admission indicators
Table A1: Hospital admission indicators (PHE measure)
Indicator Period Jersey rate Jersey
95% CI
England
rate
England
95% CI
England
best/
lowest
England
worst/
highest
Admission episodes for alcohol-specific conditions (age-standardised rate per 100,000 population)
All persons 2015/16 & 2016* 747 (695, 802) 583 (581, 585) 197 1,681
Male 2015/16 & 2016* 1,083 (994, 1,179) 812 (809, 816) 259 2,441
Female 2015/16 & 2016* 419 (365, 479) 367 (364, 369) 130 1,015
Admission episodes for alcohol-specific conditions – Under 18s (crude rate per 100,000 population)
All persons 2014-16* 78.5 (57.5, 104.7) 37.4 (36.7, 38.0) 10.8 115.1
Male 2014-16* 57.6 (33.6, 92.3) 29.4 (28.6, 30.2) 6.0 104.6
Female 2014-16* 99.7 (66.8, 143.2) 45.8 (44.8, 44.7) 15.7 126.3
Source: Jersey Statistics Unit and Public Health England *Jersey data is for calendar years, whereas English data is for financial years

50
Figure A1: Hospital admission indicators (PHE measure)
Admission episodes for alcohol-specific conditions (age-standardised rate per 100,000 population)
All persons Male
Female
Admission episodes for alcohol-specific conditions – Under 18s (crude rate per 100,000 population)
All Persons Male
Female
Source: Jersey Statistics Unit and Public Health England *Jersey data is for calendar years, whereas English data is for financial years
0
500
1,000
1,500
2,000
2012* 2013* 2014* 2015* 2016*
0
500
1,000
1,500
2,000
2012* 2013* 2014* 2015* 2016*
0
500
1,000
2012* 2013* 2014* 2015* 2016*
0
50
100
150
200
2012-2014* 2013-2015* 2014-2016*
0
50
100
150
200
2012-2014* 2013-2015* 2014-2016*
0
50
100
150
200
2012-2014* 2013-2015* 2014-2016*

51
Alcohol mortality indicators
Table A2: Mortality indicators (PHE measure)
Indicator Period Jersey rate Jersey
95% CI
England
rate
England
95% CI
England
best/
lowest
England
worst/
highest
Alcohol-specific mortality (age-standardised rate per 100,000 population)
All persons 2014-16 14.8 (10.5, 20.3) 10.4 (10.3, 10.6) 3.9 28.6
Male 2014-16 21.7 (14.4, 31.6) 14.2 (14.0, 14.5) 5.6 38.5
Female 2014-16 8.2 (4.0, 14.7) 6.8 (6.7, 7.0) 2.2 19.3
Mortality from chronic liver disease (age-standardised rate per 100,000 population)
All persons 2014-16 11.9 (8.0, 17.0) 12.0 (11.8, 12.2) 5.5 31.5
Male 2014-16 15.0 (8.9, 23.5) 15.7 (15.5, 16.0) 6.3 42.2
Female 2014-16 8.5 (4.2, 15.3) 8.5 (8.3, 8.7) 3.7 21.0
Alcohol-related mortality (age-standardised rate per 100,000 population)
All persons 2016 44.4 (31.9, 59.9) 46.0 (45.5, 46.6) 27.3 86.0
Male 2016 60.8 (38.9, 88.3) 66.3 (65.3, 67.4) 42.1 124.2
Female 2016 29.7 (16.3, 47.8) 28.8 (28.2, 29.4) 17.5 51.2
Source: Jersey Statistics Unit and Public Health England

52
Figure A2: Mortality indicators (PHE measure)
Alcohol-specific mortality (age-standardised rate per 100,000 population)
All persons Male
Female
Mortality from chronic liver disease (age-standardised rate per 100,000 population)
All Persons Male
Female
0
10
20
30
40
2008 -10
2009 -11
2010 -12
2011 -13
2012 -14
2013 -15
2014 -16
0
10
20
30
40
2008 -10
2009 -11
2010 -12
2011 -13
2012 -14
2013 -15
2014 -16
0
10
20
30
40
2008 -10
2009 -11
2010 -12
2011 -13
2012 -14
2013 -15
2014 -16
0
10
20
30
40
2008 -10
2009 -11
2010 -12
2011 -13
2012 -14
2013 -15
2014 -16
0
10
20
30
40
2008 -10
2009 -11
2010 -12
2011 -13
2012 -14
2013 -15
2014 -16
0
10
20
30
40
2008 -10
2009 -11
2010 -12
2011 -13
2012 -14
2013 -15
2014 -16

53
Alcohol-related mortality (age-standardised rate per 100,000 population)
All Persons Male
Female
Source: Jersey Statistics Unit and Public Health England
0
20
40
60
80
100
2008
2009
2010
2011
2012
2013
2014
2015
2016
0
20
40
60
80
100
2008
2009
2010
2011
2012
2013
2014
2015
2016
0
20
40
60
80
100
2008
2009
2010
2011
2012
2013
2014
2015
2016

54
Liver disease indicators (including all liver disease and alcoholic liver disease)
Table A3: Liver disease indicators (PHE measures)
Indicator Period Jersey rate Jersey
95% CI
England
rate
England
95% CI
England
best/
lowest
England
worst/
highest
Under 75 mortality rate from liver diseases (age-standardised rate per 100,000 population)
All persons 2014-16 18.8 (13.9, 24.9) 18.3 (18.0, 18.5) 9.8 44.7
Male 2014-16 24.0 (16.2, 34.2) 23.9 (23.6, 24.3) 8.5 56.8
Female 2014-16 13.8 (8.1, 21.9) 12.8 (12.6, 13.1) 5.6 32.7
Under 75 mortality rate from alcoholic liver disease (age-standardised rate per 100,000 population)
All persons 2014-16 9.0 (5.7, 13.5) 8.8 (8.7, 9.0) 2.9 26.7
Male 2014-16 13.7 (8.1, 21.7) 11.8 (11.5, 12.0) 4.0 34.9
Female 2014-16 - - 6.0 (5.8, 6.2) 2.0 18.5
Source: Jersey Statistics Unit and Public Health England
- There are two few deaths to calculate directly age standardised rates reliably

55
Figure A3: Liver disease indicators (PHE measures)
Admission episodes for alcohol-specific conditions (age-standardised rate per 100,000 population)
All persons Male
Female
Under 75 mortality rate from alcoholic liver disease (age-standardised rate per 100,000 population)
All Persons Male
Female*
Source: Jersey Statistics Unit and Public Health England
* Data for the last three time periods not published as there are two few deaths to calculate directly age standardised rates reliably
0
10
20
30
40
2009 -11
2010 -12
2011 -13
2012 -14
2013 -15
2014 -16
0
10
20
30
40
2009 -11
2010 -12
2011 -13
2012 -14
2013 -15
2014 -16
0
10
20
30
40
2009 -11
2010 -12
2011 -13
2012 -14
2013 -15
2014 -16
0
5
10
15
20
2010 -12
2011 -13
2012 -14
2013 -15
2014 -16
0
5
10
15
20
2010 -12
2011 -13
2012 -14
2013 -15
2014 -16
0
5
10
15
20
2010 -12
2011 -13
2012 -14
2013 -15
2014 -16