jennisondryden is a registered trademark of the … financial is a service mark of the prudential...
TRANSCRIPT

®
®
JennisonDryden is a registered trademark of The Prudential Insurance Company of America.

2R\JD\3Q04 MAP\Mgd Acct Field Pres Muni 09-30-04 a
®
Table of Contents
I Prudential Fixed Income Overview
II Why Managed Fixed Income?
III Dryden Municipal Bond Strategies
IV Appendix
Biographies
Disclosures
Prudential Financial is a service mark of The Prudential Insurance Company of America, Newark, NJ and its affiliates

3R\JD\3Q04 MAP\Mgd Acct Field Pres Muni 09-30-04 a
®
I
Prudential Fixed Income Overview

4R\JD\3Q04 MAP\Mgd Acct Field Pres Muni 09-30-04 a
®
US/Non-US Governments
$20 billion
High Yield$10 billion
Money Markets$21 billion
Municipals$3 billion
Emerging Markets$4 billion
Mortgages$15 billionStructured
Product$11 billion
US/Non-US Corporates$55 billion
Bank Loans<$1 billion
Assets Under Management$139 Billion*� One of the largest fixed
income managers in US**
� Broad coverage of fixed income markets
� Focused sector expertise
� Over 100 investment professionals
Prudential Fixed Income
* As of 9/30/04. Prudential Fixed Income is a unit of Prudential Investment Management, Inc., a registered investment adviser and is one advisor within Prudential Financial's asset management business, known collectively as Prudential Investment Management. Prudential Fixed Income is the primary manager of the assets described on this page. Chart does not include assets in JennisonDryden Managed Accounts (“JDMA”) and fixed income accounts managed by Jennison Associates LLC, and Quantitative Management Associates LLC, both subsidiaries of Prudential Financial. Holdings are subject to change. Asset class breakdown based on company estimates.
** Source: Institutional Investor, July 2004, based on domestic fixed income securities held as of 12/31/03.
5R\JD\3Q04 MAP\Mgd Acct Field Pres Muni 09-30-04 a
®
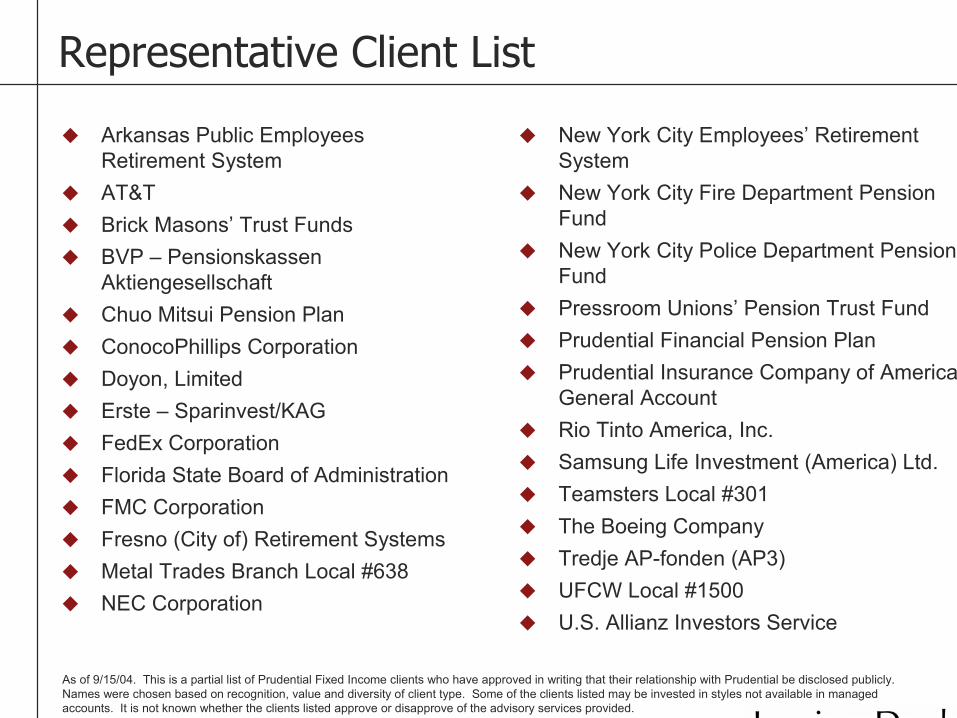
Representative Client List
� Arkansas Public Employees Retirement System
� AT&T� Brick Masons’ Trust Funds� BVP – Pensionskassen
Aktiengesellschaft� Chuo Mitsui Pension Plan� ConocoPhillips Corporation� Doyon, Limited� Erste – Sparinvest/KAG� FedEx Corporation� Florida State Board of Administration� FMC Corporation� Fresno (City of) Retirement Systems� Metal Trades Branch Local #638� NEC Corporation
As of 9/15/04. This is a partial list of Prudential Fixed Income clients who have approved in writing that their relationship with Prudential be disclosed publicly. Names were chosen based on recognition, value and diversity of client type. Some of the clients listed may be invested in styles not available in managed accounts. It is not known whether the clients listed approve or disapprove of the advisory services provided.
� New York City Employees’ Retirement System
� New York City Fire Department Pension Fund
� New York City Police Department Pension Fund
� Pressroom Unions’ Pension Trust Fund� Prudential Financial Pension Plan� Prudential Insurance Company of America
General Account� Rio Tinto America, Inc.� Samsung Life Investment (America) Ltd.� Teamsters Local #301� The Boeing Company� Tredje AP-fonden (AP3)� UFCW Local #1500� U.S. Allianz Investors Service
6R\JD\3Q04 MAP\Mgd Acct Field Pres Muni 09-30-04 a
®
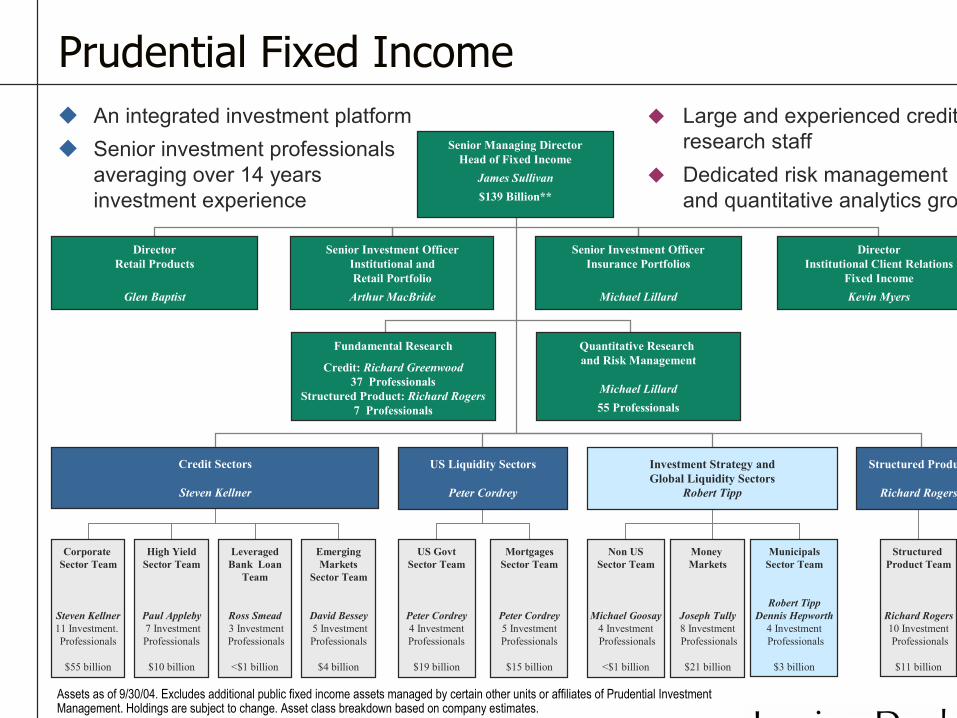
� An integrated investment platform� Senior investment professionals
averaging over 14 years investment experience
� Large and experienced creditresearch staff
� Dedicated risk management and quantitative analytics group
Prudential Fixed Income
Assets as of 9/30/04. Excludes additional public fixed income assets managed by certain other units or affiliates of Prudential Investment Management. Holdings are subject to change. Asset class breakdown based on company estimates.
Credit Sectors
Steven Kellner
Corporate Sector Team
Steven Kellner11 Investment. Professionals
$55 billion
EmergingMarkets
Sector Team
David Bessey5 InvestmentProfessionals
$4 billion
High YieldSector Team
Paul Appleby7 InvestmentProfessionals
$10 billion
LeveragedBank Loan
Team
Ross Smead3 InvestmentProfessionals
<$1 billion
Structured Product
Richard Rogers
Structured Product Team
Richard Rogers10 InvestmentProfessionals
$11 billion
Non USSector Team
Michael Goosay4 InvestmentProfessionals
<$1 billion
MunicipalsSector Team
Robert TippDennis Hepworth
4 InvestmentProfessionals
$3 billion
Money Markets
Joseph Tully8 InvestmentProfessionals
$21 billion
Investment Strategy andGlobal Liquidity Sectors
Robert Tipp
US GovtSector Team
Peter Cordrey4 InvestmentProfessionals
$19 billion
MortgagesSector Team
Peter Cordrey5 InvestmentProfessionals
$15 billion
US Liquidity Sectors
Peter Cordrey
Quantitative Research and Risk Management
Michael Lillard55 Professionals
Fundamental Research
Credit: Richard Greenwood37 Professionals
Structured Product: Richard Rogers7 Professionals
Senior Managing DirectorHead of Fixed Income
James Sullivan$139 Billion**
DirectorInstitutional Client Relations
Fixed IncomeKevin Myers
Senior Investment OfficerInsurance Portfolios
Michael Lillard
Senior Investment OfficerInstitutional andRetail Portfolio
Arthur MacBride
DirectorRetail Products
Glen Baptist
7R\JD\3Q04 MAP\Mgd Acct Field Pres Muni 09-30-04 a
®
II
Why Managed Fixed Income?

8R\JD\3Q04 MAP\Mgd Acct Field Pres Muni 09-30-04 a
®
Think About Bonds Like Stocks
Source: Bloomberg. Neither the information nor any opinion expressed shall constitute an offer to sell or a solicitation of an offer to buy any securities mentioned herein.
This hypothetical illustration is for informational purposes only. Stocks represent ownership in a corporation, while government bonds and U.S. Treasury bills are guaranteed by the U.S. Government and, as with all bonds, if held to maturity, offer a fixed rate of return and fixed principal value.
All 3 of these securities exhibit similar volatility and active trading opportunities.
80
85
90
95
100
105
110
115
120
1/0
3
2/0
3
3/0
3
4/0
3
5/0
3
6/0
3
7/0
3
8/0
3
9/0
3
10
/0
3
11
/0
3
12
/0
3
WalMart StockMissouri St. Health Muni Bond30 Year U.S. Treasury BondPr
ice
(Nor
mal
ized
)
� There are more to bonds than just fixed coupons and a set principal payment
� Bond prices fluctuate just like stock prices do. These price fluctuations can create trading opportunities to generate potential returns in actively managed portfolios.

9R\JD\3Q04 MAP\Mgd Acct Field Pres Muni 09-30-04 a
®
Yield versus Total Return
-10
-5
0
5
10
15
20
1994 1995 1996 1997 1998 1999 2000 2001 2002 2003
Perc
ent
Total ReturnYield
� Focus on total return when investing in bonds. Yield is just a component of total return, yet is often the primary focus of investors.
Lehman Municipal Index: Total Return and Yields
Source: Lehman Brothers as of 12/31/03. The Lehman Municipal Index includes municipal issues rated at least BBB with at least $5 million par value outstanding, at least one year until maturity, and were issued after 12/31/90. Past performance is not a guarantee of future results.
Avg. Ann. Return:6.0%
Avg. Yield:4.8%
10R\JD\3Q04 MAP\Mgd Acct Field Pres Muni 09-30-04 a
®
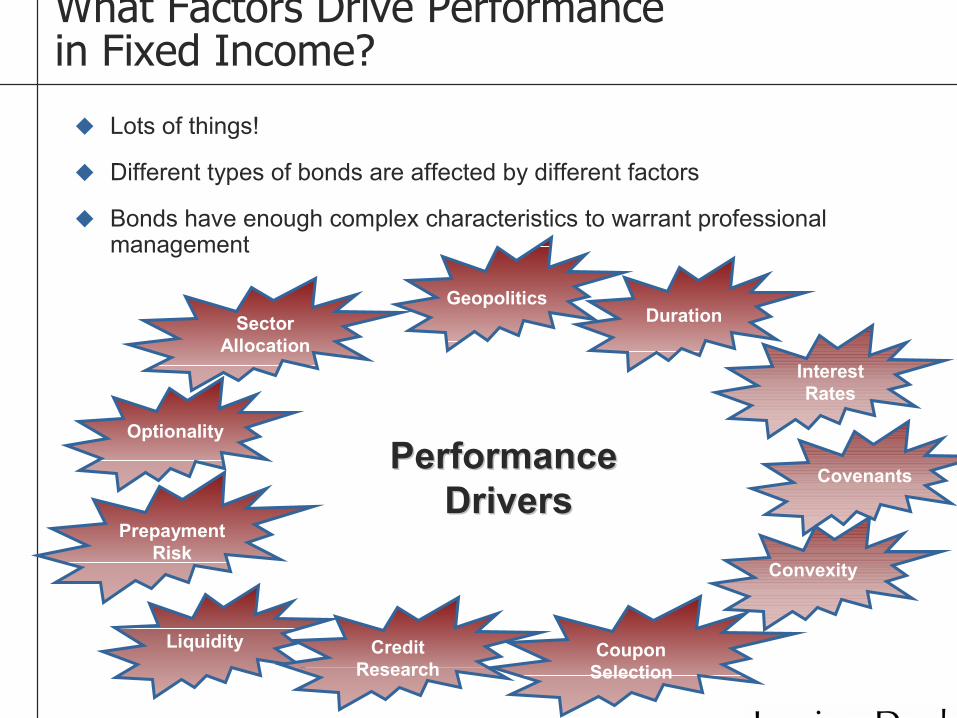
What Factors Drive Performance in Fixed Income?
� Lots of things!
� Different types of bonds are affected by different factors
� Bonds have enough complex characteristics to warrant professional management
Performance Performance DriversDrivers
Convexity
Covenants
Liquidity
GeopoliticsDurationSector
Allocation
Optionality
PrepaymentRisk
CouponSelection
CreditResearch
InterestRates

11R\JD\3Q04 MAP\Mgd Acct Field Pres Muni 09-30-04 a
®
The Benefits of Managed Fixed Income Products
� Professional Management� seeks to maximize total return, not just yield� continuous evaluation of portfolio structure
� Diversification � risk can be reduced by holding securities across various sectors and
maturities, and by limiting individual positions
� Market Access and Execution� large market participants have superior market access and offer size-
driven trading advantages not available to retail investors
� Liquidity� investor has immediate access to funds
12R\JD\3Q04 MAP\Mgd Acct Field Pres Muni 09-30-04 a
®
III
Dryden Municipal Bond Managed Accounts
Investment Strategy and Process
13R\JD\3Q04 MAP\Mgd Acct Field Pres Muni 09-30-04 a
®
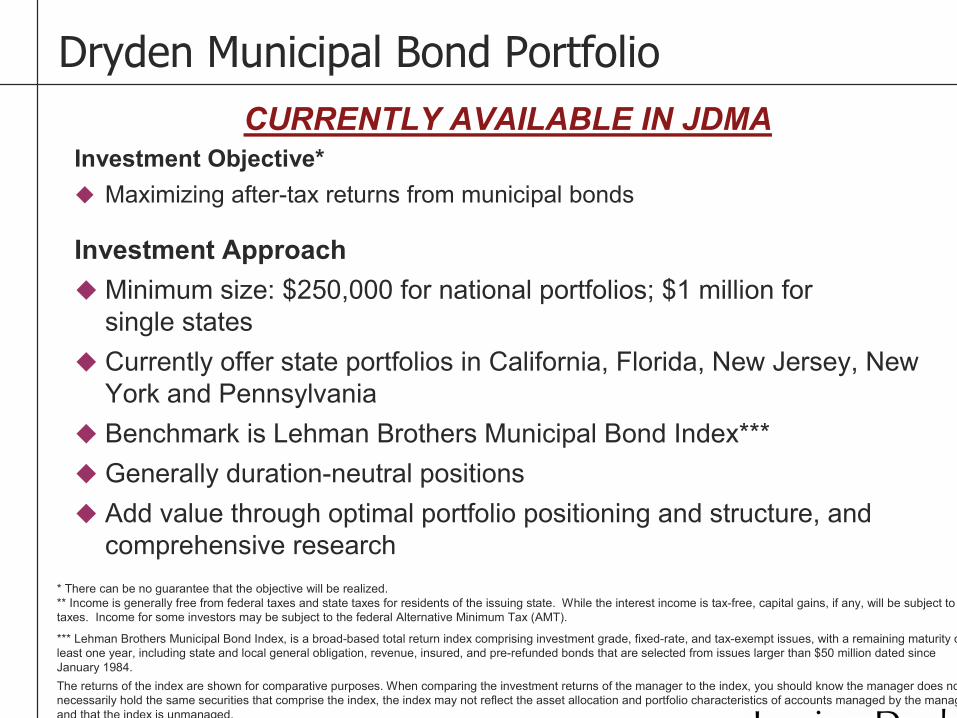
Dryden Municipal Bond Portfolio
Investment Objective*� Maximizing after-tax returns from municipal bonds
Investment Approach� Minimum size: $250,000 for national portfolios; $1 million for
single states� Currently offer state portfolios in California, Florida, New Jersey, New
York and Pennsylvania� Benchmark is Lehman Brothers Municipal Bond Index***� Generally duration-neutral positions� Add value through optimal portfolio positioning and structure, and
comprehensive research* There can be no guarantee that the objective will be realized.** Income is generally free from federal taxes and state taxes for residents of the issuing state. While the interest income is tax-free, capital gains, if any, will be subject to taxes. Income for some investors may be subject to the federal Alternative Minimum Tax (AMT).
*** Lehman Brothers Municipal Bond Index, is a broad-based total return index comprising investment grade, fixed-rate, and tax-exempt issues, with a remaining maturity of at least one year, including state and local general obligation, revenue, insured, and pre-refunded bonds that are selected from issues larger than $50 million dated since January 1984. The returns of the index are shown for comparative purposes. When comparing the investment returns of the manager to the index, you should know the manager does not necessarily hold the same securities that comprise the index, the index may not reflect the asset allocation and portfolio characteristics of accounts managed by the manager and that the index is unmanaged.
CURRENTLY AVAILABLE IN JDMA
14R\JD\3Q04 MAP\Mgd Acct Field Pres Muni 09-30-04 a
®
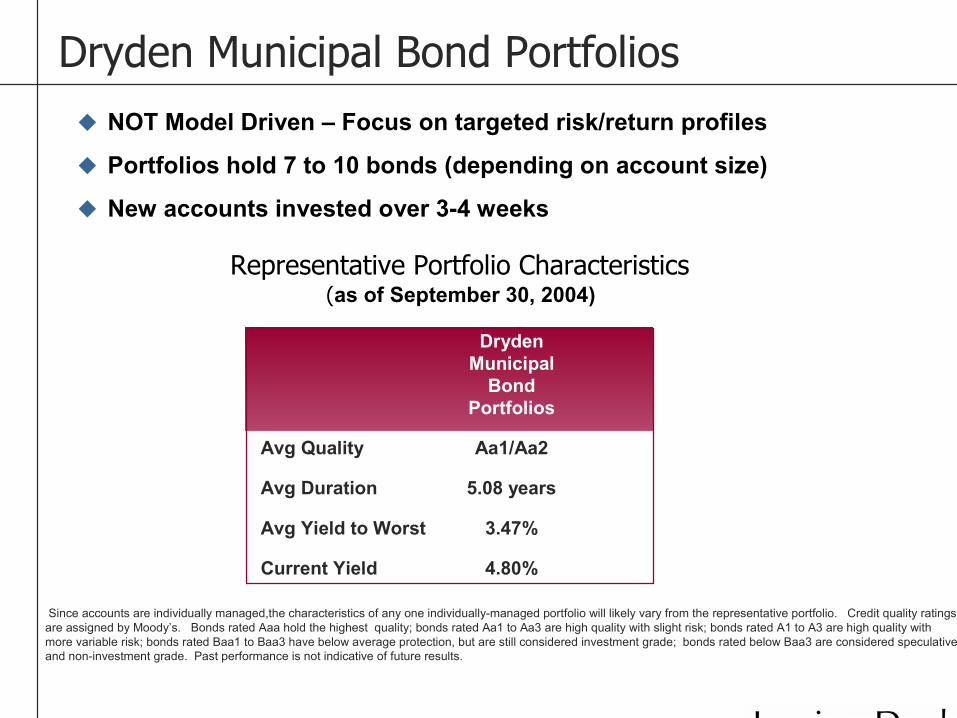
Dryden Municipal Bond Portfolios� NOT Model Driven – Focus on targeted risk/return profiles
� Portfolios hold 7 to 10 bonds (depending on account size)
� New accounts invested over 3-4 weeks
Representative Portfolio Characteristics(as of September 30, 2004)
Since accounts are individually managed,the characteristics of any one individually-managed portfolio will likely vary from the representative portfolio. Credit quality ratings are assigned by Moody’s. Bonds rated Aaa hold the highest quality; bonds rated Aa1 to Aa3 are high quality with slight risk; bonds rated A1 to A3 are high quality with more variable risk; bonds rated Baa1 to Baa3 have below average protection, but are still considered investment grade; bonds rated below Baa3 are considered speculative and non-investment grade. Past performance is not indicative of future results.
DrydenMunicipal
BondPortfolios
Avg Quality Aa1/Aa2
Avg Duration 5.08 years
Avg Yield to Worst 3.47%
Current Yield 4.80%
15R\JD\3Q04 MAP\Mgd Acct Field Pres Muni 09-30-04 a
®
0%
1%
2%
3%
4%
5%
6%
1 2 3 4 5 7 10 15 20 25 30
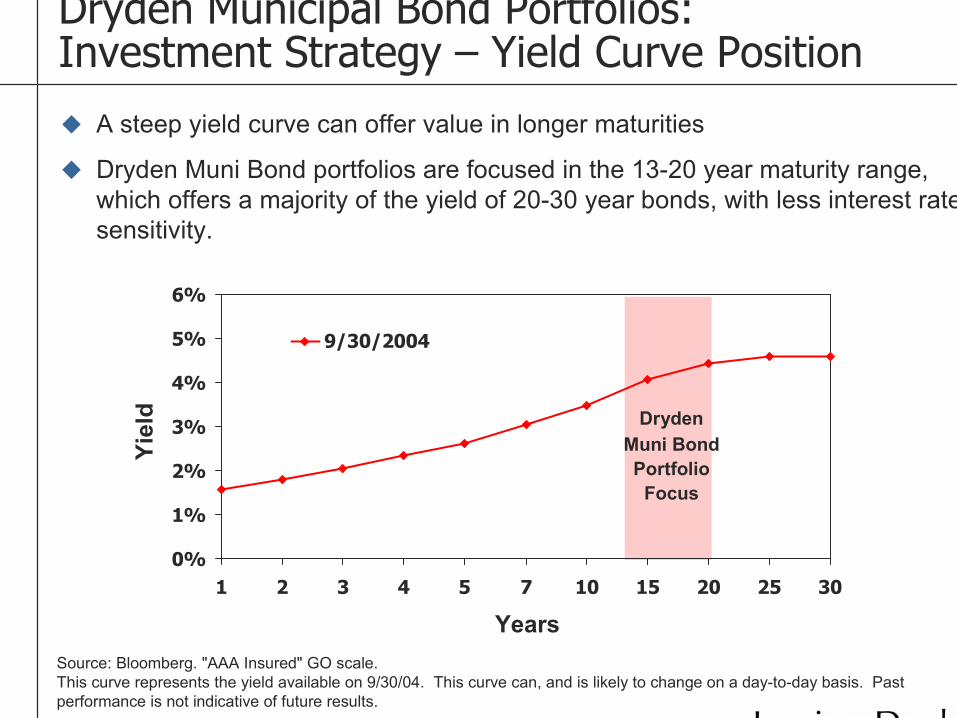
9/30/2004
Source: Bloomberg. "AAA Insured" GO scale.This curve represents the yield available on 9/30/04. This curve can, and is likely to change on a day-to-day basis. Past performance is not indicative of future results.
� A steep yield curve can offer value in longer maturities
� Dryden Muni Bond portfolios are focused in the 13-20 year maturity range, which offers a majority of the yield of 20-30 year bonds, with less interest rate sensitivity.
Yiel
d
Years
DrydenMuni BondPortfolio
Focus
Dryden Municipal Bond Portfolios:Investment Strategy – Yield Curve Position
16R\JD\3Q04 MAP\Mgd Acct Field Pres Muni 09-30-04 a
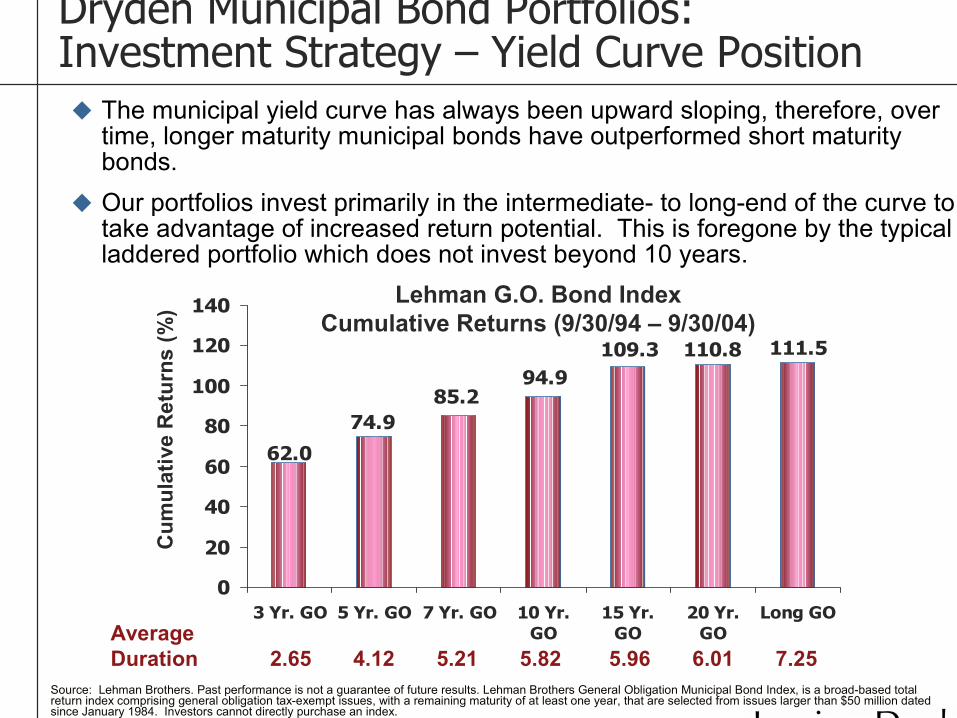
®Source: Lehman Brothers. Past performance is not a guarantee of future results. Lehman Brothers General Obligation Municipal Bond Index, is a broad-based total return index comprising general obligation tax-exempt issues, with a remaining maturity of at least one year, that are selected from issues larger than $50 million dated since January 1984. Investors cannot directly purchase an index.
111.5110.8109.394.9
85.274.9
62.0
0
20
40
60
80
100
120
140
3 Yr. GO 5 Yr. GO 7 Yr. GO 10 Yr.GO
15 Yr.GO
20 Yr.GO
Long GO
Lehman G.O. Bond IndexCumulative Returns (9/30/94 – 9/30/04)
Cum
ulat
ive
Ret
urns
(%)
AverageDuration 2.65 4.12 5.21 5.82 5.96 6.01 7.25
� The municipal yield curve has always been upward sloping, therefore, over time, longer maturity municipal bonds have outperformed short maturity bonds.
� Our portfolios invest primarily in the intermediate- to long-end of the curve to take advantage of increased return potential. This is foregone by the typical laddered portfolio which does not invest beyond 10 years.
Dryden Municipal Bond Portfolios:Investment Strategy – Yield Curve Position
17R\JD\3Q04 MAP\Mgd Acct Field Pres Muni 09-30-04 a
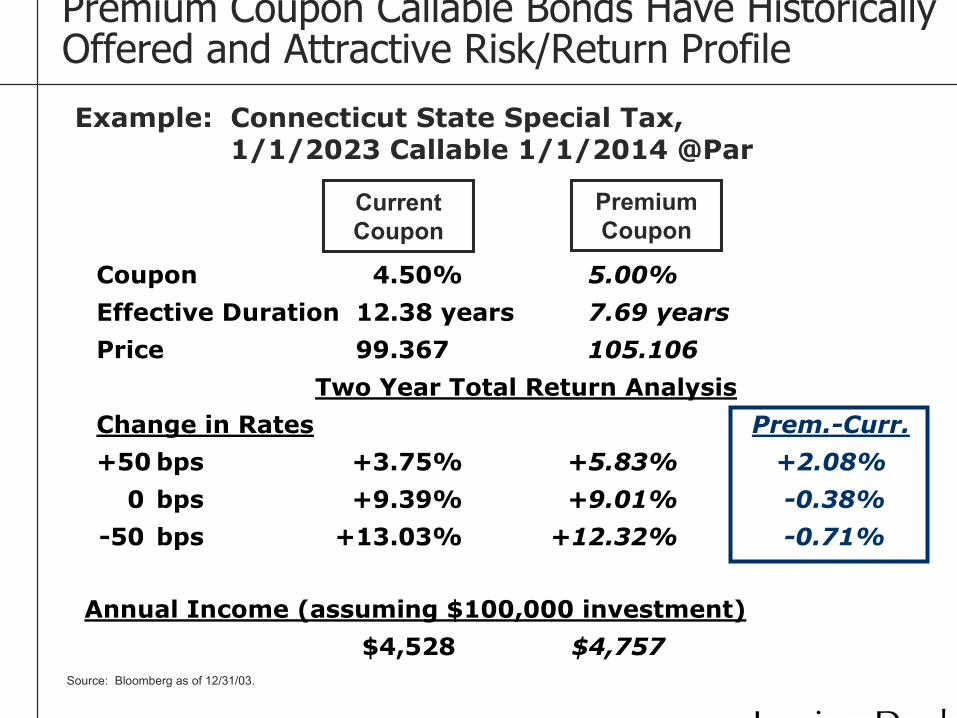
®Source: Bloomberg as of 12/31/03.
Premium Coupon Callable Bonds Have Historically Offered and Attractive Risk/Return Profile
Example: Connecticut State Special Tax, 1/1/2023 Callable 1/1/2014 @Par
Coupon 4.50% 5.00%
Effective Duration 12.38 years 7.69 years
Price 99.367 105.106
Two Year Total Return Analysis
Change in Rates Prem.-Curr.
+50 bps +3.75% +5.83% +2.08%
0 bps +9.39% +9.01% -0.38%
-50 bps +13.03% +12.32% -0.71%
Annual Income (assuming $100,000 investment)
$4,528 $4,757
Current Coupon
Premium Coupon
18R\JD\3Q04 MAP\Mgd Acct Field Pres Muni 09-30-04 a
®
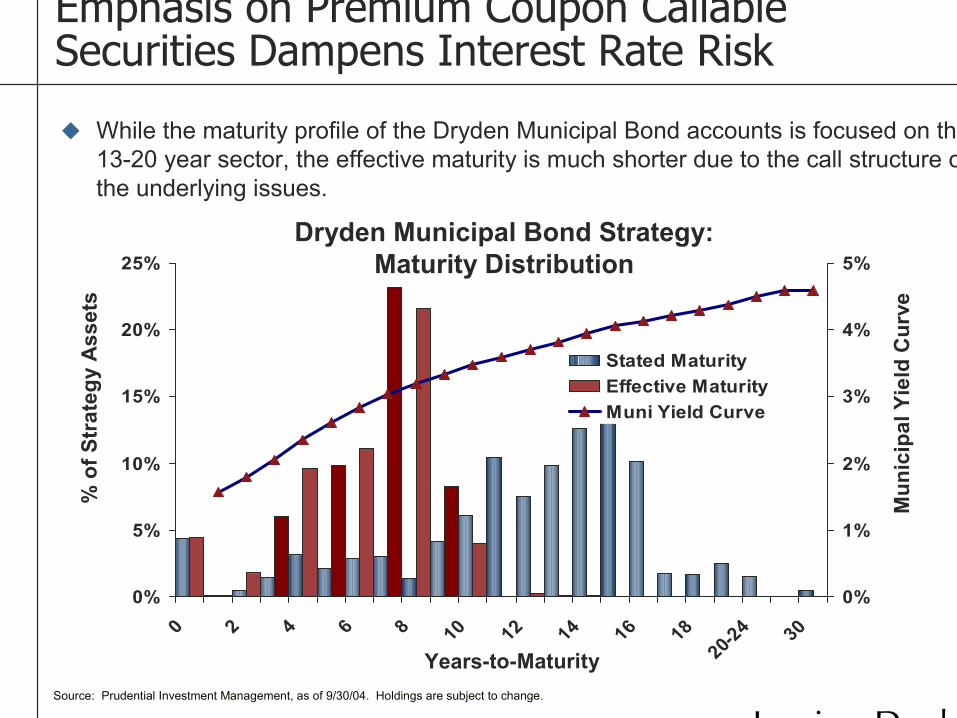
Emphasis on Premium Coupon Callable Securities Dampens Interest Rate Risk
Source: Prudential Investment Management, as of 9/30/04. Holdings are subject to change.
0%
5%
10%
15%
20%
25%
0 2 4 6 8 10 12 14 16 1820-2
4 30
0%
1%
2%
3%
4%
5%
Stated MaturityEffective MaturityMuni Yield Curve
Dryden Municipal Bond Strategy:Maturity Distribution
% o
f Str
ateg
y A
sset
s
Years-to-Maturity
� While the maturity profile of the Dryden Municipal Bond accounts is focused on the 13-20 year sector, the effective maturity is much shorter due to the call structure of the underlying issues.
Mun
icip
al Y
ield
Cur
ve
19R\JD\3Q04 MAP\Mgd Acct Field Pres Muni 09-30-04 a
®
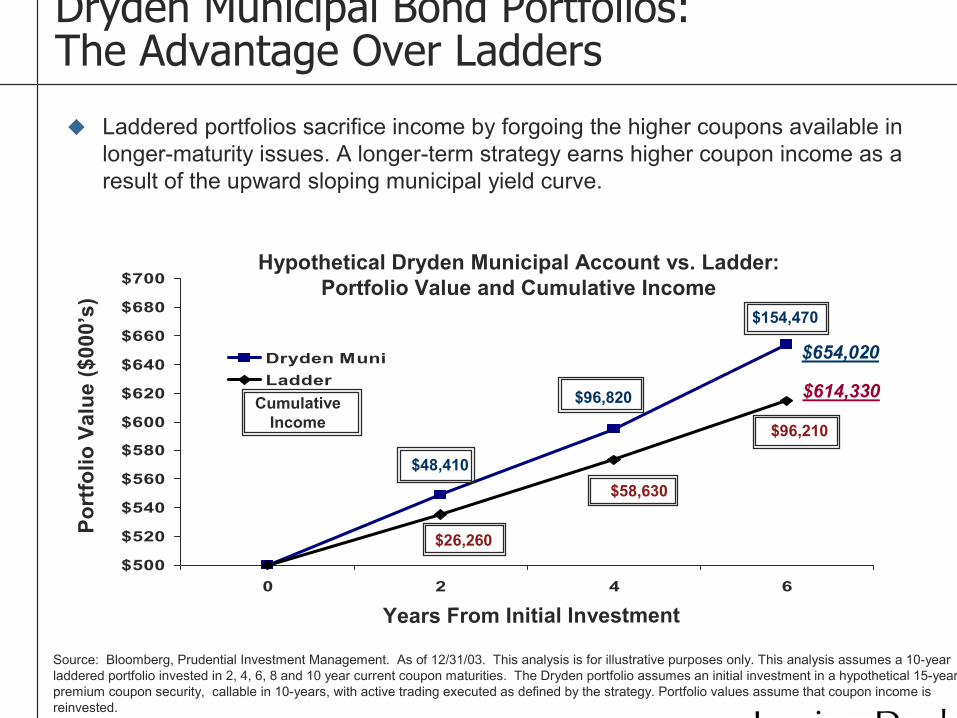
Dryden Municipal Bond Portfolios:The Advantage Over Ladders
$500
$520
$540
$560
$580
$600
$620
$640
$660
$680
$700
0 2 4 6
Dryden MuniLadder
Hypothetical Dryden Municipal Account vs. Ladder:Portfolio Value and Cumulative Income
Port
folio
Val
ue ($
000’
s)
Years From Initial Investment
� Laddered portfolios sacrifice income by forgoing the higher coupons available in longer-maturity issues. A longer-term strategy earns higher coupon income as a result of the upward sloping municipal yield curve.
$96,210
$58,630
$26,260
$154,470
$96,820
$48,410
CumulativeIncome
Source: Bloomberg, Prudential Investment Management. As of 12/31/03. This analysis is for illustrative purposes only. This analysis assumes a 10-year laddered portfolio invested in 2, 4, 6, 8 and 10 year current coupon maturities. The Dryden portfolio assumes an initial investment in a hypothetical 15-year premium coupon security, callable in 10-years, with active trading executed as defined by the strategy. Portfolio values assume that coupon income is reinvested.
$654,020
$614,330

20R\JD\3Q04 MAP\Mgd Acct Field Pres Muni 09-30-04 a
®
Dryden Municipal Bond Portfolios:The Advantage Over Ladders
$500
$510
$520
$530
$540
$550
$560
$570
$580
$590
$600
0 2 4 6
Dryden MuniLadder
Hypothetical Dryden Municipal Bond Account vs. Ladder:Portfolio Value and Cumulative Income
Port
folio
Val
ue ($
000’
s)
Years From Initial Investment
� The higher income stream and lower implied price volatility of premium coupon callable structures can lead to higher returns versus a laddered portfolio, even through periods of significantly rising interest rates (see illustration below).
� In a stable or falling rate environment, a longer-term portfolio may also provide greater price appreciation due to its longer duration and favorable roll-down characteristics compared to a ladder.
$106,750
$61,150
$26,260
$185,900
$109,640
CumulativeIncome
Source: Bloomberg, Prudential Investment Management. As of 12/31/03. This analysis is for illustrative purposes only. This analysis assumes a 10-year laddered portfolio invested in 2, 4, 6, 8 and 10 year current coupon maturities. The Dryden portfolio assumes an initial investment in a hypothetical 15-year premium coupon security, callable in 10-years, with active trading executed as defined by the strategy. Portfolio values assume that coupon income is reinvested. A parallel yield curve shift of +100 bps over each two year period is assumed for the interest rate scenario.
Interest Rate Scenario: +100 bps every 2 years
$48,410
$591,200$585,890
21R\JD\3Q04 MAP\Mgd Acct Field Pres Muni 09-30-04 a
®
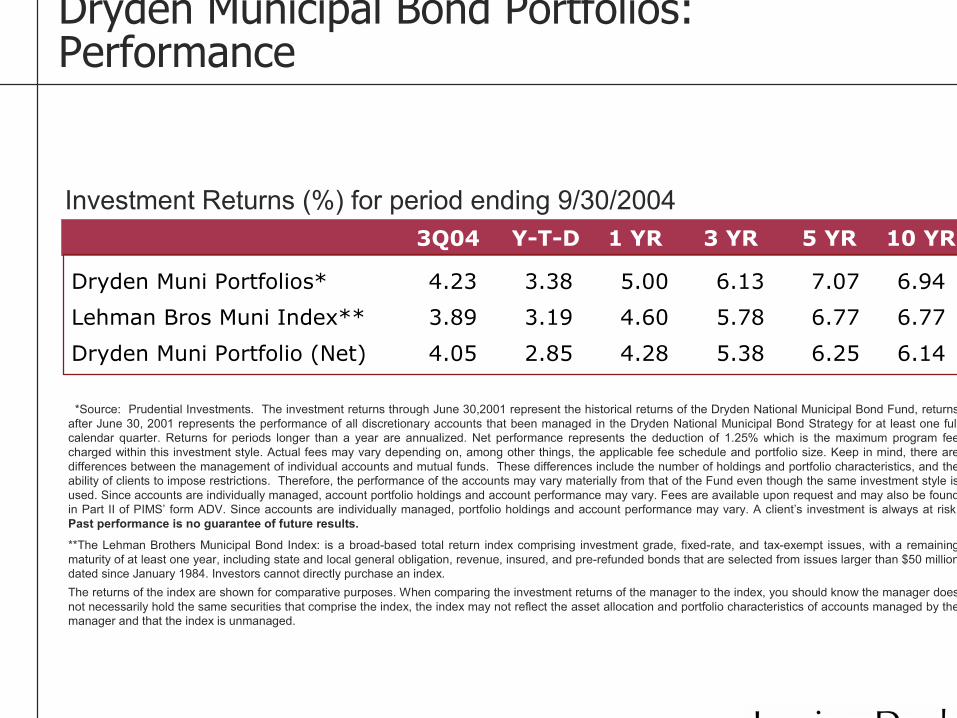
Investment Returns (%) for period ending 9/30/2004
Dryden Municipal Bond Portfolios:Performance
3Q04 Y-T-D 1 YR 3 YR 5 YR 10 YR
Dryden Muni Portfolios* 4.23 3.38 5.00 6.13 7.07 6.94
Lehman Bros Muni Index** 3.89 3.19 4.60 5.78 6.77 6.77
Dryden Muni Portfolio (Net) 4.05 2.85 4.28 5.38 6.25 6.14
*Source: Prudential Investments. The investment returns through June 30,2001 represent the historical returns of the Dryden National Municipal Bond Fund, returnsafter June 30, 2001 represents the performance of all discretionary accounts that been managed in the Dryden National Municipal Bond Strategy for at least one full calendar quarter. Returns for periods longer than a year are annualized. Net performance represents the deduction of 1.25% which is the maximum program fee charged within this investment style. Actual fees may vary depending on, among other things, the applicable fee schedule and portfolio size. Keep in mind, there are differences between the management of individual accounts and mutual funds. These differences include the number of holdings and portfolio characteristics, and the ability of clients to impose restrictions. Therefore, the performance of the accounts may vary materially from that of the Fund even though the same investment style is used. Since accounts are individually managed, account portfolio holdings and account performance may vary. Fees are available upon request and may also be found in Part II of PIMS’ form ADV. Since accounts are individually managed, portfolio holdings and account performance may vary. A client’s investment is always at risk. Past performance is no guarantee of future results.
**The Lehman Brothers Municipal Bond Index: is a broad-based total return index comprising investment grade, fixed-rate, and tax-exempt issues, with a remaining maturity of at least one year, including state and local general obligation, revenue, insured, and pre-refunded bonds that are selected from issues larger than $50 million dated since January 1984. Investors cannot directly purchase an index.The returns of the index are shown for comparative purposes. When comparing the investment returns of the manager to the index, you should know the manager does not necessarily hold the same securities that comprise the index, the index may not reflect the asset allocation and portfolio characteristics of accounts managed by the manager and that the index is unmanaged.
22R\JD\3Q04 MAP\Mgd Acct Field Pres Muni 09-30-04 a
®
5.33.23.4
5.5
12.510.6
4.8
-2.9
6.1
10.6
3.4
6.59.2
11.79.6
5.1
-2.1
4.42.9
4.8
9.811.3
4.0
-4.2
4.9
9.4
2.2
-10-505
1015202530
1996 1997 1998 1999 2000 2001 2002 2003 2004Y-T-D
Dryden Muni (Gross) Lehman Bros Muni Index**Dryden Muni (Net)
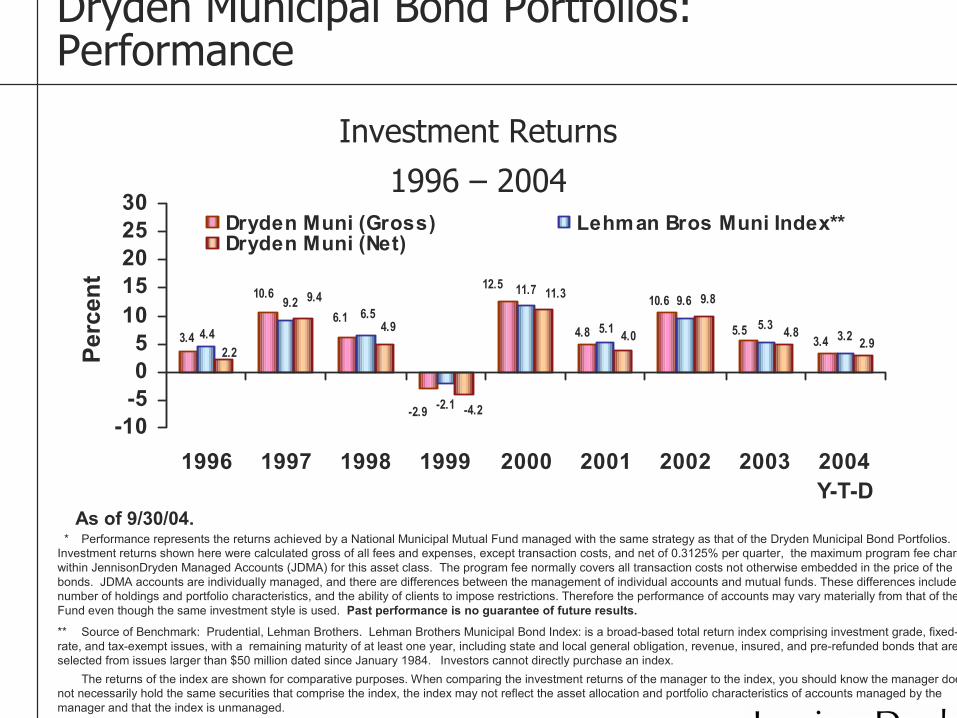
Investment Returns
1996 – 2004
* Performance represents the returns achieved by a National Municipal Mutual Fund managed with the same strategy as that of the Dryden Municipal Bond Portfolios. Investment returns shown here were calculated gross of all fees and expenses, except transaction costs, and net of 0.3125% per quarter, the maximum program fee charged within JennisonDryden Managed Accounts (JDMA) for this asset class. The program fee normally covers all transaction costs not otherwise embedded in the price of the bonds. JDMA accounts are individually managed, and there are differences between the management of individual accounts and mutual funds. These differences include the number of holdings and portfolio characteristics, and the ability of clients to impose restrictions. Therefore the performance of accounts may vary materially from that of the Fund even though the same investment style is used. Past performance is no guarantee of future results.
** Source of Benchmark: Prudential, Lehman Brothers. Lehman Brothers Municipal Bond Index: is a broad-based total return index comprising investment grade, fixed-rate, and tax-exempt issues, with a remaining maturity of at least one year, including state and local general obligation, revenue, insured, and pre-refunded bonds that are selected from issues larger than $50 million dated since January 1984. Investors cannot directly purchase an index.
The returns of the index are shown for comparative purposes. When comparing the investment returns of the manager to the index, you should know the manager does not necessarily hold the same securities that comprise the index, the index may not reflect the asset allocation and portfolio characteristics of accounts managed by the manager and that the index is unmanaged.
Perc
ent
As of 9/30/04.
Dryden Municipal Bond Portfolios:Performance

23R\JD\3Q04 MAP\Mgd Acct Field Pres Muni 09-30-04 a
®
Dryden Low-Duration Municipal Bond Portfolio
Investment Objective*� Maximizing after-tax returns from municipal bonds**
Investment Approach� Minimum size: $250,000 for national portfolios; $1 million for
single states� Currently offer state portfolios in California, Florida, New Jersey, New
York and Pennsylvania� Benchmark is Lehman Brothers 3-5 Year Municipal Bond Index***� Generally duration-neutral positions� Add value through optimal portfolio positioning and structure, and
comprehensive research* There can be no guarantee that the objective will be realized.** Income is generally free from federal taxes and state taxes for residents of the issuing state. While the interest income is tax-free, capital gains, if any, will be subject to taxes. Income for some investors may be subject to the federal Alternative Minimum Tax (AMT).
*** Lehman Brothers 3-5 Year Municipal Bond Index is a broad-based total return index comprising investment grade, fixed-rate, and tax-exempt issues, with a remaining maturity from 3 to 5 years, including state and local general obligation, revenue, insured, and pre-refunded bonds that are selected from issues larger than $50 million dated since January 1984. Investors cannot directly purchase an index.The returns of the index are shown for comparative purposes. When comparing the investment returns of the manager to the index, you should know the manager does not necessarily hold the same securities that comprise the index, the index may not reflect the asset allocation and portfolio characteristics of accounts managed by the manager and that the index is unmanaged.
CURRENTLY AVAILABLE IN JDMA
24R\JD\3Q04 MAP\Mgd Acct Field Pres Muni 09-30-04 a
®
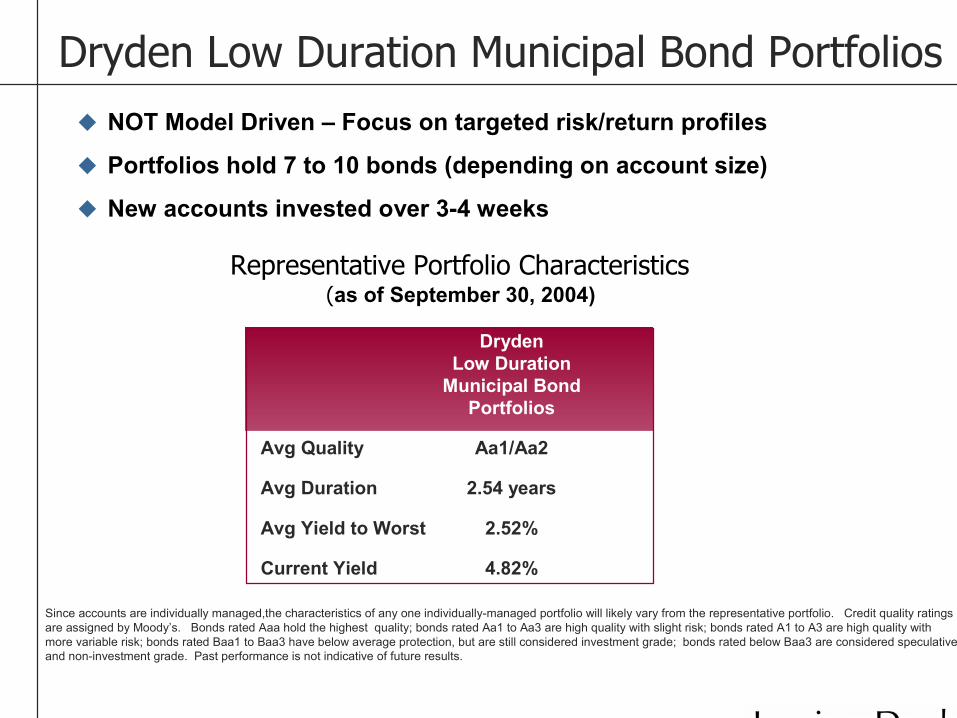
Dryden Low Duration Municipal Bond Portfolios� NOT Model Driven – Focus on targeted risk/return profiles
� Portfolios hold 7 to 10 bonds (depending on account size)
� New accounts invested over 3-4 weeks
Representative Portfolio Characteristics(as of September 30, 2004)
Since accounts are individually managed,the characteristics of any one individually-managed portfolio will likely vary from the representative portfolio. Credit quality ratings are assigned by Moody’s. Bonds rated Aaa hold the highest quality; bonds rated Aa1 to Aa3 are high quality with slight risk; bonds rated A1 to A3 are high quality with more variable risk; bonds rated Baa1 to Baa3 have below average protection, but are still considered investment grade; bonds rated below Baa3 are considered speculative and non-investment grade. Past performance is not indicative of future results.
DrydenLow Duration
Municipal BondPortfolios
Avg Quality Aa1/Aa2
Avg Duration 2.54 years
Avg Yield to Worst 2.52%
Current Yield 4.82%
25R\JD\3Q04 MAP\Mgd Acct Field Pres Muni 09-30-04 a
®
0%
1%
2%
3%
4%
5%
6%
1 2 3 4 5 7 10 15 20 25 30
9/30/2004
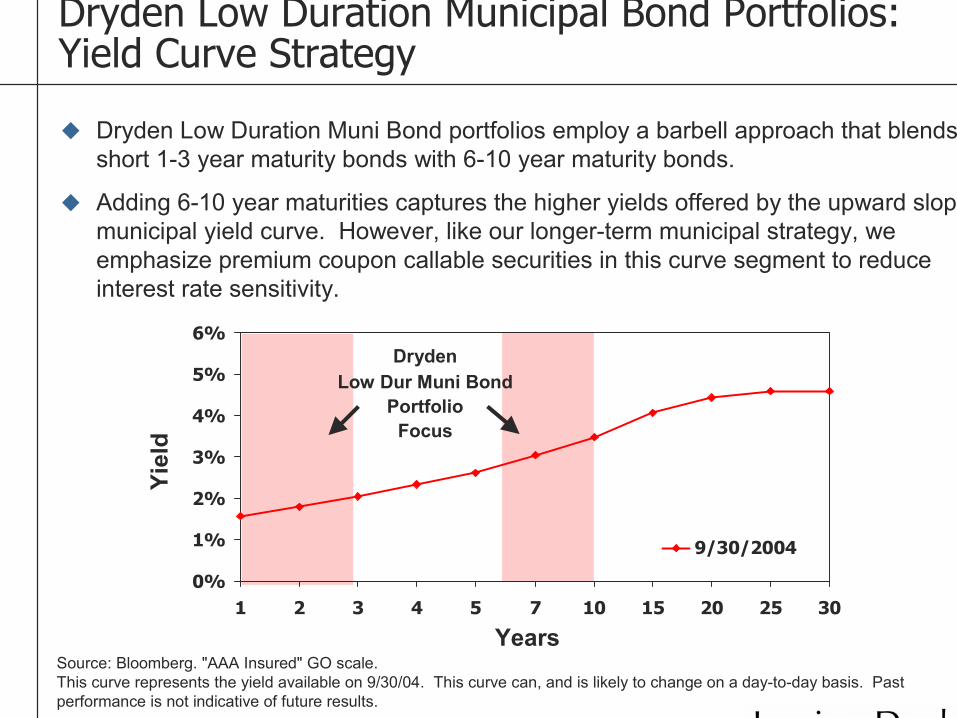
Source: Bloomberg. "AAA Insured" GO scale.This curve represents the yield available on 9/30/04. This curve can, and is likely to change on a day-to-day basis. Past performance is not indicative of future results.
� Dryden Low Duration Muni Bond portfolios employ a barbell approach that blends short 1-3 year maturity bonds with 6-10 year maturity bonds.
� Adding 6-10 year maturities captures the higher yields offered by the upward sloping municipal yield curve. However, like our longer-term municipal strategy, we emphasize premium coupon callable securities in this curve segment to reduce interest rate sensitivity.
Yiel
d
Years
DrydenLow Dur Muni Bond
PortfolioFocus
Dryden Low Duration Municipal Bond Portfolios:Yield Curve Strategy
26R\JD\3Q04 MAP\Mgd Acct Field Pres Muni 09-30-04 a
®
IV
Appendix
� Biographies
� Disclosure

27R\JD\3Q04 MAP\Mgd Acct Field Pres Muni 09-30-04 a
®
Your Portfolio Management TeamRobert Tipp CFA, is Chief Investment Strategist of PIM’s Fixed Income Group. He is co-portfolio manager of Municipal Bond, Core Plus, U.S. Government, and Global Bond strategies, and is portfolio manager for Asset-Liability strategies and TIPs portfolios. Previously, Mr. Tipp served as co-head of PrudentialFinancial’s institutional fixed income business. Before joining Prudential Financial in 1991, Mr. Tipp was a Director in the Portfolio Strategies Group at the First Boston Corporation, where he developed, marketed, and implemented strategic portfolio products for money managers. Prior to that, Mr. Tipp was a senior staff analyst at the Allstate Research & Planning Center, and managed a number of fixed income and equity derivative strategies at Wells Fargo Investment Advisors. He received a Bachelor of Science (BS) in Business Administration with highest honors and a Master in Business Administration (MBA) in Finance with honors from the University of California, Berkeley. Mr. Tipp holds the Chartered Financial Analyst (CFA) designation.
Dennis Hepworth is Principal and municipal bond portfolio manager for Prudential Fixed Income. He is also Head of the Municipal Bond Research unit, where he covers real estate, housing (multi-family & single family), public power, cogeneration and unrated corporate backed bonds. Prior to joining the Prudential Fixed Income in 1997, Dennis was a sell side municipal research analyst at Prudential Securities, and a senior analyst in the Capital Markets Credit and Private Client areas of Merrill Lynch. He received a BS in Finance from the University of Tulsa. Dennis is a member of the Municipal Analysts Group of New York and the National Federation of Municipal Analysts.
Robert Germano is Vice President and municipal bond portfolio manager for Prudential Fixed Income. He manages several specialty state funds and an insured tax-exempt fund. Prior to joining Prudential Financial in 2002, Bob owned an investment firm, Germano Municipals Corp., where he advised tax-exempt portfolio managers on the fundamentals of portfolio construction and risk management strategies. Prior to that, Bob was an institutional salesperson for Dillon Read & Co. and Lazard Freres & Co., and was also the National Institutional Sales Manager for Drexel Burnham Lambert and Shearson Lehman Brothers. Bob also built and managed an institutional sales force for Seattle Northwest Securities Corp. He received a BS from the University of Xavier.

28R\JD\3Q04 MAP\Mgd Acct Field Pres Muni 09-30-04 a
®
Your Portfolio Management TeamPhillip Slepian is an Analyst for Prudential Fixed Income’s Municipal Bond team. He assists in trading municipal securities for mutual fund and managed account portfolios, as well as assists in portfolio strategies for managed accounts. Prior to joining Prudential Financial in 2003, Phil was Manager of Fixed Income Trading for JB Oxford & Company in New York. He has been a fixed income securities trader and underwriter since 1983. Phil earned his Bachelor of Arts, cum laude in Sociology from Yeshiva University, New York City. He is a NASD Municipal Securities Registered Principal.
Glenwyn P. Baptist, CFA is the Director of Mutual Funds & Managed Accounts for Prudential Fixed Income. Glen is responsible for Prudential Fixed Income’s mutual fund and individual client managed account business. He oversees the product management of these products, including product development and positioning, investment communication and client service. Prior to taking on this role, Glen was Chief Operating Officer for Asset Management, responsible for business administration. Prior to becoming COO, he spent 6 years as Managing Director in charge of Fixed Income Research. Glen joined Prudential in 1986. He has a B.A. from St. Joseph’s College of Commerce, Bangalore University, and an M.B.A. from Northwestern University. He is a Chartered Financial Analyst and a Registered Representative.
Scott Sweitzer is a Portfolio Advisor for Prudential Fixed Income’s retail products and is responsible for investment communications and client service for Prudential Fixed Income’s separately managed retail fixed income portfolios, as well as the other retail portfolios and mutual funds managed by Prudential Fixed Income. Prior to joining Prudential Fixed Income in October, 2001, Scott spent five years at Prudential Investment Management as a mutual fund product manager responsible for fixed income funds, and as a marketing manager for portfolio management communications. Scott joined Prudential Financial in1991. He has a BA from Lock Haven University of Pennsylvania, and an MBA from Rutgers, Graduate School of Management.
29R\JD\3Q04 MAP\Mgd Acct Field Pres Muni 09-30-04 a
®
Steven Raab is a Portfolio Advisor for Prudential Fixed Income’s retail products and is responsible for investment communications and client service for Prudential Fixed Income’s separately managed retail fixed income portfolios, as well as the other retail portfolios and mutual funds managed by Prudential Fixed Income. Prior to joining Prudential Fixed Income in October, 2002, Steven spent three years at UBS Global Asset Management as a product manager responsible for fixed income funds. Prior to that Steven spent five years with GE Asset Management, various roles in Product Management and Marketing & Communication. He has a BBA in Finance from IONA College, New Rochelle New York.
Your Portfolio Management Team

30R\JD\3Q04 MAP\Mgd Acct Field Pres Muni 09-30-04 a
®
DisclosurePrudential Fixed Income is a unit of Prudential Investment Management, Inc. (“PIM”), a registered investment adviser and a Prudential Financial company. Pruco Securities Corporation (member SIPC), 751 Broad Street Newark NJ 07102. Prudential Securities and Pruco Securities are Prudential Financial companies. Prudential Financial is a service mark of The Prudential Insurance Company of America., Newark, NJ and its affiliates. Performance Descriptions: The investment returns through June 30,2001 represent the historical returns of the Dryden National Municipal Bond Fund, returns after June 30,2001 represents the performance of all discretionary accounts that been managed in the Dryden Municipal Bond Strategy for at least one full calendar quarter. Returns for periods longer than a year are annualized. Net performance represents the deduction of 1.25% which is the maximum program fee charged within this investment style.Actual fees may vary depending on,among other things,the applicable fee schedule and portfolio size. PIMS’ form ADV. Since accounts are individually managed,account portfolio holdings and account performance may vary. Keep in mind, there are differences between the management of individual accounts and mutual funds. These differences include the number of holdings and portfolio characteristics, and the ability of clients to impose restrictions. Therefore, the performance of the accounts may vary materially from that of the Fund even though the same investment style is used. Past performance is no guarantee of future results.
Definitions:Duration is a measure of the price volatility of a bond equal to the weighted average term to maturity of the bond’s cash flows. The weights are the present values of each cash flow as a percentage of the present value of all cash flows. The greater the duration of a bond, the greater its percentage price volatility.
Yield to Worst: At the time of security analysis, the yield to worst is the lowest yield that a buyer can expect amongst the standard return measures such as yield to maturity, yield to call, and yield to refunding.
Current Yield represents the income generated by the portfolio and is calculated by dividing the portfolio’s weighted average coupon by its weighted average price.
Benchmark Descriptions:Lehman Brothers Municipal Bond Index: is a broad-based total return index comprising investment grade, fixed-rate, and tax-exempt issues, with a remaining maturity of at least one year, including state and local general obligation, revenue, insured, and pre-refunded bonds that are selected from issues larger than $50 million dated since January 1984. Investors cannot directly purchase an index.
Lehman Brothers 3-5 Year Municipal Bond Index is a broad-based total return index comprising investment grade, fixed-rate, and tax-exempt issues, with a remaining maturity from 3 to 5 years, including state and local general obligation, revenue, insured, and pre-refunded bonds that are selected from issues larger than $50 million dated since January 1984. Investors cannot directly purchase an index.The returns of the index are shown for comparative purposes. When comparing the investment returns of the manager to the index, you should know the manager does not necessarily hold the same securities that comprise the index, the index may not reflect the asset allocation and portfolio characteristics of accounts managed by the manager and that the index is unmanaged. Credit Ratings: Are assigned by Moody’s and Standard & Poors and are a formal evaluation of a company’s credit history and capability of repaying obligations. Ratings range from AAA (which are judged to be of the best quality) through C (which are regarded as having extremely poor prospects of ever attaining any real investment standing)
IFS-A092608 6/2004