jefferies 2015 health care conference realty v3... · 2 executive summary doc is an internally...
TRANSCRIPT

June 4, 2015
Jefferies 2015 Health Care Conference
Scottsdale Healthcare Rehabilitation Hospital Peachtree Dunwoody Medical Center

1
Forward Looking Statements This document may contain “forward-looking” statements as defined in the Private Securities Litigation Reform Act of 1995. These forward-looking statements concern and are based upon, among other things, the possible expansion of the company’s portfolio; the sale of properties; the performance of its operators/tenants and properties; its ability to enter into agreements with new viable tenants for vacant space or for properties that the company takes back from financially troubled tenants, if any; its occupancy rates; its ability to acquire, develop and/or manage properties; the ability to successfully manage the risks associated with international expansion and operations; its ability to make distributions to shareholders; its policies and plans regarding investments, financings and other matters; its tax status as a real estate investment trust; its critical accounting policies; its ability to appropriately balance the use of debt and equity; its ability to access capital markets or other sources of funds; its ability to meet its earnings guidance; and its ability to finance and complete, and the effect of, future acquisitions. When the company uses words such as “may,” “will,” “intend,” “should,” “believe,” “expect,” “anticipate,” “project,” “estimate” or similar expressions, it is making forward-looking statements. Forward-looking statements are not guarantees of future performance and involve risks and uncertainties. The company’s expected results may not be achieved, and actual results may differ materially from expectations. This may be a result of various factors, including, but not limited to: material differences between actual results and the assumptions, projections and estimates of occupancy rates, rental rates, operating expenses and required capital expenditures; the status of the economy; the status of capital markets, including the availability and cost of capital; issues facing the health care industry, including compliance with, and changes to, regulations and payment policies, responding to government investigations and punitive settlements and operators’/tenants’ difficulty in cost-effectively obtaining and maintaining adequate liability and other insurance; changes in financing terms; competition within the health care, seniors housing and life science industries; negative developments in the operating results or financial condition of operators/tenants, including, but not limited to, their ability to pay rent and repay loans; the company’s ability to transition or sell facilities with profitable results; the failure to make new investments as and when anticipated; acts of God affecting the company’s properties; the company’s ability to re-lease space at similar rates as vacancies occur; the failure of closings to occur as and when anticipated, including the receipt of third-party approvals and health care licenses without unexpected delays or conditions; the company’s ability to timely reinvest sale proceeds at similar rates to assets sold; operator/tenant or joint venture partner bankruptcies or insolvencies; the cooperation of joint venture partners; government regulations affecting Medicare and Medicaid reimbursement rates and operational requirements; regulatory approval and market acceptance of the products and technologies of life science tenants; liability or contract claims by or against operators/tenants; unanticipated difficulties and/or expenditures relating to future acquisitions and the integration of multi-property acquisitions; environmental laws affecting the company’s properties; changes in rules or practices governing the company’s financial reporting; the movement of U.S. and foreign currency exchange rates; and legal and operational matters, including real estate investment trust qualification and key management personnel recruitment and retention. Finally, the company assumes no obligation to update or revise any forward-looking statements or to update the reasons why actual results could differ from those projected in any forward-looking statements.

2
Executive Summary
DOC is an internally managed healthcare REIT formed in 2013 with a focus on acquiring, selectively developing, owning
and managing medical office buildings (“MOB”) and other healthcare facilities
As of 1Q’15, DOC owns 109 properties across 22 states, spanning 4.0mm sq. ft. of gross leasable area (“GLA”)
77% of NOI is MOB focused
95% leased
77% of NOI is on campus / affiliated
Disciplined acquisition strategy focuses on off-market or lightly marketed transactions with a target deal size of $10 - $50
million, which typically limits competition from larger players and maximizes risk-adjusted returns
Management team has maintained extremely low leverage while investing over $900 million in real estate assets since IPO
in 2013
As of 1Q’15, leverage is ~15% of total assets and net debt / adjusted EBITDA¹ is 1.8x
In addition to maintaining low overall leverage, Company plans to limit secured leverage by utilizing a prudent mix of equity
& unsecured debt capital going forward
All data as of 3/31/2015 (1) Represents 1Q’15 annualized EBITDA adjusted for stock based compensation and acquisition-related expenses
3
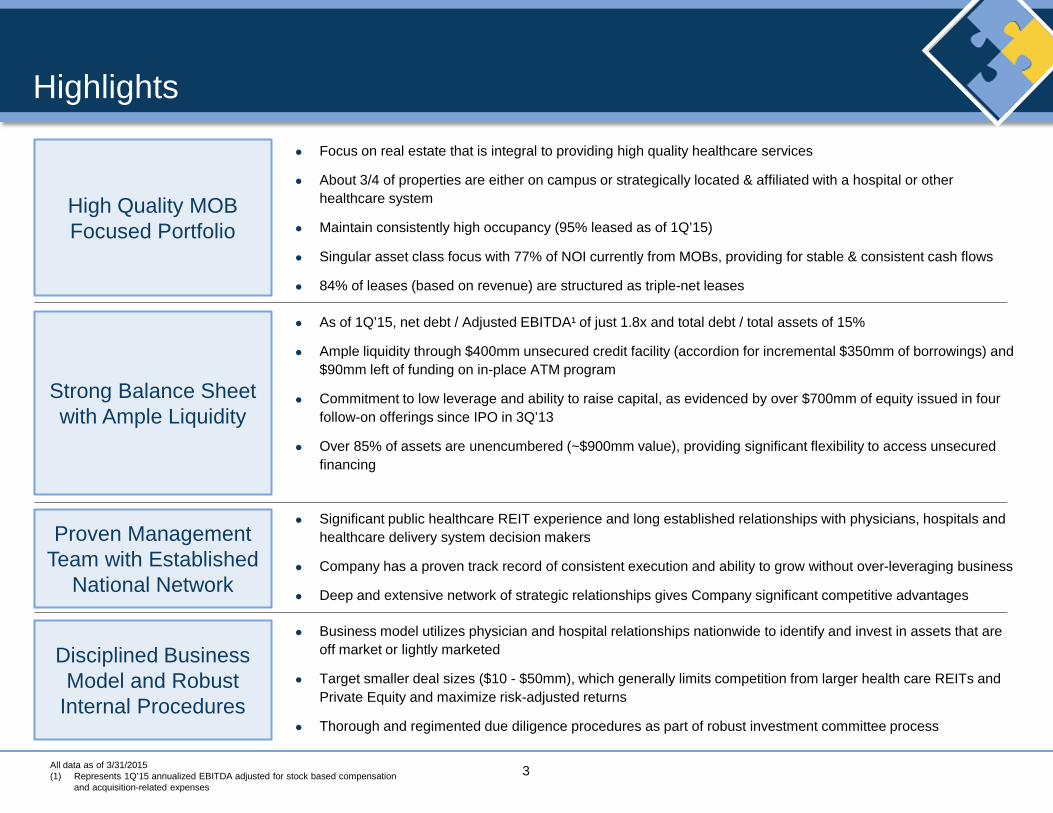
Highlights
High Quality MOB Focused Portfolio
Strong Balance Sheet with Ample Liquidity
Proven Management Team with Established
National Network
Disciplined Business Model and Robust
Internal Procedures
Focus on real estate that is integral to providing high quality healthcare services
About 3/4 of properties are either on campus or strategically located & affiliated with a hospital or other healthcare system
Maintain consistently high occupancy (95% leased as of 1Q’15)
Singular asset class focus with 77% of NOI currently from MOBs, providing for stable & consistent cash flows
84% of leases (based on revenue) are structured as triple-net leases
As of 1Q’15, net debt / Adjusted EBITDA¹ of just 1.8x and total debt / total assets of 15%
Ample liquidity through $400mm unsecured credit facility (accordion for incremental $350mm of borrowings) and $90mm left of funding on in-place ATM program
Commitment to low leverage and ability to raise capital, as evidenced by over $700mm of equity issued in four follow-on offerings since IPO in 3Q’13
Over 85% of assets are unencumbered (~$900mm value), providing significant flexibility to access unsecured financing
Significant public healthcare REIT experience and long established relationships with physicians, hospitals and healthcare delivery system decision makers
Company has a proven track record of consistent execution and ability to grow without over-leveraging business
Deep and extensive network of strategic relationships gives Company significant competitive advantages
Business model utilizes physician and hospital relationships nationwide to identify and invest in assets that are off market or lightly marketed
Target smaller deal sizes ($10 - $50mm), which generally limits competition from larger health care REITs and Private Equity and maximize risk-adjusted returns
Thorough and regimented due diligence procedures as part of robust investment committee process
All data as of 3/31/2015 (1) Represents 1Q’15 annualized EBITDA adjusted for stock based compensation and acquisition-related expenses
4
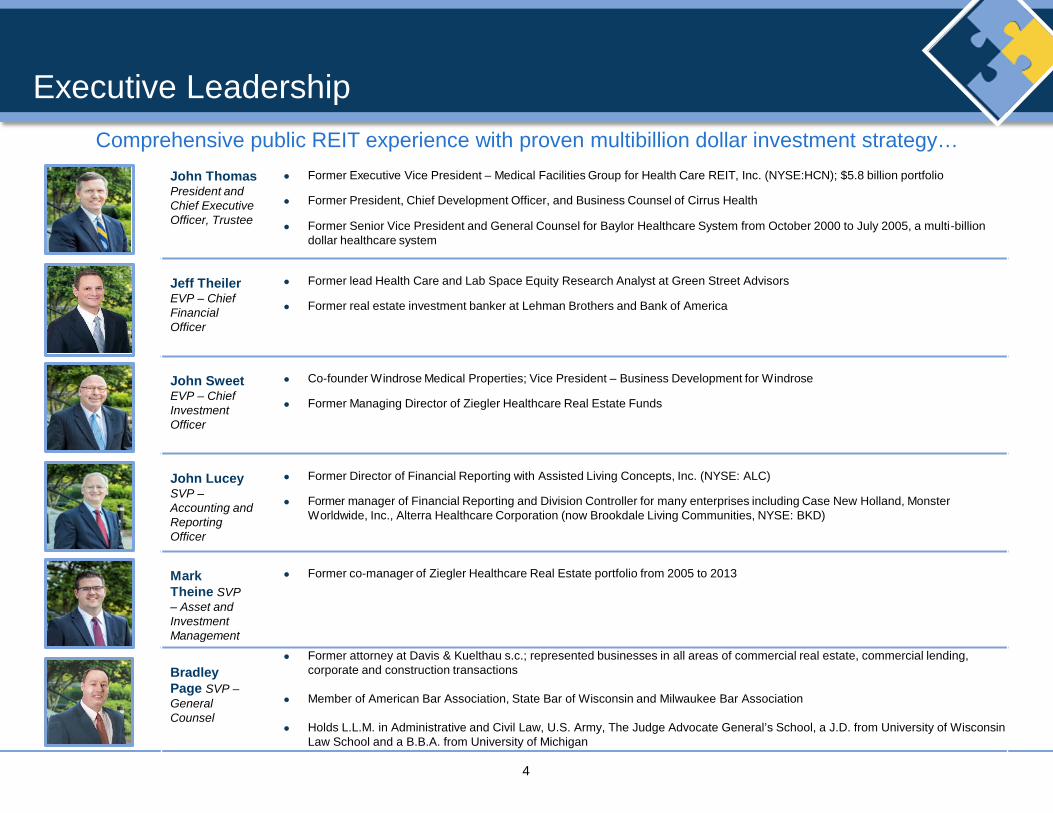
Executive Leadership Comprehensive public REIT experience with proven multibillion dollar investment strategy…
John Thomas President and Chief Executive Officer, Trustee
Former Executive Vice President – Medical Facilities Group for Health Care REIT, Inc. (NYSE:HCN); $5.8 billion portfolio
Former President, Chief Development Officer, and Business Counsel of Cirrus Health Former Senior Vice President and General Counsel for Baylor Healthcare System from October 2000 to July 2005, a multi-billion
dollar healthcare system
Jeff Theiler EVP – Chief Financial Officer
Former lead Health Care and Lab Space Equity Research Analyst at Green Street Advisors
Former real estate investment banker at Lehman Brothers and Bank of America
John Sweet EVP – Chief Investment Officer
Co-founder Windrose Medical Properties; Vice President – Business Development for Windrose
Former Managing Director of Ziegler Healthcare Real Estate Funds
John Lucey SVP – Accounting and Reporting Officer
Former Director of Financial Reporting with Assisted Living Concepts, Inc. (NYSE: ALC)
Former manager of Financial Reporting and Division Controller for many enterprises including Case New Holland, Monster Worldwide, Inc., Alterra Healthcare Corporation (now Brookdale Living Communities, NYSE: BKD)
Mark Theine SVP – Asset and Investment Management
Former co-manager of Ziegler Healthcare Real Estate portfolio from 2005 to 2013
Bradley Page SVP – General Counsel
Former attorney at Davis & Kuelthau s.c.; represented businesses in all areas of commercial real estate, commercial lending, corporate and construction transactions
Member of American Bar Association, State Bar of Wisconsin and Milwaukee Bar Association Holds L.L.M. in Administrative and Civil Law, U.S. Army, The Judge Advocate General’s School, a J.D. from University of Wisconsin
Law School and a B.B.A. from University of Michigan

5
Board of Directors
Expertise in healthcare operations, healthcare policy, hospital and physician administration
Tommy Thompson Former Secretary of U.S. Health and Human Services; Former Governor, state of Wisconsin
Founding chairman Deloitte Center for Health Solutions, previously senior adviser to Deloitte and Touche USA LLP
Current board member of: CareView Communications, Inc., Centene Corporation, C.R. Bard Inc., United Therapeutics Corporation, among others
Stanton Anderson Senior Counsel to the President and CEO of the U.S. Chamber of Commerce where he served as Executive Vice President and Chief Legal Officer
Former Director and Audit Committee Chairman for CB Richard Ellis
Former partner with McDermott Will & Emery
Mark Baumgartner
Senior Managing Director – Chief Credit Officer, B.C. Ziegler and Company
Albert Black Current President and CEO of On-Target Supplies & Logistics, Ltd.
Former Past Chairman of Baylor Health Care System Dallas
Former Chairman, Dallas Regional Chamber of Commerce
Richard Weiss, Esq. Former Board Chair for Washington Hospital Center and current Finance Board Chair for Aurora Healthcare
Former Trustee for Medical College of Wisconsin and board Chairman of a private psychiatric hospital
Former Partner with Foley & Lardner
William Ebinger, M.D. Practicing Physician / Executive with Aurora Healthcare, the largest healthcare delivery system in Wisconsin
Current President of Aurora Medical Center in Grafton, Wisconsin
Member of American Board of Internal Medicine

6
Company History
Dec-2013 Jun-2014 Dec-2014 Jun-2015 Jun-2013
07/24/13: Completed IPO with public listing on NYSE and raising $124mm of net proceeds at $11.50 per share
12/11/13: Completed 1st equity follow-on, raising $103mm of net proceeds at $11.50 per share
5/27/14: Completed 2nd equity follow-on, raising $150mm of net proceeds at $12.50 per share
1/8/15: Hired Bradley D. Page as the Company’s Senior VP General Counsel to build out Legal department
8/30/13: Closed on 1st senior secured line of credit with syndicate of banks led by Regions Bank (initially $75mm of capacity with a $175mm accordion)
5/14/14: Hired Jeff Theiler as the Company’s CFO to further build out Finance department
8/19/14: Put in place a $150mm ATM equity follow-on program
9/18/14: Closed on a new $400mm unsecured revolving credit facility led by KeyBanc and repaid previous secured facility
9/12/14: Completed 3rd equity follow-on, raising $146mm of net proceeds at $14.00 per share
1/21/15: Completed 4th equity follow-on, raising $297mm of net proceeds at $16.40 per share
DOC has demonstrated an ability to access capital to fund growth since 2013 IPO
Own over $1bn of gross real estate
assets today

7
$124
$206 $256
$404
$477
$713
$819
$1,048
$1,419
IPO Q3 2013 Q4 2013 Q1 2014 Q2 2014 Q3 2014 Q4 2014 Current(3/31/15)
Q4 2015E
Disciplined Approach to Growth: Where are We Going? More than $900 million invested since IPO…
…typically acquired in off-market or lightly marketed transactions
Portfolio Growth:
Grew total real estate assets to $1.05 billion from $124 million at the time of IPO in July 2013
Increased net leasable square footage to 4.0 million from 0.5 million at IPO
Improved geographic concentration from 10 states at IPO to 22 states
Capital Raising:
Completed four follow-on equity offerings, issuing over $700 million in equity
$400 million unsecured credit facility with expansion potential to $750 million
Performance Achievements:
First quarter 2015 total revenue of $24.5 million, up 205% year-over-year
First quarter 2015 rental revenue of $20.3 million, a 199% year-over-year increase
95% leased in 1Q15, up from 94% in 1Q14
Based on midpoint of Company guidance ($500 -
$700mm) for 2015
acquisitions
All data as of 3/31/2015
Gross Real Estate Assets ($ in millions)

8
Proven Track Record of Consistent Execution
58% total return in less than 2 years since IPO
Total Return Data as of 6/1/15
58%
19%
4%
30%
(25.0%)
(15.0%)
(5.0%)
5.0%
15.0%
25.0%
35.0%
45.0%
55.0%
65.0%
75.0%
DOC MSCI US REIT (RMS) SNL US REIT Healthcare S&P 500

9
$2,1
67
$2,3
03
$2,4
12
$2,5
04
$2,5
99
$2,6
93
$2,7
93
$2,8
95
$3,0
57
$3,2
07
$3,3
86
$3,5
79
$3,7
97
$4,0
42
$4,3
07
$4,5
78
$4,8
62
$5,1
59
($ in billions)
0
20
40
60
80
100
120
1960 1970 1980 1990 2000 2010 2020P 2030P 2040P 2050P 2060PNum
ber o
f Per
sons
65+
(milli
ons)
65 to 74 75 - 84 85+
U.S. healthcare industry boosted by increasing number of insured and aging population
Growing Demand for Healthcare Services
Aging baby boomer demographic and projected growth
Between 2010 and 2060, the US population over 65 years is projected to more than double from 40.4 million to nearly 98.2 million
Dramatic increase in doctor visits with older population
Affordable Care Act will further accelerate economic demand and growth
Provides mechanisms for 30 million uninsured to obtain insurance
Incentivizes the integration of care among multiple providers in a single location
Consumer choice and government policy driving healthcare providers to purpose built clinically efficient real estate solutions
Maximize consumer convenience and reach Maximize payer efficiency and reimbursement
Projected U.S. Population Aged 65+ (1960-2060)
U.S. National Healthcare Expenditures
Source: U.S. Census Bureau, US Centers for Disease Control and Prevention, Centers for Medicare & Medicaid Services, Office of the Actuary

10
Corporate Strategy
Maximize Risk-Adjusted Returns to
Shareholders
Physician Focused
Off-Market Transactions
Less Than $50 Million
Transaction Size
Opportunistic Development /
Takeout
• Work with our physician and hospital relationships nationwide to identify and invest in assets that are off market or lightly marketed
• Pursue a target deal size within $10 - $50 million.
Minimal competition from the larger health care REITs and Private Equity
• May engage in opportunistic pre-leased development or takeout opportunities to drive returns and provide access to premier properties before becoming subject to market pressures
We are health care executives, with a physician and provider focus

11
Acquisition Scope and Criteria: What Are We Looking For?
• Medical Office Buildings anchored by financially -sound Healthcare Delivery System (HDS) or Large Physician Group
• Property location and proximity to HDS, if important for the services in the facility
• Current and future demand and supply profile of providers and real estate
• Performance and future prospects of local HDS • Ability to integrate with existing portfolio and achieve
economies of scale • Current and future occupancy and rental rate metrics • Quality of Physical Facility (age, functionality, size,
appearance, etc.)
• Outpatient Care Integrated Medical Office Buildings
• Physician Group Practice Clinics
• Multi-Tenant On Campus MOBs
• Small Specialty Care Hospitals
• Ambulatory Surgery Centers
• LTACH or IRF Post Acute Care Hospitals Operated by National Operator
Acquisition Criteria Scope of Acquisitions
Disciplined approach to capital deployment strategically aligned with portfolio blueprint
Targeted opportunities consistent with management investment thesis

12
Deep and Extensive Relationships: Where Are We Investing?
Physicians Realty Trust understands the landlord and tenant relationship is a key element in a healthcare system’s or physician group’s decision to monetize its real estate assets
Trusted partner to healthcare delivery systems
Tenant mix can be a driver of physicians profitability
Health system and physician relationships have been and will be an important client reference for investment growth opportunities
Access third party resources to:
o Perform clinical market research and market analysis in addition to tenant financials review
o Perform property condition inspections
o Perform property tax and market rent analysis
Consistent legal team and title company, (legal team now in house) for consistent, efficient execution
Disciplined Management and Board Investment Committee Review and Board Review of all transactions over $15 million

13
Acquisition Success Stories – Minneapolis Portfolio
Medical Office Building Portfolio Minneapolis - St. Paul, MN Market
Number of Properties: 8
Square Feet: 362,654
Purchase Price: $116 million
Tenants: 80% affiliated with health systems or on campus
Consideration:
Combination of cash, common units or new preferred units in the OP and the assumption of approximately $5.8 million of debt
[To Be Updated with Picture]

14
Acquisition Success Stories – Peachtree Dunwoody Medical Center
Medical Office Building Atlanta, GA
Constructed: 1987
Square Feet: 131,368
Initial Lease Expiration: 5 years
Rent Escalator: 2.5%
Tenants: Northside Hospital (32%) Peachtree Orthopaedics (20%) Eight Additional Tenants
Additional Highlights: Ability to expand the building by an additional 30,000 rentable square feet
Peachtree Dunwoody Medical Center

15
Acquisition Success Stories – Crescent City & Meadowview Lane
Medical Office Building Kingsport, TN
Constructed: 2010
Square Feet: 60,000
Initial Lease Expiration: 2028
Rent Escalator: 3.0%
Tenants: Crescent City Surgical
Additional Highlights:
Upon contribution of their membership interest in CCSC Facility to the Company’s Operating Partnership, the physicians received 954,877 operating partnership units, valued at $11,534,909 for the purposes of this transaction, as well as additional cash consideration
Constructed: 2005
Square Feet: 64,200
Initial Lease Expiration: 2019
Rent Escalator: CPI Based
Tenants: Holston Medical Group
Additional Highlights: Awarded “Project of the Year” for 2005 by the Tri-Cities branch of the Associated General Contractors of Tennessee
Surgical Hospital Metairie, LA
Crescent City Surgical Center Meadowview Lane

16
Case Study: Wayne State University Physician Group

17
High Quality Portfolio: Where Are We Today?
Geographic Exposure (by square feet)
Proven portfolio of high quality assets primarily leased under long-term triple-net leases Portfolio occupancy of 95% Weighted average lease term of 8.7 years 72% of net leasable sq. ft. located within ¼ mile of a hospital
campus and/or affiliated with a healthcare delivery system Concentration in 22 states with strong demographic trends Strategic markets with strong demand generators and limited
new development in surrounding areas Excellent tenant credit support Direct leases with healthcare delivery systems Corporate and personal guarantees
Diversified tenants, geographies, and asset types generate reliable cash flows
All data as of 3/31/2015
Top Tenants
Lease Expiration Schedule (by square feet)
Georgia 16%
Texas 15%
Indiana 9%
Pennsylvania 8%
Minnesota 8%
Ohio 7%
Michigan 7%
New York 5%
Wisconsin 4%
Florida 4%
Other 18%
Tenants Lease Term % Revenue
LifeCare 13.0 5.8% East El Paso Physicians Medical Center 13.7 4.1% Wayne State University Physician Group 14.7 3.8% Crescent City Surgical Center 13.8 3.7% Foundation Hospital of San Antonio 14.2 3.6% Northside Hospital 7.9 2.8% Mid-Ohio Oncology 9.4 2.7% Pinnacle Health 9.5 2.5% Columbus Regional Health 11.0 2.3% University of Rochester Cancer Center 14.2 2.2% Top Ten Total 12.1 33.5%
2% 5% 5% 7% 7% 2% 2% 3%
8% 14%
39%

18
Geographic Footprint To Date
$1.05 B
Total Owned real estate assets
4.0 MM
Total square feet
72%
% of net leasable square footage affiliated or on hospital
campus
95%
% Leased
Data as of 3/31/2015; map includes 4 acquisitions announced subsequent to quarter end.
MOB (106 buildings) Hospital (4 buildings) LTACH (3 buildings)