jcer working paper aepr series
TRANSCRIPT
JCER Working Paper
AEPR series
No. 2017-1-6
This paper is under review for possible publication in the Asian
Economic Policy Review and is not the final peer reviewed
version.
This paper was prepared for the Twenty-fifth Asian Economic Policy Review (AEPR) Conference
“Four Years of Abenomics: Did it Succeed?,” April 8, 2017, Tokyo
April 2017
Asian Economic Policy Review
Japan Center for Economic Research
環境・エネルギー政策の影響試算
―試算に用いたモデルと分析手法に関するノート―
舘 祐太、小林辰男、落合勝昭
Has Abenomics Succeeded in Raising Japan’s Inward FDI?
Takeo Hoshi
(Stanford University)

To authors
If you want to introduce the same working paper you wrote and presented
at the AEPR conference held in Tokyo on Apr. 8, 2017, in your own/your
affiliation’s website, please be aware the following requirements.
To ensure that all citations and references to your published article are captured by
the SSCI (Social Sciences Citation Index), authors are required to amend the cover
page of your working paper as soon as practical after publication in AEPR. The
amended cover page should include the full article citation, journal name, volume
and issue, and DOI, as well as a hyperlink to the published article. Here is an
example of an amended working paper cover page.
JCER Working Paper
AEPR series
No.●●●
This is the pre-peer- reviewed version of the following article
“Japan's New Foreign Economic Policy: A Shift Toward a
Strategic and Activist Model?”, Asian Economic Policy Review,
vol. 2, issue 2, which has been published in final form at
http://onlinelibrary.wiley.com/doi/10.1111/j.1748-3131.2007.00
071.x/abstract and DOI: 10.1111/j.1748-3131.2007.00071.x.……
Full Cite
Link to final article

1
Has Abenomics Succeeded in Raising Japan’s Inward FDI?
Takeo Hoshi1
Stanford University, Tokyo Foundation, NBER, and ABFER
March 2017
1. Introduction Japan’s policy package that was introduced in early 2013 to pull Japan out of the economic stagnation for two decades or so became known as “Abenomics.” Consisting of three arrows of (1) bold monetary policy, (2) flexible fiscal policy, and (3) growth strategy to promote private investment, Abenomics was a mix of overall expansionary macroeconomic policy to stimulate the aggregate demand and structural reforms to increase the supply capacity. Since the continued low economic growth with mild deflation (but not deflationary spiral) despite expansionary monetary policies suggested that the supply side of the economy was also a problem, the policy to combine (further) monetary and fiscal expansions with the supply side policies. Abenomics initially targeted 3% nominal growth and 2% real growth on average of GDP over 10 years (Headquarters for Japan’s Economic Revitalization 2013, p.2). The economy responded favorably initially. Figure 1 shows Japan’s nominal GDP and real GDP against their growth paths that will be achieved if the targets are hit. All the variables are measured in natural log scale so that a constant growth shows up as a linear trend. The bold solid line shows the real GDP and the bold broken line shows the nominal GDP. Two straight lines shows the trend implied by 3% growth for nominal GDP (upper) and the trend implied by 2% growth for real GDP (lower). The real GDP traced the target trend closely during 2013 but started to deviate around mid-2014. The nominal GDP similarly deviated from the target around mid-2014. Although the nominal GDP seemed to have gone back to the trend in 2015, it quickly deviated again. Thus, in terms of the aggregate growth rate goals, the success of Abenomics was short-lived. As of this writing, Abenomics is entering its fifth year. It seems to be a good time to reflect on which parts of Abenomics worked, why it is having hard time achieving the targets, and what adjustments are necessary to become effective going forward. This paper focuses on one specific policy in the third arrow of Abenomics: policy to promote foreign direct investment (FDI) coming into Japan. Promotion of inward FDI was one of the many policies specified in the original growth strategy that was formulated in June 2013 (Headquarters for Japan’s Economic Revitalization 2013). This paper examines how successful the policy has been and
1 I thank the participants of the Japan Lunch at Asia Pacific Research Center at Stanford University for helpful comments.

2
discusses what adjustments (if any) are needed to increase inward FDI and eventually to restore Japan’s growth. The paper is organized as follows. In the next section, we start by reviewing the relation between FDI and economic growth. Promoting inward FDI as a growth strategy makes sense only if inward FDI contributes to economic growth. As we review in Section 2, however, the empirical evidence for growth enhancing effects of inward FDI is weak, which casts a doubt on the importance of FDI promotion as a growth policy. Even if inward FDI is growth enhancing, we need to understand what determines the level of FDI and how government policies can influence those factors. Thus, Section 3 reviews the empirical studies on the determinants of FDI. Section 4 examines the contents of Abenomics policy to promote inward FDI. The section starts out the review of the third arrow in general to understand the framework of the growth strategy to implement and evaluate policies, which is applied to the FDI policy as well. Then, the section discusses what has been implemented so far to promote inward FDI. Section 5 asks the question posed by the title of this paper: has Abenomics succeeded so far in raising Japan’s inward FDI by looking at the data of inward FDI to Japan. Section 6 concludes by speculating on the future success of FDI policy in Abenomics.
2. FDI and Economic Growth There is large empirical literature on the impacts of inward FDI on economic growth of host countries. A comprehensive survey is provided by Contessi and Weinberger (2009). They find the empirical evidence for the relation between aggregate measures of FDI and economic growth is mixed. One source of difficulty in examining the relation between FDI and economic growth comes from the heterogeneity of countries. FDI may be growth enhancing for some countries but hurt growth for others. Weinhold and Nair-Reichert (2001) indeed find huge heterogeneity across 24 developing countries they study. When they allow the coefficient on FDI in a growth regression to differ across countries, they find the coefficient estimates has a distribution with substantial variance and mean close to zero.
Many studies using cross-country data show that inward FDI has positive impact on the economic growth only when a complementary condition exists. For example, Borensztein, De Gregorio, and Lee (1998) use cross-country data on FDI flows from advanced countries to developing countries and find FDI tends to increase economic growth only if the host country has a minimum stock of human capital. Alfaro, Chanda, Kalemli-Ozcan, and Sayek (2004) also use a cross-country data set and find FDI contributes positively to economic growth only if the host country has well-developed financial markets. Similarly, Balasubramanyam, Salisu, and Sapsford (1996) finds that substantially positive contributions of FDI on economic growth are observed only for the countries that take export-oriented trade policy (rather than import substitution), using data on developing countries. Cross-country regression framework, however, suffers from potential problems arising from endogeneity of both FDI and economic growth and presence of country specific effects. Carkovic and Levine (2005) use panel data sets to address these problems and find that FDI does not lead to higher economic growth. Any positive correlation between the two endogenous

3
variables for some countries is likely to be a result of the third factor that increases both FDI and growth. The conclusion that “little consensus has emerged as to whether FDI is boon or bane for a country as a whole” (Contessi and Weinberger 2009, p.75) does not seem to have changed. More recent surveys such as Deutsche Bank Research (2014) and Baldi and Miethe (2015) also point to the lack of conclusive evidence on the positive impact of FDI on the aggregate economic growth. One potential problem of using aggregate measures of FDI is those add together FDIs in different forms, from different firms, into different industries, and for different corporate motivations. As Deutsche Bank Research (2014; p.3) points out, “Not all FDI flows are actually productive investments, and not all firms are equipped to benefit from foreign capital and knowledge.” To address this problem of heterogeneity among various FDI, recent studies started to use firm level data to identify the impacts of FDI. Many of these studies examine the impacts on productivity growth in the host country, which is an important source of economic growth. Criscuolo (2005) studied the contributions of affiliates of foreign firms to labor productivity for host countries in OECD. For the manufacturing firms in the 12 countries (Czech Republic, Finland, France, Hungary, Japan, Netherlands, Norway, Portugal, Spain, Sweden, United Kingdom, and United States) that Criscuolo (2005) examined, the labor productivities of foreign firms are higher than those of domestic firms, although the difference is small for the U.S., Finland, and France. For Japan, foreign firms are about twice as productive as domestic firms when the difference of industrial composition of foreign and domestic firms are taken into account. The contributions of foreign affiliates on labor productivity growth (mainly through the increase of the share of foreign firms) are positive in many countries, suggesting inward FDI increases the manufacturing productivity. Japan is an exception (with Spain and Portugal): the contribution of foreign firms is extremely low. This is a result of low presence and low entries of foreign firms in Japan compared with other OECD countries.
Corrado, Lengermann, and Slifman (2009) compare the productivities of MNCs (multi-national corporations) and domestic firms in nonfinancial sectors that operate in the U.S. and found the productivity growth mostly came from the MNCs. The labor productivity growth of the MNCs is estimated to explain more than 70% of the labor productivity growth of whole nonfinancial sectors from 1977 to 2000. They define MNCs to include both foreign firms that have establishments in the U.S. and the U.S. firms that operate also abroad, so their results suggest the productivity benefits of not only inward FDI but also outward FDI.
Keller and Yeaple (2009) studies how FDI influences the total factor productivity of
individual firms using panel data of about 1,300 U.S. manufacturing firms from 1987 to 1996. The paper finds that higher share of foreign firms in an industry leads to higher productivity growth of every firm in the industry, suggesting there may be spillover of technology. This effect is found to be larger for high-tech industries and small firms with low productivity benefit more than large firms with high productivity.
3. Determinants of FDI

4
Even if inward FDI positively impacts economic growth, what kind of policy is effective in increasing inward FDI is another question. To examine effectiveness of Abenomics in increasing inward FDI into Japan, we need to understand the determinants of FDI flows between countries. This section summarizes the relevant results obtained by Blonigen and Piger (2014), which surveys eight major studies on the determinants of FDI, identifies 56 variables that are potential determinants of FDI, and systematically examines which variables are most important determinants using cross-country data sets for 2000. Blonigen and Piger (2014) considers three alternative measures of FDI. The first is the FDI position of PARENT (source) country in HOST (destination) country. The data for this measure are collected by OECD for all OECD members and some non-OECD countries. The second is the sales of PARENT-owned affiliate in HOST country. The data for this measure come from the database built by Braconier, Norback and Urban (2005). The third measure is the number of cross-border mergers and acquisitions (M&A). These three variables are used as the alternative dependent variables of the empirical analysis. Table 1 lists 56 variables that Blonigen and Piger (2014) examines as potential determinants of FDI. These are divided into 14 groups: (1) variables considered in a gravity model (GDP and distance), (2) other variables related to GDP, (3) geography measures other than distance, (4) relative labor endowments, (5) other relative endowment measures, (6) cultural distance, (7) multilateral trade openness, (8) bilateral trade openness, (9) HOST country FDI/business costs, (10) HOST country tax policies, (11) bilateral tax and investment agreements, (12) HOST country communications infrastructure, (13) HOST country financial infrastructure, and (14) political environment and institution. Blonigen and Piger (2014) applies a Bayesian Model Averaging (BMA) procedure to a large set of potential linear regression models of FDI determination that differ on which of the 56 variables are included and estimate the probability that each variable is included (i.e., the coefficient is different from zero) in the true regression model of FDI determination given the data. Table 2, which is just a re-ordering of Table 4 of Blonigen and Piger (2014, p.799), gives the inclusion probabilities for those potential determinants of FDI that show the inclusion probability above 50% for at least one of the three measures of FDI considered. All the variables are logged, which means that the interaction terms (variables 22, 23, 36, and 37) have to be excluded from consideration. Table 2 reveals several interesting findings about the determinants of patterns of FDI. First, all the variables in classic gravity models (GDPs and distance) are important determinants of FDI regardless which alternative measure of FDI is used.
Second, some other variables related to GDP or geography are also important determinants of FDI. FDI is high if the source country has high GDP per capita or the host country is located relatively close to other major economies (negative coefficient on HOST remoteness). Other related variables (squared GDP difference, urban concentration at the source country or the host country, and remoteness of the source country) become important determinants only when particular measures of FDI are used in the regression.

5
Third, cultural distance seems to be another important factor that influences FDI. FDI stock or the number of cross-border M&A is high when the source and the destination countries share a common language as the official language or if one was formerly a colony of the other. Fourth, if both countries are in a group formed by a regional trade agreement or a customs union, FDI flows between the countries tend to be higher. Simple openness measure does not seem to be closely related to FDI. The trade openness of the host country increases FDI only when FDI stock is used as the dependent variable. Fifth, a few variables that are related to human capital seems to be an important determinant of FDI. High level of human capital at a host country is associated with high FDI into the country. The level of human capital also enters the regression for cross-border M&A, and the difference of human capital increases FDI stock. Sixth, another variable related to endowment of the host country is whether the country is a large producer of petroleum. FDI into the oil countries tend to be low. Seventh, high corporate tax at the host country discourages FDI. Somewhat surprisingly, whether the host country is tax haven or not does not seem to be a robust determinant of FDI. Eighth, the cost of doing business in the host country or barriers to FDI does not have an explanatory power on FDI flows. The only variable that enters the FDI regression is the time to resolve insolvency, and it tends to reduce the number of cross-border M&A. Finally, all the other variables on bilateral tax and investment agreements, communications infrastructure, financial system, and legal and other institutions do not seem to be significant determinant of FDI when other important factors are taken into account. One variable that many studies found to be an important determinant of FDI flows but is not included in the list of potential determinants in Bloginen and Piger (2014) is exchange rate. This is because the paper focuses on the long-run determinants of FDI decisions. As Goldberg (2009) summarizes, exchange rate fluctuations influence FDIs significantly. Real depreciation of the currency usually leads to an increase in inward FDI. This happens because the depreciation reduces the cost of production and make the host country more attractive location for production, the depreciation makes the foreign investors relatively wealthier so that they can invest more, or the appreciation of the foreign currency relaxes the financial constraints that foreign companies face in credit market. In addition to the level of exchange rate, the volatility of exchange rate also influences FDI decisions. High volatility of exchange rate is associated with more FDI because the companies have incentive to diversify their production locations.
4. FDI policy of Abenomics
Promotion of inward FDI has been included in the growth strategy of the Abe administration (aka the third arrow of Abenomics) from its inception. The original growth strategy published in June 2013 stated:
6
The government will develop an environment where all companies and human resources enjoy the benefits of global economy and facilitate full-fledged globalization in Japan in order to attract outstanding overseas manpower and technologies to Japan and to create employment and innovation. It will also aim to double inward FDI stocks to 35 trillion yen in 2020 (17.8 trillion yen at the end of 2012). (Headquarters for Japan’s Economic Revitalization 2013, p.137) The numerical target of 35 trillion yen by 2020 is an example of key performance
indicators (KPIs), which distinguishes the Abe administration’s growth strategy from earlier ones under the DPJ (Democratic Party of Japan) administrations (2009-2012). KPIs are the targets that are established for each set of major policies in the growth strategy to “enable objective, routine, and comprehensive evaluation of policy outcomes” (Headquarters for Japan’s Economic Revitalization 2013, p.11). KPIs are supposed to link to PDCA (Plan-Do-Check-Act) cycles in the government to monitor the progress of individual policies and to adjust the policies if necessary. In addition to continuing PDCA cycles, the government performs an annual review of KPIs to (1) see if the KPIs were achieved, (2) identify what was lacking if the KPIs were not achieved, (3) isolate the problems with the current policy measures, and (4) decide what should be done. The last step is supposed to include the possibility that ineffective policy measures are abandoned.
Having KPIs and running PDCA cycles around those would be useful for successful
implementation of the policies for economic growth. The actual implementation of this process by the Abe administration, however, seems to exhibit some problems. First, there are some problems with KPIs themselves. Some policy areas do not have any KPIs. Some KPIs are so vague that evaluating if the targets have been achieved is very subjective at best. The target dates for some KPIs are set far (more than a decade, for example) into the future.
In addition to the problem of KPIs themselves, the annual review process seems to be
incomplete. The government has been publishing a revision of the growth strategy in June every year from 2014 and reporting the evaluation of KPIs in the revised growth strategy. The reported evaluation, however, does not cover all KPIs. If the government performs evaluation of all KPIs, those are not reported in the revised growth strategies.
Table 3 counts the total number of KPIs, the number of KPIs that are clear numerical
targets, the number of clear numerical KPIs that are mentioned in the growth strategy revision report, and the number of numerical KPIs that seems to be on target for the growth strategy revisions in June of 2014, 2015, and 2016. The table shows that the number of KPIs increased overtime as the growth strategy went through annual revisions. A closer look reveals that the increase mostly comes from newly established KPIs. There are also several KPIs that were replaced by new ones or removed because the old targets have been considered to be reached. The proportion of the KPIs that are numerical so that it is easy to see if the targets have been achieved also increased over time.
Each revision, however, reports the progress on only about one-third of KPIs. This is
either the other KPIs are not evaluated or the evaluations on the others are not reported. The last row of the table shows the number of KPIs that are considered to be on target given the latest
7
figure in the report. To judge this, I first draw a straight line on the plane spanned by year (horizontal axis) and the value of KPI (vertical axis) that connects the initial value when the KPI was formulated (2012, for example) and the target value at the target date (2020, for example). Then, I see if the latest value of KPI reported in the report is on or above the line (on target) or below the line (not on target). We can see far less than 20% of the KPIs are numerical, tracked have been on target.
The result in Table 3 may make us doubt on the effectiveness of the current framework of
KPIs and PDCA. Promotion of inward FDI, however, is an exception in that the process is seemingly working. The KPI for the FDI policy is clearly numerical. As the original growth strategy specified in the quotation above, the KPI is to double inward FDI stocks to 35 trillion yen by 2020 from its 2012 level of 17.8 trillion yen. The progress on the KPI has been reported in every growth strategy revision. Even if the progress is not reported, anyone can check the progress because the statistics on FDI stocks are available in the Balance of Payments statistics compiled and published by the Bank of Japan. Moreover, the inward FDI stock has been increasing at the rate that would be sufficient to achieve the goal of 35 trillion yen by 2020.
Thus, the policy to promote inward FDI into Japan may appear successful because it is on
track to achieve the goal by the target date. A real question, however, is whether the policy has raised FDI more than FDI would have increased without the policy intervention. This is the question we try to tackle in the next section.
Before we try to compare the path of inward FDI to a counterfactual path that would have
observed without the policy intervention, let us look at the contents of the Abenomics policy to promote inward FDI.
The policy initiative that explicitly targets promotion of inward FDI in Abenomics started
with the creation of the Expert Group on Foreign Direct Investment in Japan. The group of seven policy makers, practitioners, and academics, was chaired by Shujiro Urata, economics professor at Waseda University. The group met five times in early 2014 to identify important impediments to foreign direct investment into Japan. To do this, the group invited and heard from many executives of foreign companies that operate in Japan. This resulted in the report that the group published in April 2014 (Expert Group on Foreign Direct Investment in Japan, 2014).
The report recommended several policies to remove or reduce those impediments to
increase FDI into Japan. First, the group called for reducing the substantial differences between the Japanese system and the global system in several areas including (i) corporate tax system, (ii) employment system, (iii) corporate governance, (iv) system for corporate mergers, and (v) various regulations and administrative procedures. Second, the group also pointed out the importance of promoting inter-governmental agreements including economic partnership agreements (EPAs), social security treaties, and tax treaties. Third, improving living conditions for foreigners in Japan was also considered important for attracting more FDI. Fourth, the group recommend expanding support and preferential treatments of foreign firms entering Japan that are provided by JETRO (Japan External Trade Organization), and the central and the local governments. Finally, the report emphasized the importance of the efforts by the Prime Minister and other state ministers to promote the appealing aspects of Japan that are “not sufficiently

8
understood.” The report also identified the issues encountered by foreign firms in some particular industries including healthcare and pharmaceutical, dairy, food processing, energy, tourism, and retail.
Also in April 2014, the government set up the ministerial-level Council for Promotion of
Foreign Direct Investment in Japan (CPFDI henceforth), which is expected to work as the headquarters for FDI promotion to Japan. The activities of the CPFDI are reported on their website (both in Japanese and in English) “Invest Japan” (http://www.invest-japan.go.jp/en_index.html).
The CPFDI published “Five Promises for Attracting Foreign Businesses to Japan” in
March 2015 and declared that the government begin implementing these (CPFDI, 2015). Table 4 lists these five promises as they appear in the English version published by CPFDI. In short, the Japanese government promised (1) to make it easier to live in Japan without Japanese language skills, (2) free public Wi-Fi access points everywhere in Japan, (3) business jet access to any regional airport in Japan with a short advance notice, (4) to enrich educational environment for children from overseas and ensure Japanese students can communicate in English, and (5) to establish “Investment Advisor Assignment System” that provides foreign business direct access to state ministers of Japan.
The fifth promise of the investment advisor assignment system was implemented in
January 2016. Under this system, qualified foreign companies that invest in Japan are assigned to state ministers who “act as advisors” to the companies. Companies must meet certain conditions to be designated. First, the amount of direct investment must exceed 20 billion yen, and must hire 500 or more regular employees in Japan. Second, the company’s business must fit one of the themes listed in the Strategic Market Creation Plan of the original growth strategy in 2013: (1) extending the nation’s “healthy life expectancy”, (2) realizing clean and economical energy demand and supply, (3) building safe, convenient, and economical next-generation infrastructures, and (4) building regional communities that use their unique local resources to appeal to the world. Finally, the company must be expected to “contribute to the invigoration of the Japanese economy through the introduction of new business models into Japan, R&D activities regarding cutting-edge technologies and/or other ways” (Council for Promotion of Foreign Direct Investment in Japan, Task Force for Promotion of Foreign Direct Investment in Japan, 2016).
In April 2016, nine foreign companies (7 from the U.S., 1 each from France and the
Netherlands) were selected and assigned to state ministers. IBM, 3M, DuPont, Micron Technology, and Air Liquide were assigned to Minister of Economy, Trade and Industry, and Johnson & Johnson, Pfizer, Royal Philips, and Merck were assigned to Minister of Health, Labour and Welfare. Compared with the report by the expert group, the Five Promises are mostly on improving living conditions for the foreigners and do not touch on the issues on harmonization to the global standard, inter-governmental agreements, or regulatory and administrative issues. The CPFDI put together a comprehensive set of policies and announced that as “Policy Package for Promoting Foreign Direct Investment into Japan to Make Japan a Global Hub” in May 2016.

9
The policies are grouped into two types of measures. The first includes the measures to attract foreign companies to Japan. These include (1) communication and PR, (2) attempts to connect foreign companies to Japanese SMEs, and (3) promotion of investment into regional areas in Japan. The second group of policies include (1) improving regulations and administrative procedures, (2) attracting and fostering globally competitive human resources, and (3) improving the living environment for foreign nationals. The “policy package” includes the idea of improving regulations and administrative procedures, which was a major emphasis of the expert group report, although it is just one of the many policies. Following this recovered interest in regulatory and administrative reform, the Working Group for Revising Regulations and Administrative Procedures was formed by the Council, which published “Immediate Report” in December 2016 and proposed some measures to fix the regulatory and administrative issues that foreign companies face in Japan. The report several concrete policies to (1) mitigate the issues in incorporation and registration of companies, (2) reduce the problem in establishing legal residency, (3) create one-stop administrative services, and (4) remedy the lack of information in foreign languages.
5. Has Abenomics Succeeded in Raising Japan’s Inward FDI? As we saw in the last section, the Abenomics FDI policy seems to be on track to achieve the KPI of 35 trillion yen of inward FDI by 2020. This does not mean, however, that Abenomics policy has been successful in increasing inward FDI into Japan. To answer the question whether Abenomics has succeeded, we need to compare the actual level of inward FDI to the level that would have been realized if the policy was not in place. Here we consider three simple counterfactuals to evaluate the effectiveness of the policy. The first counterfactual scenario is that the FDI stock would have followed the trend implied by a constant growth rate. The solid line in Figure 2 shows the FDI stock from 1996 to 2015 in natural log scale. The broken line connects the 2012 value of the FDI stock and the 35 trillion yen target in 2020. From 2013 to 2015, the actual FDI stock has followed the broken line very closely. The higher of the two dotted straight lines shows the trend line that connects the 1996 value and the 2007 value. Thus, the trend line shows how large the FDI stock would have been if it had continued to grow at the average growth rate between 1996 and 2007. The trend implies the FDI stock would grow to about 78 trillion (𝑒"".$%) yen by 2020, more than double the Abenomics goal of 35 trillion yen. The actual FDI stock has been well below this trend line. The lower dotted line shows the path that FDI would have followed if it grew at the 1996-2007 average growth rate starting from the 2012 level. This assumes the period between 2007 and 2012 when FDI did not grow very much was a “lost” period and the trend restarted in 2012. Even with this trend, the FDI stock in 2020 would be about 52 trillion (𝑒"&.'() yen, much higher than the target. The actual FDI stock has been slightly below this trend line. Thus, if this trend line is a reasonable counterfactual, we do not find evidence for the effectiveness of Abenomics

10
FDI policy. The increase of FDI stock from 2012 to 2015 is pretty much what would be expected if the inward FDI returned to normal trend after the stagnation following the global financial crisis. The second counterfactual scenario assumes a constant trend growth rate for the FDI to GDP ratio. The solid line in Figure 3 plots the FDI stock divided by GDP from 1996 to 2015. The broken line again connects the 2012 value of the FDI/GDP ratio and the target ratio in 2020. To calculate the target FDI/GDP ratio, we need the value of target GDP in addition to the 35 trillion yen target for FDI. We use 628.472 trillion yen, which is the target level of nominal GDP in the fourth quarter of 2020 implied by the line for target nominal GDP (in log scale) in Figure 1. The dotted line again extrapolates the 1996-2007 trend. In Figure 3, the “goal” line and the trend line are almost on top of each other. The FDI/GDP ratio has been increasing and it seems to be on track to achieve the target, but this would have happened without any policy changes if FDI/GDP ratio just followed the pre-Global Financial Crisis (GFC) trend. Here the 2012 value of FDI/GDP ratio is very close to the pre-GFC trend, suggesting the trend growth of FDI/GDP does not seem to have experienced a break around GFC. The third counterfactual scenario is built by estimating the following regression model of the FDI/GDP ratio and generating forecasts to 2020. 𝐹𝐷𝐼,𝐺𝐷𝑃,
=𝐹𝐷𝐼,0"𝐺𝐷𝑃,0"
+ 0.00738(0.00601) −
0.00006160.0000577 ∗ 𝐸𝑋𝑅𝐴𝑇𝐸, +
0.00006010.0000365 ∗ 𝐸𝑋𝑉𝑂𝐿, + 𝜀,
The model tries to explain the change in the FDI/GDP ratio from the previous year as a function of the level of exchange rate (EXRATE) and the volatility of exchange rate (EXVOL). The level of exchange rate is the annual average of the monthly effective exchange rates compiled by the Bank of Japan (http://www.boj.or.jp/en/statistics/market/forex/jikko/index.htm/). The volatility is estimated as the variance of the monthly effective exchange rates during the year. In estimating the regression model, the coefficient on the lagged FDI/GDP ratio is constrained to one. Thus, we try to explain the change in the FDI/GDP ratio by the movements of the exchange rate and its volatility. The estimation was done using the data from 1997 to 2012. The numbers in the parentheses show the standard errors. The signs of the estimated coefficients are as expected from the discussion at the end of Section 3. Depreciation (fall in the effective exchange rate) increases inward FDI and higher exchange rate volatility also increases FDI. The estimates, however, are not statistically significant. Figure 4 shows the forecasts of the FDI/GDP ratio generated by the regression model. Note that the forecasts beyond 2013 are out of sample. The out of sample forecasts are calculated dynamically (using forecasted values for the lagged FDI/GDP ratio). Up to 2016, the actual level of the EXRATE and EXVOL are used for forecasting. After 2016, the values of EXRATE and EXVOL are assumed to stay at the level of 2016. Figure 4 also shows the actual FDI/GDP ratio and the Abenomics goal, but these are the same as those in Figure 3. Figure 4 again shows the increase in the FDI/GDP ratio in 2013-2015 are consistent with the past trend. If anything, yen depreciation and increased volatility at the beginning of Abenomics should have shifted the trend up.

11
Figures 2 through 4 suggest that the observed increase in FDI into Japan under the Abe administration is not much different from what we would have expected from the past trend. There is no evidence that the Abenomics policy raised inward FDI beyond the trend line. In this sense, we cannot say that the FDI policy in Abenomics has been successful (unless we count yen depreciation in Figure 4 as a part of the FDI policy). Japan may achieve the target of 35 trillion yen inward FDI by 2020, but it is not because new FDI policy has been successful. The target was not set high enough to require successful new policies.
6. Conclusion The paper examined the policy to promote inward FDI to Japan, which is one of many policies in the third arrow of Abenomics. After reviewing the literature on the relation between FDI and economic growth, which is the ultimate goal of Abenomics policy package, and also the literature on the determinants of FDI, the contents of Abenomics FDI policy initiated so far were described. The policy to promote FDI has a clear numerical KPI and its progress has been reported consistently in annual revisions of the growth strategy. From 2012 to 2015, Japan’s inward FDI increased from 19.2 trillion yen to 24.4 trillion yen. At this rate, it will achieve the target of 35 trillion yen in 2020. Hitting the target does not necessarily imply the success of the policy, because the indicator may have hit the target even without the policy. For the inward FDI to Japan, the increase indeed seems what would have happened even without the new policies introduced in Abenomics. Thus, we cannot say Abenomics FDI policy has been successful. The answer to the title of this paper is “No.” As of this writing, we still have more than three years till the end of 2020. Can Japan’s inward FDI start increasing at a faster rate and contribute to economic growth in three years? We can consider this question employing what we know from the literature on the relation between FDI and economic growth and on the determinants of FDI, which we reviewed in Sections 2 and 3. For the relation between the aggregate measures of inward FDI and economic growth, the past empirical studies are inconclusive. This result casts doubt on the effectiveness of Abenomics FDI policy which targets the aggregate amount of inward FDI stock. Even if it succeeds in increasing the amount of inward FDI eventually, this may not help restoring Japan’s economic growth. Since the evidence on the impacts on productivity growth at micro level seems clearer, it may be a good idea to target some other indicators such as entries of foreign firms. More specifically, a measure like the following may be a useful KPI to promote productivity enhancing inward FDI. 𝑤H,H∈JJ (𝑝H, − 𝑝L,0")L Here FF is a set of foreign firms that enters Japan in year t, 𝑤H, is the share (measured in employment, output, or something else) of firm i in year t, and 𝑝,0" is the average productivity in

12
in industry j in year t-1. If many of the entering firms have higher than average productivity of the incumbents in the industry, the value of this indicator will be positive. Larger firms get higher weights. Thus, this indicator takes into account the quality of entries as well as quantity. The discussion on the determinants of FDI in Section 3 is useful in speculating if the current set of policies in Abenomics are likely to influence the level of FDI eventually. Table 2 suggests that most of the important determinants of FDI, including distance to the source country, GDP of the source country, cultural distance to the source country, remoteness of the host country, and oil producing host country, are not something the government policy can change at least in a decade or so. Table 2 results also suggest that some factors that are considered by many to be important determinants of FDI turn out to be unimportant. These include the financial system of the host country, communication infrastructure of the host country, political environment and institution in the host country, presence of bilateral tax and investment agreements, and the cost of doing business. The last result is surprising because many studies find that a country’s economic growth rate can rise by reducing the cost of doing business.2 Whatever benefit that reducing the cost of doing business has on economic growth does not seem to go through changing inward FDI. This leaves workers’ skill levels and corporate tax system of host country as robust determinants of FDI that may be influenced by government policy. Corporate tax reform was one of the policies suggested by the Expert Group Report. Although it is not emphasized in the policies by CPFDI, corporate tax reform is one of the key reform areas in Abenomics. The 2014 revision of the growth strategy lists corporate tax reform as one of the ten focus areas (Headquarters for Japan’s Economic Revitalization, 2014). CPFDI policies do not emphasize labor market reform, either, but this is one of the issues pointed out in the Expert Group Report and one of the key reforms in Abenomics as a whole. Increasing flexibility of labor market may increase the availability of skilled workers to foreign firms and eventually encourages more FDI. What are emphasized in FDI policies by CPFDI, however, were those related to promoting Japan to the rest of the world and improving living condition of foreigners in Japan. The effectiveness of those policies to promote inward FDI is not clear from the existing studies. The Japanese government may want to examine the impacts of those policies empirically before it commits substantial resources on them. References Alfaro, Laura, Areendam Chanda, Sebnem Kalemli-Ozcan, and Selin Sayek (2004). “FDI and
Economic Growth: The Role of Local Financial Markets,” Journal of International Economics, 64, 89-112. http://dx.doi.org/10.1016/S0022-1996(03)00081-3
2 See Haidar and Hoshi (2015) and the references that they cite in Footnote 3 (p.2).
13
Balasubramanyam, V.N., M. Salisu, and David Sapford (1996). “Foreign Direct Investment and Growth in EP and IS Countries.” Economic Journal, 106(434), 92-105. http://www.jstor.org/stable/2234933
Baldi, Guido, and Jakob Miethe (2015). “Foreign Direct Investment and Economic Growth,”
DIW Roundup No.71. http://www.diw.de/sixcms/detail.php?id=diw_01.c.509864.en Blonigen, Bruce A. and Jeremy Piger (2014). “Determinants of Foreign Direct Investment,”
Canadian Journal of Economics, 47(3), 775-812. Borensztein, Eduardo, Jose De Gregorio, and Jae-Woo Lee (1998). “How does foreign direct
investment affect economic growth?” Journal of International Economics, 45(1), 115-135. http://www.sciencedirect.com/science/article/pii/S0022199697000330
Braconier, Henrik, Pehr-Johan Norbäck, and Dieter Urban (2005). “Reconciling the Evidence on
the Knowledge-Capital Model,” Review of International Economics, 13, 770-786. Carkovic, Maria and Ross Levine (2005). “Does Foreign Direct Investment Accelerate
Economic Growth?” in Theodore H. Moran, Edward M. Graham, and Magnus Blomstrom (Eds.) Does Foreign Direct Investment Promote Development? Washington, DC: Institute for International Economics Center for Global Development, pp.195-220.
Contessi, Silvio and Ariel Weinberger (2009). “Foreign direct investment, productivity, and
country growth: an overview,” Federal Reserve Bank of St. Louis Review, 91, 61-78. https://research.stlouisfed.org/publications/review/article/7338
Corrado, Carol, Paul Lengermann and Larry Slifman (2009). “The Contribution of MNCs to US
Productivity Growth 1997-2000,” in Marshall Reinsdorf and Matthew J. Slaughter (Eds.) International Flows of Invisibles: Trade in Services and Intangibles in the Era of Globalization. Chicago, IL: University of Chicago Press, pp.331-360.
Council for Promotion of Foreign Direct Investment in Japan (2015). “Five Promises for
Attracting Foreign Businesses to Japan.” http://www.invest-japan.go.jp/promotion/promise_en.pdf
Council for Promotion of Foreign Direct Investment in Japan (2016). “Policy Package for
Promoting Foreign Direct Investment into Japan.” http://www.invest-japan.go.jp/promotion/policy_package_en.pdf
Council for Promotion of Foreign Direct Investment in Japan, Task Force for Promotion of
Foreign Direct Investment in Japan (2016). “Implementation of the Investment Advisor Assignment System” http://www.invest-japan.go.jp/investment_advisor_assignment_system/implementation_en.pdf

14
Council for Promotion of Foreign Direct Investment in Japan, Working Group for Revising Regulations and Administrative Procedures (2016). “Immediate Report.” http://www.invest-japan.go.jp/promotion/immediate_report_en.pdf
Criscuolo, Chiara (2005). “Foreign Affiliates in OECD Economies: Presence, Performance, and
Contribution to Host Countries,” OECD Economic Studies, 41(2), 109-139. Deutsche Bank Research (2014). “Recent Trends in FDI activity in Europe,” Deutsche Bank
Research: Frankfurt. https://www.dbresearch.com/PROD/DBR_INTERNET_ENPROD/PROD0000000000340841/Recent+trends+in+FDI+activity+in+Europe%3A+Regaining.pdf
Expert Group on Foreign Direct Investment in Japan (2014). Report on the Expert Group
Meeting on Foreign Direct Investment in Japan. http://www5.cao.go.jp/keizai-shimon/kaigi/special/investment/report_en.pdf
Goldberg, Linda (2009). “Exchange Rate and Foreign Direct Investment,” in Kenneth A.
Reinert, Ramkishen S. Rajan, Amy Joycelyn Glass, Lewis S. Davis (Eds.) The Princeton Encyclopedia of the World Economy. Princeton, NJ: Princeton University Press, pp.393-396.
Haidar, Jamal Ibrahim and Takeo Hoshi (2015). “Implementing Structural Reforms in
Abenomics: How to Reduce the Cost of Doing Business in Japan,” NBER Working Paper 21507. http://www.nber.org/papers/w21507
Headquarters for Japan’s Economic Revitalization (2013). Japan Revitalization Strategy: Japan
is BACK. http://www.kantei.go.jp/jp/singi/keizaisaisei/pdf/en_saikou_jpn_hon.pdf Headquarters for Japan’s Economic Revitalization (2014). Japan Revitalization Strategy Revised
in 2014: Japan’s Challenge for the Future. http://www.kantei.go.jp/jp/singi/keizaisaisei/pdf/honbunEN.pdf
Headquarters for Japan’s Economic Revitalization (2015). Japan Revitalization Strategy Revised
in 2015: Investment in the Future; Revolution in Productivity. http://www.kantei.go.jp/jp/singi/keizaisaisei/pdf/dai1en.pdf and http://www.kantei.go.jp/jp/singi/keizaisaisei/pdf/dai2_3en.pdf
Headquarters for Japan’s Economic Revitalization (2016). Japan Revitalization Strategy Revised
in 2016: Toward the Fourth Industrial Revolution. http://www.kantei.go.jp/jp/singi/keizaisaisei/pdf/2016_zentaihombun_en.pdf, http://www.kantei.go.jp/jp/singi/keizaisaisei/pdf/2016_hombun1_e.pdf, and http://www.kantei.go.jp/jp/singi/keizaisaisei/pdf/2016_hombun2_en.pdf
Keller, Wolfgang and Stephen R. Yeaple (2009). “Multinational Enterprises, International Trade,
and Productivity Growth: Firm Level Evidence from the United States,” The Review of Economics and Statistics, 91(4), 821-831.

15
Weinhold, Diana and Usha Nair-Reichert (2001). “Causality Tests for Cross-Country Panels: A
New Look at FDI and Economic Growth in Developing Countries,” Oxford Bulletin of Economics & Statistics, 63(2), 153-171.

16
Table 1. Potential determinants of FDI considered by Blonigen and Piger (2014) Variables considered in a gravity model
1. PARENT real GDP 2. HOST real GDP 3. Distance
Other variables related to GDP 4. PARENT real GDP per capita 5. HOST real GDP per capita 6. Sum of HOST and PARENT real GDP 7. Similarity of HOST and PARENT real GDP (HOST share of total (sum) GDP multiplied
by PARENT share of total GDP) 8. Squared GDP difference 9. Squared GDP per capita difference 10. HOST urban concentration 11. PARENT urban concentration
Geography measures other than distance 12. Contiguous border 13. HOST remoteness (distance of a country from all other countries in the world weighted
by those other countries’ share of world GDP (excluding the country in calculation)) 14. PARENT remoteness 15. Time zone difference
Relative labor endowments 16. HOST education level 17. HOST skill level 18. PARENT education level 19. PARENT skill level 20. Squared education difference 21. Squared skill difference 22. Interaction of GDP differences with education differences 23. Interaction of GDP differences with skill differences
Other relative endowment measures 24. HOST capital per worker 25. PARENT capital per worker 26. Squared difference in capital per worker 27. HOST land area 28. PARENT land area 29. HOST population density 30. HOST is oil country
Cultural distance 31. Common official language 32. Common language overlap 33. Colonial relationship
17
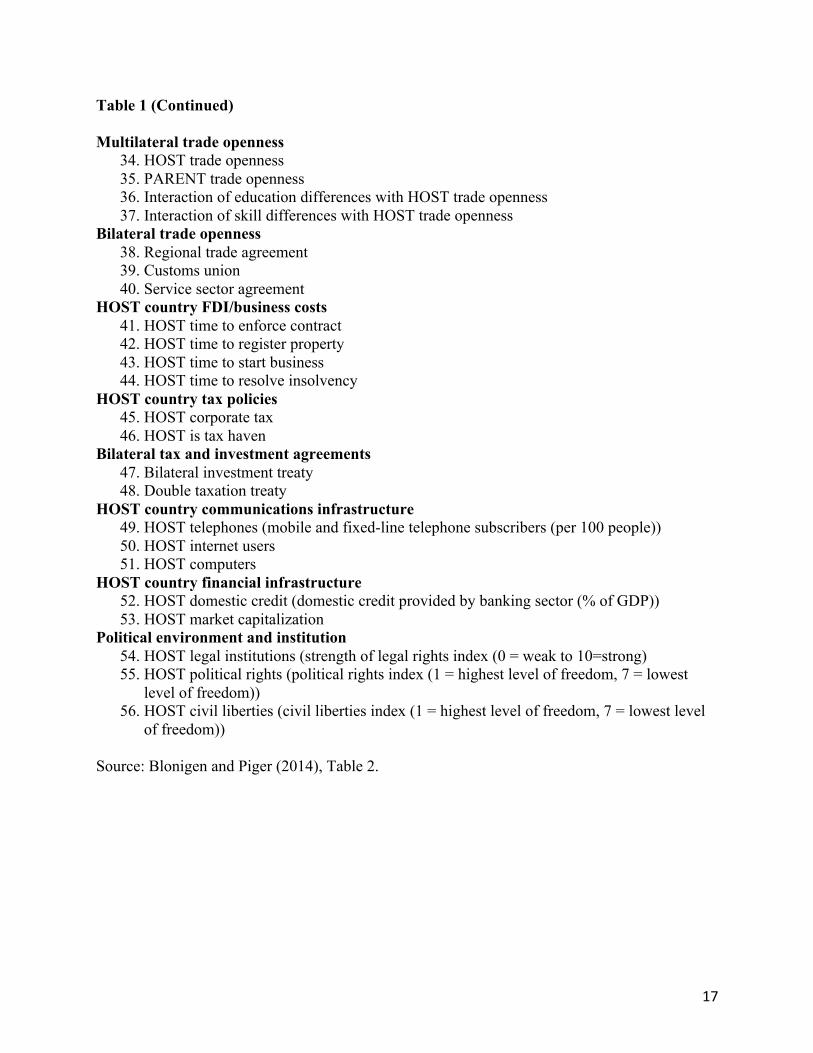
Table 1 (Continued) Multilateral trade openness
34. HOST trade openness 35. PARENT trade openness 36. Interaction of education differences with HOST trade openness 37. Interaction of skill differences with HOST trade openness
Bilateral trade openness 38. Regional trade agreement 39. Customs union 40. Service sector agreement
HOST country FDI/business costs 41. HOST time to enforce contract 42. HOST time to register property 43. HOST time to start business 44. HOST time to resolve insolvency
HOST country tax policies 45. HOST corporate tax 46. HOST is tax haven
Bilateral tax and investment agreements 47. Bilateral investment treaty 48. Double taxation treaty
HOST country communications infrastructure 49. HOST telephones (mobile and fixed-line telephone subscribers (per 100 people)) 50. HOST internet users 51. HOST computers
HOST country financial infrastructure 52. HOST domestic credit (domestic credit provided by banking sector (% of GDP)) 53. HOST market capitalization
Political environment and institution 54. HOST legal institutions (strength of legal rights index (0 = weak to 10=strong) 55. HOST political rights (political rights index (1 = highest level of freedom, 7 = lowest
level of freedom)) 56. HOST civil liberties (civil liberties index (1 = highest level of freedom, 7 = lowest level
of freedom)) Source: Blonigen and Piger (2014), Table 2.

18
Table 2. Variables with inclusion probabilities above 50% for at least one measure of FDI Dependent variable Potential Determinant FDI Stock Affiliate
Sales M&A
Variables considered in a gravity model (1-3) 1. PARENT real GDP 100 100 100 2. HOST real GDP 100 100 100 3. Distance 100 100 100 Other variables related to GDP (4-11) 4. PARENT real GDP per capita 100 99 100 8. Squared GDP difference 1 82 2 10. HOST urban concentration 52 0 1 11. PARENT urban concentration 1 0 98 Geography measures other than distance (12-15) 13. HOST remoteness 100 100 100 14. PARENT remoteness 30 0 100 Relative labor endowments (16-21) 17. HOST skill level 97 1 100 19. PARENT skill level 1 1 100 21. Squared skill difference 89 2 10 Other relative endowment measures (24-30) 30. HOST is oil country 92 1 94 Cultural distance (31-33) 31. Common official language 92 1 100 33. Colonial relationship 87 1 97 Multilateral trade openness (34-35) 34. HOST trade openness 95 3 2 Bilateral trade openness (38-40) 38. Regional trade agreement 100 4 100 39. Customs union 97 1 100 HOST country FDI/business costs (41-44) 44. HOST time to resolve insolvency 1 2 91 HOST country tax policies (45-46) 45. HOST corporate tax 67 95 3 Bilateral tax and investment agreements (47-48) HOST country communications infra. (49-51) HOST country financial infrastructure (52-53) Political environment and institution (54-56) 54. HOST legal institutions 85 22 1
Source: Bloginen and Peger (2014, Table 4).

19
Table 3. KPI Evaluation in Growth Strategy Revisions 2014-2016
2014 Report
2015 Report
2016 Report
Total number of KPIs 114 138 158
of which are clear numerical targets 85 (74.6%)
106 (76.8%)
131 (82.9%)
of which extent of progress is reported 41 (36.0%)
43 (31.2%)
56 (35.4%)
of which seem to be on target 15 (13.2%)
26 (18.8%)
22 (13.9%)
Author’s counting based on Headquarters for Japan’s Economic Revitalization (2014, 2015, 2016). The numbers in the parentheses show the proportion to the total number of KPIs in the revised strategy. Table 4. Five Promises
1. Measures will be taken to enable people from abroad to select and purchase products in foreign languages at department stores, supermarkets, and convenience stores, etc.; to be treated without anxiety over language at a hospital when they become ill, and to have signs in foreign languages available when they travel by car, train, or bus.
2. Foreign visitors to Japan will be able to use free public wireless LAN simply and easily at various locations around cities without a contract with a Japanese telecommunications carrier.
3. To make locating to Japan as a business base or R&D base easier for overseas companies, the government will create an environment in which all regional airports receive business jets with a short advance notice.
4. The government will enrich educational environment for children from overseas, and ensures that people receiving an education in Japan are able to communicate smoothly in English.
5. The government will set up a system to make it easy for the foreign businesses which have invested much amount in Japan to consult the government. The Japanese Government and all local governments will work together as one to create a network for attracting investment to Japan.
Source: Council for Promotion of Foreign Direct Investment in Japan (2015). “Five Promises for Attracting Foreign Businesses to Japan.”

20
Figure 1. Nominal and Real GDP: Abenomics Goals and Actual Levels in Log-Scale
Source: Cabinet Office of Japan “Quarterly Estimates of GDP” (http://www.esri.cao.go.jp/en/sna/data/sokuhou/files/2016/qe164_2/gdemenuea.html)
13.00
13.10
13.20
13.30
13.40
13.50
ln(NGDP) ln(RGDP) Goal (Nominal) Goal (Real)

21
Figure 2. Inward FDI: Abenomics Goal, Actual Level, and Trend in Log-Scale
Source: Bank of Japan, Balance of Payments Statistics (http://www.boj.or.jp/en/statistics/br/bop_06/index.htm/)
8
8.5
9
9.5
10
10.5
11
11.5
1996
1997
1998
1999
2000
2001
2002
2003
2004
2005
2006
2007
2008
2009
2010
2011
2012
2013
2014
2015
2016
2017
2018
2019
2020
log(FDI) log(goal) log(Trend19962007) reset2012

22
Figure 3. FDI/GDP Ratio: Abenomics Goal, Actual Levels, and Trend
Source: Bank of Japan, Balance of Payments Statistics (http://www.boj.or.jp/en/statistics/br/bop_06/index.htm/)
0%
1%
2%
3%
4%
5%
6%
1996
1997
1998
1999
2000
2001
2002
2003
2004
2005
2006
2007
2008
2009
2010
2011
2012
2013
2014
2015
2016
2017
2018
2019
2020
FDI/GDP Goal Trend19962007

23
Figure 4. FDI/GDP Ratio: Counterfactual by a Regression Model with Exchange Rates
Source: Bank of Japan, Balance of Payments Statistics (http://www.boj.or.jp/en/statistics/br/bop_06/index.htm/). Note: Regression forecasts are the forecasts generated by the regression model (1) in the text.
0%
1%
2%
3%
4%
5%
6%
7%
1996
1997
1998
1999
2000
2001
2002
2003
2004
2005
2006
2007
2008
2009
2010
2011
2012
2013
2014
2015
2016
2017
2018
2019
2020
FDI/GDP Goal Regression Forecasts