jc 940 095 weber, james f. - eric · author weber, james f. ... cultural dynamics in assessing...
TRANSCRIPT
DOCUMENT RESUME
ED 366 375 JC 940 095
AUTHOR Weber, James F.TITLE Accountability Report To Assess the Effectiveness of
Undergraduate Education at Arapahoe CommunityCollege.
INSTITUTION Arapahoe Community Coll., Littleton, Colo.PUB DATE 1 Oct 93NOTE 82p.
PUB TYPE Reports Research/Technical (143)Tests/Evaluation Instruments (160)
EDRS PRICE MF01/PC04 Plus Postage.DESCRIPTORS Academic Persistence; *Accountability Adult
Education; Community Colleges; *CurriculumEvaluation; Needs Assessment; *Program Improvement;Questionnaires; School Effectiveness; *StudentAttitudes; Surveys; Transfer Students; Two YearColleges; Undergraduate Study; VocationalEducation
IDENTIFIERS *Arapahoe Community College CO
ABSTRACTAn overview is provided of Arapahoe Community
College's (ACC's) efforts to improve undergraduate education and thesuccess of those efforts. After outlining changes made in thetransfer, vocational education, and developmental studies programs,the report identifies new strategies that have been adopted todisseminate information about accountability and briefly highlightsminority student enrollment increases. The next section of the reportpresents data and recommendations concerning: licensure andcertification exam pass rates and student satisfaction measures forvocational education; retention and completion rates; alumnisatisfaction with the transfer program; student services evaluation;student satisfaction with the adult eucation program; information onbusiness and industry services; activities to improve multiculturalawareness; and efforts to improve the acountability process.Appendices comprise the bulk of the report, providing detailedinformation on: (1) College Algebra students' scores on the CalculusReadiness Test; (2) instructors' guidelines for Freshman Composition;(3) student responses to journal writing in an Introduction toLiterature course; (4) ACC's efforts to promote communication skillsacross the curriculum; (5) findings from ACC's tracking system fordevelopmental studies and English as a Second Language students; (6)
student responses to an experimental Leadership Development course;(7) minority student enrollments; (8) participant satisfaction withvocational and transfer programs and business and industry training,including survey instruments; and (9) retention/persistence andtransfer. (ECC)
***********************************************************************
Reproductions supplied by EDRS are the best that can be madefrom the original document.
***********************************************************************
ccountability ReportTo Assess The
Effectiveness ofUndergraduate Education
AtArapahoe Community College
Qs-
Qs
.....114,,3
rari
whionnummut-I,
"PERMISSION TO REPRODUCE THISC) MATERIAL HAS BEEN GRANTED BY
Si
F. A. Markley
TO THE EDUCATIONAL RESOURCESINFORMATION CENTER (ERIC)."
Submitted ByJames Weber 11.1. D.
Prcick.nt
Ock)her 1 :-10(0
1".
Arapahoe
lEST Y MAILABLE
U.S. DEPARTMENT OF EDUCATIONUttoce of Educstional Research and improvement
EDU ATIONAL RESOURCES INFORMATIONCENTER (ERIC)
This document has been reproduced asreceived from the person or organizationoriginattng it.
LI Minor changes have been made to improvereproduction qualify
Points of view or opinions stated in this documerit do not necessarily represent officialOERI position or policy
Community College2500 West College Drive
2 Littleton, CO 80160-9002

Arapahoe Community CollegeJames F. Weber, Ph.D.
President(303) 797-5701
FAX (303) 797-5935
October 1, 1993
Colorado Commission on Higher Education1300 Broadway, Second FloorDenver, CO 80203
Dear Ladies and Gentlemen of the Commission:
in its 27th year of operation, Aranahoe Community College serves the residents of theState of Colorado and the college's assigned service area of Arapahoe, Douglas, andJefferson counties.
As a state-supported institution of higher education, the college is pleased to be able todemonstrate its good stewardship to the people of Colorado through the Accountabil-ity process.
The college has developed a planning process that encourages broad-based panicipa-don on the part of faculty and staff in providing appropriate measures of assessmentand effectiveness, and in using these measures to improve the quality of our educa-donal services to students. ACC's AccountabilityPlan has been used as a model bythe Commission on Institutions of Higher Education of the North Central Associationof Colleges and Schools in meeting our regional accrediting body's mandate for insti-tutional assessment.
Enclosed is the 1993 Report to Assess the Effectiveness of Undergraduate Educationat Arapahoe Community College, in compliance with the requirements established bythe Commission.
Sincerely,
es F. Weber, Ph.D.sident
Enclosure
171
AA/EOE2500 West College Drive P.O. Box 9002 Littleton, Colorado 80160-9002
Serving Arapahoe, Douglas, and Jefferson Counties

ACCOUNTABILITY REPORT TO ASSESS THE EFFECTIVENESS
OF UNDERGRADUATE EDUCATION AT
ARAPAHOE COMMUNITY COLLEGE
OCTOBER 1, 1993
1. CHANGES IN TEACHING, CURRICULA AND LEARNING
THE TRANSFER PROGRAMMath
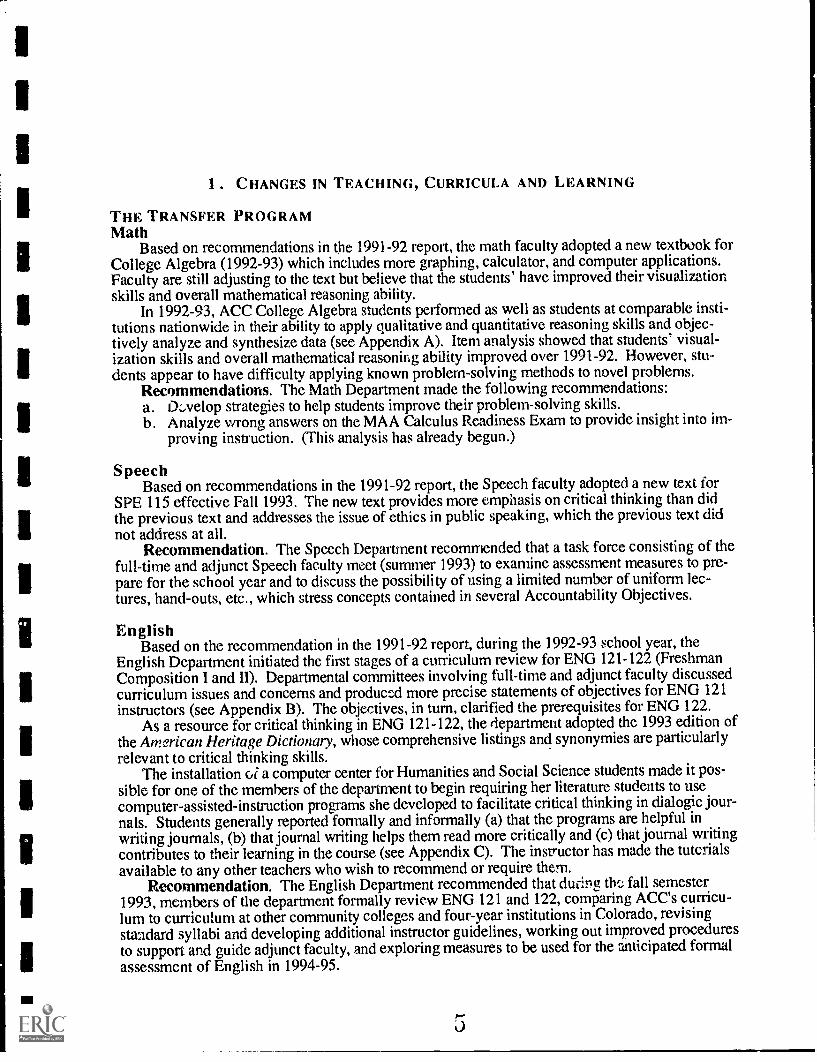
Based on recommendations in the 1991-92 report, the math faculty adopted a new textbook forCollege Algebra (1992-93) which includes more graphing, calculator, and computer applications.Faculty are still adjusting to the text but believe that the students' have improved their visualizationskills and overall mathematical reasoning ability.
In 1992-93, ACC College Algebra students performed as well as students at comparable insti-tutions nationwide in their ability to apply qualitative and quantitative reasoning skills and objec-tively analyze and synthesize data (see Appendix A). Item analysis showed that students' visual-
"!ization skills and overall mathematical reasoning ability improved over 1991-92. However, stu-dents appear to have difficulty applying known problem-solving methods to novel problems.
Recommendations. The Math Department made the following recommendations:a. Develop strategies to help students improve their problem-solving skills.b. Analyze wrong answers on the MAA Calculus Readiness Exam to provide insight into im-
proving instruction. (This analysis has already begun.)
SpeechBased on recommendations in the 1991-92 report, the Speech faculty adopted a new textfor
SPE 115 effective Fall 1993. The new text provides more emphasis on critical thinking than didthe previous text and addresses the issue of ethics in public speaking, which the previous text didnot address at all.
Recommendation. The Speech Department recommended that a task force consisting of thefull-time and adjunct Speech faculty meet (summer 1993) to examine assessment measures to pre-pare for the school year and to discuss the possibility of using a limited number of uniform lec-tures, hand-outs, etc., which stress concepts contained in several Accountability Objectives.
EnglishBased on the recommendation in the 1991-92 report, during the 1992-93 school year, the
English Department initiated the first stages of a curriculum review for ENG 121-122 (FreshmanComposition I and II). Departmental committees involving full-time and adjunct facultydiscussedcurriculum issues and concerns and produced more precise statements of objectives for ENG 121instructors (see Appendix B). The objectives, in turn, clarified the prerequisites for ENG 122.
As a resource for critical thinking in ENG 121-122, the department adopted the 1993 edition ofthe American Heritage Dictionary, whose comprehensive listings and synonymies are particularlyrelevant to critical thinking skills.
The installation oi a computer center for Humanities and Social Science students made it pos-
1sible for one of the members of the department to begin requiring her literature students to usecomputer-assisted-instruction programs she developed to facilitate critical thinking in dialogic jour-nals. Students generally reported formally and informally (a) that the programs are helpful inwriting journals, (b) that journal writing helps them read more critically and (c) that journal writingcontributes to their learning in the course (see Appendix C). The instructor has made the tutorialsavailable to any other teachers who wish to recommend or require them.
Recommendation. The English Department recommended that ducing the fall semester1993, members of the department formally review ENG 121 and 122, comparing ACC's curricu-lum to curriculum at other community colleges and four-year institutions in Colorado, revisingstandard syllabi and developing additional instructor guidelines, working out improved proceduresto support and guide adjunct faculty, and exploring measures to be used for the anticipated formalassessment of English in 1994-95.
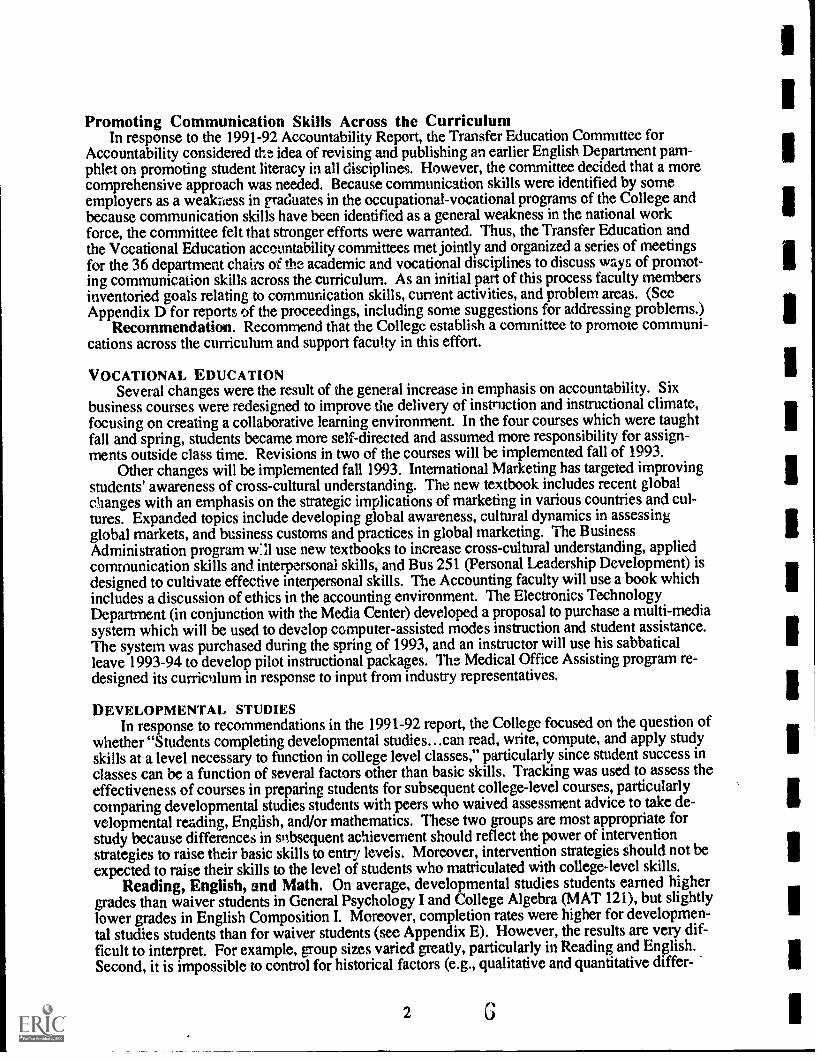
Promoting Communication Skills Across the CurriculumIn response to the 1991-92 Accountability Report, the Transfer Education Committee for
Accountability considered the idea of revising and publishing an earlier English Department pam-phlet on promoting student literacy in all disciplines. However, the committee decided that a morecomprehensive approach was needed. Because communication skills were identified by someemployers as a weakaess in graduates in the occupational-vocational programs of the College andbecause communication skills have been identified as a general weakness in the national workforce, the committee felt that stronger efforts were warranted. Thus, the Transfer Education andthe Vecational Education accountability committees met jointly and organized a series of meetingsfor the 36 department chairs of the academic and vocational disciplines to discuss ways of promot-ing communication skills across the curriculum. As an initial part of this process faculty membersinventoried goals relating to communication skills, current activities, and problem areas. (SeeAppendix D for reports of the proceedings, including some suggestions for addressing problems.)
Recommendation. Recommend that the College establish a committee to promote communi-cations across the curriculum and support faculty in this effort.
VOCATIONAL EDUCATIONSeveral changes were the result of the general increase in emphasis on accountability. Six
business courses were redesigned to improve the delivery of instruction and instructional climate,focusing on creating a collaborative learning environment. In the four courses which were taughtfall and spring, students became more self-directed and assumed more responsibility for assign-ments outside class time. Revisions in two of the courses will be implemented fall of 1993.
Other changes will be implemented fall 1993. International Marketing has targeted improvingstudents' awareness of cross-cultural understanding. The new textbook includes recent globalchanges with an emphasis on the strategic implications of marketing in various countries and cul-tures. Expanded topics include developing global awareness, cultural dynamics in assessingglobal markets, and business customs and practices in global marketing. The BusinessAdministration program w:a use new textbooks to increase cross-cultural understanding, appliedcommunication skills and interpersonal skills, and Bus 251 (Personal Leadership Development) isdesigned to cultivate effective interpersonal skills. The Accounfing faculty will use a book whichincludes a discussion of ethics in the accounting environment. The Electronics TechnologyDepartment (in conjunction with the Media Center) developed a proposal to purchase a multi-mediasystem which will be used to develop computer-assisted modes instruction and student assistance.The system was purchased during the spring of 1993, and an instructor will use his sabbaticalleave 1993-94 to develop pilot instructional packages. The Medical Office Assisting program re-designed its curriculum in response to input from industry representatives.
DEVELOPMENTAL STUDIESIn response to recommendations in the 1991-92 report, the College focused on the question of
whether "Students completing developmental studies...can read, write, compute, and apply studyskills at a level necessary to function in college level classes," particularly since student success inclasses can be a function of several factors other than basic skills. Tracking was used to assess theeffectiveness of courses in preparing students for subsequent college-level courses, particularlycomparing developmental studies students with peers who waived assessment advice to take de-velopmental reading, English, and/or mathematics. These two groups are most appropriate forstudy because differences in subsequent achievement should reflect the power of interventionstrategies to raise their basic skills to entry levels. Moreover, intervention strategies should not beexpected to raise their skills to the level of students who matriculated with college-level skills.
Reading, English, and Math. On average, developmental studies students earned highergrades than waiver students in General Psychology I and College Algebra(MAT 121), but slightlylower grades in English Composition I. Moreover, completion rates were higher for developmen-tal studies students than for waiver students (see Appendix E). However, the results are very dif-ficult to interpret. For example, group sizes varied greatly, particularly in Reading and English.Second, it is impossible to control for historical factors (e.g., qualitative and quantitative differ-
ences in intervening courses; the effect of time lapse between completing ENG 095 and ENG121/131; and lack of opportunity to apply writing skills in other coursessee related issues in"Promoting Communication Skills Across the Curriculum," p 2). Third, some students are able toenroll in courses without being advised. Fourth, MAT 060, ti:e only math course classified as adevelopmental studies course is not a gateway course for MAT 121 (the CORE specifies MAT 115as the prerequisite).
G.E.D. Because G.E.D. students differ from most ACC students, it is difficult to interpretG.E.D. results in terms of completion, retention, or subsequent achievement in college-levelcourses (see Appendix E). A continuing problem with G.E.D. is failure to complete the program.
Study Skills. Because Study Skills is not a gateway course, but instead prepares studentsfor all college-level classes, in 1991-92 the department decided tracking was not appropriate.However, the department now believes that alternative assessment tools might provide useful as-sessment information.
ESL. ESL 092 continued to be effective in preparing international students for college-levelcomposition; 77% of the 56 students completed ESL 092 with a grade of C or better (up from 70%in 1991-92), Of the students who took ESL 092 in the fall, 82% completed ENG 121 or 131 withat least a C grade in the spring. (See Appendix E.) The ESL faculty decided that the pre- and post-tests were invalid measures of the success of international students in college, and will continue touse the Michigan Test of English language proficiency to place students in ESL classes.
Recommendations.a. Develop an institutional system for tracking the waiver process.b. Develop a more comprehensive tracking system.c. Develop non-tracking methods to assess the effectiveness of Reading, G.E.D., and Study
Skills (e.g., student satisfaction surveys and self-reports in subsequent classes).d. Recommend to the State Developmental Studies Task Force that MAT 111 and 114 be
reclassified as developmental studies courses or that MAT 060 be treated as a gatewaycourse to MAT 111/114.
e. Establish time limits for completing units in G.E.D. to help students set realistic goals.f. Consider additional methods to help students meet their G.E.D. goals.g. Expand the goal of ESL 092 to include preparation for success in all college-level classes.h. Expand the objectives of ESL 092 to include summarizing skills.i. Add the following measures of success: (1) There will be no significant difference be-
tween the GPAs of ESL 092 students who subsequently take ENG 121/131 and qualifiedinternational students who directly enter ENG 121/131; (2) ESL 092 students will subse-quently maintain at least a C average in their college-level classes.
OTHERIn the summer of 1992, ACC sent two faculty members to a Phi Theta Kappa workshop on
developing leadership skills within courses. As a result, ACC has instituted a team-taught leader-ship development course which integrates academic and vocational education, utilizing a small-group, hands-on approach in learning leadership skills (see Appendix F). The students in the pilotcourse generally rated the course positively (see Appendix F).
Recommendations. The instructors and Phi Theta Kappa recommended that:a. The course be offered again in the fall and that in the spring of 1994 it be double listed as
an offering in Business and in Humanities.b. Students be provided the opportunity to obtain a leadership certificate if within 12 months
they write about a specific follow-up experience in which they took a leadership role.c. The course be publicized to promote more student interest.
2 . NEW INSTITUTIONAL STRATEGIES FOR REPORTING ASSESSMENT
The Transfer Committee will include data and information from the official Transfer Account-ability Report in its Transfer Program brochure, which is distributed to students and used as a tool
3 7

in marketing and recruiting. The committee will also recommend that the Rapp Street Journal (thestudent twice-monthly newspaper) periodically publish information about accountability.
3 . MINORITY STUDENT DATA
Since 1988, student ethnicity enrollments at ACC have gradually increased to approximately10 percent of the student population. These figures closely mirror the ethnic make-up of ACC'sservice area and the ethnicity of ACC graduates for the 1992-93 academic year (see Appendix G).There are no statistically significant differences in term-to-term retention/persistence rates based ondeclared ethnicity (see Appendix I).
4 . DATA
a . GENERAL EDUCATION (See part 1 of the report.)
b . DISCIPLINE-SPECIFIC EDUCATIONVocational EducationLicensure anc, professional certification exams provide reliable and valid measures of student
attainment of professional standards. The 1992-93 report includes the results of student attainmentin Law Enforcement, Nursing, Physical Therapy and Real Estate, with pass rates above 97% onthree of the exams; all exceeded ACC's criterion rate of 75% (see Appendix H).
A totally redesigned student satisfaction survey was distributed to graduating students at theend of the semester in classes, with stamped self-addressed return envelopes. The response rateremained a problem, with less than 26%, compared to 29.5% in spring 1992. Following therec-ommendation of the 1992-93 Report, the student satisfaction surveys identified specific programareas or majors of the respondents. Overall, students who responded said they were satisfied withinstruction, curriculum, and institutional climate. Satisfaction with facilities and equipment indi-cated several problem areas, particularly room temperature, appropriate seating, equipment whichmeets industry standards, and lab schedules. A major goal in 1992-93 was to increase studentsatisfaction with advisinWcounseling above the 73% last year. The data suggest that while therewas apparent improvement, there is still room for improvement, particularly related to schedulingand planning (75.4%). Low response rate limits the interpretation of much of the data, (SeeAppendix H.) Data have already been shared with appropriate administrators and steps are beingtaken so that new desks will be more comfortable, and lighting and temperatures/ventilation will beimproved.
Exit interviews, conducted prior to graduation in May 1993, were another vehicle for deter-mining student satisfaction. Of the 258 who participated, 85% had identified their goal as a degreeor certificate when they matriculated at ACC; 98% said they felt their education at ACC would helpthem in a future job. (See Appendix H for more information.) However, the faculty concludedthat overall the exit interview does not warrant future use because it poses validity problems (e.g.,response bias) and, at the time of the interviews, too many students are not employed in jobs relat-ing to their profession.
Recommendations. The Vocational Education Accountability Committee recommended that:1) Vocational Education continue to utilize licensure and professional certification exams,
whenever available, as one measure of student achievement.2) Vocational Education make an effort to increase the graduating-student response rate on
satisfaction surveys across all vocational programs to accommodate useful data collectionrelated to the quality of instruction.
3) Instructional divisions conduct additional research to ascertain if lab schedules can be ad-justed to better accommodate students' schedules.
4) Vocational Education support the implementation of the Faculty Advising program.
34
5) Vocational Education support the Transfer Education mcommendation that the Collegeestablish a committee to promote communications across the curriculum.
6) Vocational Education improve the administration of the Student Satisfaction Survey(timeliness, recording of numbers distributed, etc.).
7) Vocational Education provide incentives to increase the response rate of the StudentSatisfaction Survey.
8) Vocational Education discontinue the exit interview process and include productive ques-tions from the ex:t interview in the Student Satisfaction Survey and the EmployerSatisfaction Survey.
c. RETENTION AND COMPLETIONACC exceeded its goals for retention, completion, and transfer in all but one area: "equaling or
exceeding the state average transfer rate for AA/AS graduates" in 1992-93 (see Appendix 1). Thelatter may reflect a significant number of ACC students transfening to non-public state institutionsor transferring without completing a degree, However, during the past five years, ACC's portionof state graduates who transferred increased for both AA/AS graduates and total graduates.
Recommendation. Re-examine the issue of transfer rates.
d . ALUMNI SATISFACTIONTransfer EducationA telephone survey was conducted to try to locate all students who had earned an AA, AS, or
AGS degree at ACC between Spring 1991 and Fall 1992. All 107 who could be located and whohad subsequently attended a four-year college or university were surveyed. The response size was55 (51%). The survey consisted of both openended and closed-ended questions (see Appendix Jfor a copy of the questionnaire and detailed summation). Ninety percent of the respondents indi-cated that they plan to pursue graduate degrees. All respondents said they unqualifiedly wouldrecommend ACC to a friend, except for one who said it would depend on the friend's goals.
On the closed-ended questions, overall, students were "Satisfied" or "Very Satisfied" withtheir educational experience at ACC; specifically, their preparation for transfer to their subsequentcollege/university, ability to read critically, ability to speak logically, ability to plan and write wellorganized compositions, ability to think clearly about a variety of human issues, ability to applyquantitative skills, and ability to use basic resources of a library to conduct research. Because thesamples sizes of AS (9) and AGS (7) were so small, no analyses were conducted to try to identifystatistically significant differences in terms of degrees received.
Responses to open-ended questions identified the quality of instructors and small class size asthe two most helpful aspecte of the students' educational experiences. Responses indicated that the
counseling process (academic advising) had significant strengths as well as weaknesses. Twenty-eight percent of the suggestions for improvement ttlated directly or indirectly to the transfer pro-cess. (See Appendix J for a complete listing and frequency of responses.)
Recommendations. The Transfer Education Accountability Committee made the followingrecommendations (see related recommendations in part 1):
1) Reconsider the 1991-92 Report recommendation to assess English, Speech, and Math on a
three-year rotational basis.2) Complete the curriculum review process for ENG 121 and ENG 122.3) Provide staff development activities for facilitating critical thinking in the curriculum.4) Review the definition for "General Education/Transfer Education" for possible change for
the 1993-94 Accountability Report.5) See also the Transfer Education Committee for Accountability recommendation on the
Faculty Advising program in the last paragraph of 4f (p. 7).
Vocational Education (See 4b, above, for survey of graduating students.)
e . AFTER-GRADUATION PERFORMANCEAs planned, no survey was conducted; the next survey is scheduled for 1993-94.
f. OTHERStudent ServicesIn response to recommendation 1 in the 1991-92 report, a Student Activities evaluative survey
was administered to a representative sample of ACC students during the fall semester. Resultswere used to target activities to specific student groups. Increased participation in certain activitieswas noted throughout the academic year.
In response to recommendation 2 in the 1991-92 report, Student Services' Direct Ors will con-tinue to analyze usage data as a means of determining new marketing strategies for all areas.Information about Student Services will be disseminated through instructors, the student newspa-per, and campus posting. Marketing of Student Services intensified during the year and resulted inincreased awareness and usage of services by ACC students.
A survey of graduating students indicated that all areas except Student Government fell withinthe minimum criterion range for acceptable performance (see Appendix K). Compared to 1991-92,slight increases in satisfaction levels were noted in all other areas.
Recommendation.1) The Student Government should develop strategies to enhance its visibility and credibility
with the student body.2) Consider fee and service reductions in view of legislative mandates impacting ACC's total
budget.
Adult EducationA random survey of 767 students indicated a high degree of student satisfaction with the Adult
Education program. Overall, 93.4% of the students were "Very Srtisfied" or "Satisfied" with theprogram (see Appendix L). This reflects a slight decline from the previous year (95.2%).
Recommendations. The Adult Education Division recommends that the College:1) Continue to offer a wide variety of Adult Education classes to meet the needs and interests
of students as well as to encourage life-long learning of people in its service area.2) Study the organizational structure, staffing patterns, and communication systems of the
Adult Education program to attempt to improve their effectiveness and efficiency.3) In response to enrollments in 1992-93, expand the Douglas County Adult Education pro-
gram, in terms of both the number and the locations of offerings, beginning fall 1993.
Business and Industry ServicesBIS served 630 employees of 23 companies; many of the companies served during the 1991-
92 year returned for additional training and/or special services in 1992-93. Satisfaction surveys ofstudents in regular classes and non-credit classes revealed that customized-training courses met theneeds of students who completed the 3urveys; 97% of the students who completed the evaluationforms either "Strongly Agree" or "Agree" that they were satisfied with the training they receiveu(see Appendix M). This reflects an increase from 92% in 1991-92. Twenty-six percent of the stu-dents were not surveyed because they were absent when the surveys were administered or becauseof an administrative oversight in delivering the forms in a timely way or failure of the instructor toadminister the surveys. (Evaluation of services provided through the Workplace Education projectis conducted externally and is, therefore, not reported here.)
To monitor employer ntisfaction, the program maintains constant oral communications with arepresentative of each company whose employees are involved in customized-training courses. Anew follow-up evaluation form (to be completed by managers) was created (see "Follow-UpEvaluation... ' in Appendix M), but because the form is used only for customized training pro-grams the data are not reported here.
Recommendations. The Office of Business and Industry recommends that the College:1) Continue to work closely with company representatives and instructors to insure that in-
tended learning outcomes are achieved.2) Review individual participant needs/wants at the beginning of each course in order to in-
sure the participants are also given the opportunity to achieve their personal goals.3) Increase efforts to collect feedback from all participants.
6
4) Create a computer database of continuous evaluation information for more complete andaccurate assessment.
Graduating Students' SatisfactionSurveys indicated that graduating students were generally satisfied with the quality of their ed-
ucation at ACC (see Appendix N).
Multicultural AwarenessThe College's annual Quality Days, November 1992, included a session to increase multicul-
tural awareness. The session was a replication of part of the multicultural training offered at theCollege in 1991-92. It was well attended by administrators, faculty, and staff.
A faculty member proposed the College's first international film series. The 10-film academic-year series was sponsored by the Student Activities program, with support from the Humanitiesand Social Sciences Division and from the Spring International School based at the College.Twenty to 50 people attended each film.
Recommendation. Offer another international film series in 1993-94 and increase publicity.
The Accountability ProcessThe College increased its commitment to the accountability process in several new ways.
First, as the accountability process became more integrated into all levels of the College, ACC rec-ognized the need to create an assistant to the Vice-President to coordinate the various efforts ofcommittees, divisions, departments, and individuals; the position of assistant coordinator of ac-countability was created to fill this need. Second, in response to student-reported problems in theadvising/counseling area, the College is implementing (beginning summer 1993) a new FacultyAdvising program. Third, the College funded all faculty and administrators who were interested inand available to attend the CCHE Accountability Conference. Fourth, the College funded sevenfaculty and staff members to attend a two-day Workshop on Critical Thinking InstructionalSnategies. Fifth, because the first Phi Theta Kappa national faculty training session on teachingleadership skills (summer 1992) appeared to have such positive results (see "Other," p. 3) in ateam-taught course, the College funded two more people to atteod the summer 1993 session. Theabove individtials will be sharing their insights with other members of the College community.Sixth, the College is supporting ongoing Accountability efforts during the summer by compensat-ing faculty for committee work during the summer, when they are not under contract.
The College has also increased the representation on its Accountability committees. Becauseso many business students transfer to four-year programs, the Dean of the Business Division wasadded to the Transfer Education Accountability Committee. To increase the responsiveness of theCollege to data collected during the Accountability process and to avoid duplication of efforts andcosts, the Accountability process is gradually being aligned with the Strategic Planning Process.
Finally, Accountability committees are now viewing assessment as an ongoing process, oc-curring at both formal and informal levels. On a more formal level, at the recommendation of theTransfer Education Committee for Accountability, the College included faculty from the transferprogram in the new Faculty Advising program when responses on the Transfer Survey (AppendixJ) indicated significant problems in advising for transfer students (the 1991-92 surveys had alreadyindicated significant advising problems in the Vocational programs). On informal levels mostfaculty engage in assessment of their effectiveness not only at the end of a term, but also on an on-going basis, adjusting their strategies as necessary (see for example, the discussion of journalwriting, p. 1; "Vocational Education," p. 2; and "Other," p. 3).
Additional Details. Additional details relating to the information in this report are available bycontacting the Vice-president of Instruction.
7

TABLE
OF
APPENDICES
A: MathFigure 1. MAA Calculus Readiness Exam Results
B: English 121 Instructor's Guidelines
C: Journal WritingStudent Survey of Helpfulness of Journal-Writing TutorialsSelf-Ratings of Journal Helpfulness: Frequencies, Percentages & MeansWhat Students Identified as Most Helpful About Journal Writing in an
Introduction to Literature Course
D: Communication Across the CurriculumSummary of Meetings on March 3 and 4Summary of Meetings on April 7 and 8
E: Developmental StudiesDefinitions and Explanations of CalculationsTable 1. Developmental Studies Tracking Analysis: ReadingTable 2, Developmental Studies Tracking Analysis: EnglishTable 3. Developmental Studies Tracking Analysis: Mathen,aticsGeneral Comprehensive Education (G.E.D.)English as a Second Language Tracking System
Table 4. Successful Completion of ESL 092Table 5. Success of ESL 092 Students in Subsequent ENG 121/131
F: Leadership Development Course
G: Minority Student DataStudent Ethnicity Enrollment Comparisons 1992-1993
Table 1. Enrollment Comparisons: Fall 1991 to Fall 1992Table 2. Enrollm.mi Comparisons: Spring 1992 to Spring 1993Table 3. Enrollment, Graduation and Service Area Ethnicity Comparisons
H Vocational EducationTable 1. Results of Licensure Exams: 1992-93Student Satisfaction Survey
QuestionnaireTable 2. Student Satisfaction Survey: Instructors/InstructionTable 3. Cuniculum and Institutional ClimateTable 4. Areas of Concern
Exit Interview SurveyTable 5. Summary of Exit Interview Responses
continued

I: Retention/Persistence and Transfer RatesTable 1. Completion/Persistence Rates Analysis Based on Student Right-to-
Know Tracking SystemACC Term-to-term Retention Rates: 1990-1993
Table 2. Semester-to-semester Retention/Persistence Rates for All Studentsof Arapahoe Community College
Table 3. Semester-to-semester Retention/Persistence Rates for Full-timeDegyee- or Certificate-seeking Students: Academic Years 1991-1993
Table 4. Semester-to-semester Retention/Persistence Rates for ACC Full-time Degree- or Certificate-seeking Students: 1992-93
Table 5. Transfer Rates of ACC Recipients to Colorado Public Four-yearInstitutions: 1987-1992
Table 5a. Percentage of Community College Graduates Transferring fromArapahoe Community College to Public Four-year Institutions: 1987-1992
Table 6. Grade-point Averages (GPA) of ACC Transfer Students to ColoradoPublic Four-year Institutions: 1986-1992
Acceptance Rates of ACC StudentsTable 7. Acceptance Rates of ACC Graduate Applicants to Colorado Public
four-year Institutions: 1987-1992Table 8. Completion/Persistence Rates of Community College Degree
Recipients After Transferring to a Colorado Public Four-year InstitutionSummary of Student Withdrawal Survey of ACC Students: 1991-1993Summary of ACC Student Satisfaction Survey
J: Transfer Education: Alumni Satisfaction SurveyPhone SurveyQuestionnaireSummary of Responses to 1992-1993 Transfer Survey
Table 1. Mean Differences in Satisfaction Items Between Transfer DegreesTable 2, Comparative Degree StatisticsTable 3. Overall Satisfaction of StudentsSummary of Responses to Other Survey Closed Questions of InterestTable 4. Summary of Open-Ended Question #17: "Most Helpful"Table 5. Summary of Open-Ended Question #18: "Least Helpful"Table 6. Summary of Open-Ended Question #19: "Suggestions for
Improvement"
K: Graduating-student Satisfaction Survey of Student Services...
L: Adult EducationTable 1. 1992-1993 Adult Education Student Satisfaction Survey
M: Business and IndustryStudent Satisfaction SurveyTable 1. Summary of Responses to Question 10: Overall SatisfactionFollow-up Evaluation of Customized, On-site Training (Manager Survey)
N: Graduating Students' SatisfactionTable 1. Graduating Student Survey: 1992-1993 Academic Year ("Compared
with when you entered ACC")Table 2. Graduating Student Survey: 1992-1993 Academic Year ("General
Evaluation")
1
1
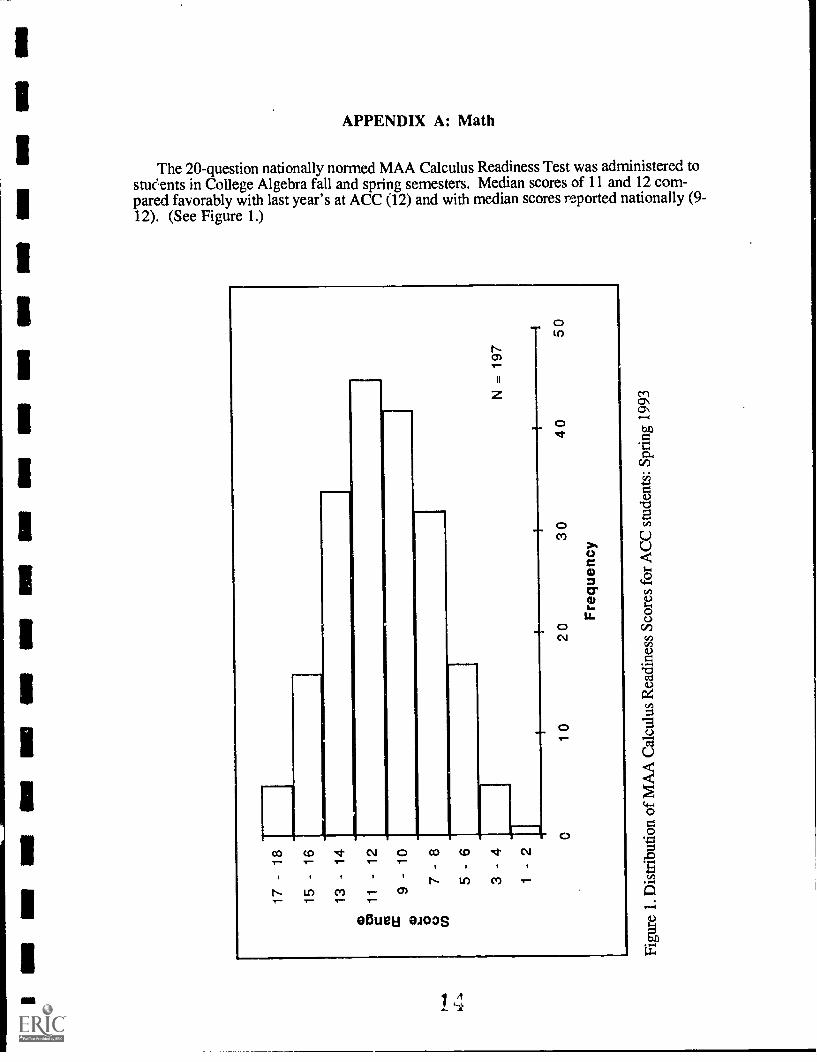
APPENDIX A: Math
The 20-question nationally normed MAA Calculus Readiness Test was administered tostueents in College Algebra fall and spring semesters. Median scores of 11 and 12 com-pared favorably with last year's at ACC (12) and with median scores reported nationally (9-12). (See Figure 1.)
NO.
/WO
CO CD Nr CV 0 CO (O V' CV1- 1-
N.. ILO CO
i" II) CO 0)T T Tethield mos
citr)
0
0
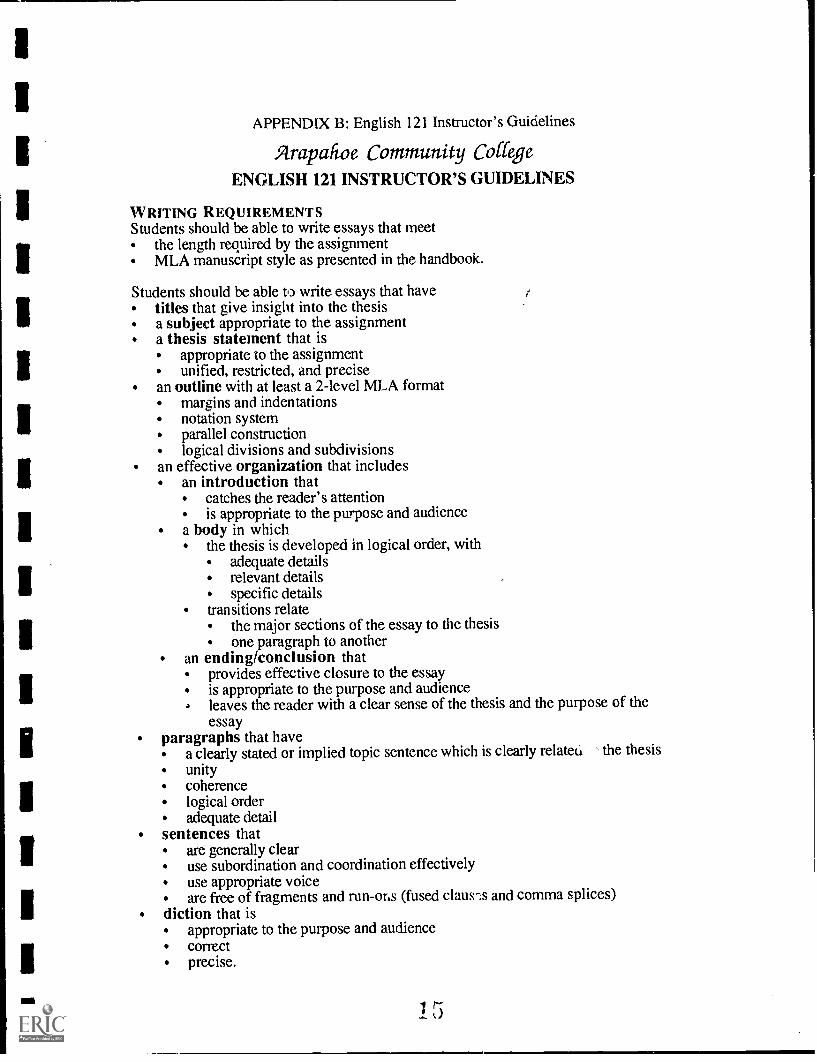
APPENDIX B: English 121 Instructor's Guidelines
Arapakoe Community CollegeENGLISH 121 INSTRUCTOR'S GUIDELINES
WRITING REQUIREMENTSStudents should be able to write essays that meet
the length required by the assignmentMLA manuscript style as presented in the handbook.
Students should be able to write essays that havetitles that give insight into the thesisa subject appropriate to the assignmenta thesis statement that is
appropriate to the assignmentunified, restricted, and precise
an outline with at least a 2-level MLA formatmargins and indentationsnotation systemparallel constructionlogical divisions and subdivisions
an effective organization that includesan introduction that
catches the reader's attentionis appropriate to the purpose and audience
a body in whichthe thesis is developed in logical order, with
adequate detailsrelevant detailsspecific details
transitions relatethe major sections of the essay to the thesisone paragraph to another
an ending/conclusion thatprovides effective closure to the essayis appropriate to the purpose and audience
-e leaves the reader with a clear sense of the thesis and the purpose of theessay
paragraphs that havea clearly stated or implied topic sentence which is clearly related the thesisunitycoherencelogical orderadequate detail
sentences thatare generally clearuse subordination and coordination effectivelyuse appropriate voiceare free of fragments and run-ons (fused claus:s and comma splices)
diction that isappropriate to the purpose and audiencecorrectprecise.

RESEARCH REQUIREMENTSStudents should be able to write a formal essay effectively incorporating research
in the MLA format, which usesa variety of sourcesparenthetical referencesWorks Cited list
in various ways, including but not limited to,running-text quotationsblock-format quotationsparaphrasessummaries
READING REQUIREMENTSWhen given an essay to read, students should be able to
state the thesisidentify the author's supportive detailsread actively (see critical thinking)respond critically (see critical thinking).
CRITICAL THINKINGStudents should also be able to
analyze and evaluate sources of informationanalyze and evaluate strengths and weaknesses of an argumentanalyze and evaluate form, style, content, and contextrelate ideas discussed in class to other contexts
LEARNING ENVIRONMENTStudents should be encouraged to
view reading and writing as a process of discoveryread and write with a clear understanding of purpose and types (modes) of writingincrease their vocabulary, paying special attention to lexical and figurative meaningsdevelop a sense of responsibility in the learning processmonitor their own comprehension and ask questions as neededdevelop a sense of being a part of a community of learners.
APPENDIX C: Journal Writing
I_ 7
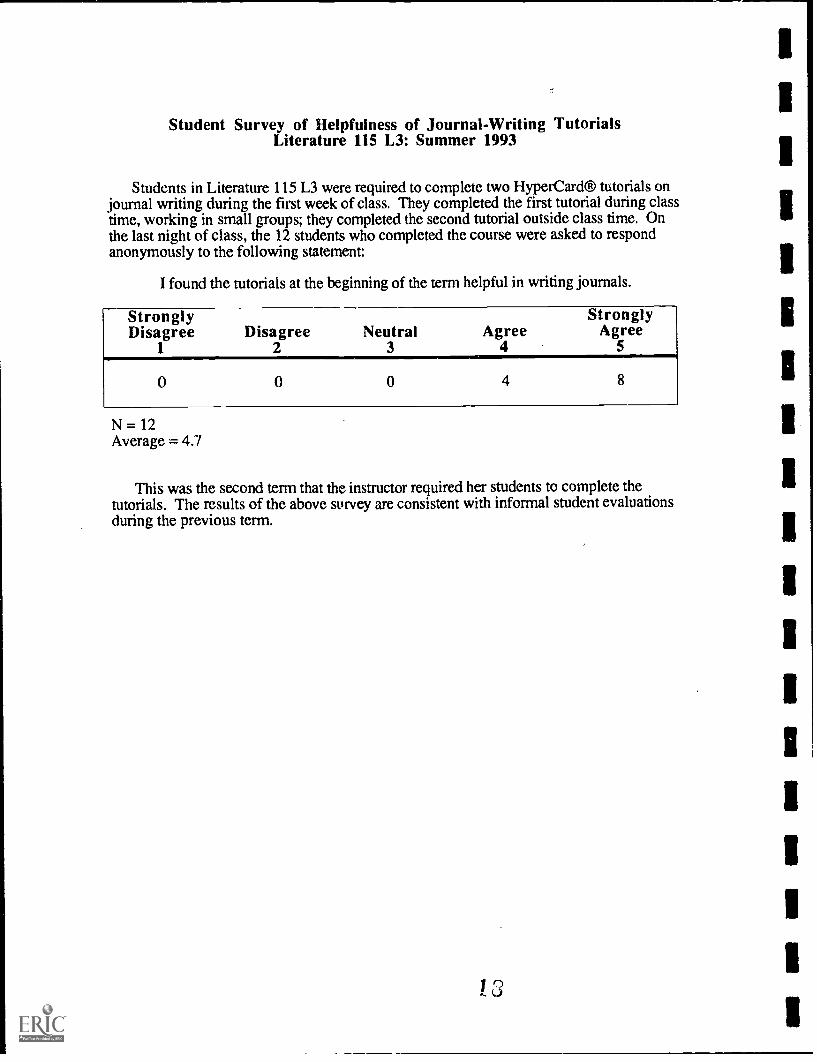
Student Survey of Helpfulness of Journal-Writing TutorialsLiterature 115 L3: Summer 1993
Students in Literature 115 L3 were required to complete two HyperCard@ tutorials onjournal writing during the first week of class. They completed the first tutorial during classtime, working in small groups; they completed the second tutorial outside class time. Onthe last night of class, the 12 students who completed the course were asked to respondanonymously to the following statement:
I found the tutorials at the beginning of the term helpful in writing journals.
Strongly StronglyDisagree Disagree Neutral Agree Agree
1
0
2 3 4 5
0 0 4 8
N = 12Average = 4.7
This was the second term that the instructor required her students to complete thetutorials. The results of the above survey are consistent with informal student evaluationsduring the previous term.

1Self-Ratings of Journal Helpfulness: Frequencies, Percentages & Means*
In a formal research study during the spring semester 1992,1 an instructor studied herstudents' use of journal writing in two sections of an Inixoduction to Literature class (LIT115). One part of the study included students' perceptions of the helpfulness of journalwriting after their first and last (seventh) journals. Students were asked to respond to thefollowing question;
How helpful did you find writing journals? Please circle only one.
Not at all
1 2
Somewhat
3
Very
4 5
Group 1
Notat all
2 3
Some-what
4 5Very
Hel i ful
NoRating
Total Mean
After 1 0 1 3 4 4 0 12 3.916
First2 2 1 8 3.875Journal 0 1 1 4
% 0% 10% 20% 40% 30%
After 1 1 0 2 5 4 0 12 3.916
Last --2 8 4.0Journal 0 0 2 4 2 0
% 5% 0% 20% 45% 30%
. ..
* Includes only students who answered both surveys.(Including the 5 students who were omitted yields grand means of 3.87 after the first journal
and 3.90 after the last journal.)(Note: The instructor did not see the "End-of-Journal-Writing Survey" until after she hadsubmitted grades for the course; students knew they were sealed in an envelope and held in the
supervisor's office.)
Additional analysis indicated that students' evaluations of journal writing were notsignificantly corre'ated with their grades in the course at the time of the survey.
1The data were collected for a dissertation and were analyzed during the summer and fall 1992.
1 J

What Students Identified as Most Helpful About Journal Writingin an Introduction to Literature Course
In a formal research study during the spring semester 1992,2 an instructor studied herstudents' use of journal writing in two sections of an Introduction to Literature class (LIT115). After their first and last journals (surveys 1 and 2, respectively), students wereasked, "What did you find most helpful about writing your journal?" Following is asummary of their responses.
Comment (Most Helpful Aspect of Journal Writing) Survey # # of Studentsfacilitated understanding 1
2
4
5
stimulated / facilitated my thinking (includingarticulating or clarifying thoughts, formulatingopinions, examining all of a story's points)
1
2
11
6forced me to think about what I read (instead ofreading passively or just for pleasure); made melook at a work in more than one light
1
236
tau_ht me to concentrate / focus m thou _hts other*forced me to read more carefully (including lookingfor details
2
stimulated questioning 1 .
helped me answer my own questions 1
232
helped me organize my thoughts 1
2other**
1
31
helped me collect my thoughts 1
21
1
having the opportunity to ask questions and havethem answered
2 2
having the opportunity to ask questions in private,without fear of student ridicule
2
following the catechism for analyzing storieshelped prepare for class discussion 2 3ihelped mc remember things I wanted to bring up inclass
2 1
helped me remember more detailshelped me prepare for quizzes 1
21
having the journal to review and elaborate on infuture individual studyknowing I could be honest about my opinions.feelin _s[no response]
* Survey I, N = 25 Survey 2, N = 20Some students wrote more than one comment.
** This comment was included in an answer to another question in the survey.
2The data were collected for a dissertation and were analyzed during the summer and fall 1092.
2
BEST COPY MAILABLE
1
1
II

APPENDIX D: Communication Across the Curriculum
TO: Department Chairs
FROM: Don Yeager
DATE: March 4, 1993
RE: Summary of Accountability Committee Meetings of Department Chairs,March 3 and 4
At our meetings yesterday and today, we agreed that although research shows that ourstudents and their employers are generally satisfied with the quality of our certificate anddegree programs, our graduates are not as proficient as we would like them to be incommunicating.
We identified the following primary proficiencies:Reading,Listening,Critical thinking,Writing,Speaking,Interpersonal communication,Ethics, andCross-cultural communication.
We agreed that the responsibility for improving these proficiencies does not rest with a fewteachers or a few courses (e.g., English 121 and Speech 115) but must extend to the wholefaculty and to the students themselves.
Thus we also discussed the importance of:Developing the student's sense of his/her own responsibilities in the learning process,Developing the student's metacognitive skills (including those essential to being a life-long learner),Developing the student's sense of being a part of a community of learners, andEstablishing rapport between the student and his/her teachers (this is, of course, relatedto the previous goal).
Planning PriorityTo address these needs, we agreed that the college should establish as one of its 1993-94planning priorities a "Communication Across the Curriculum" program. This priority wassuggested to the Chair of the Planning Committee, who was present on March 3.
Tasks for Follow-Up Meetings, April 7 and 8As a first step in the process, department chairs agreed to meet with their respectivefaculties to
Identify desired communications proficiencies in their certificate and degree programs.Review current general education requirements in certificate and degree programs.Are these meeting the needs?Identify strengths by inventorying course objectives and/or strategies individual facultycurrently use to address the desired proficiencies.Suggest ways to address current weaknesses.For example,
What type of help, if any, would faculty like in developing new instructionalstrategies?
Would faculty like to meet with members of the Speech and English Departmentsto discuss ways that general education courses could "interface" with programgoals and strategies?Would faculty like the opportunity to attend workshops or opportunities to visitclasses of faculty who use particular strategies.Are faculty interested in particular instructional strategies such as how dyads orsmall-group activities can facilitate learning and communication skills'?Would faculty like to know about types of short critical writing activities or waysjournal-writing can be used in courses do develop communication skills, rapport,and metacognitive skills?Should program requirements be changed'? Should, perhaps, interpersonalcommunications be substituted for public speaking in some programs'? Should itbe added to some programs?Should students be required to demonstrate particular communicationscompetencies before they are formally admitted to vocational programs?
3

TO: Department Chairs and Members of the Transfer and Vocational EducationalAccountability Committees
FROM: Don Yeager and Peggy Cole
DATE: April 12, 1993
RE: Summary of Meetings, April 7 and 8, 1993
In response to 1991-92 employer surveys, Transfer and Vocational Educational Accountabilitycommittees and the department/program chairs have been addressing the question of whetherour graduates have adequate communication skills. While employers were generally verypleased with our graduates' skill levels, we recognized that communications skjI. are aweakness in the American work force. At our March meetings, we, therefore, endorsed aCommunications Across the Curriculum program. Department/program chairs subsequently metwith their faculty to identify communication-skills outcomes (those desired versus thosecurrently required) and any help faculty might wish in achieving their educational goals fortheir courses and programs.
Our next step will be to ask faculty to identify their areas of expertise with instructionalstrategies that promote communications skills. Then we will ask faculty to identify strategiesand formats (e.g., Quality Days, workshops, formal courses) that they are interested in.
Thanks to those of you who attended the meetings and/or submitted written inventories,suggestions, and requests. Some people have already begun to implement suggestions.
The consensus of the April 7-8 meetings was that:1. Faculty participation in developing or enhancing expertise in teaching communications
strategies should be voluntary.2. The college should identify expertise of contractual as well as adjunct faculty in using /
teaching communications strategies (including critical thinking strategies).3. The college should encourage full-time and adjunct faculty to share their expertise (the
emphasis is on acknowledging excellence that already exists on campus before hiringoutside consultants for training).
4. The college should compensate faculty who lead workshops, etc.5. The college should try to find money to pay adjunct faculty if they attend training sessions.
INSTRUCTIONAL STRATEGIES
Following is a list of ideas that grew out of the meetings. Please note suggestions, requests forassistance, and offers of assistance that relate to your area. Some items (e.g., 6.a. in the firstsection) refer to specific programs, but suggestions apply to any program area that has similarconcerns.
When / How Opportunities to Learn Might Occur
1. A summer class in instructional strategies free to ACC full-time and part-time faculty
2. Workshops during Quality Days
LAs-.

3. Workshops or other activities during the year; e.g., Faculty Fridays (afternoon sessions), atwhich faculty can qhare their expertise, provide training, etc.
4. Sitting in on classes where a particular strategy is being used
5. Mentoring
6. Team / Guest Teachinga . A member of English faculty could teach units on grammar, mechanics, etc. in, (or
example, a course on legal writing. This could achieve several purposes:1) The paralegal instructor could develop more expertise in grammar and mechanics so
that he could ultimately teach the material himself, and he would not have tofind time in his busy schedule to attend training sessions.
2) Having an English teacher teich team the material would validate theimportance of the required English courses in that vocational program.
b. A member of the Speech faculty might teach units on public speaking, interpersonalcommunications, or nonverbal langvage.
c. A member of the English Department might teach a unit on journal writing (severaltypes or one type: purpose and procedure).
d. Faculty could lecture on cross-cultural communication or provide other suggestions onhow to incorporate issues relating to cross-cultural communication in courses (e.g.,Accounting).
7. Electronic field trips, or video tapesa . These could be used in class or at public display video units around campus to illustrate
various communication problems in work settings. They would cultivate students'awareness of the real-world neeti to master communications skills. They might be mini-cases (similar to the Zinger-Miller tapes).
b. Faculty could view faculty at ACC or other locations using alternative instructionalstrategies.
8. Othera . Speech faculty are asked to provide assistance in incorporating interpersonal and
organizational communication strategies and public speaking principles within theEarly Childhood Education program.
b. English faculty could meet with representatives from individual program areas toidentify specific problems and develop a plan to resolve them. This might be doneduring the summer, with faculty who participate being compensated for their work.
c. English faculty could provide assistance with writing activities in Accounting clatises.
d. Speech faculty could provide assistance in teaching interpersonal communication skills
in Accounting classes.
e. Faculty could attend workshops offered at other community colleges in the area.
Problems and Some of the Solution Strategies Identified
Skills are not systematically required.1. Most of the desired communications skills are required in at least some of the courses in each
program area or discipline, but because most programs and disciplines do not systematicallyrequire them, students may complete their degrees without having had to write, make oralpresentations, or engage in interpersonal communications in courses other than English 121,122 and Speech 115, 125. A related concern is that courses may provide the opportunity forstudents to use the skills but not require them (e.g., a few students do most of the talkingduring class discussion while others listen; thus they get little practice in applyingcommunication skills).
a . Require more of the skills in more courses, particularly in 200-level courses.
b. Require more on-the-job experiences.
c. Require students in degree programs to take at least two courses besides composition andspeech which are writing/speaking intensive. (Relevant courses would be flagged.)
2. Because most programs and disciplines do not systematically require communications skills,students may delay taking their English and Speech requirements until their last term.Thus, instructors of other courses cannot systematically build on those skills.
a Require students to take their English and Speech requirements before being formallyadmitted to programs. (Perhaps students could take up to 9 credits without having beenformally admitted to a vocational /occupational program.)
b. Inform students of the competencies expected in courses, grade accordingly, and allowstudents to recognize when they need to take their English and Speech requirements.
c. Require more on-the-job experiences which integrate skills.
d. Expand the academic assessment program so that students entry skills can be moreaccurately assessed and students can be advised accordingly.
e. Code classes according to the level of writing and speaking skills required. This wouldbe an academic advisement tool.
A Problem of Standards3. Faculty outside the English Department who require writing assignments are not sure of
their rights and responsibilities in requiring literacy. Several full-time faculty raisedthese concerns. One said that over the years she has vacillated between requiring studentsto master several types of writing assignments and allowing students to do only the type thestudent is most comfortable with. Furthermore, one adjunct faculty member in anoccupational program told a member of the committee that six students who are in the lastsemester of their program have inadequate writing skills; he said that three are basicallyilliterate. But he is not sure that he has the right to fail them for writing illiterately inessay examinations and other writing assignments.
Several ethical issues arise. First, if this instructor fails these students, they will notgraduate. Second, the faculty member may become so frustrated trying to deal with studentilliteracy, he/she may stop requiring writing assignments and only give multiple-choicetests. Third, if no writing is required, the student may not develop writing competenciesthat his/her profession and clients expect or require. Fourth, an adjunct faculty member

may feel pressured to lower standards if students complain, because he/she fears losinghis/her job....
a . Faculty might establish minimal standards for evaluating writing in their programareas and to communicate these "program-wide" standards to students.
b. Chairs need to articulate these standards to adjunct faculty and communicate waysthey can address problems when they arise (e.g., tell students they need to take therequired composition courses, encourage students to seek tutoring in the LearningStrategies Lab or from Carl Perkins tutors, etc.). If there are no program-widestandards, chairs need to communicate the rights of individual faculty to establishcriteria and evaluate students' performances accordingly.
Transfer of skills from composition courses to other courses4. Students who have taken English 121 (and perhaps 131) often cannot (or for some reason do
not) apply relevant research/writing skills in other courses.a . Verify that the students who have difficulties have indeed completed English 121
with a grade of C or better.
b. When teachers encounter former composition students with writing problems, theyshould share the details with the chair of the English Department (student name,types of problems) so the English Department can help resolve the problems. DoesEnglish 121 require the competencies in question? At what level of mastery? Was thestudent proficient when he/she completed English 121? Did too much time elapsebefore the student was required to use the skills in other courses? Did the student havedifficulty transferring the skills from one context to another?
c. Learning Strategies Lab and other instructional support centers tutor students who needhelp in writing papers. These services need to be publicized to instructors (particularlyadjunct faculty) and students.
d. English teachers might give assignments that require or encourage students to writeabout their career fields. For example, students might write1) reflective essays on what they learned by interviewing a client, a customer, a
patient, a patient's family, a police suspect (particularly if they are from differentethnic backgrounds); or what they learned from the worst mistake they ever madeat work;
2) narrative or reflective essays on a personal experience with prejudice, a jobinterview;
3) argumentative essays on career-related issues such as the need to upgrade a specificpiece of equipment, the need to train employees to use nonsexist language;
4) expository essays on what to do (not do) in a job interview, how to perform a criticaltask, the costs of employee theft (e.g., what if each employee ate or gave away oneserving of French fries per day, or took home one ball point pen a day).
e. Instructors in occupational/vocational courses might give mini research assignments(ones which do not require writing formal papers) to help students transfer researchskills from composition classes. For example, what percentage of motorists in the USwere uninsured in 1992? What percentage of children were born to unwed mothers in theUS in 1992? Identify the total percentage and percentages by ethnic group. Studentswould have to write the answer, identify the source and be able to explain how theylocated it. (Such assignments could be given first to students to complete in small groupsso the students could help each other, and later to students to complete individually.
Different questions relating to the same issue might be assigned, with class discussionproviding an opportunity for synthesis and evaluation.)
5. Students who have satisfied entrance requirements (i.e., appropriate ASSET scores and awriting sample, or completion of English 095) to enter the Police Academy sometimes dropout of the program when they are required to do research papers or make oral presentations.
a . Raise the entrance standards; for example, in programs that currently require English095 (or equivalent placement score), raise the requirement to English 121.
b. Require students to complete English 121 and the appropriate speech course before theyare formally admitted to the program.
c. Provide tutoring in the Learning Strategies Lab for using CARL and the other databases in the library and for writing research papers. (This will require purchase andinstallation of equipment and training of lab staff by the library staff.) Some of theEnglish faculty have already expressed interest in working in the lab in lieu ofteaching one course. Instruct the staff in the Learning Strategies Lab about theavailability of the Library video tape (this can be accessed on the video carrels in theLab).
d. Offer a two-week brush-up course in English just before the fall semester begins. (Thiscould resolve many students' problems, or persuade students that they need to takeadditional English courses. It could also introduce students to instructional supportservices that will be available to them if they need tutoring when they are assigned towrite papers.)
Training and access to electronic communications networks.6. Most faculty do not have access to and/or do not know how to use electronic communications
systems to communicate with other professionals or with students.
a . Equip faculty computers to access the appropriate communications networks that thecollege now has available and give faculty computer accounts.
b. Train faculty who are interested in learning how to use e-mail and bulletin boards.
c. Provide computer accounts for students so that faculty and students can communicatewith e-mail and bulletin boards.

APPENDIX E: Developmental Studies
23

Definitions and Explanations of Calculationsin Developmental Studies Appendix
The following definitions and calculations are derived from guidelines foranalyzingDevelopmental Studies for the purposes of accountability, from the Director of Researchand Planning for the Colorado Community College and Occupational Education System.They relate to tables 1, 2, and 3 in this appendix (E).
Student Tracking Groups
Developmental students who successfully completed developmental studies coursework and subsequently enrolled in college level disciplines.
Waiver students who were assessed as needing developmental studies course work butwho signed a waiver allowing them to take college level courses.
Tested students who were not exempted but who were assessed and qualified to performcollege level course work.
Exempt- students who were exempted from assessment testing based on pre-establishedcriteria (i.e., acceptable ACT/SAT scores, completed prior degree).
No information students who failed to undergo assessment testing and as a result noassessment scores were on file.
Explanation of Calculations
Percent successfully completing - the number of students completing the collegelevel course with a final grade of A, B, C, or P divided by the total number of studentswho took the course (A, B, C, P, plus D, F, W, U) times 100.
Average GPA computed on all students who received a grade (A-F) in the course.
Total - total number of students enrolled in college level course work for the particulardiscipline being reported.

Table 1. Developmental Studies Tracking Analysis: Reading
Students were tracked from REA 095 (Critical Reading) taken during or after the Fall1990 semester into PSY 101 (General Psychology I) taken during the Spring 1993semester.
Student Group' N% Successfully
Completing2AverageGPA2
Developmental 37 62.2* 2.70**
Waiver 120 60.0* 1.97**
Tested 79 77.3 3.05
Exempt 51 75.0 2.41
No Information 94
Total (C) 381
* There was no significant difference (p > .05) between the Developmental and Waivergroups.
** There was a statistically significant difference (p < .05) between the Developmental andWaiver groups.
ResultsStudents who successfully completed Reading, 095 (Critical Reading) subsequently per-
formed significantly better in Psychology 101 than students who waived assessment adviceto take REA 095. There was no significant difference in the completion rates of those twogroups; however, both groups had lower completion rates than students who matriculatedat ACC with college-level reading skills.
'For definition of tracking groups, see page 1 of this appendix (E).
2For explanation of calctilations, see page 1 of this appendix (E).

Table 2. Developmental Studies Tracking Analysis: English
Students were tracked from ENG 095 (Basic Composition) taken during or after the Fall1990 semester into ENG 121 (English Composition I) taken during the Spring 1993semester.
Student Group1 N% Successfully
Completing2Average
GPA2
Developmental 86 68.6* 2.12**
Waiver 17 66.7* 2.22**
Tested 247 77.8 2.67
Exempt 52 70.6 2.92
No Information 91
Total (C) 493
* There was no signficant difference (p > .05) between the Developmental and Waivergroups.
** There was no signficant difference (p > .05) between the Developmental and Waivergroups.
ResultsStudents who successfully completed ENG 095 (Basic Composition) subsequently per-
formed at about the same level in ENG 121 (English Composition I) as students whowaived assessment advice. Both groups had similar completion rates, which were lowerthan the rate for students who tested into ENG 121. However, because so few studentswho waived advice took English during the assessment terms, the results are difficult tointerpret.
1For definition of tracking groups, see page 1 of this appendix (E).
2For explanation of calculations, see page 1 of this appendix (E).

Table 3. Developmental Studies Tracking Analysis: Mathematics
Students were tracked from MAT 060 (Pre-Algebra) taken during or after the Fall 1990semester into MAT 121 (College Algebra) taken during the Spring 1993 semester.
Student Group1 N% Successfully
Completing2Average
GPA2
Developmental 16 62.5* 2.31**
Waiver 15 50.0* 2.23**
Tested 76 57.9 2.61
Exempt 81 72.4 2.38
No Information 106
Total (C) 294
* There was a statistically significant difference (p < .05) between the Developmental andWaiver groups.
** There was no significant difference (p > .05) between the developmental and Waivergroups.
ResultsStudents who successfully completed MAT 060 (Pre-Algebra) subsequently performed
at about the same level in MAT 121 (College Algebra) as students who waived assessmentadvice or who were exempted by their ACT/SAT scores; all three groups performed lowerthan the group which tested into MAT 121 on Asset. The developmental students experi-enced significantly higher completion rates than students who waived assessment advice orwho were exempted. However, the results are very difficult to interpret for several rea-sons: significantly different group sizes, ability of students to enroll in courses by waivingor without the benefit of advice, and the fact that MAT 060 is not a gateway course forMAT 121 (MAT 115 is the prerequisite).
1For definition of tracking groups, see page 1 of this appendix (E).
2For explanation of calculations, see page 1 of this appendix (E).

General Comprehensive Education
The G.E.D. program is designed to help students gain knowledge and skills in writing,social science, natural science, reading, and mathematics commensurate with at least mini-mal high school graduation standards. Students may then be ready for college-level contentcourse work, as most high school students are, or they may need additional work in Devel-opmental Studies courses, leading to gateway courses and then to college-level courses.However, the G.E.D. student differs from most students at ACC. For example, ages varyfrom 16 to 89. And ACC offers free G.E.D. pretests to members of the community. Thusit is difficult to interpret G.E.D. results in terms of completion, retention, or achievement incollege-level courses; students in G.E.D. will no longer be tracked.
Analysis of G.E.D. students who were pre tested revealed that 43% of those enrolled inG.E.D. classes passed the official G.E.D.; 25% of those pre tested passed the officialG.E.D. test.
A continuing problem with G.E.D. is failure to complete the program. Thus facultywill establish time limits for students to complete units and consider other strategies in or-der to help students set realistic goals and sub-goals.

English as a Second Language (ESL)Tracking System
Table 4. Successful Completion of ESL 092
Academic Year # Students % Successfully Completing
1990-91 40 88%
1991-92 27 70%
1992-93 56 77%
3-year Average 41 78%
Table 5. Success of ESL 092 Students in Subsequent ENG 121 or ENG 131
Tracked Tracked # Students in GPA inFrom To ENG 121/ENG 131 ENG 121/ENG 131
Fall 1991 Spring 1992 4 2.04
Fall 1992 Spring 1993 17 2.78*
* 82% completed the course with a grade of C or better
APPENDIX F: Leadership Development ClassSpring 1993
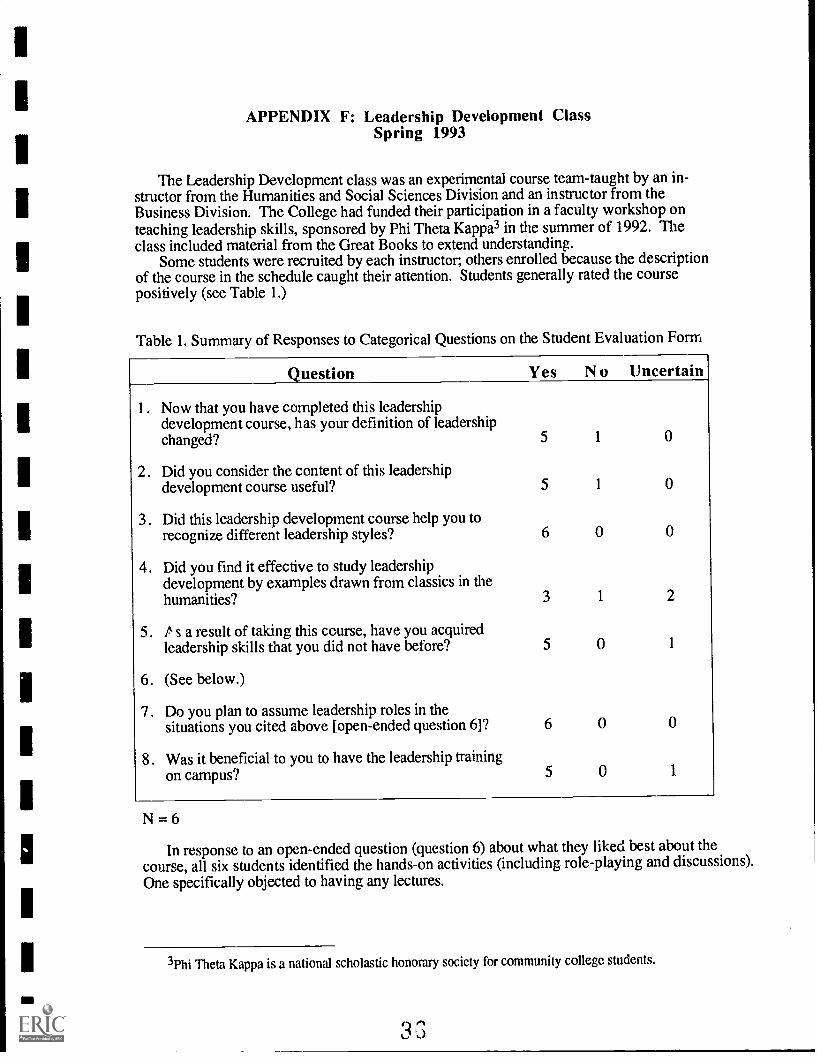
The Leadership Development class was an experimental course team-taught by an in-structor from the Humanities and Social Sciences Division and an instructor from theBusiness Division. The College had funded their participation in a faculty workshop onteaching leadership skills, sponsored by Phi Theta Kappa3 in the summer of 1992. Theclass included material from the Great Books to extend understanding.
Some students were recruited by each instructor; others enrolled because the descriptionof the course in the schedule caught their attention. Students generally rated the coursepositively (see Table 1.)
Table 1. Summary of Responses to Categorical Questions on the Student Evaluation Form
Question
1. Now that you have completed this leadershipdevelopment course, has your definition of leadershipchanged?
2. Did you consider the content of this leadershipdevelopment course useful?
3. Did this leadership development course help you torecognize different leadership styles?
4. Did you find it effective to study leadershipdevelopment by examples drawn from classics in thehumanities?
5. A s a result of taking this course, have you acquiredleadership skills that you did not have before?
6. (See below.)
7. Do you plan to assume leadership roles in thesituations you cited above [open-ended question 6]?
8. Was it beneficial to you to have the leadership trainingon campus?
Yes N o Uncertain
5 1 0
5 1 0
6 0 0
3 1 2
5 0 1
6 0 0
5 0 1
N = 6
In response to an open-ended question (question 6) about what they liked best about thecourse, all six students identified the hands-on activities (including role-playing and discussions).One specifically objected to having any lectures.
3Phi Theta Kappa is a national scholastic honorary society for community college students.
3 3

Appendix G: Minority Student Data
37

Student Ethnicity Enrollment Comparisons 1992-1993Arapahoe Com:nullity College
Table 1. Enrollment Comparisons: Fall 1991 to Fall 1992
Fall 1992 Fall 1991Ethnicity
Year-to-Year% Chan e
American 105 1.4 89 1.0 + 18.0IndianAsian 116 1.5 118 1.5 - 1.7Black 94 1.2 107 1.4 - 12.2Hispanic 435 5.7 409 5.2 + 6.4White 6,400 83.6 6,505 82.4 + 0.5InternationalStudents 174 2.3 148 1.9 + 18.2Unknown 327 4.3 423 5.4 - 22.7
Total 7,652 100 7,799 100 1.8
Table 2. Enrollment Comparisons: Spring 1992 to Spring 1993
EthnicitySpring 1993 Spring 1992 Year-to-Year
Change
Amer'ican 92 1.2 100 1.3 - 8.7IndianAsian 131 1.7 99 1.4 + 32.3Black 91 1.2 96 1.3 - 5.2Hispanic 424 5.7 410 5.4 + 3.4White 6,236 83.2 6,365 83.6 - 2.0InternationalStudents 315 4.2 169 2.2 + 86.4Unknown 205 2.7 377 4.9 45.6
Total 7,494 100 7,616 100 - 1.6
NOTE: Student ethnicity figures are self-reported. Year-to-year changes in percentages may not reflect the actual
diversity of students on campus,

Table 3. Enrollment, Graduation and Service Area Ethnicity Comparisons
Ethnicity1992-1993
% Av_g. Enrollment1992-1993
% Graduates1990
% Service Area
American Indian 1.3 ,9 0.5Asian 1,6 1.6 1.5Black 1.2 .6 1.5Hispanic 5.7 5.0 4.4White 83.4 86.9 91.0InternationalStudents 3.3 3.0Unknown 3.5 2.0 1.1
Total 100 100 100
Source: CCHE SURDS Degre.... Granted Files
NOTE: Service area percentages calculated from 1990 Census Information.
APPENDIX H: Vocational Education
4 ,,)

Table 1. Results of Licensure Exams: 1992-93
Exam NExamined
NPassed
% Passed
Colorado Real Estate Commission Exam 17 13 76.4
Nursing 53 52 98
P.O.S.T. Law Enforcement Exam 82 80 97.6*Fall 1992
Spring 1993 66 66 100*
Physical Therapist 12 12** 100
* Grade of C or higher** 17 students graduated from the program; only 12 took the Colorado exam
(Some students plan to practice in other states.)

likel ARAPAHOE COMMUNITY COLLEGE..."" STUDENT SATISFACTION SURvEY
Program/MajorYes NoEmployed in MajorField of Study?
We would appreciate your taking a few minutes to complete this survey. Your responses will help us evaluateour programs. Please return the completed survey before graduation to Frank Markley, Arapahoe CommunityCollege, P.O. Box 9002, Littleton, Colorado 80160-9002.
strongly agree
II. Instruction - Think about the instructorssomewhat agree
you have had at ACC, not just the ones whose I agreeclasses you are in now. Please indicate your 'somewhat disagreerate of agreement with the followingstatements about your ACC instructors . i strongly disagree
A . Use a variety of teaching skills/instructional strategies which assistin the learning process.
B . Demonstrate a current knowledge of the subject matter beingtaught.
C . Accessible to students enrolled in the course.
D . Usc a fair and equitable student evaluation/assessment system.
E . Organize materials to maximize class time.
Comments:
II. Curriculum
F . The objectives and requirements of the AAS degree and/orcertificate programs are clearly explained in the catalog.
G . Courses are appropriately sequenced for student learning.
H . Prerequisites to courses are appropriately assigned
I . The program offers a reasonable number of electives for students.
J . Career and occupational information is an integral part of thecurriculum.
K . Course outlines (syllabi) ckarly present the goals and cantent ofthe courses.
L Course descriptions in the catalog properly reflect the content ofthe courses in the program.
M . There was adequate communication between the instructor,
student and cooperative/internship employer concerning trainingobjectives.
Comments:
4 nPagel
00
0 00
0 0 0 0 0
0 0 0 0 00 0 0 0 00 0 0 0 0
0 0 0 0 0
0 0 0 0 0
0 0 0 0 0
0 0 0 0 0

strongly agree
Isomewhat agree
agree
somewhat disagree
Istrongly disagree
I I L Institutional Climate
A . The division office staff exhibit a professional manner.
BThe division office staff establish positive rapport with the. students.
The division office staff was open and receptive to assisting me inC solving my problems.
D . The faculty exhibit a professional manner.
E . The faculty establish positive rapport with the students.
F.The faculty was open and receptive to assisting me in solving myproblems.
Comments:
IV. Advising/CounselingStudents have an appropriate opportanity to meet with a programadvisor before entering the program.
Counselors are informed of career opportuMties in the programarea.
A .
13 .
0
0
0 o 0
O 0
O 0O 0
O 0
O 0 0 0 0
O 0 0 0 0
[excellent
above
average
below average
(unsatisfactory
C . Rate the advising and counseling services you received:
1. personal
2 . course information
3 . scheduling/planning
4. job/career
5 . English and math placement testing
Comments:4 3
Page 2
average
0 0 0000 0 0 0 00 0 0 0 00 0 0 0 0

al 1 of my classes
Imost of my classes
Isome of my classes
[none of my classes
V. Facilities/Equipment
A. Classrooms
I . The temperature was comfortable and conducive to learning.
2 . The lighting was adequate.
3 . The seating was comfortable.
4 . The seating was suitable for the instructional setting.
Comments:
B . Lab s
5 . The temperature was comfortable and conducive to learning.
6 . The labs were of adequate size.
7 . The equipment is current with industry standards.
8 . The open lab schedule is adequate for student use.
9 . The seating was suitable for the instructional setting.
10 . The seating was comfortable.
Comments:
VI. What did you find most helpful in your educational program at ACC?
VII. What did you find least helpful?
VIII. Suggestions for improvement?
Thank you for your assistance.
Page 3
0000
00
0
0000
O 0 0 0O 0 0 0O 0 0 0O 0 0 0

Student Satisfaction Survey
Table 2. Student Satisfaction Survey: Instructors/InstructionAll Vocational Programs Reported*
Categories
%Satisfied
AllPrograms(N = 130)
%SatisfiedCriminalJustice
(N = 52)
%Satisfied
Nu rsing**(N = 14)
%Satisfied
E.M.T.(N = 26)
Variety of Strategies 93.8 94.2 92.9 88.5
Knowledge of Subject Matter 96.1 98.1 92.8 88.4
Accessible to Students 85.4 82.7 85.7 84.6
Fair Assessment 84.6 82.7 71.5 84.6
Organized Materials 80.8 71.2 92.8 76.9
Other program areas are not listed because of the poor response rates.Percent of satisfied responses reported include ratings of Agree, Somewhat Agree andStrongly Agree.Caution should be exercised in interpreting the data related to the Nursing program,due to the return rate of 14 out of 53 graduates (26%).

Table 3. Student Satisfaction Survey: Curriculum and Institutional ClimateAll Vocational Programs Reported
Categories
SatisfiedAll
Programs(N =130)
SatisfiedCriminalJustice
(N = 52)
Satisfied
Nursing(N = 14)
Satisfied
E.M.T.(N = 26)
CurriculumObjectives & requirements
explained in catalog93.8 92.3 92.9 92.4
Courses appropriately sequenced 86.9 75.0 92.9 92.3Prerequisites appropriately
assigned 93.0 90.2 92.9 96.2Reasonable number of electives
offered 83.7 84.0 78.6 96.0Career information integral to
curriculum 80.7 80.4 85.7 83.6Syllabi clearly presents course
goals and content 81.5 63.4 92.9 96.2Catalog descriptions reflect course
content 91.4 88.3 92.9 92.3Adequate communication regarding
training objectives(cooperative/internships) 81.5 76.9 85.7 84.7
Institutional ClimateDivision office exhibits
professional manner 92.0 92.0 85.8 92.3Division office establishes positive
student rapport 85.2 88.2 71.4 88.0Division office assisted with
students' problems 84.0 82.3 77.0 92.3Faculty exhibits professional
manner 94.6 94.2 85.7 96.1Faculty establishes student
rapport 91.4 88.5 85.7 92.3Faculty assisted with students'
problems 88.6 86.3 84.7 92.0

Table 4. Student Satisfaction Survey: Areas of Concern*All Vocational Programs Reported
Categories % Responding Satisfactory(N = 130)
Lighting adequate 77.3
Lab seating suitable 75.5
Equipment industry standards 73.4
Lab temperatures conducive to learning 69.5
Labs adequate size 69.0
Lab schedule adequate 66.7
Lab seating comfortable 62.7
Classroom temperature conducive to learning 58.6
Seating comfortable 58.6
* Response rate = 26
4 7

Please Print STUDENT EXIT INTERVIEW TERM: YEAR:
Name Last First) Age Student ID Number Program Area AAS Cert.
Street Address City State Zip Code Hm Phone Bus Phone
Technical School
College
College
EDUCATIONAL BACKGROUND (prior to ACC)
Mame) Program
Major
Major
Deg. or Approx. Crs.
Deg. or Approx. Crs.
ACC EDUCATIONYears Attended From: To: Number of Credits Transferred to ACC Coop. Ed. at ACC ? Yes No
Goals when started at ACC: Degree or Certificate Skill Enhancement
Transfer Exploring Subjects
Other (specify)
Did you work with a FACULTY advisor while at ACC> _.Yes No
Did you work with a COUNSELOR while at ACC? Yes No
Seeking Employment
Promised Employment
Presently Employed
Company r
OCCUPATIONAL INFORMATION
iSupervisor
Address I
Previous Employment
Position
Position
Company
Company
Occupational Program
Occupational Program
No. Years Employed
City and Zip r1
No. Years
No. Years
May a representative from ACC contact your employer to request comments about the program you completed? Yes No
Future Employment What is your career objective over the next five years?
Type of position sought
I.
Plans to relocate
Future college plans
Other
RESPONSE TO ACC EDUCATIONDo you feel that your education at A.C.C. is helping you in your present position? Yes No
Do you feel that your education at A.C.C. will help you in a future position? Yes No
Comments or recommendations for ACC
Not Presently Employed
Faculty SignatureBEST COPY AVAILABLE
Date Li Student Signature Date
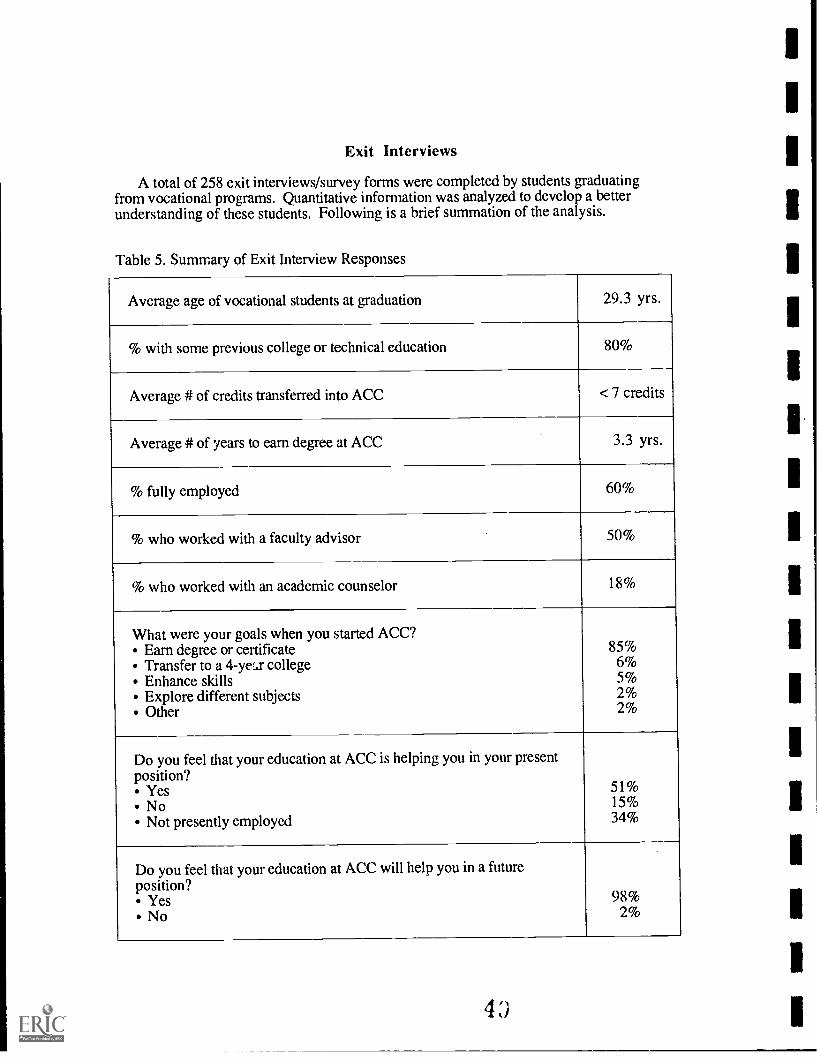
Exit Interviews
A total of 258 exit interviews/survey forms were completed by students graduatingfrom vocational programs. Quantitative information was analyzed to develop a betterunderstanding of these students. Following is a brief summation of the analysis.
Table 5. Summary of Exit Interview Responses
Average age of vocational students at graduation 29.3 yrs.
% with some previous college or technical education 80%
Average # of credits transferred into ACC < 7 credits
Average # of years to earn degree at ACC 3.3 yrs.
% fully employed 60%
% who worked with a faculty advisor 50%
% who worked with an academic counselor 18%
What were your goals when you started ACC?Earn degree or certificate 85%Transfer to a 4-yeu college 6%Enhance skills 5%Explore different subjects 2%Other 2%
Do you feel that your education at ACC is helping you in your presentposition?
Yes 51%No 15%Not presently employed 34%
Do you feel that your education at ACC will help you in a futureposition?
Yes 98%No 2%
4 :)
1
1

APPENDIX I: Retention/Persistence and Transfer
5 r)
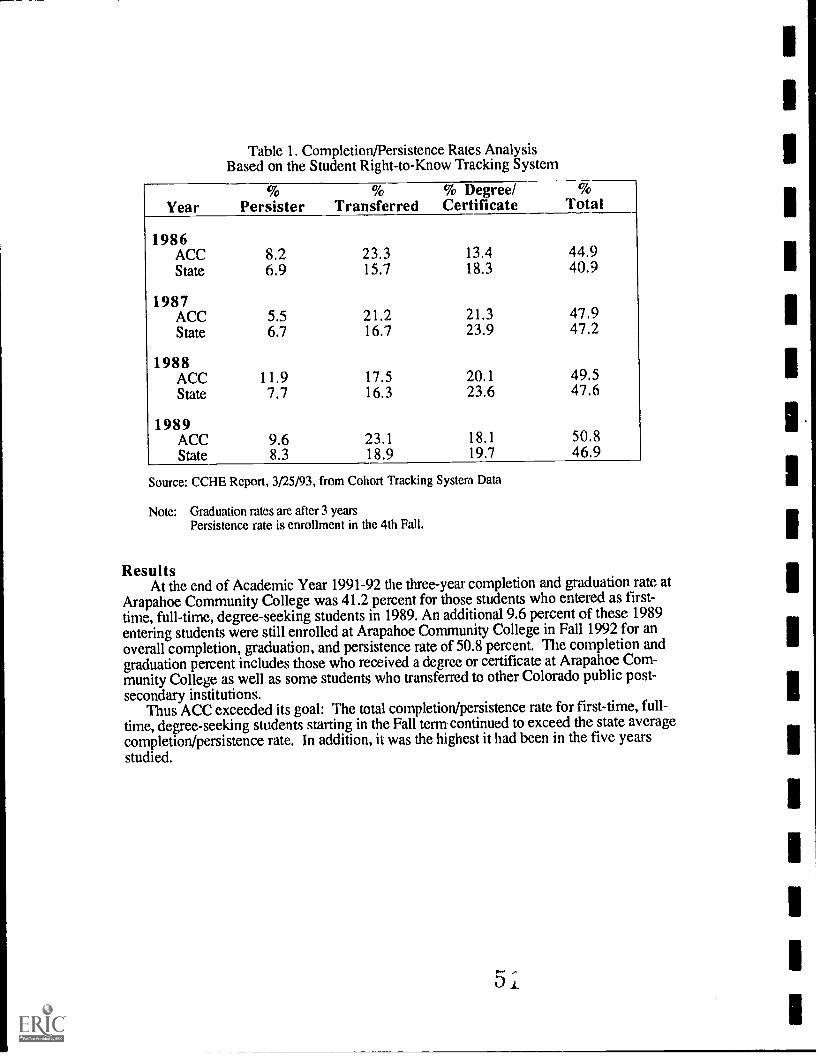
Table 1. Completion/Persistence Rates AnalysisBased on the Student Right-to-Know Tracking System
Year Persister Transferred% DegreeCertificate Total
1986ACC 8.2 23.3 13.4 44.9State 6.9 15.7 18.3 40.9
1987ACC 5.5 21.2 21.3 47.9State 6.7 16.7 23.9 47.2
1988ACC 11.9 17.5 20.1 49.5State 7.7 16.3 23.6 47.6
1989ACC 9.6 23.1 18.1 50.8State 8.3 18.9 19.7 46.9
Source: CCHE Report, 3125/93, from Cohort Tracking System Data
Note: Graduation rates are after 3 yearsPersistence rate is enrollment in the 4th Fall.
ResultsAt the end of Academic Year 1991-92 the three-year completion and gaduation rate at
Arapahoe Community College was 41.2 percent for those students who entered as first-time, full-time, degree-seeking students in 1989. An additional 9.6 percent of these 1989entering students were still enrolled at Arapahoe Community College in Fall 1992 for anoverall completion, graduation, and persistence rate of 50.8 percent. The completion andgraduation percent includes those who received a degree or certificate at Arapahoe Com-munity College as well as some students who transferred to other Colorado public post-secondary institutions.
Thus ACC exceeded its goal: The total completion/persistence rate for first-time, full-time, degree-seeking students starting in the Fall term continued to exceed the state averagecompletion/persistence rate. In addition, it was the highest it had been in the five yearsstudied.

ACC Term-to-term Retention Rates: 1990-1993
The Office of Institutional Research is monitoring retention rates over a three-year pe-riod before the Accountability Task Force establishes formal goals for this area. Tables 2,3, and 4 present retention/persistence rates from semester to semester for academic years1990-1993, 1991-93, and 1992-93. (See related table in Appendix G: Minority StudentData.)
ResultsBased on the entire student population, 59 percent of the students who were enrolled
during the Fall 1991 semester returned during the Spring 1992 semester. This is an in-crease of two percent over the 1991-92 academic year. Because Arapahoe CommunityCollege provides a variety of services to a diverse population, many students who enrolledduring the Fall semester may have met their education goals of career upgrade, personal in-terest, or skill building. Institutional analysis indicates that many students enroll in coursesone semester and transfer to a four-year institution the next.
When full-time degree- and certificate-seeking students are analyzed based on Fall en-rollments, 81 percent continued their studies into the Spring semester. This is an increaseof four percent over the previous year. This group more adequately reflects the "traditionalstudent" and provides a better indicator of retention/persistence and the success of retentionprograms such as Academic Alert and others at Arapahoe Community College.

Table 2. Semester-to-semester Retention/Persistence Ratesfor All Students of Arapahoe Community College:
Academic Years 1990-1993
Item% Retained % Retained % Retained
Fall '90 - 'Sp 91 Fall '91 - Sp '92 Fall '92 - Sp '93
GenderFemales 59 58 60Males 54 55 57
EthnicityBlack 40 52 56Hispanic 51 58 56Native American 57 57 48Asian American 64 51 53White 60 58 59Unknown 39 44 58
Student EmploymentFull-time 54 54 56Part-time 65 64 61Not Given 50 59 61
Enrollment< 7 credits 47 45 477 - 12 credits 70 66 69> 12 credits 78 79 84
MajorsDeclared 65 64 58Undeclared 50 51 59
Declared DegreeAA 72 78AAS 71 73AGS 66 67AS 84 79Certificate 54 65Undeclared 41 40
Age< 18 48 4918 - 21 63 6422 - 29 58 5530 - 39 58 6140 - 49 54 5350 - 64 44 48> 64 43 58
Total Retention 5 7 5 7 5 9
NOTE: Retention/persistence figures do not include students who graduated in the Fall semester and didnot return to the institution, because they had completed their programs.

Table 3. Semester-to-semester Retention/Persistence Ratesfor Full-time Degree- or Certificate-seeking Students:
Academic Years 1991-1993
% Retained % Retained % RetainedItem Fall '90 - Sp '91 Fall '91 - Sp '92 Fall '92 - S
GenderFemalesMales
8370
8577
EthnicityBlack 57 68Hispanic 77 78Native American 74 76Asian American 66 85White 78 82Unknown 76 83
Student EmploymentFull-time 74 78Part-time 81 77Not Given 77 85
Enrollment12 - 15 credits> 15 credit
MajorsDeclaredUndeclared
8477
7776
8278
8182
Declared DegreeAA 78 83AAS 85 81
AGS 74 74AS 87 82Certificate 74 84Undeclared 0 0
Age< 1818 - 2122 - 2930 - 3940 4950 - 64> 64
Total Retention
6781708485855('
60758290899055
77% 81%
N OTE: Retention/persistence figurc :; do not include students who graduated in the Fall semester and didnot return to the institution, "oecause they had completed their programs.
* Information on Full-time students W:',3 not analyzed during the 1990-91 academic year.
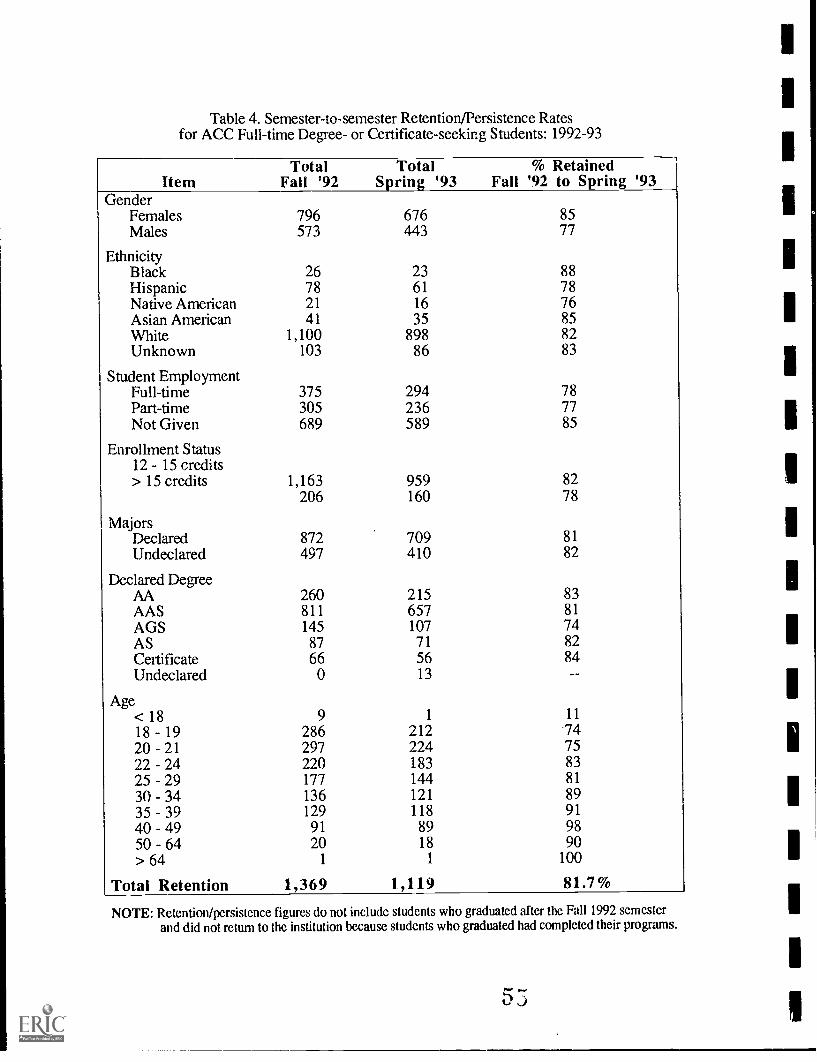
Table 4. Semester-to-semester Retention/Persistence Ratesfor ACC Full-time Degree- or Certificate-seeking Students: 1992-93
Total Total % RetainedItem Fall 192 S rin '93 Fall '92 to S rin 93
GenderFemalesMales
EthnicityBlackHispanicNative AmericanAsian AmericanWhiteUnknown
Student EmploymentFull-timePart-timeNot Given
Enrollment Status12 - 15 credits> 15 credits
MajorsDeclaredUndeclared
Declared DefgeeAAAASAGSASCertificateUndeclared
Age< 1818 - 1920 2122 - 2425 - 2930 - 3435 3940 4950 64> 64
Total Retention
796 676 85573 443 77
26 23 8878 61 7821 16 7641 35 85
1,100 898 82103 86 83
375 294 78305 236 77689 589 85
1,163 959 82206 160 78
872 709 81497 410 82
260 215 83811 657 81145 107 7487 71 8266 56 84
0 13
9 1 11
286 212 74297 224 75220 183 83177 144 81136 121 89129 118 9191 89 9820 18 90
1 1 100
1,369 1,119 81.7%
NOTE: Retention/persistence figures do not include students who graduated after the Fall 1992 semesterand did not return to the institution because students who graduated had completed their programs.

1
1
1
1
Table 5. Transfer Rates of ACC Recipients to Colorado Public Four-year Institutions:1987-1992
GraduationYear
Arapahoe CommunityCollege
%Total Grads Transferred
All Colorado CommunityColleges
%Total Grads Transferred
1987-1988AA/AS 100 42.0 958 48.8All Grads 519 18.5 4,655 17.2
1988-1989AA/AS 100 53.0 1,005 51.8All Grads 566 18.4 5,190 17.5
1989-1990AA/AS 91 53.9 960 50.0All Grads 610 15.8 5,396 15.7
1990-1991AA/AS 118 50.0 1,134 50.2All Grads 671 13.4 5,697 14.7
1991-1992AA/AS 161 40.3 1,262 43.3All Grads 828 11.2 6,242 12.1
5-year AverageAA/AS 114 47.8 1,064 48.8All Grads 639 15.5 5,436 15.4
Source: CCCOES Division of Research and Planning from CCHE SURDS extract files.
ResultsBased on a five-year average, ACC exceeded the overall rate of transfer but failed to
meet its criterion of equaling or exceeding the state average transfer rate for AA/AS gradu-ates. The latter may reflect a higher percentage of ACC students transferring to non-publicstate colleges and universities compared to the state average. (In addition, ACC's HonorsInstitute helps outstanding students transfer to prestigious institutions throughout the coun-try. Other AA/AS graduates transfer on their own initiatives to other institutions which arenot included in the target transfer schools.)
Figures from CCHE show very little difference concerning students who transferwithin one year and students who transfer within the timeframe of the reporting period(three years).
Further analysis reveals additional insight. During the past five years both the numberand percentage of ACC graduates who earned an AA/AS increased (a steady increase from100 to 161; 61% total). The percentage increase exceeded the state average increase of32%. Moreover, ACC's percentage of the total state graduates who earned an AA/AS in-creased from 10% to 13%; and ACC's percentage of all graduates increased from 11% to13%.
5 .1
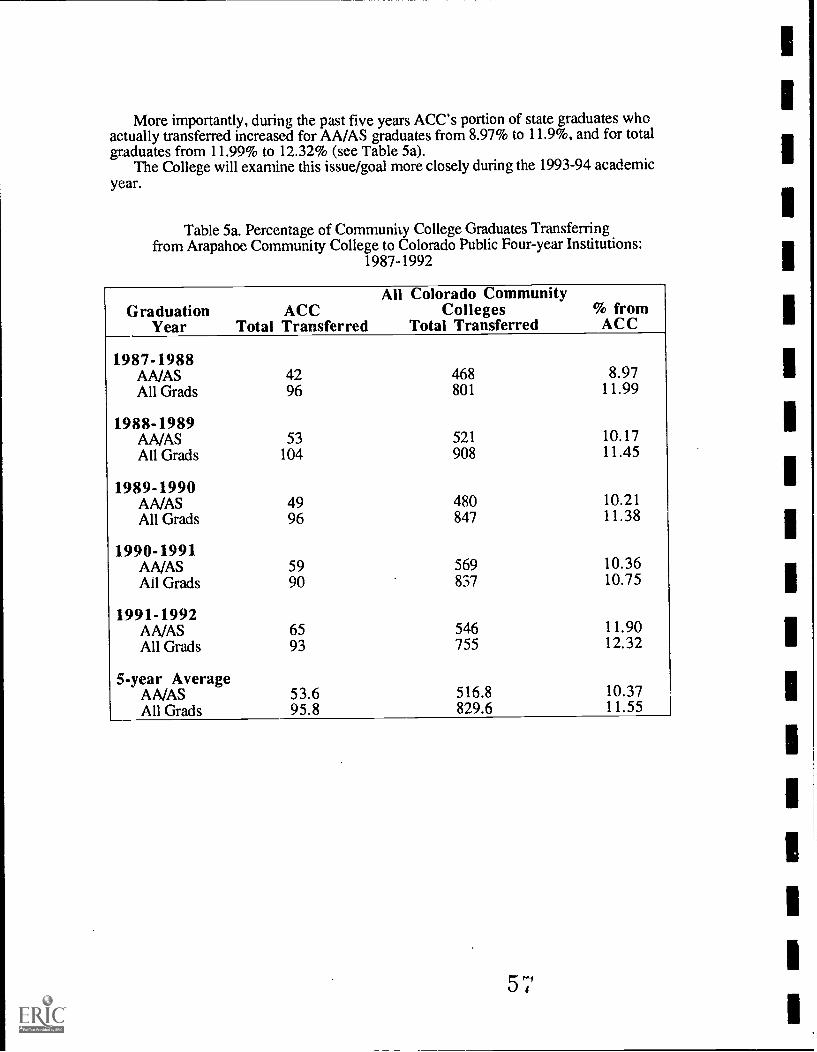
More importantly, during the past five years ACC's portion of state graduates whoactually transferred increased for AA/AS graduates from 8.97% to 11.9%, and for totalgraduates from 11.99% to 12.32% (see Table 5a).
The College will examine this issue/goal more closely during the 1993-94 academicyear.
Table 5a. Percentage of Community College Graduates Transferringfrom Arapahoe Community College to Colorado Public Four-year Institutions:
1987-1992
GraduationYear
ACCTotal Transferred
All Colorado CommunityColleges
Total Transferred% fromACC
1987-1988AA/AS 42 468 8.97All Grads 96 801 11.99
1988-1989AA/AS 53 521 10.17All Grads 104 908 11.45
1989-1990AA/AS 49 480 10.21All Grads 96 847 11.38
1990-1991ANAS 59 569 10.36All Grads 90 837 10.75
1991-1992AA/AS 65 546 11.90All Grads 93 755 12.32
5-year AverageAA/AS 53.6 516.8 10.37All Grads 95.8 829.6 11.55

Table 6. Grade-point Averages (GPA) of ACC Transfer Studentsto Colorado Public Four-year Institutions: 1986-1992
Transfer GPAGraduation Year Ara ahoe CC State Average
1986-1987AA/AS 3.3 3.0All Students 3.1 3.0
1987-1988AA/AS 3.3 3.1All Student/ 3.1 3.0
1988-1989AA/AS 3.2 3.0All Students 3.2 3.0
1989-1990AA/AS 3.2 3.0All Students 3.0 3.0
1990-1991AA/AS 3.3 3.0All Students 3.2 2.9
1991-1992AA/AS 3.1 3.0All Students 2.9 2.9
Source: CCCOES Division of Research and Planning from CCHE SURDS extract files.
ResultsThe average Arapahoe Community College transfer student maintains a solid "B" aver-
age after transferring to a four-year Colorado public institution. The average GPA of atransfer student upon graduation from ACC is 3.2 on a 4-point scale. As measured byGPA, student academic performance at four-year colleges and universities is not statisti-cally different from their performance at ACC.
ACC exceeded its criterion: ACC transfer graduates attending 4-year public Coloradopost secondary institution will have cumulative GPAs equal to or exceeding a 3.0 GPA,measured as an average over a five-year period.

Acceptance Rates of ACC Students 1987-1992
Since acceptance rates depend on the type of post secondary institution a student hasapplied to and the student's intended major, the Accountability Task Force has establishedno formal goals for acceptance rates of Arapahoe Community College graduate applicantsto four-year Colorado public institutions. The following comparison is for informationpurposes only and is intended to show that almost all Arapahoe Community College stu-dents who apply are accepted into Colorado public four-year colleges and universities.
Table 7. Acceptance Rates pf ACC Graduate Applicants toColorado Public Four-year Institutions: 1987-1992
Graduation Year N % Accepted
1987AA/AS 52 92.3All Students 120 92.5
1988AA/AS 66 93.9All Students 157 92.4
1989AA/AS 61 93.4All Students 148 91.2
1990AA/AS 67 94.0All Students 146 93.2
1991AA/AS 80 93.8All Students 157 89.9
1992AA/AS 95 95.8All Students 200 91.5
Source: CCCOES Division of Research and Planning from CO-1E SURDS extract files.
ResultsSince 1987, over 90 percent of ACC graduates who apply to a four-year Colorado post
secondary institution have been accepted. It can be concluded that receiving a two-year de-gree at ACC provides students with access to the four-year colleges and universities.

1
1
Table 8. Completion/Persistence Rates of Community College Degree RecipientsAfter Transferring to a Colorado Public Four-year Institution
Year/DegreeType
% Completion/Persistence
N Arapahoe CC N State Average
1986AA/AS 48 79.2 331 69.2All Students 91 51.7 685 59.3
1987AA/AS 47 85.1 445 74.4All Students 91 72.5 836 63.7
1988AA/AS 42 83.3 469 77.4All Students 97 61.9 803 67.2
1989AA/AS 53 69.8 521 69.6All Students 104 61.6 874 64.7
1990AA/AS 49 65.7 480 73.6All Students 96 57.3 851 67.9
5-year AverageAA/AS 48 76.6 449 72.8All Students 96 61.1 810 64.6
Source: CCCOES Division of Research and Planning From CCHE SURDS extract files.
ResultsThe five-year average completion/persistence rate for ACC AA/AS students is 76.6
percent. This figure exceeds the ACC criterion of 75%. In addition, it exceeds the five-year average state transfer rate.
6 w)

Summary of Student Withdrawal Survey of ACC Students: 1991-1993Evaluation by Total and Course Withdrawal Students
Quality of teaching:Excellent
Year 1 2
MeanPoor
6
1991-92 26% 25% 21% 13% 6% 8% 2.7
1992-93 26 25 19 14 9 6 2.7
College course work:
Year
TooDifficult
1 2 3 4 5 6Too Easy
1991-92 3% 16% 52% 20% 5% 3% 3.2
1992-93 5 10 36 41 7 I 3.4
Attitude of classroom instructors:
YearExcellent Poor
1 2 3 4 5 6
1991-92 36% 23% 23% 7% 4% 6% 2.4
1992-93 31 26 15 14 7 5 2.6
Attitude of staff, administrators, non-classroom personnel:Excellent Poor
1 2 3 4 5 6
1991-92 33% 23% 23% 9% 10% 2% 2.4
1992-93
Satisfaction with Academic Advising:
YearSatisfied Unsatisfied
1 2 3 4 5 6
1991-921992-93 21% 18% 22% 24% 9% 5% 3.0
Do you currently have plans for additional education? (1992-93)7% No, not at this time
61% Yes, I plan to re-enroll at ACC25% Yes, I plan to enroll at another college
8% I am cunently undecided about any additional education
ResultsMost of the students who withdrew from ACC during the 1992-1993 academic year did
so because of personal reasons.. The majority were satisfied with the instruction they werereceiving and 61% plan to re-enroll at ACC in the future. Thus ACC met its goal: Studentswho withdraw or drop classes from ACC will express satisfaction with their education ex-
perience at the College.
6 1i

Summary of ACC Student Satisfaction Survey
Three years of data will be gathered before the Accountability Task Force establishesformal goals for these questions. In the meantime, increases and decreases in satisfactionwill be monitored from year to year. In 1993, 540 Graduating Students Surveys weremailed to students planning to graduate during the 1992-1993 academic year. Total re-sponse rate = 45 percent with 243 surveys returned.
1: ACC has helped me meet the goals I came here to achieve._Question1992 1993
Strongly Agree 48%Agree 46Uncertain 4Disagree 1
Strongly Disagree >1
Question 2: How well do you feel ACC prepared you for your chosenoccupation or for continuing your education?
1992 1993Exceptionally Well 18% 25%More than Adequately 33 33Adequately 46 40Less Than Adequately 2 >1Very Poorly 2 1
Question 3: If you could start college_all over again, would you chooseto attend Arapahoe Community College?
Definitely YesProbably YesU ncertainProbably NoDefinitely No
1992 199332% 39%47 4710 10
74
4>1
Question 4: The skills I learned at ACC have enriched my daily life andmade me a more complete person.
1992 1993
Strongly Agree 25% 26%Agree 53 55
Uncertain 14 14
Disagree 6 5
Strongly Disagree 2
ResultsQuestions 2 through 4 show an increase in the level of satisfaction when compared
with 1992 results. Question I is new to the survey. Overall, students report a positiveexperience while attending ACC.
APPENDIX J: Transfer Education Alumni Satisfaction
03

Phone Survey
[Effort was made to telephone each student who had received an AA or AS degree from June1991 through December 1992 (students' phone numbers at the time of graduation were used).The following form was used to record information about post-ACC college attendance and cur-rent address. The Alumni Satisfaction Survey was mailed to every student contacted in thisphone survey who had attended another college since graduating from ACC.]
NameLast First
Local Mailing Address & Telephone (if applicable)
Street
City State Zip
TelephoneHome Work
Is the person currently attending college? Yes No
If "No," Has the person attended college since graduating from ACC?
Yes No
Is the person planning to attend college within the next two ycars?
Yes No
If "Yes" (currently attending college),list name of college, and mailing address if other than above local address.
College
AddressStreet
City
TelephoneHome
State Zip
Work

MikvAvor Arapahoe Community College
1
2
We would appreciate your taking a few minutes to complete the following survey.Your responses will help us evaluate our program. Please return the survey by April 5, 1993 to
Frank Markley, Arapahoe Community College, P. O. Box 9002, Littleton, Colorado 80160-9002.
Current college/university
What is your major?
3 Did you plan to pursue a bachelor's degree when you began attending ACC? Yes D No D
4 Was the focus of your studies at ACC the same as your current academic major? Yes No D
5 How many credits have you completed at your current college/university?
6 What is your GPA at your current college/university?
7 When do you plan to complete your current degree?
8 If you plan to pursue an advanced degree, please check which one(s):
MBA El MA/MS D MFA C3 PhD D EdD D
MD D DVM C3 law degree 0 Other
9 Would you recommend ACC to a friend? Yes D No 0
Satisfaction with the preparation you received at ACC in the following areas:
I Not Applicable
I Very Dissatisfied
[ DissatisfiedSatisfied
I Very Satisfied
10 Ability to think clearly about a variety of human issues
11 Ability to read critically (e.g., evaluate information & ideas)
12 Ability to speak logically (e.g., organize & express information & ideas)
13 Ability to plan and write well organized compositions
14 Ability to apply quantitative skills (e.g., interpret charts, graphs & statistics)
15 Ability to use basic resources of a library to conduct research
16 Overall satisfaction with your preparation for transfer to your current college/universitye
continued on other side

17 What did you find most helpful in your educational program at ACC?
18 What did you find least helpful?
19 Suggestions for improvement?
OPTIONAL
Sex: MD F
Age:
How do you prefer to describe yourself!
D American Indian or Alaskan Native D Black Non-Hispanic
El Asian or Pacific Islander LI White Non-Hispanic
D Hispanic LI Other
Name
Thank you for your assistance.
ACC HISTORY We. have completed the following information for you.
First Enrolled: Sp D su LI F LI Year
Completed Degree: Sp LI su D F 0 Year
Degree: AA Li AS AGS
Credits completed at ACC: GPA:
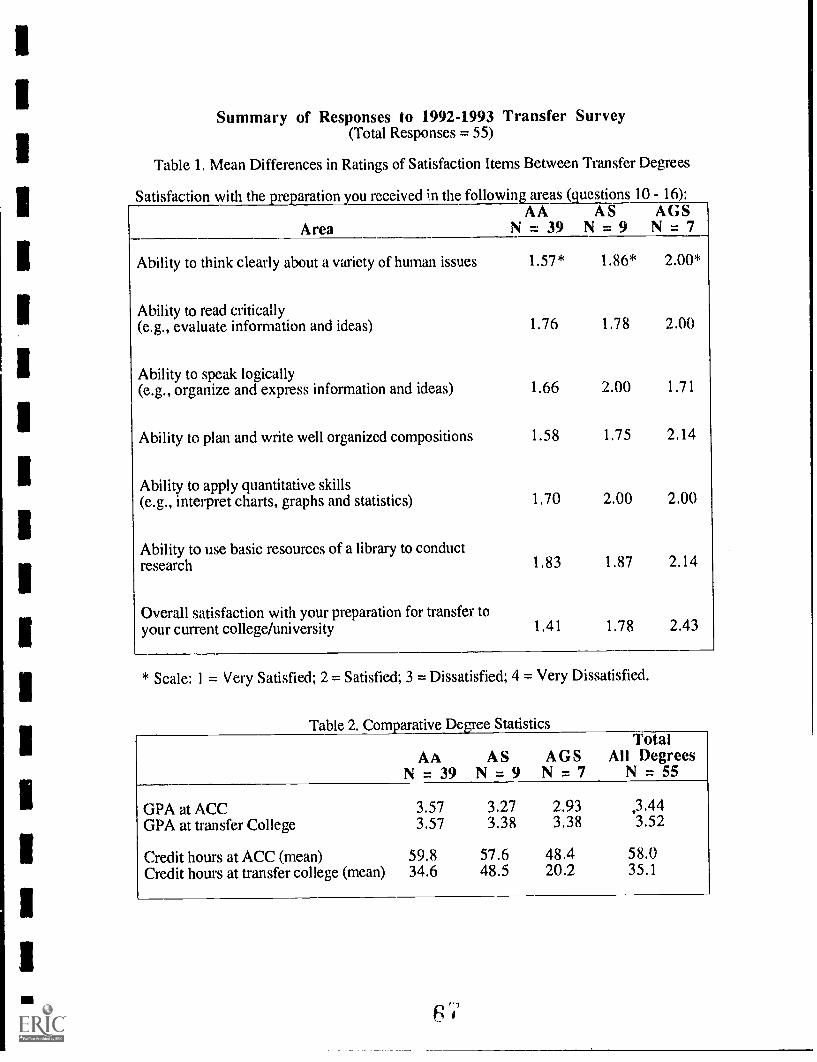
Summary of Responses to 1992-1993 Transfer Survey(Total Responses = 55)
Table 1, Mean Differences in Ratings of Satisfaction Items Between Transfer Degrees
Satisfaction with the re aration ou received in the following areas (questions 10 - 16):
AreaAA
N = 39AS
N = 9AGSN = 7
Ability to think clearly about a variety of human issues 1.57* 1.86* 2.00*
Ability to read critically(e.g., evaluate information and ideas) 1.76 1.78 2.00
Ability to speak logically(e.g., organize and express information and ideas) 1.66 2.00 1.71
Ability to plan and write well organized compositions 1.58 1.75 2.14
Ability to apply quantitative skills(e.g., interpret charts, graphs and statistics) 1.70 2.00 2.00
Ability to use basic resources of a library to conductresearch 1.83 1.87 2.14
Overall satisfaction with your preparation for transfer toyour current college/university 1.41 1.78 2.43
* Scale: 1 = Very Satisfied; 2 = Satisfied; 3 = Dissatisfied; 4 = Very Dissatisfied.
Table 2. Corn arative Degree StatisticsTotal
AA AS AGS All DegreesN = 39 N = 9 N = 7 N = 55
GPA at ACC 3.57 3.27 2.93 3.44GPA at transfer College 3.57 3.38 3.38 3.52
Credit hours at ACC (mean) 59.8 57.6 48.4 58.0Credit hours at transfer college (mean) 34.6 48.5 20.2 35.1
6

Table 7 Q i,estion 16: Ow.trall Sat.,sfaction of Students
RatingArea 1 2 3 4 N A Mean
Ability to think clearly about avariety of human issues 36% 51% 2% 2% 9% 1.67
Ability to read critically (e.g.,evaluate information and iieas) 27 67 4 2 1.76
Ability to speak logically(e.g., organize and expressinformation and ideas) 34 58 4 2 2 1.72
Ability to plan and write wellorganized compositions 36 54 6 4 1.70
Ability to apply quantitative skills(e.g., interpret charts, graphsand statistics) 26 54 7 13 1.80
Ability to use basic resources ofa library to conduct research 27 51 13 2 7 1.90
Overall satisfaction with yourpreparation for transfer to yourcurrent college/university 49 45 2 4 1.41
Scale: 1 = Very Satisfied; 2 = Satisfied; 3 = Dissatisfied; 4 = Very Dissatisfied.
Summary of Responses to Other Survey Closed Questions of Interest
8. Future plans in terms of an advanced degree:MBA 28%MA/MS 36%Ph.D. 11%Law 14%Other 11%
9. Would you recommend ACC to a friend?Yes 98%No 2%
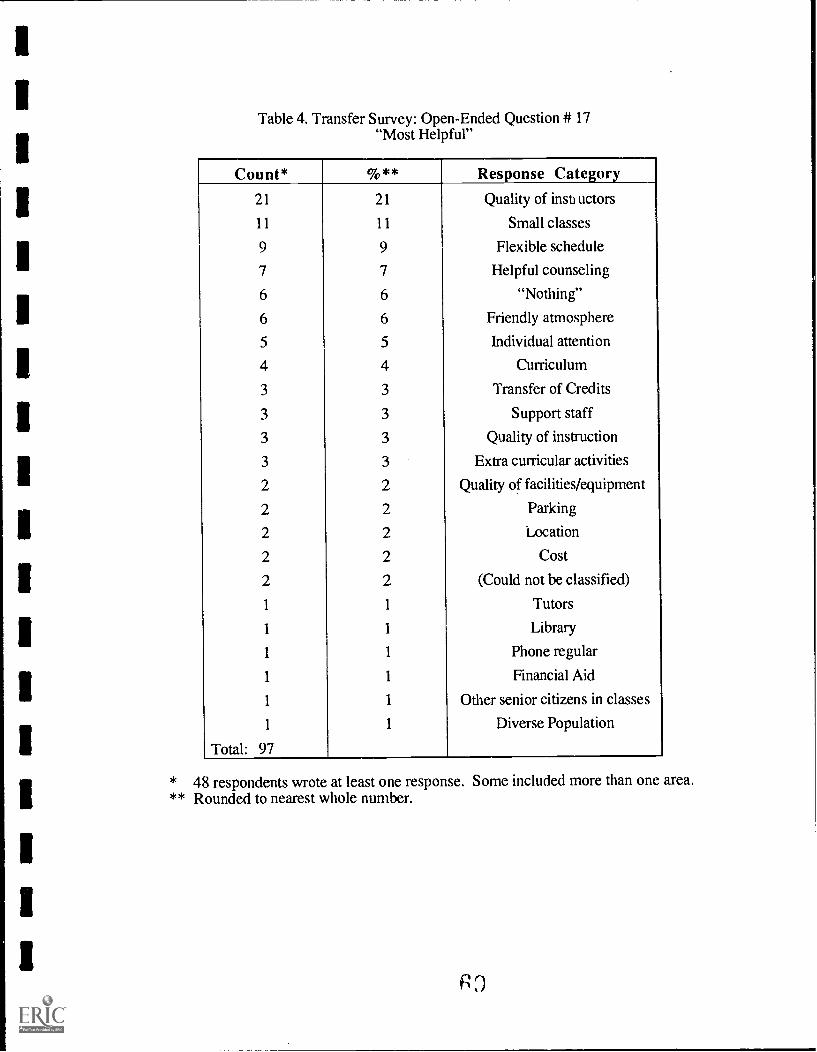
1
1
Table 4. Transfer Survey: Open-Ended Question # 17"Most Helpful"
Count* %** Response Category21 21 Quality of insti uctors
11 11 Small classes
9 9 Flexible schedule
7 7 Helpful counseling
6 6 "Nothing"
6 6 Friendly atmosphere
5 5 Individual attention
4 4 Curriculum
3 3 Transfer of Credits
3 3 Support staff
3 3 Quality of instruction
3 3 Extra curricular activities
2 2 Quality of facilities/equipment
2 2 Parking
2 2 Location
2 2 Cost
2 2 (Could not be classified)
1 1 Tutors
1 1 Library
1 1 Phone regular
1 1 Financial Aid
1 1 Other senior citizens in classes
1 1 Diverse Population
Total: 97
* 48 respondents wrote at least one response. Some included more than one area.** Rounded to nearest whole number.
R;)

Table 5. Transfer Survey: Open-Ended Question #18"Least Helpful"
Count % Response Category
13 27 (No comment)
12 25 CounEffiors
2 4 Some curriculum too easy
2 4 Homosexual activists
2 3 Quality of instructors
1 2 Transfer of credits into ACC
1 2 Student club communications1 2 Speech degree requirements
1 2 Scheduling conflict & class cancellation special topics
1 2 Poor ventilation
1 2 Overcrowding
1 2 Multiculturalism
1 2 Lack of evening business hours
1 2 Lack of enough variety of teaching strategies
1 2 Lack of adequate parking
1 2 Instructional support during break (computer centers)
1 2 Inadequate number of weekend classes
1 2 Inadequate library research in Accounting & Finance
1 2 Humanities curriculum
1 2 Frequency and availability of career testing
1 2 Communicating changes in degree requirements
1 2 (Could not be classified)
Total: 48
1
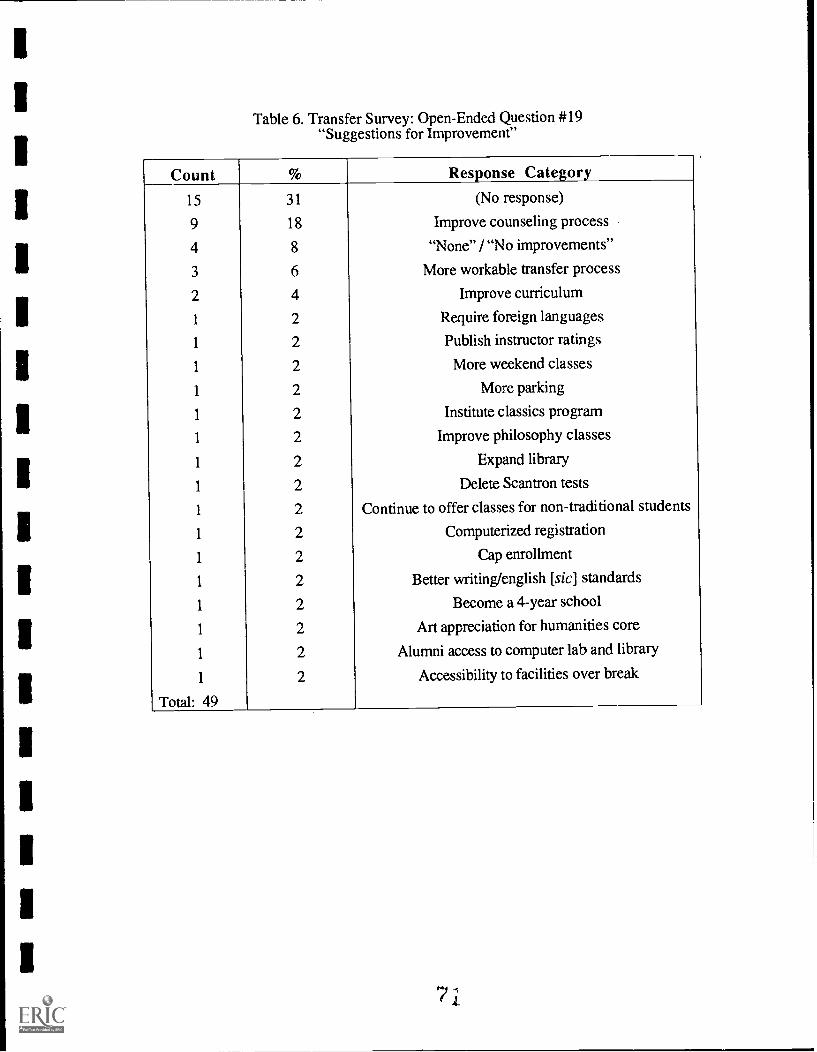
1
1
Table 6. Transfer Survey: Open-Ended Question #19"Suggestions for Improvement"
Count % Response Category
15 31 (No response)
9 18 Improve counseling process
4 8 "None" / "No improvements"
3 6 More workable transfer process
2 4 Improve curriculum
1 2 Require foreign languages
1 2 Publish instructor ratings
1 2 More weekend classes
1 2 More parking
1 2 Institute classics program
1 2 Improve philosophy classes
1 2 Expand library
1 2 Delete Scantron tests
1 2 Continue to offer classes for non-traditional students
1 2 Computerized registration
1 2 Cap enrollment
1 2 Better writing/english [sic] standards
1 2 Become a 4-year school
1 2 Art appreciation for humanities core
1 2 Alumni access to computer lab and library
1 2 Accessibility to facilities over break
Total: 49
7
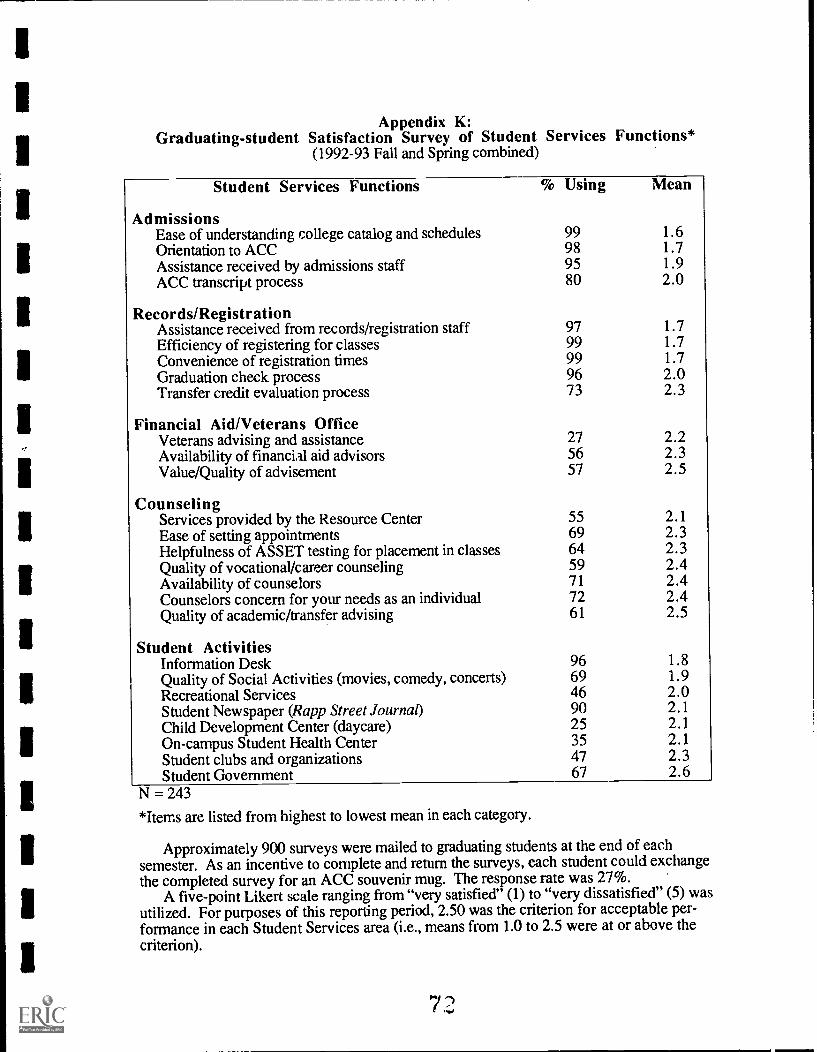
Appendix K:Graduating-student Satisfaction Survey of Student Services Functions*
(1992-93 Fall and Spring combined)
Student Services Functions
Admissions
% Using Mean
Ease of understanding college catalog and schedules 99 1.6Orientation to ACC 98 1.7Assistance received by admissions staff 95 1.9ACC transcript process 80 2.0
Records/RegistrationAssistance received from records/registration staff 97 1.7Efficiency of registering for classes 99 1.7Convenience of registration times 99 1.7Graduation check process 96 2.0Transfer credit evaluation process 73 2.3
Financial Aid/Veterans OfficeVeterans advising and assistance 27 2.2Availability of financial aid advisors 56 2.3Value/Quality of advisement 57 2.5
CounselingServices provided by the Resource Center 55 2.1Ease of setting appointments 69 2.3Helpfulness of ASSET testing for placement in classes 64 2.3Quality of vocational/career counseling 59 2.4Availability of counselors 71 2.4Counselors concern for your needs as an individual 72 2.4Quality of academic/transfer advising 61 2.5
Student ActivitiesInformation Desk 96 1.8Quality of Social Activities (movies, comedy, concerts) 69 1.9Recreational Services 46 2.0Student Newspaper (Rapp Street Journal) 90 2.1Child Development Center (daycare) 25 2.1On-campus Student Health Center 35 2.1Student clubs and organizations 47 2.3Student Government 67 2.6
N = 243
*Items are listed from highest to lowest mean in each category.
Approximately 900 surveys were mailed to graduating students at the end of eachsemester. As an incentive to complete and return the surveys, each student could exchangethe completed survey for an ACC souvenir mug. The response rate was 27%.
A five-point Likert scale ranging from "very satisfied" (1) to "very dissatisfied" (5) wasutilized. For purposes of this reporting period, 2.50 was the criterion for acceptable per-formance in each Student Services area (i.e., means from 1.0 to 2.5 were at orabove thecriterion).
7 '1

Appendix L: Adult Education
Table 1. 1992-93 Adult Education Student Satisfaction Survey
Subject Area Term* Surveyed% Very
Satisfied Satisfied
Satisfiedor Very
Satisfied
Arts & Crafts U 13 23.1 76.9 100F 17 58.5 41.2 100W 37 43.2 54.1 97.3S 23 34.8 65.2 100
Business U 36 61.8 35.3 97.1F 17 58.8 41.2 100
W 25 48 32 80S 29 34.5 55.2 89.7
Computers U 21 66.7 28.6 95.3F 22 22.7 72.7 95.4W 17 47.1 41.2 88.3S 10 10 80 90
Do It Yourself U No data receivedF 12 33.3 58.3 91.6W 4 75 25 100S 11 63.6 36.4 100
Health U 15 73.3 20 93.3F 35 74.3 25.7 100
W 19 47.4 41.6 89S 16 28.8 33.3 100
Home & Family U 15 26.7 66.7 93.4F 13 69.2 23.1 92.3W 16 28.8 56.3 85.1S No data received
Language U 34 61.8 35.3 97.1F 14 35.9 42.9 78.8W 17 29.4 41.2 70.6S 10 30 70 100
Music U 3 100 100F 3 66.7 33.3 100
W 6 83.3 16.7 100S No data received
Prof. Dev. U 9 33.3 66.7 100F 3 33.3 66.7 100
W No data receivedS No data received
SGL 3 100 100(cont'd)
73

(con('d)Self Dev. U
FWS
No data receivedNo data receivedNo data receivedNo data received
KKT U 4 50 25 75F No data receivedW No data receivedS No data received
Emeritus U 13 38.5 46.2 84.7F 9 44.4 55.6 100W 6 83.3 16.7 100S No data received
Leisure U 11 63.6 27.3 90.9F 10 50 40 90W 14 43.9 34.1 78S 27 70.4 25.9 96.3
DCAE U No data receivedF 44 63.6 31.8 95.4
W 40 55 32.5 87.5S 47 38.3 53.2 91.5
N = 767 93.39%
* U = SummerF = FallW = WinterS = Spring
Appendix M: Business and Industry
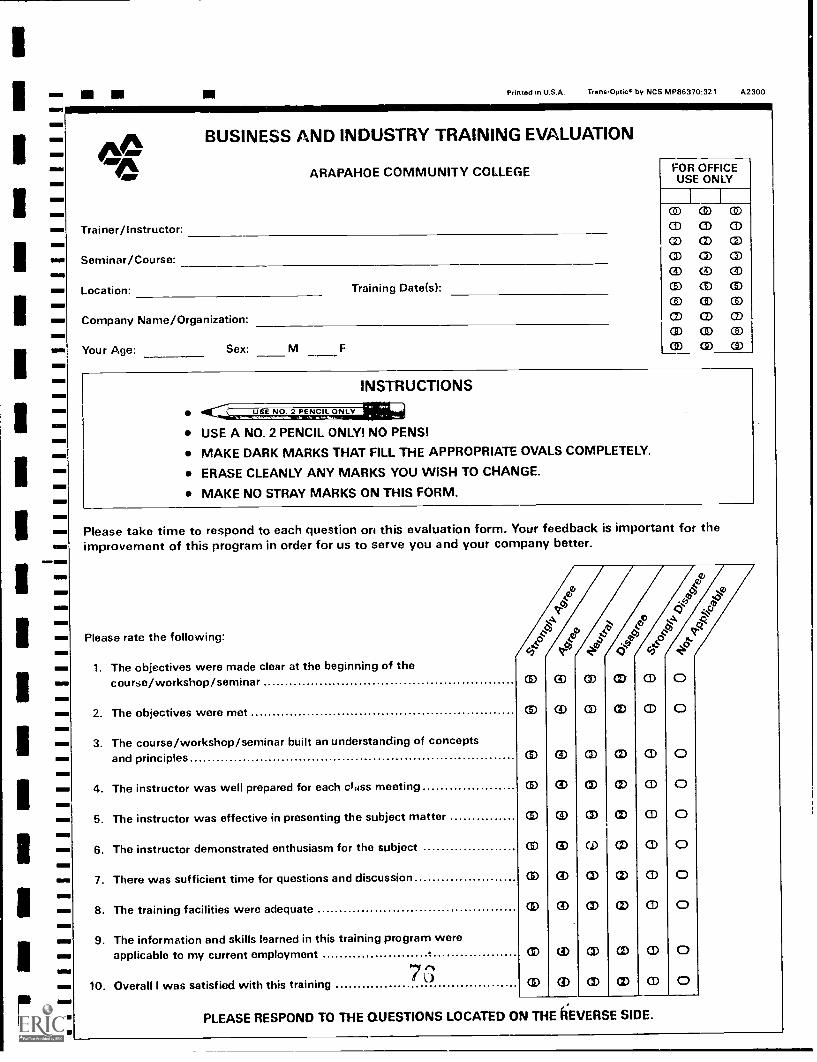
1
Printed in U.S.A. Trans-Optic* by NCS MP86370:321 A2300
BUSINESS AND INDUSTRY TRAINING EVALUATION
ARAPAHOE COMMUNITY COLLEGE FOR OFFICEUSE ONLY
I
(10 CD CD
Trainer/Instructor: CD CD 0a) a) CD
Seminar/Course: aD cp CD
CD CD CD
Location: Training Oate(s): CD CD a)CD CD CID
Company Name/Organization: CD CD CD
CD CD CD
Your Age: Sex: CID CD CD
INSTRUCTIONS
USE A NO. 2 PENCIL ONLY! NO PENS!
MAKE DARK MARKS THAT FILL THE APPROPRIATE OVALS COMPLETELY.
ERASE CLEANLY ANY MARKS YOU WISH TO CHANGE.
MAKE NO STRAY MARKS ON THIS FORM.
Please take time to respond to each question on this evaluation form. Your feedback is important for theimprovement of this program in order for us to serve you and your company better.
Please rate the following:
1. The objectives were made clear at the beginning of thecourse/workshop/seminar CD
44
(3)
4r, 0-
GD.
4.
a)
ez>c,
0
2. The objectives were met CD CD CD CD 0
3. The course/workshop/seminar built an understanding of conceptsand principles CD CD CD 0 0
4. The instructor was well prepared for each class meeting CD CD ID CD
5. The instructor was effective in presenting the subject matter CID CD CD ID CD 0
6. The instructor demonstrated enthusiasm for the subject CD CD CD CD 0
7. There was sufficient time for questions and discussion CD CD ID 0
8. The training facilities were adequate CD CD CD 0 0
9. The information and skills learned in this training program wereapplicable to my current employment CD CD CD CD CD 0
7310. Overall I was satisfied with this training CD (3) CD CD 0
PLEASE RESPOND TO THE QUESTIONS LOCATED ON THE iiEVERSE SIDE.

11. Which specific information/skills do you think will help you in theperformance of your job? How and why?
12. How would this training have been more responsive to yourneeds?
Thank you for completing this form.
Wayne Henry, DeanCommunity ServicesArapahoe Community Co lledt0t-i797-5712 /
3
3
1
1

Table 1. Summary of Responses to Question 10:"Overall I was satisfied with this training."
Course Title StronglyA gree
Agree Neutral Disagree StronglyDisagree
Intro to C Programming
Total Quality ManagementImplementation Training
Total Quality ManagementImplementation Training
English Composition 1
Beginning Spanish
Probabilistic Thinking withEmphasis on Quality Control
Surface Mout Technology
Intro. to WordPerfect 5.1
Getting Started with Windows
Getting Started with Windows
Desktop Publishing withWordPerfect 5.1
Basic Workplace Skills
Coach the Coach / Train theTrainer
D Base HI+
Career Development
Time Management
Intro to Lotus 1-2-3
Intermediate WordPerfect
C++ Programming
3
10
16
6
2
2
1
1
2
3
8
29
5
3
8
1
1
1
3
1
2
2
4
5
13
2
2
3
1
16
5
9
1
1
3
1
1
2
1
1
Totals 106(54%)
83(43%)
5(3%)
1
(.5%)0
(0%)

FOLLOW-UP EVALUATION OFCUSTOMIZED, ON-SITE TRAINING
Company:Course:Evaluator's name: Date:
This follow-up evaluation is designed to provide feedback to ACCconcerning the quality and practical application of the customizedtraining provided for your organization. Your feedback will beused to strengthen the effectiveness of our customized training asit pertains to the implementation of the training concepts on thejob. Your cooperation is appreciated!
1. Did you give input concerning content of the training as itpertained to organization/employee need?
Yes No
2. Did your employees give input concerning their needs?Yes No
3. Did the training content include practical application ofconcepts into the job?
To a greatextent
To someextent
To a small Not at allextent
4. Have you observed the use of the training concepts in the workplace?
To a greatextent
To someextent
To a small Not at allextent
5. Have you experienced resistance to the implementation of thetraining concepts in the workplace?
To a great To someextent extent
To a small Not at allextent
Describe:
6. Have you observed improvements in performance, productivity orprocesses which are attributable to you or your personnel asa result of this course?
To a great To some To a smallextent extent extent
Not at all
7. Do you believe a refresher or follow-up course would beappropriate?
Yes No If yes, at what time interval(monthly,annually,Ptc.)
Other Remarks

Appendix N: Graduating Students' Satisfaction
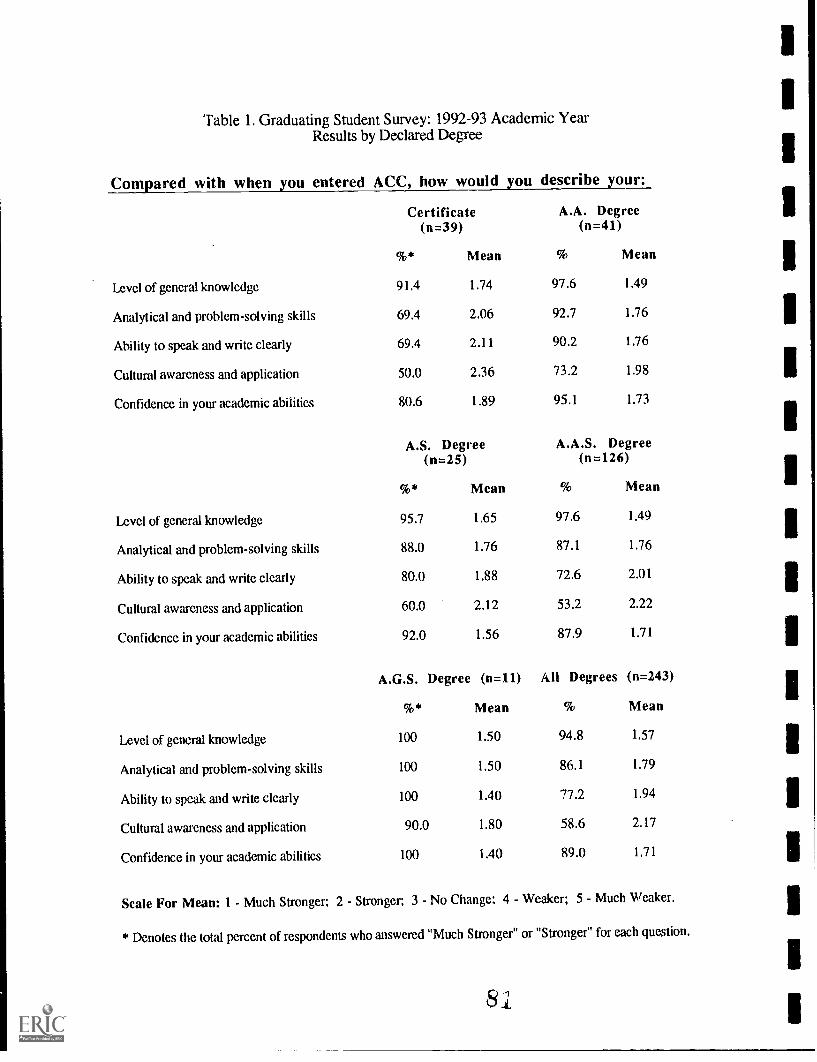
Table 1. Graduating Student Survey: 1992-93 Academic YearResults by Declared Degree
Compared with when you entered ACC, how would you describe your:
Certificate(n=39)
%* Mean
A.A. Degree(n=41)
% Mean
Level of general knowledge 91.4 1.74 97.6 1.49
Analytical and problem-solving skills 69.4 2.06 92.7 1.76
Ability to speak and write clearly 69.4 2.11 90.2 1.76
Cultural awareness and application 50.0 2.36 73.2 1.98
Confidence in your academic abilities 80.6 1.89 95.1 1.73
A.S. Degree(n=25)
A.A.S. Degree(n=126)
%* Mean % Mean
Level of general knowledge 95.7 1.65 97.6 1.49
Analytical and problem-solving skills 88.0 1.76 87.1 1.76
Ability to speak and write clearly 80.0 1.88 72.6 2.01
Cultural awareness and application 60.0 2.12 53.2 2.22
Confidence in your academic abilities 92.0 1.56 87.9 1.71
A.G.S. Degree (n=11) All Degrees (n=243)
%* Mean % Mean
Level of general knowledge 100 1.50 94.8 1.57
Analytical and problem-solving skills 100 1.50 86.1 1.79
Ability to speak and write clearly 100 1.40 77.2 1.94
Cultural awareness and application 90.0 1.80 58.6 2.17
Confidence in your academic abilities 100 1.40 89.0 1.71
Scale For Mean: 1 - Much Stronger; 2 - Stronger; 3 - No Change; 4 - Weaker; 5 - Much Weaker.
* Denotes the total percent of respondents who answered "Much Stronger" or "Stronger" for each question.
81

Table 2. Graduating Student Survey: 1992-93 Academic YearResults by Declared Degree
Certificate (n=39)%* Mean
A.A. Degree (n=41)Mean
Value of information provided by facultyadvisors 76.3 1.95 86.1 1.75
Overall quality of instruction in your majorarea of study 81.8 1.72 94.9 1.51
Attitude of instructors towards students 84.6 1.69 95.1 1.51
Challenge offered by my program 89.4 1.76 95.0 1.55
Variety of courses offered in your major area 81.6 1.87 78.0 1.85
Instructional Computing Center 95.4 1.37 60.9 2.35
A.S. Degree A.A.S. Degree(n=25)
%* Mean(n=126)
Mean
Value of information provided by facultyadvisors 91.3 1.57 87.8 1.83
Overall quality of instruction in your majorarea of study 99.1 1.52 88.7 1.71
Attitude of instructors towards students 84.0 1.72 92.7 1.57
Challenge offered by my program 92.0 1.56 90.3 1.61
Variety of courses offered in your major area 88.0 1.68 91.2 1.68
Instructional Computing Center 85.0 1.68 79.2 1.86
A.G.S. Degree (n=11) All Degrees (n=243)%* Mean % Mean
Value of information provided by facultyadvisors
77.8 1.89 85.6 1.81
Overall quality of instruction in your majorarea of study 81.8 1.91 89.5 1.67
Attitude of instructors towards students 81.8 1.82 90.0 1.61
Challenge offered by my program 81.8 2.00 90.8 1.64
Variety of courses offered in your major area 72.7 2.27 86.3 1.77
Instructional Computing Center 57.1 2.43 78.5 1.89
Scale For Mean: 1 - Very Satisfied; 2 - Satisfied; 3 - Neutral; 4 Dissatisfied; 5- Very Dissatisfied.
* Denotes the total percent of respondents who reported being "Very Satisfied" or "Satisfied."