jbs s.a. condensed financial statements and the report on
TRANSCRIPT

JBS S.A.Condensed financial statements and the report on review ofthe interim financial informationAs of June 30, 2021 and 2020

Index Page
Independent auditor's review report 3
Statement of financial position - Assets 5
Statement of financial position - Liabilities and Equity 6
Statements of income for the six month period ended June 30, 2021 and 2020 7
Statements of income for the three month period ended June 30, 2021 and 2020 8
Statement of comprehensive income the six month period ended June 30, 2021 and 2020 9
Statement of comprehensive income for three month period ended June 30, 2021 and 2020 10
Statements of changes in equity for the six month period ended June 30, 2021 and 2020 11
Statements of cash flows for the six month period ended June 30, 2021 and 2020 12
Economic value added for the six month period ended June 30, 2021 and 2020 14
Note 1 - Operating activities 15
Note 2 - Plea bargain agreement, Leniency agreement and the impacts in the financial statements 16
Note 3 - Basis of preparation and presentation of financial statements 16
Note 4 - Business combination 17
Note 5 - Cash and cash equivalents 17
Note 6 - Trade accounts receivable 18
Note 7 - Inventories 18
Note 8 - Biological assets 18
Note 9 - Recoverable taxes 19
Note 10 - Related party transactions 19
Note 11 - Income taxes 21
Note 12 - Investments in subsidiaries, associate and joint venture 24
Note 13 - Property, plant and equipment 24
Note 14 - Leases 25
Note 15 - Intangible assets 26
Note 16 - Goodwill 27
Note 17 - Trade accounts payable 27
Note 18 - Loans and financing 28
Note 19 - Accrued income taxes and other taxes 29
Note 20 - Accrued payroll and social charges 29
Note 21 - Provisions 30
Note 22 - Equity 31
Note 23 - Net revenue 32
Note 24 - Financial income (expense), net 32
Note 25 - Earnings per share 32
Note 26 - Operating segments and geographic reporting 33
Note 27 - Expenses by nature 35
Note 28 - Risk management and financial instruments 35
Note 29 - Approval of the financial statements 44

© 2021 Grant Thornton Auditores Independentes. All rights reserved │ JBS
Grant Thornton Auditores Independentes
Av. Eng. Luis Carlos Berrini, 105 - 12o andar Itaim Bibi, São Paulo (SP) Brasil
T +55 11 3886-5100
(Free translation from the original issued in Portuguese. In the event of any discrepancies, the Portuguese language version shall prevail.)
To the Shareholders, Board of Directors and Management of JBS S.A. São Paulo – SP
Introduction We have reviewed the individual and consolidated interim financial information of JBS S.A. (“Company”), identified as Company and Consolidated, respectively, included in the Interim Financial Information Form (ITR) for the quarter ended June 30, 2021, which comprises the balance sheet as of June 30, 2021 and the related income statement and statement of comprehensive income for the three- and six-month periods then ended, and the statement of changes in equity and statement of cash flows for the six-month period then ended, including the explanatory notes.
Management is responsible for the preparation of the individual and consolidated interim financial information in accordance with Technical Pronouncement NBC TG 21 - Interim Financial Reporting and IAS 34 - Interim Financial Reporting, issued by the International Accounting Standards Board (Iasb), as well as for the presentation of such information in accordance with the standards issued by the Brazilian Securities and Exchange Commission (CVM) applicable to the preparation of Interim Financial Information (ITR). Our responsibility is to express a conclusion on this interim financial information based on our review.
Scope of review We conducted our review in accordance with Brazilian and international standards on review of interim financial information (NBC TR 2410 and ISRE 2410 - Review of Interim Financial Information Performed by the Independent Auditor of the Entity, respectively). A review of interim financial information consists of making inquiries, primarily of persons responsible for financial and accounting matters, and applying analytical and other review procedures. A review is substantially less in scope than an audit conducted in accordance with the standards on auditing and consequently does not enable us to obtain assurance that we would become aware of all significant matters that might be identified in an audit. Accordingly, we do not express an audit opinion.
3

© 2021 Grant Thornton Auditores Independentes. All rights reserved │ JBS
Conclusion on the individual and consolidated interim financial information Based on our review, nothing has come to our attention that causes us to believe that the accompanying individual and consolidated interim financial information included in the interim financial statements referred to above is not prepared, in all material respects, in accordance with NBC TG 21 and IAS 34 applicable to the preparation of the Interim Financial Statements (ITR) and presented in accordance with the standards issued by the Brazilian Securities and Exchange Commission (CVM).
Other matters Statements of value added
The interim financial information referred to above includes the individual and consolidated statements of value added (“DVA”) for the six-month period ended June 30, 2021, prepared under the responsibility of the Company’s Management and presented as additional information for IAS 34 purposes. These statements were subject to review procedures performed together with the review of the interim financial information in order to conclude whether they are reconciled to the interim financial information and accounting records, as applicable, and whether their form and substance are in accordance with the criteria defined in the Technical Pronouncement NBC TG 09 – Statement of Value Added. Based on our review, nothing has come to our attention that causes us to believe that such statement of value added were not prepared, in all material respects, according to the criteria defined in that standard and consistently in relation to the individual and consolidated interim financial information taken as a whole.
São Paulo, August 11, 2021
Alcides Afonso Louro Neto Partner
Grant Thornton Auditores Independentes
4

JBS S.A.
Statements of financial positionIn thousands of Brazilian Reais - R$
Company Consolidated
Note June 30, 2021 December 31, 2020 June 30, 2021 December 31, 2020
ASSETS
CURRENT ASSETS
Cash and cash equivalents 5 5,249,492 3,351,911 16,840,600 19,679,743
Margin cash 5 48,984 — 1,281,133 —
Trade accounts receivable 6 2,774,960 2,871,612 16,414,935 14,001,211
Inventories 7 5,079,378 2,959,086 22,402,897 17,586,744
Biological assets 8 — — 6,436,192 5,115,720
Recoverable taxes 9 1,101,585 1,059,635 2,857,507 2,849,898
Derivative assets 10,100 51 505,487 228,840
Other current assets 227,816 135,042 1,417,624 1,075,143
TOTAL CURRENT ASSETS 14,492,315 10,377,337 68,156,375 60,537,299
NON-CURRENT ASSETS
Recoverable taxes 9 4,897,257 5,843,965 7,746,291 8,546,495
Biological assets 8 — — 1,854,795 1,778,565
Related party receivables 10 3,527,880 1,872,127 366,131 382,019
Deferred income taxes 11 — — 1,641,979 1,590,194
Derivative assets 83,810 41,769 97,368 41,769
Other non-current assets 622,050 596,942 1,107,621 1,094,113
9,130,997 8,354,803 12,814,185 13,433,155
Investments in subsidiaries, associate and joint venture 12 44,167,770 37,658,807 200,803 171,096
Property, plant and equipment 13 11,854,011 11,576,487 47,785,418 47,106,444
Right of use assets 14 58,247 68,786 5,678,907 5,784,709
Intangible assets 15 42,080 49,982 7,273,435 7,702,309
Goodwill 16 9,085,970 9,085,970 30,374,143 29,066,794
TOTAL NON-CURRENT ASSETS 74,339,075 66,794,835 104,126,891 103,264,507
TOTAL ASSETS 88,831,390 77,172,172 172,283,266 163,801,806
The accompanying notes are an integral part of these condensed financial statements.
5

JBS S.A.
Statements of financial positionIn thousands of Brazilian Reais - R$
Company Consolidated
Note June 30, 2021 December 31, 2020 June 30, 2021 December 31, 2020
LIABILITIES AND EQUITY
CURRENT LIABILITIES
Trade accounts payable 17 3,731,182 4,037,346 22,073,394 22,197,441
Supply chain finance 17 487,878 473,525 3,461,127 2,101,001
Loans and financing 18 4,897,076 1,700,815 7,449,059 4,562,101
Income taxes 19 — — 226,076 206,433
Accrued income taxes and other taxes 19 340,555 312,888 709,667 676,620
Accrued payroll and social charges 20 892,978 893,008 5,470,708 5,677,401
Lease liabilities 14 23,682 22,452 1,327,110 1,293,073
Dividends payable 106 1,092,174 154 1,093,230
Other financial liabilities 11,839 21,193 37,420 45,622
Provisions 21 — — 2,043,399 —
Derivative liabilities 242,992 21,087 1,181,995 287,536
Other current liabilities 1,085,231 543,462 1,993,100 2,694,773
TOTAL CURRENT LIABILITIES 11,713,519 9,117,950 45,973,209 40,835,231
NON-CURRENT LIABILITIES
Loans and financings 18 6,547,047 3,659,318 63,583,724 61,344,604
Accrued income taxes and other taxes 19 686,506 658,923 866,319 840,175
Accrued payroll and social charges 20 2,562,932 2,852,408 3,516,217 4,115,068
Lease liabilities 14 40,195 50,014 4,707,821 4,811,416
Other financial liabilities 1,650 4,950 65,672 78,668
Deferred income taxes 11 3,125,878 3,105,833 6,384,296 6,186,715
Provisions 21 512,743 522,480 1,368,659 1,413,438
Related party payables 10 21,733,965 17,074,822 — —
Derivative liabilities — — — 9,207
Other non-current liabilities 8,754 6,152 604,734 623,095
TOTAL NON-CURRENT LIABILITIES 35,219,670 27,934,900 81,097,442 79,422,386
EQUITY 22
Share capital - common shares 23,576,206 23,576,206 23,576,206 23,576,206
Capital reserve (413,729) (434,913) (413,729) (434,913)
Other reserves 46,882 49,430 46,882 49,430
Profit reserves 5,350,601 6,862,731 5,350,601 6,862,731
Accumulated other comprehensive income 9,418,648 10,065,868 9,418,648 10,065,868
Retained earnings 3,919,593 — 3,919,593 —
Attributable to company shareholders 41,898,201 40,119,322 41,898,201 40,119,322
Attributable to non-controlling interest — — 3,314,414 3,424,867
TOTAL EQUITY 41,898,201 40,119,322 45,212,615 43,544,189
TOTAL LIABILITIES AND EQUITY 88,831,390 77,172,172 172,283,266 163,801,806
The accompanying notes are an integral part of these condensed financial statements.
6

JBS S.A.
Statements of income for the six month period ended June 30, 2021 and 2020 In thousands of Brazilian Reais - R$
Company ConsolidatedNote 2021 2020 2021 2020
NET REVENUE 23 23,182,298 16,387,658 160,878,145 124,063,710
Cost of sales 27 (20,501,248) (13,070,494) (133,285,400) (102,261,401)
GROSS PROFIT 2,681,050 3,317,164 27,592,745 21,802,309
General and administrative expense 27 (1,190,566) (1,142,741) (7,246,848) (4,386,407)
Selling expense 27 (1,158,718) (1,066,536) (8,559,333) (6,732,979)
Other expense (4,539) (2,825) (70,271) (101,075)
Other income 48,291 6,822 293,339 146,037
OPERATING EXPENSES (2,305,532) (2,205,280) (15,583,113) (11,074,424)
OPERATING PROFIT 375,518 1,111,884 12,009,632 10,727,885
Finance income 24 623,852 180,270 1,162,281 477,638
Finance expense 24 (1,171,384) (5,559,211) (3,480,965) (12,794,542)
(547,532) (5,378,941) (2,318,684) (12,316,904)
Share of profit of equity-accounted investees, net of tax 12 7,810,450 340,436 38,880 18,034
PROFIT (LOSS) BEFORE TAXES 11 7,638,436 (3,926,621) 9,729,828 (1,570,985)
Current income taxes 11 (1,190,408) — (3,150,607) (1,638,178)
Deferred income taxes 11 (20,045) 1,372,842 (215,487) 668,696
(1,210,453) 1,372,842 (3,366,094) (969,482)
NET INCOME (LOSS) 6,427,983 (2,553,779) 6,363,734 (2,540,467)
ATTRIBUTABLE TO:
Company shareholders 6,427,983 (2,553,779)
Non-controlling interest (64,249) 13,312
6,363,734 (2,540,467)
Basic earnings per share - common shares (R$) 25 2.59 (0.96) 2.59 (0.96)
The accompanying notes are an integral part of these condensed financial statements.
7

JBS S.A.
Statements of income for the three month period ended June 30, 2021 and 2020 In thousands of Brazilian Reais - R$
Company ConsolidatedNote 2021 2020 2021 2020
NET REVENUE 23 12,213,092 8,372,837 85,626,927 67,582,330
Cost of sales 27 (10,666,276) (6,333,509) (69,145,961) (53,052,106)
GROSS PROFIT 1,546,816 2,039,328 16,480,966 14,530,224
General and administrative expense 27 (630,204) (621,580) (4,747,269) (2,523,243)
Selling expense 27 (612,478) (523,895) (4,478,740) (3,547,752)
Other expense (1,670) (1,738) (29,738) (49,788)
Other income 4,197 5,577 156,151 30,360
OPERATING EXPENSES (1,240,155) (1,141,636) (9,099,596) (6,090,423)
OPERATING PROFIT 306,661 897,692 7,381,370 8,439,801
Finance income 24 287,668 70,067 828,909 100,639
Finance expense 24 (642,229) (1,409,302) (1,974,857) (3,330,160)
(354,561) (1,339,235) (1,145,948) (3,229,521)
Share of profit of equity-accounted investees, net of tax 5,074,591 3,707,260 12,169 4,929
PROFIT BEFORE TAXES 11 5,026,691 3,265,717 6,247,591 5,215,209
Current income taxes 11 (664,131) — (1,990,904) (1,595,894)
Deferred income taxes 11 19,902 113,519 (48,532) (272,691)
(644,229) 113,519 (2,039,436) (1,868,585)
NET INCOME 4,382,462 3,379,236 4,208,155 3,346,624
ATTRIBUTABLE TO:
Company shareholders 4,382,462 3,379,236
Non-controlling interest (174,307) (32,612)
4,208,155 3,346,624
Basic earnings per share - common shares (R$) 25 1.75 1.27 1.75 1.27
The accompanying notes are an integral part of these condensed financial statements.
8

JBS S.A.
Statements of comprehensive income for the six month period ended June 30, 2021 and 2020 In thousands of Brazilian Reais - R$
Company Consolidated
Reference 2021 2020 2021 2020
Net income (loss) IS 6,427,983 (2,553,779) 6,363,734 (2,540,467)
Other comprehensive income
Items that may be subsequently reclassified to profit or loss:
Foreign currency translation adjustments SCSE (1,540,943) 9,127,081 (1,613,484) 9,984,806
Exchange rate variation on net investment SCSE 667,650 — 667,650 —
Valuation adjustments to equity in subsidiaries SCSE 226,073 (63,373) 259,397 (98,310)
Total other comprehensive income (loss) (647,220) 9,063,708 (686,437) 9,886,496
Comprehensive income 5,780,763 6,509,929 5,677,297 7,346,029
Total comprehensive income attributable to:
Company shareholders SCSE 5,780,763 6,509,929 5,780,763 6,509,929
Non-controlling interest SCSE — — (103,466) 836,100
5,780,763 6,509,929 5,677,297 7,346,029
The accompanying notes are an integral part of these condensed financial statements.
9

JBS S.A.
Statement of comprehensive income for the three month period ended June 30, 2021 and 2020 In thousands of Brazilian Reais - R$
Company Consolidated
Reference 2021 2020 2021 2020
Net income IS 4,382,462 3,379,236 4,208,155 3,346,624
Other comprehensive income
Items that may be subsequently reclassified to profit or loss:
Foreign currency translation adjustments (4,232,346) 2,683,100 (4,661,869) 2,862,618
Exchange rate variation on net investment 2,320,886 — 2,320,886 —
Valuation adjustments to equity in subsidiaries 108,678 (57,129) 113,247 (88,291)
Total other comprehensive income (loss) (1,802,782) 2,625,971 (2,227,736) 2,774,327
Comprehensive income 2,579,680 6,005,207 1,980,419 6,120,951
Total comprehensive income attributable to:
Company shareholders 2,579,680 6,005,207 2,579,680 6,005,207
Non-controlling interest — — (599,261) 115,744
2,579,680 6,005,207 1,980,419 6,120,951
The accompanying notes are an integral part of these condensed financial statements.
10

JBS S.A.Statements of changes in equity for the six month period ended June 30, 2021 and 2020 In thousands of Brazilian Reais - R$
Capital reserves Profit reservesOther comprehensive
income
NoteShare capital
Premium on issue of shares
Capital transaction (1)
Stock options
Other reserves
Treasury shares Legal
Investments statutory
Declared dividends VAE ATA
Retained earnings Total
Non-controlling interest Total equity
DECEMBER 31, 2019 23,576,206 211,879 (490,533) 44,947 54,374 (605,722) 774,049 4,446,449 — 7,188 1,618,129 — 29,636,966 2,845,083 32,482,049
Net income (loss) — — — — — — — — — — — (2,553,779) (2,553,779) 13,312 (2,540,467)
Valuation adjustments to equity in subsidiaries (2) — — — — — — — — — (63,373) — — (63,373) (34,937) (98,310)
Foreign currency translation adjustments (3) 12 — — — — — — — — — — 9,127,081 — 9,127,081 857,725 9,984,806
Total comprehensive income — — — — — — — — — (63,373) 9,127,081 (2,553,779) 6,509,929 836,100 7,346,029
Share-based compensation 22 b2 — — 14,281 (3,180) — — — — — — — — 11,101 3,773 14,874
Treasury shares used in stock option plan 22 b3 — — — (9,339) — 9,471 — (132) — — — — — — —
Realization of other reserves — — — — (2,508) — — — — — — 2,508 — — —
PPC share repurchase — — (146,239) — — — — — — — — — (146,239) (232,446) (378,685)
Others — — — — — — — — — — — — — 1,972 1,972
JUNE 30, 2020 23,576,206 211,879 (622,491) 32,428 51,866 (596,251) 774,049 4,446,317 — (56,185) 10,745,210 (2,551,271) 36,011,757 3,454,482 39,466,239
DECEMBER 31, 2020 23,576,206 211,879 (679,054) 32,262 49,430 (303,565) 1,003,965 4,743,294 1,419,037 (29,269) 10,095,137 — 40,119,322 3,424,867 43,544,189
Net income (loss) — — — — — — — — — — — 6,427,983 6,427,983 (64,249) 6,363,734
Exchange rate variation on net investment (4) — — — — — — — — — — 667,650 — 667,650 — 667,650
Valuation adjustments to equity in subsidiaries (2) — — — — — — — — — 226,073 — — 226,073 33,324 259,397
Foreign currency translation adjustments (3) 12 — — — — — — — — — — (1,540,943) — (1,540,943) (72,541) (1,613,484)
Total comprehensive income — — — — — — — — — 226,073 (873,293) 6,427,983 5,780,763 (103,466) 5,677,297
Purchase of treasury shares 22 b3 — — — — — (3,847,080) — — — — — — (3,847,080) — (3,847,080)
Sale of treasury shares 22 b3 — — — — — 1,260,731 — (19,480) — — — — 1,241,251 — 1,241,251
Cancellation of treasury shares 22 b3 — — — — — 2,879,309 — (2,879,309) — — — — — — —
Share-based compensation 22 b2 — — 22,982 — — — — — — — — — 22,982 5,682 28,664
Treasury shares used in stock option plan 22 b3 — — — (1,798) — 4,523 — (2,725) — — — — — — —
Realization of other reserves — — — — (2,548) — — — — — — 2,548 — — —
Additional dividends distributed — — — — — — — — (1,419,037) — — — (1,419,037) — (1,419,037)
Distribution of interim dividends 22 c2 — — — — — — — — 2,510,938 — — (2,510,938) — — —
Dividends to non-controlling interest — — — — — — — — — — — — — (13,683) (13,683)
Others — — — — — — — — — — — — — 1,014 1,014
JUNE 30, 2021 23,576,206 211,879 (656,072) 30,464 46,882 (6,082) 1,003,965 1,841,780 2,510,938 196,804 9,221,844 3,919,593 41,898,201 3,314,414 45,212,615
(1) Refers to changes in the equity of investees arising from PPC's share repurchase and share-based compensation.(2) Valuation adjustments to equity arising from derivative financial instruments and defined benefit plans in the indirect subsidiary JBS USA.(3) Accumulated translation adjustments and exchange variation in subsidiaries.(4) Refers to the capitalization of exchange variation of intercompany balances between JBS S.A. and JBS Investments II, which will be converted into capital in JBS Investments II. Thus, since the balances are an extension of that entity's investment, they are considered as equity instruments.
The accompanying notes are an integral part of these condensed financial statements.
11
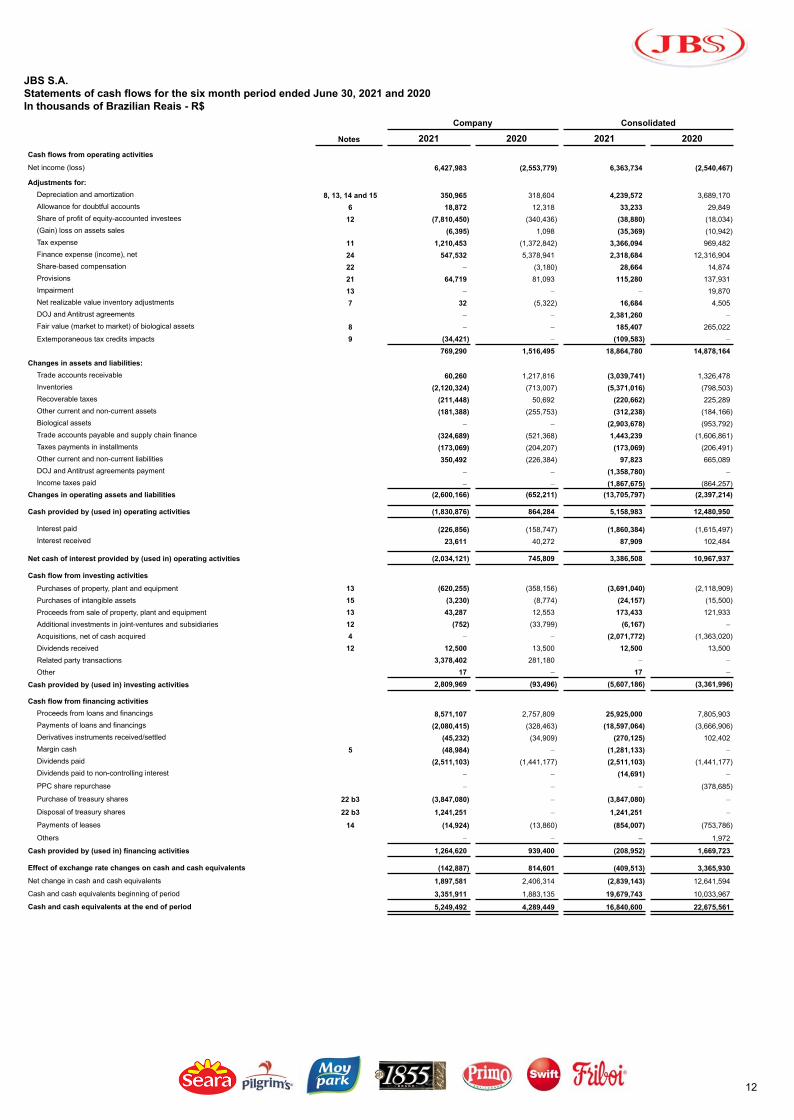
JBS S.A.Statements of cash flows for the six month period ended June 30, 2021 and 2020In thousands of Brazilian Reais - R$
Company Consolidated
Notes 2021 2020 2021 2020Cash flows from operating activities
Net income (loss) 6,427,983 (2,553,779) 6,363,734 (2,540,467)
Adjustments for:Depreciation and amortization 8, 13, 14 and 15 350,965 318,604 4,239,572 3,689,170 Allowance for doubtful accounts 6 18,872 12,318 33,233 29,849 Share of profit of equity-accounted investees 12 (7,810,450) (340,436) (38,880) (18,034) (Gain) loss on assets sales (6,395) 1,098 (35,369) (10,942) Tax expense 11 1,210,453 (1,372,842) 3,366,094 969,482 Finance expense (income), net 24 547,532 5,378,941 2,318,684 12,316,904 Share-based compensation 22 — (3,180) 28,664 14,874 Provisions 21 64,719 81,093 115,280 137,931 Impairment 13 — — — 19,870 Net realizable value inventory adjustments 7 32 (5,322) 16,684 4,505 DOJ and Antitrust agreements — — 2,381,260 —
Fair value (market to market) of biological assets 8 — — 185,407 265,022 Extemporaneous tax credits impacts 9 (34,421) — (109,583) —
769,290 1,516,495 18,864,780 14,878,164 Changes in assets and liabilities:
Trade accounts receivable 60,260 1,217,816 (3,039,741) 1,326,478 Inventories (2,120,324) (713,007) (5,371,016) (798,503) Recoverable taxes (211,448) 50,692 (220,662) 225,289 Other current and non-current assets (181,388) (255,753) (312,238) (184,166) Biological assets — — (2,903,678) (953,792) Trade accounts payable and supply chain finance (324,689) (521,368) 1,443,239 (1,606,861) Taxes payments in installments (173,069) (204,207) (173,069) (206,491) Other current and non-current liabilities 350,492 (226,384) 97,823 665,089 DOJ and Antitrust agreements payment — — (1,358,780) —
Income taxes paid — — (1,867,675) (864,257) Changes in operating assets and liabilities (2,600,166) (652,211) (13,705,797) (2,397,214)
Cash provided by (used in) operating activities (1,830,876) 864,284 5,158,983 12,480,950
Interest paid (226,856) (158,747) (1,860,384) (1,615,497) Interest received 23,611 40,272 87,909 102,484
Net cash of interest provided by (used in) operating activities (2,034,121) 745,809 3,386,508 10,967,937
Cash flow from investing activities
Purchases of property, plant and equipment 13 (620,255) (358,156) (3,691,040) (2,118,909) Purchases of intangible assets 15 (3,230) (8,774) (24,157) (15,500) Proceeds from sale of property, plant and equipment 13 43,287 12,553 173,433 121,933 Additional investments in joint-ventures and subsidiaries 12 (752) (33,799) (6,167) —
Acquisitions, net of cash acquired 4 — — (2,071,772) (1,363,020) Dividends received 12 12,500 13,500 12,500 13,500 Related party transactions 3,378,402 281,180 — —
Other 17 — 17 —
Cash provided by (used in) investing activities 2,809,969 (93,496) (5,607,186) (3,361,996)
Cash flow from financing activitiesProceeds from loans and financings 8,571,107 2,757,809 25,925,000 7,805,903 Payments of loans and financings (2,080,415) (328,463) (18,597,064) (3,666,906) Derivatives instruments received/settled (45,232) (34,909) (270,125) 102,402 Margin cash 5 (48,984) — (1,281,133) —
Dividends paid (2,511,103) (1,441,177) (2,511,103) (1,441,177) Dividends paid to non-controlling interest — — (14,691) —
PPC share repurchase — — — (378,685)
Purchase of treasury shares 22 b3 (3,847,080) — (3,847,080) —
Disposal of treasury shares 22 b3 1,241,251 — 1,241,251 —
Payments of leases 14 (14,924) (13,860) (854,007) (753,786)
Others — — — 1,972
Cash provided by (used in) financing activities 1,264,620 939,400 (208,952) 1,669,723
Effect of exchange rate changes on cash and cash equivalents (142,887) 814,601 (409,513) 3,365,930 Net change in cash and cash equivalents 1,897,581 2,406,314 (2,839,143) 12,641,594
Cash and cash equivalents beginning of period 3,351,911 1,883,135 19,679,743 10,033,967
Cash and cash equivalents at the end of period 5,249,492 4,289,449 16,840,600 22,675,561
12

Non-cash transactions:
Company Consolidated
Notes 2021 2020 2021 2020
Treasury shares used in stock option plan 22 b2 1,798 9,339 1,798 9,339
New lease contracts 14 2,974 23,576 796,838 401,051
Reclassification of negative investments 12 2,148 115,020 — —
Capitalised interests 13 (20,567) — (87,414) —
Mercado da Carne's PP&E transference to Seara — 195,842 — —
Mercado da Carne's intangible assets transference to Seara — 16,276 — —
Mercado da Carne's inventory transference to Seara — 98,347 — —
Mercado da Carne's recoverable taxes transference to Seara — 2,038 — —
Assets held for sale reclassification — — — (9,667)
Increase/decrease in share capital in subsidiaries' through assumption of credit — (29,373) — —
The accompanying notes are an integral part of these condensed financial statements.
13

JBS S.A.
Economic value added the six month period ended June 30, 2021 and 2020In thousands of Brazilian Reais - R$
Company Consolidated2021 2020 2021 2020
RevenueSales of goods and services 23,744,470 16,735,807 162,601,666 125,194,310 Other income (expense) 7,326 4,217 72,969 1,642 Allowance for doubtful accounts (18,872) (12,318) (33,233) (29,849)
23,732,924 16,727,706 162,641,402 125,166,103 GoodsCost of services and goods sold (19,266,374) (11,790,993) (96,626,007) (71,745,106) Materials, energy, services from third parties and others (2,237,676) (2,029,048) (29,093,292) (21,332,172)
(21,504,050) (13,820,041) (125,719,299) (93,077,278)
Gross added value 2,228,874 2,907,665 36,922,103 32,088,825
Depreciation and Amortization (350,965) (318,604) (4,239,572) (3,689,170)
Net added value generated 1,877,909 2,589,061 32,682,531 28,399,655
Net added value by transferShare of profit of equity-accounted investees, net of tax 7,810,450 340,436 38,880 18,034 Financial income 623,852 180,270 1,162,281 477,638 Others (709) (4,272) 69,947 78,694
8,433,593 516,434 1,271,108 574,366
NET ADDED VALUE TOTAL TO DISTRIBUTION 10,311,502 3,105,495 33,953,639 28,974,021
DISTRIBUTION OF ADDED VALUELaborSalaries 1,043,510 977,956 15,418,046 13,349,648 Benefits 163,793 150,624 3,186,256 2,737,768 FGTS (Brazilian Labor Social Charge) 73,229 69,093 186,250 162,375
1,280,532 1,197,673 18,790,552 16,249,791 Taxes and contributionFederal 927,618 (1,414,604) 3,447,816 1,222,773 State 480,012 290,390 1,194,627 729,996 Municipal 9,335 10,537 10,162 11,388
1,416,965 (1,113,677) 4,652,605 1,964,157 Capital Remuneration from third partiesInterests and exchange variation 1,142,997 5,527,483 3,104,190 12,625,658 Rents 23,507 32,559 301,914 237,873 Others 19,518 15,236 740,644 437,009
1,186,022 5,575,278 4,146,748 13,300,540 Owned capital remunerationNet income (loss) attributable to company shareholders 6,427,983 (2,553,779) 6,427,983 (2,553,779) Non-controlling interest — — (64,249) 13,312
6,427,983 (2,553,779) 6,363,734 (2,540,467) ADDED VALUE TOTAL DISTRIBUTED 10,311,502 3,105,495 33,953,639 28,974,021
The accompanying notes are an integral part of these condensed financial statements.
14

1 Operating activities
JBS S.A ("JBS" or the "Company"), is a company listed on the "Novo Mercado" segment of the São Paulo Stock Exchange (B3 - Bolsa de Valores, Mercadorias & Futuros) under the ticker symbol "JBSS3". JBS also trades it’s American Depository Receipts over-the-counter under the symbol "JBSAY".
The Company along with its subsidiaries ("Company" or "Consolidated") is the world's largest company in processing animal protein as measured by total revenue.
The issuance of these individual and consolidated financial statements was authorized by the Board of Directors on August 11, 2021.
The financial statements presented herein include the Company’s individual operations in Brazil as well as the activities of its subsidiaries in Brazil and abroad.
a. Main operating events that occurred during the period:
a1. Analysis of the impacts from Covid-19 pandemic and "Fazer o Bem Faz Bem" program:
The Covid-19 pandemic remains active, although many restrictions which were imposed by the Brazilian authorities have been made more flexible. The effects of the pandemic on the global economy, as well as the course of the pandemic, are still uncertain despite the various actions to combat the proliferation of the new Coronavirus. Given the profile of our operational and industrial footprint, the Company had the flexibility to redirect part of the products that would have served the food service channel (restaurants, hotels, etc.) to the retail channel, as well noticing an increase in online sales. Both channels have been experiencing increased usage by consumers. Furthermore, as the restrictions have been made more flexible, the Company is able to meet its demand, which is quite diversified. The Company reiterates that it will maintain its efforts to continuously meet the demand for food in the world. At this moment, there is no way to precisely predict the medium and long-term impacts on the economic scenario and on the Company's operations.
The Company continues with the program “Fazer o Bem Faz Bem”, which benefited 300 municipalities in 26 Brazilian states and the Federal District, impacting around 77 million people. The program carried out the construction of 2 permanent hospitals, with 131 beds, and 15 expansion works for hospitals, medical centers and health posts, besides the donation of 88 ambulances, 560 respirators, 1,612 multiparameter monitors, 1,997 ICU beds, 400 oxygen cylinders, 560 thousand basic-needs grocery packages, 1 million liters of hygiene and cleaning products and 19 million PPE. In addition, through the program, 40 pulmonary physiotherapists were hired, 39 scientific and technological researches were supported and more than 2 million people were assisted by 80 benefited NGOs and R$5,000 were donated to the Butantan Institute to contribute in the construction of a new vaccine factory. In Brazil, up to this date, the donations reach a total amount of approximately R$351,282. Abroad, JBS USA, with Pilgrim’s Pride Corporation ("PPC"), is investing more than US$200 million (R$1 billion at June 30, 2021) in initiatives to support its employees and communities where is present in the United States, in line with its continued efforts in sustainability and social responsibility.
The initiatives to combat the proliferation of the new Coronavirus remain strict given the various investments made by the Company in order to protect its employees, including greater hygiene and disinfection of offices and plant, health and temperature verification, training, social distance, reduction in the production lines, in the plant air purification in the ventilation systems, among others.
In Brazil, JBS and its subsidiaries will entered a FGTS (Brazilian Labor Social Charge) tax installment program presented in the Provisional Measure 1,046/21, thus the amount of R$113,000 arising from April up to July of 2021, was not paid at its original maturity and will be paid by year end.
In the United States, during the first quarter of 2020, the U.S. government enacted the CARES Act which provided a payment delay of employer payroll taxes during 2020 after the date of enactment. The Company estimates the payment of approximately US$66,7 million (R$333,600 at June 30, 2021) of employer payroll taxes by December 31, 2021 that were deferred in 2020 with an equal amount to be paid by December 31, 2022.
As presented in footnote 28 - Risk management and financial instruments, during the six month period ended June 30, 2021, the volatility in exchange rates and commodity prices increased, partly due to the uncertainties arising from Covid-19, as well as due to the measures taken by governments and central banks. The Company's Management expects the volatility of exchange rates and commodity prices to continue into 2021, however, it is unable to estimate the duration, extent or impacts of such volatility. The Company can use financial instruments to mitigate such exposures aforementioned.
Finally, considering all subsequent events that occurred up to the issuance date of these financial statements, there were no material impacts identified that might have affected the recoverability of assets or changed the measurement of expected changes in these financial statements.
a2. On April 8, 2021, the indirect subsidiary PPC, completed a sale of US$1 billion aggregate principal amount (R$5 billion at June 30, 2021) at 4.25% per year sustainability-linked senior notes due 2031 ("Notes 4,25% JBS Lux 2031"). Starting from 2026, the interest rate payable on the notes shall be increased to 4.50% per annum unless: (i) PPC’s greenhouse gas emissions intensity reduction target of 17.679% by December 31, 2025 from a 2019 baseline (the “Sustainability Performance Target”) has been satisfied and (ii) the satisfaction of the Sustainability Performance Target has been confirmed by a qualified provider of third-party assurance or attestation services appointed by PPC to review PPC’s statement of the greenhouse gas emissions intensity in accordance with its customary procedures.
a3. On April 8, 2021, the indirect subsidiary PPC paid the Notes 5.75% PPC 2025 in the amount of approximately US$896.1 million (R$4.48 billions at June 30, 2021).
a4. On April 19, 2021, the Company, through its international structure, entered into an agreement to purchase the totality of Vivera's shares the third-largest manufacturer of plant-based food products in Europe, for an amount of approximately US$409 million (R$2.06 billions at the transaction date). The acquisition has been completed on June 17, 2021 and it will be part of JBS USA beef segment. This business combination is presented on footnote 4 - Business Combination.
a5. On April 28, 2021, at the Shareholders' Annual Ordinary Meeting ("AGO"), it was approved dividends of i) a minimum mandatory dividend of R$1,092,099 and ii) additional dividends of R$1,419,037, totaling R$2,511,136. On May 5, 2021 the Company distributed dividends to its shareholders from the fiscal year of 2020.
a6. On May 5, 2021, the Company concluded the issuance of private debentures in the amount of R$1.65 billion, in two series maturing in 7 and 10 years, intended for the formation of Agribusiness Credit Rights that will constitute a guarantee for the Public Offering of Certificates of Agribusiness receivables.
a7. On May 12, 2021, the Company's Board of Directors approved a new Share Buyback Program which the Company may acquire up to 10% of the outstanding shares, not changing the Company's controlling shareholder nor its administrative structure. The expiration date in connection with the share buyback program is in 18 months from May 12th, 2021.
a8. On May 14, 2021, the indirect subsidiary JBS USA completed a sale of US$500 millions aggregate principal amount (R$2.5 billions at June 30, 2021), at 3,75% per year, due 2031 ("Notes 3,75% JBS Lux 2031"). The resources were used to finance Vivera's acquisition.
a9. On May 30, 2021, the indirect subsidiary JBS USA and its subsidiaries identified that they were the target of an organized cybersecurity attack ("Cyberattack") affecting some of the servers supporting their global IT systems. They contacted federal officials and activated their cybersecurity protocols, to isolate the intrusion and limit the potential infection. The IT systems recovered full capacity in two days. As a result, the loss of food produced was limited to less than one day of production. The Company paid (to the hackers) an amount of US$11 million (R$55,024 at June 30, 2021), under the caption "General and administrative expenses", as result of the Cyberattack.
JBS S.A.Notes to the condensed financial statements for the six month period ended June 30, 2021 and 2020(Expressed in thousands of Brazilian reais)
15

a10. On June 08, 2021, the Company, through its international structure, entered into an agreement to purchase the totality of Rivalea Holdings Pty Ltd and Oxdale Dairy Enterprise Pty Ltd (together, "Rivalea"), for an amount of approximately US$133 million (R$665,293 at June 30, 2021), subject to approval of local authorities. Rivalea's acquisition will leverage the Company's position in Australia, as a leader in pork processing. The acquisition is expected to close in the second semester of 2021.
a11. On June 08, 2021, the indirect subsidiary JBS Finance Luxembourg S.à r.l. issued senior notes of US$1 billion aggregate principal amount (R$5 billion at June 30, 2021), at 3,75% per year, due 2032 ("Notes 3,625% JBS Finance 2032"). JBS' Sustainability-Linked Bond structure is in line with the Company's sustainability strategy, outlined by the Net Zero 2040 Commitment..a12. On June 17, 2021, the indirect subsidiary PPC, has entered into an agreement to purchase the prepared foods (“Kerry Meats”) and meals (“Kerry Meals”) businesses (together, "Kerry"), for an amount of approximately US$952 million (R$4.76 billion at June 30, 2021), subject to approval of local authorities. Kerry's acquisition strengthens PPC´s position as one of the leading food companies in Europe, creating one of the largest integrated platforms in the world, with a branded portfolio of value-added products. The acquisition is expected to close in the fourth quarter of 2021.
a13. On June 21, 2021, the Company and its indirect subsidiary JBS USA, concluded the consent solicitations in order to conform certain provisions and restrictive covenants (and definitions related thereto) of the indentures that governing certain senior notes due from 2026 to 2031. The consent solicitations were received at June 30, 2021.
a14. During the first semester of 2021, the rating agencies Moody´s Investors Service and Fitch Ratings upgraded JBS's credit rating, from Ba2 to Ba1 and from BB+ to BBB- (investment grade), with a stable outlook.
a15. During the first semester of 2021, the Company and its indirect subsidiary Seara Alimentos donated R$7,000 to the JBS Found For The Amazon.
b. Subsequent events:
b1. On August 6, 2021, the Company, through its international structure, entered into an agreement to purchase Huon Aquaculture Group Limited ("Huon"), for an amount of approximately US$318.6 million (R$1.593 billion at June 30, 2021), subject to approval of local authorities. Huon is Australia’s second largest salmon aquaculture company with vertically integrated operations situated in Tasmania’s pristine environment spanning across hatcheries, marine farming, harvesting, processing, marketing, sales and distribution which will make the Group's portfolio even more complete. The acquisition is expected to close in the fourth quarter of 2021.
a1. The Company submitted and received approval at the Board of Directors meeting, held at August 11, 2021, a proposal to distribute interim dividends referring to the six month period ended at June 30, 2021, in the amount of R$2,511 billion which will be distributed at August 24, 2021. The shareholder base will be from August 16, 2021.
2 Plea bargain agreement, Leniency agreement and the impacts in the financial statements
As is public knowledge, in May 2017 certain executives and former executives of J&F Investimentos S.A. (“J&F”), the holder of a group of companies that belong to the “J&F Group,” took over certain obligations in the Plea Bargain Agreement with the District Attorney General's Office and in 2017, J&F entered in a Leniency Agreement (“Agreement”) with the Federal Public Prosecutor’s Office ("MPF"). The Company and its Brazilian subsidiaries entered the Agreement in September 6, 2017.
In the Agreement, J&F, on behalf of itself and its subsidiaries, committed to reimburse R$10.3 billion over the next 25 years and to cooperate voluntarily with the Government. Carrying out internal investigations and providing proof to ensure the materiality and origin of the actions committed and confessed was one of the Agreement's conditions. J&F hired legal advisors, on behalf of itself and its subsidiaries, to conduct independent internal investigations which began in the third quarter of 2017. On September 30, 2020, three years after the initiation of the investigation, review of several documents, meeting the requests of the forensic specialists and the documents and evidence delivered to the MPF, the Company understands that all the events reported were measured, recognized and disclosed since the financial statements of December 31, 2017. On June 7, 2021, the Company was notified by its shareholder J&F regarding the conclusion of the independent internal investigations conclusion, which was a requirement in the Leniency Agreement. The report and the independent internal investigation conclusions were presented to the MPF and no new facts or ilicit actions were pointed out from those already presented in the Leniency Agreement annexes.
The Company structured a compliance program named "Always Do It Right", created to prevent conducts of employees and third parties that might disagree with the Company's Code of Conduct and Ethics, laws, regulations and/or internal procedures. The program is constantly developing and it reports directly to the Board of Directors, acting independently. They are also responsible for monitoring and implementing trainings related to compliance matters, management of the complaints channel, periodical risk assessments, internal control implementation including anti-corrupting matters, reputation analysis of third parties (due diligence), among other activities related to the Management.
3 Basis of preparation and presentation of financial statements
The condensed financial statements (individual and consolidated) were prepared in accordance with IAS 34/CPC 21 (R1) - Interim Financial Reporting issued by the International Accounting Standards Board ("IASB") and the Brazilian Accounting Pronouncements Committee (Comitê de Pronunciamentos Contábeis - "CPC"). The information disclosed in these financial statements do not meet all the disclosure requirements for the presentation of full annual financial statements and thus should be read in conjunction with the consolidated financial statements for the year ended in December 31, 2020, prepared in accordance with International Financial Reporting Standards (“IFRS”) and the accounting practices adopted in Brazil issued by CPC and approved by the Brazilian Securities Commission ("CVM"). Therefore these condensed financial statements as of September 30, 2020 are not disclosed fully when compared to the financial statements for the year ended December 31, 2020, approved by the Board of Directors on March 24, 2021.
a. Functional and representation currency
The functional currency of a company is the local currency within the primary economic environment in which it operates.These condensed individual and consolidated financial statements are presented in Brazilian Reais (R$), which is the Company’s reporting and functional currency. All financial information is presented in thousands of Reais and the disclosure of other amounts in currencies other than Reais when necessary, except when otherwise indicated.
b. New standards, amendments and interpretations that are not yet effective
b1. IAS 39/CPC 38, IFRS 7/CPC 40 (R2) and IFRS 9/CPC 48 - Reference interest rate reform - Phase 2
As of January 1, 2021, a change is expected, due to the reform of the reference interest rate, related to the forecast to discontinue the use of the London Interbank Offered Rate (LIBOR) as a reference interest rate after 2021. The Company is following the discussions and so far has not identified significant impacts as a result of this change.
b2. IAS 37/CPC 25 - Provisions, Contingent Liabilities and Contingent Assets
As of January 1, 2022, changes specify what costs the Company must include when assessing whether a contract is onerous. The costs directly related to the fulfillment of the contract must be considered in the cash flow assumptions (Ex: Cost of labor, materials and other expenses related to the operation of the contract). The Company is following the discussions and has so far not identified any significant impacts as a result of this change.
JBS S.A.Notes to the condensed financial statements for the six month period ended June 30, 2021 and 2020(Expressed in thousands of Brazilian reais)
16

There are no other standards, changes in standards and interpretations that are not in force that the Company expects to have a material impact arising from its application in its financial statements.
4 Business Combination
On November 30, 2020, the Company's indirect subsidiary Seara Alimentos, acquired assets of margarine business ("Margarinas"), for the amount paid in cash of approximately R$843,988, subject to working capital adjustments. The Margarine business strengthens Seara's position in the margarine market in Brazil by optimizing its distribution platform and is in line with the strategy of expanding the portfolio of products with higher added value and with brand. The goodwill generated in the transaction of R$199,727 is only eligible for tax deductibility if the Company incorporates the subsidiary or if it sells the assets and liabilities assumed. During the first quarter of 2021, the goodwill allocation was reviewed, which resulted in a goodwill decrease of R$179,827 and increase in accrued payroll and social charges. The changes were retrospectively recorded at the date of acquisition according to IFRS 3 - Business Combinations.
On June 17, 2021 the Company´s indirect subsidiary Planterra Holdings B.V., acquired the totality of Vivera's shares, for the amount of US$409 million (R$2,06 billion at the transaction date), subject to working capital adjustments, paid with the Notes 3,75% JBS Lux 2031 resources, issued by JBS USA. Vivera strengthens and boosts the Group's global platform of plant-based products, adding technological knowledge and innovation. The goodwill generated in the transaction of US$364 million (R$1.84 billion at the transaction date) is not deductible in the Netherlands.
The assets acquired and liabilities assumed in the business combinations were measured at fair value as presented below:Acquisitions
2021 2020FAIR VALUE Vivera Margarine assets
Cash and cash equivalents 56,496 —
Trade accounts receivable 53,566 —
Inventories 59,356 172,137 Property, plant and equipment 151,502 484,574 Right of use assets 23,585 —
Intangible assets — 21,168 Other assets 26,954 —
ASSETS 371,459 677,879
Trade accounts payable 89,069 —
Accrued income taxes, other taxes, payroll and social charges — 33,618 Lease liabilities 23,585 —
Current and deferred income taxes 3,218 —
Other liabilities 32,030 —
LIABILITIES 147,902 33,618
Net assets and liabilities 223,557 644,261 Acquisition price 2,059,327 843,988 Goodwill 1,835,770 199,727
Other non-material acquisitions
a1. On May 27, 2021, the Company´s indirect subsidiary Seara Alimentos, acquired 48,8% of the Bait Almakoolat Food Industries LLC ("BMF") assets, for the amount of R$21,412, paid in cash, subject to working capital adjustments.
. 5 Cash and cash equivalents
Company Consolidated
June 30, 2021 December 31, 2020 June 30, 2021 December 31, 2020Cash on hand and at banks 2,993,622 3,066,208 11,284,710 15,496,570 CDB (bank certificates of deposit) and National Treasury Bill (Tesouro Selic) 2,255,870 285,703 5,555,890 4,183,173
5,249,492 3,351,911 16,840,600 19,679,743
Company ConsolidatedJune 30, 2021 December 31, 2020 June 30, 2021 December 31, 2020
Margin cash (1) — — 888,576 —
Treasury bills (2) 48,984 — 392,557 —
48,984 — 1,281,133 —
(1) Margin cash kept as collateral at the bank when hiring exchange traded futures contracts. The cash is redeemable when the contracts are settled, therefore they are not considered as cash and cash equivalents.
(2) Treasury bills bound to the consumer price index ("CPI"). The bills guarantee protection against inflation (deflation as well) when carried out up to its maturity.
JBS S.A.Notes to the condensed financial statements for the six month period ended June 30, 2021 and 2020(Expressed in thousands of Brazilian reais)
17

6 Trade accounts receivable, netCompany Consolidated
June 30, 2021 December 31, 2020 June 30, 2021 December 31, 2020Current receivables 2,604,647 2,624,145 14,363,161 11,621,728 Overdue receivables:From 1 to 30 days 162,936 239,427 1,781,552 2,069,211 From 31 to 60 days 16,507 12,803 164,013 144,492 From 61 to 90 days 2,510 2,642 36,658 48,390 Above 90 days 231,517 234,632 495,402 541,910 Allowance for doubtful accounts (234,747) (233,708) (412,371) (413,856) Present value adjustment (8,410) (8,329) (13,480) (10,664)
170,313 247,467 2,051,774 2,379,483 2,774,960 2,871,612 16,414,935 14,001,211
Changes in allowance for doubtful accounts: Company Consolidated
June 30, 2021 December 31, 2020 June 30, 2021 December 31, 2020Initial balance (233,708) (204,601) (413,856) (345,473) Additions (18,872) (18,860) (33,233) (33,173) Write-offs 10,541 33,059 19,852 49,177 Exchange rate variation 7,292 (43,306) 14,866 (84,387) Closing balance (234,747) (233,708) (412,371) (413,856)
7 InventoriesCompany Consolidated
June 30, 2021 December 31, 2020 June 30, 2021 December 31, 2020
Finished products 4,247,005 2,213,424 15,611,193 11,126,005 Work in process 269,468 187,425 1,427,088 1,138,863 Raw materials 325,943 315,878 2,101,697 2,239,584 Warehouse spare parts 236,962 242,359 3,262,919 3,082,292
5,079,378 2,959,086 22,402,897 17,586,744
The changes in the net realizable value inventory adjustments accrual, which its offset is under the caption "Cost of sales", are presented below:
Company ConsolidatedJune 30, 2021 December 31, 2020 June 30, 2021 December 31, 2020
Initial balance (6,746) (8,166) (182,409) (137,436) Additions (325) (6,027) (106,931) (163,591)
Write-offs 293 7,447 90,247 138,157
Exchange rate variation — — 3,749 (19,539)
Closing balance (6,778) (6,746) (195,344) (182,409)
8 Biological assetsConsolidated
Changes in biological assets: Current Non-current
Balance at December 31, 2020 5,115,720 1,778,565 Increase by reproduction (born) and cost to reach maturity 26,567,284 1,508,772 Reduction for slaughter, sale or consumption (26,589,239) (151,978) Increase by purchase 1,246,852 415,137 Decrease by death (68,576) (24,702) Fair value adjustments (185,407) —
Changes from current to non-current 523,777 (523,777) Exchange rate variation (174,219) (47,711) Amortization — (1,099,511)
Balance at June 30, 2021 6,436,192 1,854,795
JBS S.A.Notes to the condensed financial statements for the six month period ended June 30, 2021 and 2020(Expressed in thousands of Brazilian reais)
18

9 Recoverable taxesCompany Consolidated
June 30, 2021 December 31, 2020 June 30, 2021 December 31, 2020Value-added tax on sales and services - ICMS 1,522,140 1,371,291 3,817,572 3,524,264 Social contribution on billings - PIS and COFINS 2,032,128 1,909,867 3,094,355 2,906,283 Withholding income tax - IRRF/IRPJ 2,233,951 3,421,832 3,235,430 4,507,261 Excise tax - IPI 164,402 154,151 301,174 299,751 Reintegra 30,134 30,372 45,745 48,061 Other 16,087 16,087 109,522 110,773
5,998,842 6,903,600 10,603,798 11,396,393
Current 1,101,585 1,059,635 2,857,507 2,849,898 Non-current 4,897,257 5,843,965 7,746,291 8,546,495
5,998,842 6,903,600 10,603,798 11,396,393
The Federal Supreme Court ("STF") decided, by majority, with general repercussion on May 13, 2021, that ICMS is not part of the PIS and COFINS calculation basis, and the decision is valid from 15 of March 2017, date on which the thesis of general repercussion was established, except for the judicial and administrative lawsuits filed up to the date of the session in which the trial was carried out. The decision also clarified that the thesis discusses the ICMS shown in the invoice, which was the form used by the Company and its subsidiaries to calculate the tax credits.
During the first semester of 2021, the Company and its subsidiaries recognized reimbursements which refer to the inclusion of ICMS (Value-added tax on sales and services) in the calculation basis of PIS (Program of social integration) and COFINS (Contribution for the financing of social security), which resulted in the amount of R$71,500 in the Company, with a principal amount of R$34,420 and interests and monetary correction amount of R$37,080; and the amount of R$236,162 in the Consolidated, with a principal amount of R$109,582 and interests and monetary correction amount of R$126,580.
10 Related parties transactions
The main balances of assets and liabilities, as well as the transactions resulting in income (loss) for any period, that relate to transactions between related parties or arose from transactions at prices and conditions established between the related parties. Transference of costs includes borrowing costs, interest and management fee, when applicable. The following table includes balances and net effect on income of intercompany financing transactions between the Company and its subsidiaries:
June 30, 2021 December 31, 2020
Related party receivables 3,527,880 1,872,127 Related party payables (21,733,965) (17,074,822)
(18,206,085) (15,202,695)
Statement of financial position
accounts Effect on net income
COMPANY CurrencyCosts transfer
(administrative and funding) June 30, 2021December 31,
2020 2021 2020
Direct subsidiariesJBS Confinamento Ltda. R$ CDI + 4% p.y. 196,844 73,708 5,066 3,461
Brazservice Ltda. R$ CDI + 4% p.y. 21,052 16,922 516 7,417
JBS Investments Lux US$ — 15,790 14,926 — —
Enersea Ltda. R$ CDI + 4% p.y. 2,976 1,005 1 (2)
JBS Embalagens Metálicas Ltda R$ CDI + 4% p.y. 15 7 — 10,032
JBS Investments II GMBH (1) US$ 5,75% to 7,3% p.y. (16,816,989) (17,074,822) (409,817) (334,395)
JBS Finance Luxembourg S.à.r.l (2) US$ 3,64% p.y. (4,916,976) — (7,632) —
Indirect subsidiariesSeara Alimentos Ltda. R$ CDI + 4% p.y. 2,915,538 1,384,241 41,229 (169,053)
JBS Leather Paraguay Srl GUA 7,00% p.y. 9,534 9,417 265 232 JBS USA Holding Lux S.à.r.l US$ — — — — (77,350) Other related partiesJ&F Oklahoma Holdings, Inc. (3) US$ 3,4% p.y. 366,131 371,901 8,772 8,034
(18,206,085) (15,202,695) (361,600) (551,624)
Credit with related parties
ConsolidatedJune 30, 2021 December 31, 2020
J&F Oklahoma Holdings Inc (3) 366,131 371,901
JBS Ontario — 10,118 366,131 382,019
The transactions above refer to working capital funding. Settlement in the future shall be through a capital contribution, reduction and/or dividends distribution, except for the transactions following below:
(1) During the years ended at 2018 and 2019, the Company received funds from the direct subsidiary JBS Investments II GmbH, raised from senior notes in the amount of US$1,750 billion (R$8,75 billion at June 30, 2021) and funds from the indirect subsidiary JBS USA Holding Lux of US$1.520 billion (R$7.60 billions at June 30, 2021).
JBS S.A.Notes to the condensed financial statements for the six month period ended June 30, 2021 and 2020(Expressed in thousands of Brazilian reais)
19

(2) In June 2021, the Company received funds from the direct subsidiary JBS Finance Luxembourg S.à.r.l, raised from senior notes in the amount of US$1 billion (R$5 billion at June 30, 2021).
(3) In December 2019, the Company undertook the credits previously held by its indirect subsidiary Moyer Distribution with J&F Oklahoma arising from a credit line granted due to the cattle purchase operation in the USA.
The disclosure of significant intercompany commercial transactions is in accordance with the criteria established by Management, by disclosing individually, balances equal or higher than 2% of the total of each transaction (sale of products, purchases, accounts receivable and accounts payable). Additionally, transactions which are below the described criteria will be disclosed if relevant. This analysis is performed for each related party. If any related party has not meet this criteria in the past and in the current period they do, the comparative balance will be disclosed.
Accounts receivable Accounts payablePurchases/Services
renderedSale of products/Services
provided
COMPANYJune 30,
2021December 31, 2020
June 30, 2021
December 31, 2020 2021 2020 2021 2020
Direct subsidiaries JBS Confinamento 3,244 1,745 109,193 59,860 694,669 335,852 10,911 5,814 Brazservice 12,875 12,813 6,605 8,320 43,123 12,236 94,050 41,778 Conceria Priante 6,805 14,087 — — — — 14,199 4,080 Enersea — — 248 13 80,534 65,191 54,921 45,708 Toledo 55,845 22,795 — — — 8 139,754 148,171 Indirect subsidiaries Seara Alimentos 134,486 140,489 38,252 45,120 92,330 119,944 855,950 447,717 JBS Global UK 56,029 66,821 — — — — 153,011 118,136 JBS Aves 4,127 3,130 21,525 20,665 4,356 2,702 23,629 7,464 Weddel 7,582 5,710 — — — — 25,001 29,414 Sampco 170,916 77,526 — — — — 480,200 326,155 Meat Snacks Partners 40,642 23,752 — 16 5 172 368,599 177,044 JBS Asia — — 10,632 — 11,204 — — —
JBS Leather Asia 36,577 10,255 — — — — 145,079 73,483 JBS USA 94,736 19,517 — — 518 989 153,893 16,214 Seara Comércio de Alimentos 66 640 1,297 1,344 8,447 6,822 13,807 3,030 Swift & Company Trade Group 1,932 1,187 — — — — 115,866 62,792 Other related parties JBJ Agropecuária 2,509 1,455 27 13,851 405,493 193,847 8,095 6,358 Flora Produtos 37,668 26,723 — — 3 367 135,730 93,738 Eldorado Celulose 650 983 5 10 104 77 7,403 8,102 Banco Original — — — — — — 9 55
666,689 429,628 187,784 149,199 1,340,786 738,207 2,800,107 1,615,253
Other financial transactions in the Company
The Company and a few of its subsidiaries entered into an agreement in which Banco Original (Related party) acquires trade accounts receivables held against certain of the Company's customers in the domestic and foreign markets. The assignments are measured at market value through a permanent transfer of the risks and benefits to Banco Original of all trade accounts receivable. At June 30, 2021 and December 31, 2020, the unpaid balance of transferred receivables was R$691,667 and R$524,088 in the Company, and R$1,791,727 and R$1,498,079 in the Consolidated, respectively. During the six month period ended June 30, 2021 and 2020, the Company incurred financial costs related to this operation in the amount of R$30,991 and R$32,472 in the Company, and R$77,549 and R$56,471 in the Consolidated, respectively, recognized in these financial statements as financial expenses.
The Company has a livestock purchase agreement for future delivery with certain suppliers, including JBJ Agropecuária. At June 30, 2021 and December 31, 2020, this balance of this transaction was R$70,000 and R$100,559.
At June 30, 2021 and December 31, 2020, the Company held investments with Banco Original, in the amount of R$572,880 and R$591,186 in the Company and R$2,185,858 and R$1,836,669 in the Consolidated, recognized as cash and cash equivalents, respectively. The cash investments, CDB and similar investments have similar earnings to CDI (Certificado de Depósito Interbancário). For the six month period ended June 30, 2021 and 2020, the Company earned interest from these investments in the amount of R$733 and R$1,005 in the Company, and R$1,687 and R$2,906 in the Consolidated, respectively, recognized in these financial statements as financial income.
The Company is the sponsor of Instituto Germinare, a business school youth-directed, whose mission is to educate future leaders by offering free, high-quality education. During the six month period ended June 30, 2021 and 2020, the Company made donations in the amounts of R$25,945 and R$11,630, respectively, recognized in these financial statements as general and administrative expenses.
The Company, in its insurance hiring and renewal process, includes the related party Original Corporate Corretora de Seguros Ltda., an insurance broker company. If hired, the contracts are carried out at market value.
PicPay salary advance - Employees from the Company can opt to receive a salary advance every 15th business day of each month. This advance will be deducted from the employee's salary when the total payroll is paid at month end, without financial charges on the amount advanced.
No expense for doubtful accounts or bad debts relating to related-party transactions were recorded during the six month period ended June 30, 2021 and 2020.
JBS S.A.Notes to the condensed financial statements for the six month period ended June 30, 2021 and 2020(Expressed in thousands of Brazilian reais)
20

Remuneration of key management
The Company's key management is comprised of its Executive Officers. The aggregate amount of compensation received by the Company’s key management during the six month period ended June 30, 2021 and 2020 is the following:
2021 2020Salaries and wages 14,795 11,921 Variable cash compensation 56,891 44,500
71,686 56,421
The Chief Executive Officer, the Administrative and Control Officer, the Chief Financial Officer and the Executive Officers are parties to the Brazilian employment contract regime referred to as CLT (which is the Consolidation of Labor Laws), which follows all the legal prerogatives of payments and benefits.
Except for those described above, the Board of Directors members are not part to any employment contract or any other contracts for additional business benefits such as post-employment benefits or other long-term benefits, termination of work that does not conform to those requested by the CLT.
11 Income taxesCompany Consolidated
June 30, 2021 December 31, 2020 June 30, 2021 December 31, 2020Deferred income taxes assets — — 1,641,979 1,590,194 Deferred income taxes liabilities (3,125,878) (3,105,833) (6,384,296) (6,186,715)
(3,125,878) (3,105,833) (4,742,317) (4,596,521)
a. Deferred income tax and social contribution
CompanyDecember 31,
2020Income
statement June 30, 2021
Allowance for doubtful accounts 82,570 318 82,888 Provisions 177,643 (3,310) 174,333 Present value adjustment - Trade accounts receivable 2,832 27 2,859 Share-based payment 1,314 (611) 703 Right of use asset 1,251 663 1,914 Other temporary differences assets 80,982 (18,458) 62,524 Goodwill amortization (3,196,250) — (3,196,250) Present value adjustment - Trade accounts payable 1,580 501 2,081 Realization of other reserves/deemed cost (263,688) 1,313 (262,375) Other temporary differences liabilities 5,933 (488) 5,445
Deferred taxes, net (3,105,833) (20,045) (3,125,878)
ConsolidatedDecember 31,
2020Income
statement Exchange variationOther
adjustments June 30, 2021
Tax losses and negative basis of social contribution 1,876,040 37,337 (16,826) — 1,896,551 Allowance for doubtful accounts 111,303 2,880 (226) — 113,957 Provisions 502,988 3,823 — — 506,811 Present value adjustment - Trade accounts receivable 29,515 58,382 — — 87,897 Tax credits - Foreign subsidiaries 51,017 19,324 (2,979) 94 67,456 Biological assets - Foreign subsidiaries 59,820 (3,835) (2,408) — 53,577 Labor accidents accruals - Foreign subsidiaries 209,228 18,823 (8,963) — 219,088 Pension plan - Foreign subsidiaries 175,887 (13,723) (6,542) — 155,622 Trade accounts payable accrual - Foreign subsidiaries 943,048 46,419 (36,363) — 953,104 Share-based payment 1,314 (612) — — 702 Non-deductible interests - Foreign subsidiaries 2,502 2,190 (1,364) — 3,328 Right of use assets 40,579 4,831 (809) — 44,601 Other temporary differences assets 511,205 (57,781) (5,877) — 447,547 Goodwill amortization (3,622,479) (34,370) 13,603 — (3,643,246) Present value adjustment - Trade accounts payable 1,580 (21,399) — — (19,819) Business combination (1,682,069) (578,970) 88,879 (3,194) (2,175,354) Customer returns accruals - Foreign subsidiaries (169,824) (32,706) 8,208 — (194,322) Inventory valuation - Foreign subsidiaries (504,563) 84,695 13,278 — (406,590) Realization of other reserves/deemed cost (607,537) 7,417 — — (600,120) Depreciation and amortization (2,169,080) 214,525 73,968 — (1,880,587) Other temporary differences liabilities (356,995) 27,263 13,255 (56,043) (372,520)
Deferred taxes, net (4,596,521) (215,487) 128,834 (59,143) (4,742,317)
JBS S.A.Notes to the condensed financial statements for the six month period ended June 30, 2021 and 2020(Expressed in thousands of Brazilian reais)
21

b. Reconciliation of income tax and social contribution expense:Company Consolidated
Six month period ended June 30, Six month period ended June 30, 2021 2020 2021 2020
Profit before income taxes (PBT) 7,638,436 (3,926,621) 9,729,828 (1,570,985) Nominal rate (34) % (34) % (34) % (34) %
Expected tax expense (2,597,068) 1,335,051 (3,308,142) 534,135
Adjustments to reconcile taxable income:
Earnings and losses due to equity method 2,655,553 115,748 13,219 6,131 Investments grants 262,950 (183) 418,549 113,052 Difference on tax rates under taxable income from foreign subsidiaries — — 1,080,496 590,125 Net income arising from foreign subsidiaries (1) (1,465,592) — (1,179,802) —
Unrecognized tax benefits — (575) (284,161) (2,247,433) Non-taxable interest - Foreign subsidiaries — — 90,874 163,205 Taxation of dual jurisdiction subsidiaries - Foreign subsidiaries — — 43 41,137 "Fazer o Bem Faz Bem" program and JBS Found For The Amazon (13,495) — (13,495) —
Other permanent differences (52,801) (77,199) (183,675) (169,834)
Current and deferred income tax (expense) benefit (1,210,453) 1,372,842 (3,366,094) (969,482)
Current income tax (1,190,408) — (3,150,607) (1,638,178)
Deferred income tax (20,045) 1,372,842 (215,487) 668,696 (1,210,453) 1,372,842 (3,366,094) (969,482)
% IT/PBT (15.85) % 34.96 % (34.60) % (61.71) %
Company Consolidated
Six month period ended June 30, Six month period ended June 30, 2021 2020 2021 2020
Adjustments to reconcile taxable income (2)
Current and deferred income tax (expense) benefit (1,210,453) 1,372,842 (3,366,094) (969,482) Goodwill amortization - Deferred — — 34,370 —
Prior years loss carryfowards - deferred — (1,405,897) (37,337) (1,383,016) Unrecognized tax benefits — 575 284,161 2,247,433 Income tax on realization of other reserves (1,313) (1,292) (7,417) (7,998)
Current and deferred income tax (expense) benefit - ADJUSTED (1,211,766) (33,772) (3,092,317) (113,063)
Effective income tax rate (15.86) % (0.86) % (31.78) % (7.20) %
JBS S.A.Notes to the condensed financial statements for the six month period ended June 30, 2021 and 2020(Expressed in thousands of Brazilian reais)
22

Company ConsolidatedThree month period ended June 30, Three month period ended June 30,
2021 2020 2021 2020
Profit before income taxes (PBT) 5,026,691 3,265,717 6,247,591 5,215,209 Nominal rate (34) % (34) % (34) % (34) %
Expected tax expense (1,709,075) (1,110,344) (2,124,181) (1,773,171)
Adjustments to reconcile taxable income:
Earnings and losses due to equity method 1,725,361 1,260,468 4,137 1,676 Investments grants 135,505 — 216,752 46,720 Difference on tax rates under taxable income from foreign subsidiaries — — 410,350 459,118 Net income arising from foreign subsidiaries (1) (758,292) — (741,640) —
Unrecognized tax benefits — (241) 327,465 (659,695) Non-taxable interest - Foreign subsidiaries — — 12,418 93,607 Taxation of dual jurisdiction subsidiaries - Foreign subsidiaries — — 31 16 "Fazer o Bem Faz Bem" program and JBS Found For The Amazon (13,495) — (13,495) —
Other permanent differences (24,233) (36,364) (131,273) (36,856)
Current and deferred income tax (expense) benefit (644,229) 113,519 (2,039,436) (1,868,585)
Current income tax (664,131) — (1,990,904) (1,595,894)
Deferred income tax 19,902 113,519 (48,532) (272,691) (644,229) 113,519 (2,039,436) (1,868,585)
% IT/PBT (12.82) % 3.48 % (32.64) % (35.83) %
Company Consolidated
Three month period ended June 30, Three month period ended June 30, 2021 2020 2021 2020
Adjustments to reconcile taxable income (2)
Current and deferred income tax (expense) benefit (644,229) 113,519 (2,039,436) (1,868,585) Goodwill amortization - Deferred — — 19,869 —
Prior years loss carryfowards - deferred — (101,866) (3,907) (67,791) Unrecognized tax benefits — 241 (327,465) 659,695 Income tax on realization of other reserves (696) (638) (3,742) (3,593)
Current and deferred income tax (expense) benefit - ADJUSTED (644,925) 11,256 (2,354,681) (1,280,274)
Effective income tax rate (12.83) % 0.34 % (37.69) % (24.55) %
(1) Refers to the impacts from IFRIC 23 - Uncertainty over income tax treatments.
(2) The Company believes that due to the origin and non-recurrence of specific events certain items should be excluded from the effective tax rate disclosure such as: i) deferred tax effects on goodwill amortization; ii) recognition of deferred tax from current year; iii) unrecognized tax benefits; iv) income tax on realization of the other reserves (since it is not relate to the net operating income).
JBS S.A.Notes to the condensed financial statements for the six month period ended June 30, 2021 and 2020(Expressed in thousands of Brazilian reais)
23

12 Investments in subsidiaries, associate and joint venture
Changes in the Company's investments:
Equity
December 31, 2020
Addition (disposal)
Exchange rate variation
Changes in the equity of investees
Proportionate share of income (loss) June 30, 2021
JBS Embalagens Metálicas 79,564 — — — 1,330 80,894 JBS Confinamento 110,619 — — — (67,667) 42,952 Conceria Priante 155,857 — (11,287) — 2,911 147,481 JBS Leather International 715,521 — (28,826) 3,975 25,464 716,134 Brazservice 48,281 — — — (6,328) 41,953 Meat Snack Partners (1) 113,751 (12,500) — — 36,578 137,829 Enersea (354) — — — (1,240) (1,594) JBS Asset Management 103,030 — (4,013) — 2,335 101,352 JBS Investments II GmbH 17,218,374 — (1,320,738) 642,554 407,144 16,947,334 JBS Investments Luxembourg 18,897,423 — (1,203,506) 646,876 7,399,734 25,740,527 Swift Foods 401 — (7) (2) (128) 264 JBS Toledo 202,721 — (14,924) — 6,753 194,550 JBS Chile 13,265 — (1,224) — 4,459 16,500 JBS Finance Luxembourg (2)
— 753 50 (816) (895) (908) Subtotal 37,658,453 (11,747) (2,584,475) 1,292,587 7,810,450 44,165,268 Accrual for loss on investments (*) 354 2,502 Total 37,658,807 44,167,770
(*) Transfer of the negative investments for other current liabilities.
(1) The indirect subsidiary Meat Snack Partners distributed dividends to the Company.(2) During the second quarter of 2021, the Company increased JBS Finance Luxembourg's share capital.
Changes in the Consolidated's investments:
Equity
December 31, 2020 Addition
Dividends distribution
Changes in the equity of investees
Proportionate share of income June 30, 2021
Meat Snack Partners 113,751 — (12,500) — 36,578 137,829 JBS Ontario 57,345 6,167 — (2,840) 2,302 62,974 Total 171,096 6,167 (12,500) (2,840) 38,880 200,803
13 Property, plant and equipment
Changes in property, plant and equipment:
Company December 31, 2020 Additions net of transferences (1) Disposals Depreciation June 30, 2021
Buildings 3,844,629 34,096 (4,991) (87,997) 3,785,737 Land 1,648,149 15,513 (2,881) — 1,660,781 Machinery and equipment 3,168,463 117,609 (5,482) (150,521) 3,130,069 Facilities 1,502,057 138,501 (283) (44,529) 1,595,746 Computer equipment 33,167 6,774 (21) (7,843) 32,077 Vehicles 377,136 68,114 (23,145) (31,903) 390,202 Construction in progress 941,882 255,024 — — 1,196,906 Other 61,004 5,191 (89) (3,613) 62,493
11,576,487 640,822 (36,892) (326,406) 11,854,011
JBS S.A.Notes to the condensed financial statements for the six month period ended June 30, 2021 and 2020(Expressed in thousands of Brazilian reais)
24

ConsolidatedDecember 31,
2020 (*)
Acquired in business
combinations (2)Additions net of transferences (1)
Business combination
adjustments (3) Disposals DepreciationExchange rate
variation June 30, 2021
Buildings 17,139,617 43,024 582,377 (217) (62,786) (536,076) (343,550) 16,822,389
Land 4,868,382 22,342 27,465 — (12,311) — (76,985) 4,828,893
Machinery and equipment 16,665,029 82,559 1,298,206 237 (31,096) (1,293,034) (371,640) 16,350,261
Facilities 2,329,078 — 236,652 — (2,229) (69,583) 559 2,494,477
Computer equipment 520,038 — 138,845 (3) (394) (100,313) (17,676) 540,497
Vehicles 637,045 4,057 96,805 — (24,095) (67,597) (7,861) 638,354
Construction in progress 4,116,712 4,058 1,307,574 — — — (156,200) 5,272,144
Other 830,543 15,086 90,530 (2) (5,153) (69,768) (22,833) 838,403
47,106,444 171,126 3,778,454 15 (138,064) (2,136,371) (996,186) 47,785,418
(*) The Company reviewed and change the balances in December 31, 2020 in the amount of R$ 179,827 referring to the "Margarinas" business final goodwill allocation, according to IFRS 3 - Business Combinations, the adjustment should be retrospective. (1) Additions for each category includes transfer from construction in progress during the period.(2) Refers to Vivera and Bait Almakoolat Food Industries ("BMF") acquisitions, during the second quarter of 2021, as described in footnote 4 - Business combination.(3) Refers to Marba's business combination adjustments.
For the six month period ended June 30, 2021 and 2020, the amount of capitalized interest added to construction in progress and included in additions was R$20,567 and R$18,394 in the Company, respectively, and in the Consolidated was R$87,414 and R$54,358, respectively.
Annually, the Company tests the recoverability of its assets that were identified as having an indicator of impairment using the concept of value in use through discounted cash flow models. There were no indicates of impairment at the six month period ended June 30, 2021.
14 Leases
14.1 Right of use asset
Changes in the right of use asset:
CompanyDecember 31,
2020 Additions (1)Terminated contracts Amortization June 30, 2021
Buildings 31,811 475 — (6,017) 26,269 Computer equipment 26,338 — — (3,903) 22,435 Operating plants 7,006 — — (1,828) 5,178 Machinery and equipment 3,207 1,585 — (1,351) 3,441 Land 170 419 — (158) 431 Vehicles and aircraft 135 479 (53) (163) 398 Furniture and appliances 119 — — (24) 95
68,786 2,958 (53) (13,444) 58,247
ConsolidatedDecember 31,
2020
Acquired in business
combinations (2) Additions (1)Terminated contracts Amortization
Exchange rate variation June 30, 2021
Growing facilities 2,545,166 — 200,997 — (230,033) (39,001) 2,477,129 Buildings 1,583,905 1,898 272,435 (38,656) (135,432) (40,452) 1,643,698 Vehicles and aircraft 792,168 — 151,818 (9,548) (197,704) (21,274) 715,460 Machinery and equipment 644,569 21,687 147,693 (5,752) (149,886) (20,226) 638,085 Operating plants 110,010 4,760 3,558 (4,359) (9,348) (2,012) 102,609 Land 82,315 — 1,184 — (4,741) (2,324) 76,434 Computer equipment 26,457 — 2,993 — (4,050) (3) 25,397 Furniture and appliances 119 — — — (24) — 95
5,784,709 28,345 780,678 (58,315) (731,218) (125,292) 5,678,907
(1) Additions for each category includes PIS and COFINS to be paid.(2) Refers to Vivera and Bait Almakoolat Food Industries ("BMF") acquisitions, during the second quarter of 2021, as described in footnote 4 - Business combination.
JBS S.A.Notes to the condensed financial statements for the six month period ended June 30, 2021 and 2020(Expressed in thousands of Brazilian reais)
25

14.2 Lease liabilities
Company ConsolidatedJune 30, 2021 December 31, 2020 June 30, 2021 December 31, 2020
Lease liability 77,697 89,055 7,370,097 7,506,332
Present value adjustment (13,820) (16,589) (1,335,166) (1,401,843)
63,877 72,466 6,034,931 6,104,489 Breakdown:Current liabilities 23,682 22,452 1,327,110 1,293,073
Non-current liabilities 40,195 50,014 4,707,821 4,811,416
63,877 72,466 6,034,931 6,104,489
Changes in the lease liability:
CompanyDecember 31,
2020 AdditionsInterest accrual Payments
Terminated contracts June 30, 2021
Lease liability 72,466 2,974 3,417 (14,924) (56) 63,877
ConsolidatedDecember 31, 2020
Acquired in business
combinations (2) AdditionsInterest accrual Payments
Terminated contracts
Exchange rate
variationJune 30,
2021
Lease liability 6,104,489 28,494 796,838 158,164 (854,007) (62,526) (136,521) 6,034,931
The non-current portion of the lease liability schedule is as follows:June 30, 2021
Company Consolidated
2022 10,197 1,160,329 2023 11,985 959,649 2024 11,473 777,233 2025 7,569 597,103 2026 1,137 423,830 Maturities thereafter 2026 6,504 1,843,261 Present value adjustment (8,670) (1,053,584)
40,195 4,707,821
15 Intangible assets
Changes in intangible assets:
CompanyDecember 31,
2020 Additions Disposals Amortization June 30, 2021Amortizing:Trademarks 31,047 — — (7,800) 23,247 Software 18,935 3,230 (17) (3,315) 18,833
49,982 3,230 (17) (11,115) 42,080
ConsolidatedDecember 31, 2020
Acquired in business
combination (1) Additions Disposals Amortization
Exchange rate
variation June 30, 2021Amortizing:Trademark 370,813 — — — (41,486) (11,020) 318,307 Software 72,603 33 13,090 (17) (11,735) (530) 73,444 Customer relationships 2,597,087 — — — (208,448) (72,127) 2,316,512 Supplier contract 186,732 — 11,000 — (9,384) (2,790) 185,558 Others 4,328 — — — (1,419) (51) 2,858 Non-amortizing:Trademarks 4,409,555 — 67 — — (91,732) 4,317,890 Water rights 61,191 — — — — (2,325) 58,866
7,702,309 33 24,157 (17) (272,472) (180,575) 7,273,435
(1) Refers to Bait Almakoolat Food Industries ("BMF") acquisition, during the second quarter of 2021, as described in footnote 4 - Business combination.
Impairment test:
Annualy, the Company tests the recoverability of its assets using the concept of value in use through cash flow models and at the six month period ended June 30, 2021, there were no indications of impairment.
JBS S.A.Notes to the condensed financial statements for the six month period ended June 30, 2021 and 2020(Expressed in thousands of Brazilian reais)
26

16 Goodwill
In the Company, goodwill is recognized under the caption "Investments in subsidiaries, associate and joint venture" because for the investor it is part of its investment in the subsidiary's acquisition; and as goodwill, in the Consolidated because it refers to expectation of future earnings from the acquired subsidiary, which assets and liabilities are consolidated with the Company's. Therefore, in the Company there is only goodwill from incorporations in the amount of R$9,085,970 and in the Consolidated all goodwill are recognized as intangible.
Changes in goodwill: ConsolidatedJune 30, 2021 December 31, 2020
Initial balance (1) 29,066,794 24,497,750 Acquired in business combination (2) 1,844,189 496,600
Business combination adjustments (1) 5,452 164,684
Exchange rate variation (542,292) 3,907,760
Closing balance 30,374,143 29,066,794
(1) The Company reviewed and change the balances in December 31, 2020 in the amount of R$ 179,827 referring to the "Margarinas" business goodwill allocation,according to IFRS 3 - Business Combinations, the adjustment should be retrospective.(2) Refers to Vivera and Bait Almakoolat Food Industries ("BMF") acquisitions, during the second quarter of 2021, as described in footnote 4 - Business combination..
CGU Groups June 30, 2021 December 31, 2020Brazil Beef 9,069,926 9,069,926
Seara (1) 3,893,535 3,880,428
Moy Park 4,277,682 4,341,869
USA Pork 3,474,199 3,609,285
Australia Meat 1,565,819 1,630,007
Australia Smallgoods 1,731,717 1,802,725
Vivera 1,814,809 —
Others CGUs without significant goodwill 4,546,456 4,732,554
Total 30,374,143 29,066,794
CGU groups containing goodwill are tested for impairment annually and for the year ended December 31, 2020 there were no events or circumstances that indicate that the recoverable amount may be less than the carrying amount and no expense was recorded. For the six month period ended June 30, 2021 there were no events or circumstances that indicate that the recoverable amount may be less than the carrying amount.
17 Trade accounts payableCompany Consolidated
June 30, 2021 December 31, 2020 June 30, 2021 December 31, 2020Commodities 2,272,289 2,802,807 6,402,527 7,523,282
Materials and services 1,205,792 1,039,861 15,494,619 14,543,549
Finished products 256,782 196,283 210,572 145,853
Present value adjustment (3,681) (1,605) (34,324) (15,243)
Subtotal 3,731,182 4,037,346 22,073,394 22,197,441 Supply chain finance 487,878 473,525 3,461,127 2,101,001
Total 4,219,060 4,510,871 25,534,521 24,298,442
In its normal course of business and in order to guarantee cattle supply, the Company enters into purchase agreements for livestock with certain suppliers, including the related party JBJ Agropecuária. This kind of operation allows suppliers to anticipate the receivables with financial institutions where the Company has approved credit limit and can guarantee a fixed price when purchasing cattle, without a cash impact in the Company until the maturity date of these commitments. At June 30, 2021 and December 31, 2020, the Company had commitments to purchase livestock cattle in the amount of R$138,770 and R$128,127, respectively, of which R$70,000 and R$100,559, were with JBJ Agropecuária, respectively. (Company and Consolidated).
JBS S.A.Notes to the condensed financial statements for the six month period ended June 30, 2021 and 2020(Expressed in thousands of Brazilian reais)
27

18 Loans and financingsCompany
Average annual
interest rate Currency
Index on variable rate
loans
Payment terms / non-current debt
Current (*) Non-current
Type June 30, 2021December 31,
2020 June 30, 2021December 31,
2020
Foreign currencyACC - Advances on exchange contracts 3.17% USD — 2022 - 24 3,287,233 703,871 746,376 —
Prepayment 2.67% USD Libor 2024 505,727 — 275,121 —
Working capital - Dollar 3.60% USD Libor 2030 1,628 1,971 16,529 17,721 Credit Note - Export 2.68% USD — * 378,095 — — —
FINIMP 3.54%USD and
EURLibor and Euribor 2022 - 25 143,839 101,278 160,765 165,278
4,316,522 807,120 1,198,791 182,999 Local currencyCredit note - export 7.93% BRL CDI 2022 - 23 301,420 756,575 1,190,473 895,236 Working capital - Brazilian Reais 7.73% BRL TJLP 2022 - 23 632 587 136,733 136,168 FINAME 5.25% BRL TJLP 2023 - 25 6,350 8,324 9,729 12,799 FINEP 8.37% BRL — 2025 8,154 18,138 14,065 16,345 CDC - Direct credit to consumers 7.74% BRL — 2022 - 24 89,093 75,857 42,391 60,896 CRA - Agribusiness Credit Receivable Certificates 5.79% BRL CDI and IPCA 2023 - 31 174,905 34,214 3,954,865 2,354,875
580,554 893,695 5,348,256 3,476,319
4,897,076 1,700,815 6,547,047 3,659,318
Consolidated
Average annual
interest rate Currency Indexer
Payment terms / non-current debt
Current (*) Non-current
TypeJune 30,
2021December 31,
2020 June 30, 2021December 31,
2020
Foreign currencyACC - Advances on exchange contracts 3.17% USD — 2022 - 24 3,287,230 703,871 746,378 —
Prepayment 2.70% USD Libor 2024 1,241,230 767,607 2,069,208 2,236,916
Credit note – export 2.68% USD — * 378,095 — — —
FINIMP 3.54% USD and EUR Libor and Euribor 2022 - 25 186,342 150,456 160,765 167,587
Scott credit facilities 4.97% USD — 2023 1,671 1,803 5,157 6,454 White Stripe credit facility 3.40% USD and CAD — * 5,783 3,955 — —
Working capital - Dollar 3.60% USD Libor 2030 1,628 1,971 16,529 17,721
Other 5.89% AED — * 479 — — —
5,102,458 1,629,663 2,998,037 2,428,678 Local currencyFINAME 5.26% BRL TJLP 2023 - 25 6,389 8,513 9,729 12,799 FINEP 8.37% BRL — 2025 8,154 18,138 14,065 16,345 Notes 5.75% JBS Lux 2025 — — — — — 11,329 — 5,442,125 Notes 5.75% PPC 2025 — — — — — 85,491 — 5,179,666 Notes 7,0% JBS Lux 2026 7.00% USD — 2026 158,540 162,174 4,973,869 5,162,836 Notes 5.875% PPC 2027 5.88% USD — 2027 61,062 63,436 4,199,428 4,358,389 Notes 5,75% JBS Lux 2028 5.75% USD — 2028 97,673 99,884 3,727,589 3,868,766 Notes 6.75% JBS Lux 2028 6.75% USD — 2028 112,269 116,635 4,472,538 4,644,120 Notes 6.5% JBS Lux 2029 6.50% USD — 2029 92,306 95,895 7,016,802 7,290,513 Notes 5.50% JBS Lux 2030 5.50% USD — 2030 155,709 161,768 6,205,630 6,444,043 Notes 3,75% JBS Lux 2031 3.75% USD — 2031 7,818 — 2,479,771 —
Notes 4,25% JBS Lux 2031 4.25% USD — 2031 47,241 — 4,910,110 —
Notes 3,625% JBS Finance 2032 3.63% USD — 2032 8,059 — 4,912,311 —
Term loan JBS Lux 2026 2.09% USD Libor 2026 112,530 115,414 9,145,639 9,535,082 PPC term loan 1.52% USD Libor 2023 127,876 132,448 2,241,816 2,188,746 Working capital - Brazilian Reais 7.73% BRL TJLP 2022 - 23 632 587 136,732 136,168 Working capital - Euros 0.73% EUR Euribor 2023 51,063 67,058 5,020 5,407 Working capital - Pounds 1.50% GBP — * 3,236 — — —
Credit note – export 7.02% BRL CDI 2022 - 24 732,635 784,154 1,708,708 1,812,616 CDC - Direct credit to consumers 7.75% BRL — 2022 - 24 89,283 76,063 42,391 60,983 Rural - Credit note 5.77% BRL CDI 2022 40,737 40,178 59,896 59,739 Rural - Credit note - Pre fixed 3.35% BRL — * 211,881 788,286 — —
CRA - Agribusiness Credit Receivable Certificates 5.79% BRL CDI and IPCA 2023 - 31 174,905 34,214 3,954,865 2,354,875
Scott credit facilities 4.44%USD, EUR and
AUD — 2023 20,894 44,240 2,381 2,515 Beardstown Pace credit facility 2.74% USD — 2035 - 50 1,266 1,169 81,381 85,517 JBS Australia Feedlot Agreement 7.75% AUD — 2023 — — 189,834 197,615
Other 1.50% Others Others 2022 - 26 24,443 25,364 95,182 57,061 2,346,601 2,932,438 60,585,687 58,915,926
7,449,059 4,562,101 63,583,724 61,344,604
JBS S.A.Notes to the condensed financial statements for the six month period ended June 30, 2021 and 2020(Expressed in thousands of Brazilian reais)
28

(*) Balances classified as current which have their maturities up to the next twelve months following the closing period of these financial statements.
Average annual interest rate: Refers to the weighted average nominal cost of interest at the reporting date. The loans and financings are fixed by a fixed rate or indexed to rates: CDI, TJLP, LIBOR and EURIBOR, among others.
The availability under JBS USA revolving credit facilities was US$2 billion (R$10.255 billion at June 30, 2021) and US$1.9 billion (R$10.2 billion at December 31, 2020).
The non-current portion of the principal payment schedule of loans and financing is as follows:
June 30, 2021Maturity Company Consolidated
2022 1,384,711 1,956,897 2023 701,715 4,167,144 2024 1,045,851 1,941,828 2025 7,986 121,167 2026 1,919 13,799,006 Maturities thereafter 2026 3,404,865 41,597,682
6,547,047 63,583,724
18.1 Guarantees and contractual restrictions ("covenants")
The Company was in compliance with all of its debt covenant restrictions at June 30, 2021 and until the date that these financial statements were approved.
19 Accrued income taxes and other taxes:
Company Consolidated
June 30, 2021 December 31, 2020 June 30, 2021 December 31, 2020Taxes payable in installments 841,383 792,968 890,581 839,863 PIS / COFINS tax payable 92,421 88,355 162,026 157,890 ICMS / VAT / GST tax payable 65,157 60,576 143,825 124,862 Withholding income taxes 24,594 27,163 77,406 80,154 Others 3,506 2,749 302,148 314,026 Subtotal 1,027,061 971,811 1,575,986 1,516,795 Accrued income taxes — — 226,076 206,433 Total 1,027,061 971,811 1,802,062 1,723,228
Breakdown:Current liabilities 340,555 312,888 935,743 883,053 Non-current liabilities 686,506 658,923 866,319 840,175
1,027,061 971,811 1,802,062 1,723,228
Decree 8,426/2015 - PIS/COFINS over financial income: In July 2015, the Company and its subsidiaries filed an injunction to suspend the enforceability of PIS and COFINS debts over financial income. The Decree 8,426/2015 reestablished the levy of PIS and COFINS on financial revenues obtained by companies subject to the PIS and COFINS non cumulative regime, at the rates of 4.65%. As of June 30, 2021 and December 31, 2020, the Company has recognized under the caption "Accrued income taxes and other taxes" the amount of R$92,421 and R$88,355 in the Company, respectively, and in the Consolidated R$154,104 and R$149,054, respectively, regarding to PIS/COFINS over financial income.
20 Accrued payroll and social chargesCompany Consolidated
June 30, 2021 December 31, 2020 June 30, 2021 December 31, 2020Taxes payable in installments 2,902,939 3,106,335 2,961,780 3,170,262 Bonus and vacation along with related social charges 325,883 219,684 3,626,916 3,979,650 Salaries and related social charges 214,615 410,704 2,145,309 2,392,508 Others 12,473 8,693 252,920 250,049
3,455,910 3,745,416 8,986,925 9,792,469 Breakdown:Current liabilities 892,978 893,008 5,470,708 5,677,401 Non-current liabilities 2,562,932 2,852,408 3,516,217 4,115,068
3,455,910 3,745,416 8,986,925 9,792,469
JBS S.A.Notes to the condensed financial statements for the six month period ended June 30, 2021 and 2020(Expressed in thousands of Brazilian reais)
29

21 Provisions
The Company is part of several lawsuits arising in the ordinary course of business for which provisions are recognized based on estimated costs determined by management as follows:
Company ConsolidatedJune 30, 2021 December 31, 2020 June 30, 2021 December 31, 2020
Labor 293,591 319,018 748,658 665,439
Civil 50,670 46,279 2,201,762 290,257
Tax and Social Security 168,482 157,183 461,638 457,742
Total 512,743 522,480 3,412,058 1,413,438
Breakdown: Company ConsolidatedJune 30, 2021 December 31, 2020 June 30, 2021 December 31, 2020
Current liabilities (*) — — 2,043,399 —
Non-current liabilities 512,743 522,480 1,368,659 1,413,438 512,743 522,480 3,412,058 1,413,438
(*) Given the materiality of the accrual, JBS USA Antitrust Agreements that were recognized under the caption "Other current liabilities", to allow better presentation, are now disclosed as "Provisions".
Changes in provisionsCompany
December 31, 2020
Additions, disposals and changes in
prognosis PaymentsMonetary correction June 30, 2021
Labor 319,018 46,629 (77,344) 5,288 293,591 Civil 46,279 3,543 (3,174) 4,022 50,670 Tax and social security 157,183 14,547 (10,787) 7,539 168,482 Total 522,480 64,719 (91,305) 16,849 512,743
Consolidated
December 31, 2021
Additions, disposals and changes in
prognosis PaymentsMonetary correction
Exchange rate variation June 30, 2021
Labor 665,439 238,493 (159,731) 13,025 (8,568) 748,658 Civil 290,257 2,248,697 (237,141) 17,182 (117,233) 2,201,762 Tax and social security 457,742 9,350 (12,201) 6,922 (175) 461,638 Total 1,413,438 2,496,540 (409,073) 37,129 (125,976) 3,412,058
Investigative and judicial related procedures
In accordance to the resolution approved at the Extraordinary General Shareholders' Meeting ("AGE"), held on October 30, 2020, the Company submitted to the Market Arbitration Chamber, on January 28, 2021, a request for the establishment of arbitration in view of: i) its direct and indirect controlling shareholders, J&F Investimentos S.A., Joesley Mendonça Batista and Wesley Mendonça Batista; and ii) ex-administrators Francisco de Assis e Silva and Florisvaldo Caetano de Oliveira. The proceeding is ongoing.
The other criminal investigations proceedings, class actions, and the corporate lawsuits (CVM) are ongoing and the Company has been collaborating with the investigations. There are no relevant changes in the proceedings aforementioned since the financial statements from December 31, 2020.
In the subsidiary JBS USA:
a. Labor Agreement - Chicken: Refers to several purported class action lawsuits against PPC and a number of other chicken producers, alleging that the defendants conspired to fix and depress the compensation paid to Plant Workers in violation of the Sherman Act and seek damages for the workers. The indirect subsidiary PPC recognized an accrual in the amount of US$29 million (R$145,064 at June 30, 2021).
b. Antitrust Agreement - Chicken: During 2016, a series of purported federal class action lawsuits were filed with the US District Court for the Northern District of Illinois, USA, against PPC and 19 other defendants by and on behalf of direct and indirect purchasers of broiler chickens alleging violations of federal and state antitrust and unfair competition laws. The indirect subsidiary PPC recognized an accrual in the amount of US$120.5 million (R$602,765 at June 30, 2021). Also, PPC estimated an accrual for potential losses in future agreements in the amount of US$251.3 million (R$1.26 billion at June 30, 2021).
c. Antitrust Agreement - Pork: Refers to several purported class action lawsuits were filed against JBS USA and a number of other pork producers on behalf of direct and indirect purchasers of pork alleging violations of federal and state antitrust, unfair competition, unjust enrichment, deceptive trade practice, and consumer protection laws. The indirect subsidiary JBS USA estimated an accrual for potential losses in future agreements in the amount of US$17.5 million (R$87,539 at June 30, 2021).
JBS S.A.Notes to the condensed financial statements for the six month period ended June 30, 2021 and 2020(Expressed in thousands of Brazilian reais)
30
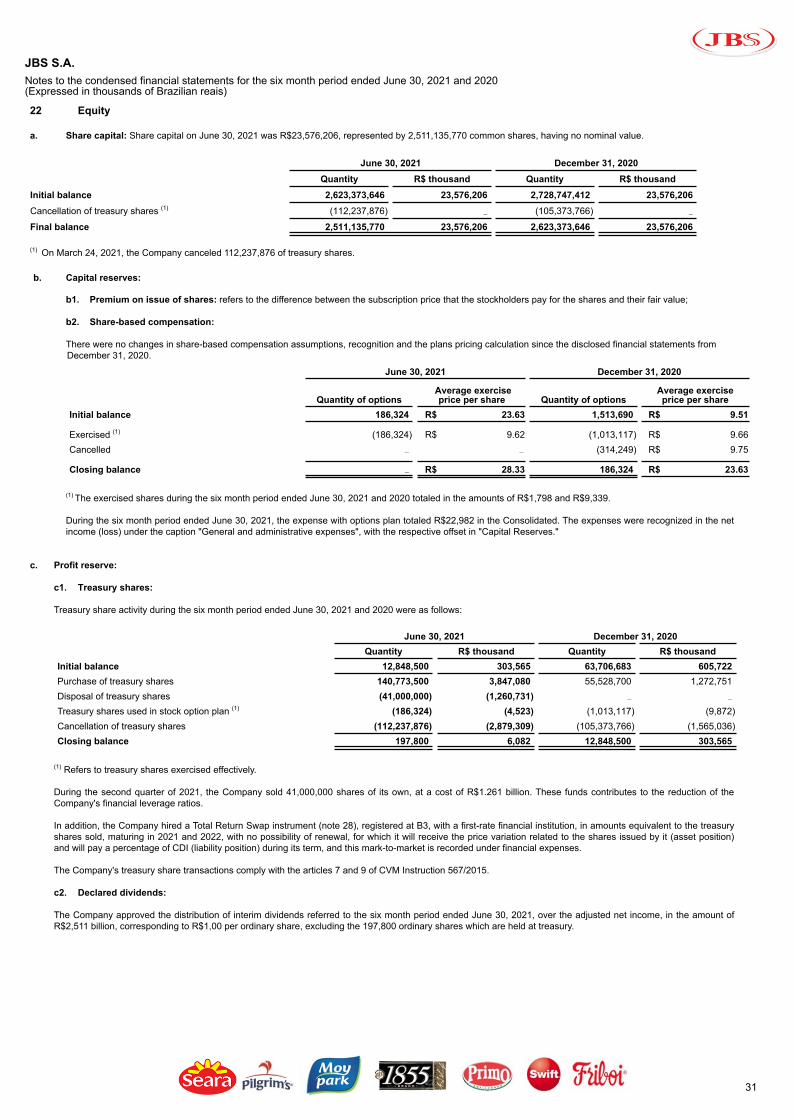
22 Equity
a. Share capital: Share capital on June 30, 2021 was R$23,576,206, represented by 2,511,135,770 common shares, having no nominal value.
June 30, 2021 December 31, 2020Quantity R$ thousand Quantity R$ thousand
Initial balance 2,623,373,646 23,576,206 2,728,747,412 23,576,206 Cancellation of treasury shares (1) (112,237,876) — (105,373,766) —
Final balance 2,511,135,770 23,576,206 2,623,373,646 23,576,206
(1) On March 24, 2021, the Company canceled 112,237,876 of treasury shares.
b. Capital reserves:
b1. Premium on issue of shares: refers to the difference between the subscription price that the stockholders pay for the shares and their fair value;
b2. Share-based compensation:
There were no changes in share-based compensation assumptions, recognition and the plans pricing calculation since the disclosed financial statements from December 31, 2020.
June 30, 2021 December 31, 2020
Quantity of options Average exercise
price per share Quantity of optionsAverage exercise price per share
Initial balance 186,324 R$ 23.63 1,513,690 R$ 9.51
Exercised (1) (186,324) R$ 9.62 (1,013,117) R$ 9.66Cancelled — — (314,249) R$ 9.75
Closing balance — R$ 28.33 186,324 R$ 23.63
(1) The exercised shares during the six month period ended June 30, 2021 and 2020 totaled in the amounts of R$1,798 and R$9,339.
During the six month period ended June 30, 2021, the expense with options plan totaled R$22,982 in the Consolidated. The expenses were recognized in the net income (loss) under the caption "General and administrative expenses", with the respective offset in "Capital Reserves."
c. Profit reserve:
c1. Treasury shares:
Treasury share activity during the six month period ended June 30, 2021 and 2020 were as follows:
June 30, 2021 December 31, 2020Quantity R$ thousand Quantity R$ thousand
Initial balance 12,848,500 303,565 63,706,683 605,722 Purchase of treasury shares 140,773,500 3,847,080 55,528,700 1,272,751 Disposal of treasury shares (41,000,000) (1,260,731) — —
Treasury shares used in stock option plan (1) (186,324) (4,523) (1,013,117) (9,872) Cancellation of treasury shares (112,237,876) (2,879,309) (105,373,766) (1,565,036) Closing balance 197,800 6,082 12,848,500 303,565
(1) Refers to treasury shares exercised effectively.
During the second quarter of 2021, the Company sold 41,000,000 shares of its own, at a cost of R$1.261 billion. These funds contributes to the reduction of the Company's financial leverage ratios.
In addition, the Company hired a Total Return Swap instrument (note 28), registered at B3, with a first-rate financial institution, in amounts equivalent to the treasury shares sold, maturing in 2021 and 2022, with no possibility of renewal, for which it will receive the price variation related to the shares issued by it (asset position) and will pay a percentage of CDI (liability position) during its term, and this mark-to-market is recorded under financial expenses.
The Company's treasury share transactions comply with the articles 7 and 9 of CVM Instruction 567/2015.
c2. Declared dividends:
The Company approved the distribution of interim dividends referred to the six month period ended June 30, 2021, over the adjusted net income, in the amount of R$2,511 billion, corresponding to R$1,00 per ordinary share, excluding the 197,800 ordinary shares which are held at treasury.
JBS S.A.Notes to the condensed financial statements for the six month period ended June 30, 2021 and 2020(Expressed in thousands of Brazilian reais)
31

23 Net revenueCompany Consolidated
Six month period ended June 30,
Three month period ended June 30,
Six month period ended June 30, 2021
Three month period ended June 30,
2021 2020 2021 2020 2021 2020 2021 2020GROSS REVENUESales of productsDomestic sales 14,547,162 9,823,431 7,385,012 4,439,197 124,553,607 95,110,929 65,774,717 51,232,043 Export sales 9,841,936 7,526,293 5,427,918 4,401,276 41,217,735 32,670,549 22,364,148 18,160,054
24,389,098 17,349,724 12,812,930 8,840,473 165,771,342 127,781,478 88,138,865 69,392,097 SALES DEDUCTIONReturns and discounts (644,629) (613,917) (315,669) (311,781) (3,169,676) (2,587,169) (1,620,763) (1,256,636) Sales taxes (562,171) (348,149) (284,169) (155,855) (1,723,521) (1,130,599) (891,175) (553,131)
(1,206,800) (962,066) (599,838) (467,636) (4,893,197) (3,717,768) (2,511,938) (1,809,767) NET REVENUE 23,182,298 16,387,658 12,213,092 8,372,837 160,878,145 124,063,710 85,626,927 67,582,330
24 Finance income (expense)Company Consolidated
Six month period ended June 30,
Three month period ended June 30,
Six month period ended June 30, 2021
Three month period ended June 30,
2021 2020 2021 2020 2021 2020 2021 2020Exchange rate variation 396,333 (4,471,065) 183,026 (835,860) 527,249 (10,154,897) 629,097 (1,947,077)
Fair value adjustments on derivatives (173,279) (77,322) (122,496) (101,630) (494,409) 148,864 (639,926) (95,074)
Interest expense (1) (957,462) (948,846) (495,104) (454,955) (2,342,356) (2,457,060) (1,154,609) (1,242,867)
Interest income (2) 227,519 155,962 104,642 70,067 387,667 233,700 199,812 100,639
Taxes, contribution, fees and others (3) (40,643) (37,670) (24,629) (16,857) (396,835) (87,511) (180,322) (45,142)
(547,532) (5,378,941) (354,561) (1,339,235) (2,318,684) (12,316,904) (1,145,948) (3,229,521)
Finance income 623,852 180,270 287,668 70,067 1,162,281 477,638 828,909 100,639
Finance expense (1,171,384) (5,559,211) (642,229) (1,409,302) (3,480,965) (12,794,542) (1,974,857) (3,330,160)
(547,532) (5,378,941) (354,561) (1,339,235) (2,318,684) (12,316,904) (1,145,948) (3,229,521)
(1) For the six month period ended June 30, 2021 and 2020, the amounts of R$324,786 and R$188,669 in the Company and R$1,841,311 and R$1,943,442 in the Consolidated refers to interest expenses from loans and financings recognized under the caption "Interest expense".
(2) For the six month period ended June 30, 2021 and 2020, the amounts of R$8,956 and R$19,033 in the Company and R$32,625 and R$55,760 in the Consolidated refers to interest income from short investments recognized under the caption "Interest income".
(3) Under the caption "Taxes, contribution, fees and others" in the six month period ended June 30, 2021, includes the premium payments, in the Consolidated, of the notes 5.75% JBS Lux 2025 and notes 5,75% PPC 2025 in the amount of US$57 millions (R$308,000 at June 30, 2021).
25 Earnings per share
Basic: There were no changes in the basic earnings per share calculation assumptions since the disclosed financial statements from December 31, 2020.
Six month period ended June 30, Three month period ended June 30, 2021 2020 2021 2020
Net income attributable to shareholders 6,427,983 (2,553,779) 4,382,462 3,379,236 Weighted average common shares outstanding 2,535,454 2,728,747 2,535,454 2,728,747 Weighted average - treasury shares (55,586) (62,862) (37,019) (62,862) Weighted average - common shares outstanding (basic) 2,479,868 2,665,885 2,498,435 2,665,885
Basic earnings per share - (R$) 2.59 (0.96) 1.75 1.27
JBS S.A.Notes to the condensed financial statements for the six month period ended June 30, 2021 and 2020(Expressed in thousands of Brazilian reais)
32

26 Operating segments and geographic reporting
There are no changes in the structure of operating segments and geographic reporting since the disclosed financial statements from December 31, 2020.
The information by consolidated operational segment are as follows:
Net revenue Operating income (loss) (1) DepreciationSix month period ended June 30, Six month period ended June 30, Six month period ended June 30,
2021 2020 2021 2020 (*) 2021 2020SegmentsBrazil 24,269,979 16,880,617 285,435 1,199,862 390,307 337,560 Seara 16,779,924 12,225,290 1,184,873 1,597,451 556,420 465,890 Beef USA 66,130,224 53,075,533 9,073,894 6,720,000 712,050 624,014 Pork USA 19,516,067 15,167,090 1,458,448 977,322 421,735 408,206 Chicken USA 37,143,962 28,892,760 2,325,837 443,285 2,107,712 1,809,092 Others 1,783,843 1,228,350 15,775 (102,012) 55,920 48,980 Intercompany elimination (4,745,854) (3,405,930) (907) (905) (4,572) (4,572) Total 160,878,145 124,063,710 14,343,355 10,835,003 4,239,572 3,689,170
Net revenue Operating income (loss) (1) DepreciationThree month period ended June 30, Three month period ended June 30, Three month period ended June 30,
2021 2020 2021 2020 (*) 2021 2020SegmentsBrazil 12,736,715 8,720,977 242,978 1,028,904 196,433 170,432 Seara 8,937,741 6,391,665 517,257 856,776 291,455 222,971 Beef USA 35,711,207 30,063,028 6,689,029 5,897,407 368,709 348,886 Pork USA 10,728,154 8,542,249 646,518 821,828 207,343 235,387 Chicken USA 19,246,050 15,201,882 1,450,951 103,622 1,066,372 1,013,725 Others 932,965 567,149 2,341 (110,502) 29,522 26,462 Intercompany elimination (2,665,905) (1,904,620) (455) (2,152) (2,286) (2,286) Total 85,626,927 67,582,330 9,548,619 8,595,883 2,157,548 2,015,577
June 30, 2021 December 31, 2020Total assetsBrazil 46,339,430 40,989,826 Seara 36,575,399 34,137,413 Beef USA 36,657,979 31,733,149 Pork USA 14,768,737 13,969,791 Chicken USA 40,160,413 39,897,085 Others 80,774,156 88,784,867 Intercompany elimination (82,992,848) (85,710,325) Total 172,283,266 163,801,806
JBS S.A.Notes to the condensed financial statements for the six month period ended June 30, 2021 and 2020(Expressed in thousands of Brazilian reais)
33

Below is net revenue, operating income and depreciation and amortization based on geography, presented for supplemental information.
Geographic reportingNet revenue Operating income (loss) (1) Depreciation
Six month period ended June 30, Six month period ended June 30, Six month period ended June 30,2021 2020 2021 2020 (*) 2021 2020
United States of America 120,831,233 95,371,917 12,830,176 8,073,707 3,267,716 2,865,812 South America 40,220,737 28,635,272 1,470,149 2,801,879 956,416 812,274 Others 1,548,177 1,117,364 44,058 (39,079) 20,012 15,656 Intercompany elimination (1,722,002) (1,060,843) (1,028) (1,504) (4,572) (4,572) Total 160,878,145 124,063,710 14,343,355 10,835,003 4,239,572 3,689,170
Geographic reportingNet revenue Operating income (loss) (1) Depreciation
Three month period ended June 30, Three month period ended June 30, Three month period ended June 30, 2021 2020 2021 2020 (*) 2021 2020
United States of America 64,646,757 52,821,009 8,776,689 6,742,633 1,656,253 1,611,194 South America 21,174,649 14,863,405 752,199 1,872,167 492,741 402,088 Others 818,555 523,499 20,273 (16,166) 10,840 4,581 Intercompany elimination (1,013,034) (625,583) (542) (2,751) (2,286) (2,286) Total 85,626,927 67,582,330 9,548,619 8,595,883 2,157,548 2,015,577
Total assets by geographic area:
June 30, 2021 December 31, 2020Total assetsUnited States of America 139,286,347 138,480,816 South America 80,205,783 73,975,311 Others 32,507,360 35,389,020 Intercompany elimination (79,716,224) (84,043,341) Total 172,283,266 163,801,806
(1) - The operating income is reconciled with the consolidated net income, as follows below:Operating income
Six month period ended June 30, Three month period ended June 30, 2021 2020 (*) 2021 2020 (*)
Net income (loss) 6,363,734 (2,540,467) 4,208,155 3,346,624 Income tax and social contribution - current and deferred 3,366,094 969,482 2,039,436 1,868,585 Finance (income) expense, net 2,318,684 12,316,904 1,145,948 3,229,521 Share of profit of equity-accounted investees, net of tax (38,880) (18,034) (12,169) (4,929) Operating profit 12,009,632 10,727,885 7,381,370 8,439,801 DOJ and Antitrust agreements (2) 2,381,260 — 2,188,890 —
"Fazer o Bem Faz Bem" program (3) 35,137 115,272 7,972 115,272 Extemporaneous tax credit impacts (4) (109,583) — (55,593) —
JBS Found For The Amazon (5) 7,000 — 6,500 —
Other operating expense/income (6) 19,909 (8,154) 19,480 40,810 Net operating profit 14,343,355 10,835,003 9,548,619 8,595,883
(*) The comparative balances from June 30, 2020 are being presented in an adjusted manner in the Brazil segment, due to the materiality of the donations, so the donations are adjusted comparatively and cumulatively.
(2) Refers to the Agreements entered by JBS USA and its subsidiaries.
(3) As described in footnote 1- Operating activities, item a1. - Analysis of the impacts from Covid-19 pandemic and "Fazer o Bem Faz Bem" program.
(4) Refers to the recognition of PIS/ COFINS tax credits in the ICMS tax base.
(5) As described in footnote 1- Operating activities, item a15.
(6) Refers to several adjustments basically in JBS USA's jurisdiction such as third party advisory expenses related to restructuring projects, marketing of social programs, among others.
JBS S.A.Notes to the condensed financial statements for the six month period ended June 30, 2021 and 2020(Expressed in thousands of Brazilian reais)
34

27 Expenses by nature
The Company’s policy is to present expenses by function on the consolidated statement of income (loss). Expenses by nature are disclosed below:
Company ConsolidatedSix month period ended
June 30, Three month period ended
June 30, Six month period ended
June 30, 2021Three month period ended
June 30,
2021 2020 2021 2020 2021 2020 2021 2020
Cost of sales
Cost of inventories, raw materials and production inputs (19,504,172) (12,149,665) (10,159,896) (5,879,889) (113,859,374) (85,508,516) (59,405,990) (43,817,980)
Salaries and benefits (817,461) (733,639) (416,717) (357,985) (15,761,286) (13,539,798) (7,876,187) (7,474,772)
Depreciation and amortization (179,615) (187,190) (89,663) (95,635) (3,664,740) (3,213,087) (1,863,784) (1,759,354)
(20,501,248) (13,070,494) (10,666,276) (6,333,509) (133,285,400) (102,261,401) (69,145,961) (53,052,106)
General and administrative
Salaries and benefits (619,181) (608,665) (323,607) (303,274) (2,810,823) (2,541,458) (1,442,762) (1,376,007)
Fees, services held and general expenses (394,363) (446,595) (225,402) (279,656) (1,590,094) (1,493,356) (890,473) (956,757)
Depreciation and amortization (135,385) (87,481) (67,223) (38,650) (422,534) (351,593) (210,672) (190,479)
Antitrust agreements — — — — (2,381,260) — (2,188,890) —
"Fazer o Bem Faz Bem" program (35,137) — (7,972) — (35,137) — (7,972) —
JBS Found For The Amazon (6,500) — (6,000) — (7,000) — (6,500) —
(1,190,566) (1,142,741) (630,204) (621,580) (7,246,848) (4,386,407) (4,747,269) (2,523,243)
Selling
Freights and selling expenses (917,534) (864,069) (479,096) (425,816) (7,185,958) (5,718,655) (3,745,824) (3,036,878)
Allowance for doubtful accounts (18,872) (12,318) (9,521) (8,382) (33,233) (29,849) (18,933) (9,925)
Salaries and benefits (89,269) (82,711) (44,660) (38,687) (433,598) (371,470) (227,783) (188,102)
Depreciation and amortization (35,965) (43,933) (18,894) (22,374) (152,298) (124,490) (83,092) (65,744)
Advertising and marketing (33,962) (27,836) (22,744) (12,661) (605,825) (385,436) (322,732) (197,951)
Commissions (63,116) (35,669) (37,563) (15,975) (148,421) (103,079) (80,376) (49,152)
(1,158,718) (1,066,536) (612,478) (523,895) (8,559,333) (6,732,979) (4,478,740) (3,547,752)
As of June 30, 2021, other income (expenses) includes gain (losses) of sale of assets and extemporaneous tax credits gain in the Company, and in the Consolidated, gain (losses) of sale of assets, third party advisory expenses related to corporate restructures, extemporaneous tax credits gain, among others.
28 Risk management and financial instruments
Financial instruments are recognized in the consolidated financial statements as follows:
Company ConsolidatedNotes June 30, 2021 December 31, 2020 June 30, 2021 December 31, 2020
AssetsFair value through profit or lossFinancial investments 5 2,143,429 142,779 5,423,737 3,939,077 National treasury bills 5 112,441 142,924 132,153 244,096 Derivative assets 93,910 51 602,855 228,840 Loans and receivables at amortized costCash at banks 5 2,993,622 3,066,208 11,284,710 15,496,570 Margin cash 5 48,984 — 1,281,133 —
Trade accounts receivable 6 2,774,960 2,871,612 16,414,935 14,001,211 Related party receivables 10 3,527,880 1,872,127 366,131 382,019
Total 11,695,226 8,095,701 35,505,654 34,291,813 LiabilitiesLiabilities at amortized costLoans and financing 18 (11,444,123) (5,360,133) (71,032,783) (65,906,705)Trade accounts payable and supply chain finance 17 (4,219,060) (4,510,871) (25,534,521) (24,298,442)Related party payables 10 (4,916,976) 0 — —
Other financial liabilities (13,489) (26,143) (103,092) (124,290)Fair value through profit or lossDerivative liabilities (242,992) (21,087) (1,181,995) (287,536)
Total (20,836,640) (9,918,234) (97,852,391) (90,616,973)
Fair value through profit or loss: (i) CDBs are updated at the effective rate but have a really short-term and negotiated with financial institutions, and their recognition is similar to fair value; (ii) national treasury bill are recognized according to market value.
Amortized cost: (i) loans and receivables are classified as amortized cost, but without any change in their nature or business model; (ii) the accounts receivable are short-term and net from expected losses.
JBS S.A.Notes to the condensed financial statements for the six month period ended June 30, 2021 and 2020(Expressed in thousands of Brazilian reais)
35

Fair value of assets and liabilities carried at amortized cost:
The fair value of the Notes under Rule 144-A and Regulation S, are estimated using the closing sale price of these securities informed by a financial newswire on June 30, 2021 and 2020, considering there is an active market for these financial instruments. The book value of the remaining fixed-rate loans approximates fair value since the interest rate market, the Company’s credit quality, and other market factors have not significantly changed since entering into the loans. The book value of variable-rate loans and financings approximates fair value given the interest rates adjust for changes in market conditions and the quality of the Company’s credit rating has not substantially changed. For all other financial assets and liabilities, book value approximates fair value due to the short duration of the instruments. The following details the estimated fair value of loans and financings:
Consolidated
Description
June 30, 2021 December 31, 2020
PrincipalPrice (% of the
Principal)Market Value of
the Principal PrincipalPrice (% of the
Principal)Market Value of
the Principal
JBS Lux 5.75% Notes 2025 — — — 5,456,535 102.10 5,571,123 JBS Lux 7.00% Notes 2026 5,002,201 105.75 5,289,828 5,196,700 107.95 5,609,838 JBS Lux 5.75% Notes 2028 3,751,651 106.55 3,997,384 3,897,525 108.00 4,209,327 JBS Lux 6.75% Notes 2028 4,501,981 110.25 4,963,434 4,677,030 112.16 5,245,944 JBS Lux 6.5% Notes 2029 7,003,081 112.64 7,888,341 7,275,380 116.43 8,470,944 JBS Lux 5.50% Notes 2030 6,252,751 112.25 7,018,713 6,495,875 114.65 7,447,521 JBS Lux 3,75% Notes 2031 2,501,100 103.55 2,589,890 — — —
Finance Lux 3,625% Notes 2032 5,002,201 99.66 4,984,943 — — —
PPC 5.75% Notes 2025 — — — 5,196,700 102.45 5,324,071 PPC 5,875% Notes 2027 4,251,871 106.79 4,540,658 4,417,195 107.29 4,739,165 PPC 4,25% Notes 2031 5,002,201 103.63 5,183,531 — — —
43,269,038 46,456,722 42,612,940 46,617,933
Risk management:
The Company during the regular course of its operations is exposed to a variety of financial risks that include the effects of changes in market prices, (including foreignexchange, interest rate risk and commodity price risk), credit risk and liquidity risk. Such risks are fully disclosed in the financials statements at December 31, 2020. Therewere no changes in the nature of these risks in the current period.
JBS S.A.Notes to the condensed financial statements for the six month period ended June 30, 2021 and 2020(Expressed in thousands of Brazilian reais)
36

a. Interest rate risk
The Company understands that the quantitative data referring to the risk of exposure to the Company's interest rates on June 30, 2021 and December 31, 2020, shown below, are in accordance with the Financial and Commodity Risk Management Policy and are representative of the exposure incurred during the period.
Company Consolidated June 30, 2021 December 31, 2020 June 30, 2021 December 31, 2020
Liabilities and assets exposure to the CDI rate net:CRA - Agribusiness Credit Receivable Certificates (60,001) (59,821) (60,001) (59,821) Credit note - export (589,730) (1,651,811) (1,539,180) (2,596,770) Rural - Credit note - Pre fixed — — (100,634) (99,917) Related party transactions 3,136,425 1,475,883 — —
CDB-DI (Bank certificates of deposit) 142,199 142,779 3,119,858 2,105,833 Margin cash — — 225,336 —
Subtotal 2,628,893 (92,970) 1,645,379 (650,675) Derivatives (DI) — 69,550 — 69,550 Derivatives (Swap) (4,990,089) — (4,167,952) 824,304 Total (2,361,196) (23,420) (2,522,573) 243,179 Liabilities exposure to the LIBOR rate:Prepayment (505,062) — (3,034,653) (3,004,523) FINIMP (248,179) (195,424) (254,491) (195,424) Term loan JBS Lux 2026 — — (9,258,169) (9,650,496) PPC term loan — — (2,175,417) (2,321,195) PPC Credit Facility — — (194,275) —
Working Capital - Dollars (18,157) (19,692) (18,157) (19,692) Others — — (385) (390) Subtotal (771,398) (215,116) (14,935,547) (15,191,720) Derivatives (Swap) — — 9,606,324 10,346,975 Total (771,398) (215,116) (5,329,223) (4,844,745) Liabilities exposure to the IPCA rate:Treasury bills 112,441 142,924 278,190 142,924 Margin cash 48,984 — 48,984 —
CRA - Agribusiness Credit Receivable Certificates (4,069,769) (2,329,268) (4,069,769) (2,329,268) Subtotal (3,908,344) (2,186,344) (3,742,595) (2,186,344) Derivatives (Swap) 3,815,362 1,093,752 3,815,362 1,093,752 Total (92,982) (1,092,592) 72,767 (1,092,592) Liabilities exposure to the TJLP rate:CDB-DI (Bank certificates of deposit) — — — (190) FINAME (4) (21,123) (4) (21,123) Working capital - Brazilian Reais (51,732) (51,168) (51,732) (51,168) Total (51,736) (72,291) (51,736) (72,481)
Sensitivity analysis:Scenario (I) VaR 99% I.C. 1 day Scenario (II) Interest rate variation - 25% Scenario (III) Interest rate variation - 50%
Contracts exposure Risk
Current scenario Rate
Effect on income
Rate
Effect on income
Rate
Effect on income
Company Consolidated Company Consolidated Company Consolidated
CDI Increase 4.1500% 4.1704% (482) (515) 5.1880% (24,509) (26,184) 6.2250% (48,995) (52,343)
Libor Increase 0.2463% 0.2463% — (1) 0.3080% (476) (3,291) 0.3690% (947) (6,542)
IPCA Decrease 8.0600% 8.0340% 24 (19) 6.0450% 1,874 (1,466) 4.0300% 3,747 (2,933)
TJLP Increase 4.6100% 4.6110% (1) (1) 5.7630% (597) (597) 6.9150% (1,193) (1,193)
(459) (536) (23,708) (31,538) (47,388) (63,011)
The Company is exposed to rates such as Euribor and IRS that are not significant since their impact on net income (loss) in a scenario with a interest rate variation of 50% is less than R$10,000.
Company/ConsolidatedJune 30, 2021 December 31, 2020
Instrument Risk factor Nature Quantity Notional Fair value Quantity Notional Fair valueFuture contracts DI Short — — — 755 (69,550) (60)
JBS S.A.Notes to the condensed financial statements for the six month period ended June 30, 2021 and 2020(Expressed in thousands of Brazilian reais)
37

Company
June 30, 2021 December 31, 2020
Instrument Risk factorMaturity
NotionalFair value
(Asset) - R$Fair value
(Liability) - R$ Fair value NotionalFair value
(Asset) - R$
Fair value (Liability) -
R$ Fair value
Swap
JBSS3 2021 326.430 320.100 (330.303) (10.203) - - - -PRE USD 2022 431.850 382.120 (444.800) (62.680) - - - -
JBSS3 2022 915.450 873.000 (937.773) (64.773) - - - -IPCA 2024 537.534 620.983 (557.562) 63.421 537.534 628.896 (600.900) 27.995IPCA 2027 387.000 418.187 (421.065) (2.878) - - - -IPCA 2028 442.000 486.574 (490.414) (3.840) - - - -IPCA 2030 1.400.000 1.583.876 (1.637.609) (53.733) 400.000 464.857 (472.169) (7.313)IPCA 2031 630.000 705.741 (728.125) (22.384) - - - -
5.070.264 5.390.581 (5.547.651) (157.070) 937.534 1.093.753 (1.073.069) 20.682
Consolidated
June 30, 2021 December 31, 2020
Instrument Risk factor Maturity NotionalFair value
(Asset) - R$Fair value
(Liability) - R$ Fair value NotionalFair value
(Asset) - R$Fair value
(Liability) - R$ Fair value
Swap
JBSS3 2021 326.430 320.100 (330.303) (10.203) - - - -LIBOR 2022 2.063.408 2.065.679 (2.068.070) (2.391) 2.143.639 2.148.030 (2.151.356) (3.326)
PRE USD 2022 431.850 382.120 (444.800) (62.680) - - - -JBSS3 2022 915.450 873.000 (937.773) (64.773) - - - -
CDI 2023 800.000 822.137 (816.171) 5.966 800.000 824.304 (852.543) (28.239)LIBOR 2023 5.002.201 5.025.491 (5.028.117) (2.626) 5.196.700 5.217.217 (5.231.025) (13.808)LIBOR 2024 2.890.160 2.515.154 (2.517.178) (2.024) 3.002.538 2.981.728 (2.994.834) (13.106)IPCA 2024 537.534 620.983 (557.562) 63.421 537.534 628.896 (600.900) 27.995IPCA 2027 387.000 418.187 (421.065) (2.878) - - - -IPCA 2028 442.000 486.574 (490.414) (3.840) - - - -IPCA 2030 1.400.000 1.583.876 (1.637.609) (53.733) 400.000 464.857 (472.169) (7.313)IPCA 2031 630.000 705.741 (728.125) (22.384) - - - -
15.826.033 15.819.042 (15.977.187) (158.145) 12.080.411 12.265.032 (12.302.827) (37.797)
b. Exchange rate risk:
Below are presented the risks related to the most significant exchange rates fluctuation given the relevance of these currencies in the Company's operations and the stressanalysis scenarios and Value at Risk (VaR) to measure the total exposure as well as the cash flow risk with B3 and the Chicago Mercantile Exchange. In the Consolidated, the Company discloses these exposures considering the fluctuations of a exchange rate in particular towards the functional currency of each subsidiary.
Company USD EUR GBP
June 30, 2021December 31,
2020 June 30, 2021December 31,
2020 June 30, 2021December 31,
2020OPERATING Cash and cash equivalents 4,901,228 2,962,153 77,165 49,754 1,453 31,876 Trade accounts receivable 3,716,297 2,300,167 132,487 41,292 78,296 88,538 Sales orders 2,932,524 1,893,232 125,496 48,817 60,210 110,896 Trade accounts payable (121,938) (124,974) (43,839) (49,845) (100) (101) Subtotal 11,428,111 7,030,578 291,309 90,018 139,859 231,209FINANCIALRelated parties transaction, net (4,535,055) 386,827 — — — —
Loans and financing (5,458,888) (918,986) (56,426) (71,131) — —
Subtotal (9,993,943) (532,159) (56,426) (71,131) — —
Total exposure 1,434,168 6,498,419 234,883 18,887 139,859 231,209 DERIVATIVESFuture contracts — (519,150) — — — —
Future contracts DDI — 519,150 — — — —
Swap 382,120 — — — — —
Total derivatives 382,120 — — — — —
NET EXPOSURE IN R$ 1,816,288 6,498,419 234,883 18,887 139,859 231,209
Net debt in foreign subsidiaries (43,667,790) (44,270,963) — — — —
JBS S.A.Notes to the condensed financial statements for the six month period ended June 30, 2021 and 2020(Expressed in thousands of Brazilian reais)
38

Consolidated
USD EUR GBP MXN AUD
June 30, 2021
December 31, 2020
June 30, 2021
December 31, 2020
June 30, 2021
December 31, 2020
June 30, 2021
December 31, 2020
June 30, 2021
December 31, 2020
OPERATING
Cash and cash equivalents 8,428,815 6,295,296 86,219 74,795 4,849 34,193 738,780 1,342,999 345 1,653
Trade accounts receivable 7,005,124 4,641,316 261,141 128,052 110,540 113,929 561,932 567,423 450 14,343
Sales orders 3,104,293 2,021,338 241,695 48,993 60,210 110,896 — — 3,151 5,782
Trade accounts payable (1,398,302) (346,252) (217,807) (292,434) (12,436) (7,532) (1,205,450) (941,128) (415) (9,681)
Provisions for contingencies (126,125) (126,733) — — — — — — — —
Income tax payable — — — — — — — — — (9,572)
Purchase orders (368,269) (196,762) (182,814) (22,081) — — — — — —
Subtotal 16,645,536 12,288,203 188,434 (62,675) 163,163 251,486 95,262 969,294 3,531 2,525
FINANCIAL
Related party transactions, net (2,208,588) 2,260,315 1,326,584 — — — — — (6,843) (40,529)
Advances to customers (3,969,864) (2,414,510) (223,741) (285,849) — — — — — —
Loans and financing (7,952,571) (4,004,776) (92,617) (116,187) — — — — — —
Subtotal (14,131,023) (4,158,971) 1,010,226 (402,036) — — — — (6,843) (40,529)
Total exposure 2,514,513 8,129,232 1,198,660 (464,711) 163,163 251,486 95,262 969,294 (3,312) (38,004)
DERIVATIVES
Future contracts (268,368) (77,430) — — — — — — — —
Future contracts DDI — 519,150 — — — — — — — —
Deliverable Forwards (DF´s) 325,243 337,900 572,587 322,445 (40,913) (46,677) (1,100,729) (1,163,224) (12,731) (1,575)
Non Deliverable Forwards (NDF´s) 3,210,437 2,338,780 (177,758) (84,732) (100,669) (73,123) — — — —
Swap 380,096 (13,106) — — — — — — — —
Total derivatives 3,647,408 3,105,294 394,829 237,713 (141,582) (119,800) (1,100,729) (1,163,224) (12,731) (1,575)
NET EXPOSURE IN R$ 6,161,921 11,234,526 1,593,489 (226,998) 21,581 131,686 (1,005,467) (193,930) (16,043) (39,579)
Net debt in foreign subsidiaries (43,667,790) (44,270,963) — — — — — — — —
b1. Sensitivity analysis and derivative financial instruments breakdown:
b1.1 US Dollar (amounts in thousands of R$):
Scenario (i) VaR 99% I.C. 1 day Scenario (ii) Interest rate variation - 25% Scenario (iii) Interest rate variation - 50%
Exposure of R$ Risk
Current exchange
rateExchange
rate
Effect on incomeExchange
rate
Effect on incomeExchange
rate
Effect on income
Company Consolidated Company Consolidated Company Consolidated
Operating Appreciation 5.0022 4.8834 (271,413) (395,324) 3.7517 (2,857,028) (4,161,384) 2.5011 (5,714,056) (8,322,768)
Financial Depreciation 5.0022 4.8834 237,352 335,605 3.7517 2,498,486 3,532,756 2.5011 4,996,972 7,065,511
Derivatives Appreciation 5.0022 4.8834 (9,075) (86,624) 3.7517 (95,530) (911,852) 2.5011 (191,060) (1,823,704)
Scenario (i) VaR 99% I.C. 1 dayScenario (ii) Interest rate variation
- 25%Scenario (iii) Interest rate variation
- 50%
Exposure of R$ Risk
Current exchange
rateExchange
rate Effect on incomeExchange
rate Effect on incomeExchange
rate Effect on income
Net debt in foreign subsidiaries Depreciation 5.0022 4.8834 1,037,090 3.7517 10,916,948 2.5011 21,833,895
The Company includes the net debt of foreign subsidiaries in the disclosure of economic hedging exposure. Although these debts do not generate foreign exchange gains or losses (since they are foreign debts and in the functional currency of each respective country), they are translated to Brazilian Reais in the consolidation, impacting the equity as exchange variation of investment, influencing the consolidated debt of the Company, and consequently the leverage indicators.
CompanyJune 30, 2021 December 31, 2020
Instrument Risk factor Nature QuantityNotional
(R$) Fair value QuantidadeNotional
(R$) Fair value
Future Contract American dollar — — — — 1,998 (519,150) (362)
Future Contract DDI — — — — 1,998 519,150 374
JBS S.A.Notes to the condensed financial statements for the six month period ended June 30, 2021 and 2020(Expressed in thousands of Brazilian reais)
39

ConsolidatedJune 30, 2021 December 31, 2020
Instrument Risk factor Nature QuantityNotional
(R$) Fair value QuantidadeNotional
(R$) Fair value
Future Contract American dollar Short 1,073 (268,368) (3,384) 298 (77,430) (1,740)
Future Contract DDI — — — — 1,998 519,150 374
ConsolidatedJune 30, 2021 December 31, 2020
Instrument Risk factor NatureNotional
(USD)Notional
(R$) Fair valueNotional
(USD)Notional
(R$) Fair value
Deliverable Forwards American dollar Long 62,586 325,243 4,997 83,832 337,900 (14,140) Non Deliverable Forwards American dollar Long 617,784 3,210,437 (159,314) 580,242 2,338,780 (64,217)
b1.2 € - EURO (amounts in thousands of R$):
Scenario (i) VaR 99% I.C. 1 day Scenario (ii) Interest rate variation - 25% Scenario (iii) Interest rate variation - 50%
Exposure of R$ RiskCurrent
exchangeExchange
rate
Effect on incomeExchange
rate
Effect on incomeExchange
rate
Effect on income
Company Consolidated Company Consolidated Company Consolidated
Operating Appreciation 5.9276 5.7823 (7,140) (4,619) 4.4457 (72,827) (47,109) 2.9638 (145,655) (94,217)
Financial Appreciation 5.9276 5.7823 1,383 (24,761) 4.4457 14,106 (252,556) 2.9638 28,213 (505,113)
Derivatives Appreciation 5.9276 5.7823 — (9,678) 4.4457 — (98,707) 2.9638 — (197,414)
ConsolidatedJune 30, 2021 December 31, 2020
Instrument Risk factor NatureNotional
(EUR)Notional
(R$) Fair valueNotional
(EUR)Notional
(R$) Fair value
Deliverable Forwards Euro Long 96,597 572,587 1,446 50,557 322,445 (6,839) Non Deliverable Forwards Euro Short (29,988) (177,758) 4,542 (13,285) (84,732) 2,162
b1.3 GBP - British Pound (amounts in thousands of R$):
Scenario (i) VaR 99% I.C. 1 day Scenario (ii) Interest rate variation - 25% Scenario (iii) Interest rate variation - 50%
Exposure of R$ RiskCurrent
exchangeExchange
rate
Effect on incomeExchange
rate
Effect on incomeExchange
rate
Effect on income
Company Consolidated Company Consolidated Company Consolidated
Operating Appreciation 6.9070 6.7237 (3,712) (4,330) 5.1803 (34,964) (40,791) 3.4535 (69,929) (81,581)
Derivatives Depreciation 6.9070 6.7237 — 3,758 5.1803 — 35,396 3.4535 — 70,791
ConsolidatedJune 30, 2021 December 31, 2020
Instrument Risk factor NatureNotional
(GBP)Notional
(R$) Fair valueNotional
(GBP)Notional
(R$) Fair value
Deliverable Forwards British pound Short (5,923) (40,913) (500) (6,573) (46,677) 255
Non Deliverable Forwards British pound Short (14,575) (100,669) (470) (10,298) (73,123) (883)
b1.4 MXN - Mexican Peso (amounts in thousands of R$):
Scenario (i) VaR 99% I.C. 1 dayScenario (ii) Interest rate
variation - 25%Scenario (iii) Interest rate
variation - 50%
Exposure of R$ Risk
Current exchange
rateExchange
rate
Effect on incomeExchange
rate
Effect on incomeExchange
rate
Effect on income
Consolidated Consolidated Consolidated
Operating Appreciation 0.2512 0.2567 2,090 0.3140 23,815 0.3768 47,631
Derivatives Depreciation 0.2512 0.2567 (24,144) 0.3140 (275,182) 0.3768 (550,365)
ConsolidatedJune 30, 2021 December 31, 2020
Instrument Risk factor NatureNotional (MXN)
Notional (R$) Fair value
Notional (MXN)
Notional (R$) Fair value
Deliverable Forwards Mexican peso Short (4,381,884) (1,100,729) 6,828 (4,456,798) (1,163,224) 6,397
JBS S.A.Notes to the condensed financial statements for the six month period ended June 30, 2021 and 2020(Expressed in thousands of Brazilian reais)
40

b1.5 AUD - Australian Dollar (amounts in thousands of R$):
Scenario (i) VaR 99% I.C. 1 dayScenario (ii) Interest rate
variation - 25%Scenario (iii) Interest rate
variation - 50%
Exposure of R$ Risk
Current exchange
rateExchange
rate
Effect on incomeExchange
rate
Effect on incomeExchange
rate
Effect on income
Consolidated Consolidated Consolidated
Operating Appreciation 3.7496 3.8366 82 4.6870 883 5.6244 1,765
Financial Depreciation 3.7496 3.8366 (159) 4.6870 (1,711) 5.6244 (3,422)
Derivatives Depreciation 3.7496 3.8366 (295) 4.6870 (3,183) 5.6244 (6,365)
ConsolidatedJune 30, 2021 December 31, 2020
Instrument Risk factor NatureNotional
(AUD)Notional
(R$) Fair valueNotional
(AUD)Notional
(R$) Fair value
Deliverable Forwards Australian dollar Short (3,395) (12,731) (105) (392) (1,575) (47)
c. Commodity price risk
The Company operates globally across (the entire livestock protein chain and related business ) and during the regular course of its operations brings is exposed to price fluctuations in feeder cattle, live cattle, lean hogs, corn, soybeans, and energy, especially in the American, Australian and Brazilian markets. Commodity markets are characterized by volatility arising from external factors including climate, supply levels, transportation costs, agricultural policies and storage costs, among others. The Risk Management Department is responsible for mapping the exposures to commodity prices of the Company and its subsidiaries and proposing strategies to the Risk Management Committee, in order to mitigate such exposures.
c1. Position balance in commodities (cattle) contracts of the Company:
CompanyEXPOSURE in Commodities (Cattle) June 30, 2021 December 31, 2020Firm contracts of cattle purchase 267,298 164,106Subtotal 267,298 164,106DERIVATIVESFuture contracts (385,806) (57,457) Non Deliverable Forwards (104,940) —
Subtotal (490,746) (57,457) NET EXPOSURE (223,448) 106,649
Sensitivity analysis:
Scenario (i) VaR 99% I.C. 1 day Scenario (ii) @ Variation - 25% Scenario (ii) @ Variation - 50%
Exposure RiskCurrent
price PriceEffect on income
PriceEffect on income
PriceEffect on income
Company Company Company
Operating Cattle arroba depreciation 318.50 326.46 6,682 398.13 66,824 477.75 133,649 Derivatives Cattle arroba appreciation 318.50 326.46 (12,269) 398.13 (122,686) 477.75 (245,373)
Derivatives financial instruments breakdown:Company
June 30, 2021 December 31, 2020
Instrument Risk factor Nature Quantity Notional Fair value Quantity Notional Fair value
Future Contracts Commodities (Cattle) Short 3,679 (385,806) (89) 633 (57,457) 99
Non Deliverable Forwards Commodities (Cattle) Short — (104,940) 8,032 — — —
JBS S.A.Notes to the condensed financial statements for the six month period ended June 30, 2021 and 2020(Expressed in thousands of Brazilian reais)
41

c2. Position balance in commodities (grain) derivatives financial instruments of Seara Alimentos:
Seara AlimentosEXPOSURE in Commodities (Grain) June 30, 2021 December 31, 2020OPERATINGPurchase orders 2,376,792 1,649,586Subtotal 2,376,792 1,649,586DERIVATIVESFuture contracts (524,101) 255,377Brazil Cash basis 55,781 4,923 Non Deliverable Forwards (285,642) —
Subtotal (753,962) 260,300NET EXPOSURE 1,622,830 1,909,886
Sensitivity analysis:
Scenario (i) VaR 99% I.C. 1 day Scenario (ii) Price variation - 25% Scenario (ii) Price variation - 50%
Exposure Risk Price
Effect on income
Price
Effect on income
Price
Effect on income
Seara Alimentos Seara Alimentos Seara Alimentos
Operating Depreciation (2.19)% (51,957) (25.00)% (594,198) (50.00)% (1,188,396) Derivatives Apreciation (2.19)% 16,482 (25.00)% 188,491 (50.00)% 376,981
Derivatives financial instruments breakdown:
Seara AlimentosJune 30, 2021 December 31, 2020
Instrument Risk factor Nature Quantity Notional Fair value Quantity Notional Fair value
Future contracts Commodities (Grains) Short 18,443 (524,101) (7,131) 1,004 255,377 84
Brazil Cash basis Commodities (Grains) Long 429,000 55,781 (11,331) 129,000 4,923 21,284
Non Deliverable Forwards Commodities (Grains) Short 7,000 (285,642) 34,676 — — —
c3. Position balance in commodities derivatives financial instruments of JBS USA:
JBS USAEXPOSURE in Commodities June 30, 2021 December 31, 2020OPERATIONALFirm contracts of cattle purchase 14,365,601 10,069,506Subtotal 14,365,601 10,069,506DERIVATIVESDeliverable Forwards (1,243,112) (3,340,319) Subtotal (1,243,112) (3,340,319) NET EXPOSURE 13,122,489 6,729,187
Sensitivity analysis:
Scenario (i) VaR 99% I.C. 1 day Scenario (ii) Price variation - 25% Scenario (iii) Price variation - 50%
Exposure Risk PriceEffect on income
PriceEffect on income
PriceEffect on income
JBS USA JBS USA JBS USA
Operating Depreciation (2.07)% (296,650) (25.00)% (3,591,400) (50.00)% (7,182,800)
Derivatives Apreciation (2.07)% 25,670 (25.00)% 310,778 (50.00)% 621,556
Derivatives financial instruments breakdown:Consolidated
June 30, 2021 December 31, 2020
Instrument Risk factor NatureNotional
(USD)Notional
(R$) Fair valueNotional
(USD)Notional
(R$) Fair value
Deliverable Forwards Commodities (Cattle) Short (248,513) (1,243,112) (553,944) (642,777) (3,340,319) 27,428
JBS S.A.Notes to the condensed financial statements for the six month period ended June 30, 2021 and 2020(Expressed in thousands of Brazilian reais)
42

d. Liquidity risk
The table below shows the contractual obligation amounts from financial liabilities of the Company and its subsidiaries according to their maturities:Company
June 30, 2021 December 31, 2020
Less than 1 year
Between 1 and 3 years
Between 4 and 5 years
More than 5 years Total
Less than 1 year
Between 1 and 3 years
Between 4 and 5 years
More than 5 years Total
Trade accounts payable 4,219,060 — — — 4,219,060 4,510,871 — — — 4,510,871
Loans and financing 4,897,076 2,619,436 521,778 3,405,833 11,444,123 1,700,815 1,303,717 524,729 1,830,872 5,360,133
Estimated interest on loans and financing (1) 763,362 1,140,071 923,382 1,753,793 4,580,608 264,274 381,132 245,748 474,584 1,365,738
Derivatives financing liabilities (assets) — — — — — 21,087 — — — 21,087
Other financial liabilities 11,839 1,650 — — 13,489 21,193 4,950 — — 26,143
Consolidated
June 30, 2021 December 31, 2020
Less than 1 year
Between 1 and 3 years
Between 4 and 5 years
More than 5 years Total
Less than 1 year
Between 1 and 3 years
Between 4 and 5 years
More than 5 years Total
Trade accounts payable 25,534,521 — — — 25,534,521 24,298,442 — — — 24,298,442
Loans and financing 7,449,059 7,074,541 7,998,956 48,510,227 71,032,783 4,562,102 6,142,420 12,181,765 43,020,420 65,906,707
Estimated interest on loans and financing (1) 3,435,666 6,483,279 6,089,579 8,581,508 24,590,032 3,014,943 6,217,792 5,573,784 5,868,015 20,674,534
Derivatives financing liabilities (assets) 1,181,995 — — — 1,181,995 287,536 — — — 287,536
Other financial liabilities 37,420 52,804 12,868 — 103,092 45,622 4,950 — — 50,572
(1) Includes interest on all loans and financing outstanding. Payments are estimated for variable rate debt based on effective interest rates at June 30, 2021 and December 31, 2020. Payments in foreign currencies are estimated using the June 30, 2021 and December 31, 2020 exchange rates.
The Company has securities pledged as collateral for derivative transactions with the commodities and futures whose balance at June 30, 2021 is R$150,513 (R$141,080 at December 31, 2020). This guarantee is superior to the need presented for these operations.
The indirect subsidiary JBS USA and its subsidiaries, has securities pledged as collateral for derivative transactions with the commodities and futures whose balance at June 30, 2021 is R$1,002,941 (R$303,487 at December 31, 2020). This guarantee is larger than its collateral.
Also, the direct subsidiary Seara Alimentos has securities pledged as collateral for derivative transactions with the commodities and futures whose balance at June 30, 2021 is R$165,749 (R$99,524 in December 31, 2020). This guarantee is larger than its collateral.
The Company and its subsidiaries have no guarantees received from third parties deemed relevant.
* * * * *
JBS S.A.Notes to the condensed financial statements for the six month period ended June 30, 2021 and 2020(Expressed in thousands of Brazilian reais)
43

29 Approval of the financial statements
The issuance of these condensed financial statements was approved by the Board of Directors on August 11, 2021.
BOARD OF DIRECTORS
Chairman: Jeremiah Alphonsus O'CallaghanVice-Chairman: José Batista SobrinhoBoard Member: Wesley Mendonça Batista FilhoBoard Member: Aguinaldo Gomes Ramos FilhoIndependent Board Member: Alba PettengillIndependent Board Member: Gelson Luiz MerisioIndependent Board Member: Gilberto Meirelles Xandó BaptistaIndependent Board Member: Leila Abraham LoriaIndependent Board Member: Márcio Guedes Pereira Júnior
STATUTORY AUDIT COMMITTEE REPORT
The Statutory Audit Committee reviewed the individual and consolidated condensed financial statements for the six month period ended June 30, 2021. Based on the procedures performed, also considering Grant Thorton Auditores Independentes' review report, as well as the information and clarifications received during the period, the Committee recommends that these documents are in a position to be considered by the Board of Directors.
STATUTORY AUDIT COMMITTEE
Chairman: Gilberto Meirelles Xandó BaptistaCommittee Member: Paulo Sérgio Cruz Dortas MatosCommittee Member: Orlando Octávio de Freitas JúniorCommittee Member: Gelson Luiz Merisio
FISCAL COUNCIL REPORT
The Fiscal Council, in the use of its legal and statutory attributions, examined the Earnings Release and the and the Company's individual and consolidated condensed financial statements for the six month period ended June 30, 2021, approved by the Company's Board of Directors on this date.
Based on our review, the information and clarifications received during this period and considering Grant Thornton Auditores Independentes' review report on the individualand consolidated condensed financial statements, without reservations, issued on this date, the Fiscal Council was not aware of any additional fact that would lead us to believe that the aforementioned financial statements do not reflect in all material respects the information contained therein and that are in a position to be disclosed by the Company.
FISCAL COUNCIL
Chairman: Adrian Lima da HoraCouncil Member: Demetrius Nichele MaceiCouncil Member: José Paulo da Silva FilhoCouncil Member: Roberto Lamb
STATEMENT OF OFFICERS ON THE FINANCIAL STATEMENTS AND ON THE INDEPENDENT AUDITORS REPORT
The Company's Officers declare for the purposes of Article 25, paragraph 1, item V and VI of CVM Instruction No. 480 of December 7, 2009, that:
(i) They reviewed, discussed and agreed with the independent auditors report on the individual and consolidated condensed financial statements for the six month period ended June 30, 2021, and
(ii) They reviewed, discussed and agreed with the condensed financial statements for the six month period ended June 30, 2021.
STATUTORY BOARD
Chief Executive Officer: Gilberto Tomazoni Administrative and Control Officer: Eliseo Santiago Perez FernandezChief Financial Officer: Guilherme Perboyre CavalcantOfficer: Jeremiah Alphonsus O'CallaghanOfficer: Wesley Mendonça Batista Filho
Accountant: Agnaldo dos Santos Moreira Jr. (CRC SP: 244207/O-4)
* * * * *
JBS S.A.Notes to the condensed financial statements for the six month period ended June 30, 2021 and 2020(Expressed in thousands of Brazilian reais)
44