jason quinley roland m uhlenbernd seminar f ur …roland/slang11/latex/session3/session03.… ·...
TRANSCRIPT

SLANGSession 3
Jason QuinleyRoland Muhlenbernd
Seminar fur SprachwissenschaftUniversity of Tubingen
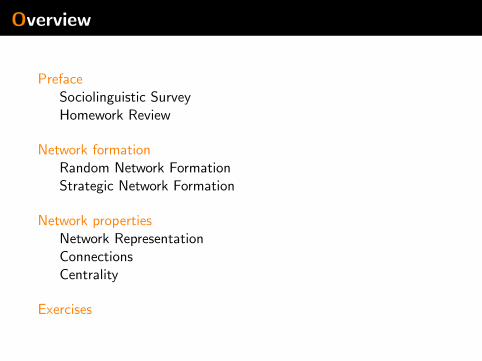
Overview
PrefaceSociolinguistic SurveyHomework Review
Network formationRandom Network FormationStrategic Network Formation
Network propertiesNetwork RepresentationConnectionsCentrality
Exercises
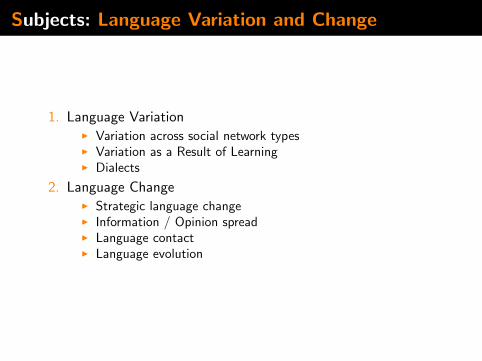
Subjects: Language Variation and Change
1. Language VariationI Variation across social network typesI Variation as a Result of LearningI Dialects
2. Language ChangeI Strategic language changeI Information / Opinion spreadI Language contactI Language evolution
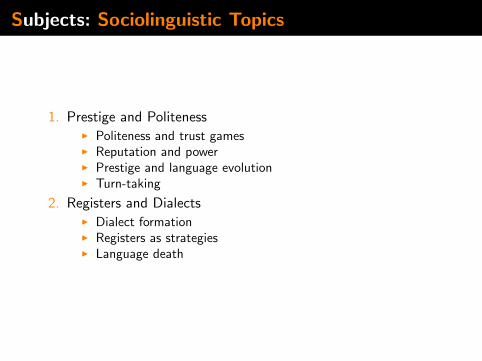
Subjects: Sociolinguistic Topics
1. Prestige and PolitenessI Politeness and trust gamesI Reputation and powerI Prestige and language evolutionI Turn-taking
2. Registers and DialectsI Dialect formationI Registers as strategiesI Language death

Homework
1. Network from 2.13
I APL: 1,2,6,7 = 1+1+2+3+4+46 = 15/6
I APL: 3,5 = 1+1+1+2+3+36 = 11/6
I APL: 4 = 1+1+2+2+2+26 = 10/6
I APL(N): = 4(15)+2(11)+107(6) = 46/21
I N1(g) = {2, 3, 4}, N2(g) = {1, 3, 4}, N3(g) = {1, 2, 4, 5},N4(g) = {1, 2, 3, 5, 6, 7}, N5(g) = {3, 4, 6, 7},N6(g) = {4, 5, 7}, N7(g) = {4, 5, 6}
2. Language vs. Dialect
I Why is the ”army and a navy” distinction given?I How do we distinguish them?
3. Networks
I Why study them? Lattice?I Superorganism

Network formation: Classical network structures
Star network
9
12
3
45
6
7
8
Ring network
12
3
45
6
7
8
Tree network
1
2 3
4 5 6 7
Complete network
1 2
3 4

Network formation: Random networks
I To create a random network we need:
I A set of nodes N = {1, . . . , n}I p: Probability for a link between any nodes i , j ;
0 < p < 1
I Exercise: Create & analyse a random network
1. For N = {1, 2, 3, 4, 5} find all possible links2. Set each possible link with probability p = .53. Calculate the average degree of the network4. Let’s collect the degrees of all your nodes
1
2 3
4 5

Network formation: Random networks
I The degree distribution of a random network describes theprobability that any given node will have a degree d .
I The probability that any given node i has degree d is
Pr(d |n, p) =
(n − 1d
)× pd × (1− p)n−1−d
I With n = 5 and p = .5: Pr(d) =
(4d
)× .5d × .54−d
I
Pr(d)
50%
0 1 2 3 4 d
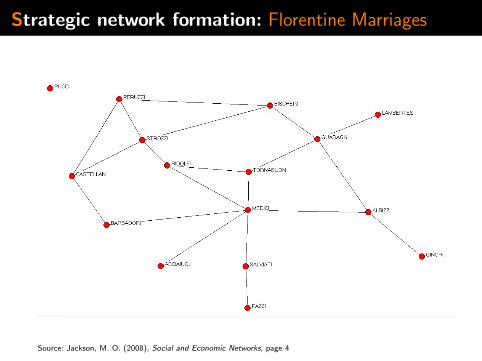
Strategic network formation: Florentine Marriages
Source: Jackson, M. O. (2008), Social and Economic Networks, page 4

Network formation: Symmetric connection model
I Like in the Florentine marriage example links are chosen bythe agents in the network
I Players benefit from direct and indirect connections, butdeterioration over distances
I Benefit factor δd with 0 < δ < 1, d = distance between nodes
I Cost value c for maintaining a direct relationship
I For a given network g the utility for agent i is:
ui =∑j 6=i
δ`ij − di × c

Network formation: Symmetric connection model
Example: N = {1, 2, 3}, δ = .5, c = .3
1
2 3
Round Choice u1(g) u2(g) u3(g)0 Init 0 0 01 1:(1− 2) .2 .2 02 2:(2− 3) .45 .4 .453 3: Noop .45 .4 .45
Pairwise stability:
1. No agent can benefit by deleting a link he is involved in
2. No two agents can both benefit by adding a link betweenthemselves

Network Representation: Graphs and Matrices
I Graph G = (N, g)
I N = {1, 2, 3, 4}
I g =
0 1 0 10 0 0 11 1 0 00 0 1 0
1 2
3
4
I Graph G = (N, g)
I N = {1, 2, 3, 4}
I g =
0 1 1 01 0 1 01 1 0 10 0 1 0
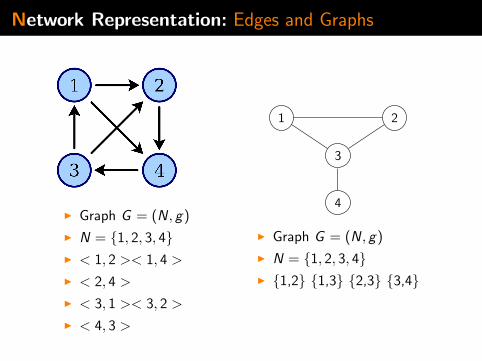
Network Representation: Edges and Graphs
I Graph G = (N, g)
I N = {1, 2, 3, 4}I < 1, 2 >< 1, 4 >
I < 2, 4 >
I < 3, 1 >< 3, 2 >
I < 4, 3 >
1 2
3
4
I Graph G = (N, g)
I N = {1, 2, 3, 4}I {1,2} {1,3} {2,3} {3,4}

Network Representation: Edges and Matrices
I Graph G = (N, g)
I N = {1, 2, 3, 4}I < 1, 2 >< 1, 4 >
I < 2, 4 >
I < 3, 1 >< 3, 2 >
I < 4, 3 >
Matrix
I g =
0 1 0 10 0 0 11 1 0 00 0 1 0
I Graph G = (N, g)
I N = {1, 2, 3, 4}I {1,2} {1,3} {2,3} {3,4}
Matrix
I g =
0 1 1 01 0 1 01 1 0 10 0 1 0

Connections: Directed Graphs
Why directed graphs?
I Information Spread
I Multi-agentCommunication
Important Notions
I In- vs. Out-Degree
I Cycles, Paths, Walks
I What about the Matricesand Edge descriptions?

Connections: Paths and Cycles
I A walk is a sequence of links connecting asequence of nodes
I A path is a walk in which a node appearsat most once in the sequence
I A cycle is a walk in which each nodeappears at most once in the sequence,except the starting node, which alsoappears as the ending node
1 2
3 4

Connections: Euler Problem
How do we solve the Bridges of Konigs-berg problem?
I Goal: Walk the entire network withoutusing a bridge twice.
I Think about Degree.I The walk is directed. Think in terms
of In and Out.I What do you notice about the
degrees of each node?
I Theorem: An Eulerian path ispossible only if and only if there are atmost two nodes of odd degree.
I What happens with two nodes?Zero?
I Why can’t we have a single node ofodd degree?
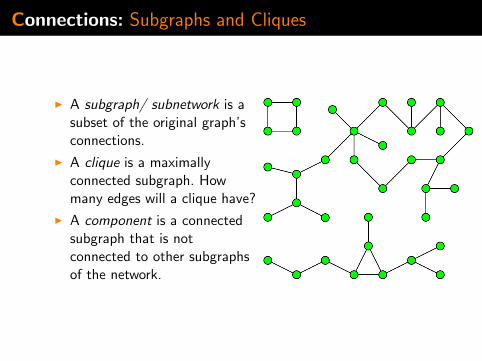
Connections: Subgraphs and Cliques
I A subgraph/ subnetwork is asubset of the original graph’sconnections.
I A clique is a maximallyconnected subgraph. Howmany edges will a clique have?
I A component is a connectedsubgraph that is notconnected to other subgraphsof the network.
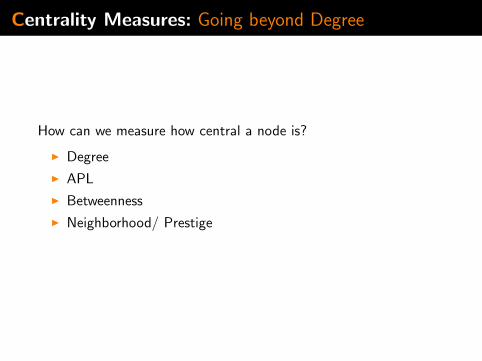
Centrality Measures: Going beyond Degree
How can we measure how central a node is?
I Degree
I APL
I Betweenness
I Neighborhood/ Prestige
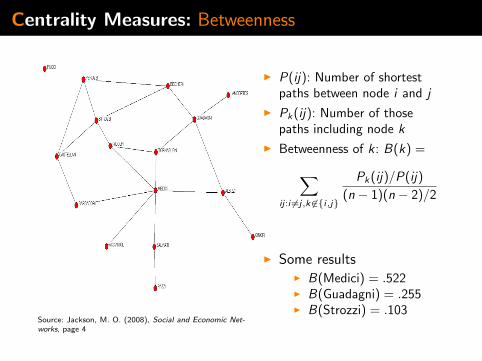
Centrality Measures: Betweenness
Source: Jackson, M. O. (2008), Social and Economic Net-works, page 4
I P(ij): Number of shortestpaths between node i and j
I Pk(ij): Number of thosepaths including node k
I Betweenness of k: B(k) =∑ij :i 6=j,k 6∈{i,j}
Pk(ij)/P(ij)
(n − 1)(n − 2)/2
I Some resultsI B(Medici) = .522I B(Guadagni) = .255I B(Strozzi) = .103

Wrapup: What did we discuss today?
How can we synthesize networks?
I Randomly
I Strategically
How can we analyze networks?
I Node/ Local properties
I Global Properties
I Statistically
I Analytically
How can we represent networks?
I Graphs
I Links
I Matrices