japan citrus annual 2017 japan citrus annual - usda gain publications/citrus annual... · table 3 -...
TRANSCRIPT
THIS REPORT CONTAINS ASSESSMENTS OF COMMODITY AND TRADE ISSUES MADE BY
USDA STAFF AND NOT NECESSARILY STATEMENTS OF OFFICIAL U.S. GOVERNMENT
POLICY
Date:
GAIN Report Number:
Approved By:
Prepared By:
Report Highlights:
Although Japanese production and consumption of citrus has been in decline for decades, market year
(MY) 2016/17 marked a small increase from the previous MY. Japanese mandarin area planted
continued a modest decline to 52,200 hectares (ha) in MY 2017/18. Cloudy weather and low
temperatures in summer, coupled with typhoons and rain in October, further contributed to a lower
production forecast in MY 2017/18 to 990,000 metric tons (MT). Grapefruit consumption is also
forecast lower 13 percent to 95,000 MT on reduced production in Florida, though offset partially by
other suppliers.
Keywords: Japan, JA7150, citrus, grapefruit, mandarin, unshu, lemon, lime
Tomohiro Kurai
Jess K. Paulson
2017 Japan Citrus Annual
Citrus Annual
Japan
JA7150
12/15/2017
Required Report - public distribution
Commodities:
Author Defined:
Tangerines/Mandarins
PS&D Table
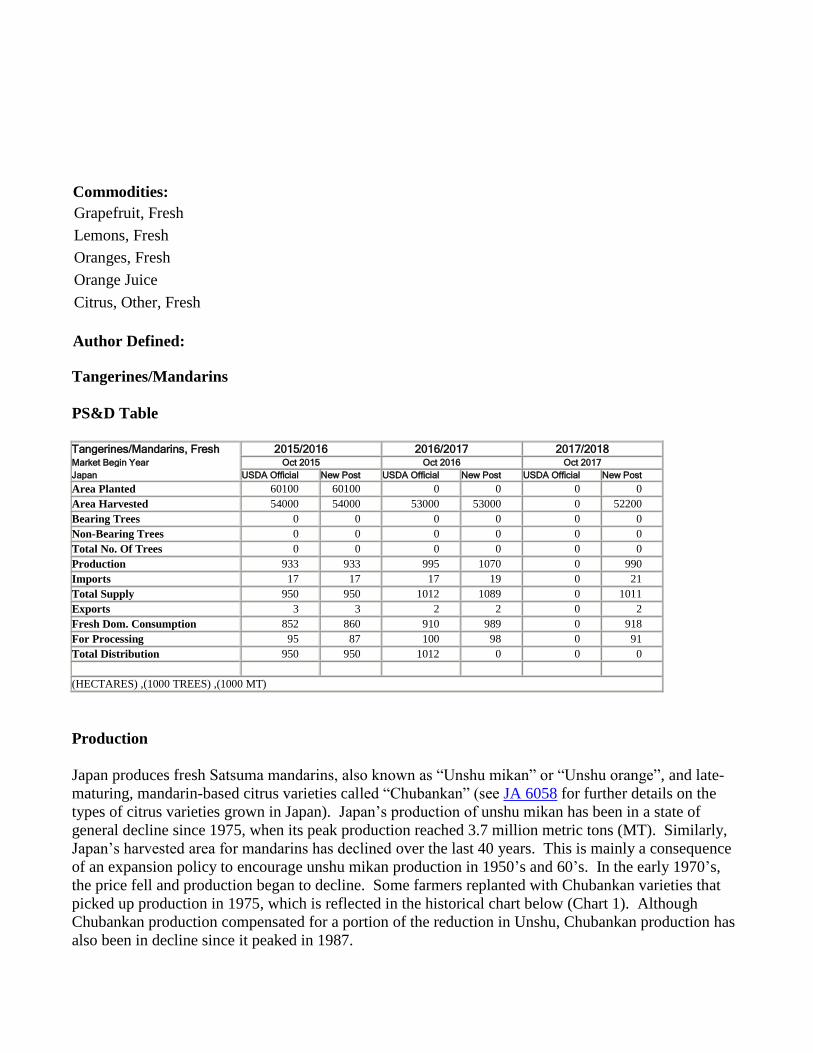
Tangerines/Mandarins, Fresh 2015/2016 2016/2017 2017/2018 Market Begin Year Oct 2015 Oct 2016 Oct 2017
Japan USDA Official New Post USDA Official New Post USDA Official New Post
Area Planted 60100 60100 0 0 0 0
Area Harvested 54000 54000 53000 53000 0 52200
Bearing Trees 0 0 0 0 0 0
Non-Bearing Trees 0 0 0 0 0 0
Total No. Of Trees 0 0 0 0 0 0
Production 933 933 995 1070 0 990
Imports 17 17 17 19 0 21
Total Supply 950 950 1012 1089 0 1011
Exports 3 3 2 2 0 2
Fresh Dom. Consumption 852 860 910 989 0 918
For Processing 95 87 100 98 0 91
Total Distribution 950 950 1012 0 0 0
(HECTARES) ,(1000 TREES) ,(1000 MT)
Production
Japan produces fresh Satsuma mandarins, also known as “Unshu mikan” or “Unshu orange”, and late-
maturing, mandarin-based citrus varieties called “Chubankan” (see JA 6058 for further details on the
types of citrus varieties grown in Japan). Japan’s production of unshu mikan has been in a state of
general decline since 1975, when its peak production reached 3.7 million metric tons (MT). Similarly,
Japan’s harvested area for mandarins has declined over the last 40 years. This is mainly a consequence
of an expansion policy to encourage unshu mikan production in 1950’s and 60’s. In the early 1970’s,
the price fell and production began to decline. Some farmers replanted with Chubankan varieties that
picked up production in 1975, which is reflected in the historical chart below (Chart 1). Although
Chubankan production compensated for a portion of the reduction in Unshu, Chubankan production has
also been in decline since it peaked in 1987.
Citrus, Other, Fresh
Orange Juice
Oranges, Fresh
Lemons, Fresh
Grapefruit, Fresh
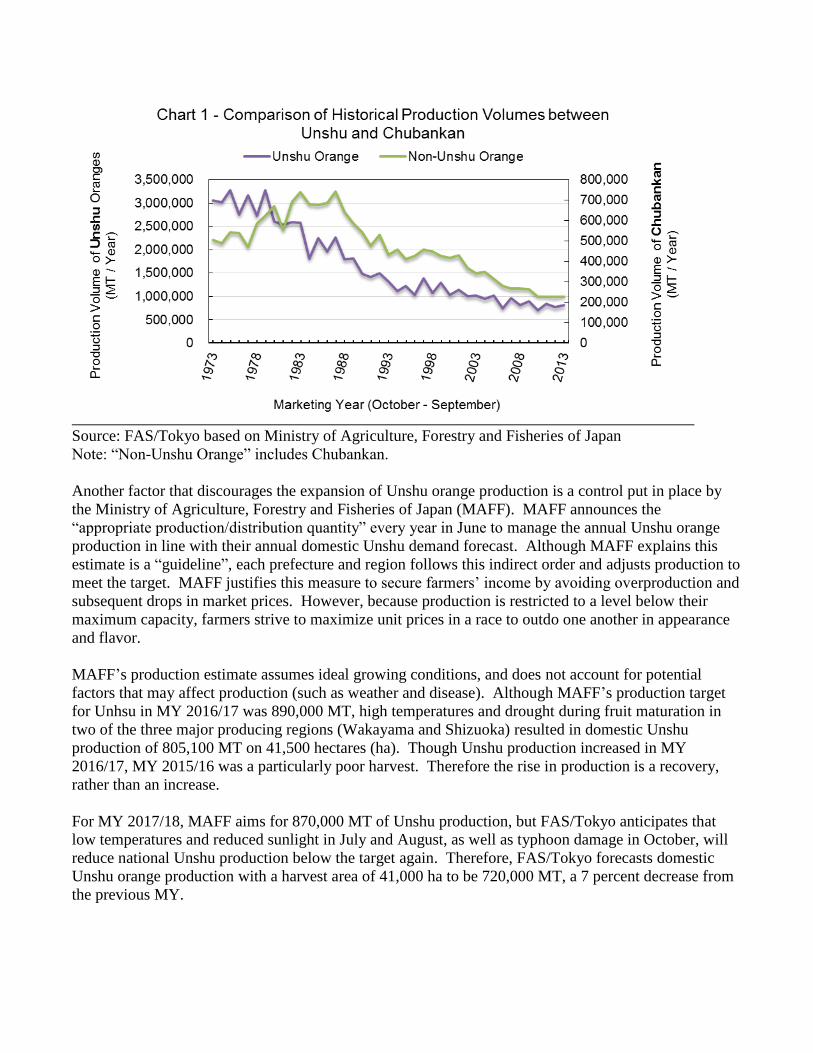
Source: FAS/Tokyo based on Ministry of Agriculture, Forestry and Fisheries of Japan
Note: “Non-Unshu Orange” includes Chubankan.
Another factor that discourages the expansion of Unshu orange production is a control put in place by
the Ministry of Agriculture, Forestry and Fisheries of Japan (MAFF). MAFF announces the
“appropriate production/distribution quantity” every year in June to manage the annual Unshu orange
production in line with their annual domestic Unshu demand forecast. Although MAFF explains this
estimate is a “guideline”, each prefecture and region follows this indirect order and adjusts production to
meet the target. MAFF justifies this measure to secure farmers’ income by avoiding overproduction and
subsequent drops in market prices. However, because production is restricted to a level below their
maximum capacity, farmers strive to maximize unit prices in a race to outdo one another in appearance
and flavor.
MAFF’s production estimate assumes ideal growing conditions, and does not account for potential
factors that may affect production (such as weather and disease). Although MAFF’s production target
for Unhsu in MY 2016/17 was 890,000 MT, high temperatures and drought during fruit maturation in
two of the three major producing regions (Wakayama and Shizuoka) resulted in domestic Unshu
production of 805,100 MT on 41,500 hectares (ha). Though Unshu production increased in MY
2016/17, MY 2015/16 was a particularly poor harvest. Therefore the rise in production is a recovery,
rather than an increase.
For MY 2017/18, MAFF aims for 870,000 MT of Unshu production, but FAS/Tokyo anticipates that
low temperatures and reduced sunlight in July and August, as well as typhoon damage in October, will
reduce national Unshu production below the target again. Therefore, FAS/Tokyo forecasts domestic
Unshu orange production with a harvest area of 41,000 ha to be 720,000 MT, a 7 percent decrease from
the previous MY.
Although there is no “production control” for Chubankan, these varieties are facing a steady decline in
production similar to that of the Unshu orange (Chart 1 above). FAS/Tokyo estimates total Chubankan
acreage and production were 11,500 ha and 265,000 MT in MY 2016/17, respectively. Because
Chubankan are later-maturing varieties, they are better suited to withstand typhoon damage.
FAS/Tokyo forecasts Chubankan production to remain almost flat at 270,000 MT in MY 2017/18,
despite reduced acreage to 11,200 ha.
Overall, FAS/Tokyo forecasts Japanese total planted area of mandarin oranges in MY 2017/18 to be
52,200 ha (a 2 percent reduction), and total production will be 990,000 MT (an 8 percent reduction)
compared to the previous MY.
Consumption
Almost all of Japan’s Unshu orange production is consumed fresh (90 percent), with only a small part of
production being processed as juice (7 percent) or as canned fruit (3 percent). This consumption trend
remains unchanged and is unlikely to change in the foreseeable future, as fresh oranges receive the
highest commercial return.
Consumer preferences for fruit have been shifting toward sweeter products. Thus, many retailers
display the brix values of fruit at the point of sale. Accordingly, breeding programs aim for sweeter
varieties, and sorting facilities for Unshu oranges are all equipped with brix sensors. Another
characteristic which consumers seek in fruit is easy handling, particularly easy peeling or even no
peeling. Consumer surveys conducted by MAFF clearly show that the inconvenience of peeling is one
of the reasons why Japanese consumers avoid Unshu oranges. In fact, kiwi fruit and bananas are the
only two types of fruit recently that are increasing in consumption in Japan, both of which require little
peeling.
To increase the competitiveness of their Unshu and Chubankan oranges, many growers and their
associations are trying to establish brands or trademarks for marketing campaigns. For example,
“Dekopon” is a registered trademark given to the Shiranui variety of Unshu grown in certified areas and
meet established brix and acidity standards. This type of strict quality control has successfully
established brands and distinguished them from other Chubankan and citrus. Another approach is to
register local products as a geographic indication (GI). “Sakurajima-Komikan” is the first registered GI-
protected Unshu orange in Japan and FAS/Tokyo anticipates this trend will expand to other localized
citrus varieties.
Strong production in 2016/17 reflects a recovery from the previous MY, and consumption increased 14
percent due to more availability and lower prices. However, the efforts mentioned above have not
prevented the continuous decline in Japanese mandarin consumption. Therefore, FAS/Tokyo forecasts
that consumption of Unshu and other mandarin oranges will continue to decline slowly but steadily in
the future.
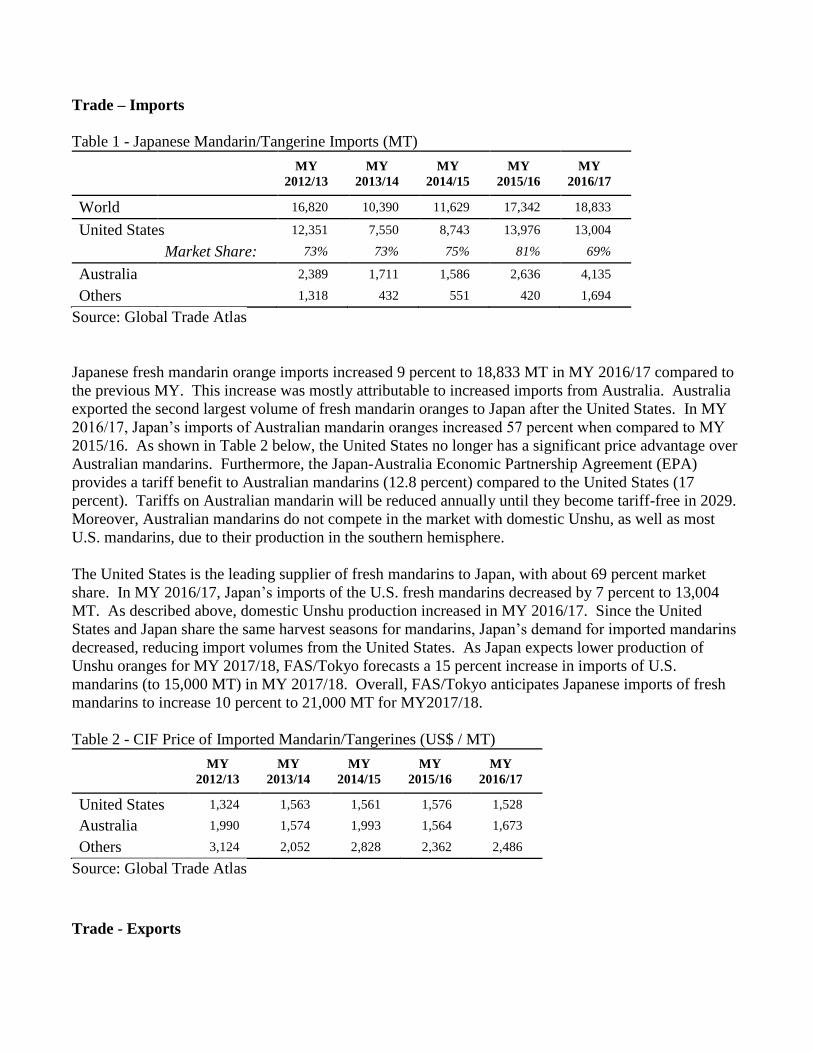
Trade – Imports
Table 1 - Japanese Mandarin/Tangerine Imports (MT)
MY
2012/13 MY
2013/14 MY
2014/15 MY
2015/16 MY
2016/17
World
16,820 10,390 11,629 17,342 18,833
United States 12,351 7,550 8,743 13,976 13,004
Market Share: 73% 73% 75% 81% 69%
Australia
2,389 1,711 1,586 2,636 4,135
Others 1,318 432 551 420 1,694
Source: Global Trade Atlas
Japanese fresh mandarin orange imports increased 9 percent to 18,833 MT in MY 2016/17 compared to
the previous MY. This increase was mostly attributable to increased imports from Australia. Australia
exported the second largest volume of fresh mandarin oranges to Japan after the United States. In MY
2016/17, Japan’s imports of Australian mandarin oranges increased 57 percent when compared to MY
2015/16. As shown in Table 2 below, the United States no longer has a significant price advantage over
Australian mandarins. Furthermore, the Japan-Australia Economic Partnership Agreement (EPA)
provides a tariff benefit to Australian mandarins (12.8 percent) compared to the United States (17
percent). Tariffs on Australian mandarin will be reduced annually until they become tariff-free in 2029.
Moreover, Australian mandarins do not compete in the market with domestic Unshu, as well as most
U.S. mandarins, due to their production in the southern hemisphere.
The United States is the leading supplier of fresh mandarins to Japan, with about 69 percent market
share. In MY 2016/17, Japan’s imports of the U.S. fresh mandarins decreased by 7 percent to 13,004
MT. As described above, domestic Unshu production increased in MY 2016/17. Since the United
States and Japan share the same harvest seasons for mandarins, Japan’s demand for imported mandarins
decreased, reducing import volumes from the United States. As Japan expects lower production of
Unshu oranges for MY 2017/18, FAS/Tokyo forecasts a 15 percent increase in imports of U.S.
mandarins (to 15,000 MT) in MY 2017/18. Overall, FAS/Tokyo anticipates Japanese imports of fresh
mandarins to increase 10 percent to 21,000 MT for MY2017/18.
Table 2 - CIF Price of Imported Mandarin/Tangerines (US$ / MT)
MY
2012/13 MY
2013/14 MY
2014/15 MY
2015/16 MY
2016/17
United States 1,324 1,563 1,561 1,576 1,528
Australia
1,990 1,574 1,993 1,564 1,673
Others 3,124 2,052 2,828 2,362 2,486
Source: Global Trade Atlas
Trade - Exports
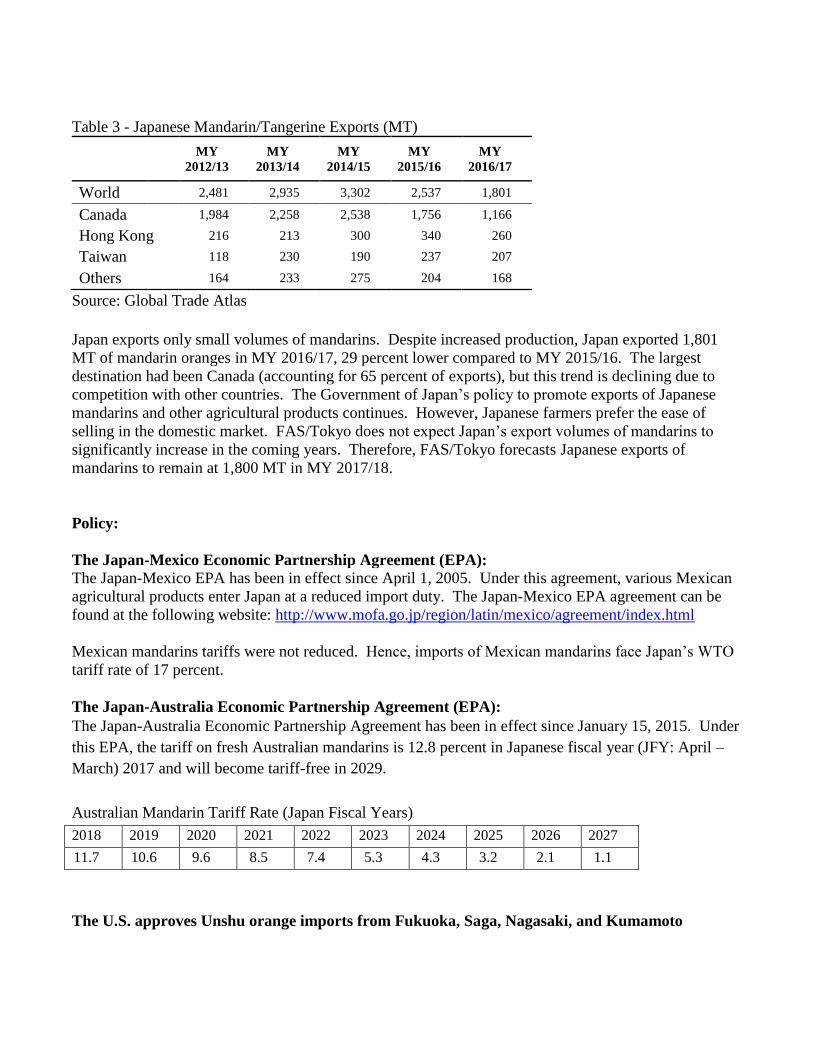
Table 3 - Japanese Mandarin/Tangerine Exports (MT)
MY
2012/13 MY
2013/14 MY
2014/15 MY
2015/16 MY
2016/17
World
2,481 2,935 3,302 2,537 1,801
Canada 1,984 2,258 2,538 1,756 1,166
Hong Kong 216 213 300 340 260
Taiwan
118 230 190 237 207
Others 164 233 275 204 168
Source: Global Trade Atlas
Japan exports only small volumes of mandarins. Despite increased production, Japan exported 1,801
MT of mandarin oranges in MY 2016/17, 29 percent lower compared to MY 2015/16. The largest
destination had been Canada (accounting for 65 percent of exports), but this trend is declining due to
competition with other countries. The Government of Japan’s policy to promote exports of Japanese
mandarins and other agricultural products continues. However, Japanese farmers prefer the ease of
selling in the domestic market. FAS/Tokyo does not expect Japan’s export volumes of mandarins to
significantly increase in the coming years. Therefore, FAS/Tokyo forecasts Japanese exports of
mandarins to remain at 1,800 MT in MY 2017/18.
Policy:
The Japan-Mexico Economic Partnership Agreement (EPA): The Japan-Mexico EPA has been in effect since April 1, 2005. Under this agreement, various Mexican
agricultural products enter Japan at a reduced import duty. The Japan-Mexico EPA agreement can be
found at the following website: http://www.mofa.go.jp/region/latin/mexico/agreement/index.html
Mexican mandarins tariffs were not reduced. Hence, imports of Mexican mandarins face Japan’s WTO
tariff rate of 17 percent.
The Japan-Australia Economic Partnership Agreement (EPA):
The Japan-Australia Economic Partnership Agreement has been in effect since January 15, 2015. Under
this EPA, the tariff on fresh Australian mandarins is 12.8 percent in Japanese fiscal year (JFY: April –
March) 2017 and will become tariff-free in 2029.
Australian Mandarin Tariff Rate (Japan Fiscal Years)
2018 2019 2020 2021 2022 2023 2024 2025 2026 2027
11.7 10.6 9.6 8.5 7.4 5.3 4.3 3.2 2.1 1.1
The U.S. approves Unshu orange imports from Fukuoka, Saga, Nagasaki, and Kumamoto
To prevent the introduction of the citrus fruit fly (Bactrocera tsuneonis), the U.S. prohibited Unshu
orange imports from Kyushu, the southernmost of Japan’s four main islands. The U.S. and Japan
reached an agreement to import Unshu oranges from these islands in 2016.
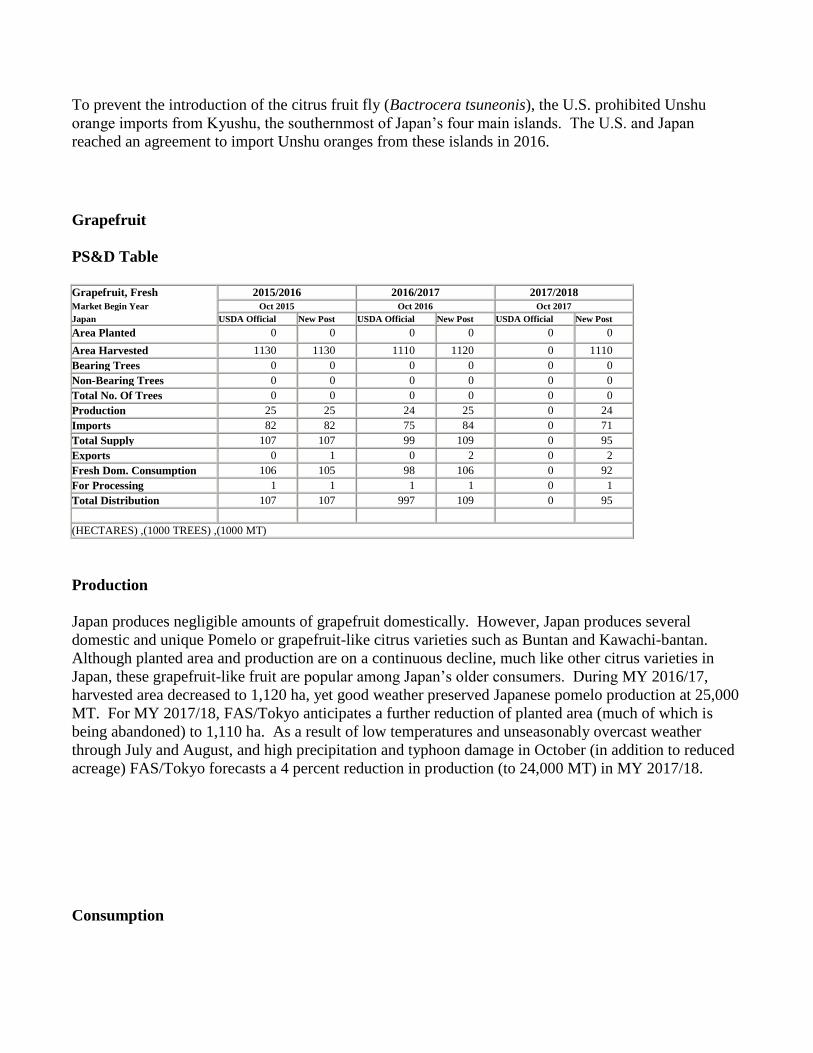
Grapefruit
PS&D Table
Grapefruit, Fresh 2015/2016 2016/2017 2017/2018
Market Begin Year Oct 2015 Oct 2016 Oct 2017
Japan USDA Official New Post USDA Official New Post USDA Official New Post
Area Planted 0 0 0 0 0 0
Area Harvested 1130 1130 1110 1120 0 1110
Bearing Trees 0 0 0 0 0 0
Non-Bearing Trees 0 0 0 0 0 0
Total No. Of Trees 0 0 0 0 0 0
Production 25 25 24 25 0 24
Imports 82 82 75 84 0 71
Total Supply 107 107 99 109 0 95
Exports 0 1 0 2 0 2
Fresh Dom. Consumption 106 105 98 106 0 92
For Processing 1 1 1 1 0 1
Total Distribution 107 107 997 109 0 95
(HECTARES) ,(1000 TREES) ,(1000 MT)
Production
Japan produces negligible amounts of grapefruit domestically. However, Japan produces several
domestic and unique Pomelo or grapefruit-like citrus varieties such as Buntan and Kawachi-bantan.
Although planted area and production are on a continuous decline, much like other citrus varieties in
Japan, these grapefruit-like fruit are popular among Japan’s older consumers. During MY 2016/17,
harvested area decreased to 1,120 ha, yet good weather preserved Japanese pomelo production at 25,000
MT. For MY 2017/18, FAS/Tokyo anticipates a further reduction of planted area (much of which is
being abandoned) to 1,110 ha. As a result of low temperatures and unseasonably overcast weather
through July and August, and high precipitation and typhoon damage in October (in addition to reduced
acreage) FAS/Tokyo forecasts a 4 percent reduction in production (to 24,000 MT) in MY 2017/18.
Consumption
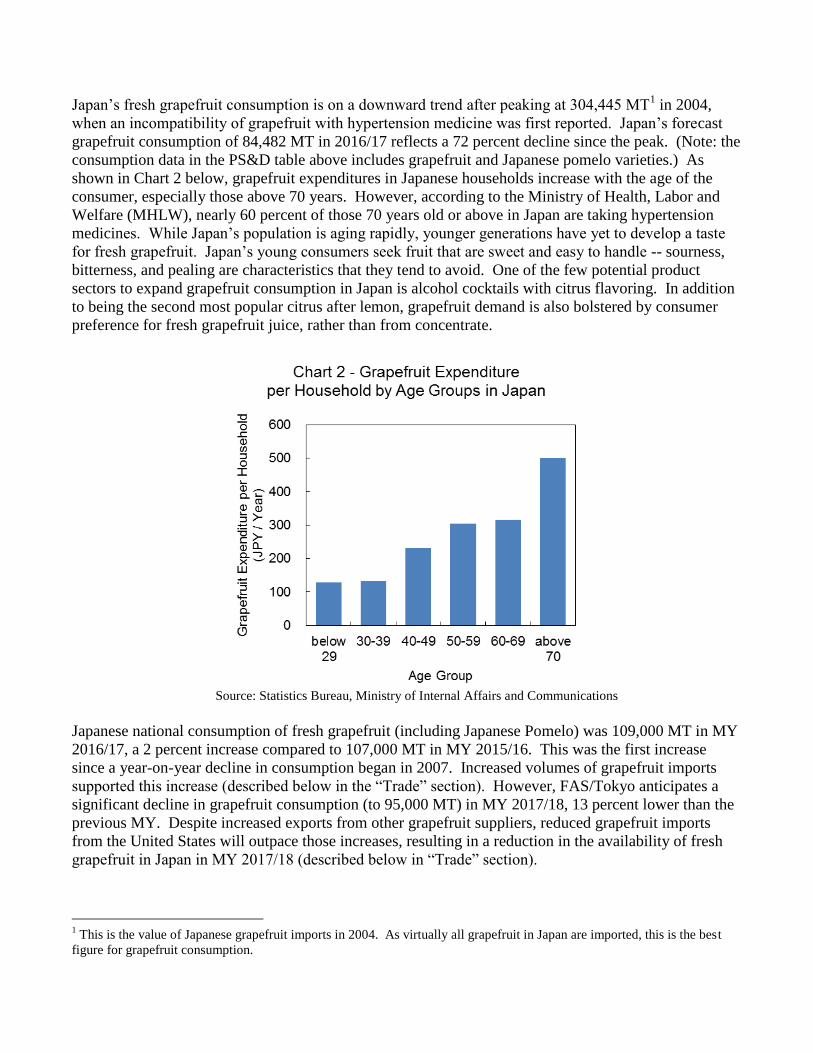
Japan’s fresh grapefruit consumption is on a downward trend after peaking at 304,445 MT1 in 2004,
when an incompatibility of grapefruit with hypertension medicine was first reported. Japan’s forecast
grapefruit consumption of 84,482 MT in 2016/17 reflects a 72 percent decline since the peak. (Note: the
consumption data in the PS&D table above includes grapefruit and Japanese pomelo varieties.) As
shown in Chart 2 below, grapefruit expenditures in Japanese households increase with the age of the
consumer, especially those above 70 years. However, according to the Ministry of Health, Labor and
Welfare (MHLW), nearly 60 percent of those 70 years old or above in Japan are taking hypertension
medicines. While Japan’s population is aging rapidly, younger generations have yet to develop a taste
for fresh grapefruit. Japan’s young consumers seek fruit that are sweet and easy to handle -- sourness,
bitterness, and pealing are characteristics that they tend to avoid. One of the few potential product
sectors to expand grapefruit consumption in Japan is alcohol cocktails with citrus flavoring. In addition
to being the second most popular citrus after lemon, grapefruit demand is also bolstered by consumer
preference for fresh grapefruit juice, rather than from concentrate.
Source: Statistics Bureau, Ministry of Internal Affairs and Communications
Japanese national consumption of fresh grapefruit (including Japanese Pomelo) was 109,000 MT in MY
2016/17, a 2 percent increase compared to 107,000 MT in MY 2015/16. This was the first increase
since a year-on-year decline in consumption began in 2007. Increased volumes of grapefruit imports
supported this increase (described below in the “Trade” section). However, FAS/Tokyo anticipates a
significant decline in grapefruit consumption (to 95,000 MT) in MY 2017/18, 13 percent lower than the
previous MY. Despite increased exports from other grapefruit suppliers, reduced grapefruit imports
from the United States will outpace those increases, resulting in a reduction in the availability of fresh
grapefruit in Japan in MY 2017/18 (described below in “Trade” section).
1 This is the value of Japanese grapefruit imports in 2004. As virtually all grapefruit in Japan are imported, this is the best
figure for grapefruit consumption.
Trade – Imports
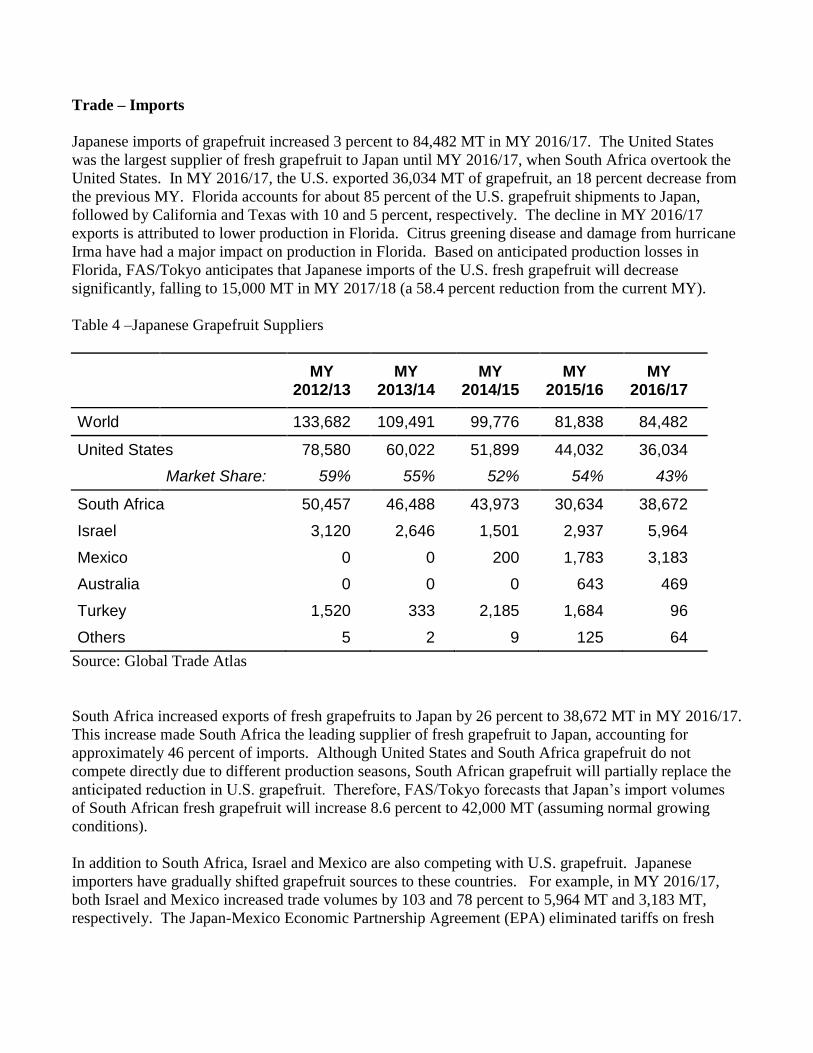
Japanese imports of grapefruit increased 3 percent to 84,482 MT in MY 2016/17. The United States
was the largest supplier of fresh grapefruit to Japan until MY 2016/17, when South Africa overtook the
United States. In MY 2016/17, the U.S. exported 36,034 MT of grapefruit, an 18 percent decrease from
the previous MY. Florida accounts for about 85 percent of the U.S. grapefruit shipments to Japan,
followed by California and Texas with 10 and 5 percent, respectively. The decline in MY 2016/17
exports is attributed to lower production in Florida. Citrus greening disease and damage from hurricane
Irma have had a major impact on production in Florida. Based on anticipated production losses in
Florida, FAS/Tokyo anticipates that Japanese imports of the U.S. fresh grapefruit will decrease
significantly, falling to 15,000 MT in MY 2017/18 (a 58.4 percent reduction from the current MY).
Table 4 –Japanese Grapefruit Suppliers
MY
2012/13 MY
2013/14 MY
2014/15 MY
2015/16 MY
2016/17
World
133,682 109,491 99,776 81,838 84,482
United States 78,580 60,022 51,899 44,032 36,034
Market Share: 59% 55% 52% 54% 43%
South Africa 50,457 46,488 43,973 30,634 38,672
Israel
3,120 2,646 1,501 2,937 5,964
Mexico
0 0 200 1,783 3,183
Australia 0 0 0 643 469
Turkey 1,520 333 2,185 1,684 96
Others 5 2 9 125 64
Source: Global Trade Atlas
South Africa increased exports of fresh grapefruits to Japan by 26 percent to 38,672 MT in MY 2016/17.
This increase made South Africa the leading supplier of fresh grapefruit to Japan, accounting for
approximately 46 percent of imports. Although United States and South Africa grapefruit do not
compete directly due to different production seasons, South African grapefruit will partially replace the
anticipated reduction in U.S. grapefruit. Therefore, FAS/Tokyo forecasts that Japan’s import volumes
of South African fresh grapefruit will increase 8.6 percent to 42,000 MT (assuming normal growing
conditions).
In addition to South Africa, Israel and Mexico are also competing with U.S. grapefruit. Japanese
importers have gradually shifted grapefruit sources to these countries. For example, in MY 2016/17,
both Israel and Mexico increased trade volumes by 103 and 78 percent to 5,964 MT and 3,183 MT,
respectively. The Japan-Mexico Economic Partnership Agreement (EPA) eliminated tariffs on fresh
Mexican grapefruit since 2011. FAS/Tokyo forecasts that both Israel and Mexico will further expand
grapefruit exports to 9,000 MT and 4,500 MT in MY 2017/18, respectively.
Given the reductions in U.S. grapefruit production, and despite Japan’s increased imports of grapefruit
from South Africa, Israel and Mexico, FAS/Tokyo forecasts Japanese grapefruit imports to decrease 16
percent in MY 2017/18 to 71,000 MT.
Trade – Exports
Japan exports a negligible amount of Japanese Pomelo to Hong Kong, Singapore, and Taiwan in MY
2016/17, and FAS/Tokyo expects these levels to remain unchanged in MY 2017/18.
Policy:
The Japan-Mexico Economic Partnership Agreement (EPA): For mandarins, Mexican grapefruits tariffs were not reduced. Hence, imports of Mexican mandarins
receive Japan’s WTO tariff rate of 10 percent.
The Japan-Australia Economic Partnership Agreement (EPA):
Under this EPA, the tariff on fresh Australian grapefruit is 3.3 percent in JFY 2017. It will be 1.7
percent in JFY2018, and will become tariff-free in 2019.
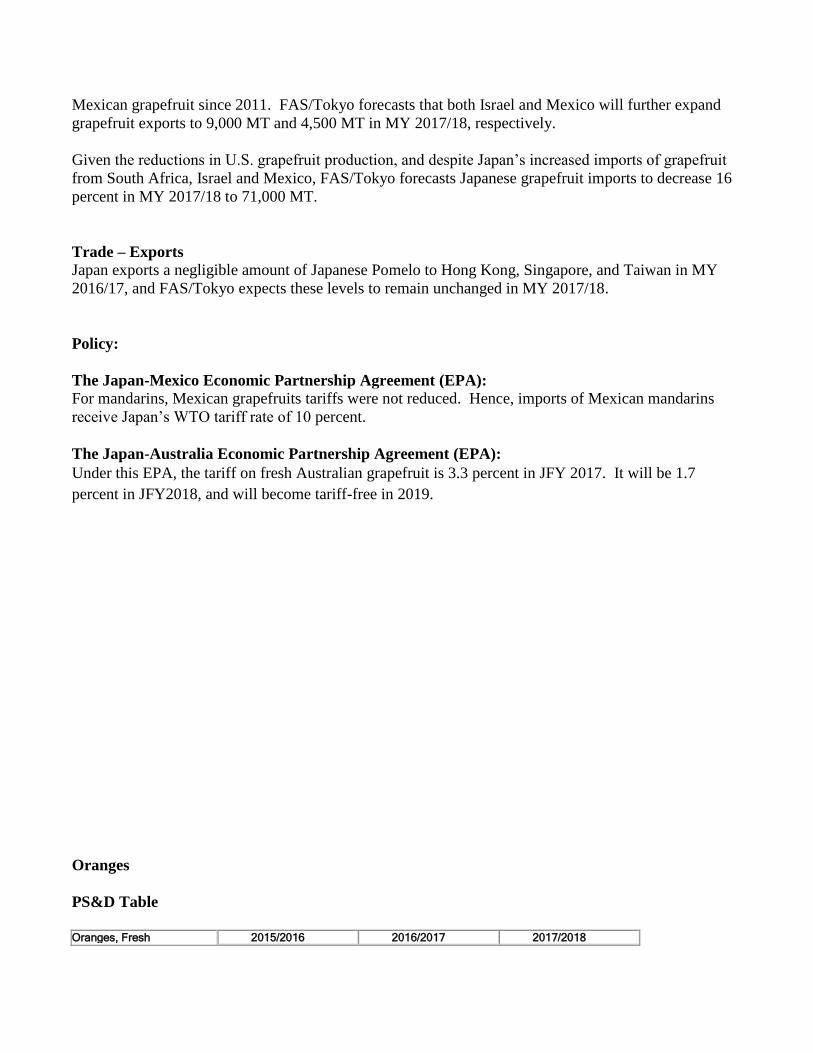
Oranges
PS&D Table
Oranges, Fresh 2015/2016 2016/2017 2017/2018
Market Begin Year Oct 2015 Oct 2016 Oct 2017
Japan USDA Official New Post USDA Official New Post USDA Official New Post
Area Planted 0 0 0 0 0 0
Area Harvested 450 450 440 440 0 430
Bearing Trees 0 0 0 0 0 0
Non-Bearing Trees 0 0 0 0 0 0
Total No. Of Trees 0 0 0 0 0 0
Production 7 7 6 6 0 6
Imports 100 100 95 92 0 89
Total Supply 0 0 101 98 0 95
Exports 0 0 0 0 0 0
Fresh Dom. Consumption 106 106 101 97 0 94
For Processing 1 1 0 1 0 1
Total Distribution 107 107 101 98 0 95
(HECTARES) ,(1000 TREES) ,(1000 MT)
Production
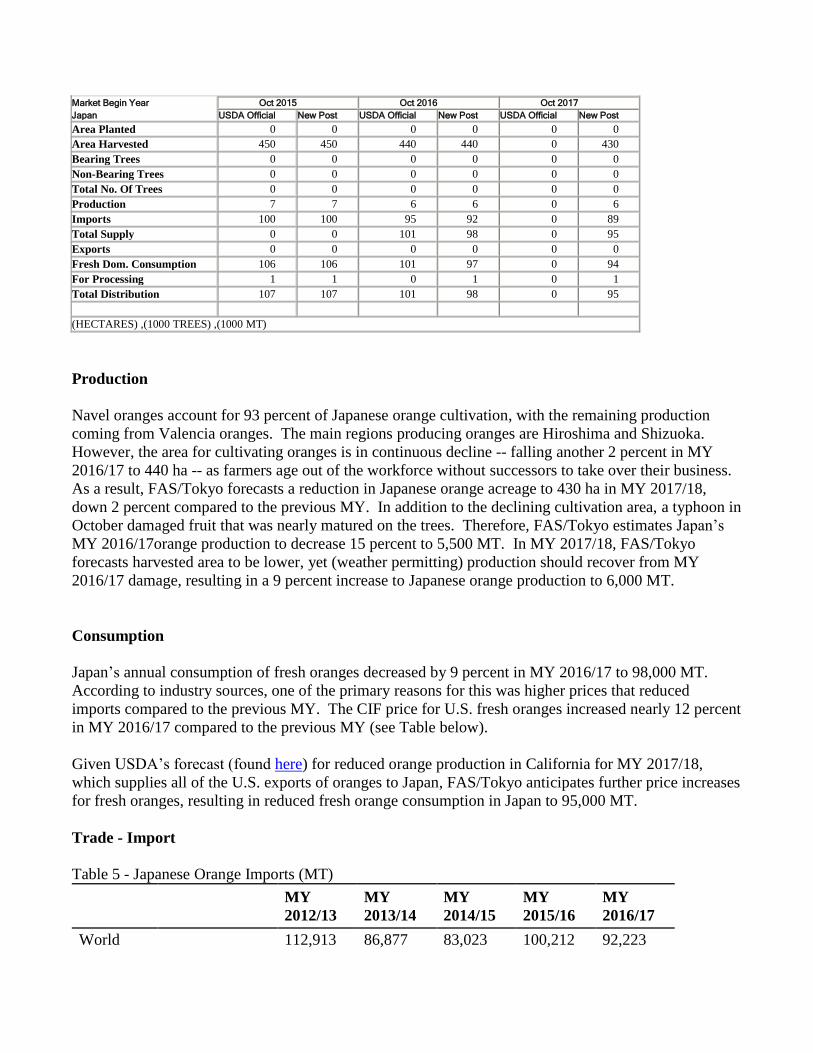
Navel oranges account for 93 percent of Japanese orange cultivation, with the remaining production
coming from Valencia oranges. The main regions producing oranges are Hiroshima and Shizuoka.
However, the area for cultivating oranges is in continuous decline -- falling another 2 percent in MY
2016/17 to 440 ha -- as farmers age out of the workforce without successors to take over their business.
As a result, FAS/Tokyo forecasts a reduction in Japanese orange acreage to 430 ha in MY 2017/18,
down 2 percent compared to the previous MY. In addition to the declining cultivation area, a typhoon in
October damaged fruit that was nearly matured on the trees. Therefore, FAS/Tokyo estimates Japan’s
MY 2016/17orange production to decrease 15 percent to 5,500 MT. In MY 2017/18, FAS/Tokyo
forecasts harvested area to be lower, yet (weather permitting) production should recover from MY
2016/17 damage, resulting in a 9 percent increase to Japanese orange production to 6,000 MT.
Consumption
Japan’s annual consumption of fresh oranges decreased by 9 percent in MY 2016/17 to 98,000 MT.
According to industry sources, one of the primary reasons for this was higher prices that reduced
imports compared to the previous MY. The CIF price for U.S. fresh oranges increased nearly 12 percent
in MY 2016/17 compared to the previous MY (see Table below).
Given USDA’s forecast (found here) for reduced orange production in California for MY 2017/18,
which supplies all of the U.S. exports of oranges to Japan, FAS/Tokyo anticipates further price increases
for fresh oranges, resulting in reduced fresh orange consumption in Japan to 95,000 MT.
Trade - Import
Table 5 - Japanese Orange Imports (MT)
MY
2012/13
MY
2013/14
MY
2014/15
MY
2015/16
MY
2016/17
World
112,913 86,877 83,023 100,212 92,223
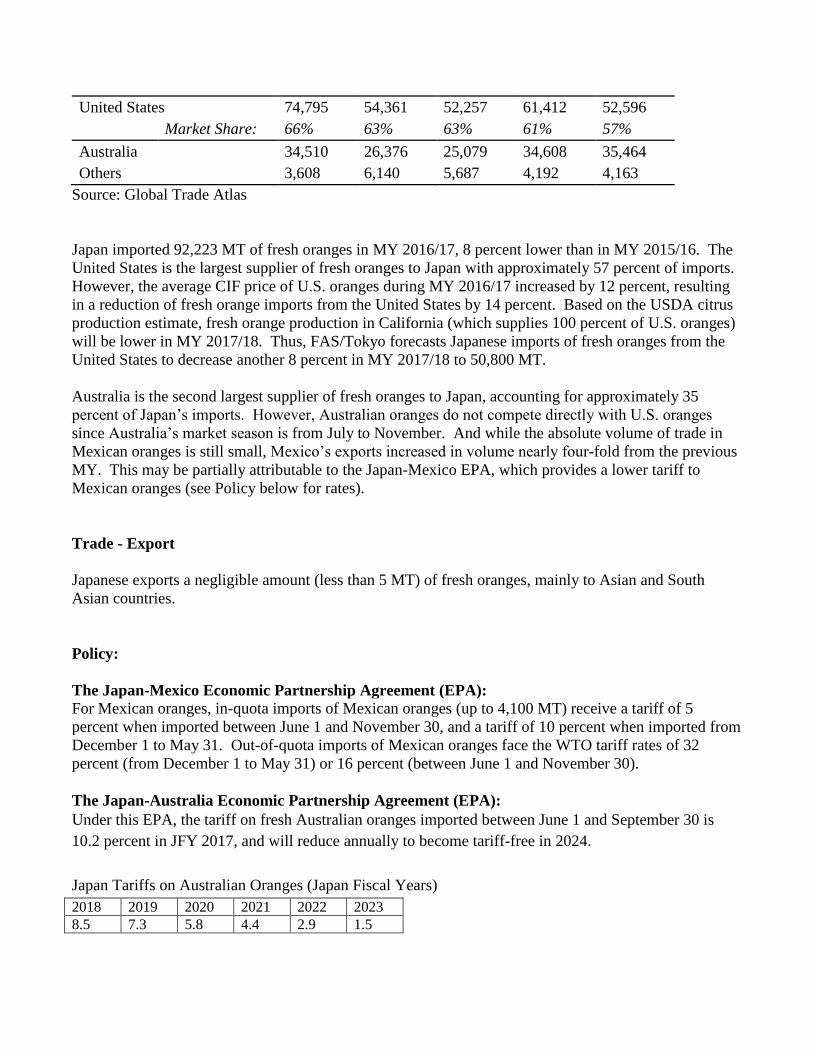
United States 74,795 54,361 52,257 61,412 52,596
Market Share: 66% 63% 63% 61% 57%
Australia
34,510 26,376 25,079 34,608 35,464
Others 3,608 6,140 5,687 4,192 4,163
Source: Global Trade Atlas
Japan imported 92,223 MT of fresh oranges in MY 2016/17, 8 percent lower than in MY 2015/16. The
United States is the largest supplier of fresh oranges to Japan with approximately 57 percent of imports.
However, the average CIF price of U.S. oranges during MY 2016/17 increased by 12 percent, resulting
in a reduction of fresh orange imports from the United States by 14 percent. Based on the USDA citrus
production estimate, fresh orange production in California (which supplies 100 percent of U.S. oranges)
will be lower in MY 2017/18. Thus, FAS/Tokyo forecasts Japanese imports of fresh oranges from the
United States to decrease another 8 percent in MY 2017/18 to 50,800 MT.
Australia is the second largest supplier of fresh oranges to Japan, accounting for approximately 35
percent of Japan’s imports. However, Australian oranges do not compete directly with U.S. oranges
since Australia’s market season is from July to November. And while the absolute volume of trade in
Mexican oranges is still small, Mexico’s exports increased in volume nearly four-fold from the previous
MY. This may be partially attributable to the Japan-Mexico EPA, which provides a lower tariff to
Mexican oranges (see Policy below for rates).
Trade - Export
Japanese exports a negligible amount (less than 5 MT) of fresh oranges, mainly to Asian and South
Asian countries.
Policy:
The Japan-Mexico Economic Partnership Agreement (EPA): For Mexican oranges, in-quota imports of Mexican oranges (up to 4,100 MT) receive a tariff of 5
percent when imported between June 1 and November 30, and a tariff of 10 percent when imported from
December 1 to May 31. Out-of-quota imports of Mexican oranges face the WTO tariff rates of 32
percent (from December 1 to May 31) or 16 percent (between June 1 and November 30).
The Japan-Australia Economic Partnership Agreement (EPA):
Under this EPA, the tariff on fresh Australian oranges imported between June 1 and September 30 is
10.2 percent in JFY 2017, and will reduce annually to become tariff-free in 2024.
Japan Tariffs on Australian Oranges (Japan Fiscal Years)
2018 2019 2020 2021 2022 2023
8.5 7.3 5.8 4.4 2.9 1.5
Orange Juice
PS&D Table
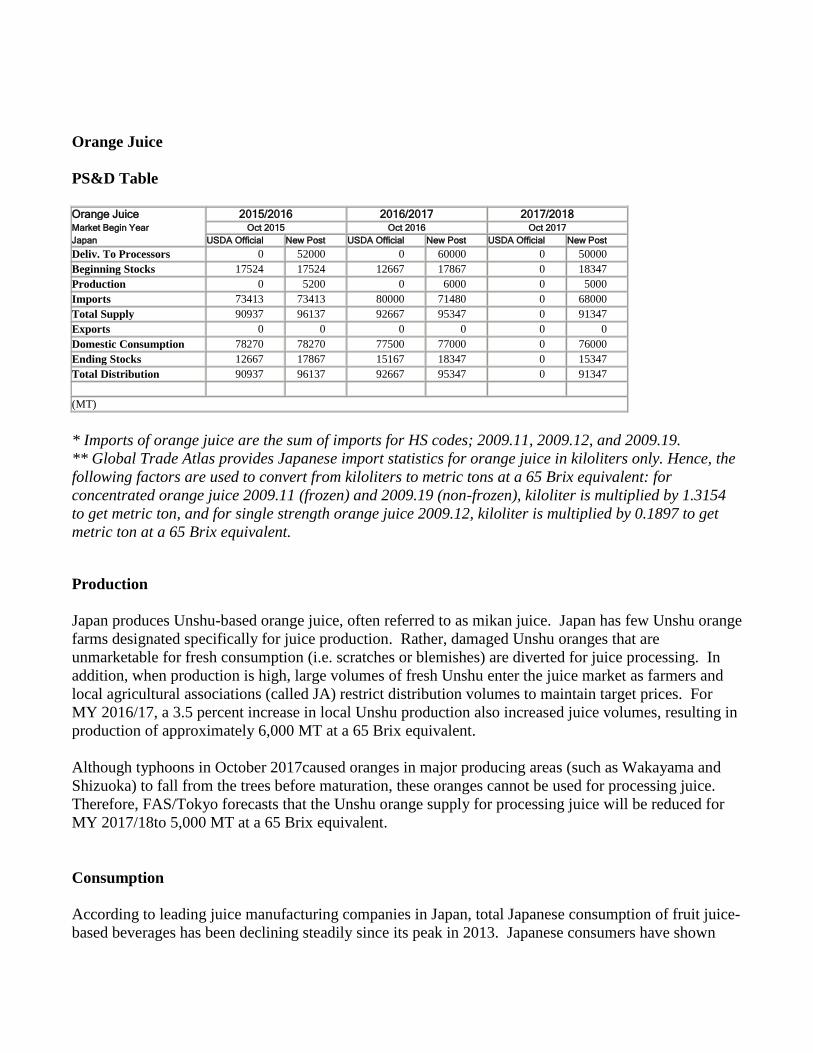
Orange Juice 2015/2016 2016/2017 2017/2018 Market Begin Year Oct 2015 Oct 2016 Oct 2017
Japan USDA Official New Post USDA Official New Post USDA Official New Post
Deliv. To Processors 0 52000 0 60000 0 50000
Beginning Stocks 17524 17524 12667 17867 0 18347
Production 0 5200 0 6000 0 5000
Imports 73413 73413 80000 71480 0 68000
Total Supply 90937 96137 92667 95347 0 91347
Exports 0 0 0 0 0 0
Domestic Consumption 78270 78270 77500 77000 0 76000
Ending Stocks 12667 17867 15167 18347 0 15347
Total Distribution 90937 96137 92667 95347 0 91347
(MT)
* Imports of orange juice are the sum of imports for HS codes; 2009.11, 2009.12, and 2009.19.
** Global Trade Atlas provides Japanese import statistics for orange juice in kiloliters only. Hence, the
following factors are used to convert from kiloliters to metric tons at a 65 Brix equivalent: for
concentrated orange juice 2009.11 (frozen) and 2009.19 (non-frozen), kiloliter is multiplied by 1.3154
to get metric ton, and for single strength orange juice 2009.12, kiloliter is multiplied by 0.1897 to get
metric ton at a 65 Brix equivalent.
Production
Japan produces Unshu-based orange juice, often referred to as mikan juice. Japan has few Unshu orange
farms designated specifically for juice production. Rather, damaged Unshu oranges that are
unmarketable for fresh consumption (i.e. scratches or blemishes) are diverted for juice processing. In
addition, when production is high, large volumes of fresh Unshu enter the juice market as farmers and
local agricultural associations (called JA) restrict distribution volumes to maintain target prices. For
MY 2016/17, a 3.5 percent increase in local Unshu production also increased juice volumes, resulting in
production of approximately 6,000 MT at a 65 Brix equivalent.
Although typhoons in October 2017caused oranges in major producing areas (such as Wakayama and
Shizuoka) to fall from the trees before maturation, these oranges cannot be used for processing juice.
Therefore, FAS/Tokyo forecasts that the Unshu orange supply for processing juice will be reduced for
MY 2017/18to 5,000 MT at a 65 Brix equivalent.
Consumption
According to leading juice manufacturing companies in Japan, total Japanese consumption of fruit juice-
based beverages has been declining steadily since its peak in 2013. Japanese consumers have shown
more concern for 100-percent juice due to their concerns for its high sugar content, calories and high
prices. During MY 2015/16, many manufacturers and retailers increased the retail price of 100-percent
orange juice due to high Frozen Concentrated Orange Juice (FCOJ) prices. Consequently,
manufacturers and retailers focus more on drinks with a lower percentage of orange juice (i.e.
carbonated drinks with less than 5 percent orange juice). This trend continued in MY 2016/17, which
further reduced orange juice consumption in Japan by about 2 percent. FAS/Tokyo anticipates a
continuation of this trend in MY 2017/18, and forecasts orange juice consumption in Japan to decrease
another 1,000 MT in MY 2017/18.
Trade
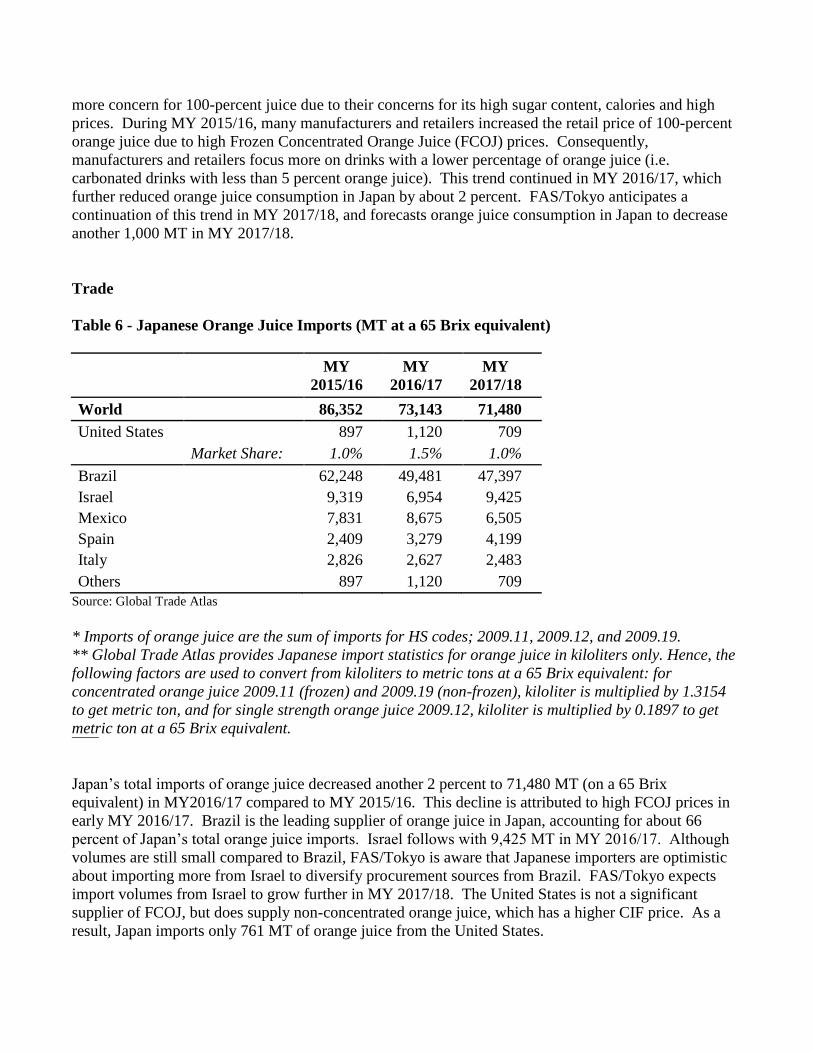
Table 6 - Japanese Orange Juice Imports (MT at a 65 Brix equivalent)
MY
2015/16
MY
2016/17
MY
2017/18
World
86,352 73,143 71,480
United States 897 1,120 709
Market Share: 1.0% 1.5% 1.0%
Brazil
62,248 49,481 47,397
Israel 9,319 6,954 9,425
Mexico
7,831 8,675 6,505
Spain
2,409 3,279 4,199
Italy
2,826 2,627 2,483
Others 897 1,120 709
Source: Global Trade Atlas
* Imports of orange juice are the sum of imports for HS codes; 2009.11, 2009.12, and 2009.19.
** Global Trade Atlas provides Japanese import statistics for orange juice in kiloliters only. Hence, the
following factors are used to convert from kiloliters to metric tons at a 65 Brix equivalent: for
concentrated orange juice 2009.11 (frozen) and 2009.19 (non-frozen), kiloliter is multiplied by 1.3154
to get metric ton, and for single strength orange juice 2009.12, kiloliter is multiplied by 0.1897 to get
metric ton at a 65 Brix equivalent.
Japan’s total imports of orange juice decreased another 2 percent to 71,480 MT (on a 65 Brix
equivalent) in MY2016/17 compared to MY 2015/16. This decline is attributed to high FCOJ prices in
early MY 2016/17. Brazil is the leading supplier of orange juice in Japan, accounting for about 66
percent of Japan’s total orange juice imports. Israel follows with 9,425 MT in MY 2016/17. Although
volumes are still small compared to Brazil, FAS/Tokyo is aware that Japanese importers are optimistic
about importing more from Israel to diversify procurement sources from Brazil. FAS/Tokyo expects
import volumes from Israel to grow further in MY 2017/18. The United States is not a significant
supplier of FCOJ, but does supply non-concentrated orange juice, which has a higher CIF price. As a
result, Japan imports only 761 MT of orange juice from the United States.
For MY 2017/18, Japanese manufacturers have expressed uncertainty about Brazil’s orange production
next year. In addition, devastating damage to oranges in Florida by Hurricane Irma may encourage the
United States to import more orange juice. These factors may increase competition and raise FCOJ
prices further. Given these circumstances, together with Japan’s declining consumption of orange juice,
FAS/Tokyo forecasts total Japanese imports of orange juice to decrease 5 percent to 68,000 MT (on a 65
Brix equivalent) in MY 2017/18.
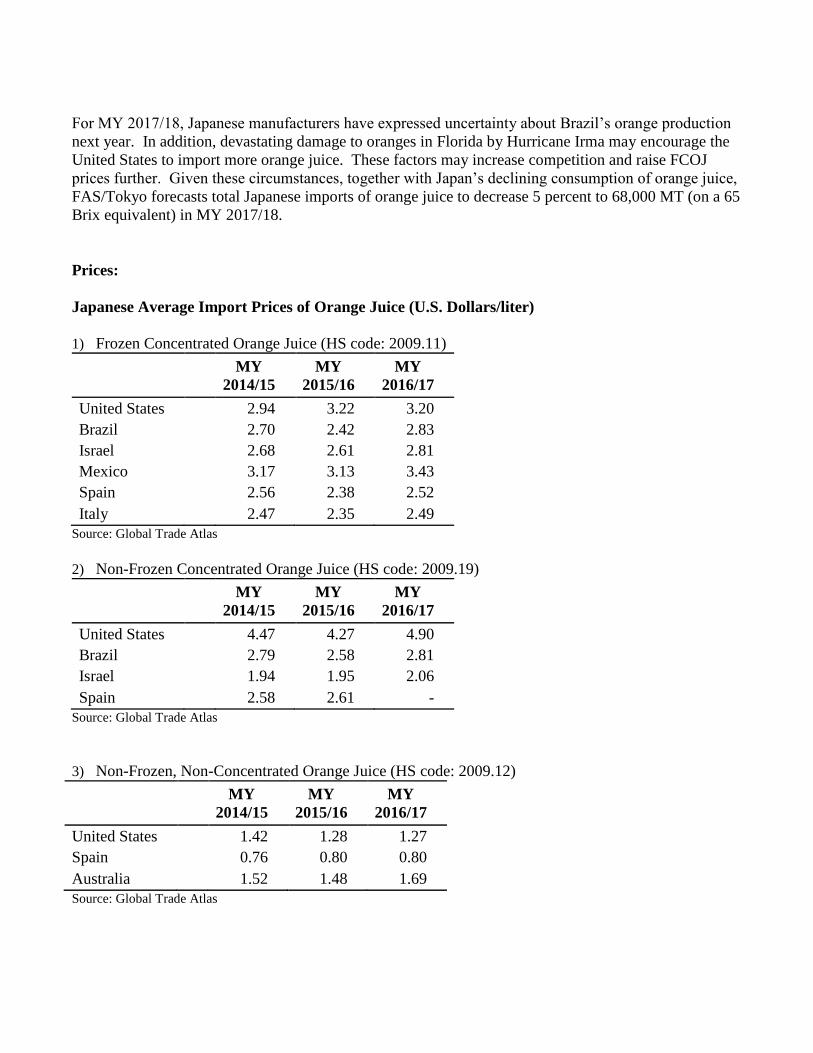
Prices:
Japanese Average Import Prices of Orange Juice (U.S. Dollars/liter)
1) Frozen Concentrated Orange Juice (HS code: 2009.11)
MY
2014/15
MY
2015/16
MY
2016/17
United States 2.94 3.22 3.20
Brazil
2.70 2.42 2.83
Israel 2.68 2.61 2.81
Mexico
3.17 3.13 3.43
Spain
2.56 2.38 2.52
Italy 2.47 2.35 2.49
Source: Global Trade Atlas
2) Non-Frozen Concentrated Orange Juice (HS code: 2009.19)
MY
2014/15
MY
2015/16
MY
2016/17
United States 4.47 4.27 4.90
Brazil
2.79 2.58 2.81
Israel
1.94 1.95 2.06
Spain 2.58 2.61 -
Source: Global Trade Atlas
3) Non-Frozen, Non-Concentrated Orange Juice (HS code: 2009.12)
Source: Global Trade Atlas
MY
2014/15
MY
2015/16
MY
2016/17
United States 1.42 1.28 1.27
Spain
0.76 0.80 0.80
Australia 1.52 1.48 1.69
The Japan-Mexico Economic Partnership Agreement (EPA):
For Mexican orange juice, depending on the tariff code, the in-quota tariff rate will be lowered to either:
1) 5.3 percent; 2) 6.3 percent; or 3) whichever is the greater of 7.4 percent or 5.7 yen per kilogram. The
quota for Mexican FCOJ (HS 2009.11 and 2009.19) is set in Japanese Fiscal Year (JFY, April - March)
2017 at 7,000 MT. The quota for orange juice other than FCOJ (HS 2009.12) set at 5,000 MT in JFY
2017.
As shown in Annex-I, depending on the tariff code, out-of-quota imports of Mexican orange juice face
the WTO tariff rate of either: 1) 21.3 percent; 2) 25.5 percent; or 3) whichever is greater of 29.8 percent
or 23 yen per kilogram.
The Japan-Australia Economic Partnership Agreement (EPA):
Under this EPA, Japan granted Australia preferential tariff quotas on all orange juice line items with
reduced tariffs. For JPY 2017, the annual quota is set at 1,300 MT and in-quota tariff rates are set
below.
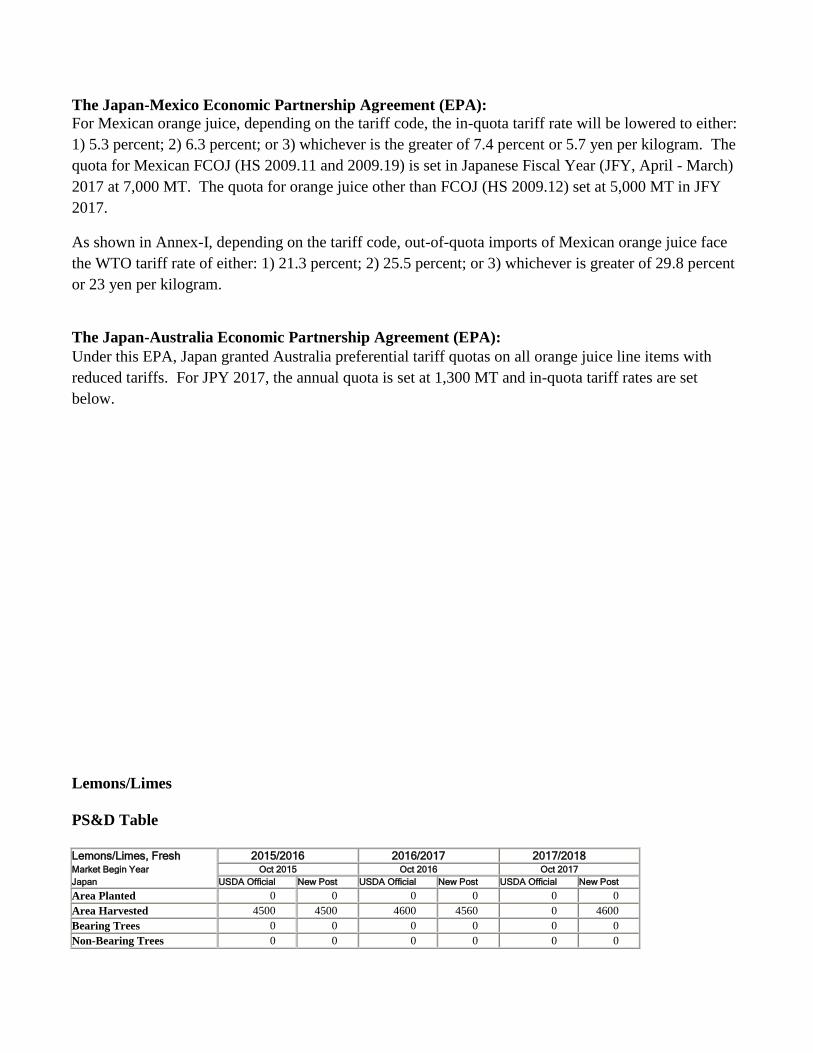
Lemons/Limes
PS&D Table
Lemons/Limes, Fresh 2015/2016 2016/2017 2017/2018 Market Begin Year Oct 2015 Oct 2016 Oct 2017
Japan USDA Official New Post USDA Official New Post USDA Official New Post
Area Planted 0 0 0 0 0 0
Area Harvested 4500 4500 4600 4560 0 4600
Bearing Trees 0 0 0 0 0 0
Non-Bearing Trees 0 0 0 0 0 0
Total No. Of Trees 0 0 0 0 0 0
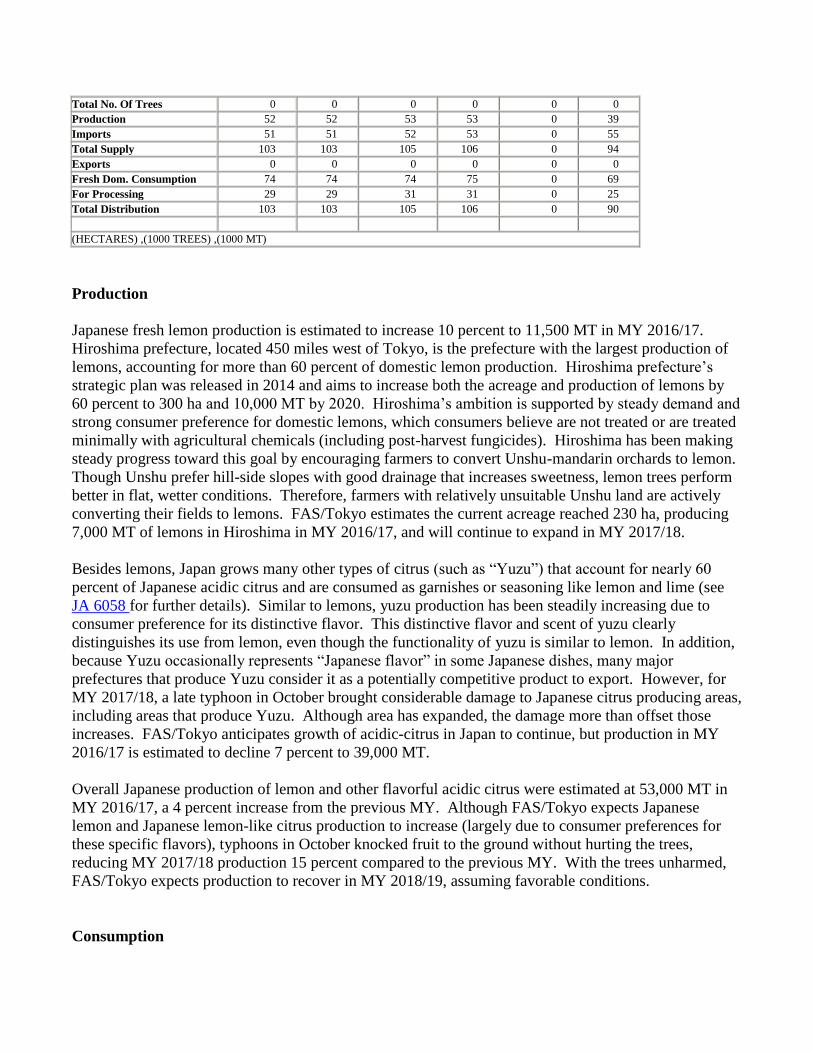
Production 52 52 53 53 0 39
Imports 51 51 52 53 0 55
Total Supply 103 103 105 106 0 94
Exports 0 0 0 0 0 0
Fresh Dom. Consumption 74 74 74 75 0 69
For Processing 29 29 31 31 0 25
Total Distribution 103 103 105 106 0 90
(HECTARES) ,(1000 TREES) ,(1000 MT)
Production
Japanese fresh lemon production is estimated to increase 10 percent to 11,500 MT in MY 2016/17.
Hiroshima prefecture, located 450 miles west of Tokyo, is the prefecture with the largest production of
lemons, accounting for more than 60 percent of domestic lemon production. Hiroshima prefecture’s
strategic plan was released in 2014 and aims to increase both the acreage and production of lemons by
60 percent to 300 ha and 10,000 MT by 2020. Hiroshima’s ambition is supported by steady demand and
strong consumer preference for domestic lemons, which consumers believe are not treated or are treated
minimally with agricultural chemicals (including post-harvest fungicides). Hiroshima has been making
steady progress toward this goal by encouraging farmers to convert Unshu-mandarin orchards to lemon.
Though Unshu prefer hill-side slopes with good drainage that increases sweetness, lemon trees perform
better in flat, wetter conditions. Therefore, farmers with relatively unsuitable Unshu land are actively
converting their fields to lemons. FAS/Tokyo estimates the current acreage reached 230 ha, producing
7,000 MT of lemons in Hiroshima in MY 2016/17, and will continue to expand in MY 2017/18.
Besides lemons, Japan grows many other types of citrus (such as “Yuzu”) that account for nearly 60
percent of Japanese acidic citrus and are consumed as garnishes or seasoning like lemon and lime (see
JA 6058 for further details). Similar to lemons, yuzu production has been steadily increasing due to
consumer preference for its distinctive flavor. This distinctive flavor and scent of yuzu clearly
distinguishes its use from lemon, even though the functionality of yuzu is similar to lemon. In addition,
because Yuzu occasionally represents “Japanese flavor” in some Japanese dishes, many major
prefectures that produce Yuzu consider it as a potentially competitive product to export. However, for
MY 2017/18, a late typhoon in October brought considerable damage to Japanese citrus producing areas,
including areas that produce Yuzu. Although area has expanded, the damage more than offset those
increases. FAS/Tokyo anticipates growth of acidic-citrus in Japan to continue, but production in MY
2016/17 is estimated to decline 7 percent to 39,000 MT.
Overall Japanese production of lemon and other flavorful acidic citrus were estimated at 53,000 MT in
MY 2016/17, a 4 percent increase from the previous MY. Although FAS/Tokyo expects Japanese
lemon and Japanese lemon-like citrus production to increase (largely due to consumer preferences for
these specific flavors), typhoons in October knocked fruit to the ground without hurting the trees,
reducing MY 2017/18 production 15 percent compared to the previous MY. With the trees unharmed,
FAS/Tokyo expects production to recover in MY 2018/19, assuming favorable conditions.
Consumption
For MY 2016/17, Japan’s total consumption of lemons was 61,000 MT, of which 10,500 MT was
supplied from domestic production. Japan’s consumption of flavor-adding, acidic citrus was 106,000
MT, of which 75,000 MT was consumed fresh.
Fresh lemons, as well as other unique lemon-like citrus in Japan, are largely consumed in the food sector
as a garnish or as seasoning for food and beverages. For example, the main use of domestic varieties is
for processed products such as salad dressing and jams. For MY 2016/17, nearly 70 percent of the yield
of domestic varieties (excluding lemons) was used for processing.
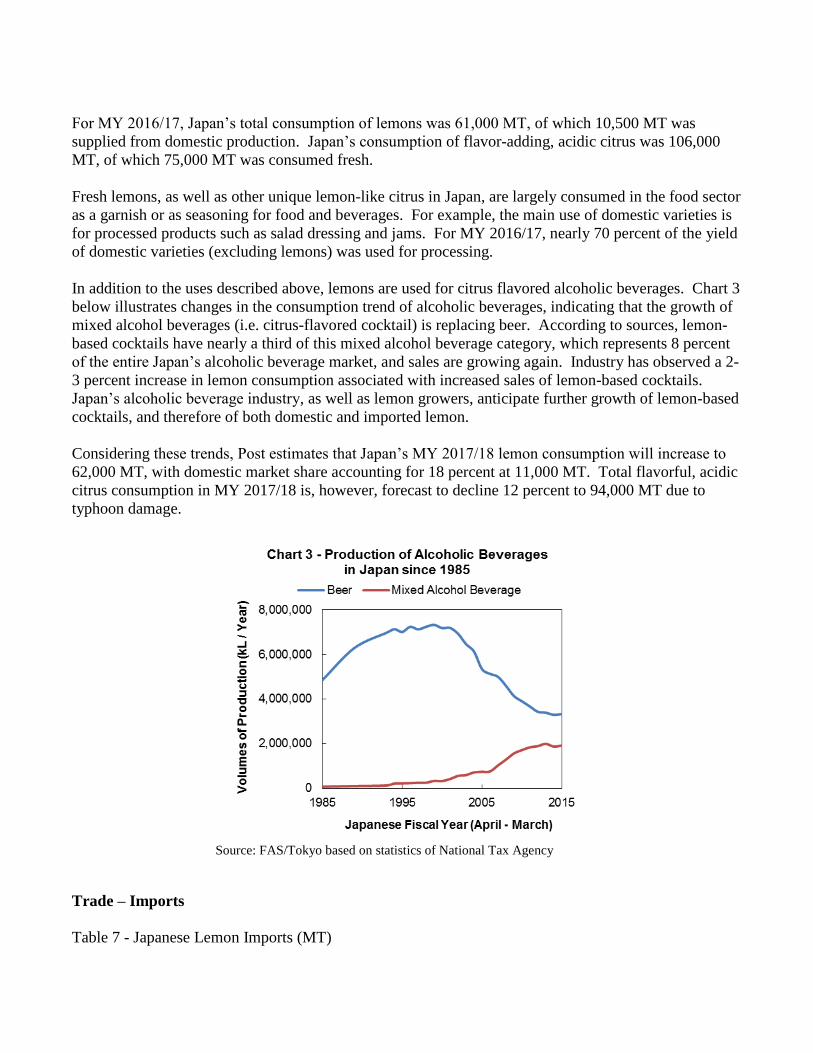
In addition to the uses described above, lemons are used for citrus flavored alcoholic beverages. Chart 3
below illustrates changes in the consumption trend of alcoholic beverages, indicating that the growth of
mixed alcohol beverages (i.e. citrus-flavored cocktail) is replacing beer. According to sources, lemon-
based cocktails have nearly a third of this mixed alcohol beverage category, which represents 8 percent
of the entire Japan’s alcoholic beverage market, and sales are growing again. Industry has observed a 2-
3 percent increase in lemon consumption associated with increased sales of lemon-based cocktails.
Japan’s alcoholic beverage industry, as well as lemon growers, anticipate further growth of lemon-based
cocktails, and therefore of both domestic and imported lemon.
Considering these trends, Post estimates that Japan’s MY 2017/18 lemon consumption will increase to
62,000 MT, with domestic market share accounting for 18 percent at 11,000 MT. Total flavorful, acidic
citrus consumption in MY 2017/18 is, however, forecast to decline 12 percent to 94,000 MT due to
typhoon damage.
Source: FAS/Tokyo based on statistics of National Tax Agency
Trade – Imports
Table 7 - Japanese Lemon Imports (MT)
MY
2013/14
MY
2014/15
MY
2015/16
MY
2016/17
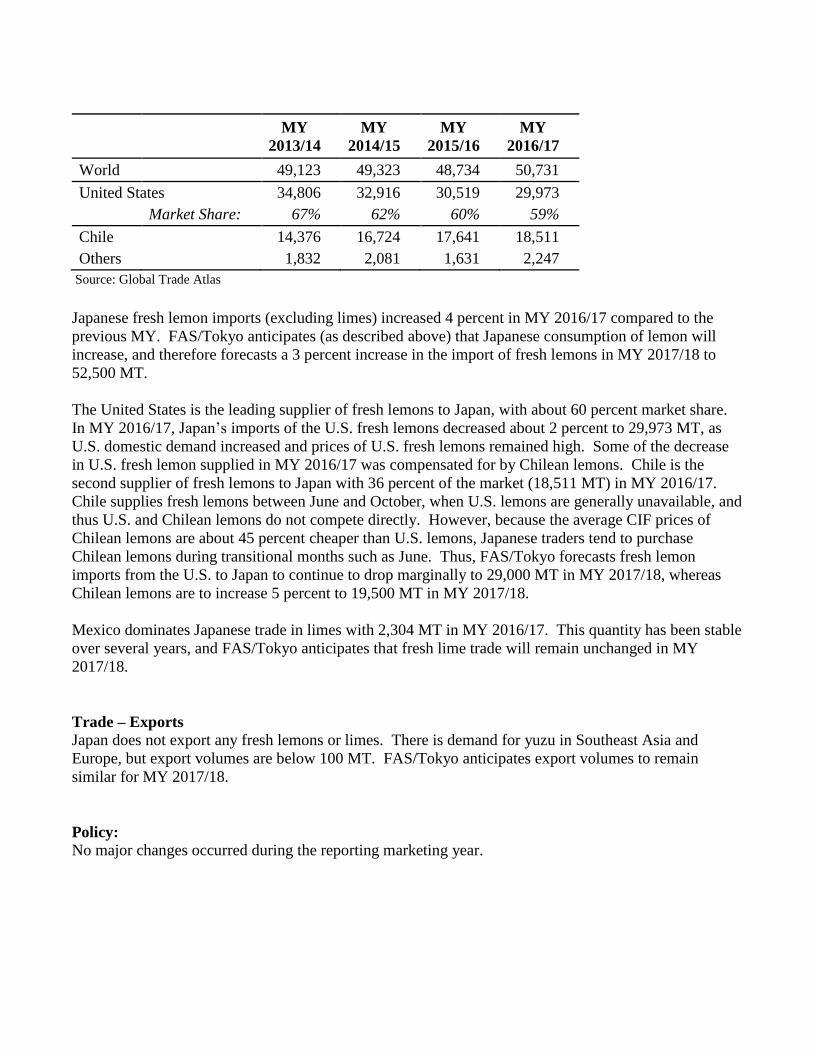
World
49,123 49,323 48,734 50,731
United States 34,806 32,916 30,519 29,973
Market Share: 67% 62% 60% 59%
Chile
14,376 16,724 17,641 18,511
Others 1,832 2,081 1,631 2,247
Source: Global Trade Atlas
Japanese fresh lemon imports (excluding limes) increased 4 percent in MY 2016/17 compared to the
previous MY. FAS/Tokyo anticipates (as described above) that Japanese consumption of lemon will
increase, and therefore forecasts a 3 percent increase in the import of fresh lemons in MY 2017/18 to
52,500 MT.
The United States is the leading supplier of fresh lemons to Japan, with about 60 percent market share.
In MY 2016/17, Japan’s imports of the U.S. fresh lemons decreased about 2 percent to 29,973 MT, as
U.S. domestic demand increased and prices of U.S. fresh lemons remained high. Some of the decrease
in U.S. fresh lemon supplied in MY 2016/17 was compensated for by Chilean lemons. Chile is the
second supplier of fresh lemons to Japan with 36 percent of the market (18,511 MT) in MY 2016/17.
Chile supplies fresh lemons between June and October, when U.S. lemons are generally unavailable, and
thus U.S. and Chilean lemons do not compete directly. However, because the average CIF prices of
Chilean lemons are about 45 percent cheaper than U.S. lemons, Japanese traders tend to purchase
Chilean lemons during transitional months such as June. Thus, FAS/Tokyo forecasts fresh lemon
imports from the U.S. to Japan to continue to drop marginally to 29,000 MT in MY 2017/18, whereas
Chilean lemons are to increase 5 percent to 19,500 MT in MY 2017/18.
Mexico dominates Japanese trade in limes with 2,304 MT in MY 2016/17. This quantity has been stable
over several years, and FAS/Tokyo anticipates that fresh lime trade will remain unchanged in MY
2017/18.
Trade – Exports
Japan does not export any fresh lemons or limes. There is demand for yuzu in Southeast Asia and
Europe, but export volumes are below 100 MT. FAS/Tokyo anticipates export volumes to remain
similar for MY 2017/18.
Policy:
No major changes occurred during the reporting marketing year.
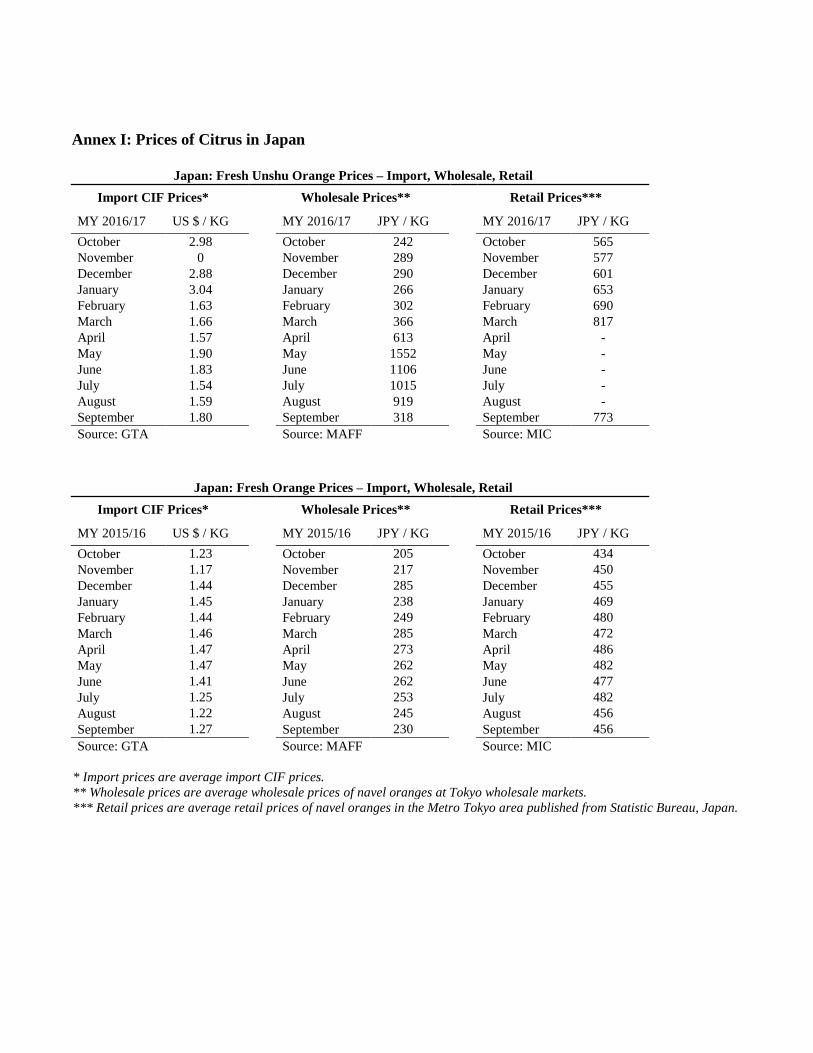
Annex I: Prices of Citrus in Japan
Japan: Fresh Unshu Orange Prices – Import, Wholesale, Retail
Import CIF Prices* Wholesale Prices** Retail Prices***
MY 2016/17 US $ / KG
MY 2016/17 JPY / KG
MY 2016/17 JPY / KG
October 2.98
October 242
October 565
November 0
November 289
November 577
December 2.88
December 290
December 601
January 3.04
January 266
January 653
February 1.63
February 302
February 690
March 1.66
March 366
March 817
April 1.57
April 613
April -
May 1.90
May 1552
May -
June 1.83
June 1106
June -
July 1.54
July 1015
July -
August 1.59
August 919
August -
September 1.80
September 318
September 773
Source: GTA
Source: MAFF
Source: MIC
Japan: Fresh Orange Prices – Import, Wholesale, Retail
Import CIF Prices* Wholesale Prices** Retail Prices***
MY 2015/16 US $ / KG
MY 2015/16 JPY / KG
MY 2015/16 JPY / KG
October 1.23
October 205
October 434
November 1.17
November 217
November 450
December 1.44
December 285
December 455
January 1.45
January 238
January 469
February 1.44
February 249
February 480
March 1.46
March 285
March 472
April 1.47
April 273
April 486
May 1.47
May 262
May 482
June 1.41
June 262
June 477
July 1.25
July 253
July 482
August 1.22
August 245
August 456
September 1.27
September 230
September 456
Source: GTA
Source: MAFF
Source: MIC
* Import prices are average import CIF prices.
** Wholesale prices are average wholesale prices of navel oranges at Tokyo wholesale markets.
*** Retail prices are average retail prices of navel oranges in the Metro Tokyo area published from Statistic Bureau, Japan.
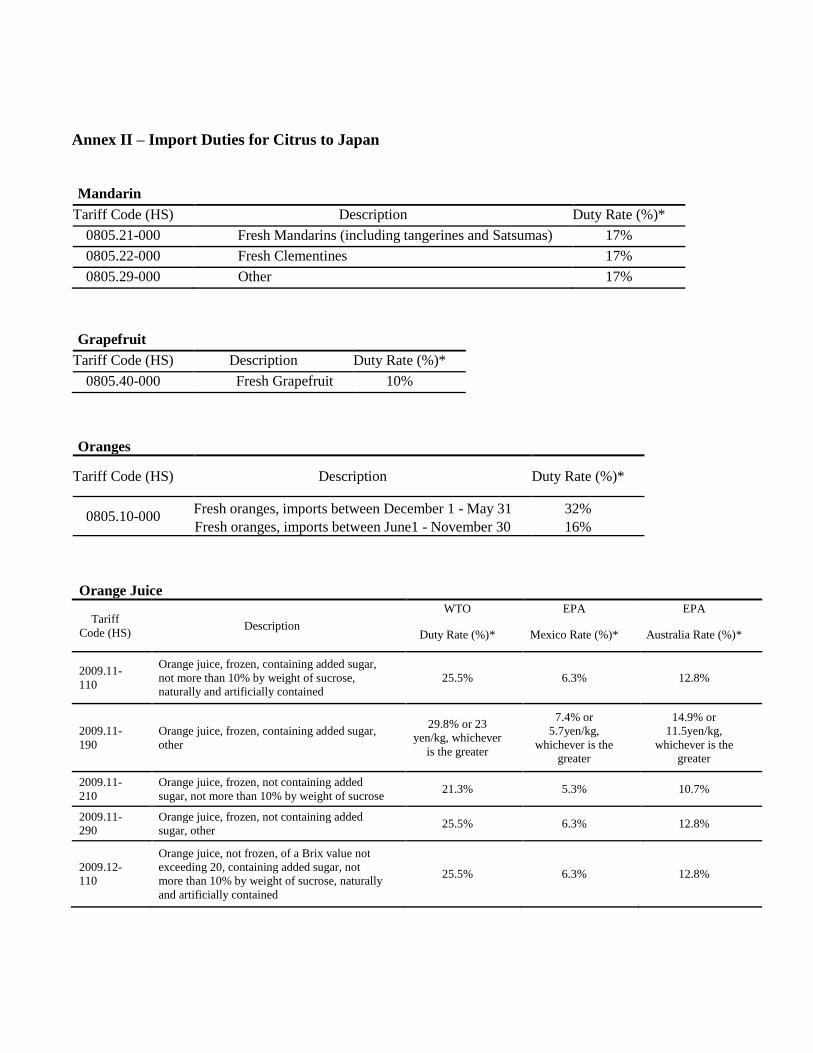
Annex II – Import Duties for Citrus to Japan
Mandarin
Tariff Code (HS) Description Duty Rate (%)*
0805.21-000 Fresh Mandarins (including tangerines and Satsumas) 17%
0805.22-000 Fresh Clementines 17%
0805.29-000 Other 17%
Grapefruit
Tariff Code (HS) Description Duty Rate (%)*
0805.40-000 Fresh Grapefruit 10%
Oranges
Tariff Code (HS) Description Duty Rate (%)*
0805.10-000 Fresh oranges, imports between December 1 - May 31 32%
Fresh oranges, imports between June1 - November 30 16%
Orange Juice
Tariff
Code (HS) Description
WTO EPA EPA
Duty Rate (%)* Mexico Rate (%)* Australia Rate (%)*
2009.11-
110
Orange juice, frozen, containing added sugar,
not more than 10% by weight of sucrose,
naturally and artificially contained
25.5% 6.3% 12.8%
2009.11-
190
Orange juice, frozen, containing added sugar,
other
29.8% or 23
yen/kg, whichever
is the greater
7.4% or
5.7yen/kg,
whichever is the
greater
14.9% or
11.5yen/kg,
whichever is the
greater
2009.11-
210
Orange juice, frozen, not containing added
sugar, not more than 10% by weight of sucrose 21.3% 5.3% 10.7%
2009.11-
290
Orange juice, frozen, not containing added
sugar, other 25.5% 6.3% 12.8%
2009.12-
110
Orange juice, not frozen, of a Brix value not
exceeding 20, containing added sugar, not
more than 10% by weight of sucrose, naturally
and artificially contained
25.5% 6.3% 12.8%
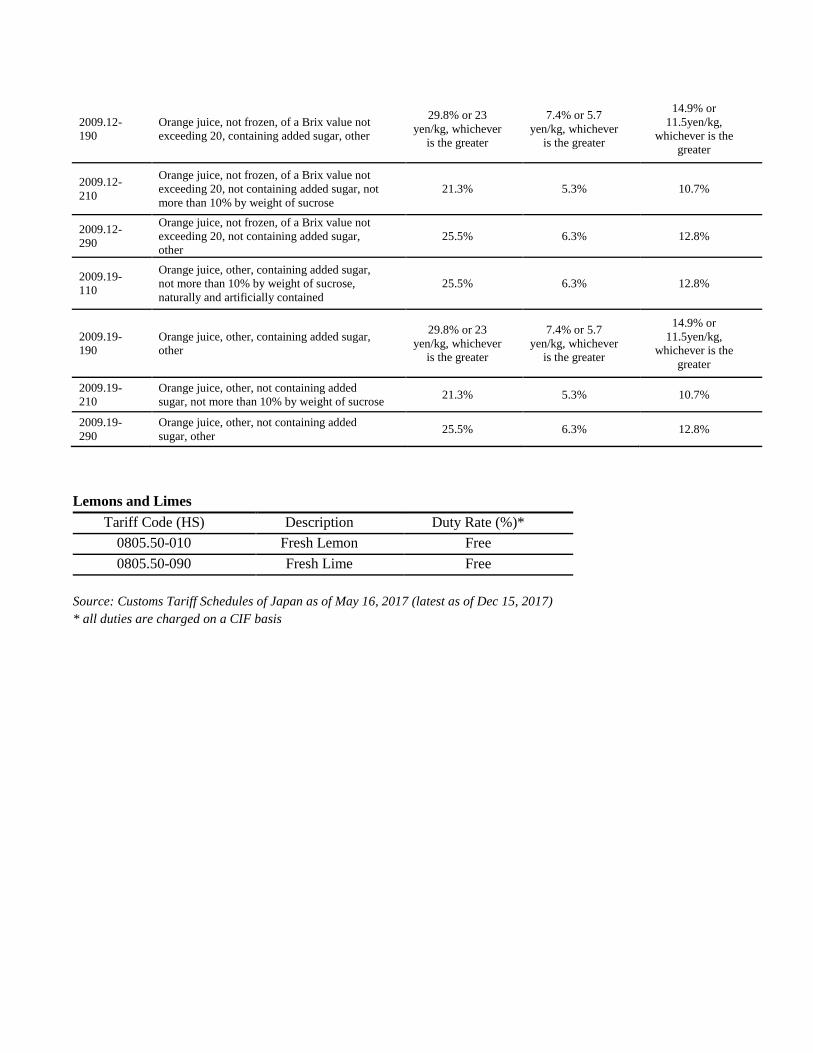
2009.12-
190
Orange juice, not frozen, of a Brix value not
exceeding 20, containing added sugar, other
29.8% or 23
yen/kg, whichever
is the greater
7.4% or 5.7
yen/kg, whichever
is the greater
14.9% or
11.5yen/kg,
whichever is the
greater
2009.12-
210
Orange juice, not frozen, of a Brix value not
exceeding 20, not containing added sugar, not
more than 10% by weight of sucrose
21.3% 5.3% 10.7%
2009.12-
290
Orange juice, not frozen, of a Brix value not
exceeding 20, not containing added sugar,
other
25.5% 6.3% 12.8%
2009.19-
110
Orange juice, other, containing added sugar,
not more than 10% by weight of sucrose,
naturally and artificially contained
25.5% 6.3% 12.8%
2009.19-
190
Orange juice, other, containing added sugar,
other
29.8% or 23
yen/kg, whichever
is the greater
7.4% or 5.7
yen/kg, whichever
is the greater
14.9% or
11.5yen/kg,
whichever is the
greater
2009.19-
210
Orange juice, other, not containing added
sugar, not more than 10% by weight of sucrose 21.3% 5.3% 10.7%
2009.19-
290
Orange juice, other, not containing added
sugar, other 25.5% 6.3% 12.8%
Lemons and Limes
Tariff Code (HS) Description Duty Rate (%)*
0805.50-010 Fresh Lemon Free
0805.50-090 Fresh Lime Free
Source: Customs Tariff Schedules of Japan as of May 16, 2017 (latest as of Dec 15, 2017)
* all duties are charged on a CIF basis