january 23, 2006transportation research board 85 th annual meeting using ground truth geospatial...
TRANSCRIPT

January 23, 2006Transportation Research Board 85th Annual Meeting
Using Ground Truth Geospatial Data to Validate Advanced Traveler Information Systems Freeway Travel Time Messages
Transportation Research Board Annual Meeting, January 23, 2006
Christopher M. MonsereDepartment of Civil & Environmental EngineeringPortland State University
Aaron BreakstoneSchool of Urban Studies & Planning Portland State University
Robert L. Bertini Department of Civil & Environmental EngineeringPortland State University
Dean DeeterCastle Rock Consultants
Galen McGillOregon Department of Transportation
January 23, 2006Transportation Research Board 85th Annual Meeting
Outline
• Introduction
• Study Area
• Archived Data
• Data Collection
• Data Analysis
• Conclusions
• Next Steps
January 23, 2006Transportation Research Board 85th Annual Meeting
Outline
• Introduction
• Study Area
• Archived Data
• Data Collection
• Data Analysis
• Conclusions
• Next Steps

January 23, 2006Transportation Research Board 85th Annual Meeting
Project Goal
• Evaluation of Oregon Department of Transportation (ODOT)’s travel time estimating and reporting capabilities

January 23, 2006Transportation Research Board 85th Annual Meeting
Real-time Travel Time Estimates
• FHWA policy• Variety of technologies
– Inductive loop detectors– Microwave radar– Automatic vehicle tag matching– Video detection– License plate matching– Cell phone matching
• Past research– General accuracy in free-flow conditions– Recurring congestion & incidents more challenging
January 23, 2006Transportation Research Board 85th Annual Meeting
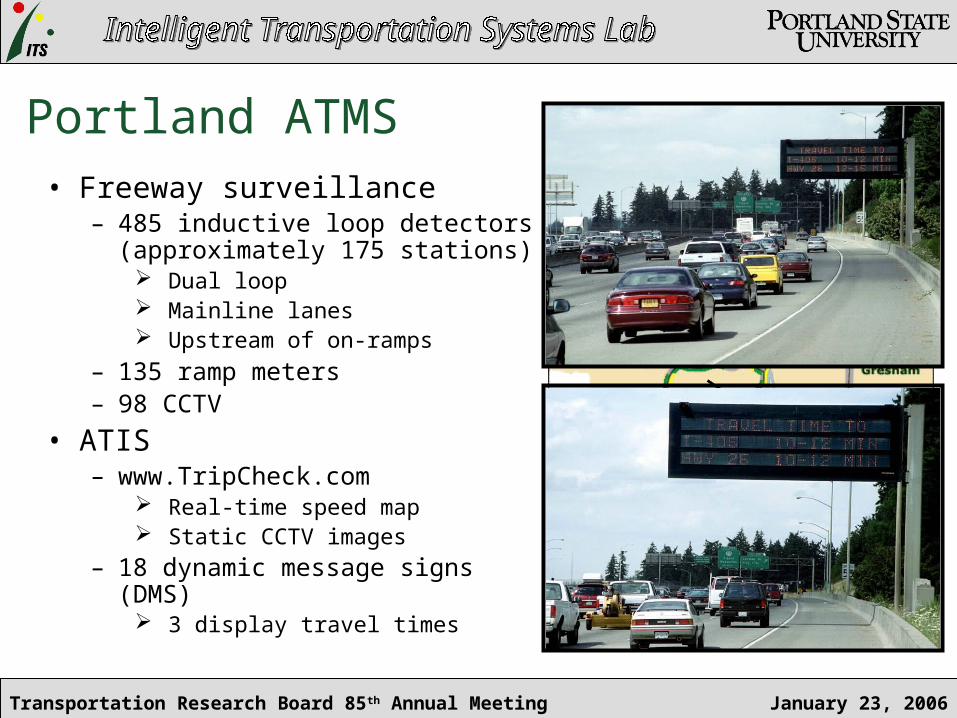
Portland ATMS• Freeway surveillance
– 485 inductive loop detectors (approximately 175 stations)
Dual loop Mainline lanes Upstream of on-ramps
– 135 ramp meters– 98 CCTV
• ATIS– www.TripCheck.com
Real-time speed map Static CCTV images
– 18 dynamic message signs (DMS) 3 display travel times

January 23, 2006Transportation Research Board 85th Annual Meeting
Outline
• Introduction
• Study Area
• Archived Data
• Data Collection
• Data Analysis
• Conclusions
• Next Steps
January 23, 2006Transportation Research Board 85th Annual Meeting
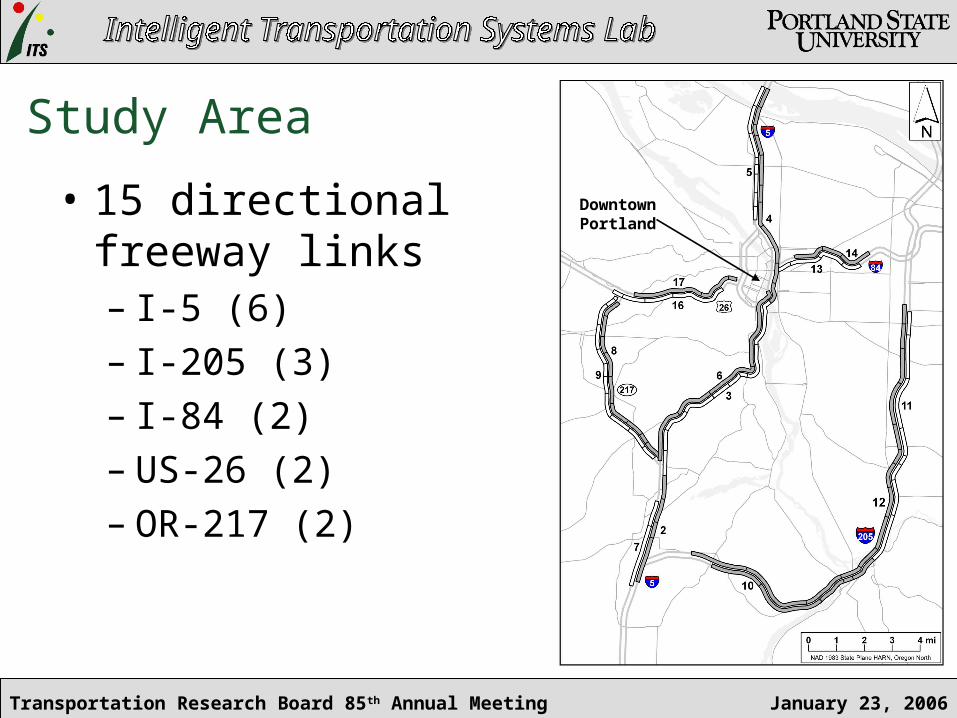
Study Area
• 15 directional freeway links– I-5 (6)– I-205 (3) – I-84 (2)– US-26 (2)– OR-217 (2)
Downtown Portland

January 23, 2006Transportation Research Board 85th Annual Meeting
Travel Time Calculation
Influence
Area 4 Travel Time 4
Travel Time 1Influence
Area 1
Travel Time 3Influence
Area 3
Travel Time 2Influence
Area 2
Link Travel Time
(TT1 + TT2 + TT3 + TT4)
Downtown Portland
January 23, 2006Transportation Research Board 85th Annual Meeting
Outline
• Introduction
• Study Area
• Archived Data
• Data Collection
• Data Analysis
• Conclusions
• Next Steps
January 23, 2006Transportation Research Board 85th Annual Meeting
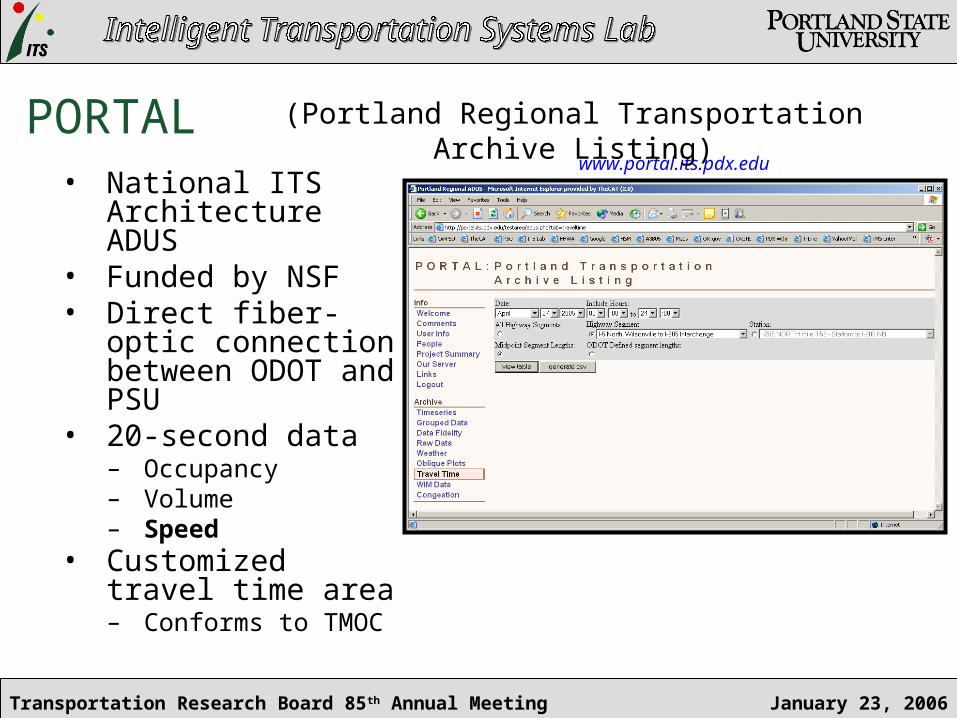
PORTAL• National ITS
Architecture ADUS• Funded by NSF• Direct fiber-optic
connection between ODOT and PSU
• 20-second data– Occupancy– Volume– Speed
• Customized travel time area – Conforms to TMOC
www.portal.its.pdx.edu
(Portland Regional Transportation Archive Listing)

January 23, 2006Transportation Research Board 85th Annual Meeting
Outline
• Introduction
• Study Area
• Archived Data
• Data Collection
• Data Analysis
• Conclusions
• Next Steps
January 23, 2006Transportation Research Board 85th Annual Meeting
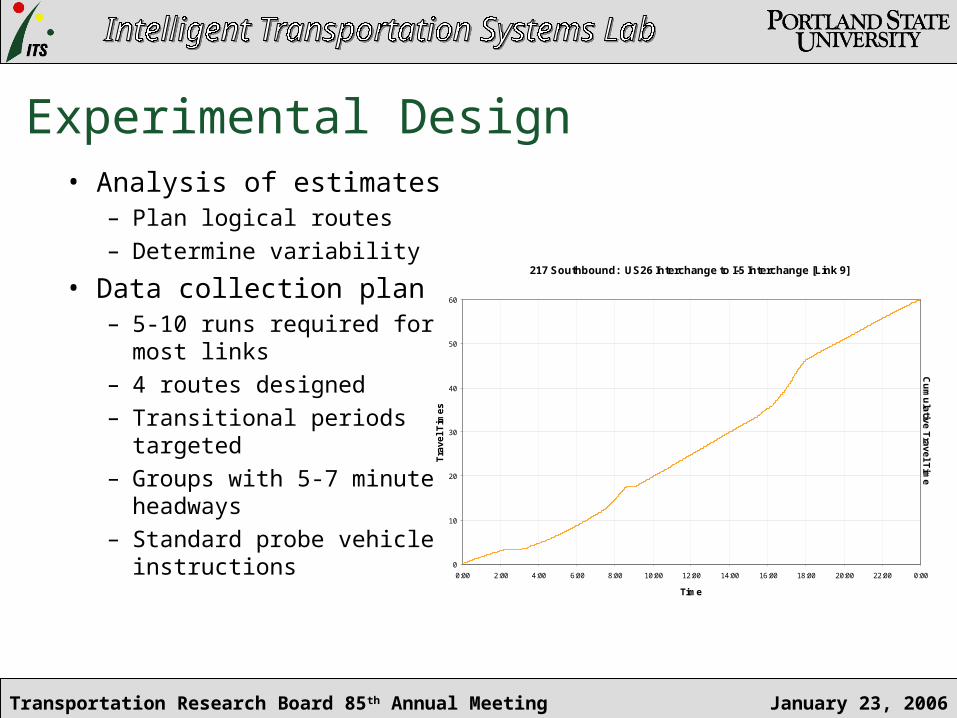
Experimental Design• Analysis of estimates
– Plan logical routes– Determine variability
• Data collection plan– 5-10 runs required for
most links– 4 routes designed– Transitional periods
targeted– Groups with 5-7 minute
headways– Standard probe vehicle
instructions
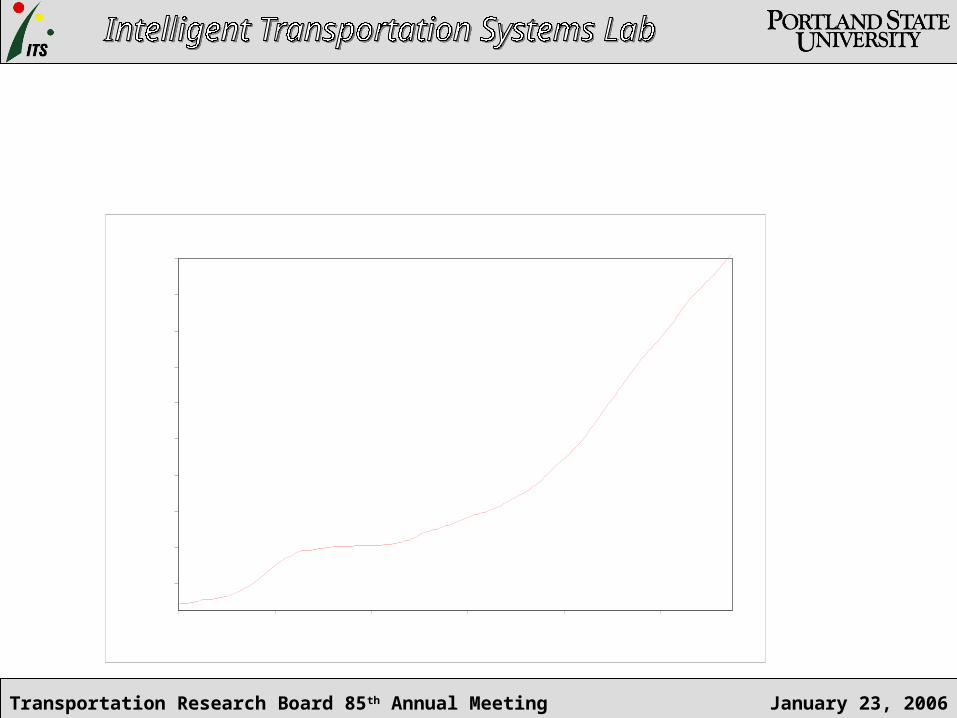
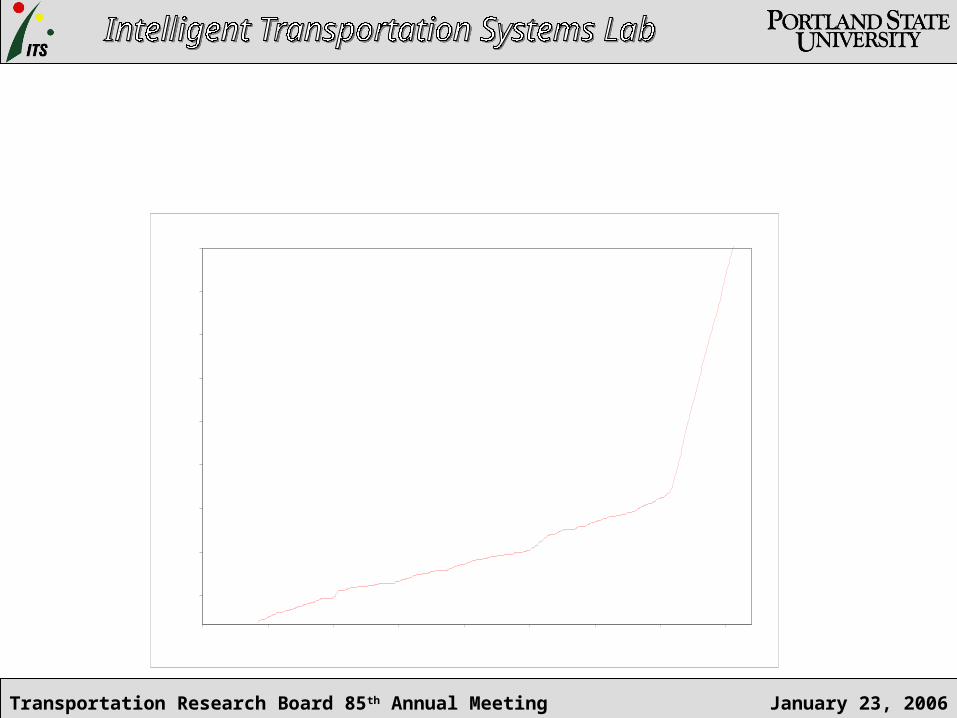
217 Southbound: US26 Interchange to I-5 Interchange [Link 9]
0
10
20
30
40
50
60
0:00 2:00 4:00 6:00 8:00 10:00 12:00 14:00 16:00 18:00 20:00 22:00 0:00
Time
Tra
ve
l T
ime
s
Cu
mu
lativ
e T
rav
el T
ime
January 23, 2006Transportation Research Board 85th Annual Meeting
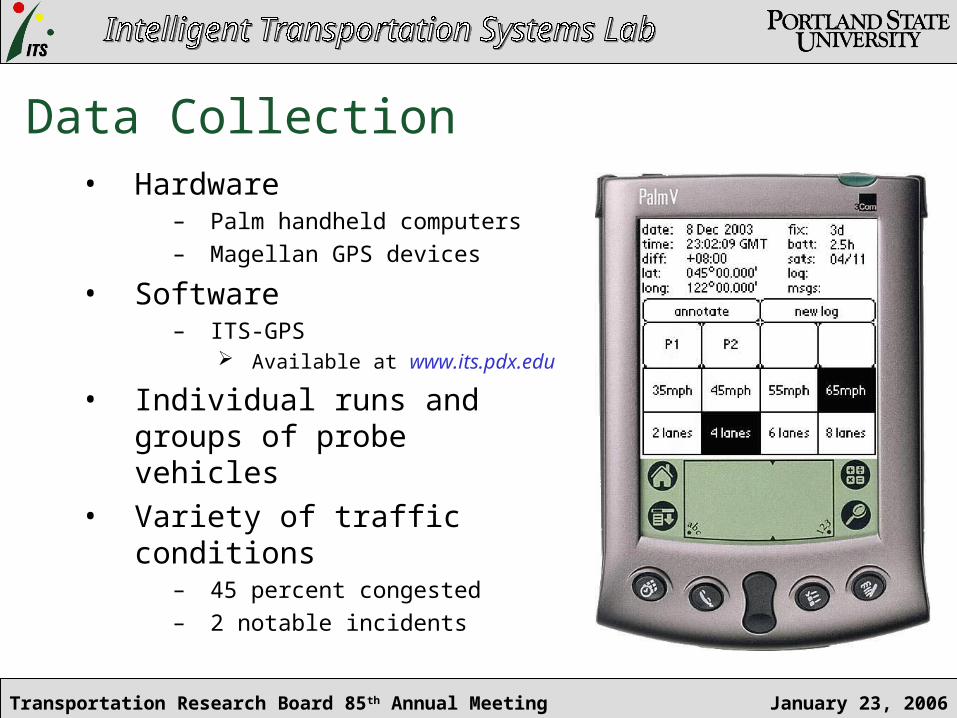
Data Collection• Hardware
– Palm handheld computers
– Magellan GPS devices
• Software– ITS-GPS
Available at www.its.pdx.edu
• Individual runs and groups of probe vehicles
• Variety of traffic conditions– 45 percent congested
– 2 notable incidents
January 23, 2006Transportation Research Board 85th Annual Meeting
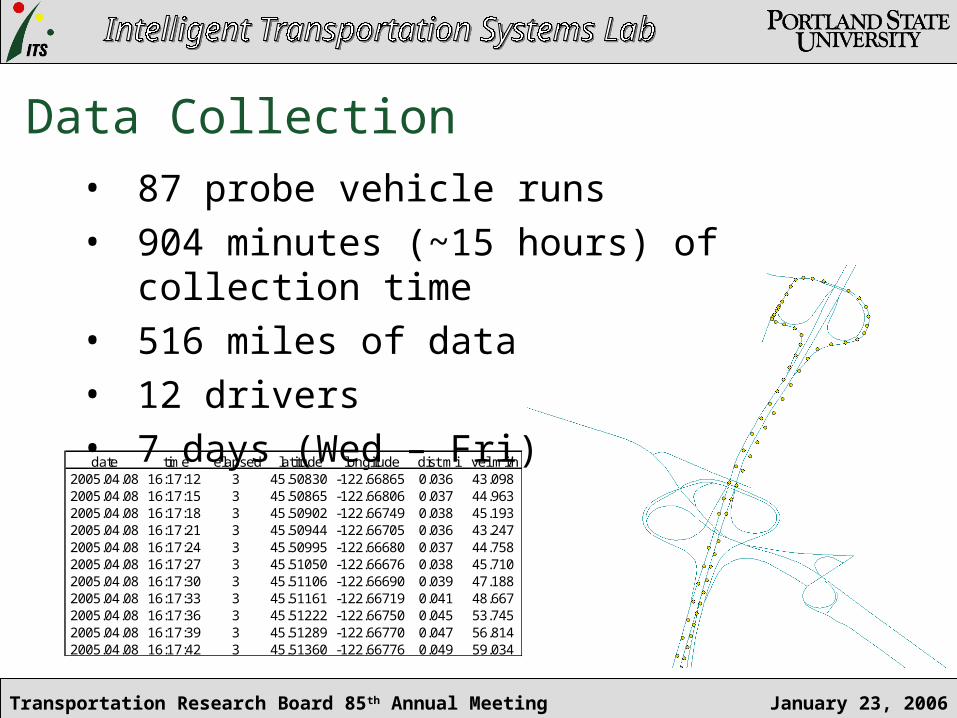
Data Collection• 87 probe vehicle runs• 904 minutes (~15 hours) of collection time• 516 miles of data• 12 drivers• 7 days (Wed – Fri)
date time elapsed latitude longitude dist mi vel mi/h2005.04.08 16:17:12 3 45.50830 -122.66865 0.036 43.0982005.04.08 16:17:15 3 45.50865 -122.66806 0.037 44.9632005.04.08 16:17:18 3 45.50902 -122.66749 0.038 45.1932005.04.08 16:17:21 3 45.50944 -122.66705 0.036 43.2472005.04.08 16:17:24 3 45.50995 -122.66680 0.037 44.7582005.04.08 16:17:27 3 45.51050 -122.66676 0.038 45.7102005.04.08 16:17:30 3 45.51106 -122.66690 0.039 47.1882005.04.08 16:17:33 3 45.51161 -122.66719 0.041 48.6672005.04.08 16:17:36 3 45.51222 -122.66750 0.045 53.7452005.04.08 16:17:39 3 45.51289 -122.66770 0.047 56.8142005.04.08 16:17:42 3 45.51360 -122.66776 0.049 59.034

January 23, 2006Transportation Research Board 85th Annual Meeting
Outline
• Introduction
• Study Area
• Archived Data
• Data Collection
• Data Analysis
• Conclusions
• Next Steps

January 23, 2006Transportation Research Board 85th Annual Meeting
Probe Vehicle Data• Individual runs
downloaded – “run” = several links
+ extraneous data
• Unique ID for each GPS record
• Runs plotted on freeway network
– Links color-coded
• Pertinent data segments extracted
last point on Link 9
last point on Link 2
first point on Link 3

January 23, 2006Transportation Research Board 85th Annual Meeting
Matching Estimates• Nearest 20-second interval
– e.g. 9:15:34 9:15:20
• Aggregation– Averages more realistic to operation of system
Average of nearest interval and 1 minute prior Average of nearest interval and 3 minutes prior

January 23, 2006Transportation Research Board 85th Annual Meeting
Probe vs. Estimated Travel Times
0
5
10
15
20
25
30
35
0 5 10 15 20 25 30 35
Observed Probe Vehicle Travel Tim e
Est
imat
ed T
rave
l Tim
e
Average of previous 3 minutes

January 23, 2006Transportation Research Board 85th Annual Meeting
-100%
-80%
-60%
-40%
-20%
0%
20%
40%
60%
80%
100%
2 3 4 5 6 7 8 9 10 12 13 14 16 17
Link Num ber
Per
cen
t E
rro
rResults
January 23, 2006Transportation Research Board 85th Annual Meeting
Outline
• Introduction
• Study Area
• Archived Data
• Data Collection
• Data Analysis
• Conclusions
• Next Steps

January 23, 2006Transportation Research Board 85th Annual Meeting
Conclusions • Estimates reasonably accurate given current
system configuration– Many within 20% of probe times– Less so under congested conditions– Incidents produced highest error
• Averaging improves accuracy• Detector density and location critical
January 23, 2006Transportation Research Board 85th Annual Meeting
303.5
304.0
304.5
305.0
305.5
306.0
306.5
307.0
307.5
308.0
8:06:00 8:08:00 8:10:00 8:12:00 8:14:00 8:16:00
Time
Mile
po
st
Run 7292.3
293.3
294.3
295.3
296.3
297.3
298.3
299.3
300.3
8:05:00 8:10:00 8:15:00 8:20:00 8:25:00 8:30:00
Time
Mile
po
stConclusions
• Detector density and location criticalEstimated Travel Time: ~25.5 minutes
Probe Travel Time: ~14.5 minutes
68.9
69.4
69.9
70.4
70.9
71.4
71.9
72.4
72.9
8:17:00 8:18:30 8:20:00 8:21:30 8:23:00 8:24:30 8:26:00 8:27:30
Time
Mile
po
st
Probe
Projection
Influence Area Limit
Probe Travel Time: ~11 minutes
Estimated Travel Time: ~9.5 minutes
January 23, 2006Transportation Research Board 85th Annual Meeting
0.3
1.1
1.9
2.7
3.5
4.3
5.1
5.9
6.7
8:18:00 8:23:00 8:28:00 8:33:00 8:38:00 8:43:00 8:48:00 8:53:00 8:58:00
Time
Mile
po
st
69.7
70.2
70.7
71.2
71.7
72.2
72.7
73.2
73.7
16:26:00 16:28:00 16:30:00 16:32:00 16:34:00 16:36:00 16:38:00 16:40:00 16:42:00
Time
Mile
po
st
Conclusions• Incidents difficult to capture

January 23, 2006Transportation Research Board 85th Annual Meeting
Outline
• Introduction
• Study Area
• Archived Data
• Data Collection
• Data Analysis
• Conclusions
• Next Steps

January 23, 2006Transportation Research Board 85th Annual Meeting
Next Steps
• More data– Targeted conditions– Fill gaps
Incidents Software/hardware issues
– Up-to-date
• Different algorithms– Historical data– Other detectors
January 23, 2006Transportation Research Board 85th Annual Meeting
Acknowledgements
• ODOT– Stacy Shetler– Dennis Mitchell– Jack Marchant
– Hau Hagedorn
• Student Drivers
• PSU Department of Civil and Environmental Engineering