january | 2021 | mthcf
TRANSCRIPT

How Medicaid Affects Montana’s State Budget, Economy, and Health
January | 2021 | MTHCF.ORG

Medicaid in Montana – January 2021
Acknowledgements
Montana Healthcare Foundation (MHCF) makes strategic investments to improve the health and well-being of all Montanans. Created in 2013, MHCF has approximately $200 million in assets making it Montana's largest health-focused, private foundation. MHCF contributes to a measurably healthier state by supporting access to quality and affordable health services, conducting evidence-driven research and analysis, and addressing the upstream influences on health and illness. To learn more about the Foundation and its focus areas, please visit mthcf.org.
Manatt Health integrates legal and consulting expertise to serve the complex needs of clients across the health care system. Combining legal excellence, first-hand experience in shaping public policy, sophisticated strategy insight, and deep analytic capabilities, we provide uniquely valuable professional services to the full range of health industry players. Our diverse team of more than 135 attorneys and consultants from Manatt, Phelps & Phillips, LLP and its consulting subsidiary, Manatt Health Strategies, LLC, is passionate about helping our clients advance their business interests, fulfill their missions, and lead health care into the future. For more information, visit manatt.com/Health.
2
This report would not have been possible without the partnership and support of the Montana Department of Public Health and Human Services (DPHHS). MHCF would also like to acknowledge the support of the Montana Department of Corrections and the Montana Department of Labor and Industry in the development of this report and thank our reviewers for sharing their time and expertise, including: Heather O’Loughlin, Montana Budget and Policy Center; Stacey Anderson, Montana Primary Care Association; Rich Rasmussen and Duane Preshinger, Montana Hospital Association.

Medicaid in Montana – January 2021
Letter from Montana Healthcare Foundation CEO Dr. Aaron Wernham
3
This report is intended to provide a clear, objective analysis of Montana’s Medicaid program, its beneficiaries and costs, and how it affects the health system and health outcomes of Montanans.
Medicaid provides insurance coverage for 265,000 of Montana’s most vulnerable citizens. It serves as a funding source that enables Montana communities to build and sustain health services, including primary care, dental care, mental health and substance abuse treatment, specialty care, and hospital and emergency care. As such, Medicaid ranks as one of the most important resources for improving the health of Montanans.
MHCF is Montana’s largest independent, 501(c)3 private foundation focused on health. We make strategic investments that contribute to a measurably healthier state by supporting access to quality and affordable health services, addressing the upstream influences on health and illness, and conducting evidence-driven research and analysis.
Given the importance of Medicaid in Montana’s health system, for the past four years, MHCF has conducted research and analysis to help the public and policymakers better understand the program and to identify opportunities to strengthen it. MHCF’s Medicaid reports are widely relied on by the public, the press, government officials, and lawmakers.
This year, based on our previous work, we decided to create an annual report on Medicaid. This first annual report coincides with the coronavirus pandemic, an unprecedented public health emergency. Montana’s safety net, including Medicaid, has never been more important as a resource to support families that have lost income and hospitals and providers working on the front lines ofthe pandemic. Even with incomplete data for 2020, the report offers important insights into the role Medicaid plays in Montana’sresponse to the pandemic.
We offer special thanks to our partners at the Montana Department of Public Health and Human Services. They made this report possible through contributing data, expertise, and insights on Medicaid.

Medicaid in Montana – January 2021
Executive Summary
Montana’s Medicaid program provides Montanans with low-incomes access to health care benefits and services based on their medical needs and life circumstances. Its Healthy Montana Kids program is the largest provider of health care for children in the state; while Medicaid more broadly serves as a safety net for Montanans who are blind and disabled, women who are pregnant or have breast or cervical cancer, families with dependent children, and other adults with low-incomes.
Medicaid provides coverage for one-in-four Montanans (265,000 people).
• Medicaid is jointly funded with the federal government, which reimbursed Montana for 75 cents of every dollar it spent on member care in State Fiscal Year 2019.
• Expanding Medicaid to cover more children and adults was central to halving uninsured rates in Montana since 2008.
• Nearly two-thirds (65%) of Medicaid recipients live in rural Montana; and nearly 50,000 American Indians have coverage through Medicaid.
• Seniors and individuals with disabilities comprise only 15% of the Medicaid population but contribute to 40% of Medicaid expenditures.
• Medicaid-covered behavioral telehealth service visits increased by over 1,400% through August 2020, as Medicaid waived in-person service delivery requirements for many physical and behavioral health services during to the pandemic.
4

Medicaid in Montana – January 2021
Executive Summary Continued
The HELP Act expanded Medicaid in 2016 to cover over 90,000 Montanans with incomes at or below 138% of the Federal Poverty Level.
• Approximately 95% of expansion enrollees are working (72%), ill or disabled (10%), caretakers (7%), or in school (6%).
• Medicaid expansion supports workers with low-incomes and their employers, with nearly six-in-ten Montana businesses having at least one employee enrolled in Medicaid during 2018 and 2019.
• Medicaid expansion enrollees stay in the program for an average of only two years.
• Medicaid expansion improved health care access for Montanans, supporting their health, well-being, and productivity. In 2019, over 60,000 expansion enrollees received preventive services, over 30,000 received mental health treatments, and over 5,000 received substance use disorder treatments.
• The HELP Act and Medicaid expansion generated state budget savings exceeding $28 million in State Fiscal Year 2019 by providing higher match rates for some existing Medicaid populations and by replacing existing state spending with new federal dollars.
• Medicaid expansion continues to infuse over $650 million in new federal spending into Montana annually, creating jobs and economic activity.
• With the implementation of expansion, uncompensated care costs for hospitals in Montana halved.
5

Table of Contents
» Program Background
» Montana Medicaid Basics
» The Impact of Medicaid Expansion
» Special Topic:Medicaid as a Critical Support for Tribal Communities
» Conclusion
Medicaid in Montana – January 2021

Program Background
MTHCF.ORG

Medicaid in Montana – January 2021
Medicaid is a critical safety net program that provides Montanans with low-incomes with access to health care benefits. The federal government pays most of its cost.
Montana Medicaid and the Children’s Health Insurance Plan (CHIP) – collectively referred to as “Medicaid” within this report – provide Montanans with low-incomes with access to low- or no-cost health care benefits and services based on their medical needs and life circumstances (e.g., disabilities, pregnancy). The Healthy Montana Kids program is the largest provider of health care for children in the state; while Medicaid more broadly also serves as a safety net for Montanans who are blind and disabled, women who are pregnant or have breast or cervical cancer, families with dependent children, and other adults with low-incomes since its expansion in 2016.
8
Program Background Montana Medicaid Basics The Impact of Medicaid Expansion Tribal Communities Conclusion
Medicaid is a joint federal-state program managed locally by the Montana Department of Public Health and Human Services (DPHHS) and federally by the U.S. Centers for Medicare and Medicaid Services (CMS). DPHHS and CMS agree to a “state plan” that outlines how DPHHS will administer Montana’s Medicaid program, including who will be eligible to receive services and what services they will be eligible to receive, beyond those minimally required by CMS. The state plan is sometimes modified by jointly agreed-to “waivers” of statutory requirements, which allow Montana to tailor its Medicaid program to meet local needs and pursue alternative approaches for achieving program goals.
Medicaid services are funded by a combination of federal and state funds. Montana receives approximately two “federal” dollars for every “state” dollar it expends on Medicaid enrollees’ medical care at health care providers across the state. Federal reimbursement rates are higher for “expansion” enrollees (over 90%) and for Indian Health Services and Tribal Health Services (100%), among other populations and services.
This report provides foundational information and statistics on the Montana Medicaid program, who its serves, their health care needs, and their medical costs. It also speaks to the role Medicaid expansion has played in expanding coverage for many previously uninsured Montanans, and the impact it has had on enrollees’ health and well-being, the state budget, and the state economy by infusing new federal dollars into Montana’s health care system.
Program Background Montana Medicaid Basics The Impact of Medicaid Expansion Tribal Communities Conclusion

Medicaid in Montana – January 2021
Medicaid provides access to health care coverage for Montanans of all ages.
9
Covered Populations
Other Populations with Complex Conditions*
Children(112,000 enrollees)
Medicaid provides services and support for people with complex conditions including those with
severe mental illness and breast or cervical cancer.
Adults(136,000 enrollees)
Medicaid (including CHIP) covers children up to 19 years of age who are in families with incomes up to 261% of
the Federal Poverty Line (FPL).*
Medicaid covers non-elderly, non-disabled adults who have incomes up
to 138% FPL.*
Seniors(18,000 enrollees)
Adults & Children w/ Disabilities
(21,000 enrollees)
Medicaid covers children and adults who are blind or disabled (income
levels vary based on Medicare and LTC status); and supports Medicare
premium payments.
Medicaid covers seniors who meet income thresholds (up to 73% FPL);
and supports Medicare premium payments, allowing low-income
seniors to “buy in” to federal coverage.
Pregnant Women(1,700 enrollees*)
Medicaid covers pregnant women with incomes up to 157% FPL from
time of pregnancy through 60 days postpartum.
Program Background Montana Medicaid Basics The Impact of Medicaid Expansion Tribal Communities Conclusion
* See technical notes for additional detail.

Medicaid in Montana – January 2021
• Early Periodic Screening, Diagnosis and Treatment: Montana Medicaid covers all medically necessary physical, behavioral health and dental services for children under the age of 21.
• Inpatient and Hospitalization Services: Montana Medicaid covers needed inpatient medical services for individuals who are admitted to a hospital.
• Primary and Specialty Care: Montana Medicaid covers primary care and specialty services, including those delivered by Montana’s critical Federally Qualified Health Centers (FQHCs) and Rural Health Centers (RHCs), which play a significant role in supporting the health of Montana’s underserved rural communities.
• Behavioral Health and Substance Use Disorder Treatment Support: Montana Medicaid covers behavioral health services such as psychiatry and crisis intervention to help individuals with mental illness receive the treatment and support they need. Medicaid also covers screening and treatment for individuals with substance use disorders.
• Dental Services: Recognizing the importance of oral health, Montana Medicaid covers necessary dental services including exams, cleanings, fillings and dentures.
• Long Term Services and Supports, including Home and Community-Based Services: For older and physically disabled Montanans who need assistance for daily activities, Medicaid covers long-term care services at nursing facilities. Under the Big Sky Waiver, Montanans can receive these services in their home or communities, rather than a nursing home or institutional setting.
Medicaid provides access to comprehensive health care services to address physical, behavioral health, dental, and long-term care needs.
10
Covered Services
Program Background Montana Medicaid Basics The Impact of Medicaid Expansion Tribal Communities Conclusion

Medicaid in Montana – January 2021
The federal government reimbursed Montana for 75 cents of every dollar Medicaid spent on caring for its members in State Fiscal Year 2019.
During SFY 2019, Montana Medicaid’s budget was $2.0B or 27% of Montana’s total budget, with:
§ Most expenditures (94%) on patient care, and directed to health care providers across Montana
§ Three quarters of the budget reimbursed by the federal government ($1.5B)
Montana benefitted from high federal match rates (FMAP) for its general population (65.5%) and the populations it covered (e.g., expansion enrollee FMAP was approximately 93% in 2019)
11
Montana Medicaid as Percentage of State Budget (SFY 2019)
Non-Medicaid
Medicaid$5.2B(63%)
$2.0B(27%)
General Fund, $335MSpecial Fund, $116M
State Spending
$0.5B
Federal Spending
$1.5B
Includes state and federal revenues
Montana had the 16th highest FMAP in the United States in SFY 2019 and had the 8th lowest rate of state general fund spending on Medicaid (14%).
Program Background Montana Medicaid Basics The Impact of Medicaid Expansion Tribal Communities Conclusion

MTHCF.ORG
Montana Medicaid Basics

Medicaid in Montana – January 2021
13.8% 12.6%11.4% 8.4%
4.9% 6.1% 6.2%
20.2% 20.2% 21.3%16.9%
9.8% 10.0%10.2%
0%
5%
10%
15%
20%
25%
Unin
sure
d Ra
teExpanding Medicaid coverage for children and adults was central to reducing uninsured rates in Montana, which declined by half from 2008 to 2019.
13
Montana Uninsured Rates (2008-2019)
[2008] Initiative 155 Healthy Montana Kids established
[2016] HELP Act implemented, after passage in 2015
Montana’s uninsured rate has halved since 2008 for both adults (20% to 10%) and children (14% to 6%), as the state expanded eligibility for both its Medicaid and CHIP programs. In 2008, Montana passed Initiative 155 to create Healthy Montana Kids (HMK), increasing CHIP eligibility to 266% FPL. In 2016, Montana’s 2015 HELP Act expanded Medicaid coverage to non-disabled adults, ages 19 to 64, with incomes up to 138% FPL.
Adults (19-64)
[2014] Montana’s federally-facilitated marketplace opened
Children
Program Background Montana Medicaid Basics The Impact of Medicaid Expansion Tribal Communities Conclusion
2008 2009 2010 2011 2012 2013 2014 2015 2016 2017 2018 2019
* Data from the MHCF’s “2019 Report on Health Coverage and Montana’s Insured,” available here, found a similar decline in uninsured rates after Medicaid expansion: 20% in 2013; 17% in 2014; 15% in 2015; followed by a drop to 7.4% in 2016; 7.8% in 2018; and 8.6% in 2019.

Medicaid in Montana – January 2021
0
100
200
300
Med
icai
d En
rolle
es (i
n th
ousa
nds)
The HELP Act expanded Medicaid to cover over 90,000 Montanans with incomes at or below 138% of the Federal Poverty Level ($17,609 for an individual in 2020).
14
Montana’s Medicaid enrollment has grown since 2010 as the state expanded eligibility for children in 2008 and adults in 2015 (implemented in 2016), and as the program supported a growing state population. Montana’s adult expansion provided nearly 100,000 Montanans with low-incomes with access to health care coverage its early years, before enrollment declined through 2019, prior to the pandemic. Montana’s Medicaid expansion enrollment has grown more slowly than peer states’ expansion populations.
Montana Medicaid Enrollment’ (2010-2020)
Parents, Caretakers, & Disabled Adults
Children
Seniors
The HELP Act expanded Medicaid eligibility to non-disabled, non-elderly adults, ages 19-
64, with incomes up to 138% FPL.
Enrollment (2020*) Change (2010-20)
Total Share Total Annual Growth**
Total 265,000 - +142,000 +7.2%
Expansion Adults 91,000 34% +91,000 N/A
Parents/Caretakers 45,000 17% +11,000 +2.6%
Children 112,000 42% +35,000 +3.5%
Seniors 18,000 7% +5,000 +3.4%
Expansion Adults
2010 2012 2014 2016 2018 2020 * Average enrollment through September 2020** Compounded annual growth rate (estimate)
‘Excludes Section 9 and Mental Health Service Plan enrollees
Program Background Montana Medicaid Basics The Impact of Medicaid Expansion Tribal Communities Conclusion

Medicaid in Montana – January 2021
Medicaid provides coverage for one-in-four Montanans and is a particularly critical safety net for tribal and rural populations.
15
Medicaid provides health care coverage for one-in-four Montanans. It is a safety net for Montana’s most “isolated” areas (21% of Medicaid enrollment vs. 20% of the population) as it is for its most urban (34% vs. 36%). It is also a critical support for Tribal populations, who comprise only 6% of the state’s population, but 18% of its Medicaid enrollment.
Medicaid Demographics in Comparison with State Population (2020)
Stat
e**
Population**1,069,000
Medicaid Enrollment as Proportion of the Population (2020)
Medicaid265,000
25%
Med
icai
d
Race*
White
67%
18%
14%
American Indian/Alaskan Native
Other/ Unknown
88%
6%6%
Gender
Female
Male
50% 50%
54% 46%
Urban
Rural
Geography
65%34%
64%36%
* Race information is voluntarily reported ** State data only available for 2019
Program Background Montana Medicaid Basics The Impact of Medicaid Expansion Tribal Communities Conclusion
Medicaid in Montana – January 2021
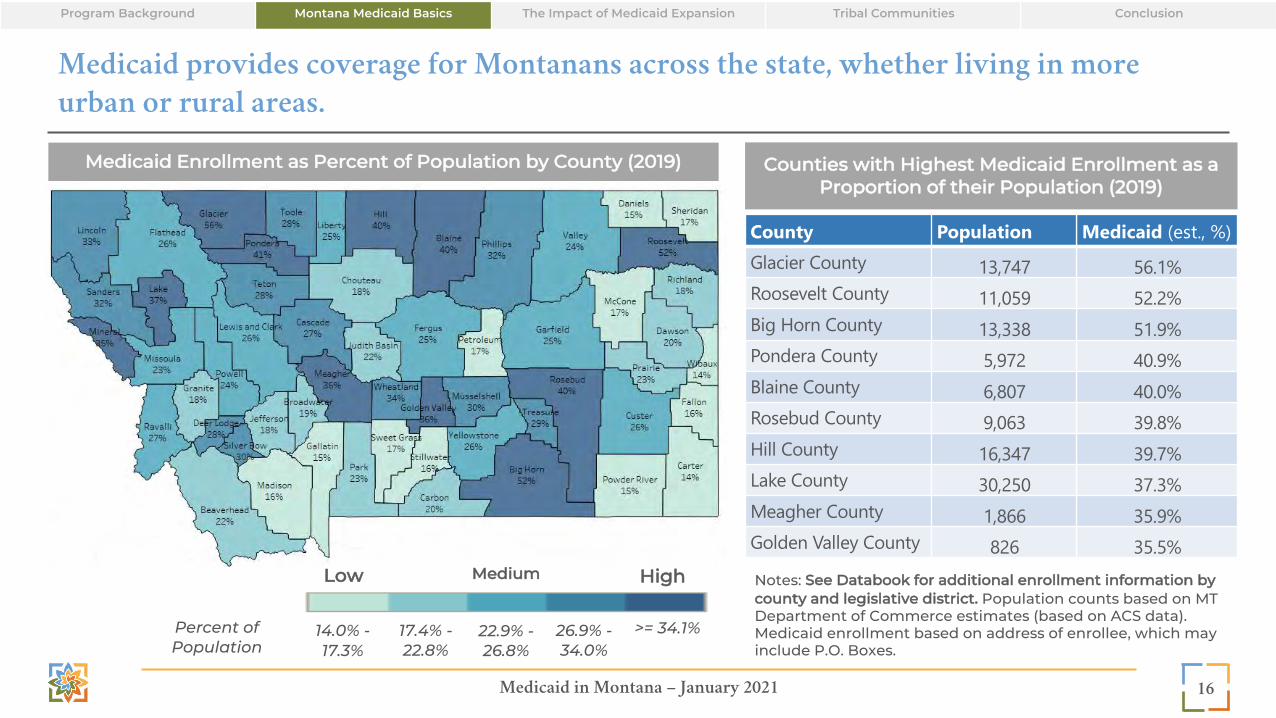
Medicaid provides coverage for Montanans across the state, whether living in more urban or rural areas.
16
Medicaid Enrollment as Percent of Population by County (2019)
Low Medium High
Percent of Population
14.0% -17.3%
17.4% -22.8%
22.9% -26.8%
26.9% -34.0%
>= 34.1%
County Population Medicaid (est., %)Glacier County 13,747 56.1%Roosevelt County 11,059 52.2%Big Horn County 13,338 51.9%Pondera County 5,972 40.9%Blaine County 6,807 40.0%Rosebud County 9,063 39.8%Hill County 16,347 39.7%Lake County 30,250 37.3%Meagher County 1,866 35.9%Golden Valley County 826 35.5%
Counties with Highest Medicaid Enrollment as a Proportion of their Population (2019)
Notes: See Databook for additional enrollment information by county and legislative district. Population counts based on MT Department of Commerce estimates (based on ACS data). Medicaid enrollment based on address of enrollee, which may include P.O. Boxes.
Program Background Montana Medicaid Basics The Impact of Medicaid Expansion Tribal Communities Conclusion

Medicaid in Montana – January 2021
Medicaid is a stable source of coverage for the elderly and individuals with disabilities, while providing more temporary coverage for adults and children.
17
0 1 2 3 4 5 6 7 8
Adults (Expansion)
Adults (Non Exp)
Children
Seniors
Disabled
Average Number of Years on Medicaid
Average Duration of Medicaid Coverage* (Dec. 2019)
Medicaid is a critical source of health care coverage that ensures Montanans with low-incomes have access to the care they need to support their long-term health, well-being, and productivity. Medicaid minimizes gaps in coverage that could otherwise result in missed prescriptions, and delays in needed medical care and preventative services, such as disease testing and vaccinations. Nationally, populations that have chronic medical needs (seniors, individuals with disabilities) and/or inherent income limitations (children) tend to be on Medicaid longer than those who have stronger prospects for finding employment or alternative coverage (adults). This holds true in Montana. Expansion adults were enrolled for two years, on average, with a third enrolled for less than 12 months.
<1 Year
31%
19%18%
20%
12%
1-2 Years
2-3 Years
3-4 Years
4+ Years
* Average duration for expansion adults will likely increase over time. Expansion started in January 2016; other programs were audited back to July 1999.
Program Background Montana Medicaid Basics The Impact of Medicaid Expansion Tribal Communities Conclusion

Medicaid in Montana – January 2021
0%
50%
100%
150%
200%
250%
Children Adults Seniors Disabled AdultsExpansion
Seniors and individuals with disabilities have the most complex medical needs among Medicaid enrollees.
18
Population Risk Scores by Population Group (Dec. 2019)
Based on their past service use, clinical diagnoses, and demographics, seniors and individuals with disabilities are projected to have medical costs that are three times as high as the average “traditional” adult enrollee, as they require more frequent, intensive, and costly procedures and services to manage their health. (Not all these costs fall to Medicaid, however, as many of these individuals are dually-enrolled in Medicare.) Adult expansion enrollees have slightly higher “risk scores” than their traditional adult Medicaid counterparts, driven, in part, due to the composition of the expansion population, which includes individuals who may have previously been eligible for coverage under other eligibility categories.
Program Background Montana Medicaid Basics The Impact of Medicaid Expansion Tribal Communities Conclusion

Medicaid in Montana – January 2021
Children rely upon Medicaid for access to preventive care services, while older and higher-need populations rely upon it to cover long-term services and supports.
Different population groups require different Medicaid services to support their unique health care needs. Medicaid supports children by providing access to dental services, immunizations, preventive screenings, and outpatient care; while adults (both traditional and expansion) rely upon Medicaid for outpatient care and lab services (e.g., blood counts, metabolic panels). Older populations and individuals with disabilities rely upon Medicaid to cover services that Medicare (with which they are often dually-enrolled) does not cover, such as assisted living, personal care services, and habilitation services.
19
Children’*
Top Procedures* by Population Group (2019)
Community psychiatric supportive treatment
Dental services, including topical fluoride varnish, prophylaxis, periodic oral evaluations
Adults*
Seniors
Disabled
Traditional & Expansion:Office/outpatient visit
(Evaluation & Management)
Traditional: Comprehensive metabolic panelExpansion: Office/outpatient visit (Evaluation & Management)
Assisted living (per diem) Blood collection by venipuncture (note: Medicare pays for most procedures)
Personal care services (15 min.) Comprehensive metabolic panel (note: Medicare pays for most procedures)
*Procedures are illustrative and may not represent top service categories; excl. care coordination and risk adjustment claims
By Total Spending By Unique Utilizers**
Program Background Montana Medicaid Basics The Impact of Medicaid Expansion Tribal Communities Conclusion

Medicaid in Montana – January 2021
Medicaid provides access to critical preventive services for Montanans of all ages.
In 2019, nearly 65,000 Medicaid enrollees received vaccinations, 69,000 received wellness exams, and nearly 138,000 benefitted from dental services – preventive services that promote long-term health and well-being. Medicaid expansion has played an important role in bringing access to preventive services to the previously uninsured.
20
Preventative Service Utilization By Population Group (2019)
Service Children (Medicaid Only)
Adults(Traditional)
Adults(Expansion) Seniors Disabled
Preventive/Wellness Exams 45,233 5,900 14,159 1,304 2,825Physical and Behavioral Health Screenings*Alcohol Abuse Screening 59 202 941 52 73Breast Cancer Screening 1 1,850 4,423 738 1,424Cervical Cancer Screening 12 3,843 8,936 120 951Cholesterol Screening 2,570 9,090 17,069 2,829 5,866Diabetes Screening 2,571 9,380 13,397 2,534 4,845Hepatitis B Screening 266 2,179 3,847 168 688Hepatitis C Screening 422 2,912 5,305 235 782STD Screening 2,476 7,686 12,895 118 1,167Tobacco Use Counseling & Interventions 22 643 1,184 134 429Dental Services 79,982 15,738 31,176 2,778 8,326Vaccines 34,570 8,510 14,737 1,865 4,858
*Unique counts not available
Program Background Montana Medicaid Basics The Impact of Medicaid Expansion Tribal Communities Conclusion

Medicaid in Montana – January 2021
The use of telehealth services – particularly behavioral health services – by Medicaid enrollees expanded dramatically during the coronavirus pandemic.
Telemedicine has traditionally offered Montanans living in more rural parts of the state access to qualified clinicians for medically necessary services. Through the coronavirus pandemic, however, Montana Medicaid expanded access to telehealth services, waiving in-person service delivery requirements for many physical and behavioral health services (e.g., primary care, therapy, and substance use disorder treatment) and authorized reimbursement for telehealth services at the same rate as in-person visits. As a result, telehealth utilization has increased significantly through August 2020, particularly for behavioral health services, where visits increased by 1,418% (+175,000) over the full 2019 year; physical health visits have more than doubled during the first two-thirds of 2020 as well.
21
Telehealth Service Utilization (2015-2020)
0
50,000
100,000
150,000
200,000
250,000
2015 2016 2017 2018 2019 2020 (YTD)Te
leH
ealth
Visi
ts2015 2016 2017 2018 2019 2020
(Jan.-Aug.)
Physical Health 933 13,294 25,789 38,455 25,672 50,046Behavioral Health 2,538 4,483 7,676 14,652 12,487 189,579
Behavioral Health
Physical Health
+95%
+1,418%
Program Background Montana Medicaid Basics The Impact of Medicaid Expansion Tribal Communities Conclusion

Medicaid in Montana – January 2021
Seniors and individuals with disabilities comprise only 15% of the Medicaid population but contribute to 40% of Medicaid expenditures.
Medicaid spending varies significantly by age group and disability status. Non-disabled children and adults comprised the vast majority of Medicaid enrollment (85%) but contribute to far less of its expenditures (60%). Conversely, seniors and individuals with disabilities, who often require high-touch, high-intensity, and ultimately high-cost services to support their daily living, comprised 15% of Medicaid enrollment, but contributed to 40% of its expenditures. Similar spending patterns are observed nationally.
22
Medicaid Enrollment and Spending by Population Group* (SFY 2019)
Children + Adults (Non-disabled, including
expansion)
85%
Spending
Enrollment
Seniors**
Individuals with Disabilities
25% 8%
* Medicaid spending only (excludes Medicare spending). CHIP spending estimated based on aggregate budget data. Spending excludes DSH and supplemental provider payments. Enrollment percentages based on member months and may not align with other values in this report. ** “Individuals with Disabilities” category includes individuals from all age categories. Seniors exclude “disabled” who are otherwise captured by the Individuals with Disabilities category.
7%15%
60%
Program Background Montana Medicaid Basics The Impact of Medicaid Expansion Tribal Communities Conclusion

Medicaid in Montana – January 2021
0% 25% 50% 75% 100%
Children
Adults (Non Exp)
Seniors
Disabled
AdultsExpansion
Hospitals & Clinics Physician Pharmacy LTSS Behavioral Health IHS Dental All Other
Most of Medicaid spending on seniors and individuals with disabilities is for long term services and supports, because Medicare covers other services they need.
Long term services and supports (LTSS), including nursing home care and home and community-based services, comprise more than half of Montana Medicaid’s average spending for seniors and individuals with disabilities. Seniors and individuals with disabilities are often dually-enrolled in Medicare, which covers most hospital/physician service costs. Children and adults (including expansion adults) more often rely upon Medicaid for emergency services (hospital inpatient & outpatient services) and routine care (physician services).
23
Service Category Spending as a Percentage of Total Spending by Population* (SFY 2019)
Monthly Spending
(Avg.)$298
$414
$1,440
$1,514
$434
26%
39%
76%
51%
44%
(e.g., school svcs)
(e.g., specialists)
(e.g., buy-in)
(e.g., buy-in)
(e.g., specialists)
*Medicaid spending only (excludes Medicare and CHIP).
Non
-Dis
able
dProgram Background Montana Medicaid Basics The Impact of Medicaid Expansion Tribal Communities Conclusion

Medicaid in Montana – January 2021
Medicaid leverages federal dollars to support Montana’s health care system, from hospitals and rural clinics, to medical practices and behavioral health providers.
Medicaid Payments by Provider Type (SFY2019)
$1.66B
Hospitals & Clinics
27%
LTSS Providers
25%
Montana health care providers receive over $1.6 billion from Medicaid to support patient care, with the majority payments supported by federal dollars. Medicaid supports over $400 million in patient care at hospitals, clinics and LTSS providers annually. Expansion brought an additional $525 million in new revenues to Montana’s health care system at a nine-to-one federal spending match, with hospitals playing a key role in supporting the state’s ability to receive these federal dollars (see next section).
24
Provider Type Medicaid Spending PercentTotal $ 1,655,919,049 100%Hospitals & Clinics $ 440,417,048 27%LTSS $ 414,171,665 25%Physician & Mid-Level Practitioners $ 184,299,967 11%Indian Health Service $ 127,854,750 8%Behavioral Health $ 121,526,868 7%Other $ 120,852,640 7%Pharmacy $ 98,023,997 6%Dental $ 63,112,569 4%Medicare Buy-in $ 44,598,918 3%Schools $ 41,060,627 3%Physician & Mid-Level
Practitioners
11%
8%
7%
Indian Health Service
Behavioral Health
Program Background Montana Medicaid Basics The Impact of Medicaid Expansion Tribal Communities Conclusion
MTHCF.ORG
The Impact of Medicaid Expansion

Medicaid in Montana – January 2021
The size of the expansion population fluctuates with the economy as it serves as a safety net, particularly for rural Montanans and American Indians.
The Health and Economic Livelihood Partnership (HELP) Act expanded Medicaid to cover non-disabled, childless adults with incomes up to 138% FPL effective January 1, 2016. Expansion enrollment peaked in 2018 near 100,000 lives, before decreasing to 80,000 in March 2020. Enrollment has since increased steadily through the pandemic to 93,000 in December 2020. Demographically, the expansion population looks like the overall Medicaid population in terms of race, gender, and geography, with the program playing a particularly critical role in supporting the health and well-being of Montana’s tribal and rural populations.
26
Total Medicaid Enrollment(265,000)
ExpansionEnrollment
(91,000)
34%
Medicaid Expansion Enrollee Characteristics (2020)
Race Gender Geography
White
AI/AN
Other/UnknownFemale
Male
Urban
Rural
69%18%
13%
54% 46% 64%35%
0
25,000
50,000
75,000
100,000
2017
Monthly Enrollment (2016-20)
2018 2019 2020 20212016
Program Background Montana Medicaid Basics The Impact of Medicaid Expansion Tribal Communities Conclusion

Medicaid in Montana – January 2021
Expansion enrollees contribute toward the cost of their coverage through premium payments equal to 2% of household income.
Expansion enrollees with incomes between 51% and 138% FPL are required to pay premiums equal to 2% of household income unless otherwise exempted (e.g., American Indians). In July 2020, members paid over $423,000 in premiums, the majority of which was returned to the federal government. *Failure to pay premiums ordinarily usually result in disenrollment for enrollees with incomes exceeding 100% FPL, prior to federal requirements preventing disenrollment until after the public health emergency.
27
* In response to the COVID-19 pandemic, on March 27, DPHHS waived disenrollment penalties for inability to pay premiums, though continued to collect premiums for those who could pay.
Medicaid Expansion Enrollee Monthly Premiums Collected by the State (2016-20)
$0
$100,000
$200,000
$300,000
$400,000
$500,000
Mon
thly
Pre
miu
ms C
olle
cted
$56k
Jan 2016 Jan 2017 Jan 2018 Jan 2019 Jan 2020
$306k
$264k
$401k
$397k
Program Background Montana Medicaid Basics The Impact of Medicaid Expansion Tribal Communities Conclusion
Medicaid in Montana – January 2021
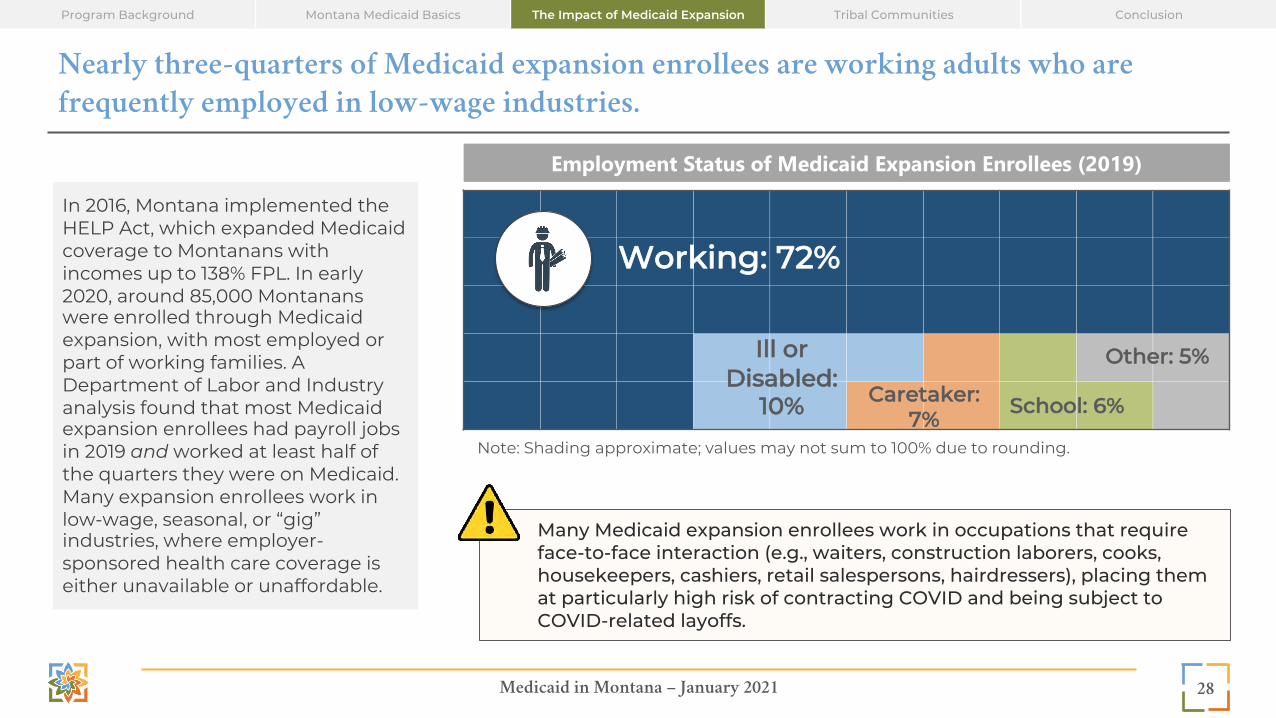
Nearly three-quarters of Medicaid expansion enrollees are working adults who are frequently employed in low-wage industries.
28
Employment Status of Medicaid Expansion Enrollees (2019)
Working: 72%
Caretaker: 7% School: 6%
Ill or Disabled:
10%
Other: 5%
Note: Shading approximate; values may not sum to 100% due to rounding.
In 2016, Montana implemented the HELP Act, which expanded Medicaid coverage to Montanans with incomes up to 138% FPL. In early 2020, around 85,000 Montanans were enrolled through Medicaid expansion, with most employed or part of working families. A Department of Labor and Industry analysis found that most Medicaid expansion enrollees had payroll jobs in 2019 and worked at least half of the quarters they were on Medicaid. Many expansion enrollees work in low-wage, seasonal, or “gig” industries, where employer-sponsored health care coverage is either unavailable or unaffordable.
Many Medicaid expansion enrollees work in occupations that require face-to-face interaction (e.g., waiters, construction laborers, cooks, housekeepers, cashiers, retail salespersons, hairdressers), placing them at particularly high risk of contracting COVID and being subject to COVID-related layoffs.
Program Background Montana Medicaid Basics The Impact of Medicaid Expansion Tribal Communities Conclusion

Medicaid in Montana – January 2021
Expansion enrollees are connected to employment and advancement opportunities through the HELP-Link workforce program.
The HELP Act also created HELP-Link, a voluntary workforce program administered by the Department of Labor and Industry that helps expansion enrollees to find, and in some cases, enhance their skills to match with more stable and higher-paying long-term employment. HELP-Link provides “general” employment services, including career matching and counsel, as well as more “intensive” support, where participants may participate in a full workforce or educational training programs. More than two-thirds of HELP-Link participants participating in “intensive” training found employment in 2020. Truck drivers, registered nurses, and personal care workers, are common occupations pursued by participants.
29
HELP-Link Employment Training and Outcomes (2018-2020)
2018 2019 2020 (YTD)
Receiving Employment Services
8,677
7,234
9,068
Em
plo
yed
Aft
er
Exi
t
5,553
4,630
Type of Services Received (2020 YTD)
2020 (YTD)
General Employment Support
(e.g., career matching and advise, resume assistance,
mock interviews)
8,601
Participation in “Intensive” Workforce
Training(e.g., educational or
apprenticeship support, dedicated career coaching)
467
(Dis
trib
uti
on N
ot Y
et
Ava
ilab
le)
Program Background Montana Medicaid Basics The Impact of Medicaid Expansion Tribal Communities Conclusion

Medicaid in Montana – January 2021
Medicaid expansion supports workers with low-incomes and their employers.
30
Percent of Businesses with at Least One Medicaid Expansion Enrollee by Industry and Industry Hourly Wage (2019)
$0
$10
$20
$30
$40
Indu
stry
Hou
rly W
age
(Ave
rage
)
According to a recent Department of Labor and Industry analysis, between 2018 and 2019, nearly six-in-ten Montana businesses had at least one employee enrolled in Medicaid; a quarter had at least 25% of their employees enrolled in the program. Working Medicaid expansion enrollees are often employed in lower-wage industries such as accommodation and food services, arts, entertainment and recreation (e.g., ski resorts), and retail. The Department of Labor and Industry estimates that it would have cost employers between $432 million and $1.1 billion in 2019 to provide private insurance to Medicaid-enrolled workers.
89%75% 70%
66%64%
49%
54%52%
66%
55%
66%
63%
41%40%
36%
Accommodation & Food Services
Arts, Entertainment &
Recreation
Retail Trade
Health Care
Manufacturing
Administration & Waste
Transportation
Construction
Other
Natural Resources
Financial Activities
Wholesale Trade
Professional Services
Program Background Montana Medicaid Basics The Impact of Medicaid Expansion Tribal Communities Conclusion

Medicaid in Montana – January 2021
90%
75%
64%
50%
45%
Medical/Dental Care
Basic Housing or Food Due to Medical Costs
Delayed Medical/Dental Care Due to Cost
Had to Borrow Money or Skip Bills Due toMedical/Dental Costs
Took Less Medication Than Prescribed Due to Cost
43%
47%
51%
69%
Improved Health Since Enrollment
Mental Health/SUD Support
Dental Care
Medical Care
Medicaid expansion improved health care access for Montanans, supporting their health, well-being, and productivity.
Medicaid expansion provides low-income Montanans with greater access to medical, dental, mental health, and substance use disorder treatment to support their health, well-being, and productivity. Nearly seven-in-ten Medicaid expansion enrollees reported improved access to medical care since enrollment; and four-in-ten noted improved health.
Expansion also mitigated many barriers-to-care for Montanans. Ninety percent of Medicaid expansion enrollees reported they would have trouble in paying their medical bills without expansion; at least three-quarters would struggle to pay for basic housing and food. Many enrollees reported that prior to expansion they delayed needed medical care, dental care or medication refills due to cost.
31
HELP Enrollees Reporting Improved Health and Access to Care (2018)
HELP Enrollees Reporting Barriers to Care Without Enrollment (2018)
Imp
rove
d
Acc
ess
Exp
erie
nce
D
iffic
ult
y P
ayin
g *
* Respondents reported that, if not covered by Medicaid expansion, it would be difficult to pay for food for them or their family (75%) or basic housing needs (77%).
Program Background Montana Medicaid Basics The Impact of Medicaid Expansion Tribal Communities Conclusion

Medicaid in Montana – January 2021
-
2,000
4,000
6,000
Newly Diagnosed Treated Newly Diagnosed TreatedHypertension Diabetes
Uniq
ue M
embe
rs 2017 2018 2019
Medicaid expansion provided enrollees with access to preventive services and the physical, mental health, and substance use treatment needed to stay healthy.
In 2019, over 60,000 expansion enrollees received preventive services from Montana health care providers. Access to preventive services allows for the identification and treatment of health issues and chronic conditions, promoting the long-term health and well-being of Montanans – and Montana’s workforce. Over 30,000 expansion enrollees received mental health services in 2019, and over 5,000 received support for substance use disorders with their expansion coverage. Nearly 3,000 enrollees were newly diagnosed with hypertension and over 1,300 were newly diagnosed with diabetes; ongoing treatment for both conditions continued to increase. Preventive screenings also resulted in 71 breast cancer diagnoses and early treatment of potential colon cancer indicators for 938 individuals (data not shown).
32
Expansion Diagnosis and Treatment Counts (2017-2019)
-
20,000
40,000
60,000
80,000
Preventive Services Mental HealthTreatment
Substance UseTreatment
Uniq
ue M
embe
rs
2017 2018 201960,595
30,698
5,272
5,760
2,9222,795
1,395
Program Background Montana Medicaid Basics The Impact of Medicaid Expansion Tribal Communities Conclusion
Medicaid in Montana – January 2021
0
2,000
4,000
6,000
Num
ber o
f Uni
que
Mem
bers
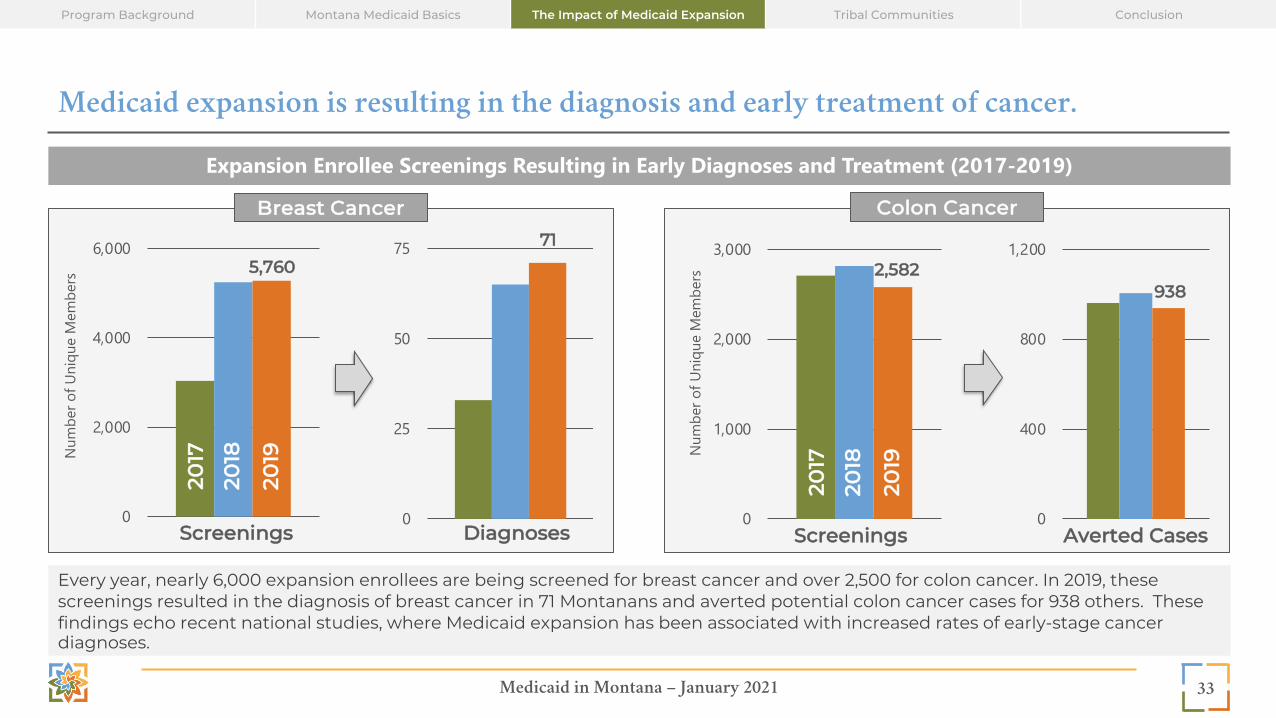
Medicaid expansion is resulting in the diagnosis and early treatment of cancer.
Every year, nearly 6,000 expansion enrollees are being screened for breast cancer and over 2,500 for colon cancer. In 2019, these screenings resulted in the diagnosis of breast cancer in 71 Montanans and averted potential colon cancer cases for 938 others. These findings echo recent national studies, where Medicaid expansion has been associated with increased rates of early-stage cancer diagnoses.
33
Expansion Enrollee Screenings Resulting in Early Diagnoses and Treatment (2017-2019)
5,760
Breast Cancer20
17
2018
2019
Screenings
Colon Cancer
0
25
50
75
Diagnoses
71
0
1,000
2,000
3,000
Num
ber o
f Uni
que
Mem
bers
Screenings
2,582
2017
2018
2019
0
400
800
1,200
938
Averted Cases
Program Background Montana Medicaid Basics The Impact of Medicaid Expansion Tribal Communities Conclusion

Medicaid in Montana – January 2021
Medicaid expansion provided Montana with new program levers and funding flexibility to address substance use disorders in the state.
Montana has among the highest rates of alcohol use disorders and substance use disorders (SUD) of any state, significantly exceeding national averages. Medicaid expansion provided the state with new program levers and funding flexibility to address this acute health concern. Expansion’s 90,000 enrollees – many previously uninsured – now have access to primary care to diagnose SUD and the comprehensive treatment to address it. Expansion also freed-up federal block grant and state dollars previously allocated to fund SUD treatment for the uninsured, to now fund the state’s share of Medicaid costs, expand SUD treatment, and support other state priorities. Expansion generated over $9 million in funding for SUD treatment providers alone in 2019, supporting a critical behavioral health safety net in Montana while leveraging a 93% federal funding match.
34
Montana Rates of Alcohol and Substance Use Disorders and Treatment Needs* (2016-2018)
7.8% 7.4%
5.4%
8.6%
6.8%7.3%
5.2%
9.2%
Mon
tan
a
Un
ited
Sta
tes
The Montana Healthcare Foundation is developing a brief on the role of Medicaid expansion in supporting Montana’s behavioral
health system and addressing enrollees’ behavioral heath needs for release in February 2021.
Diagnosed in Past Year
Needing, but Not Receiving Treatment at a
Specialty Facility
Alcohol Use Disorder
Diagnosed in Past Year
Needing, but Not Receiving Treatment at a
Specialty Facility
Substance Use Disorder
* Individuals age 12 and older
Program Background Montana Medicaid Basics The Impact of Medicaid Expansion Tribal Communities Conclusion
Medicaid in Montana – January 2021
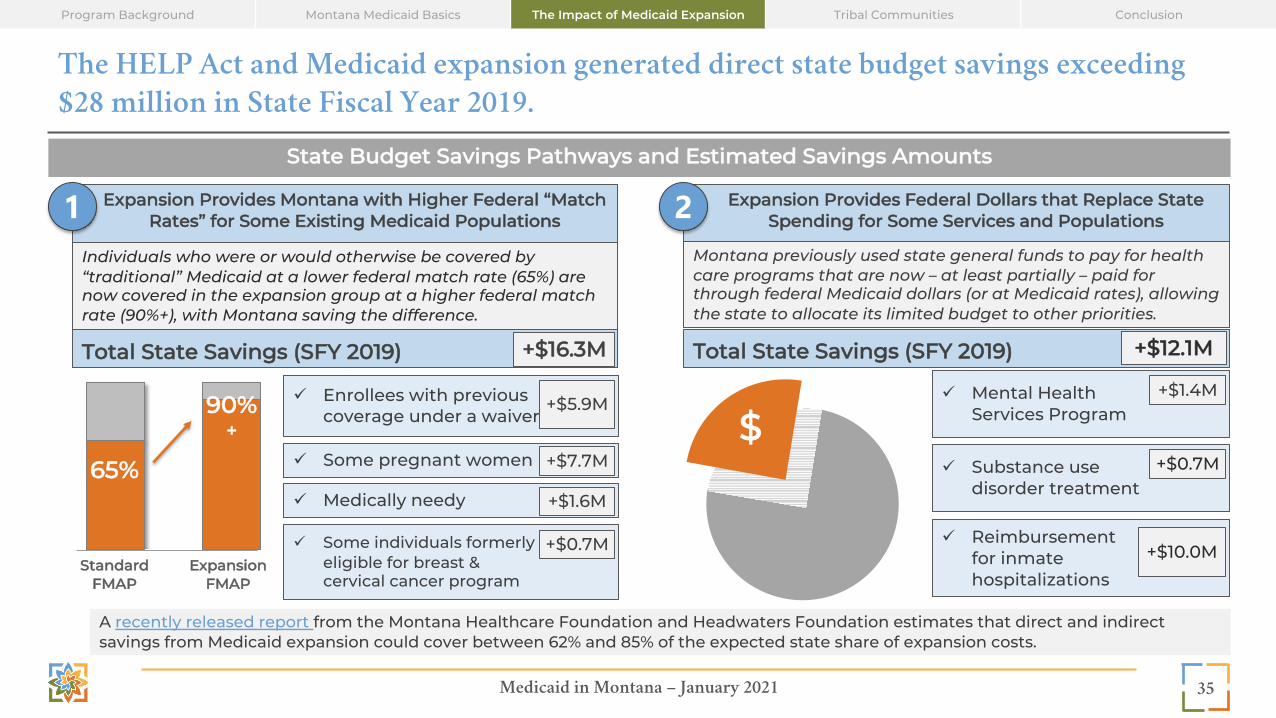
The HELP Act and Medicaid expansion generated direct state budget savings exceeding $28 million in State Fiscal Year 2019.
35
State Budget Savings Pathways and Estimated Savings Amounts
Expansion Provides Montana with Higher Federal “Match Rates” for Some Existing Medicaid Populations1 Expansion Provides Federal Dollars that Replace State
Spending for Some Services and Populations2
65%
90%+
ü Enrollees with previous coverage under a waiver
Standard FMAP
Expansion FMAP
Individuals who were or would otherwise be covered by “traditional” Medicaid at a lower federal match rate (65%) are now covered in the expansion group at a higher federal match rate (90%+), with Montana saving the difference.
+$5.9M
ü Some pregnant women +$7.7M
ü Medically needy +$1.6M
ü Some individuals formerly eligible for breast & cervical cancer program
+$0.7M
Total State Savings (SFY 2019) +$16.3M
Montana previously used state general funds to pay for health care programs that are now – at least partially – paid for through federal Medicaid dollars (or at Medicaid rates), allowing the state to allocate its limited budget to other priorities.
Total State Savings (SFY 2019) +$12.1M
ü Mental Health Services Program
+$1.4M
ü Substance use disorder treatment
+$0.7M
ü Reimbursement for inmate hospitalizations
+$10.0M
$
A recently released report from the Montana Healthcare Foundation and Headwaters Foundation estimates that direct and indirect savings from Medicaid expansion could cover between 62% and 85% of the expected state share of expansion costs.
Program Background Montana Medicaid Basics The Impact of Medicaid Expansion Tribal Communities Conclusion

Medicaid in Montana – January 2021
Medicaid expansion infuses over $650 million into Montana annually, creating jobs and supporting new economic activity.
In 2020, Medicaid expansion brought over $650 million in new federal spending directly to Montana’s hospitals, clinics, and primary care and specialty practices. The new spending creates and sustains over 6,000 new jobs statewide – more than 40% directly in health care. The spending also generates over $700 million in new economic activity, as these new employees spend their paychecks on local goods and services, and health care providers invest in new capital to support their systems and patient care.
36
Economic Impact of Medicaid Expansion Annually (est., 2020)
Montana Receives New Federal Health Care Dollars Each Year
New Federal Dollars Support Jobs, Income, and Economic Growth
+$650 million
+6,000 new jobsacross industries
+$400 millionin new personal
income
+$700 millionin new economic
activity
Program Background Montana Medicaid Basics The Impact of Medicaid Expansion Tribal Communities Conclusion

Medicaid in Montana – January 2021
Medicaid expansion has reduced the financial burden of uncompensated care for Montana’s hospitals.
Montana’s hospitals play a key role in supporting the state’s Medicaid expansion, contributing to the state’s payment share through an annual tax on outpatient revenues. In 2019, Montana hospitals paid nearly $20 million to the General Fund, which helped the state to generate approximately $180 million in new federal matching funds to support all of Montana’s health care providers.
Medicaid expansion provided coverage to many previously uninsured Montanans, who might have otherwise been unable to pay their medical bills. With the implementation of expansion, uncompensated care costs for hospitals in Montana halved, as Medicaid provided a stable, reliable source of payment for medical claims – and allowed new enrollees access to preventive care services, likely reducing the dependence on hospitals’ emergency room services.
Nationally, hospitals in states that have not expanded Medicaid are six times more likely to close than those in expansion states. No hospitals in Montana have closed since expansion was implemented in 2016.
37
$0
$100
$200
$300
$400
2015 2016 2017 2018 2019
Milli
ons
Hospital Uncompensated Care Costs* (2015-2019)
HELP Act expanded Medicaid eligibility to non-disabled, non-elderly adults, ages
19-64, with incomes up to 138% FPL.
* Data provided by the Montana Hospital Association; sourced from the American Hospital Association’s Annual Survey of Hospitals, which includes approximately 80% to 85% of Montana hospitals.
Program Background Montana Medicaid Basics The Impact of Medicaid Expansion Tribal Communities Conclusion

MTHCF.ORG
Special Topic: Medicaid as a Critical Support for Tribal Communities

Medicaid in Montana – January 2021
Medicaid serves as a critical source of care for Tribal communities in Montana.
39
Program Background Montana Medicaid Basics The Impact of Medicaid Expansion Tribal Communities Conclusion
The Indian Health Service (IHS) is a federal agency which provides services to American Indian and Alaskan Native (AI/AN) populations in Montana directly through IHS facilities, Tribally-contracted and operated programs (e.g., Tribal 638 programs), and indirectly, and Purchased and Referred Care (PRC) which buys services from private sector providers. PRC referrals are funded by IHS and Tribal facilities when the facility cannot provide the service, and the individual is uninsured and requires care. The federal government covers 100% of Medicaid costs for services delivered through IHS. IHS also provides a limited amount of funding for Urban Indian Health Programs that serve AI/AN individuals who live off the reservation and other tribal-operated lands, though services provided by these programs and facilities may not qualify for 100% federal reimbursement.
Medicaid Coverage for American Indians in Montana (2020)
Traditional Medicaid (32,000) Expansion (16,000)
Nearly 50,000 American Indians are enrolled in Medicaid in Montana.
100%Federal Match
For services provided to AI/AN
populations in IHS or Tribal facilities
Medicaid in Montana – January 2021
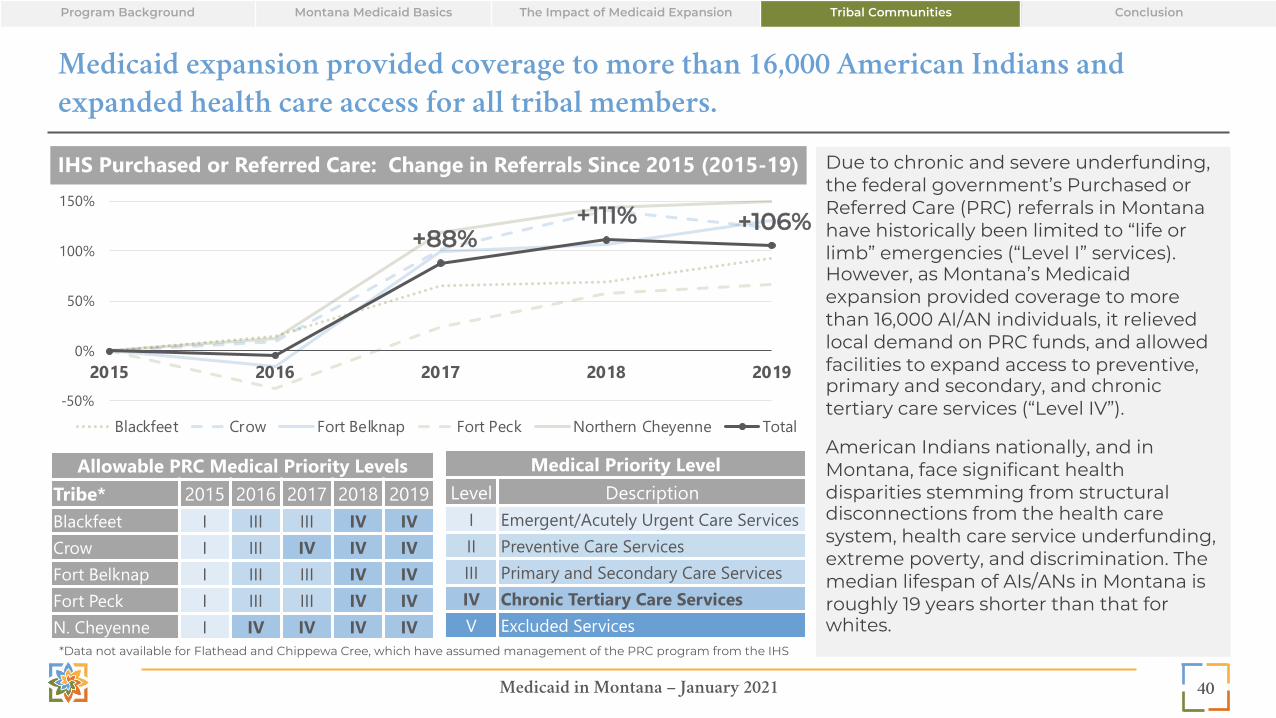
Medicaid expansion provided coverage to more than 16,000 American Indians and expanded health care access for all tribal members.
Due to chronic and severe underfunding, the federal government’s Purchased or Referred Care (PRC) referrals in Montana have historically been limited to “life or limb” emergencies (“Level I” services). However, as Montana’s Medicaid expansion provided coverage to more than 16,000 AI/AN individuals, it relieved local demand on PRC funds, and allowed facilities to expand access to preventive, primary and secondary, and chronic tertiary care services (“Level IV”).
American Indians nationally, and in Montana, face significant health disparities stemming from structural disconnections from the health care system, health care service underfunding, extreme poverty, and discrimination. The median lifespan of AIs/ANs in Montana is roughly 19 years shorter than that for whites.
40
Allowable PRC Medical Priority LevelsTribe* 2015 2016 2017 2018 2019Blackfeet I III III IV IVCrow I III IV IV IVFort Belknap I III III IV IVFort Peck I III III IV IVN. Cheyenne I IV IV IV IV
Medical Priority LevelLevel Description
I Emergent/Acutely Urgent Care ServicesII Preventive Care ServicesIII Primary and Secondary Care ServicesIV Chronic Tertiary Care ServicesV Excluded Services
IHS Purchased or Referred Care: Change in Referrals Since 2015 (2015-19)
*Data not available for Flathead and Chippewa Cree, which have assumed management of the PRC program from the IHS
-50%
0%
50%
100%
150%
2015 2016 2017 2018 2019
Blackfeet Crow Fort Belknap Fort Peck Northern Cheyenne Total
+88%+111% +106%
Program Background Montana Medicaid Basics The Impact of Medicaid Expansion Tribal Communities Conclusion

Medicaid in Montana – January 2021
Expansion is providing American Indians with access to preventive services and treatment.
41
In 2019, expansion allowed over 9,000 American Indians in Montana to receive preventive services, nearly 5,600 to receive mental health treatment, and over a thousand to access substance use treatment to support their health and well-being. Through access to preventive care, colon cancer was averted in nearly 100 individuals and breast cancer was diagnosed in 10 women. Hundreds of American Indians received diagnosis of and treatment for diabetes and hypertension.
2017 2018 2019
Preventive Services Delivered 7,918 9,284 9,364
Mental Health Treatment 3,978 5,412 5,596
Substance Use Treatment 902 1,090 1,125
Breast CancerScreenings 217 449 443Diagnoses 3 9 10
Colon CancerScreenings 286 303 298Averted 85 102 96
DiabetesNewly Diagnosed 126 196 220Treatments 426 469 453
HypertensionNewly Diagnosed 272 332 304Treatments 629 660 558
Preventive Services and Treatment Received by AI/AN Expansion Enrollees (2016-2019)
0
2,500
5,000
7,500
10,000
2016 2017 2018 2019
Uniq
ue M
embe
rs
Program Background Montana Medicaid Basics The Impact of Medicaid Expansion Tribal Communities Conclusion

Medicaid in Montana – January 2021
$37 $41 $32 $44 $51 $58
$93 $103 $127 $138
$-
$50
$100
$150
2010 2011 2012 2013 2014 2015 2016 2017 2018 2019
Med
icai
d Pa
ymen
ts ($
, m
illio
ns)
Expansion has brought new federal dollars to Montana to support historically under-funded Indian Health Service and Tribal health organization facilities.
Medicaid payments are a critical source of revenue for resource-limited IHS and Tribal health organization facilities. In 2017, the U.S. Government Accountability Office (GAO) noted that national IHS spending per capita was 60% lower than per capita spending by theVeterans Health Administration (VA) and half of that by Medicaid.* Medicaid expansion has helped to mitigate decades of under-funding at IHS and Tribally operated facilities by bringing new federal dollars into Montana, with all Medicaid services for American Indians provided at – and coordinated through – these facilities qualifying for 100% federal reimbursement.
In 2019, Montana Medicaid paid $138 million to IHS and Tribally operated facilities as they supported the health and well-being of American Indians on and off reservations in Montana; 40% of payments were for services provided to expansion enrollees.
42
Medicaid Payments to IHS and Tribal Health Organization Facilities (2010-2019)
Expansion
* GAO findings should be considered in context of program differences. IHS, the VA, and Medicaid have different program structures, service populations, and services/benefits.
Program Background Montana Medicaid Basics The Impact of Medicaid Expansion Tribal Communities Conclusion
MTHCF.ORG
Conclusion

Medicaid in Montana – January 2021
Conclusion
Montana Medicaid is a critical safety net program that provides Montanans with low-incomes - from children to seniors, the disabled to the medically needy - with access to health care benefits that can support their long-term health, well-being, and productivity. Medicaid provided coverage to approximately 265,000 individuals in 2020, a number which continues to increase in 2021, as the coronavirus pandemic affects the lives and livelihoods of Montanans. As the program continues to evolve to address Montana’s health care needs through the years ahead, this report will aim to serve as a nonpartisan, fact-based, and data-driven resource to support informed discussion about the program’s value and its future priorities.
44
Program Background Montana Medicaid Basics The Impact of Medicaid Expansion Tribal Communities Conclusion

MTHCF.ORG
Appendix A: References

Medicaid in Montana – January 2021
ReferencesProgram Background (1 of 2)Slide 8: Program Overview • “Medicaid in Montana: 2019 Report,” MT DPHHS. Jan. 2019. Available here. • “Montana DPHHS Report to the 2017 Legislature: SFY 15/16,” MT DPHHS. Available here. • Technical Notes:
o 100% federal reimbursement is specific to American Indians using an IHS or Tribal 638 facility; services rendered at urban facilities or off-reservation may not be eligible for 100% federal reimbursement
Slide 9: Populations• “Medicaid in Montana: 2019 Report,” MT DPHHS. Jan. 2019. Available here. • “How Medicaid Expansion Affects Montana,” MHCF and Manatt Health. June 2018. Available here. • Data Sources:
o DPHHS direct data request.o “Montana Medicaid Enrollment Dashboard,” DPHHS. Available here. Pregnant Women only.
• Technical Notes: o * Children: CHIP-funded Medicaid expansion covers children in families with income up to 148% FPL. Medicaid and CHIP offer separate benefit
packages.o * Adults: Parents/caretakers with incomes below 29% FPL remain on Medicaid but will not be eligible for enhanced expansion FMAP.o * Pregnant Women: Pregnant women enrollment counts sourced from DPHHS Medicaid Enrollment Dashboard and may undercount pregnant
women. o * Other Populations with Complex Conditions: Population counts vary by condition.o Enrollment numbers are estimates and provided for contextual purposes only. o Direct data was not available from DPHHS for pregnant women. Count represents only those women who are enrolled in the Pregnant Women
eligibility category; it does not include individuals who may be enrolled in another eligibility category, who may have become pregnant during their plan year.
o Income thresholds incorporate 5% disregard.
46

Medicaid in Montana – January 2021
ReferencesProgram Background (2 of 2)
Slide 10: Services• “Medicaid in Montana: 2019 Report,” MT DPHHS. Jan. 2019. Available here. • “How Medicaid Expansion Affects Montana,” MHCF and Manatt Health. June 2018. Available here.
Slide 11: Budget• “Total State Expenditures (SFY 2018),” Kaiser Family Foundation. Available here. • “Medicaid Expenditures as a Percent of Total State Expenditures by Fund (SFY 2018),” Kaiser Family Foundation. Available here. • “Federal Medical Assistance Percentage (FMAP) for Medicaid and Multiplier,” Kaiser Family Foundation. Available here. • “FMAP Brochure,” Montana Legislative Fiscal Division. Available here. • Data Sources:
o DPHHS direct data request.o “2020 State Expenditure Report: Fiscal 2018-20,” National Association of State Budget Offices (NASBO). Available here. Montana state
budget estimate only.• Technical Notes:
o NASBO estimates total Medicaid spending for Montana at $1.805B, slightly less than the $1.97B estimated by DPHHS. o Expansion FMAP on a FFY basis; though represented and used in calculations on SFY basis.
47

Medicaid in Montana – January 2021
ReferencesMontana Medicaid Basics (1 of 6)
Slide 13: Uninsured Rates• “House and Senate GOP Health Bills Endanger Healthy Montana Kids Program,” Montana Budget and Policy Center. July 2017. Available
here. • Data Source(s):
o “Children's Health Care Report Card,” Georgetown University Center for Children and Families. Available here. o “2019 Report on Health Coverage and Montana’s Insured,” Montana Health Care Foundation. Jun. 2019. Available here
Slide 14: Enrollment Trends• “Federal Poverty Level (FPL),” Healthcare.gov. Available here. • Data Source(s):
o DPHHS direct data request.
Slide 15: Enrollment Demographics• Data Source(s):
o DPHHS direct data request.o "Quick Facts: Montana," US Census Bureau. Available here.
• Technical Notes: o Rural/urban definitions from University of Washington Rural Health Research Center’s RUCA Census data crosswalk (available here).
RUCA was last updated in 2006. Rural/urban classifications have likely shifted in Montana since last update, though distributions remain comparatively accurate.
48

Medicaid in Montana – January 2021
ReferencesMontana Medicaid Basics (2 of 6)
Slide 16: Enrollment Geographic Distribution• “Montana Legislative Districts, 2014-2023,” Montana State Library. Available here. • Data Source(s):
o DPHHS direct data request.o “Census and Economic Information Center,” Montana Department of Commerce. Available here. Population data.
• Technical Notes: o County map built using Tableau. o Enrollee-to-county assignments result in 3,561 individuals unattributed or attributed to out-of-state addresses. Enrollee-to-legislative
district assignments result in 4,661 individuals unattributed or attributed to out-of-state addresses; one zip code (82801) is included in “in-state” counts; though the majority of the acreage is in Wyoming.
Slide 17: Enrollment Duration• “The Continuing Importance of Continuous Health Insurance for Children’s Access to Care,” American Academy of Pediatrics. 2016.
Available here. • “Uninsured and unstably insured: the importance of continuous insurance coverage,” Health Services Research. 2000. Available here. • Data Source(s):
o DPHHS direct data request.• Technical Notes:
o Duration represents average number of months of continuous enrollment. Time period for the study is July 1999 to December 2019. All individuals enrolled in the month of December 2019. Durations represent continuous enrollment in the same enrollment category the individual was in in December 2019 (i.e., if a child switched into an “adult” EnrollCat, their duration on the child plan would end and on the adult plan would begin).
49

Medicaid in Montana – January 2021
ReferencesMontana Medicaid Basics (3 of 6)
Slide 18: Population Risk Scores• “Milliman Advanced Risk Adjusters,” Milliman. Available here. • Data Source(s):
o DPHHS direct data request.• Technical Notes:
o DPHHS-applied Milliman MARA Comprehensive Adjuster (CxAdjusters) leverages medical claims, drug claims, and member demographics over the previous 12 months to predict health care costs over the next 12 months. Individual category risk scores are calculated raw (member centric) and normalized (relative to the entire Montana Healthcare Program Members); categories include: procedure score, pharmacy score, inpatient score, outpatient score, physician score, ER score, total raw score, and total normalized score. Only the total normalized score are shown.
Slide 19: Top Procedures by Population Group• Data Source(s):
o DPHHS direct data request.• Technical Notes:
o Data for HMK children (CHIP Expansion) not available. *Case and care management procedure codes excluded from analysis. **Individuals with disabilities excluded from Children and Adult analysis to show differences in utilization needs.
o Medicare-paid services may be included in utilization counts as cross-over claims.
50

Medicaid in Montana – January 2021
ReferencesMontana Medicaid Basics (4 of 6)
Slide 20: Preventative Service Utilization By Population Group • “Data Note: Medicaid’s Role in Providing Access to Preventive Care for Adults,” Kaiser Family Foundation. May 17, 2017. Available here. • “The Role of the Medicaid Expansion in the Use of Preventive Health Care Services in California Men,” American Journal of Men’s Health.
Jan. 2020. Available here. • Data Source(s):
o DPHHS direct data request.• Technical Notes:
o Counts represent unique members receiving services within designated eligibility categories.
Slide 21: Telehealth Utilization• “Suspension of Face to Face Requirements for Some Medicaid Programs,” MT DPHHS. Apr. 1, 2020. Available here. • Data Source(s):
o DPHHS direct data request.• Technical Notes:
o CY2020 counts through August 2020.
51

Medicaid in Montana – January 2021
ReferencesMontana Medicaid Basics (5 of 6)
Slide 22: Cost Trends - Spending by Population• “State Variation in Medicaid Per Enrollee Spending for Seniors and People with Disabilities,” Kaiser Family Foundation. May 1, 2017.
Available here. • Data Source(s):
o DPHHS direct data request.o “Most Current MACStats Compiled: Exhibit 33: CHIP Spending by State, FY2019,” MACPAC. Dec. 2020. Available here.
• Technical Notes: o Spending data for HMK children (CHIP Expansion) not available. Expenditures estimated using MACPAC data. CHIP enrollment
estimates based on CY basis; spending based on FY basis. Spending totals may not sum to previously reported expenditure totals due to exclusions (e.g., supplemental payments, service spending not attributed to members). The following payments were eliminated from spending and per member spending totals: hospital utilization fee; HUF (HRD) HELP SSR; Disproportionate Share Hospital payments; DSH (FMAP) payments. “Disabled” category includes individuals from all age categories. Seniors exclude “disabled” who are otherwise captured by “Individuals with Disabilities”.
52

Medicaid in Montana – January 2021
ReferencesMontana Medicaid Basics (6 of 6)
Slide 23: Cost Trends - Service Category Spending as a Percentage of Total Spending PMPM by Population (SFY 2019)• Data Source(s):
o DPHHS direct data request.• Technical Notes:
o Spending data for HMK children (CHIP Expansion) not available. Spending totals may not sum to previously reported expenditure totals due to exclusions (e.g., supplemental payments, service spending not attributed to members). The following payments wereeliminated from spending and per member spending totals: hospital utilization fee; HUF (HRD) HELP SSR; Disproportionate Share Hospital payments; DSH (FMAP) payments. IHS payments not broken out by service category. Service categories based on Manattcategorization.
o “Disabled” category includes individuals from all age categories. Seniors exclude “disabled” who are otherwise captured by “Individuals with Disabilities”.
Slide 24: Medicaid Payments by Provider Type (SFY 2019)• Data Source(s):
o DPHHS direct data request.• Technical Notes:
o Spending totals may not sum to previously reported expenditure totals due to differing specifications and exclusions (e.g., supplemental payments, service spending not attributed to members). The following payments were eliminated from spending andper member spending totals: hospital utilization fee; HUF (HRD) HELP SSR; Disproportionate Share Hospital payments; DSH (FMAP) payments. IHS payments not broken out by service category. Service categories based on Manatt categorization.
53

Medicaid in Montana – January 2021
ReferencesThe Impact of Medicaid Expansion (1 of 5)
Slide 26: Medicaid Expansion Enrollees• “Medicaid Expansion: How It Affects Montana’s State Budget, Economy, and Residents,” MHCF and Manatt Health. June 2018. Available
here. • “Section 1115 Medicaid Exapnsion/HELP Demonstration Waiver Legislative Summary,” DPHHS. Oct. 1, 2020. Available here. • “Montana Medicaid and Healthy Montana Kids Plus Member Guide,” DPHHS. Jan. 1, 2020. Available here. • Data Source(s):
o DPHHS direct data request.o Manatt analysis of “Montana Medicaid Expansion Dashboard,” DPHHS. Available here.
Slide 27: Medicaid Expansion Enrollee Premiums• “HELP Premiums,” DPHHS. Available here. • “Federal Evaluation of Montana Health and Economic Livelihood Partnership (HELP): Draft Interim Evaluation Report,” Social & Scientific
Systems. Jul. 22, 2019. Available here. • “Provider Notice: Elimination of Copayment,” DPHHS. Dec. 27, 2019. Available here. • Data Source(s): Manatt analysis of “Montana Medicaid Expansion Dashboard,” DPHHS. Available here. • Technical Notes: Premium collections vary significantly over the course of a CY, with peaks between February and April annually.
Slide 28: Employment Status of Medicaid Expansion Enrollees (2019)• Data Source(s):
o “Medicaid Expansion & Montana Employers,” MT Department of Revenue, Department of Labor and Industry, and DPHHS. Sep. 15, 2020. Available here. Analysis relies on CPS March 2019 Supplement.
o “Montana Medicaid Expansion Dashboard,” MT DPHHS. Available here.
54

Medicaid in Montana – January 2021
ReferencesThe Impact of Medicaid Expansion (2 of 4)
Slide 29: HELP-Link Employment Training and Outcomes (2018-20)• “HELP-Link,” Montana Department of Labor & Industry. Available here. • “HELP-Link Program: 2018 Fiscal Year End Report,” Montana Department of Labor & Industry. Available here. • Data Source(s):
o “Medicaid Expansion & Montana Employers,” MT Department of Revenue, Department of Labor and Industry, and DPHHS. Sep. 15, 2020. Available here. Analysis relies on CPS March 2019 Supplement.
o “Montana Medicaid Expansion Dashboard,” MT DPHHS. Available here.• Technical Notes:
o “Received Employment Service” data available only on a CY basis; “Received Intensive, One-on-One Services” data available only on a FY basis.
o It is unclear what proportion of the “percent employed after exit” were not previously employed prior to receiving employmentservices.
o Average quarterly wage data not shown, but available in Databook.
Slide 30: Percent of Businesses with at Least One Medicaid Enrollee by Industry and Industry Hourly Wage (2019) • Data Source(s):
o “Medicaid Expansion & Montana Employers,” MT Department of Revenue, Department of Labor and Industry, and DPHHS. Sep. 15, 2020. Available here.
• Technical Notes:o Bubbles scaled to percentage of industry’s businesses with at least one Medicaid enrollee, not to the size of the industry.
55

Medicaid in Montana – January 2021
ReferencesThe Impact of Medicaid Expansion (3 of 4)Slide 31: Expansion Enrollee Outcomes• Data Source(s): “The Medicaid Expansion (HELP Act): How it is Reducing Financial Barriers and Improving Access to Essential Health
Services in Montana,” Montana DPHHS. Jan. 22, 2019. Available here. Based on 2018 Medicaid Expansion survey.
Slide 32: Expansion Access to Preventive Services• Data Source(s): DPHHS direct data request.• Technical Notes: Service counts of unique expansion enrollees at any point during the CY.
Slide 33: Expansion Access to Preventive Services and Diagnoses• “Association of Medicaid Expansion Under the Affordable Care Act With Insurance Status, Cancer Stage, and Timely Treatment Among
Patients With Breast, Colon, and Lung Cancer,” Health Policy. Feb. 2020. Available here. • Data Source(s): DPHHS direct data request.• Technical Notes: Service counts of unique expansion enrollees at any point during the CY.
Slide 34: SUD Support and Access• “Medicaid’s Role in the Delivery and Payment of Substance Use Disorder Services in Montana,” MHCF and Manatt Health. Mar. 2017.
Available here.• Data Source(s):
o Manatt analysis of “2016-2018 National Survey on Drug Use and Health (NSDUH) Substate Region Estimates – Tables,” SAMSHA. Jul. 2020. Available here.
o DPHHS direct data request.• Technical Notes: SAMSHA NSDUH survey results for persons aged 12 or older; annual averages based on 2016, 2017, and 2018. All Montana
to US comparisons are statistically significant.
56

Medicaid in Montana – January 2021
ReferencesThe Impact of Medicaid Expansion (4 of 4)Slide 35: State Budget Savings• “Medicaid expansion has saved Montana $30 million,” Modern Healthcare. Oct. 2, 2017. Available here. • “How and When Medicaid Covers People Under Correctional Supervision,” Pew. Aug. 2, 2016. Available here. • “The Impact of Medicaid Expansion on States’ Budgets,” The Commonwealth Fund. May 5, 2020. Available here. • Data Source(s): Manatt analysis of Montana Medicaid enrollment and spending data, SFY13-19. DPHHS direct data request.• Technical Notes: Women enrolled in the expansion group and become pregnant may stay enrolled during the coverage year; the State
receives the enhanced FMAP. Another mechanism where expansion generates savings to traditional Medicaid is behavior change: individuals, who in the absence of expansion reduce income/assets or apply for disability in order to qualify for traditional Medicaid. With expansion, these individuals no longer need to adapt themselves so they are Medicaid eligible.
Slide 36: Economic Impact of Medicaid Expansion• Data Source(s):
o “The Economic Impact of Medicaid Expansion in Montana: Updated Findings,” University of Montana Bureau of Business and Economic Research. Jan. 2019. Available here.
o “The Economic Impact of Medicaid Expansion in Montana: Updated Findings (2021),” Montana Health Care Foundation and Headwaters Foundation. Jan. 2021.
• Technical Notes: Income and sales in 2018 dollars
Slide 37: Uncompensated Care• “Medicaid Expansion: How It Affects Montana’s State Budget, Economy, and Residents,” Montana Health Care Foundation. Jun. 2018.
Available here.• “Understanding The Relationship Between Medicaid Expansions And Hospital Closures,” Health Affairs. Jan. 2018. Available here. • Data Source(s): American Hospital Association Annual Hospital Survey via Montana Hospital Association
57

Medicaid in Montana – January 2021
ReferencesTribal Communities (1 of 2)
Slide 39: Medicaid Coverage for American Indians in Montana (2019)• “Impact of ACA Repeal on American Indians and Alaska Natives,” Montana Health Care Foundation. Jan. 2018. Available here. • “100% FMAP for Urban American Indians and Alaska Natives, Clarifying Facts and Challenging Misconceptions,” Urban Indian Health
Institute. Mar. 2017. Available here. • Data Source(s):
o DPHHS direct data request.
Slide 40: IHS Purchase or Referred Care: Change in Referrals Since 2015 (2015-19)• Manatt analysis of Montana Medicaid enrollment and spending data, SFY13-19. DPHHS. • “Impact of ACA Repeal on American Indians and Alaska Natives,” Montana Health Care Foundation. Jan. 2018. Available here. • “Billings Area,” Indian Health Service. Available here. • “Impact of Medicaid Expansion in the Crow Community,” DPHHS. Jan. 14, 2019. Available here. • “Disparities Fact Sheet,” Indian Health Service. Available here. • “Medicaid and American Indians and Alaska Natives,” Kaiser Family Foundation. Sept. 2017. Available here and here.• Data Source(s):
o DPHHS direct data request.• Technical Notes:
o IHS provides a limited amount of funding for urban Indian health programs that serve AI/AN populations living off-reservation or –tribal lands
58

Medicaid in Montana – January 2021
ReferencesTribal Communities (2 of 2)
Slide 41: Preventive Services and Treatment Received by AI/AN Expansion Enrollees • “Medicaid Expansion in Indian Country: Improving the Health of Individuals and Communities,” Montana Budget and Policy Center. Nov.
2018. Available here. • Data Source(s): DPHHS direct data request.• Technical Notes: Income and sales in 2018 dollars
Slide 42: Medicaid Payments to IHS & Tribal Health Facilities (2010-19)• “Indian Health Service: Spending Levels and Characteristics of IHS and Three Other Federal Health Care Programs,” US Government
Accountability Office. Dec. 2018. Available here. • Data Source(s): DPHHS direct data request.• Technical Notes: Income and sales in 2018 dollars
59