january 2018 - idfc mutual funds€¦ · 3-4% over the last month. ... on a sectoral front, telecom...
TRANSCRIPT

FACTSHEETJanuary 2018

2
Index
Commentary - Equity Outlook 1
Commentary - Debt Outlook 3
IDFC Classic Equity Fund 4
IDFC Sterling Equity Fund 5
IDFC Premier Equity Fund 6
IDFC Focused Equity Fund 7
IDFC Equity Fund 8
IDFC Nifty Fund 9
IDFC Infrastructure Fund 10
IDFC Tax Advantage (ELSS) Fund 11
IDFC Arbitrage Fund 12
IDFC Arbitrage Plus Fund 13
IDFC Sensex Exchange Traded Fund 14
IDFC Nifty Exchange Traded Fund 15
IDFC Dynamic Equity Fund 16
IDFC Balanced Fund 17
IDFC Monthly Income Plan 18
IDFC Asset Allocation Fund of Funds 19
IDFC All Seasons Bond Fund 20
IDFC Cash Fund 21
IDFC Ultra Short Term Fund 22
IDFC Money Manager Fund – Treasury Plan 23
IDFC Money Manager Fund – Investment Plan 24
IDFC Banking & PSU Debt Fund 25
IDFC Super Saver Income Fund – Short Term 26
IDFC Corporate Bond Fund 27
IDFC Credit Opportunities Fund 28
IDFC Super Saver Income Fund – Medium Term 29
IDFC Super Saver Income Fund – Investment Plan 30
IDFC Dynamic Bond Fund 31
IDFC Government Securities Fund – Short Term Plan 32
IDFC Government Securities Fund – Provident Fund Plan 32
IDFC Government Securities Fund – Investment Plan 33
Performance Table 34
SIP Performance 37
Dividend History 39
Fund Manager Details 40
Investment Objective 41

1
WHAT WENT BY
Global Factors
US Dollar continues to slide: The Dollar Index was down 3.2% MoM, as a result most EM currencies appreciated 3-4% over the last month. The UK pound and EURO rose 5.0% and 3.4% respectively against the Dollar. In this context, the INR was muted, rising 0.3% against the Dollar. The Dollar has seen continued weakness despite the strong rally seen after Mr Trump won the US Presidential election. The Dollar has depreciated 11.3% over the last year and is down 8.9% since 8-Nov-16, the day of Mr Trump’s Presidential victory. Over the last 1 Year, the GBP and EURO are up 13.0% and 16.0% respectively.
Oil continues to sustain gains, metals take a breather: Oil prices continued to rise in January with the WTI rising 7.1% to $64.7 and the Brent rising 3.3% to $69.1 - most of the gains in crude have been led by cuts in production as compared to a structural improvement in demand. Rising crude prices should trigger an increase in US shale oil supply, as has been generally speculated. On a 1-Year basis, Brent is up 24.4% and WTI is up 21.7% which has fuelled concerns of inflation. Apart from Zinc (+6.7% MoM), most base metals took a breather with Aluminium (-2.1% MoM) falling the most followed by Copper and Steel. However, on a 1-Year basis, most base metals are up ~20%, while crude oil is up 24%, it may be a bit early to forecast a run away inflation at this juncture, though worries of deflation should be put aside firmly.
Equities continued their up move in Jan, EMs outperform: The MSCI World Index was up 5.6% in Jan with the Developed Market Index rising 5.2% and Emerging Market Index rising 8.3%. Indian market Dollar performance was in line, with the SENSEX rising 5.9% in Dollar terms. On a 1 year basis, Indian market return in Dollar terms is 37.9%, which is in line with the EM Index (+38.0%). Developed Markets Index has given 23.5% return in the last year. Weakening Dollar resulted in significant inflows into EMs. MSCI Global Emerging Index is still roughly 6% below 2008 levels, whereas most emerging markets have already crossed the 2008 peaks in local currency.
Interest Rates rise across the world, spooking markets in Feb: The 10-Year US yield rose 30 bps to 2.71%. This could impact equity valuations going forward. Yields across DMs like US, UK & Germany increased 30 bps MoM.
Domestic Factors:
Q3 FY 18 Mid-term Earnings Review: 118 of the BSE200 companies have reported - PAT growth of 21% as compared to 7% in the September quarter for these 118 companies. Ex-Financials, these companies have witnessed a Sales, EBITDA & PAT growth of 10%, 20% & 21% respectively. PAT for the stable segment (Pvt Banks, NBFCs, Consumer Staple & Discretionary, Auto, IT & Healthcare) grew 16% whereas PAT for the cyclicals segment (Corp Banks, Cement, Industrials, Commodities, Energy, Utilities & Telecom) grew 28% YoY. On a sectoral basis, growth was led by Industrials (+115% YoY), Energy (+50% YoY), Consumer Discretionary (+44% YoY) and Commodities (+30% YoY); whereas Telecom (-116%) and Corp Banks (-47%) were the key underperformers.
Among Industrials & Infra, L&T reported spike in order inflows whereas Tata Motors reported strong growth on a low base in the domestic business. Private banks had a steady quarter with PAT growth of 23% while High provisioning in Corporate Banks resulted in continued stress in that segment. Among Consumer stocks, Hindustan Unilever reported robust quarter with broadbased growth. In Energy, Reliance reported another strong quarter led by petchem and Jio turning profitable. IOCL reports strong quarter led by inventory gains and recovery in marketing margins.
Equity Markets - Large Caps outperform Mid & Small Caps: In a trend reversal from the last couple of years, Large caps significantly outperformed Mid & Small Caps with the NIFTY rising 4.7% as compared to a 1.6% fall in NSE Mid Cap and 3.0% fall in NSE Small Cap. On a sectoral front, Telecom (-11.8%) was the worst performer, as Reliance Jio’s fresh round of tariffs cuts are likely to delay the earnings recovery for incumbents. IT services (+11.3%) was the top performer led by hopes of higher IT spends in US post the tax reform as well as a flight to quality, low beta.
Equity markets saw a sharp fall in the first two days of Feb, led by (i) budget being viewed as populist and expansionary by a section of market (ii) 10 Year yields spiking above 7.50% on inflation concerns with the budget revising FY 18 and FY 19 Fiscal Deficit target upwards and continued surge in crude (iii) Imposition on LTCG on Equities increasing uncertainty and (iv) global markets falling on concerns of increasing cost of capital.
Domestic Growth signs stable to positive: Nov IIP surged to 8.4% vs 2.2% in Oct led by manufacturing sector. The surprise spike could be attributed to the festival related distortion as evidenced in the past. Capital goods output improved further to 9.4% vs 6.6% in Oct. Electricity production inched up to 3.9% vs 3.2% and mining also rose marginally to 1.1% in Nov.
Inflation: Dec CPI expectedly rose to 5.2% vs 4.9% in Nov but the key relief was the non-volatile component of
Commentary - Equity OutlookMr. Anoop Bhaskar Head - Equity

2
CPI (excl veggies, pulses, HRA, fuel) eased to 4.4% YoY from 4.5% in Nov, a first decline in three months. Core inflation rose to 4.5% yoy after staying in the 3.9-4.1% for past 6 months led by health and education services. WPI also eased to 3.58% in Dec vs 3.93% in Nov as food inflation eased.
Trade Deficit: Dec trade deficit rose to 3 year high to USD 14.88bn vs USD 13.8bn in the previous month led by rally in crude, and gold prices. Gold imports were up 71% in Dec post decline for 3 straight months and oil imports were up 35%. Exports were up 12.36% as engineered goods stayed strong while gems & jewellery was subdued.
Strong FII flows in line with EMs: FIIs started the year with strong inflows in contrast to Dec with net inflows of USD 2bn. DIIs turned cautious albeit net buyers of small quantum ~USD 63mn. Mutual Funds were net buyers of ~USD 1.2bn in the month while Insurers were net sellers to the tune of ~USD 1.1bn.
Going Forward:
On the earnings front, over the next two fiscal years, BSE 200 earnings are expected to grow 19.5% CAGR, driven by cyclical segment (Corp Banks, Cement, Industrials, Commodities, Energy, Utilities & Telecom) that are expected to grow 24% CAGR. Earnings for the Stable segment (Pvt Banks, NBFCs, Consumer Staple & Discretionary, Auto, IT & Healthcare) are expected to be 14.7% CAGR over FY 17-20E which appears reasonable given growth of 15.7% CAGR over 2008-17.
In the near future, the re-introduction of Long term capital gains tax will be the single biggest factor to impact investor sentiments. Hopefully, over time, the concerns on this issue will subside and rationalize - you may be taxed only if you book gains! However, the return expectations from equity would have been impacted by 10% going forward. With continuous USD weakening, flows into emerging markets should remain buoyant. Even if India remains underweight within emerging market allocation, the torrent of flows should boost FII flows into India after tepid flows over the last two years. Hence, the flows into Indian equities may not represent the dramatic shift in sentiments as visible post the Budget.
Currency & Commodities Last Price % Change YTD % Change MTD
USD / INR 63.588 -0.45% -0.45%
Dollar Index 89.13 -3.25% -3.25%
Gold 1,345.15 3.23% 3.23%
Crude OIL
WTI (Nymex) 64.73 7.13% 7.13%
Brent Crude 69.05 3.26% 3.26%
India Macro Analysis Latest Equity Flows USD Mn
GDP 6.30 FII (USD mln)
IIP 8.40 YTD 2,038.61
Inflation (WPI Monthly) 3.58 MTD 2,038.61
Inflation (CPI Monthly) 5.21 *DII (USD mln)
Commodity (CRB Index) 443.44 YTD 1,146.81
MTD 1,146.81*DII : Domestic Mutual Funds
Data as on 31st January 2018
Equity Markets Index % Change YTD % Change MTD P/E
Nifty 11,027.70 4.72% 4.72% 20.91
Sensex 35,965.02 5.60% 5.60% 21.92
Dow Jones 26,149.39 5.79% 5.79% 16.90
Shanghai 3,480.83 5.25% 5.25% 12.99
Nikkei 23,098.29 1.46% 1.46% 17.58
Hang Sang 32,887.27 9.92% 9.92% 11.81
FTSE 7,533.55 -2.01% -2.01% 13.70
MSCI E.M. (USD) 1,254.59 8.30% 8.30% 12.58
MSCI D.M.(USD) 2,213.24 5.22% 5.22% 16.18
MSCI India (INR) 1,303.56 3.04% 3.04% 20.77
Source: Bloomberg, SEBI

3
WHAT WENT BY
2018 has been tough for fixed income globally on expectations of tighter advanced economy rates & balance sheet policies on the back of continued positive economic surprises & rising inflation expectations. US treasuries fell sharply with the 10yr moving up by 30bps to end at 2.70% as at the end of January. Indian bond yields also rose with the new ten-year benchmark 7.17% 2028 ending the month up 26bps at 7.43%. Apart from sharp rise in global yields & oil prices there was considerable uncertainty on FY18 borrowing calendar with Government 1st announcing INR 50,000cr extra borrowing but subsequently cancelling INR 30,000cr due to rise in yields. However, the government/ RBI largely wasted the opportunity in terms of its effect on bond yields as they decided to cut the borrowing from the longest 2 securities for the most part (where there was presumably assured demand from insurers) rather than the so-called ‘belly’ of the curve (where the pain was maximum from lack of absorptive power of general market participants).
The Union Budget 2018 came in the backdrop of an extremely nervous bond market. Given this context, the bond market was hoping to be delighted by the Budget. Had the finance minister chosen to stick to the initial glide path on fiscal deficit and announced 3% deficit target for FY19, that would have constituted such a delight. As it turned out, the minister revised current year’s deficit to 3.5% and announced 3.3% for the year ahead. Having said that, he also adopted recommendations of the new FRBM with a commitment to reach 3% by FY21. As things stand, it is a prudent enough budget. Thus total expenditure grew by 12.3% in FY18 while the nominal GDP grew by 10%. However, in FY19 total expenditure is budgeted to grow by only 10.1% even though nominal GDP growth is higher at 11.5%. Thus there is decided compression in expenditure to GDP despite calls for a ‘stimulatory’ budget. Furthermore, there is more reliance on tax revenues to fund spending with budgeted capital receipts scheduled to rise only modestly.
The bond market has also been unnerved by the announced intention of setting MSP at 50% higher than cost of produce for the crop. However, there are quite a few caveats here that one should remember. One, the finance minister said that this formula has already been applied for the Rabi MSP announcements made. While these MSPs were higher, they weren’t extra-ordinarily so. This then means that a similar magnitude should be expected in the Kharif crops for next season as well. Two, MSPs influence prices for only a small minority of crops. Three, this hike may also be considered in the nature of a fiscal transfer where the government(s) bear the difference between MSP and market price as a means of supporting farmers. Therefore, even once the operation is fully functional, the entire hikes may not reflect in market prices. Fourth, the government is also on a mega-drive to link all APMCs via the e-NAM network. This may actually lead to intermediary margins coming off thereby compensating in end product prices for some eventual rise in farm level prices. All told then this is too early to react on the MSP news.
The RBI policy on February 7th turned out to be much more run of the mill as there was no rate action but the stance was also kept neutral. This has provided relief to the market as some quarters were expecting a shift in stance while some were even assigning probabilities for an actual rate hike.
Outlook:
Our view has been that the bar for a rate hike is high currently. We are comfortable reiterating this view post the February policy. The RBI / MPC assessment is quite continuous from the negative output gap that they had assessed in the December policy. Thus recovery is still judged to be nascent and most factors posing upside risks to CPI are largely supply side. If one needs to start ascribing timing for a rate hike (as opposed to actually expecting it as a base case), it is most likely to be not before August. By then the RBI / MPC will have much more information on both some of the supply side drivers of CPI (oil, MSP, monsoons ) as well as be able to assess how enduring and persistent the current cyclical growth upturn is likely to be, in the context of closure of the current negative output gap.
For a RBI / MPC that is still some distance from actively contemplating its first rate hike, there is surely excess fear pricing in the bond market. This makes front end rates (upto 5 – 6 years) a buy and hold trade from a core portfolio standpoint. Longer duration may also tactically make sense at least till meaningful new bond supply hits in April; given oversold markets and with one imminent fear with respect to RBI out of the way. However, one can only take a longer term call on long duration once the current impasse with respect to bond appetite from large local banks is resolved.
Commentary - Debt OutlookMr. Suyash Choudhary
Head - Fixed Income

4
IDFC Classic Equity FundAn open ended ‘diversified’ equity fund
31st January 2018
FUND FEATURES
INDUSTRY ALLOCATION
Size
Large Cap
Mid Cap
Small Cap
Style Growth Blend Value
About the Fund: IDFC Classic Equity fund is a diversified equity fund with a large cap bias currently. The focus of the fund is to build a portfolio of Quality companies while being cognizant of the relative valuation.
Nature: Equity
Monthly Avg AUM: ` 2,378.31 Crores
Month end AUM: ` 2442.71 Crores
Inception Date: 9 August 2005
Fund Manager: Mr. Anoop Bhaskar (w.e.f. 30th April 2016)
Other Parameter: Beta 0.99
R Square 0.91
Standard Deviation (Annualized) 13.67%
Sharpe* 0.61
Portfolio Turnover Equity 0.39
Aggregate^ 1.37
Expense Ratio£ Regular 2.08%
Direct 0.50%
Benchmark: S&P BSE 200
SIP (Minimum Amount): ` 1,000/-
SIP Frequency: Monthly
SIP Dates (Monthly): Any day of the month, except 29th, 30th & 31st day of the monthInvestment Objective: Refer Pg No from 41 to 42 Minimum Investment Amount : ` 5,000/- and any amount thereafter
Option Available: Growth, Dividend - (Payout, Reinvestment and Sweep (from Equity Schemes to Debt Schemes only))
Exit Load: 1% if redeemed within 365 days from the date of allotment. (w.e.f. 10th May 2016)
Top 10 Equity Holdings
Banks 20.46%Finance 10.84%Auto Ancillaries 6.25%Petroleum Products 5.90%Software 5.75%Construction Project 5.56%Auto 4.80%Pharmaceuticals 4.30%Power 4.04%Consumer Non Durables 3.65%Retailing 3.41%Industrial Capital Goods 3.16%Industrial Products 3.06%Cement 3.06%
Performance TableScheme Name CAGR Returns (%) Current Value of Investment of ` 10,000
1 Year 3 Years 5 YearsSince Inception Aug 09, 2005
1 Year 3 Years 5 YearsSince InceptionAug 09, 2005
IDFC Classic Equity Fund 32.22% 14.27% 15.74% 13.27% 13,222 14,933 20,777 47,416
S&P BSE 200 TRI# 31.70% 11.17% 15.95% 14.83% 13,170 13,746 20,966 56,243
Nifty 50 TRI## 30.48% 9.10% 14.18% 14.69% 13,048 12,991 19,418 55,372
TRI - Total Return IndexPerformance based on NAV as on 31/1/2018. Past performance may or may not be sustained in future.For other funds managed by the fund manager, please refer page no. 34 - 36 & the respective fund pages The performances given are of regular plan growth option.Regular and Direct Plans have different expense structure. Direct Plan shall have a lower expense ratio excluding distribution expenses, commission expenses etc.*Risk-free rate assumed to be 6.00% (FBIL OVERNIGHT MIBOR as on 31st January 2018). Ratios calculated on the basis of 3 years history of monthly data. ^Portfolio Turnover ratio is calculated as Lower of purchase or sale during the period / Average AUM for the last one year (includes Fixed Income securities and Equity derivatives). #Benchmark Returns. ##Alternate Benchmark Returns.£The above recurring expense ratio does not include Goods and Service Tax on Investment Management Fees, the proportionate charge in respect of sales beyond T-15 cities subject to maximum of 30 bps on daily net assets and borrowing costs, wherever applicable.Current Index performance adjusted for the period from since inception to June 28, 2007 with the performance of S&P BSE 200 price return index (Benchmark)With effect from 1st February 2018, we are comparing the performances of the funds with the total return variant of the benchmark instead of the price return variant.
SIP PERFORMANCE
Monthly SIP of ` 10,000 in IDFC Classic Equity Fund - Regular Plan - Growth
1 Year 3 Years 5 Years 7 Years 10 YearsSince
InceptionAug 09, 2005
Total Amount Invested (`) 1,20,000 3,60,000 6,00,000 8,40,000 12,00,000 15,00,000Total Value as on January 31, 2018 (`) 1,34,622 4,93,170 9,65,802 15,54,739 25,70,248 35,47,652Fund Returns (%) 26.49 21.41 19.27 17.33 14.49 12.94Total Value of S&P BSE 200 TRI# 1,35,119 4,78,763 9,34,918 15,12,199 26,22,876 37,41,316S&P BSE 200 TRI (%)# 27.88 19.29 17.98 16.57 14.87 13.73Total Value of Nifty 50 TRI## 1,35,318 4,68,469 8,87,029 14,19,213 24,32,559 34,98,520Nifty 50 TRI (%)## 28.28 17.75 15.83 14.80 13.49 12.77Past performance may or may not be sustained in future.Dividends are assumed to be reinvested and bonus is adjusted. Load is not taken into consideration. To illustrate the advantages of SIP investment, this is how your investment would have grown if you had invested say `10,000 systematically on the first business Day of every month over a period of time. Returns are calculated by using XIRR approach. XIRR helps in calculating return on investment given an initial and final value and a series of cash inflows and outflows with the correct allowance for the time impact of the transactions. Data as on 31st January 2018.
Riskometer
Investors understand that their principal will be at Moderately High risk
This product is suitable for investors who are seeking*:
Create wealth over a long period of time.•
Investment predominantly in equity and •equity related instruments across market capitalisation.
*Investors should consult their financial advisers if in doubt about whether the product is suitable for them.
Ferrous Metals 2.93%Non - Ferrous Metals 2.13%Gas 2.07%Chemicals 1.63%Hotels, Resorts And Other Recreational Activities 1.30%Consumer Durables 0.81%Oil 0.77%Media & Entertainment 0.70%Fertilisers 0.68%Transportation 0.66%Textile Products 0.51%Minerals/Mining 0.40%Miscellaneous 0.04%
NAV (`)
Regular Plan Growth 47.4162Regular Plan Dividend 17.5624
PORTFOLIO
Name % of NAV
Equity and Equity related Instruments 98.90%Banks 20.46%HDFC Bank 5.26%ICICI Bank 2.84%Kotak Mahindra Bank 2.30%State Bank of India 1.97%Axis Bank 1.55%Axis Bank - Equity Futures 0.69%RBL Bank 1.28%The Federal Bank 1.25%Punjab National Bank 1.20%Union Bank of India 0.86%IndusInd Bank 0.65%Bank of Baroda 0.61%Finance 10.84%HDFC 2.09%HDFC - Equity Futures 0.61%M&M Financial Services 1.33%Shriram City Union Finance 1.32%Sundaram Finance 1.31%Bharat Financial Inclusion 1.26%Reliance Nippon Life Asset Management 0.84%ICICI Lombard General Insurance Company 0.71%TI Financial Holdings 0.71%Max Financial Services 0.66%Auto Ancillaries 6.25%MRF 1.23%Apollo Tyres 1.16%Apollo Tyres - Equity Futures 0.22%Minda Industries 1.11%CEAT 1.10%Exide Industries 0.98%Asahi India Glass 0.45%Petroleum Products 5.90%Reliance Industries 2.36%Reliance Industries - Equity Futures 0.61%Indian Oil Corporation 1.22%Hindustan Petroleum Corporation 0.89%Bharat Petroleum Corporation 0.82%Software 5.75%Infosys 2.77%HCL Technologies 1.00%KPIT Technologies 0.91%Tech Mahindra - Equity Futures 0.54%Mastek 0.52%Construction Project 5.56%Larsen & Toubro 3.17%Voltas 0.84%Sadbhav Engineering 0.83%NCC 0.73%Auto 4.80%Hero MotoCorp 1.54%Tata Motors 1.24%Tata Motors - Equity Futures 0.25%Mahindra & Mahindra 1.00%Bajaj Auto 0.76%Pharmaceuticals 4.30%Sun Pharmaceutical Industries 1.33%Natco Pharma 1.05%Indoco Remedies 0.84%Cadila Healthcare 0.56%Cadila Healthcare - Equity Futures 0.14%Eris Lifesciences 0.39%Power 4.04%NTPC 1.17%
Name % of NAV
Nava Bharat Ventures 1.13%Kalpataru Power Transmission 0.94%Torrent Power 0.81%Consumer Non Durables 3.65%ITC 2.43%Nestle India 0.80%DCM Shriram 0.42%Retailing 3.41%Future Retail 1.93%Future Lifestyle Fashions 1.14%Aditya Birla Fashion and Retail 0.33%Industrial Capital Goods 3.16%Bharat Electronics 1.01%Thermax 0.87%Bharat Heavy Electricals - Equity Futures 0.68%CG Power and Industrial Solutions 0.60%Industrial Products 3.06%Graphite India 1.47%Mahindra CIE Automotive 0.85%Bharat Forge 0.74%Cement 3.06%Ambuja Cements 1.49%The Ramco Cements 0.73%JK Cement 0.57%Deccan Cements 0.27%Ferrous Metals 2.93%Jindal Steel & Power 1.03%JSW Steel 0.97%Tata Steel 0.93%Non - Ferrous Metals 2.13%National Aluminium Company 1.09%Vedanta 1.04%Gas 2.07%Petronet LNG 1.15%GAIL (India) 0.92%Chemicals 1.63%Tata Chemicals 0.95%Deepak Nitrite 0.68%Hotels, Resorts And Other Recreational Activities 1.30%The Indian Hotels Company 1.30%Consumer Durables 0.81%Crompton Greaves Consumer Electricals 0.48%Sheela Foam 0.33%Oil 0.77%Oil & Natural Gas Corporation 0.77%Media & Entertainment 0.70%Zee Entertainment Enterprises 0.70%Fertilisers 0.68%Coromandel International 0.68%Transportation 0.66%Container Corporation of India 0.66%Textile Products 0.51%Dollar Industries 0.51%Minerals/Mining 0.40%Coal India 0.34%NMDC 0.07%Miscellaneous 0.04%Praxis Home Retail 0.04%Preference Shares 0.01%Media & Entertainment 0.01%Zee Entertainment Enterprises 0.01%Net Cash and Cash Equivalent 1.09%Grand Total 100.00%

5
IDFC Sterling Equity FundAn open ended ‘mid & small cap’ equity fund
31st January 2018
FUND FEATURES
INDUSTRY ALLOCATION
Size
Large Cap
Mid Cap
Small Cap
Style Growth Blend Value
About the Fund: IDFC Sterling Equity Fund is a mid/small cap fund that focuses on active stock selection strategy.
Nature: Equity
Monthly Avg AUM: ` 2,465.39 Crores
Month end AUM: ` 2482.61 Crores
Inception Date: 7 March 2008
Fund Manager: Mr. Anoop Bhaskar (w.e.f. 30th April 2016) & Mr. Daylynn Pinto (w.e.f. 20th October 2016)
Other Parameter:
Beta 0.98
R Square 0.82
Standard Deviation (Annualized) 16.50%
Sharpe* 0.62
Portfolio Turnover
Equity 0.28 Aggregate^ 0.37
Expense Ratio£
Regular 2.07%
Direct 1.04%
Benchmark: Nifty Free Float Midcap 100
SIP (Minimum Amount): ` 1,000/-
SIP Frequency: Monthly
SIP Dates (Monthly): Any day of the month, except 29th, 30th & 31st day of the monthInvestment Objective: Refer Pg No from 41 to 42 Minimum Investment Amount : ` 5,000/- and any amount thereafter
Option Available: Growth, Dividend (Payout, Reinvestment and Sweep (from Equity Schemes to Debt Schemes only))
Exit Load: 1.00% if redeemed on or before 365 days from the date of allotment. (w.e.f. 7th September, 2015)
Top 10 Equity Holdings
Auto Ancillaries 11.74%Banks 10.77%Retailing 8.06%Construction Project 7.85%Finance 7.66%Cement 5.23%Industrial Products 4.44%Pharmaceuticals 4.06%Power 3.73%Industrial Capital Goods 3.41%Transportation 3.27%Consumer Durables 3.11%
Performance Table
Scheme Name CAGR Returns (%) Current Value of Investment of ` 10,000
1 Year 3 Years 5 YearsSince InceptionMar 07, 2008
1 Year 3 Years 5 YearsSince InceptionMar 07, 2008
IDFC Sterling Equity Fund 47.40% 16.16% 21.79% 19.37% 14,740 15,687 26,811 57,798
Nifty Free Float Midcap 100 TRI#
36.60% 17.89% 21.45% 13.98% 13,660 16,401 26,437 36,563
Nifty 50 TRI## 30.48% 9.10% 14.18% 10.10% 13,048 12,991 19,418 25,948
TRI - Total Return IndexPerformance based on NAV as on 31/1/2018. Past performance may or may not be sustained in future.For other funds managed by the fund manager, please refer page no. 34 - 36 & the respective fund pages The performances given are of regular plan growth option.Regular and Direct Plans have different expense structure. Direct Plan shall have a lower expense ratio excluding distribution expenses, commission expenses etc.*Risk-free rate assumed to be 6.00% (FBIL OVERNIGHT MIBOR as on 31st January 2018). Ratios calculated on the basis of 3 years history of monthly data. ^Portfolio Turnover ratio is calculated as Lower of purchase or sale during the period / Average AUM for the last one year (includes Fixed Income securities and Equity derivatives). #Benchmark Returns. ##Alternate Benchmark Returns.£The above recurring expense ratio does not include Goods and Service Tax on Investment Management Fees, the proportionate charge in respect of sales beyond T-15 cities subject to maximum of 30 bps on daily net assets and borrowing costs, wherever applicable.With effect from 1st February 2018, we are comparing the performances of the funds with the total return variant of the benchmark instead of the price return variant.
SIP PERFORMANCE
Monthly SIP of ` 10,000 in IDFC Sterling Equity Fund - Regular Plan - Growth
1 Year 3 Years 5 Years 7 YearsSince
InceptionMar 07, 2008
Total Amount Invested (`) 1,20,000 3,60,000 6,00,000 8,40,000 11,90,000
Total Value as on January 31, 2018 (`) 1,41,653 5,28,421 11,21,755 18,82,211 36,81,243
Fund Returns (%) 34.95 26.54 25.29 22.64 21.58
Total Value of Nifty Free Float Midcap 100 TRI# 1,38,222 5,14,645 11,22,526 18,40,712 32,56,556
Nifty Free Float Midcap 100 TRI (%)# 29.21 24.61 25.32 22.01 19.29
Total Value of Nifty 50 TRI## 1,37,666 4,67,821 8,91,592 14,23,939 24,04,361
Nifty 50 TRI (%)## 28.28 17.75 15.83 14.80 13.60
Past performance may or may not be sustained in future.Dividends are assumed to be reinvested and bonus is adjusted. Load is not taken into consideration. To illustrate the advantages of SIP investment, this is how your investment would have grown if you had invested say `10,000 systematically on the first business Day of every month over a period of time. Returns are calculated by using XIRR approach. XIRR helps in calculating return on investment given an initial and final value and a series of cash inflows and outflows with the correct allowance for the time impact of the transactions. Data as on 31st January 2018.
Riskometer
Investors understand that their principal will be at Moderately High risk
This product is suitable for investors who are seeking*:
Create wealth over a long period of time.•
Investment predominantly in equity and equity •related instruments in the mid cap segment.
*Investors should consult their financial advisers if in doubt about whether the product is suitable for them.
Software 3.08%Hotels, Resorts And Other Recreational Activities 2.70%Media & Entertainment 2.63%Consumer Non Durables 2.36%Textile Products 2.19%Gas 1.87%Chemicals 1.82%Ferrous Metals 1.50%Petroleum Products 1.04%Textiles - Cotton 0.79%Miscellaneous 0.45%Minerals/Mining 0.23%
NAV (`)Regular Plan Growth 57.7983Regular Plan Dividend 24.0641
PORTFOLIO
Name % of NAV
Equity and Equity related Instruments 94.01%Auto Ancillaries 11.74%Minda Industries 2.98%MRF 1.98%Exide Industries 1.35%Asahi India Glass 1.27%Apollo Tyres 1.07%CEAT 0.84%WABCO India 0.84%Igarashi Motors India 0.72%Sterling Tools 0.70%Banks 10.77%IndusInd Bank 2.75%RBL Bank 1.83%Union Bank of India 1.43%Punjab National Bank 1.42%The Karnataka Bank 1.31%Bank of Baroda 1.03%The Federal Bank 1.01%Retailing 8.06%Future Retail 4.67%V-Mart Retail 1.32%Future Lifestyle Fashions 1.15%Aditya Birla Fashion and Retail 0.92%Construction Project 7.85%KEC International 2.62%NCC 2.28%Voltas 1.58%Engineers India 1.36%Finance 7.66%Bajaj Finance 2.91%M&M Financial Services 1.43%Max Financial Services 1.01%Magma Fincorp 0.90%Mas Financial Services 0.75%ICICI Lombard General Insurance Company 0.67%Cement 5.23%The Ramco Cements 2.90%JK Cement 1.11%Sagar Cements 0.78%JK Lakshmi Cement 0.45%Industrial Products 4.44%Graphite India 1.07%Schaeffler India 1.01%KEI Industries 0.89%Mahindra CIE Automotive 0.77%Bharat Forge 0.69%Pharmaceuticals 4.06%Dishman Carbogen Amcis 1.32%Aurobindo Pharma 0.96%Hikal 0.79%Natco Pharma 0.67%Indoco Remedies 0.31%Power 3.73%
Name % of NAV
Nava Bharat Ventures 1.54%Kalpataru Power Transmission 1.25%CESC 0.93%Industrial Capital Goods 3.41%CG Power and Industrial Solutions 0.88%Skipper 0.74%Bharat Electronics 0.68%Lakshmi Machine Works 0.61%TD Power Systems 0.51%Transportation 3.27%VRL Logistics 2.35%Future Supply Chain Solutions 0.92%Consumer Durables 3.11%Crompton Greaves Consumer Electricals 1.30%Greenply Industries 1.11%Butterfly Gandhimathi Appliances 0.70%Software 3.08%Cyient 1.55%KPIT Technologies 1.02%Persistent Systems 0.51%Hotels, Resorts And Other Recreational Activities 2.70%The Indian Hotels Company 1.11%EIH 0.80%Wonderla Holidays 0.79%Media & Entertainment 2.63%Zee Entertainment Enterprises 0.96%PVR 0.88%Entertainment Network (India) 0.80%Consumer Non Durables 2.36%HBL Power Systems 1.43%Procter & Gamble Hygiene and Health Care 0.93%Textile Products 2.19%K.P.R. Mill 0.74%Dollar Industries 0.73%Raymond 0.72%Gas 1.87%Petronet LNG 1.33%Gujarat Gas 0.54%Chemicals 1.82%Deepak Nitrite 1.82%Ferrous Metals 1.50%Maharashtra Seamless 0.85%Jindal Steel & Power 0.64%Petroleum Products 1.04%Hindustan Petroleum Corporation 1.04%Textiles - Cotton 0.79%Nitin Spinners 0.79%Miscellaneous 0.45%Kirloskar Ferrous Industries 0.34%Praxis Home Retail 0.11%Minerals/Mining 0.23%NMDC 0.23%Net Cash and Cash Equivalent 5.99%Grand Total 100.00%

6
IDFC Premier Equity FundAn open ended ‘multi cap’ equity fund
31st January 2018
FUND FEATURES
INDUSTRY ALLOCATION
Size
Large Cap
Mid Cap
Small Cap
Style Growth Blend Value
About the Fund: IDFC Premier Equity Fund is a multi-cap Equity Fund. It is a fund that encourages systematic investing. The fund in the past has been opened for lump sum investments for limited time periods.
Nature: Equity
Monthly Avg AUM: ` 6,159.00 Crores
Month end AUM: ` 5922.16 Crores
Inception Date: 28 September 2005
Fund Manager: Mr. Anoop Bhaskar (w.e.f. 30th April 2016)
Other Parameter:
Beta 0.91
R Square 0.78
Standard Deviation (Annualized) 13.82%
Sharpe* 0.35
Portfolio Turnover
Equity 0.21 Aggregate^ 0.26
Expense Ratio£
Regular 2.00%
Direct 1.32%
Benchmark: S&P BSE 500
SIP (Minimum Amount): ` 2,000/-
SIP Frequency: Monthly
SIP Dates (Monthly): Any day of the month, except 29th, 30th & 31st day of the month
Investment Objective: Refer Pg No from 41 to 42 Minimum Investment Amount: ` 10,000/- and any amount thereafter (During the period when the fund is open for lump sum subscription)
Option Available: Growth, Dividend - (Payout, Reinvestment and Sweep (from Equity Schemes to Debt Schemes only))
Exit Load: 1.00% if redeemed before 365 days from the date of allotment. (w.e.f. 1st September, 2009)
Top 10 Equity Holdings
Finance 12.57%Consumer Non Durables 9.33%Banks 8.28%Transportation 7.05%Industrial Products 6.69%Pharmaceuticals 6.27%Auto 5.25%Auto Ancillaries 4.86%Construction Project 4.17%Chemicals 3.94%Commercial Services 3.33%Ferrous Metals 3.32%
Performance Table
Scheme Name CAGR Returns (%) Current Value of Investment of ` 10,000
1 Year 3 Years 5 YearsSince Inception Sep 28, 2005
1 Year 3 Years 5 YearsSince InceptionSep 28, 2005
IDFC Premier Equity Fund 28.48% 10.87% 19.61% 20.13% 12,848 13,636 24,496 96,299
S&P BSE 500 TRI# 33.24% 11.98% 16.46% 14.03% 13,324 14,049 21,436 50,611
Nifty 50 TRI## 30.48% 9.10% 14.18% 13.77% 13,048 12,991 19,418 49,207
TRI - Total Return IndexPerformance based on NAV as on 31/1/2018. Past performance may or may not be sustained in future.For other funds managed by the fund manager, please refer page no. 34 - 36 & the respective fund pages The performances given are of regular plan growth option.Regular and Direct Plans have different expense structure. Direct Plan shall have a lower expense ratio excluding distribution expenses, commission expenses etc.*Risk-free rate assumed to be 6.00% (FBIL OVERNIGHT MIBOR as on 31st January 2018). Ratios calculated on the basis of 3 years history of monthly data. ^Portfolio Turnover ratio is calculated as Lower of purchase or sale during the period / Average AUM for the last one year (includes Fixed Income securities and Equity derivatives). #Benchmark Returns. ##Alternate Benchmark Returns. £The above recurring expense ratio does not include Goods and Service Tax on Investment Management Fees, the proportionate charge in respect of sales beyond T-15 cities subject to maximum of 30 bps on daily net assets and borrowing costs, wherever applicable.Current Index performance adjusted for the period from since inception to June 28, 2007 with the performance of S&P BSE 500 price return index (Benchmark)With effect from 1st February 2018, we are comparing the performances of the funds with the total return variant of the benchmark instead of the price return variant.
SIP PERFORMANCE
Monthly SIP of ` 10,000 in IDFC Premier Equity Fund -Regular Plan - Growth
1 Year 3 Years 5 Years 7 Years 10 YearsSince
InceptionSep 28, 2005
Total Amount Invested (`) 1,20,000 3,60,000 6,00,000 8,40,000 12,00,000 14,90,000
Total Value as on January 31, 2018 (`) 1,30,839 4,50,955 9,64,200 16,64,491 32,56,625 52,59,869
Fund Returns (%) 19.93 15.03 19.31 19.33 19.51 19.55
Total Value of S&P BSE 500 TRI# 1,35,609 4,84,301 9,53,747 15,40,685 27,01,015 36,75,006
S&P BSE 500 TRI (%)# 28.79 20.21 18.79 17.09 15.19 13.86
Total Value of Nifty 50 TRI## 1,35,318 4,67,993 8,87,029 14,19,213 23,52,805 32,82,454
Nifty 50 TRI (%)## 28.28 17.75 15.83 14.80 13.49 12.71Past performance may or may not be sustained in future.Dividends are assumed to be reinvested and bonus is adjusted. Load is not taken into consideration. To illustrate the advantages of SIP investment, this is how your investment would have grown if you had invested say `10,000 systematically on the first business Day of every month over a period of time. Returns are calculated by using XIRR approach. XIRR helps in calculating return on investment given an initial and final value and a series of cash inflows and outflows with the correct allowance for the time impact of the transactions. Data as on 31st January 2018.
Riskometer
Investors understand that their principal will be at Moderately High risk
This product is suitable for investors who are seeking*:
Create wealth over a long period of time.•
Investment predominantly in equity and •equity related instruments across market capitalisation.
*Investors should consult their financial advisers if in doubt about whether the product is suitable for them.
Consumer Durables 3.27%Engineering Services 3.09%Cement 2.48%Industrial Capital Goods 2.42%Textile Products 2.19%Construction 2.17%Retailing 2.15%IT Consulting & Other Services 2.06%Textiles - Cotton 1.77%Media & Entertainment 1.12%Gas 1.01%Miscellaneous 0.03%
NAV (`)
Regular Plan Growth 96.2991Regular Plan Dividend 37.8595
PORTFOLIO
Name % of NAV
Equity and Equity related Instruments 98.84%Finance 12.57%JM Financial 3.41%ICICI Prudential Life Insurance Company 1.96%Bharat Financial Inclusion 1.21%Multi Commodity Exchange of India 1.18%TI Financial Holdings 1.16%HDFC Standard Life Insurance Company 1.14%Bajaj Finance 1.10%Max Financial Services 1.08%SBI Life Insurance Company 0.31%Consumer Non Durables 9.33%Asian Paints 2.81%Britannia Industries 1.69%Balrampur Chini Mills 1.50%Procter & Gamble Hygiene and Health Care 1.44%Colgate Palmolive (India) 0.84%S H Kelkar and Company 0.64%Mcleod Russel India 0.42%Banks 8.28%Kotak Mahindra Bank 3.29%HDFC Bank 2.85%RBL Bank 1.07%City Union Bank 1.07%Transportation 7.05%Container Corporation of India 3.90%Blue Dart Express 1.20%TCI Express 1.09%Transport Corporation of India 0.86%Industrial Products 6.69%Schaeffler India 3.03%Greaves Cotton 2.31%Ingersoll Rand (India) 0.69%Kirloskar Pneumatic Company 0.66%Pharmaceuticals 6.27%Sun Pharmaceutical Industries 1.81%Suven Life Sciences 1.36%Eris Lifesciences 1.12%Natco Pharma 1.12%Aurobindo Pharma 0.87%Auto 5.25%Maruti Suzuki India 3.13%Ashok Leyland 1.24%Hero MotoCorp 0.88%Auto Ancillaries 4.86%Minda Industries 1.47%MRF 1.21%
Name % of NAV
Apollo Tyres 1.13%Precision Camshafts 0.65%Tube Investments of India 0.41%Construction Project 4.17%Voltas 3.55%Power Mech Projects 0.62%Chemicals 3.94%Tata Chemicals 2.79%Pidilite Industries 1.15%Commercial Services 3.33%3M India 3.33%Ferrous Metals 3.32%APL Apollo Tubes 3.32%Consumer Durables 3.27%Bata India 1.86%Greenlam Industries 0.93%Khadim India 0.48%Engineering Services 3.09%VA Tech Wabag 3.09%Cement 2.48%Ambuja Cements 2.48%Industrial Capital Goods 2.42%Bharat Electronics 1.06%Disa India 0.82%Kennametal India 0.54%Textile Products 2.19%Page Industries 2.19%Construction 2.17%ITD Cementation India 1.31%Poddar Housing and Development 0.87%Retailing 2.15%Future Retail 1.46%Future Lifestyle Fashions 0.69%IT Consulting & Other Services 2.06%Cognizant Technology Solutions Corp - International Equities 2.06%
Textiles - Cotton 1.77%RSWM 0.94%Vardhman Textiles 0.83%Media & Entertainment 1.12%Entertainment Network (India) 1.12%Gas 1.01%Gujarat State Petronet 1.01%Miscellaneous 0.03%Praxis Home Retail 0.03%Net Cash and Cash Equivalent 1.16%Grand Total 100.00%

7
IDFC Focused Equity Fund (The Fund was earlier known as IDFC Imperial Equity Fund)$$ An open ended ‘focused’ equity fund 31st January 2018
FUND FEATURES
INDUSTRY ALLOCATION
Size
Large Cap
Mid Cap
Small Cap
Style Growth Blend Value
About the Fund: IDFC Focused Equity Fund is a concentrated portfolio of up to 30 stocks with the flexibility to invest across sectors and across market cap.
Nature: Equity
Monthly Avg AUM: ` 1,221.91 Crores
Month end AUM: ` 1264.19 Crores
Inception Date: 16 March 2006
Fund Manager: Mr. Sumit Agrawal (w.e.f. 20th October 2016)
Other Parameter:
Beta 0.90
R Square 0.78
Standard Deviation (Annualized) 13.47%
Sharpe* 0.48
Portfolio Turnover
Equity 0.69 Aggregate^ 1.82
Expense Ratio£
Regular 2.20%
Direct 0.22%
Benchmark: Nifty 50
SIP (Minimum Amount)$: ` 1,000/-
SIP Frequency: Monthly
SIP Dates (Monthly): Any day of the month, except 29th, 30th & 31st day of the monthInvestment Objective: Refer Pg No from 41 to 42
Minimum Investment Amount$: ` 5,000/- and any amount thereafter
Option Available: Growth, Dividend - (Payout, Reinvestment and Sweep (from Equity Schemes to Debt Schemes only))
Exit Load: 1.00% if redeemed before 365 days from the date of allotment. (w.e.f. 1st September 2009)$Subscription in IDFC Focused Equity Fund has been restricted to Rs. 2 lakhs per transaction with effect from 4th December 2017
Top 10 Equity Holdings
Banks 20.63%
Finance 11.17%
Petroleum Products 9.12%
Auto Ancillaries 6.14%
Industrial Capital Goods 5.30%
Pharmaceuticals 4.86%
Gas 4.41%
Consumer Non Durables 4.33%
Media & Entertainment 4.17%
Performance Table
Scheme Name CAGR Returns (%) Current Value of Investment of ` 10,000
1 Year 3 Years 5 YearsSince InceptionMar 16, 2006
1 Year 3 Years 5 YearsSince InceptionMar 16, 2006
IDFC Focused Equity Fund 48.23% 12.41% 15.39% 12.58% 14,823 14,213 20,463 40,894
Nifty 50 TRI# 30.48% 9.10% 14.18% 12.24% 13,048 12,991 19,418 39,453
TRI - Total Return IndexPerformance based on NAV as on 31/1/2018. Past performance may or may not be sustained in future.For other funds managed by the fund manager, please refer page no. 34 - 36 & the respective fund pages The performances given are of regular plan growth option.Regular and Direct Plans have different expense structure. Direct Plan shall have a lower expense ratio excluding distribution expenses, commission expenses etc.*Risk-free rate assumed to be 6.00% (FBIL OVERNIGHT MIBOR as on 31st January 2018). Ratios calculated on the basis of 3 years history of monthly data. ^Portfolio Turnover ratio is calculated as Lower of purchase or sale during the period / Average AUM for the last one year (includes Fixed Income securities and Equity derivatives). #Benchmark Returns. $$ The strategy of the Fund has been changed from large cap to focused fund£The above recurring expense ratio does not include Goods and Service Tax on Investment Management Fees, the proportionate charge in respect of sales beyond T-15 cities subject to maximum of 30 bps on daily net assets and borrowing costs, wherever applicable.$Subscription in IDFC Focused Equity Fund has been restricted to Rs. 2 lakhs per transaction with effect from 4th December 2017.With effect from 1st February 2018, we are comparing the performances of the funds with the total return variant of the benchmark instead of the price return variant.
SIP PERFORMANCE
Monthly SIP of ` 10,000 in IDFC Focused Equity Fund - Regular Plan - Growth
1 Year 3 Years 5 Years 7 Years 10 YearsSince
InceptionMar 16, 2006
Total Amount Invested (`) 1,20,000 3,60,000 6,00,000 8,40,000 12,00,000 14,30,000
Total Value as on January 31, 2018 (`) 1,42,985 5,13,245 9,74,213 15,07,601 24,89,421 32,71,501
Fund Returns (%) 37.19 24.41 19.45 16.40 13.97 13.11
Total Value of Nifty 50 TRI# 1,37,666 4,67,821 8,91,592 14,23,939 24,27,162 31,59,044
Nifty 50 TRI (%)# 28.28 17.75 15.83 14.80 13.49 12.57
Past performance may or may not be sustained in future.Dividends are assumed to be reinvested and bonus is adjusted. Load is not taken into consideration. To illustrate the advantages of SIP investment, this is how your investment would have grown if you had invested say `10,000 systematically on the first business Day of every month over a period of time. Returns are calculated by using XIRR approach. XIRR helps in calculating return on investment given an initial and final value and a series of cash inflows and outflows with the correct allowance for the time impact of the transactions. Data as on 31st January 2018.
Riskometer
Investors understand that their principal will be at Moderately High risk
This product is suitable for investors who are seeking*:
To create wealth over a long period of time.•
Investment in a concentrated portfolio of equity •and equity related instruments of up to 30 companies.
*Investors should consult their financial advisers if in doubt about whether the product is suitable for them.
Auto 4.06%
Industrial Products 3.44%
Commercial Services 3.27%
Consumer Durables 3.08%
Construction 2.44%
Cement 2.43%
Software 2.23%
Textile Products 1.92%
Power 1.92%
NAV (`)
Regular Plan Growth 40.8937Regular Plan Dividend 14.5079
PORTFOLIO
Name % of NAV
Equity and Equity related Instruments 94.94%
Banks 20.63%Kotak Mahindra Bank 4.81%IndusInd Bank 4.71%Axis Bank 4.13%
RBL Bank 3.90%
The South Indian Bank 3.07%
Finance 11.17%PNB Housing Finance 4.10%
Bajaj Finance 3.96%
Central Depository Services (India) 3.11%
Petroleum Products 9.12%Indian Oil Corporation 4.70%Bharat Petroleum Corporation 4.42%
Auto Ancillaries 6.14%MRF 4.31%
Minda Industries 1.83%
Industrial Capital Goods 5.30%
Bharat Electronics 3.22%
Skipper 2.09%
Pharmaceuticals 4.86%
Dishman Carbogen Amcis 3.04%
Eris Lifesciences 1.82%
Gas 4.41%Petronet LNG 4.41%
Name % of NAV
Consumer Non Durables 4.33%Jubilant Foodworks 4.33%
Media & Entertainment 4.17%Zee Entertainment Enterprises 4.17%
Auto 4.06%
Maruti Suzuki India 4.06%
Industrial Products 3.44%
Astral Poly Technik 3.44%
Commercial Services 3.27%
Security and Intelligence Services (India) 3.27%
Consumer Durables 3.08%
Titan Company 3.08%
Construction 2.44%
Kajaria Ceramics 2.44%
Cement 2.43%
Sagar Cements 2.43%
Software 2.23%
Majesco 2.23%
Textile Products 1.92%
Dollar Industries 1.92%
Power 1.92%
Nava Bharat Ventures 1.92%
Net Cash and Cash Equivalent 5.06%
Grand Total 100.00%

8
IDFC Equity Fund(The Fund has been repositioned with effect from April 18, 2017)$$ An open ended ‘large cap’ equity fund31st January 2018
FUND FEATURES
INDUSTRY ALLOCATION
Size
Large Cap
Mid Cap
Small Cap
Style Growth Blend Value
About the Fund: IDFC Equity Fund focuses on investing predominantly in Large Cap stocks.
Nature: Equity
Monthly Avg AUM: ` 309.51 Crores
Month end AUM: ` 312.37 Crores
Inception Date: 9 June 2006
Fund Manager: Mr. Sumit Agrawal & Mr. Arpit Kapoor (w.e.f. 1st March 2017)
Other Parameter:
Beta 0.91
R Square 0.96
Standard Deviation (Annualized) 12.35%
Sharpe* 0.19
Portfolio Turnover
Equity 1.54
Aggregate^ 1.86
Expense Ratio£
Regular 2.53%
Direct 1.74%
Benchmark: S&P BSE 100 (w.e.f. April 18, 2017)
SIP (Minimum Amount): ` 1,000/-
SIP Frequency: Monthly
SIP Dates (Monthly): Any day of the month, except 29th, 30th & 31st day of the monthInvestment Objective: Refer Pg No from 41 to 42 Minimum Investment Amount : ` 5,000/- and any amount thereafter
Option Available: Growth, Dividend (Payout, Reinvestment and Sweep (from Equity Schemes to Debt Schemes only))
Exit Load: 1.00% if redeemed before 365 days from the date of allotment. (w.e.f. 1st September 2009)
Top 10 Equity Holdings
Banks 26.84%Consumer Non Durables 8.49%Finance 7.74%Petroleum Products 6.77%Pharmaceuticals 5.22%Software 4.99%Auto 4.55%Non - Ferrous Metals 4.22%Gas 4.08%Power 3.19%Cement 2.75%Industrial Capital Goods 2.59%
Performance Table
Scheme Name CAGR Returns (%) Current Value of Investment of ` 10,000
1 Year 3 Years 5 YearsSince InceptionJun 09, 2006
1 Year 3 Years 5 YearsSince InceptionJun 09, 2006
IDFC Equity Fund 30.85% 8.35% 13.35% 10.69% 13,085 12,727 18,717 32,672
S&P BSE 100 TRI# 30.26% 9.04% 14.15% 13.60% 13,026 12,969 19,385 44,211
Nifty 50 TRI## 30.48% 9.10% 14.18% 13.62% 13,048 12,991 19,418 44,286
TRI - Total Return IndexPerformance based on NAV as on 31/1/2018. Past performance may or may not be sustained in future. For other funds managed by the fund manager, please refer page no. 34 - 36 & the respective fund pages The performances given are of regular plan growth option.Regular and Direct Plans have different expense structure. Direct Plan shall have a lower expense ratio excluding distribution expenses, commission expenses etc.*Risk-free rate assumed to be 6.00% (FBIL OVERNIGHT MIBOR as on 31st January 2018). Ratios calculated on the basis of 3 years history of monthly data. ^Portfolio Turnover ratio is calculated as Lower of purchase or sale during the period / Average AUM for the last one year (includes Fixed Income securities and Equity derivatives). #Benchmark Returns. ##Alternate Benchmark Returns. Current Index performance adjusted for the period from since inception to April 18, 2017 with the performance of Nifty 50 TRI (Benchmark)$$For details please refer Notice (https://www.idfcmf.com/uploads/140320171238No-14-Change-in-Investmenty-Strategy-of-IDFC-Equity-Fund.pdf)£The above recurring expense ratio does not include Goods and Service Tax on Investment Management Fees, the proportionate charge in respect of sales beyond T-15 cities subject to maximum of 30 bps on daily net assets and borrowing costs, wherever applicable.Current Index performance adjusted for the period from since inception to June 28, 2007 with the performance of S&P BSE 100 price return index (Benchmark)With effect from 1st February 2018, we are comparing the performances of the funds with the total return variant of the benchmark instead of the price return variant.
SIP PERFORMANCE
Monthly SIP of ` 10,000 in IDFC Equity Fund - Regular Plan - Growth
1 Year 3 Years 5 Years 7 Years 10 YearsSince
InceptionJun 09, 2006
Total Amount Invested (`) 1,20,000 3,60,000 6,00,000 8,40,000 12,00,000 14,00,000
Total Value as on January 31, 2018 (`) 1,29,476 4,51,199 8,40,688 13,31,408 22,42,383 27,61,030
Fund Returns (%) 25.87 17.50 15.06 14.00 12.65 11.63
Total Value of S&P BSE 100 TRI Index# 1,36,354 4,72,529 8,57,947 14,31,717 24,50,426 29,80,087
S&P BSE 100 Index TRI (%)# 27.42 17.57 15.74 14.74 13.46 12.61
Total Value of Nifty 50 TRI## 1,30,882 4,53,110 8,94,781 13,72,683 23,49,265 29,51,350
Nifty 50 TRI (%)## 28.28 17.75 15.83 14.80 13.49 12.63
Past performance may or may not be sustained in future.Dividends are assumed to be reinvested and bonus is adjusted. Load is not taken into consideration. To illustrate the advantages of SIP investment, this is how your investment would have grown if you had invested say `10,000 systematically on the first business Day of every month over a period of time. Returns are calculated by using XIRR approach. XIRR helps in calculating return on investment given an initial and final value and a series of cash inflows and outflows with the correct allowance for the time impact of the transactions. Data as on 31st January 2018.
Riskometer
Investors understand that their principal will be at Moderately High risk
This product is suitable for investors who are seeking*:
To create wealth over a long period of time.•
Investment predominantly in equity and equity •related instruments in the large cap segment.
*Investors should consult their financial advisers if in doubt about whether the product is suitable for them.
Ferrous Metals 2.09%Consumer Durables 2.03%Construction Project 2.00%Media & Entertainment 1.98%Oil 1.07%Industrial Products 1.07%Textiles - Cotton 1.00%Textile Products 0.97%Construction 0.97%Miscellaneous 0.82%Retailing 0.02%
NAV (`)Regular Plan Growth 32.6722Regular Plan Dividend 16.2925
PORTFOLIO
Name % of NAV
Equity and Equity related Instruments 95.43%Banks 26.84%HDFC Bank 5.45%Axis Bank 5.03%ICICI Bank 4.52%State Bank of India 4.01%
Punjab National Bank 2.19%
Kotak Mahindra Bank 2.06%
Bank of Baroda 2.01%
IndusInd Bank 1.57%
Consumer Non Durables 8.49%Hindustan Unilever 3.26%
Godrej Consumer Products 2.16%
Britannia Industries 2.10%
Prataap Snacks 0.97%
Finance 7.74%
HDFC 2.13%
ICICI Lombard General Insurance Company 1.86%
SBI Life Insurance Company 1.86%
Bajaj Finance 0.97%
Magma Fincorp 0.91%
Petroleum Products 6.77%Reliance Industries 2.74%
Bharat Petroleum Corporation 2.11%
Indian Oil Corporation 1.93%
Pharmaceuticals 5.22%
Aurobindo Pharma 2.18%
Cadila Healthcare 1.91%
Dishman Carbogen Amcis 1.13%
Software 4.99%Infosys 3.98%
Majesco 1.01%
Auto 4.55%Maruti Suzuki India 2.70%
Tata Motors 1.85%
Non - Ferrous Metals 4.22%
Vedanta 2.22%
Name % of NAV
Hindalco Industries 2.00%
Gas 4.08%GAIL (India) 2.42%
Petronet LNG 1.66%
Power 3.19%
NTPC 2.18%
Nava Bharat Ventures 1.01%
Cement 2.75%Grasim Industries 2.75%
Industrial Capital Goods 2.59%
Bharat Electronics 1.84%
Texmaco Rail & Engineering 0.75%
Ferrous Metals 2.09%
Tata Steel 2.09%
Consumer Durables 2.03%
Titan Company 1.06%
Khadim India 0.98%
Construction Project 2.00%
Larsen & Toubro 2.00%
Media & Entertainment 1.98%
Zee Entertainment Enterprises 1.98%
Oil 1.07%
Oil & Natural Gas Corporation 1.07%
Industrial Products 1.07%
INEOS Styrolution India 1.07%
Textiles - Cotton 1.00%
Nitin Spinners 1.00%
Textile Products 0.97%
Dollar Industries 0.97%
Construction 0.97%
PSP Projects 0.97%
Miscellaneous 0.82%
Amulya Leasing And Finance 0.82%
Retailing 0.02%
Avenue Supermarts 0.02%
Net Cash and Cash Equivalent 4.57%
Grand Total 100.00%
Size
Large Cap
Mid Cap
Small Cap
Style Growth Blend Value

9
IDFC Nifty FundAn Open Ended Index Linked Equity Scheme
31st January 2018
FUND FEATURES
INDUSTRY ALLOCATION
About the Fund: IDFC Nifty Fund is an index fund which is managed passively by investing in proportion to the Nifty 50.Nature: EquityMonthly Avg AUM: ` 101.27 Crores Month end AUM: ` 105.57 Crores Inception Date: 30 April 2010Fund Manager: Mr. Arpit Kapoor & Mr. Sumit Agrawal (w.e.f. 1st March 2017) Other Parameter:Beta 1.00R Square 1.00Standard Deviation (Annualized) 13.18%Sharpe* 0.19Portfolio TurnoverEquity 0.22Aggregate^ 0.36Tracking Error (Annualized) 0.38%
Expense Ratio£ Regular 0.25%Direct 0.15%
Benchmark: Nifty 50 SIP (Minimum Amount): ` 100/- SIP Frequency: Monthly SIP Dates (Monthly): Any day of the month, except 29th, 30th & 31st day of the monthInvestment Objective: Refer Pg No from 41 to 42 Minimum Investment Amount: ` 100/- and any amount thereafterOption Available: Growth, Dividend - (Payout, Reinvestment and Sweep (from Equity Schemes to Debt Schemes only))Exit Load: 1% if redeemed/switched out (to any non-equity scheme of IDFC Mutual Fund) within 7 days.
Top 10 Equity Holdings
Banks 25.48%
Software 11.36%
Petroleum Products 9.80%
Auto 8.88%
Finance 8.80%
Consumer Non Durables 8.43%
Construction Project 3.87%
Pharmaceuticals 3.54%
Non - Ferrous Metals 2.23%
Power 2.10%
Cement 1.44%
Performance Table
Scheme Name CAGR Returns (%) Current Value of Investment of ` 10,000
1 Year 3 Years 5 YearsSince InceptionApr 30, 2010
1 Year 3 Years 5 YearsSince InceptionApr 30, 2010
IDFC Nifty Fund 29.68% 8.53% 13.65% 10.96% 12,968 12,789 18,965 22,418
Nifty 50 TRI# 30.48% 9.10% 14.18% 11.31% 13,048 12,991 19,418 22,970
TRI - Total Return IndexPerformance based on NAV as on 31/1/2018. Past performance may or may not be sustained in future.For other funds managed by the fund manager, please refer page no. 34 - 36 & the respective fund pages The performances given are of regular plan growth option.Regular and Direct Plans have different expense structure. Direct Plan shall have a lower expense ratio excluding distribution expenses, commission expenses etc.*Risk-free rate assumed to be 6.00% (FBIL OVERNIGHT MIBOR as on 31st January 2018). Ratios calculated on the basis of 3 years history of monthly data. ^Portfolio Turnover ratio is calculated as Lower of purchase or sale during the period / Average AUM for the last one year (includes Fixed Income securities and Equity derivatives). #Benchmark Returns.£The above recurring expense ratio does not include Goods and Service Tax on Investment Management Fees, the proportionate charge in respect of sales beyond T-15 cities subject to maximum of 30 bps on daily net assets and borrowing costs, wherever applicable.With effect from 1st February 2018, we are comparing the performances of the funds with the total return variant of the benchmark instead of the price return variant.
SIP PERFORMANCE
Monthly SIP of ` 10,000 in IDFC Nifty - Regular Plan - Growth
1 Year 3 Years 5 Years 7 YearsSince
InceptionApr 30, 2010
Total Amount Invested (`) 1,20,000 3,60,000 6,00,000 8,40,000 9,40,000
Total Value as on January 31, 2018 (`) 1,37,217 4,63,692 8,79,087 14,01,268 16,13,258
Fund Returns (%) 27.54 17.12 15.25 14.35 13.45
Total Value of Nifty 50 TRI# 1,37,666 4,67,821 8,91,592 14,23,939 16,40,461
Nifty 50 TRI (%)# 28.28 17.75 15.83 14.80 13.86
Past performance may or may not be sustained in future.Dividends are assumed to be reinvested and bonus is adjusted. Load is not taken into consideration. To illustrate the advantages of SIP investment, this is how your investment would have grown if you had invested say `10,000 systematically on the first business Day of every month over a period of time. Returns are calculated by using XIRR approach. XIRR helps in calculating return on investment given an initial and final value and a series of cash inflows and outflows with the correct allowance for the time impact of the transactions. Data as on 31st January 2018.
Riskometer
Investors understand that their principal will be at Moderately High risk
This product is suitable for investors who are seeking*:
Create wealth over a long period of time.•Replicate the Nifty 50 by investing in securities of •the Nifty 50 in the same proportion/weightage.
*Investors should consult their financial advisers if in doubt about whether the product is suitable for them.
Telecom - Services 1.29%
Oil 1.27%
Ferrous Metals 1.10%
Index 1.02%
Minerals/Mining 0.87%
Transportation 0.73%
Media & Entertainment 0.72%
Gas 0.68%
Pesticides 0.61%
Telecom - Equipment & Accessories 0.61%
Auto Ancillaries 0.39%
NAV (`)
Regular Plan Growth 22.4176Regular Plan Dividend 22.5938
PORTFOLIO
Name Rating % of NAV
Equity and Equity related Instruments 95.21%
Banks 25.48%HDFC Bank 9.09%ICICI Bank 5.02%Kotak Mahindra Bank 3.28%
State Bank of India 2.58%
Axis Bank 2.09%
IndusInd Bank 1.98%
Yes Bank 1.44%
Software 11.36%Infosys 5.10%Tata Consultancy Services 3.43%
HCL Technologies 1.22%
Tech Mahindra 0.85%
Wipro 0.76%
Petroleum Products 9.80%Reliance Industries 7.35%
Indian Oil Corporation 0.95%
Bharat Petroleum Corporation 0.85%
Hindustan Petroleum Corporation 0.66%
Auto 8.88%Maruti Suzuki India 2.80%
Tata Motors 1.64%
Mahindra & Mahindra 1.58%
Hero MotoCorp 1.06%
Bajaj Auto 1.01%
Eicher Motors 0.80%
Finance 8.80%HDFC 6.92%
Indiabulls Housing Finance 1.00%
Bajaj Finance 0.88%
Consumer Non Durables 8.43%ITC 5.13%
Hindustan Unilever 2.17%
Asian Paints 1.13%
Construction Project 3.87%Larsen & Toubro 3.87%
Pharmaceuticals 3.54%
Sun Pharmaceutical Industries 1.42%
Name Rating % of NAV
Cipla 0.67%
Dr. Reddy's Laboratories 0.60%
Lupin 0.47%
Aurobindo Pharma 0.39%
Non - Ferrous Metals 2.23%
Vedanta 1.40%
Hindalco Industries 0.83%
Power 2.10%
NTPC 1.15%
Power Grid Corporation of India 0.94%
Cement 1.44%
UltraTech Cement 1.01%
Ambuja Cements 0.43%
Telecom - Services 1.29%
Bharti Airtel 1.29%
Oil 1.27%
Oil & Natural Gas Corporation 1.27%
Ferrous Metals 1.10%
Tata Steel 1.10%
Index 1.02%
Nifty Index - Equity Futures 1.02%
Minerals/Mining 0.87%
Coal India 0.87%
Transportation 0.73%Adani Ports and Special Economic Zone
0.73%
Media & Entertainment 0.72%
Zee Entertainment Enterprises 0.72%
Gas 0.68%
GAIL (India) 0.68%
Pesticides 0.61%
UPL 0.61%
Telecom - Equipment & Accessories 0.61%
Bharti Infratel 0.61%
Auto Ancillaries 0.39%
Bosch 0.39%
Corporate Bond 0.02%
NTPC AAA 0.02%
Net Cash and Cash Equivalent 4.77%
Grand Total 100.00%
Size
Large Cap
Mid Cap
Small Cap
Style Growth Blend Value

10
IDFC Infrastructure FundAn Open Ended Equity Scheme Fund
31st January 2018
FUND FEATURES
INDUSTRY ALLOCATION
About the Fund: A dedicated Infrastructure fund, that invests across the infrastructure value chain with exclusions like Banking, Autos, IT, Pharma and FMCG. It is a diversified portfolio of companies that are participating in and benefitting from the Indian Infrastructure and Infrastructure related activities.
Nature: Equity
Monthly Avg AUM: ` 1,075.37 Crores
Month end AUM: ` 1102.07 Crores
Inception Date: 8 March 2011
Fund Manager: Mr. Rajendra Kumar Mishra (w.e.f. 27th June 2013)
Other Parameter:
Beta 0.89
R Square 0.78
Standard Deviation (Annualized) 17.58%
Sharpe* 0.67
Portfolio Turnover
Equity 0.18 Aggregate^ 0.18
Expense Ratio£
Regular 2.23%
Direct 0.39%
Benchmark: Nifty Infrastructure
SIP (Minimum Amount): ` 1,000/-
SIP Frequency: Monthly
SIP Dates (Monthly): Any day of the month, except 29th, 30th & 31st day of the monthInvestment Objective: Refer Pg No from 41 to 42 Minimum Investment Amount: ` 5,000/- and any amount thereafter
Option Available: Growth, Dividend - (Payout, Reinvestment and Sweep (from Equity Schemes to Debt Schemes only))
Exit Load: 1.00% if redeemed before 365 days from the date of allotment.
Top 10 Equity Holdings
Construction Project 14.95%Construction 11.54%Power 10.07%Transportation 8.70%Industrial Capital Goods 7.95%Telecom - Services 7.41%Cement 5.13%Non - Ferrous Metals 4.52%Oil 3.05%Telecom - Equipment & Accessories 2.49%
Performance Table Regular Plan - GrowthScheme Name CAGR Returns (%) Current Value of Investment of ` 10,000
1 Year 3 Years 5 YearsSince Inception
Mar 08, 20111 Year 3 Years 5 Years
Since InceptionMar 08, 2011
IDFC Infrastructure Fund 42.29% 17.79% 17.41% 9.89% 14,229 16,357 22,316 19,187
Nifty Infrastructure TRI# 24.88% 4.61% 8.61% 4.59% 12,488 11,450 15,116 13,632
Nifty 50 TRI## 30.48% 9.10% 14.18% 11.90% 13,048 12,991 19,418 21,738
TRI - Total Return IndexPerformance based on NAV as on 31/1/2018. Past performance may or may not be sustained in future.For other funds managed by the fund manager, please refer page no. 34 - 36 & the respective fund pages The performances given are of regular plan growth option.Regular and Direct Plans have different expense structure. Direct Plan shall have a lower expense ratio excluding distribution expenses, commission expenses etc.*Risk-free rate assumed to be 6.00% (FBIL OVERNIGHT MIBOR as on 31st January 2018). Ratios calculated on the basis of 3 years history of monthly data. ^Portfolio Turnover ratio is calculated as Lower of purchase or sale during the period / Average AUM for the last one year (includes Fixed Income securities and Equity derivatives). #Benchmark Returns. ##Alternate Benchmark Returns.£The above recurring expense ratio does not include Goods and Service Tax on Investment Management Fees, the proportionate charge in respect of sales beyond T-15 cities subject to maximum of 30 bps on daily net assets and borrowing costs, wherever applicable.With effect from 1st February 2018, we are comparing the performances of the funds with the total return variant of the benchmark instead of the price return variant.
SIP PERFORMANCE
Monthly SIP of ` 10,000 in IDFC Infrastructure Fund - Regular Plan - Growth
1 Year 3 Years 5 YearsSince
InceptionMar 08, 2011
Total Amount Invested (`) 1,20,000 3,60,000 6,00,000 8,30,000
Total Value as on January 31, 2018 (`) 1,40,702 5,41,175 10,86,851 15,73,508
Fund Returns (%) 33.35 28.31 23.97 18.17
Total Values of Nifty Infrastructure TRI# 1,33,361 4,43,160 8,00,691 11,47,867
Nifty Infrastructure TRI (%)# 21.20 13.95 11.48 9.22
Total Value of Nifty 50 TRI## 1,37,666 4,67,821 8,91,592 14,01,787
Nifty 50 TRI (%)## 28.28 17.75 15.83 14.89
Past performance may or may not be sustained in future.Dividends are assumed to be reinvested and bonus is adjusted. Load is not taken into consideration. To illustrate the advantages of SIP investment, this is how your investment would have grown if you had invested say `10,000 systematically on the first business Day of every month over a period of time. Returns are calculated by using XIRR approach. XIRR helps in calculating return on investment given an initial and final value and a series of cash inflows and outflows with the correct allowance for the time impact of the transactions. Data as on 31st January 2018.
Riskometer
Investors understand that their principal will be at High risk
This product is suitable for investors who are seeking*:
Create wealth over a long period of time.•Investment predominantly in equity and equity •related instruments of companies that are participating in and benefiting from growth in Indian infrastructure and infrastructural related activities.
*Investors should consult their financial advisers if in doubt about whether the product is suitable for them.
Gas 2.43%
Minerals/Mining 2.38%
Ferrous Metals 2.36%
Consumer Durables 1.81%
Engineering Services 1.33%
Finance 1.22%
Industrial Products 1.13%Hotels, Resorts And Other Recreational Activities
0.94%
NAV (`)
Regular Plan Growth 19.1866Regular Plan Dividend 19.1947
Size
Large Cap
Mid Cap
Small Cap
Style Growth Blend Value
PORTFOLIO
Name % of NAV
Equity and Equity related Instruments 89.40%
Construction Project 14.95%Larsen & Toubro 5.66%NCC 3.78%Engineers India 3.03%
Sadbhav Engineering 2.48%
Construction 11.54%PNC Infratech 3.20%
Dilip Buildcon 2.04%
Ahluwalia Contracts (India) 1.46%
PSP Projects 1.10%
NBCC (India) 1.03%
GPT Infraprojects 0.94%
J.Kumar Infraprojects 0.93%
ITD Cementation India 0.86%
Power 10.07%NTPC 4.84%
PTC India 2.38%
Power Grid Corporation of India 2.00%
CESC 0.86%
Transportation 8.70%
Navkar Corporation 2.17%
Gateway Distriparks 2.10%
InterGlobe Aviation 1.97%
Adani Ports and Special Economic Zone 1.39%
Future Supply Chain Solutions 1.06%
Industrial Capital Goods 7.95%Cochin Shipyard 2.76%
Bharat Heavy Electricals 2.19%
ISGEC Heavy Engineering 1.32%
Praj Industries 0.89%
Bharat Electronics 0.79%
Telecom - Services 7.41%Bharti Airtel 5.39%
Idea Cellular 2.02%
Name % of NAV
Cement 5.13%JK Cement 2.93%
UltraTech Cement 2.21%
Non - Ferrous Metals 4.52%Vedanta 2.92%
National Aluminium Company 1.61%
Oil 3.05%Oil & Natural Gas Corporation 3.05%
Telecom - Equipment & Accessories 2.49%
Tejas Networks 2.49%
Gas 2.43%
Gujarat Gas 0.90%
Gujarat State Petronet 0.83%
Indraprastha Gas 0.69%
Minerals/Mining 2.38%
Coal India 2.38%
Ferrous Metals 2.36%
Jindal Saw 1.08%
Maharashtra Seamless 0.96%
Ratnamani Metals & Tubes 0.32%
Consumer Durables 1.81%
Blue Star 1.81%
Engineering Services 1.33%
VA Tech Wabag 1.33%
Finance 1.22%
Indian Energy Exchange 0.96%
PTC India Financial Services 0.25%
Industrial Products 1.13%
Kirloskar Brothers 1.13%Hotels, Resorts And Other Recreational Activities 0.94%
Taj GVK Hotels & Resorts 0.94%
Net Cash and Cash Equivalent 10.60%
Grand Total 100.00%

11
IDFC Tax Advantage (ELSS) FundAn Open Ended Equity Linked Saving Scheme with Lock in Period of 3 Years
31st January 2018
FUND FEATURES
INDUSTRY ALLOCATION
About the Fund: The Fund is an Equity Linked Savings Scheme (ELSS) that aims to generate long term capital growth from a diversified equity portfolio and enables investors to avail of a deduction from total income, as permitted under the Income Tax Act, 1961.
Nature: Equity
Monthly Avg AUM: ` 979.53 Crores
Month end AUM: ` 1012.20 Crores
Inception Date: 26 December 2008
Fund Manager: Mr. Daylynn Pinto (w.e.f. 20th October 2016)
Other Parameter:
Beta 1.00 R Square 0.83 Standard Deviation (Annualized) 14.46% Sharpe* 0.67
Portfolio Turnover
Equity 0.53 Aggregate^ 0.53
Expense Ratio£
Regular 2.26%
Direct 1.29%
Benchmark: S&P BSE 200
SIP (Minimum Amount): ` 500/-
SIP Frequency : Monthly
SIP Dates (Monthly): Any day of the month, except 29th, 30th & 31st day of the monthInvestment Objective: Refer Pg No from 41 to 42
Minimum Investment Amount: ` 500/- and in multiples of ` 500/- thereafter.
Option Available: Growth, Dividend (Payout, Reinvestment and Sweep (from Equity Schemes to Debt Schemes only))
Exit Load: Nil
Top 10 Equity Holdings
Banks 15.83%Finance 6.63%Auto Ancillaries 6.40%Software 6.03%Construction Project 5.76%Retailing 5.56%Auto 4.60%Pharmaceuticals 4.44%Cement 3.88%Consumer Non Durables 3.80%Consumer Durables 3.76%Power 3.22%
Performance Table
Scheme Name CAGR Returns (%) Current Value of Investment of ` 10,000
1 Year 3 Years 5 YearsSince InceptionDec 26, 2008
1 Year 3 Years 5 YearsSince InceptionDec 26, 2008
IDFC Tax Advantage (ELSS) Fund
44.96% 15.71% 21.67% 21.82% 14,496 15,504 26,683 60,329
S&P BSE 200 TRI# 31.70% 11.17% 15.95% 19.05% 13,170 13,746 20,966 48,923
Nifty 50 TRI## 30.48% 9.10% 14.18% 17.35% 13,048 12,991 19,418 42,921
TRI - Total Return IndexPerformance based on NAV as on 31/1/2018, Past performance may or may not be sustained in future. The performances given are of regular plan growth option. Regular and Direct Plans have different expense structure. Direct Plan shall have a lower expense ratio excluding distribution expenses, commission expenses etc. For other funds managed by the fund manager, please refer page no. 34 - 36 & the respective fund pages *Risk-free rate assumed to be 6.00% (FBIL OVERNIGHT MIBOR as on 31st January 2018). Ratios calculated on the basis of 3 years history of monthly data. ^Portfolio Turnover ratio is calculated as Lower of purchase or sale during the period / Average AUM for the last one year (includes Fixed Income securities and Equity derivatives). #Benchmark Returns. ##Alternate Benchmark Returns. £The above recurring expense ratio does not include Goods and Service Tax on Investment Management Fees, the proportionate charge in respect of sales beyond T-15 cities subject to maximum of 30 bps on daily net assets and borrowing costs, wherever applicable.With effect from 1st February 2018, we are comparing the performances of the funds with the total return variant of the benchmark instead of the price return variant.
SIP PERFORMANCE
Monthly SIP of ` 10,000 in IDFC Tax Advantage (ELSS) Fund - Regular Plan - Growth
1 Year 3 Years 5 Years 7 YearsSince
InceptionDec 26, 2008
Total Amount Invested (`) 1,20,000 3,60,000 6,00,000 8,40,000 11,00,000
Total Value as on January 31, 2018 (`) 1,43,267 5,13,475 10,82,852 18,41,895 28,90,392
Fund Returns (%) 37.67 24.44 23.82 22.03 20.18
Total Value of S&P BSE 200 TRI# 1,37,421 4,78,065 9,39,854 15,16,915 23,01,523
S&P BSE 200 TRI (%)# 27.88 19.29 17.98 16.57 15.50
Total Value of NIFTY 50 TRI## 1,37,666 4,67,821 8,91,592 14,23,939 21,40,786
NIFTY 50 TRI (%)## 28.28 17.75 15.83 14.80 14.00
Past performance may or may not be sustained in future.Dividends are assumed to be reinvested and bonus is adjusted. Load is not taken into consideration. To illustrate the advantages of SIP investment, this is how your investment would have grown if you had invested say `10,000 systematically on the first business Day of every month over a period of time. Returns are calculated by using XIRR approach. XIRR helps in calculating return on investment given an initial and final value and a series of cash inflows and outflows with the correct allowance for the time impact of the transactions. Data as on 31st January 2018.
Gas 3.21%Construction 2.87%Industrial Products 2.85%Industrial Capital Goods 2.57%Chemicals 2.31%Petroleum Products 2.22%Ferrous Metals 1.95%Media & Entertainment 1.89%Transportation 1.86%Miscellaneous 1.72%Non - Ferrous Metals 1.11%Oil 1.11%Hotels, Resorts And Other Recreational Activities 1.04%
NAV (`)
Regular Plan Growth 60.3290Regular Plan Dividend 19.3548
Size
Large Cap
Mid Cap
Small Cap
Style Growth Blend Value
Riskometer
Investors understand that their principal will be at Moderately High risk
This product is suitable for investors who are seeking*:
Create wealth over a long period of time.•
Investment predominantly in Equity and Equity •related securities.
*Investors should consult their financial advisers if in doubt about whether the product is suitable for them.
PORTFOLIO
Name % of NAV
Equity and Equity related Instruments 96.64%Banks 15.83%HDFC Bank 4.36%ICICI Bank 3.31%RBL Bank 1.84%IndusInd Bank 1.56%Kotak Mahindra Bank 1.15%Union Bank of India 1.04%State Bank of India 0.93%Punjab National Bank 0.85%The Federal Bank 0.79%Finance 6.63%HDFC 1.55%Bajaj Finance 1.16%Max Financial Services 0.84%Mas Financial Services 0.81%Magma Fincorp 0.78%TI Financial Holdings 0.75%Sundaram Finance 0.74%Auto Ancillaries 6.40%Minda Industries 2.13%MRF 1.75%Apollo Tyres 1.07%Bosch 0.96%Igarashi Motors India 0.49%Software 6.03%Infosys 1.93%Mastek 1.42%Cyient 0.95%KPIT Technologies 0.94%HCL Technologies 0.78%Construction Project 5.76%KEC International 2.17%NCC 1.57%Voltas 1.49%Engineers India 0.53%Retailing 5.56%Future Retail 3.39%Future Lifestyle Fashions 1.30%Avenue Supermarts 0.87%Auto 4.60%Maruti Suzuki India 1.88%Hero MotoCorp 1.46%Tata Motors 1.26%Pharmaceuticals 4.44%Dishman Carbogen Amcis 1.58%Aurobindo Pharma 1.12%Cadila Healthcare 0.97%Eris Lifesciences 0.77%Cement 3.88%The Ramco Cements 1.80%Ambuja Cements 1.10%Sagar Cements 0.98%Consumer Non Durables 3.80%Hindustan Unilever 1.62%Procter & Gamble Hygiene and Health Care 1.19%
Name % of NAV
HBL Power Systems 0.85%Mcleod Russel India 0.14%Consumer Durables 3.76%Greenlam Industries 0.99%Crompton Greaves Consumer Electricals 0.96%Khadim India 0.96%Greenply Industries 0.85%Power 3.22%Nava Bharat Ventures 1.24%Kalpataru Power Transmission 1.01%Tata Power Company 0.97%Gas 3.21%GAIL (India) 2.08%Petronet LNG 1.13%Construction 2.87%PSP Projects 1.65%Asian Granito India 0.87%Capacit'e Infraprojects 0.35%Industrial Products 2.85%HEG 1.21%KEI Industries 0.94%Bharat Forge 0.71%Industrial Capital Goods 2.57%Bharat Heavy Electricals 0.99%Texmaco Rail & Engineering 0.82%CG Power and Industrial Solutions 0.76%Chemicals 2.31%Deepak Nitrite 1.65%Atul 0.67%Petroleum Products 2.22%Indian Oil Corporation 1.36%Chennai Petroleum Corporation 0.86%Ferrous Metals 1.95%Tata Steel 1.03%JSW Steel 0.92%Media & Entertainment 1.89%Zee Entertainment Enterprises 1.17%PVR 0.72%Transportation 1.86%VRL Logistics 1.86%Miscellaneous 1.72%Amulya Leasing And Finance 1.00%Kirloskar Ferrous Industries 0.64%Praxis Home Retail 0.08%Non - Ferrous Metals 1.11%Hindalco Industries 1.11%Oil 1.11%Oil & Natural Gas Corporation 1.11%Hotels, Resorts And Other Recreational Activities 1.04%EIH 1.04%Preference Shares 0.02%Media & Entertainment 0.02%Zee Entertainment Enterprises 0.02%Net Cash and Cash Equivalent 3.33%Grand Total 100.00%

12
IDFC Arbitrage FundAn Open Ended Equity Fund
31st January 2018
FUND FEATURES
About the Fund: The fund invests in arbitrage opportunities in the cash and the derivative segments of the equity markets. It aims to capture the spread (Cost of Carry) between the cash and futures market by simultaneously executing buy (in the cash market) and sell (in the futures market) trades. The balance is invested in debt and money market instruments. The fund typically follows a strategy of taking market neutral (equally offsetting) positions in the equity market making it a low risk product irrespective of the movements in equity market.
Nature: Equity & Equity Derivatives
Monthly Avg AUM: ` 3,057.91 Crores
Month end AUM: ` 3010.96 Crores
Inception Date: 21 December 2006
Fund Manager: Equity Portion: Mr. Yogik Pitti (w.e.f. 27th June 2013), Mr. Arpit Kapoor (w.e.f. 1st March 2017) & Debt Portion: Mr. Harshal Joshi (w.e.f. 20th October 2016)
Other Parameter:
Beta 0.89 R Square 0.34 Standard Deviation (Annualized) 0.45% Sharpe* 0.83
Portfolio Turnover
Equity 3.92
Aggregate^ 16.80
Expense Ratio£
Regular 0.97%
Direct 0.27%
Benchmark: Crisil Liquid Fund Index
SIP (Minimum Amount): ` 100/-
SIP Frequency: Monthly
SIP Dates (Monthly): Any day of the month, except 29th, 30th & 31st day of the month Investment Objective: Refer Pg No from 41 to 42 Minimum Investment Amount: ` 100/- and any amount thereafter
Option Available: Growth, Dividend - (Payout,Reinvestment and Sweep (from Equity Schemes to Debt Schemes only)) - Monthly & Annual
Exit Load: 0.25% if redeemed / switched-out within 1 month from the date of allotment (w.e.f 01st July 2016)
Performance Table
Scheme Name CAGR Returns (%) Current Value of Investment of ` 10,000
1 Year 3 Years 5 YearsSince InceptionDec 21, 2006
1 Year 3 Years 5 YearsSince InceptionDec 21, 2006
IDFC Arbitrage Fund 5.88% 6.38% 7.35% 7.23% 10,588 12,041 14,262 21,725
CRISIL Liquid Fund Index# 6.68% 7.39% 8.10% 7.55% 10,668 12,391 14,761 22,461
Nifty 50 TRI## 30.48% 9.10% 14.18% 11.28% 13,048 12,991 19,418 32,827
Performance based on NAV as on 31/1/2018. Past performance may or may not be sustained in future.For other funds managed by the fund manager, please refer page no. 34 - 36 & the respective fund pages The performances given are of regular plan growth option.Regular and Direct Plans have different expense structure. Direct Plan shall have a lower expense ratio excluding distribution expenses, commission expenses etc.*Risk-free rate assumed to be 6.00% (FBIL OVERNIGHT MIBOR as on 31st January 2018). Ratios calculated on the basis of 3 years history of monthly data. ^Portfolio Turnover ratio is calculated as Lower of purchase or sale during the period / Average AUM for the last one year (includes Fixed Income securities and Equity derivatives). #Benchmark Returns. ##Alternate Benchmark Returns. £The above recurring expense ratio does not include Goods and Service Tax on Investment Management Fees, the proportionate charge in respect of sales beyond T-15 cities subject to maximum of 30 bps on daily net assets and borrowing costs, wherever applicable.With effect from 1st February 2018, we are comparing the performances of the funds with the total return variant of the benchmark instead of the price return variant.
SIP PERFORMANCE
Monthly SIP of ` 10,000 in IDFC Arbitrage Fund - Regular Plan - Growth
1 Year 3 Years 5 Years 7 Years 10 YearsSince
InceptionDec 21, 2006
Total Amount Invested (`) 1,20,000 3,60,000 6,00,000 8,40,000 12,00,000 13,40,000
Total Value as on January 31, 2018 (`) 1,23,812 3,94,624 7,10,104 10,84,777 17,41,628 20,31,618
Fund Returns (%) 5.92 6.05 6.67 7.19 7.23 7.20
Total Value of Crisil Liquid Fund Index# 1,24,244 4,00,380 7,26,693 11,12,186 17,90,594 20,93,564
Crisil Liquid Fund Index Returns (%)# 6.60 7.02 7.59 7.88 7.76 7.70
Total Value of Nifty 50 TRI## 1,37,666 4,67,821 8,91,592 14,23,939 24,27,162 28,20,280
Nifty 50 TRI (%)## 28.28 17.75 15.83 14.80 13.49 12.67Past performance may or may not be sustained in future.Dividends are assumed to be reinvested and bonus is adjusted. Load is not taken into consideration. To illustrate the advantages of SIP investment, this is how your investment would have grown if you had invested say `10,000 systematically on the first business Day of every month over a period of time. Returns are calculated by using XIRR approach. XIRR helps in calculating return on investment given an initial and final value and a series of cash inflows and outflows with the correct allowance for the time impact of the transactions. Data as on 31st January 2018.
INDUSTRY ALLOCATION
Finance 16.53%Banks 5.32%Pharmaceuticals 5.06%Power 4.33%Telecom - Services 3.84%Consumer Non Durables 3.20%Auto Ancillaries 2.78%Auto 2.40%Cement 2.39%Consumer Durables 2.22%Construction 1.91%Ferrous Metals 1.90%Chemicals 1.80%Construction Project 1.68%Petroleum Products 1.63%
Non - Ferrous Metals 1.37%Minerals/Mining 1.22%Healthcare Services 1.19%Textile Products 1.07%Industrial Capital Goods 0.97%Fertilisers 0.92%Software 0.91%Transportation 0.87%Media & Entertainment 0.85%Gas 0.73%Trading 0.41%Pesticides 0.05%Telecom - Equipment & Accessories 0.02%Industrial Products 0.01%
NAV (`)
Regular Plan Growth 21.7246Regular Plan Monthly Dividend 12.6481Regular Plan Annual Dividend 10.9359
Riskometer
Investors understand that their principal will be at Moderately Low risk
This product is suitable for investors who are seeking*:
To generate low volatility returns over short to •medium termInvestments predominantly in arbitrage opportunities in •the cash and derivative segments of the equity markets and the arbitrage opportunities available within the derivative segment and by investing the balance in debt and money market instruments.
*Investors should consult their financial advisers if in doubt about whether the product is suitable for them.
PORTFOLIO
Name Industries % of NAVBharti Airtel Telecom - Services 2.90%Indiabulls Housing Finance Finance 2.32%Century Textiles & Industries Cement 1.99%Cholamandalam Investment and Finance Company
Finance 1.93%
Tata Chemicals Chemicals 1.77%Aurobindo Pharma Pharmaceuticals 1.70%Bharat Financial Inclusion Finance 1.45%CESC Power 1.31%DLF Construction 1.29%Tata Global Beverages Consumer Non Durables 1.23%NMDC Minerals/Mining 1.22%Sun Pharmaceutical Industries Pharmaceuticals 1.22%Equitas Holdings Finance 1.22%JSW Steel Ferrous Metals 1.22%Fortis Healthcare Healthcare Services 1.19%Balkrishna Industries Auto Ancillaries 1.10%Bank of Baroda Banks 1.09%Castrol India Petroleum Products 1.08%Reliance Infrastructure Power 1.05%Reliance Capital Finance 1.03%Titan Company Consumer Durables 1.02%Dr. Reddy's Laboratories Pharmaceuticals 1.02%Power Finance Corporation Finance 0.99%L&T Finance Holdings Finance 0.95%National Aluminium Company Non - Ferrous Metals 0.92%Dewan Housing Finance Corporation Finance 0.92%Gujarat State Fertilizers & Chemicals Fertilisers 0.92%Tata Communications Telecom - Services 0.87%Raymond Textile Products 0.87%GMR Infrastructure Construction Project 0.85%Mahindra & Mahindra Financial Services Finance 0.81%
Maruti Suzuki India Auto 0.80%Adani Ports and Special EconomicZone Transportation 0.79%
Mahindra & Mahindra Auto 0.76%Bharat Heavy Electricals Industrial Capital Goods 0.76%Reliance Power Power 0.74%Power Grid Corporation of India Power 0.73%Exide Industries Auto Ancillaries 0.70%Dish TV India Media & Entertainment 0.69%Manappuram Finance Finance 0.69%Punjab National Bank Banks 0.68%Syndicate Bank Banks 0.67%LIC Housing Finance Finance 0.66%Muthoot Finance Finance 0.64%Bajaj Finance Finance 0.60%Canara Bank Banks 0.60%Marico Consumer Non Durables 0.59%PC Jeweller Consumer Durables 0.57%United Spirits Consumer Non Durables 0.53%Amara Raja Batteries Auto Ancillaries 0.53%SREI Infrastructure Finance Finance 0.49%Granules India Pharmaceuticals 0.45%Max Financial Services Finance 0.44%Jindal Steel & Power Ferrous Metals 0.43%Mahanagar Gas Gas 0.41%Adani Enterprises Trading 0.41%Housing Development and Infrastructure Construction 0.40%
KPIT Technologies Software 0.40%Union Bank of India Banks 0.40%Bata India Consumer Durables 0.36%NCC Construction Project 0.35%NIIT Technologies Software 0.34%TVS Motor Company Auto 0.34%Hindustan Construction Company Construction Project 0.33%Shriram Transport Finance Company Finance 0.33%Ujjivan Financial Services Finance 0.32%Indraprastha Gas Gas 0.31%Tata Power Company Power 0.31%Capital First Finance 0.30%Balrampur Chini Mills Consumer Non Durables 0.27%Strides Shasun Pharmaceuticals 0.27%Havells India Consumer Durables 0.26%Allahabad Bank Banks 0.26%ICICI Prudential Life Insurance Company Finance 0.24%
The Karnataka Bank Banks 0.23%Lupin Pharmaceuticals 0.21%
Name Industries % of NAVDCB Bank Banks 0.21%The India Cements Cement 0.21%Andhra Bank Banks 0.21%Chennai Petroleum Corporation Petroleum Products 0.20%Indian Bank Banks 0.20%RBL Bank Banks 0.20%The Federal Bank Banks 0.20%Bajaj Finserv Finance 0.20%Mangalore Refinery and Petrochemicals Petroleum Products 0.19%
Tata Motors Auto 0.19%Oriental Bank of Commerce Banks 0.19%Hindustan Zinc Non - Ferrous Metals 0.19%Jubilant Foodworks Consumer Non Durables 0.19%Bharat Electronics Industrial Capital Goods 0.18%Apollo Tyres Auto Ancillaries 0.18%Motherson Sumi Systems Auto Ancillaries 0.18%Hindalco Industries Non - Ferrous Metals 0.16%Jaiprakash Associates Cement 0.16%IRB Infrastructure Developers Construction 0.15%Tata Steel Ferrous Metals 0.15%Indian Oil Corporation Petroleum Products 0.15%Tata Motors DVR Shares Auto 0.15%Dabur India Consumer Non Durables 0.14%Sun TV Network Media & Entertainment 0.13%Arvind Textile Products 0.13%Eicher Motors Auto 0.12%PTC India Power 0.11%Voltas Construction Project 0.10%Vedanta Non - Ferrous Metals 0.10%CEAT Auto Ancillaries 0.10%Steel Authority of India Ferrous Metals 0.10%Bank of India Banks 0.10%Just Dial Software 0.09%Britannia Industries Consumer Non Durables 0.08%Cadila Healthcare Pharmaceuticals 0.08%Berger Paints (I) Consumer Non Durables 0.08%Wockhardt Pharmaceuticals 0.08%ITC Consumer Non Durables 0.07%Idea Cellular Telecom - Services 0.07%Jet Airways (India) Transportation 0.07%SRF Textile Products 0.07%MindTree Software 0.07%NBCC (India) Construction 0.06%Adani Power Power 0.05%UPL Pesticides 0.05%Engineers India Construction Project 0.05%Ashok Leyland Auto 0.04%Grasim Industries Cement 0.03%IDBI Bank Banks 0.03%The South Indian Bank Banks 0.03%Pidilite Industries Chemicals 0.03%Torrent Power Power 0.03%Zee Entertainment Enterprises Media & Entertainment 0.03%CG Power and Industrial Solutions Industrial Capital Goods 0.02%Axis Bank Banks 0.02%
Bharti Infratel Telecom - Equipment & Accessories 0.02%
InterGlobe Aviation Transportation 0.01%Glenmark Pharmaceuticals Pharmaceuticals 0.01%Hero MotoCorp Auto 0.01%Godfrey Phillips India Consumer Non Durables 0.01%Ajanta Pharma Pharmaceuticals 0.01%Bharat Forge Industrial Products 0.01%Wipro Software 0.005%BEML Industrial Capital Goods 0.004%Oracle Financial Services Software Software 0.004%Cipla Pharmaceuticals 0.004%Housing Development Finance Corporation Finance 0.003%
Tata Elxsi Software 0.003%United Breweries Consumer Non Durables 0.003%Kaveri Seed Company Consumer Non Durables 0.003%PVR Media & Entertainment 0.002%Total Hedged Equity 67.53%Margin Fixed Deposit 19.05%Commercial Paper 4.06%Corporate Bond 9.79%CBLO 4.57%Zero Coupon Bond 0.36%Adjusted Net Current Asset -5.37%Grand Total 100.00%

13
IDFC Arbitrage Plus Fund(The fund is suspended for further sales w.e.f. 24th August 2017)
An Open Ended Equity Fund
31st January 2018
FUND FEATURES
INDUSTRY ALLOCATION
About the Fund: The fund invests in arbitrage opportunities in the cash and the derivative segments of the equity markets. It aims to capture the spread between the cash and futures market by simultaneously executing buy (in the cash market) and sell (in the futures market) trades. The fund can also tactically participate in a mix of strategies like pair trades, corporate events like buybacks, etc, (restricted upto 5% of the portfolio). The balance is invested in actively managed debt and money market instruments.
Nature: Equity Derivatives
Monthly Avg AUM: ` 376.73 Crores
Month end AUM: ` 371.27 Crores
Inception Date: 9 June 2008
Fund Manager: Equity Portion: Mr. Yogik Pitti (w.e.f. 27th June 2013), Mr. Arpit Kapoor (w.e.f. 1st March 2017) & Debt Portion: Mr. Harshal Joshi (w.e.f. 20th October 2016)
Other Parameter:
Beta 1.46 R Square 0.21 Standard Deviation (Annualized) 0.94% Sharpe* 0.06
Portfolio Turnover
Equity 2.35 Aggregate^ 16.76
Expense Ratio£
Regular 1.03%
Direct 0.43%
Benchmark: Crisil Liquid Fund Index
SIP (Minimum Amount): ` 1000/-
SIP Frequency: Monthly
SIP Dates (Monthly): Any day of the month, except 29th, 30th & 31st day of the monthInvestment Objective: Refer Pg No from 41 to 42 Minimum Investment Amount: ` 5,000/- and any amount thereafter
Option Available: Growth, Dividend - (Payout, Reinvestment and Sweep (from Equity Schemes to Debt Schemes only)) - Monthly & Annual
Exit Load: 0.25% if redeemed / switched-out within 1 (one) month from the date of allotment. (w.e.f. 12th August 2016)
Finance 11.59%Pharmaceuticals 8.40%Banks 4.76%Telecom - Services 4.40%Software 4.16%Gas 3.83%Construction 3.17%Cement 3.05%Auto 2.99%Ferrous Metals 2.91%Consumer Non Durables 2.89%
Performance Table
Scheme Name CAGR Returns (%) Current Value of Investment of ` 10,000
1 Year 3 Years 5 YearsSince InceptionJun 09, 2008
1 Year 3 Years 5 YearsSince InceptionJun 09, 2008
IDFC Arbitrage Plus Fund 4.94% 6.05% 7.04% 6.91% 10,494 11,932 14,053 19,055
CRISIL Liquid Fund Index# 6.68% 7.39% 8.10% 7.56% 10,668 12,391 14,761 20,203
Nifty 50 TRI## 30.48% 9.10% 14.18% 11.03% 13,048 12,991 19,418 27,458
Performance based on NAV as on 31/1/2018. Past performance may or may not be sustained in future.For other funds managed by the fund manager, please refer page no. 34 - 36 & the respective fund pages The performances given are of regular plan growth option.Regular and Direct Plans have different expense structure. Direct Plan shall have a lower expense ratio excluding distribution expenses, commission expenses etc.*Risk-free rate assumed to be 6.00% (FBIL OVERNIGHT MIBOR as on 31st January 2018). Ratios calculated on the basis of 3 years history of monthly data. ^Portfolio Turnover ratio is calculated as Lower of purchase or sale during the period / Average AUM for the last one year (includes Fixed Income securities and Equity derivatives). #Benchmark Returns. ##Alternate Benchmark Returns. £The above recurring expense ratio does not include Goods and Service Tax on Investment Management Fees, the proportionate charge in respect of sales beyond T-15 cities subject to maximum of 30 bps on daily net assets and borrowing costs, wherever applicable.With effect from 1st February 2018, we are comparing the performances of the funds with the total return variant of the benchmark instead of the price return variant.
SIP PERFORMANCE
Monthly SIP of ` 10,000 in IDFC Arbitrage Plus Fund - Regular Plan - Growth
1 Year 3 Years 5 Years 7 Years 10 YearsSince
InceptionJun 09, 2008
Total Amount Invested (`) 1,20,000 3,60,000 6,00,000 8,40,000 NA 11,60,000
Total Value as on January 31, 2018 (`) 1,23,332 3,93,118 7,05,137 10,72,489 NA 16,36,209
Fund Returns (%) 5.17 5.79 6.39 6.87 NA 6.92
Total Value of Crisil Liquid Fund Index# 1,24,244 4,00,380 7,26,693 11,12,186 NA 17,08,411
Crisil Liquid Fund Index Returns (%)# 6.60 7.02 7.59 7.88 NA 7.78
Total Value of Nifty 50 TRI## 1,37,666 4,67,821 8,91,592 14,23,939 NA 23,30,463
Nifty 50 TRI (%)## 28.28 17.75 15.83 14.80 NA 13.85
Past performance may or may not be sustained in future.Dividends are assumed to be reinvested and bonus is adjusted. Load is not taken into consideration. To illustrate the advantages of SIP investment, this is how your investment would have grown if you had invested say `10,000 systematically on the first business Day of every month over a period of time. Returns are calculated by using XIRR approach. XIRR helps in calculating return on investment given an initial and final value and a series of cash inflows and outflows with the correct allowance for the time impact of the transactions. Data as on 31st January 2018.
Healthcare Services 2.57%Auto Ancillaries 2.51%Pesticides 1.94%Media & Entertainment 1.70%Textile Products 1.70%Power 0.87%Chemicals 0.64%Industrial Products 0.54%Petroleum Products 0.36%Consumer Durables 0.28%Industrial Capital Goods 0.18%
NAV (`)
Regular Plan Growth 19.0546Regular Plan Monthly Dividend 12.0312Regular Plan Annual Dividend 11.0533
Riskometer
Investors understand that their principal will be at Moderate risk
This product is suitable for investors who are seeking*:
To generate low volatility returns over short to •medium term.Investments predominantly in arbitrage •opportunities in the cash and derivative segments of the equity markets and the arbitrage opportunities available within the derivative segment and by investing the balance in debt and money market instruments.
*Investors should consult their financial advisers if in doubt about whether the product is suitable for them.
PORTFOLIO
Name Industries% of NAV
Aurobindo Pharma Pharmaceuticals 3.89%
Mahanagar Gas Gas 3.83%
Century Textiles & Industries Cement 2.98%
Sun Pharmaceutical Industries Pharmaceuticals 2.73%
DLF Construction 2.69%
Reliance Capital Finance 2.60%
LIC Housing Finance Finance 2.58%
Fortis Healthcare Healthcare Services 2.57%
JSW Steel Ferrous Metals 2.55%
Bharti Airtel Telecom - Services 2.34%
Tata Motors DVR Shares Auto 2.21%
Tata Communications Telecom - Services 2.07%
ICICI Prudential Life Insurance Company Finance 2.06%
United Spirits Consumer Non Durables 1.95%
UPL Pesticides 1.94%
Amara Raja Batteries Auto Ancillaries 1.88%
Canara Bank Banks 1.71%
TV18 Broadcast Media & Entertainment 1.70%
Raymond Textile Products 1.70%
NIIT Technologies Software 1.66%
MindTree Software 1.57%
Axis Bank Banks 1.21%
Manappuram Finance Finance 1.13%
Equitas Holdings Finance 1.01%
Reliance Power Power 0.87%
Syndicate Bank Banks 0.76%
Tata Global Beverages Consumer Non Durables 0.74%
Lupin Pharmaceuticals 0.71%
Ashok Leyland Auto 0.71%
Bank of Baroda Banks 0.71%
Tata Chemicals Chemicals 0.64%
Glenmark Pharmaceuticals Pharmaceuticals 0.63%
Name Industries% of NAV
Indiabulls Housing Finance Finance 0.63%
CEAT Auto Ancillaries 0.53%
Tata Consultancy Services Software 0.52%
Bharat Forge Industrial Products 0.51%
IRB Infrastructure Developers Construction 0.47%
Bajaj Finance Finance 0.45%
Wockhardt Pharmaceuticals 0.43%
Just Dial Software 0.41%
Reliance Industries Petroleum Products 0.36%
Jindal Steel & Power Ferrous Metals 0.36%
Indian Bank Banks 0.31%
Shriram Transport Finance Company Finance 0.31%
Power Finance Corporation Finance 0.30%
Havells India Consumer Durables 0.28%
L&T Finance Holdings Finance 0.25%
Cholamandalam Investment and Finance Company Finance 0.21%
Bharat Electronics Industrial Capital Goods 0.18%
ITC Consumer Non Durables 0.16%
Motherson Sumi Systems Auto Ancillaries 0.09%
Grasim Industries Cement 0.07%
Yes Bank Banks 0.07%
Tata Motors Auto 0.06%
Ujjivan Financial Services Finance 0.05%
Balrampur Chini Mills Consumer Non Durables 0.05%
Jain Irrigation Systems Industrial Products 0.03%
Total Hedged Equity 65.44%
Margin Fixed Deposit 11.29%
Corporate Bond 9.36%
State Government Bond 1.39%
Zero Coupon Bond 5.35%
CBLO 14.79%
Adjusted Net Current Asset -7.62%
Grand Total 100.00%
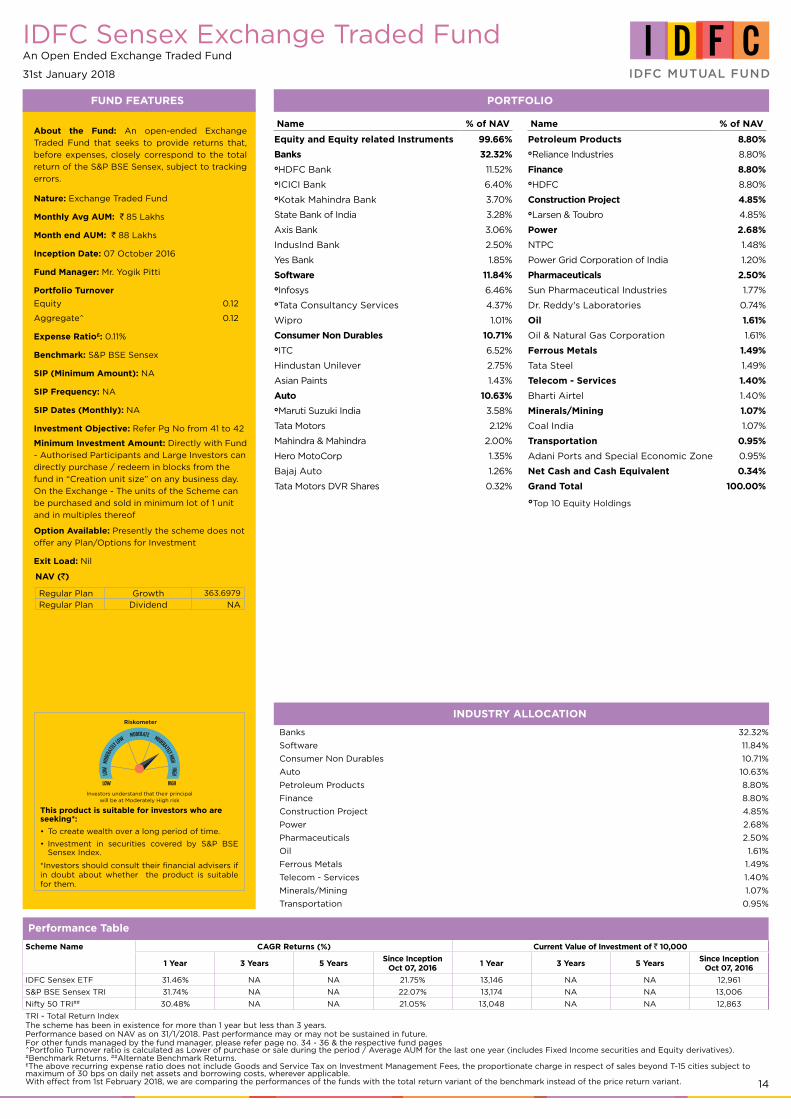
14
Banks 32.32%
Software 11.84%
Consumer Non Durables 10.71%
Auto 10.63%
Petroleum Products 8.80%
Finance 8.80%
Construction Project 4.85%
Power 2.68%
Pharmaceuticals 2.50%
Oil 1.61%
Ferrous Metals 1.49%
Telecom - Services 1.40%
Minerals/Mining 1.07%
Transportation 0.95%
IDFC Sensex Exchange Traded FundAn Open Ended Exchange Traded Fund
31st January 2018
FUND FEATURES
INDUSTRY ALLOCATION
About the Fund: An open-ended Exchange
Traded Fund that seeks to provide returns that,
before expenses, closely correspond to the total
return of the S&P BSE Sensex, subject to tracking
errors.
Nature: Exchange Traded Fund
Monthly Avg AUM: ` 85 Lakhs
Month end AUM: ` 88 Lakhs
Inception Date: 07 October 2016
Fund Manager: Mr. Yogik Pitti
Portfolio Turnover
Equity 0.12
Aggregate^ 0.12
Expense Ratio£: 0.11%
Benchmark: S&P BSE Sensex
SIP (Minimum Amount): NA
SIP Frequency: NA
SIP Dates (Monthly): NA
Investment Objective: Refer Pg No from 41 to 42
Minimum Investment Amount: Directly with Fund
- Authorised Participants and Large Investors can
directly purchase / redeem in blocks from the
fund in “Creation unit size” on any business day.
On the Exchange - The units of the Scheme can
be purchased and sold in minimum lot of 1 unit
and in multiples thereof
Option Available: Presently the scheme does not
offer any Plan/Options for Investment
Exit Load: Nil
Performance Table
Scheme Name CAGR Returns (%) Current Value of Investment of ` 10,000
1 Year 3 Years 5 YearsSince Inception
Oct 07, 20161 Year 3 Years 5 Years
Since InceptionOct 07, 2016
IDFC Sensex ETF 31.46% NA NA 21.75% 13,146 NA NA 12,961
S&P BSE Sensex TRI 31.74% NA NA 22.07% 13,174 NA NA 13,006
Nifty 50 TRI## 30.48% NA NA 21.05% 13,048 NA NA 12,863
TRI - Total Return IndexThe scheme has been in existence for more than 1 year but less than 3 years.Performance based on NAV as on 31/1/2018. Past performance may or may not be sustained in future.For other funds managed by the fund manager, please refer page no. 34 - 36 & the respective fund pages ^Portfolio Turnover ratio is calculated as Lower of purchase or sale during the period / Average AUM for the last one year (includes Fixed Income securities and Equity derivatives). #Benchmark Returns. ##Alternate Benchmark Returns. £The above recurring expense ratio does not include Goods and Service Tax on Investment Management Fees, the proportionate charge in respect of sales beyond T-15 cities subject to maximum of 30 bps on daily net assets and borrowing costs, wherever applicable.With effect from 1st February 2018, we are comparing the performances of the funds with the total return variant of the benchmark instead of the price return variant.
NAV (`)
Regular Plan Growth 363.6979
Regular Plan Dividend NA
PORTFOLIO
Name % of NAV
Equity and Equity related Instruments 99.66%
Banks 32.32%HDFC Bank 11.52%ICICI Bank 6.40%Kotak Mahindra Bank 3.70%
State Bank of India 3.28%
Axis Bank 3.06%
IndusInd Bank 2.50%
Yes Bank 1.85%
Software 11.84%Infosys 6.46%Tata Consultancy Services 4.37%
Wipro 1.01%
Consumer Non Durables 10.71%ITC 6.52%
Hindustan Unilever 2.75%
Asian Paints 1.43%
Auto 10.63%Maruti Suzuki India 3.58%
Tata Motors 2.12%
Mahindra & Mahindra 2.00%
Hero MotoCorp 1.35%
Bajaj Auto 1.26%
Tata Motors DVR Shares 0.32%
Name % of NAV
Petroleum Products 8.80%Reliance Industries 8.80%
Finance 8.80%HDFC 8.80%
Construction Project 4.85%Larsen & Toubro 4.85%
Power 2.68%
NTPC 1.48%
Power Grid Corporation of India 1.20%
Pharmaceuticals 2.50%
Sun Pharmaceutical Industries 1.77%
Dr. Reddy's Laboratories 0.74%
Oil 1.61%
Oil & Natural Gas Corporation 1.61%
Ferrous Metals 1.49%
Tata Steel 1.49%
Telecom - Services 1.40%
Bharti Airtel 1.40%
Minerals/Mining 1.07%
Coal India 1.07%
Transportation 0.95%
Adani Ports and Special Economic Zone 0.95%
Net Cash and Cash Equivalent 0.34%
Grand Total 100.00%
Riskometer
Investors understand that their principal will be at Moderately High risk
This product is suitable for investors who are seeking*:
To create wealth over a long period of time.•
Investment in securities covered by S&P BSE •Sensex Index.
*Investors should consult their financial advisers if in doubt about whether the product is suitable for them.
Top 10 Equity Holdings

15
IDFC Nifty Exchange Traded FundAn Open Ended Exchange Traded Fund
31st January 2018
FUND FEATURES
INDUSTRY ALLOCATION
About the Fund: An open-ended Exchange
Traded Fund that seeks to provide returns that,
before expenses, closely correspond to the total
return of the Nifty 50, subject to tracking errors.
Nature: Exchange Traded Fund
Monthly Avg AUM: ` 3.80 Crores
Month end AUM: ` 3.82 Crores
Inception Date: 07 October 2016
Fund Manager: Mr. Yogik Pitti
Portfolio Turnover
Equity 0.54
Aggregate^ 0.54
Expense Ratio£: 0.13%
Benchmark: Nifty 50
SIP (Minimum Amount): NA
SIP Frequency: NA
SIP Dates (Monthly): NA
Investment Objective: Refer Pg No from 41 to 42
Minimum Investment Amount: Directly with Fund
- Authorised Participants and Large Investors can
directly purchase / redeem in blocks from the
fund in “Creation unit size” on any business day.
On the Exchange - The units of the Scheme can
be purchased and sold in minimum lot of 1 unit
and in multiples thereof
Option Available: Presently the scheme does not
offer any Plan/Options for Investment.
Exit Load: Nil
Performance Table
Scheme Name CAGR Returns (%) Current Value of Investment of ` 10,000
1 Year 3 Years 5 YearsSince Inception
Oct 07, 20161 Year 3 Years 5 Years
Since InceptionOct 07, 2016
IDFC Nifty ETF 29.95% NA NA 20.59% 12,995 NA NA 12,798
Nifty 50 TRI# 30.48% NA NA 21.05% 13,048 NA NA 12,863
TRI - Total Return IndexThe scheme has been in existence for more than 1 year but less than 3 years.Performance based on NAV as on 31/1/2018. Past performance may or may not be sustained in future.For other funds managed by the fund manager, please refer page no. 34 - 36 & the respective fund pages ^Portfolio Turnover ratio is calculated as Lower of purchase or sale during the period / Average AUM for the last one year (includes Fixed Income securities and Equity derivatives). #Benchmark Returns. £The above recurring expense ratio does not include Goods and Service Tax on Investment Management Fees, the proportionate charge in respect of sales beyond T-15 cities subject to maximum of 30 bps on daily net assets and borrowing costs, wherever applicable.With effect from 1st February 2018, we are comparing the performances of the funds with the total return variant of the benchmark instead of the price return variant.
NAV (`)
Regular Plan Growth 111.3141Regular Plan Dividend NA
PORTFOLIO
Name % of NAV
Equity and Equity related Instruments 99.74%
Banks 26.96%HDFC Bank 9.62%ICICI Bank 5.32%Kotak Mahindra Bank 3.47%
State Bank of India 2.73%
Axis Bank 2.21%
IndusInd Bank 2.09%
Yes Bank 1.53%
Software 12.01%Infosys 5.39%Tata Consultancy Services 3.63%
HCL Technologies 1.29%
Tech Mahindra 0.90%
Wipro 0.81%
Petroleum Products 10.37%Reliance Industries 7.77%
Indian Oil Corporation 1.00%
Bharat Petroleum Corporation 0.90%
Hindustan Petroleum Corporation 0.70%
Auto 9.32%Maruti Suzuki India 2.96%
Tata Motors 1.73%
Mahindra & Mahindra 1.67%
Hero MotoCorp 1.12%
Bajaj Auto 1.06%
Eicher Motors 0.78%
Finance 9.31%HDFC 7.33%
Indiabulls Housing Finance 1.05%
Bajaj Finance 0.93%
Consumer Non Durables 8.91%ITC 5.43%
Hindustan Unilever 2.29%
Asian Paints 1.19%
Construction Project 4.10%Larsen & Toubro 4.10%
Name % of NAV
Pharmaceuticals 3.74%
Sun Pharmaceutical Industries 1.50%
Cipla 0.70%
Dr. Reddy's Laboratories 0.63%
Lupin 0.50%
Aurobindo Pharma 0.41%
Non - Ferrous Metals 2.36%
Vedanta 1.48%
Hindalco Industries 0.88%
Power 2.22%
NTPC 1.22%
Power Grid Corporation of India 1.00%
Cement 1.52%
UltraTech Cement 1.07%
Ambuja Cements 0.45%
Telecom - Services 1.36%
Bharti Airtel 1.36%
Ferrous Metals 1.35%
Tata Steel 1.35%
Oil 1.35%
Oil & Natural Gas Corporation 1.35%
Minerals/Mining 0.92%
Coal India 0.92%
Transportation 0.77%
Adani Ports and Special Economic Zone 0.77%
Media & Entertainment 0.76%
Zee Entertainment Enterprises 0.76%
Gas 0.72%
GAIL (India) 0.72%
Pesticides 0.64%
UPL 0.64%
Telecom - Equipment & Accessories 0.64%
Bharti Infratel 0.64%
Auto Ancillaries 0.41%
Bosch 0.41%
Net Cash and Cash Equivalent 0.26%
Grand Total 100.00%
Riskometer
Investors understand that their principal will be at Moderately High risk
This product is suitable for investors who are seeking*:
To create wealth over a long period of time.•
Investment in securities covered by • Nifty 50 Index.
*Investors should consult their financial advisers if in doubt about whether the product is suitable for them.
Banks 26.96%Software 12.01%Petroleum Products 10.37%Auto 9.32%Finance 9.31%Consumer Non Durables 8.91%Construction Project 4.10%Pharmaceuticals 3.74%Non - Ferrous Metals 2.36%Power 2.22%Cement 1.52%Telecom - Services 1.36%Ferrous Metals 1.35%Oil 1.35%Minerals/Mining 0.92%Transportation 0.77%Media & Entertainment 0.76%Gas 0.72%Pesticides 0.64%Telecom - Equipment & Accessories 0.64%Auto Ancillaries 0.41%
INDUSTRY ALLOCATION
Top 10 Equity Holdings

16
IDFC Dynamic Equity Fund(The Fund has been repositioned with effect from June 19, 2017)$$ An open ended equity oriented fund – dynamically allocating between equity and debt31st January 2018
FUND FEATURES PORTFOLIO
INDUSTRY ALLOCATION
About the Fund:‘Dynamically’ invests between Equity and Debt •An Equity fund that buys less when markets are •expensive and more when markets are cheapBased on the model that tracks market valuation•
Nature: Equity
Monthly Avg AUM: ` 531.86 Crores
Month end AUM: ` 574.68 Crores
Inception Date: 10 October 2014
Fund Manager: Equity Portion: Mr. Arpit Kapoor & Mr. Sumit Agrawal (w.e.f. 01st March 2017), Debt Portion: Mr. Arvind Subramanian (w.e.f. 09th November 2015)
Other Parameter:Standard Deviation (Annualized) 5.25% Beta 0.56 R Square 0.87 Sharpe* 0.02
Modified Duration 1.93 yearsAverage Maturity 2.20 yearsYield to Maturity 7.85%
Portfolio TurnoverEquity 1.36Aggregate^ 4.38
Expense Ratio£ Regular 2.44%Direct 1.07%
Benchmark: CRISIL Hybrid 35+65 - Aggressive Index
SIP (Minimum Amount): ` 1,000/-
SIP Frequency: Monthly
SIP Dates (Monthly): Any day of the month, except 29th, 30th & 31st day of the month
Investment Objective: Refer Pg No from 41 to 42
Minimum Investment Amount : ` 5,000/- and any amount thereafter
Option Available: Growth, Dividend (Payout, Reinvestment and Sweep (from Equity Schemes to Debt Schemes only))
Exit Load: In respect of each purchase of Units:- For 10% of investment: Nil- For remaining investment: 1% if redeemed/ switched out within 1 year from the date of allotment (w.e.f. July 5, 2017)
Top 10 Equity Holdings
Name Rating % of NAV
Equity and Equity related Instruments 68.38%Net Equity Exposure 48.03%Banks 9.74%HDFC Bank 2.97%Axis Bank 2.50%Axis Bank - Equity Futures -1.27%State Bank of India 1.92%State Bank of India - Equity Futures -0.89%ICICI Bank 1.23%Kotak Mahindra Bank 1.16%The Federal Bank 1.08%The Federal Bank - Equity Futures -1.08%IndusInd Bank 1.04%RBL Bank 0.61%Punjab National Bank 0.48%Union Bank of India 0.45%Union Bank of India - Equity Futures -0.45%Bank of Baroda 0.19%Bank of Baroda - Equity Futures -0.19%Finance 5.71%HDFC 2.89%HDFC - Equity Futures -1.88%Indiabulls Housing Finance 1.20%Indiabulls Housing Finance - Equity Futures -1.20%Bajaj Finserv 1.17%SBI Life Insurance Company 0.92%Mas Financial Services 0.88%HDFC Standard Life Insurance Company 0.74%Reliance Nippon Life Asset Management 0.59%Magma Fincorp 0.39%Power Finance Corporation 0.30%Power Finance Corporation - Equity Futures -0.30%Consumer Non Durables 3.59%United Spirits 1.79%United Spirits - Equity Futures -1.79%Hindustan Unilever 1.19%Nestle India 0.97%Tata Global Beverages 0.77%Tata Global Beverages - Equity Futures -0.78%GlaxoSmithKline Consumer Healthcare 0.64%Prataap Snacks 0.50%DCM Shriram 0.30%Auto Ancillaries 3.55%Motherson Sumi Systems 1.23%Motherson Sumi Systems - Equity Futures -1.24%Apollo Tyres 1.11%MRF 0.71%Minda Industries 0.67%GNA Axles 0.47%Asahi India Glass 0.42%Minda Corporation 0.17%Auto 3.00%Maruti Suzuki India 3.11%Maruti Suzuki India - Equity Futures -1.30%Tata Motors 1.56%Tata Motors - Equity Futures -1.57%Mahindra & Mahindra 1.20%Tata Motors DVR Shares 0.55%Tata Motors DVR Shares - Equity Futures -0.55%Petroleum Products 2.77%Reliance Industries 1.96%Reliance Industries - Equity Futures -0.62%Bharat Petroleum Corporation 0.77%Indian Oil Corporation 0.65%Hindustan Petroleum Corporation 0.61%Hindustan Petroleum Corporation - Equity Futures -0.60%
Pharmaceuticals 2.33%Cadila Healthcare 1.11%
Banks 13.61%Finance 9.09%Auto 6.42%Consumer Non Durables 6.16%Auto Ancillaries 4.79%Petroleum Products 3.99%Telecom - Services 3.20%Pharmaceuticals 2.87%Ferrous Metals 2.69%Software 2.24%Construction Project 2.04%Gas 1.54%Cement 1.49%
Performance Table
Scheme Name CAGR Returns (%) Current Value of Investment of ` 10,000
1 Year 3 Years 5 YearsSince Inception
Oct 10, 20141 Year 3 Years 5 Years
Since InceptionOct 10, 2014
IDFC Dynamic Equity Fund 16.93% 6.09% NA 8.10% 11,693 11,944 NA 12,945CRISIL Hybrid 35+65 - Aggressive Index#
21.04% 10.27% NA 12.78% 12,104 13,415 NA 14,896
Nifty 50 TRI## 30.48% 9.10% NA 12.05% 13,048 12,991 NA 14,577The scheme has been in existence for more than 3 years but less than 5 years.Performance based on NAV as on 31/1/2018. Past performance may or may not be sustained in future.For other funds managed by the fund manager, please refer page no. 34 - 36 & the respective fund pages The performances given are of regular plan growth option.Regular and Direct Plans have different expense structure. Direct Plan shall have a lower expense ratio excluding distribution expenses, commission expenses etc.*Risk-free rate assumed to be 6.00% (FBIL OVERNIGHT MIBOR as on 29th December 2017). Ratios calculated on the basis of 3 years history of monthly data. ^Portfolio Turnover ratio is calculated as Lower of purchase or sale during the period / Average AUMfor the last one year (includes Fixed Income securities and Equity derivatives). The portfolio shall be rebalanced on the first business day of every month.#Benchmark Returns. ##Alternate Benchmark Returns.$$ For details please refer Notice (https://www.idfcmf.com/uploads/160520171236May-16-2017-Change-in-investment-strategy-of-IDFC-Dynamic-Equity-Fund.pdf )£The above recurring expense ratio does not include Goods and Service Tax on Investment Management Fees, the proportionate charge in respect of sales beyond T-15 cities subject to maximum of 30 bps on daily net assets and borrowing costs, wherever applicable.With effect from 1st February 2018, we are comparing the performances of the funds with the total return variant of the benchmark instead of the price return variant.
SIP PERFORMANCE
Monthly SIP of ` 10,000 in IDFC Dynamic Equity - Regular Plan - Growth
1 Year 3 Years 5 YearsSince
InceptionOct 10, 2014
Total Amount Invested (`) 1,20,000 3,60,000 NA 4,00,000 Total Value as on January 31, 2018 (`) 1,29,986 4,19,069 NA 4,69,213 Fund Returns (%) 15.73 10.10 NA 9.55Total Value of CRISIL Hybrid 35+65 - Aggressive Index# 1,31,635 4,50,327 NA 5,07,403
CRISIL Hybrid 35+65 - Aggressive Index Returns (%)# 18.39 15.07 NA 14.38
Total Value of Nifty 50 TRI## 1,37,666 4,67,821 NA 5,23,341 Nifty 50 TRI (%)## 28.28 17.75 NA 16.32
Past performance may or may not be sustained in future.Dividends are assumed to be reinvested and bonus is adjusted. Load is not taken into consideration. To illustrate the advantages of SIP investment, this is how your investment would have grown if you had invested say `10,000 systematically on the first business Day of every month over a period of time. Returns are calculated by using XIRR approach. XIRR helps in calculating return on investment given an initial and final value and a series of cash inflows and outflows with the correct allowance for the time impact of the transactions. Data as on 31st January 2018.
Riskometer
Investors understand that their principal will be at Moderately High risk
This product is suitable for investors who are seeking*:
Create wealth over a long period of time•
Dynamic allocation towards equity, derivatives, •debt and money market instruments
*Investors should consult their financial advisers if in doubt about whether the product is suitable for them.
Name Rating % of NAV
Aurobindo Pharma 0.77%Lupin 0.54%Lupin - Equity Futures -0.54%Dishman Carbogen Amcis 0.46%Software 2.24%Infosys 1.50%Mastek 0.46%KPIT Technologies 0.28%Construction Project 2.04%Larsen & Toubro 1.85%KEC International 0.19%Ferrous Metals 1.77%JSW Steel 1.19%JSW Steel - Equity Futures -0.31%Tata Steel 0.90%Steel Authority of India 0.61%Steel Authority of India - Equity Futures -0.62%Gas 1.54%GAIL (India) 0.92%Petronet LNG 0.62%Cement 1.49%Ambuja Cements 1.03%Sagar Cements 0.47%Construction 1.34%ITD Cementation India 0.88%PNC Infratech 0.46%Power 1.14%NTPC 0.59%Nava Bharat Ventures 0.54%Industrial Capital Goods 0.77%Bharat Electronics 0.77%Non - Ferrous Metals 0.76%Hindalco Industries 0.76%Oil 0.71%Oil & Natural Gas Corporation 0.71%Textiles - Cotton 0.65%Nitin Spinners 0.65%Media & Entertainment 0.62%Zee Entertainment Enterprises 0.62%Consumer Durables 0.60%Khadim India 0.60%Retailing 0.58%Future Retail 0.58%Hotels, Resorts And Other Recreational Activities 0.38%
The Indian Hotels Company 0.38%Miscellaneous 0.37%Amulya Leasing And Finance 0.22%Amber Enterprises India 0.13%Praxis Home Retail 0.01%Fertilisers 0.34%Coromandel International 0.34%Telecom - Services -0.01%Bharti Airtel 3.20%Bharti Airtel - Equity Futures -3.21%Corporate Bond 17.35%Kotak Mahindra Prime AAA 5.22%HDFC AAA 5.19%LIC Housing Finance AAA 5.16%HDB Financial Services AAA 1.73%NTPC AAA 0.04%State Government Bond 9.75%8.39% Rajasthan UDAY BOND - 2023 SOV 6.23%8.18% Haryana UDAY BOND - 2022 SOV 1.77%8.14% Harayana UDAY BOND - 2022 SOV 1.76%Net Cash and Cash Equivalent 4.51%Grand Total 100.00%
Construction 1.34%Power 1.14%Industrial Capital Goods 0.77%Non - Ferrous Metals 0.76%Oil 0.71%Textiles - Cotton 0.65%Media & Entertainment 0.62%Consumer Durables 0.60%Retailing 0.58%Hotels, Resorts And Other Recreational Activities 0.38%Miscellaneous 0.37%Fertilisers 0.34%
NAV (`)
Regular Plan Growth 12.9450Regular Plan Dividend 11.1330
PE Bands Equity Allocation<12 90 - 100 12 - 16 75 - 9016 - 19 65 - 7519 - 22 55 - 6522 - 26 40 - 55>26 30 - 40
The industry allocation is provided at gross equity exposure
The equity exposure of the scheme’s portfolio will be determined as follows:
The balance will be invested in debt and money market securities.

17
IDFC Balanced FundAn Open-ended Balanced Scheme
31st January 2018
FUND FEATURES
INDUSTRY ALLOCATION
About the Fund: IDFC Balanced Equity Fund provides a combination of equity (up to 60%), arbitrage (minimum 5%) and balance in debt so as to provide both stability of returns and potential of growth. Both equity and fixed income portions are actively managed.
Nature: Balanced
Monthly Avg AUM: ` 1,308.64 Crores
Month end AUM: ` 1309.58 Crores
Inception Date: 30 December 2016
Fund Manager: Equity Portion: Mr. Anoop Bhaskar Debt Portion: Mr. Suyash Choudhary & Mr. Anurag Mittal
Other Parameter:
Modified Duration 4.06 years Average Maturity 5.67 years Yield to Maturity 7.74%
Expense Ratio£
Regular 2.18%
Direct 0.41%
Benchmark: CRISIL Hybrid 35+65 - Aggressive Index
SIP (Minimum Amount): ` 1,000/-
SIP Frequency: Monthly
SIP Date (Monthly): Any day of the month, except 29th, 30th & 31st day of the month
Investment Objective: Refer Pg No from 41 to 42
Minimum Investment Amount: ` 5,000/- and any amount thereafter
Option Available: Growth & Dividend (Payout, Reinvestment & Sweep facility)
Exit Load: 10% of investment: Nil Remaining investment: 1% if redeemed/switched out within 1 year from the date of allotment
NAV (`)
Regular Plan Dividend 10.8781Regular Plan Growth 11.7830
Riskometer
Investors understand that their principal will be at Moderately High risk
This product is suitable for investors who are seeking*:
Create wealth over a long period of time.•
Capital appreciation and current income by •investing in equity as well as fixed income securities.
*Investors should consult their financial advisers if in doubt about whether the product is suitable for them.
PORTFOLIO
Name Rating/Industry % of NAV
HDFC Bank Banks 3.16%
State Bank of India Banks 2.10%
Reliance Industries Petroleum Products 2.10%
ICICI Bank Banks 1.94%
Axis Bank Banks 1.71%
Hero MotoCorp Auto 1.56%
ICICI Prudential Life Insurance Company Finance 1.36%
GAIL (India) Gas 1.34%
Infosys Software 1.25%
ITC Consumer Non Durables 1.21%
KPIT Technologies Software 1.21%
Future Retail Retailing 1.21%
Kotak Mahindra Bank Banks 1.14%
IndusInd Bank Banks 1.09%
EIH Hotels, Resorts And Other Recreational Activities 1.09%
Top 15 Active Equity Holdings 23.47%
Other Active Equity Holdings 36.94%
Arbitrage Position 5.21%
8.20% GOI (MD 15/02/2022) SOV 8.42%
6.68% GOI (MD 17/09/2031) SOV 4.55%
6.79% GOI (MD 15/05/2027) SOV 1.81%
7.35% GOI (MD 22/06/2024) SOV 1.51%
8.15% GOI (MD 24/11/2026) SOV 0.78%
7.68% GOI (MD 15/12/2023) SOV 0.77%
8.33% GOI 2026 (MD 09/07/2026) SOV 0.40%
Government Bond 18.24%
Axis Bank AA+ 3.39%
IndusInd Bank AA 1.92%
Housing Development Finance Corporation AAA 1.16%
Power Finance Corporation AAA 0.39%
Corporate Bond 6.85%
8.21% Haryana UDAY BOND (MD 31/03/2022) SOV 0.13%
State Government Bond 0.13%
Margin FD 0.76%
Net Current Asset 8.39%
Grand Total 100.00%
Banks 15.03%
Finance 6.20%
Auto 5.18%
Software 4.26%
Pharmaceuticals 3.84%
Petroleum Products 3.70%
Consumer Non Durables 3.16%
Power 2.57%
Auto Ancillaries 2.47%Hotels, Resorts And Other Recreational Activities 2.43%
Cement 2.25%
Retailing 2.20%
Gas 1.70%
Transportation 1.57%
Construction Project 1.36%
Consumer Durables 1.35%
Industrial Capital Goods 1.25%
Industrial Products 1.20%
Non - Ferrous Metals 0.80%
Chemicals 0.77%
Fertilisers 0.73%
Ferrous Metals 0.71%
Minerals/Mining 0.70%
Telecom - Services 0.14%
Miscellaneous 0.03%
Construction 0.02%
Performance Table
Scheme Name CAGR Returns (%) Current Value of Investment of ` 10,000
1 Year 3 Years 5 YearsSince InceptionDec 30, 2016
1 Year 3 Years 5 YearsSince InceptionDec 30, 2016
IDFC Balanced Fund - Growth 16.80% NA NA 16.28% 11,680 NA NA 11,783CRISIL Hybrid 35+65 - Aggressive Index#
21.04% NA NA 23.51% 12,104 NA NA 12,582
Nifty 50 TRI## 30.48% NA NA 33.10% 13,048 NA NA 13,648The scheme has been in existence for more than 1 year but less than 3 years.Performance based on NAV as on 31/1/2018. Past performance may or may not be sustained in future.For other funds managed by the fund manager, please refer page no. 34 - 36 & the respective fund pages The performances given are of regular plan growth option.Regular and Direct Plans have different expense structure. Direct Plan shall have a lower expense ratio excluding distribution expenses, commission expenses etc.The portfolio shall be rebalanced on the first business day of every month.#Benchmark Returns. ##Alternate Benchmark Returns.The above recurring expense ratio does not include Goods and Service Tax on Investment Management Fees, the proportionate charge in respect of sales beyond T-15 cities subject to maximum of 30 bps on daily net assets and borrowing costs, wherever applicable.With effect from 1st February 2018, we are comparing the performances of the funds with the total return variant of the benchmark instead of the price return variant.
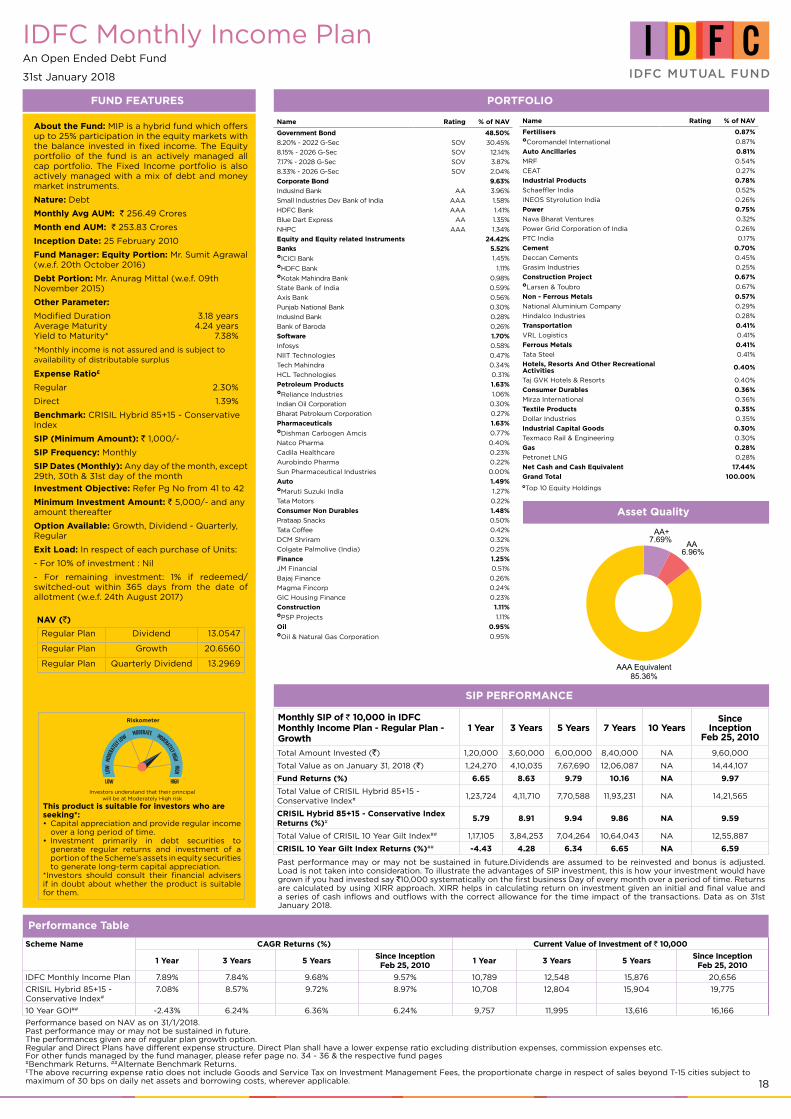
18
IDFC Monthly Income PlanAn Open Ended Debt Fund
31st January 2018
FUND FEATURES
About the Fund: MIP is a hybrid fund which offers up to 25% participation in the equity markets with the balance invested in fixed income. The Equity portfolio of the fund is an actively managed all cap portfolio. The Fixed Income portfolio is also actively managed with a mix of debt and money market instruments.
Nature: Debt
Monthly Avg AUM: ` 256.49 Crores
Month end AUM: ` 253.83 Crores
Inception Date: 25 February 2010
Fund Manager: Equity Portion: Mr. Sumit Agrawal (w.e.f. 20th October 2016)
Debt Portion: Mr. Anurag Mittal (w.e.f. 09th November 2015)
Other Parameter:
Modified Duration 3.18 years Average Maturity 4.24 years Yield to Maturity* 7.38%
*Monthly income is not assured and is subject to availability of distributable surplus
Expense Ratio£
Regular 2.30%
Direct 1.39%
Benchmark: CRISIL Hybrid 85+15 - Conservative Index
SIP (Minimum Amount): ` 1,000/-
SIP Frequency: Monthly
SIP Dates (Monthly): Any day of the month, except 29th, 30th & 31st day of the month
Investment Objective: Refer Pg No from 41 to 42
Minimum Investment Amount: ` 5,000/- and any amount thereafter
Option Available: Growth, Dividend - Quarterly, Regular
Exit Load: In respect of each purchase of Units:
- For 10% of investment : Nil
- For remaining investment: 1% if redeemed/switched-out within 365 days from the date of allotment (w.e.f. 24th August 2017)
Performance Table
Scheme Name CAGR Returns (%) Current Value of Investment of ` 10,000
1 Year 3 Years 5 YearsSince InceptionFeb 25, 2010
1 Year 3 Years 5 YearsSince InceptionFeb 25, 2010
IDFC Monthly Income Plan 7.89% 7.84% 9.68% 9.57% 10,789 12,548 15,876 20,656
CRISIL Hybrid 85+15 - Conservative Index#
7.08% 8.57% 9.72% 8.97% 10,708 12,804 15,904 19,775
10 Year GOI## -2.43% 6.24% 6.36% 6.24% 9,757 11,995 13,616 16,166
Performance based on NAV as on 31/1/2018. Past performance may or may not be sustained in future.The performances given are of regular plan growth option.Regular and Direct Plans have different expense structure. Direct Plan shall have a lower expense ratio excluding distribution expenses, commission expenses etc.For other funds managed by the fund manager, please refer page no. 34 - 36 & the respective fund pages #Benchmark Returns. ##Alternate Benchmark Returns.£The above recurring expense ratio does not include Goods and Service Tax on Investment Management Fees, the proportionate charge in respect of sales beyond T-15 cities subject to maximum of 30 bps on daily net assets and borrowing costs, wherever applicable.
SIP PERFORMANCE
Monthly SIP of ` 10,000 in IDFC Monthly Income Plan - Regular Plan - Growth
1 Year 3 Years 5 Years 7 Years 10 YearsSince
InceptionFeb 25, 2010
Total Amount Invested (`) 1,20,000 3,60,000 6,00,000 8,40,000 NA 9,60,000
Total Value as on January 31, 2018 (`) 1,24,270 4,10,035 7,67,690 12,06,087 NA 14,44,107
Fund Returns (%) 6.65 8.63 9.79 10.16 NA 9.97
Total Value of CRISIL Hybrid 85+15 - Conservative Index# 1,23,724 4,11,710 7,70,588 11,93,231 NA 14,21,565
CRISIL Hybrid 85+15 - Conservative Index Returns (%)# 5.79 8.91 9.94 9.86 NA 9.59
Total Value of CRISIL 10 Year Gilt Index## 1,17,105 3,84,253 7,04,264 10,64,043 NA 12,55,887
CRISIL 10 Year Gilt Index Returns (%)## -4.43 4.28 6.34 6.65 NA 6.59
Past performance may or may not be sustained in future.Dividends are assumed to be reinvested and bonus is adjusted. Load is not taken into consideration. To illustrate the advantages of SIP investment, this is how your investment would have grown if you had invested say `10,000 systematically on the first business Day of every month over a period of time. Returns are calculated by using XIRR approach. XIRR helps in calculating return on investment given an initial and final value and a series of cash inflows and outflows with the correct allowance for the time impact of the transactions. Data as on 31st January 2018.
NAV (`)
Regular Plan Dividend 13.0547
Regular Plan Growth 20.6560
Regular Plan Quarterly Dividend 13.2969
Riskometer
Investors understand that their principal will be at Moderately High risk
This product is suitable for investors who are seeking*:
Capital appreciation and provide regular income •over a long period of time.Investment primarily in debt securities to •generate regular returns and investment of a portion of the Scheme’s assets in equity securities to generate long-term capital appreciation.
*Investors should consult their financial advisers if in doubt about whether the product is suitable for them.
PORTFOLIO
Name Rating % of NAV
Government Bond 48.50%
8.20% - 2022 G-Sec SOV 30.45%
8.15% - 2026 G-Sec SOV 12.14%
7.17% - 2028 G-Sec SOV 3.87%
8.33% - 2026 G-Sec SOV 2.04%
Corporate Bond 9.63%
IndusInd Bank AA 3.96%
Small Industries Dev Bank of India AAA 1.58%
HDFC Bank AAA 1.41%
Blue Dart Express AA 1.35%
NHPC AAA 1.34%
Equity and Equity related Instruments 24.42%
Banks 5.52%ICICI Bank 1.45%HDFC Bank 1.11%Kotak Mahindra Bank 0.98%
State Bank of India 0.59%
Axis Bank 0.56%
Punjab National Bank 0.30%
IndusInd Bank 0.28%
Bank of Baroda 0.26%
Software 1.70%
Infosys 0.58%
NIIT Technologies 0.47%
Tech Mahindra 0.34%
HCL Technologies 0.31%
Petroleum Products 1.63%Reliance Industries 1.06%
Indian Oil Corporation 0.30%
Bharat Petroleum Corporation 0.27%
Pharmaceuticals 1.63%Dishman Carbogen Amcis 0.77%
Natco Pharma 0.40%
Cadila Healthcare 0.23%
Aurobindo Pharma 0.22%
Sun Pharmaceutical Industries 0.00%
Auto 1.49%Maruti Suzuki India 1.27%
Tata Motors 0.22%
Consumer Non Durables 1.48%
Prataap Snacks 0.50%
Tata Coffee 0.42%
DCM Shriram 0.32%
Colgate Palmolive (India) 0.25%
Finance 1.25%
JM Financial 0.51%
Bajaj Finance 0.26%
Magma Fincorp 0.24%
GIC Housing Finance 0.23%
Construction 1.11%PSP Projects 1.11%
Oil 0.95%Oil & Natural Gas Corporation 0.95%
Name Rating % of NAV
Fertilisers 0.87%Coromandel International 0.87%
Auto Ancillaries 0.81%
MRF 0.54%
CEAT 0.27%
Industrial Products 0.78%
Schaeffler India 0.52%
INEOS Styrolution India 0.26%
Power 0.75%
Nava Bharat Ventures 0.32%
Power Grid Corporation of India 0.26%
PTC India 0.17%
Cement 0.70%
Deccan Cements 0.45%
Grasim Industries 0.25%
Construction Project 0.67%Larsen & Toubro 0.67%
Non - Ferrous Metals 0.57%
National Aluminium Company 0.29%
Hindalco Industries 0.28%
Transportation 0.41%
VRL Logistics 0.41%
Ferrous Metals 0.41%
Tata Steel 0.41%
Hotels, Resorts And Other Recreational Activities 0.40%
Taj GVK Hotels & Resorts 0.40%
Consumer Durables 0.36%
Mirza International 0.36%
Textile Products 0.35%
Dollar Industries 0.35%
Industrial Capital Goods 0.30%
Texmaco Rail & Engineering 0.30%
Gas 0.28%
Petronet LNG 0.28%
Net Cash and Cash Equivalent 17.44%
Grand Total 100.00%
Asset Quality
AA+
AAA Equivalent
7.69%
85.36%
AA6.96%
Top 10 Equity Holdings

19
IDFC Asset Allocation Fund of FundsAn Open Ended Fund of Funds Scheme
31st January 2018
FUND FEATURES
NAV (`)
Regular Plan Growth 20.0904Regular Plan Dividend 14.3579
IDFC Asset Allocation Fund - Conservative Plan
Nature: An Open - Ended Fund of Funds Scheme
Monthly Avg AUM: ` 23.92 Crores
Month end AUM: ` 23.95 Crores
Inception Date: 11 February 2010
Fund Manager: Mr. Bhavin Patadia (w.e.f. 29th May 2017)
Expense Ratio£
Regular 1.12% Direct 0.44%
Benchmark: CRISIL Hybrid 85+15 - Conservative Index
SIP (Minimum Amount) : `1,000/-
SIP Frequency : Monthly
SIP Dates (Monthly) Any day of the month, except 29th, 30th & 31st day of the month
Investment Objective: Refer Pg No from 41 to 42
Minimum Investment Amount : ` 5,000/- and any amount thereafter
Option Available : Growth, Dividend - (Payout, Reinvestment and Sweep)
Exit Load: 1.50% if redeemed before 18 months from the date of allotment.
FUND FEATURES FUND FEATURES
IDFC Asset Allocation Fund - Moderate Plan
Nature: An Open - Ended Fund of Funds Scheme
Monthly Avg AUM: ` 41.87 Crores
Month end AUM: ` 41.76 Crores
Inception Date: 11 February 2010
Fund Manager: Mr. Bhavin Patadia (w.e.f. 29th May 2017)
Expense Ratio£
Regular 1.24% Direct 0.65%
Benchmark: CRISIL Hybrid 85+15 - Conservative Index
SIP (Minimum Amount) : `1,000/-
SIP Frequency : Monthly
SIP Dates (Monthly) Any day of the month, except 29th, 30th & 31st day of the month
Investment Objective: Refer Pg No from 41 to 42
Minimum Investment Amount : ` 5,000/- and any amount thereafter
Option Available : Growth, Dividend - (Payout, Reinvestment and Sweep)
Exit Load: 1.50% if redeemed before 18 months from the date of allotment.
IDFC Asset Allocation Fund - Aggressive Plan
Nature: An Open - Ended Fund of Funds Scheme
Monthly Avg AUM: ` 20.68 Crores
Month end AUM: ` 20.47 Crores
Inception Date: 11 February 2010
Fund Manager: Mr. Bhavin Patadia (w.e.f. 29th May 2017)
Expense Ratio£
Regular 1.45% Direct 0.92%
Benchmark: CRISIL Hybrid 35+65 - Aggressive Index
SIP (Minimum Amount) : `1,000/-
SIP Frequency : Monthly
SIP Dates (Monthly) Any day of the month, except 29th, 30th & 31st day of the month
Investment Objective: Refer Pg No from 41 to 42
Minimum Investment Amount : ` 5,000/- and any amount thereafter
Option Available : Growth, Dividend - (Payout, Reinvestment and Sweep)
Exit Load: 1.50% if redeemed before 18 months from the date of allotment.
NAV (`)
Regular Plan Growth 21.9541Regular Plan Dividend 16.1584
NAV (`)
Regular Plan Growth 23.3460Regular Plan Dividend 17.1873
Riskometer
Investors understand that their principal will be at Moderately High risk
This product is suitable for investors who are seeking*:
Capital appreciation and provide regular income •over a long period of time.
Investment in different mutual fund schemes •primarily local funds based on a defined asset allocation model.
*Investors should consult their financial advisers if in doubt about whether the product is suitable for them.
Riskometer
Investors understand that their principal will be at Moderate risk
This product is suitable for investors who are seeking*:
Capital appreciation and provide regular income •over a long period of time.
Investment in different mutual fund schemes •primarily local funds based on a defined asset allocation model.
*Investors should consult their financial advisers if in doubt about whether the product is suitable for them.
Riskometer
Investors understand that their principal will be at Moderately High risk
This product is suitable for investors who are seeking*:
Capital appreciation and provide regular income •over a long period of time.
Investment in different mutual fund schemes •primarily local funds based on a defined asset allocation model
*Investors should consult their financial advisers if in doubt about whether the product is suitable for them.
PORTFOLIO
Name ConservativePlan
ModeratePlan
AggressivePlan
CBLO 0.42% - -
Clearing Corporation of India 0.42% - -
Gold - 5.24% 10.37%
Reliance ETF Gold BeES - 5.24% 10.37%
Debt 84.00% 64.66% 39.31%
IDFC Ultra Short Term Fund 41.96% 22.77% 7.87%
IDFC Super Saver Income Fund - Short Term 21.01% 21.11% 15.88%
HDFC Gilt Fund - Short Term Plan 6.97% 6.89% 5.16%
SBI Magnum Gilt Fund - Short Term Plan 7.05% 6.97% 5.21%
ICICI Prudential Short Term Gilt Fund 7.00% 6.92% 5.20%
Equity 15.09% 30.04% 50.19%
IDFC Classic Equity Fund 3.08% 4.38% 7.97%
IDFC Sterling Equity Fund - 1.73% 3.12%
Reliance Growth Fund 3.00% 4.16% 7.77%
HDFC Capital Builder Fund 3.11% 4.38% 8.11%
HDFC Top 200 Fund 2.94% 5.11% 9.27%
Aditya Birla Sun Life Top 100 Fund 2.91% 5.06% 9.24%
Kotak Emerging Equity Scheme - 1.53% 2.85%
IDFC Nifty ETF 0.06% 3.69% 1.86%
Net Current Asset 0.49% 0.05% 0.13%
Grand Total 100.00% 100.00% 100.00%
PORTFOLIO FUND FEATURES
Standard Allocation % to net assets
Standard MatrixConservative
Plan
Moderate
Plan
Aggressive
Plan
Equity (Including Offshore
Equity) Fund10-15% 25-30% 45-50%
Debt Fund(Including Liquid
funds)0-90% 0-70% 0-45%
Alternate (Including Gold/
Commodity Equity Funds)0% 5-10% 10-15%
Money Market Securities 0-15% 0-15% 0-15%
(w.e.f. 07 Dec, 2011)
FUND FEATURES

20
Performance Table
Scheme Name CAGR Returns (%) Current Value of Investment of ` 10,000
1 Year 3 Years 5 Years Since Inception 1 Year 3 Years 5 Years Since Inception
IDFC Asset Allocation Fund - CP - Regular Plan - Growth* 9.50% 8.16% 9.90% 9.14% 10,950 12,659 16,033 20,090
CRISIL Hybrid 85+15 - Conservative Index# 7.08% 8.57% 9.72% 8.95% 10,708 12,804 15,904 19,807
CRISIL 10 Year Gilt Index## -2.43% 6.24% 6.36% 6.28% 9,757 11,995 13,616 16,255
*Since Inception Regular Plan - Growth Feb 11, 2010.
Performance Table
Scheme Name CAGR Returns (%) Current Value of Investment of ` 10,000
1 Year 3 Years 5 Years Since Inception 1 Year 3 Years 5 Years Since Inception
IDFC Asset Allocation Fund - MP - Regular Plan - Growth* 13.14% 8.59% 10.87% 10.36% 11,314 12,811 16,759 21,954
CRISIL Hybrid 85+15 - Conservative Index# 7.08% 8.57% 9.72% 8.95% 10,708 12,804 15,904 19,807
CRISIL 10 Year Gilt Index## -2.43% 6.24% 6.36% 6.28% 9,757 11,995 13,616 16,255
*Since Inception Regular Plan - Growth Feb 11, 2010.
Performance Table
Scheme Name CAGR Returns (%) Current Value of Investment of ` 10,000
1 Year 3 Years 5 Years Since Inception 1 Year 3 Years 5 Years Since Inception
IDFC Asset Allocation Fund - AP - Regular Plan - Growth* 18.88% 8.97% 12.10% 11.22% 11,888 12,944 17,711 23,346
CRISIL Hybrid 35+65 - Aggressive Index# 21.04% 10.27% 13.53% 11.47% 12,104 13,415 18,871 23,776
CRISIL 10 Year Gilt Index## -2.43% 6.24% 6.36% 6.28% 9,757 11,995 13,616 16,255
Performance based on NAV as on 31/1/2018. Past performance may or may not be sustained in future.The performances given are of regular plan growth option.Regular and Direct Plans have different expense structure. Direct Plan shall have a lower expense ratio excluding distribution expenses, commission expenses etc.For other funds managed by the fund manager, please refer page no. 34 - 36 & the respective fund pages. #Benchmark Returns. ##Alternate Benchmark Returns.*Since Inception Regular Plan - Growth Feb 11, 2010.£The above recurring expense ratio does not include Goods and Service Tax on Investment Management Fees, the proportionate charge in respect of sales beyond T-15 cities subject to maximum of 30 bps on daily net assets and borrowing costs, wherever applicable.
IDFC Asset Allocation Fund of FundsAn Open Ended Fund of Funds Scheme
31st January 2018
IDFC All Season Bond FundAn Open Ended Fund of Fund Scheme
31st January 2018
FUND FEATURES
About the Fund: All Seasons Bond Fund is a Fund of Fund (FOF) structure which can invest in one or more funds within our basket of short term offerings currently. The portfolio gives the fund manager the flexibility to play between debt and money market, benefiting from the accrual available in its space and optimizing the portfolio yields.
Nature: Fund of Fund | Monthly Avg AUM: ` 171.75 Crores | Month end AUM: ` 171.01 Crores
Inception Date: 13 September 2004 | Fund Manager: Mr. Harshal Joshi (w.e.f 15th July 2016)
Other Parameter Asset Quality Expense Ratio£
Standard Deviation (Annualized) 1.30% AAA Equivalent 94.35% Regular 0.74%
Modified Duration 2.51 years AA+ 3.48% Direct 0.30%
Average Maturity 3.26 years AA 2.16%
Yield to Maturity 7.74%
Benchmark: CRISIL Short Term Bond Fund Index (w.e.f. 30th November 2015) | SIP (Minimum Amount): ` 1,000/- | SIP Frequency: Monthly
SIP Dates (Monthly): Any day of the month, except 29th, 30th & 31st day of the month | Investment Objective: Refer Pg No from 41 to 42
Minimum Investment Amount: ` 5,000/- and any amount thereafter | Option Available: Growth, Dividend - Daily, Weekly, Fortnightly, Quarterly, Half Yearly, Annual & Periodic
Exit Load: 0.50% if redeemed or switched before 3 months (w.e.f. 09th October 2013)
NAV (`)
Plan Option Freq NAVRegular Plan Growth - 26.4352Regular Plan Dividend Quarterly 12.3097Regular Plan Dividend Half Yearly 11.6718Regular Plan Dividend Annual 11.9409Regular Plan Dividend Fortnightly 11.0003Regular Plan Dividend Daily 10.9806Regular Plan Dividend Weekly 10.9647Regular Plan Dividend Periodic 13.0705
PORTFOLIO
Name % of NAV
Mutual Fund Units 100.00%
IDFC Money Manager Fund – Investment Plan 77.97%
IDFC Government Securities Fund – Short Term Plan 21.71%
IDFC Super Saver Income Fund – Short Term 0.33%
Net Cash and Cash Equivalent 0.0002%
Grand Total 100.00%
Riskometer
Investors understand that their principal will be at Moderately Low Risk
This product is suitable for investors who are seeking*:
To generate short term optimal returns •with high liquidity.Investment predominantly in debt •oriented mutual fund schemes and money market instruments
*Investors should consult their financial advisers if in doubt about whether the product is suitable for them.
Performance TableScheme Name CAGR Returns (%) Current Value of Investment of ` 10,000
1 Year 3 Years 5 Years Since Inception 1 Year 3 Years 5 Years Since InceptionIDFC All Seasons Bond Fund - Regular Plan - Growth* 5.15% 7.39% 8.20% 7.53% 10,515 12,391 14,836 26,435CRISIL Short Term Bond Fund Index# 5.38% 7.88% 8.53% 7.48% 10,538 12,562 15,062 26,285CRISIL 1 Year T-Bill## 5.65% 6.97% 7.05% 6.07% 10,565 12,246 14,058 22,007
Performance based on NAV as on 31/1/2018. Past performance may or may not be sustained in future.The performances given are of regular plan growth option.Regular and Direct Plans have different expense structure. Direct Plan shall have a lower expense ratio excluding distribution expenses, commission expenses etc.For other funds managed by the fund manager, please refer page no. 34 - 36 & the respective fund pages. #Benchmark Returns. ##Alternate Benchmark Returns. *Since Inception Regular Plan - Growth Sep 13, 2004.£The above recurring expense ratio does not include Goods and Service Tax on Investment Management Fees, the proportionate charge in respect of sales beyond T-15 cities subject to maximum of 30 bps on daily net assets and borrowing costs, wherever applicable.

21
IDFC Cash FundAn Open Ended Liquid Fund
31st January 2018
FUND FEATURES PORTFOLIO
About the Fund: The Fund aims to invest in high quality debt and money market instruments with high liquidity and seeks to generate accrual income with low volatility.
Nature: Liquid Fund
Monthly Avg AUM: ` 13,634.81 Crores
Month end AUM: ` 11733.86 Crores
Inception Date: 2 July 2001
Fund Manager: Mr. Harshal Joshi (w.e.f. 15th September 2015) & Mr. Anurag Mittal (w.e.f. 09th November 2015)
Other Parameter:
Standard Deviation (Annualized) 0.11%
Modified Duration 30 days
Average Maturity 30 days
Yield to Maturity 6.47%
Expense Ratio£
Regular 0.20%
Direct 0.12%
Benchmark: CRISIL Liquid Fund Index
SIP (Minimum Amount): ` 100/-
SIP Frequency: Monthly
SIP Dates (Monthly): Any day of the month, except 29th, 30th & 31st day of the month
Investment Objective: Refer Pg No from 41 to 42
Minimum Investment Amount: ` 100/- and any amount thereafter
Option Available: Growth, Dividend - Daily, Weekly, Monthly & Periodic
Exit Load: Nil
NAV (`)
Plan Option Freq NAV
Regular Plan Growth - 2078.9789
Regular Plan Dividend Daily 1001.0846
Regular Plan Dividend Weekly 1002.1599
Regular Plan Dividend Periodic 1370.9507
Regular Plan Dividend Monthly 1000.5193
Name Rating % of NAV
Commercial Paper 63.51%
NABARD A1+ 8.90%
Vedanta A1+ 4.75%
Shriram Transport Finance Company A1+ 4.66%
Reliance Industries A1+ 4.23%
Indiabulls Housing Finance A1+ 3.83%
L&T Finance Holdings A1+ 2.55%
India Infoline Finance A1+ 2.55%
Adani Ports and Special Economic Zone A1+ 2.55%
Export Import Bank of India A1+ 2.55%
Piramal Enterprises A1+ 2.54%
SBI Cards & Payment Services Pvt A1+ 2.13%
Reliance Retail Ltd A1+ 1.70%
India Infoline Housing Finance A1+ 1.70%
M&M Financial Services A1+ 1.70%
Tata Motors Finance A1+ 1.69%
PNB Housing Finance A1+ 1.69%
L&T Finance A1+ 1.69%
Tata Capital Financial Services A1+ 1.28%
JM Financial Services A1+ 1.27%
Dewan Housing Finance Corporation A1+ 1.27%
GRUH Finance A1+ 1.27%
L & T Housing Finance A1+ 0.85%
JM Financial A1+ 0.85%
Cholamandalam Invt and Fin Co A1+ 0.85%
Performance TableScheme Name CAGR Returns (%) Current Value of Investment of ` 10,000
1 Year 3 Years 5 YearsSince
Inception1 Year 3 Years 5 Years
SinceInception
IDFC Cash Fund - Regular Plan - Growth*
6.60% 7.46% 8.12% 7.87% 10,660 12,413 14,781 20,790
Crisil Liquid Fund Index# 6.68% 7.39% 8.10% 7.55% 10,668 12,391 14,761 20,212
1 Year T-Bill## 5.65% 6.97% 7.05% 6.44% 10,565 12,246 14,058 18,273
Performance based on NAV as on 31/1/2018. Past performance may or may not be sustained in future.The performances given are of regular plan growth option.Regular and Direct Plans have different expense structure. Direct Plan shall have a lower expense ratio excluding distribution expenses, commission expenses etc.For other funds managed by the fund manager, please refer page no. 34 - 36 & the respective fund pages #Benchmark Returns. ##Alternate Benchmark Returns. Standard Deviation calculated on the basis of 1 year history of monthly data *Since Inception Regular Plan - Growth Jun 04, 2008. £The above recurring expense ratio does not include Goods and Service Tax on Investment Management Fees, the proportionate charge in respect of sales beyond T-15 cities subject to maximum of 30 bps on daily net assets and borrowing costs, wherever applicable.
Riskometer
Investors understand that their principal will be at Low Risk
This product is suitable for investors who are seeking*:
To generate short term optimal returns with •high liquidity.Investments in high quality money market and •debt instruments
*Investors should consult their financial advisers if in doubt about whether the product is suitable for them.
Maturity Bucket Asset Quality
AAA Equivalent100.00%
Name Rating % of NAV
Shriram City Union Finance A1+ 0.85%
Tata Housing Development Company A1+ 0.85%
Kotak Securities A1+ 0.84%
The Ramco Cements A1+ 0.64%
JM Financial Products A1+ 0.43%
JM Financial Credit Solution A1+ 0.43%
Julius Baer Capital India Pvt A1+ 0.42%
Certificate of Deposit 27.02%
Axis Bank A1+ 8.60%
ICICI Bank A1+ 7.64%
Punjab National Bank A1+ 5.08%
The Federal Bank A1+ 4.00%
Yes Bank A1+ 1.70%
Treasury Bill 14.05%
91 Days Tbill - 2018 SOV 10.66%
329 Days Tbill - 2018 SOV 2.54%
317 Days Tbill - 2018 SOV 0.85%
Corporate Bond 2.26%
Kotak Mahindra Prime AAA 1.83%
Indiabulls Housing Finance AAA 0.43%
Zero Coupon Bond 1.15%
Kotak Mahindra Prime AAA 0.93%
M&M Financial Services AAA 0.21%
Net Cash and Cash Equivalent -7.99%
Grand Total 100.00%

22
IDFC Ultra Short Term FundAn Open Ended Income Fund
31st January 2018
FUND FEATURES PORTFOLIO
About the Fund: The Fund aims to invest in high quality debt and money market instruments and seeks to generate returns predominantly through accrual income.
Nature: Income Fund
Monthly Avg AUM: ` 5,215.58 Crores
Month end AUM: ` 4881.20 Crores
Inception Date: 17 January 2006
Fund Manager: Mr. Anurag Mittal (w.e.f. 09th November 2015)
Other Parameter:
Standard Deviation (Annualized) 0.45%
Modified Duration 249 days
Average Maturity 284 days
Yield to Maturity 7.50%
Expense Ratio£
Regular 0.36%
Direct 0.21%
Benchmark: CRISIL Liquid Fund Index
SIP (Minimum Amount): ` 100/-
SIP Frequency: Monthly
SIP Dates (Monthly): Any day of the month, except 29th, 30th & 31st day of the month
Investment Objective: Refer Pg No from 41 to 42
Minimum Investment Amount: ` 100/- and any amount thereafter
Option Available: Growth, Dividend - Daily, Weekly, Monthly, Quarterly & Periodic
Exit Load: Nil (Since 29th June 2012)
NAV (`)
Plan Option Freq NAV
Regular Plan Growth - 24.2853
Regular Plan Dividend Daily 10.0712
Regular Plan Dividend Periodic 13.1129
Regular Plan Dividend Weekly 10.1026
Regular Plan Dividend Monthly 10.1048
Regular Plan Dividend Quarterly 10.6956
Name Rating % of NAV
Corporate Bond 53.45%
M&M Financial Services AAA 5.00%
Tata Capital Financial Services AA+ 4.47%
Indiabulls Housing Finance AAA 4.33%
HDFC AAA 4.09%
L & T Housing Finance AA+ 3.54%
Kotak Mahindra Prime AAA 2.96%
Power Finance Corporation AAA 2.77%
Small Industries Dev Bank of India AAA 2.39%
GRUH Finance AAA 2.24%
Tata Housing Development Company AA 2.23%
Citicorp Finance India AAA 2.05%
Cholamandalam Invt and Fin Co AA+ 2.03%
Cholamandalam Invt and Fin Co AA 1.74%
LIC Housing Finance AAA 1.64%
NABARD AAA 1.56%
Rural Electrification Corporation AAA 1.54%
JM Financial Products AA 1.53%
Bajaj Finance AAA 1.34%
L & T Infrastructure Finance Company AA+ 1.03%
Kotak Mahindra Investments AAA 1.02%
Mahindra Rural Housing Finance AA+ 1.02%
JM Financial Credit Solution AA 0.81%
L&T Finance AA+ 0.51%
Sundaram BNP Paribas Home Finance AA+ 0.51%
Power Grid Corporation of India AAA 0.41%
Export Import Bank of India AAA 0.27%
Performance TableScheme Name CAGR Returns (%) Current Value of Investment of ` 10,000
1 Year 3 Years 5 YearsSince
Inception1 Year 3 Years 5 Years
SinceInception
IDFC Ultra Short Term Fund - Regular Plan - Growth*
6.71% 8.04% 8.60% 7.64% 10,671 12,617 15,111 24,285
Crisil Liquid Fund Index 6.68% 7.39% 8.10% 7.42% 10,668 12,391 14,761 23,697
1 Year T-Billl## 5.65% 6.97% 7.05% 6.25% 10,565 12,246 14,058 20,755
Performance based on NAV as on 31/1/2018. Past performance may or may not be sustained in future.The performances given are of regular plan growth option.Regular and Direct Plans have different expense structure. Direct Plan shall have a lower expense ratio excluding distribution expenses, commission expenses etc.For other funds managed by the fund manager, please refer page no. 34 - 36 & the respective fund pages #Benchmark Returns. ##Alternate Benchmark Returns. Standard Deviation calculated on the basis of 1 year history of monthly data *Since Inception Regular Plan - Growth Jan 17, 2006. £The above recurring expense ratio does not include Goods and Service Tax on Investment Management Fees, the proportionate charge in respect of sales beyond T-15 cities subject to maximum of 30 bps on daily net assets and borrowing costs, wherever applicable.
Riskometer
Investors understand that their principal will be at Moderately Low Risk
This product is suitable for investors who are seeking*:
To generate short term stable returns with a low •risk strategy.Investments in good quality debt and money •market instruments such that the fund will offer a blend of liquidity with stability of returns.
*Investors should consult their financial advisers if in doubt about whether the product is suitable for them.
Name Rating % of NAV
Indian Railway Finance Corporation AAA 0.21%
NHPC AAA 0.21%
Certificate of Deposit 20.31%
IndusInd Bank A1+ 7.63%
Axis Bank A1+ 5.73%
Kotak Mahindra Bank A1+ 4.00%
ICICI Bank A1+ 2.95%
Commercial Paper 13.23%
Shapoorji Pallonji and Company Pvt A1+ 4.64%
Tata Housing Development Company A1+ 4.07%
TATA Realty & Infrastructure A1+ 2.04%
Trapti Trading & Invest Pvt A1+ 1.00%
TGS Investment & Trade Pvt A1+ 0.99%
Power Finance Corporation A1+ 0.49%
State Government Bond 5.26%
8.39% Rajasthan UDAY BOND - 2018 SOV 3.81%
7.86% Rajasthan UDAY BOND - 2019 SOV 0.72%
8.21% Haryana UDAY BOND - 2023 SOV 0.52%
7.67% Tamilnadu UDAY BOND - 2023 SOV 0.21%
Government Bond 1.37%
8.15% - 2022 G-Sec SOV 0.74%
8.20% - 2022 G-Sec SOV 0.63%
Zero Coupon Bond 0.47%
Kotak Mahindra Prime AAA 0.47%
Treasury Bill 0.13%
91 Days Tbill (MD 01/03/2018) SOV 0.13%
Net Cash and Cash Equivalent 5.78%
Grand Total 100.00%
Asset Quality
AA+13.11%
AA6.31%
AAA Equivalent80.58%
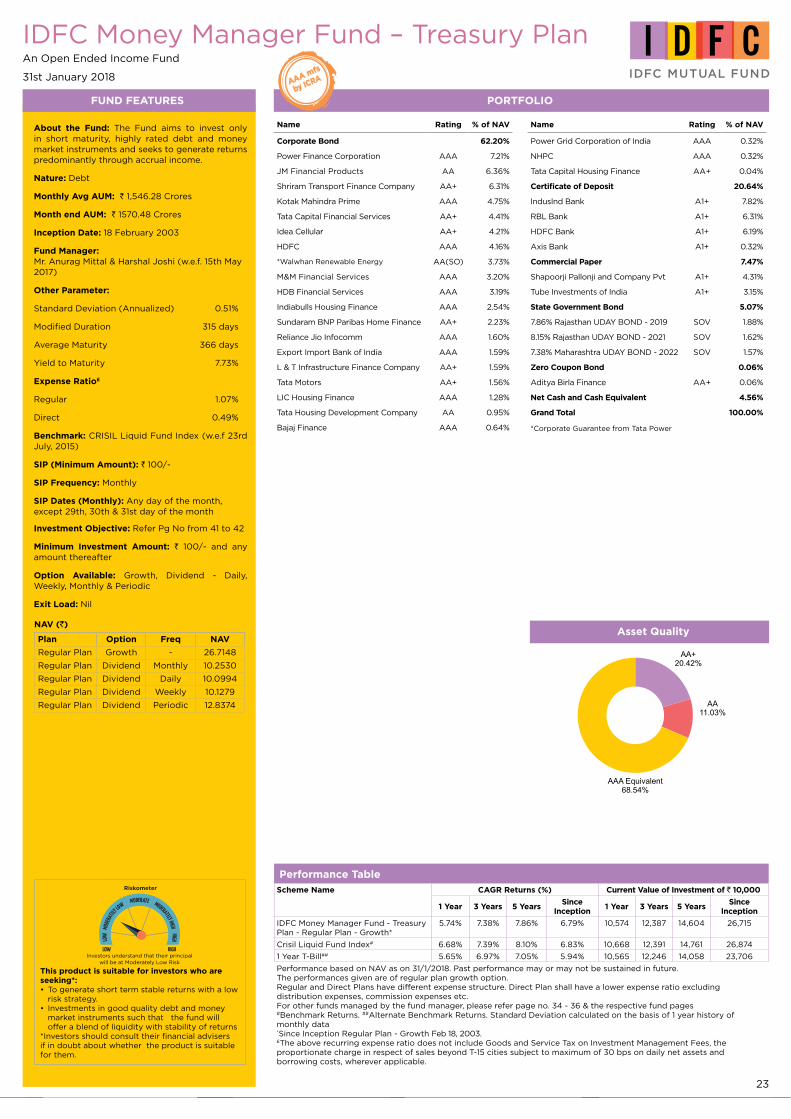
23
IDFC Money Manager Fund – Treasury PlanAn Open Ended Income Fund
31st January 2018
FUND FEATURES PORTFOLIO
About the Fund: The Fund aims to invest only in short maturity, highly rated debt and money market instruments and seeks to generate returns predominantly through accrual income.
Nature: Debt
Monthly Avg AUM: ` 1,546.28 Crores
Month end AUM: ` 1570.48 Crores
Inception Date: 18 February 2003
Fund Manager: Mr. Anurag Mittal & Harshal Joshi (w.e.f. 15th May 2017)
Other Parameter:
Standard Deviation (Annualized) 0.51%
Modified Duration 315 days
Average Maturity 366 days
Yield to Maturity 7.73%
Expense Ratio£
Regular 1.07%
Direct 0.49%
Benchmark: CRISIL Liquid Fund Index (w.e.f 23rd July, 2015)
SIP (Minimum Amount): ` 100/-
SIP Frequency: Monthly
SIP Dates (Monthly): Any day of the month, except 29th, 30th & 31st day of the month
Investment Objective: Refer Pg No from 41 to 42
Minimum Investment Amount: ` 100/- and any amount thereafter
Option Available: Growth, Dividend - Daily, Weekly, Monthly & Periodic
Exit Load: Nil
NAV (`)
Plan Option Freq NAV
Regular Plan Growth - 26.7148
Regular Plan Dividend Monthly 10.2530
Regular Plan Dividend Daily 10.0994
Regular Plan Dividend Weekly 10.1279
Regular Plan Dividend Periodic 12.8374
Name Rating % of NAV
Corporate Bond 62.20%
Power Finance Corporation AAA 7.21%
JM Financial Products AA 6.36%
Shriram Transport Finance Company AA+ 6.31%
Kotak Mahindra Prime AAA 4.75%
Tata Capital Financial Services AA+ 4.41%
Idea Cellular AA+ 4.21%
HDFC AAA 4.16%
*Walwhan Renewable Energy AA(SO) 3.73%
M&M Financial Services AAA 3.20%
HDB Financial Services AAA 3.19%
Indiabulls Housing Finance AAA 2.54%
Sundaram BNP Paribas Home Finance AA+ 2.23%
Reliance Jio Infocomm AAA 1.60%
Export Import Bank of India AAA 1.59%
L & T Infrastructure Finance Company AA+ 1.59%
Tata Motors AA+ 1.56%
LIC Housing Finance AAA 1.28%
Tata Housing Development Company AA 0.95%
Bajaj Finance AAA 0.64%
Performance TableScheme Name CAGR Returns (%) Current Value of Investment of ` 10,000
1 Year 3 Years 5 YearsSince
Inception1 Year 3 Years 5 Years
SinceInception
IDFC Money Manager Fund - Treasury Plan - Regular Plan - Growth*
5.74% 7.38% 7.86% 6.79% 10,574 12,387 14,604 26,715
Crisil Liquid Fund Index# 6.68% 7.39% 8.10% 6.83% 10,668 12,391 14,761 26,874
1 Year T-Bill## 5.65% 6.97% 7.05% 5.94% 10,565 12,246 14,058 23,706
Performance based on NAV as on 31/1/2018. Past performance may or may not be sustained in future.The performances given are of regular plan growth option.Regular and Direct Plans have different expense structure. Direct Plan shall have a lower expense ratio excluding distribution expenses, commission expenses etc.For other funds managed by the fund manager, please refer page no. 34 - 36 & the respective fund pages #Benchmark Returns. ##Alternate Benchmark Returns. Standard Deviation calculated on the basis of 1 year history of monthly data*Since Inception Regular Plan - Growth Feb 18, 2003. £The above recurring expense ratio does not include Goods and Service Tax on Investment Management Fees, the proportionate charge in respect of sales beyond T-15 cities subject to maximum of 30 bps on daily net assets and borrowing costs, wherever applicable.
Riskometer
Investors understand that their principal will be at Moderately Low Risk
This product is suitable for investors who are seeking*:
To generate short term stable returns with a low •risk strategy.Investments in good quality debt and money •market instruments such that the fund will offer a blend of liquidity with stability of returns
*Investors should consult their financial advisers if in doubt about whether the product is suitable for them.
Name Rating % of NAV
Power Grid Corporation of India AAA 0.32%
NHPC AAA 0.32%
Tata Capital Housing Finance AA+ 0.04%
Certificate of Deposit 20.64%
IndusInd Bank A1+ 7.82%
RBL Bank A1+ 6.31%
HDFC Bank A1+ 6.19%
Axis Bank A1+ 0.32%
Commercial Paper 7.47%
Shapoorji Pallonji and Company Pvt A1+ 4.31%
Tube Investments of India A1+ 3.15%
State Government Bond 5.07%
7.86% Rajasthan UDAY BOND - 2019 SOV 1.88%
8.15% Rajasthan UDAY BOND - 2021 SOV 1.62%
7.38% Maharashtra UDAY BOND - 2022 SOV 1.57%
Zero Coupon Bond 0.06%
Aditya Birla Finance AA+ 0.06%
Net Cash and Cash Equivalent 4.56%
Grand Total 100.00%
Maturity Bucket Asset Quality
AA+20.42%
AA11.03%
AAA Equivalent68.54%
*Corporate Guarantee from Tata Power

24
IDFC Money Manager Fund – Investment PlanAn Open Ended Income Fund
31st January 2018
FUND FEATURES PORTFOLIO
About the Fund: The Fund will invest in high quality money market and debt instruments and will be positioned in the short term category
Nature: Debt
Monthly Avg AUM: ` 1,773.26 Crores
Month end AUM: ` 1776.27 Crores
Inception Date: 9 August 2004
Fund Manager: Mr. Harshal Joshi (w.e.f. 15th September 2015)
Other Parameter:
Standard Deviation (Annualized) 1.21%
Modified Duration 2.58 years
Average Maturity 3.35 years
Yield to Maturity 7.90%
Expense Ratio£
Regular 0.50%
Direct 0.26%
Benchmark: CRISIL AAA Short Term Index (w.e.f. 26th September 2016)
SIP (Minimum Amount): ` 1000/-
SIP Frequency: Monthly
SIP Dates (Monthly): Any day of the month, except 29th, 30th & 31st day of the month
Investment Objective: Refer Pg No from 41 to 42
Minimum Investment Amount: ` 5,000/- and any amount thereafter
Option Available: Growth, Dividend - Daily, Weekly, Monthly, Quarterly, Annual & Periodic
Exit Load: Nil (w.e.f June 22nd, 2017)
NAV (`)
Plan Option Freq NAVRegular Plan Growth - 26.5370Regular Plan Dividend Monthly 10.2448Regular Plan Dividend Daily 10.1564Regular Plan Dividend Weekly 10.1929Regular Plan Dividend Quarterly 10.8653Regular Plan Dividend Periodic 12.9202Regular Plan Dividend Annual 10.5857
Name Rating % of NAV
Corporate Bond 49.95%HDFC AAA 11.34%LIC Housing Finance AAA 7.64%Power Finance Corporation AAA 6.18%Kotak Mahindra Prime AAA 5.87%Cholamandalam Invt and Fin Co AA 4.47%Export Import Bank of India AAA 4.39%M&M Financial Services AAA 3.91%L & T Housing Finance AA+ 2.78%Reliance Jio Infocomm AAA 1.42%NABARD AAA 1.11%Bajaj Finance AAA 0.56%Rural Electrification Corporation AAA 0.29%State Government Bond 28.61%7.42% Maharashtra SDL - 2022 SOV 5.86%8.62% Tamil Nadu SDL - 2023 SOV 2.91%8.63% Tamilnadu SDL - 2023 SOV 2.91%8.56% Tamilnadu SDL - 2023 SOV 2.65%8.15% Rajasthan UDAY BOND - 2021 SOV 2.29%8.64% Haryana SDL - 2023 SOV 1.46%8.66% Tamilnadu SDL - 2022 SOV 1.45%8.39% Rajasthan UDAY BOND - 2023 SOV 1.44%8.21% Rajasthan UDAY BOND - 2023 SOV 1.43%8.72% Andhra Pradesh SDL- 2023 SOV 1.17%8.21% Haryana UDAY BOND - 2022 SOV 1.14%8.65% Karnataka SDL - 2023 SOV 0.87%7.95% Tamil Nadu SDL - 2023 SOV 0.85%7.67% Tamilnadu UDAY BOND - 2023 SOV 0.69%7.95% Maharastra SDL - 2023 SOV 0.57%8.92% Karnatka SDL - 2022 SOV 0.29%8.66% Haryana SDL - 2023 SOV 0.29%7.71% Tamilnadu UDAY SDL - 2023 SOV 0.28%7.77% Gujarat SDL - 2023 SOV 0.06%Government Bond 14.52%8.20% - 2025 G-Sec SOV 4.07%8.83% - 2023 G-Sec SOV 3.89%8.15% - 2026 G-Sec SOV 3.18%8.33% - 2026 G-Sec SOV 2.63%8.20% - 2022 G-Sec SOV 0.75%Commercial Paper 0.03%Bajaj Finance A1+ 0.03%Net Cash and Cash Equivalent 6.89%Grand Total 100.00%
Performance TableScheme Name CAGR Returns (%) Current Value of Investment of ` 10,000
1 Year 3 Years 5 YearsSince
Inception1 Year 3 Years 5 Years
SinceInception
IDFC Money Manager Fund – Investment Plan - Regular Plan - Growth*
5.00% 7.58% 8.09% 7.50% 10,500 12,455 14,761 26,537
CRISIL AAA Short Term Bond Index# 6.23% 8.04% 8.58% 8.21% 10,623 12,618 15,095 29,003
CRISIL 1 Year T-Bill## 5.65% 6.97% 7.05% 6.04% 10,565 12,246 14,058 22,056
Performance based on NAV as on 31/1/2018. Past performance may or may not be sustained in future. The performances given are of regular plan growth option. Regular and Direct Plans have different expense structure. Direct Plan shall have a lower expense ratio excluding distribution expenses, commission expenses etc. For other funds managed by the fund manager, please refer page no. 34 - 36 & the respective fund pages #Benchmark Returns. ##Alternate Benchmark Returns. Standard Deviation calculated on the basis of 1 year history of monthly data *Since Inception Regular Plan - Growth Aug 09, 2004. £The above recurring expense ratio does not include Goods and Service Tax on Investment Management Fees, the proportionate charge in respect of sales beyond T-15 cities subject to maximum of 30 bps on daily net assets and borrowing costs, wherever applicable.
Riskometer
Investors understand that their principal will be at Moderately Low Risk
This product is suitable for investors who are seeking*:
To generate short term stable returns with a low •risk strategy.Investments in good quality fixed income & •Money Market securities
*Investors should consult their financial advisers if in doubt about whether the product is suitable for them.
Asset Quality
AA+2.78% AA
4.47%
AAA Equivalent92.76%

25
IDFC Banking & PSU Debt Fund (The Fund (erstwhile IDFC Banking Debt Fund) has been repositioned with effect from June 12, 2017$$)An Open Ended Income Fund31st January 2018
FUND FEATURES PORTFOLIO
About the Fund: The Fund will predominantly invest in high quality money market and debt instruments of Banks, PSU and PFI.
Nature: Debt
Monthly Avg AUM: ` 947.50 Crores
Month end AUM: ` 948.60 Crores
Inception Date: 7 March 2013
Fund Manager: Mr. Anurag Mittal (w.e.f. 15th May 2017)
Other Parameter:
Standard Deviation (Annualized) 0.97%
Modified Duration 1.92 years
Average Maturity 2.34 years
Yield to Maturity 7.83%
Expense Ratio£
Regular 0.46%
Direct 0.20%
Benchmark: Crisil Short Term Bond Fund Index (w.e.f. 12th June 2017)
SIP (Minimum Amount): ` 1000/-
SIP Frequency: Monthly
SIP Dates (Monthly): Any day of the month, except 29th, 30th & 31st day of the month
Investment Objective: Refer Pg No from 41 to 42
Minimum Investment Amount: ` 5,000/- and any amount thereafter
Option Available: Growth, Dividend - Daily, Fortnightly, Monthly (Reinvestment), Quarterly (Payout), Annual (Payout) & Periodic
Exit Load: Nil (w.e.f. June 12th 2017)
NAV (`)
Plan Option Freq NAVRegular Plan Growth - 14.5379Regular Plan Dividend - 10.5757Regular Plan Dividend Fortnightly 10.1932Regular Plan Dividend Daily 10.0973Regular Plan Dividend Monthly 10.1567Regular Plan Dividend Quarterly 10.5343Regular Plan Dividend Annual -
Name Rating % of NAV
Corporate Bond 80.79%
Power Finance Corporation AAA 11.03%
Indian Railway Finance Corporation AAA 11.02%
Axis Bank AA+ 10.10%
NABARD AAA 9.96%
Small Industries Dev Bank of India AAA 9.92%
Power Grid Corporation of India AAA 9.64%
Rural Electrification Corporation AAA 7.50%
ICICI Bank AA+ 4.77%
IndusInd Bank AA 3.70%
Export Import Bank of India AAA 2.61%
State Bank of India AA+ 0.53%
Government Bond 6.52%
8.20% - 2022 G-Sec SOV 5.43%
8.15% - 2022 G-Sec SOV 1.09%
State Government Bond 2.72%8.6% Madhya Pradesh SDL - 2023 SOV 1.63%
8.56% Tamilnadu SDL - 2023 SOV 1.09%
Certificate of Deposit 0.52%ICICI Bank A1+ 0.52%
Net Cash and Cash Equivalent 9.45%
Grand Total 100.00%
Performance TableScheme Name CAGR Returns (%) Current Value of Investment of ` 10,000
1 Year 3 Years 5 YearsSince
Inception1 Year 3 Years 5 Years
SinceInception
IDFC Banking & PSU Debt Fund - Regular Plan - Growth*
5.38% 7.23% NA 7.92% 10,538 12,334 NA 14,538
Crisil Short Term Bond Fund Index# 5.34% 6.94% NA 7.81% 10,534 12,236 NA 14,465
1 Year T-Bill## 5.65% 6.97% NA 7.06% 10,565 12,246 NA 13,978
The scheme has been in existence for more than 3 years but less than 5 years.Current Index performance adjusted for the period from since inception to June 12, 2017 with the performance of Crisil Short Term Bond Fund Index (Benchmark) & 1 Year T-Bill (Alternate Benchmark)Performance based on NAV as on 31/1/2018. Past performance may or may not be sustained in future.The performances given are of regular plan growth option.Regular and Direct Plans have different expense structure. Direct Plan shall have a lower expense ratio excluding distribution expenses, commission expenses etc.For other funds managed by the fund manager, please refer page no. 34 - 36 & the respective fund pages #Benchmark Returns. ##Alternate Benchmark Returns. Current Index performance adjusted for the period from since inception to June 12, 2017 with the performance of CRISIL Liquid Fund Index (Benchmark)Standard Deviation calculated on the basis of 1 year history of monthly data *Since Inception Regular Plan - Growth Mar 07, 2013. $$ For details please refer Notice (https://www.idfcmf.com/uploads/090520171306No-18-Change-in-Scheme-features-of-IDFC-Banking-Debt-Fund.pdf) £The above recurring expense ratio does not include Goods and Service Tax on Investment Management Fees, the proportionate charge in respect of sales beyond T-15 cities subject to maximum of 30 bps on daily net assets and borrowing costs, wherever applicable.
Riskometer
Investors understand that their principal will be at Moderately Risk
This product is suitable for investors who are seeking*:
Income over short to medium term• A debt fund that invests predominantly in debt & •money market instruments issued by PSU, Banks & PFI
*Investors should consult their financial advisers if in doubt about whether the product is suitable for them.
Asset Quality
AA+15.40%
AAA Equivalent80.89%
AA3.70%

26
IDFC Super Saver Income Fund – Short TermAn Open Ended Income Fund
31st January 2018
FUND FEATURES PORTFOLIO
About the Fund: A Short Term Income Fund, the portfolio is mostly a mix of short duration debt and money market instruments. The average portfolio maturity will not ordinarily exceed around 2 years.
Nature: Debt
Monthly Avg AUM: ` 5,188.45 Crores
Month end AUM: ` 5034.32 Crores
Inception Date: 14 December 2000
Fund Manager: Mr. Suyash Choudhary (Since 11th March 2011)
Other Parameter:
Standard Deviation (Annualized) 0.96%
Modified Duration 1.75 years
Average Maturity 2.10 years
Yield to Maturity 7.85%
Expense Ratio£
Regular 0.72%
Direct 0.24%
Benchmark: CRISIL AAA Short Term Index
(w.e.f. 26th September 2016)
SIP (Minimum Amount): ` 1000/-
SIP Frequency: Monthly
SIP Dates (Monthly): Any day of the month, except 29th, 30th & 31st day of the month
Investment Objective: Refer Pg No from 41 to 42
Minimum Investment Amount: ` 5,000/- and any amount thereafter
Option Available: Growth, Dividend - Fortnightly (Payout & Reinvestment), Monthly & Periodic
Exit Load: Nil (w.e.f. 23rd May 2016)
NAV (`)
Plan Option Freq NAV
Regular Plan Growth - 34.9151
Regular Plan Dividend Monthly 10.1647
Regular Plan Dividend Fortnightly 10.3314
Regular Plan Dividend Periodic 12.9547
Name Rating % of NAV
Corporate Bond 95.68%
HDFC AAA 14.11%
Power Finance Corporation AAA 11.92%
Rural Electrification Corporation AAA 9.79%
Bajaj Finance AAA 9.73%
Kotak Mahindra Prime AAA 8.70%
LIC Housing Finance AAA 7.42%
Indian Railway Finance Corporation AAA 6.14%
National Highways Auth Of Ind AAA 5.72%
UltraTech Cement AAA 5.01%
NABARD AAA 3.92%
Reliance Industries AAA 3.37%
Power Grid Corporation of India AAA 3.25%
HDB Financial Services AAA 2.06%
Reliance Jio Infocomm AAA 2.01%
NTPC AAA 1.31%
M&M Financial Services AA+ 0.60%
Export Import Bank of India AAA 0.59%
HDFC Bank AAA 0.03%
Net Cash and Cash Equivalent 4.32%
Grand Total 100.00%
Performance TableScheme Name CAGR Returns (%) Current Value of Investment of ` 10,000
1 Year 3 Years 5 YearsSince
Inception1 Year 3 Years 5 Years
SinceInception
IDFC Super Saver Income Fund – Short Term - Regular Plan - Growth*
5.42% 7.38% 8.04% 7.57% 10,542 12,385 14,722 34,915
CRISIL AAA Short Term Bond Index# 6.23% 8.04% 8.58% NA 10,623 12,618 15,095 NA
CRISIL 1 Year T-Bill## 5.65% 6.97% 7.05% 6.30% 10,565 12,246 14,058 28,494
Performance based on NAV as on 31/1/2018. Past performance may or may not be sustained in future.The performances given are of regular plan growth option.Regular and Direct Plans have different expense structure. Direct Plan shall have a lower expense ratio excluding distribution expenses, commission expenses etc.For other funds managed by the fund manager, please refer page no. 34 - 36 & the respective fund pages #Benchmark Returns. ##Alternate Benchmark Returns. Standard Deviation calculated on the basis of 1 year history of monthly data *Since Inception Regular Plan - Growth Dec 14, 2000. £The above recurring expense ratio does not include Goods and Service Tax on Investment Management Fees, the proportionate charge in respect of sales beyond T-15 cities subject to maximum of 30 bps on daily net assets and borrowing costs, wherever applicable.
Riskometer
Investors understand that their principal will be at Moderately Low Risk
This product is suitable for investors who are seeking*:
To generate optimal returns over short to medium •term.Investments in good quality fixed income & •Money Market securities.
*Investors should consult their financial advisers if in doubt about whether the product is suitable for them.
Maturity Bucket Asset Quality
% NAV
0 10 20 30 40 50 60 70
Upto 1 year
1-3 years
Above 3 years
28.70
46.84
24.47
AA+0.60%
AAA Equivalent99.40%

27
IDFC Corporate Bond FundAn Open Ended Income Fund
31st January 2018
FUND FEATURES PORTFOLIO
About the Fund: The fund focuses on delivering returns through investment in the corporate bond segment. The fund will not have weighted average portfolio maturity of more than 5 years and shall not invest in G Secs.
Nature: Open Ended Income Fund
Monthly Avg AUM: ` 12,190.87 Crores
Month end AUM: ` 12400.89 Crores
Inception Date: 12 January 2016
Fund Manager: Mr. Anurag Mittal (w.e.f. 12th January 2016)
Other Parameter:
Standard Deviation (Annualized) 1.30%
Modified Duration 1.86 years
Average Maturity 2.19 years
Yield to Maturity 7.88%
Expense Ratio£
Regular 0.47%
Direct 0.19%
Benchmark: CRISIL Short Term Bond Fund Index
SIP (Minimum Amount): ` 1000/-
SIP Frequency: Monthly
SIP Dates (Monthly): Any day of the month, except 29th, 30th & 31st day of the month
Investment Objective: Refer Pg No from 41 to 42
Minimum Investment Amount: ` 5,000/- and any amount thereafter
Option Available: Dividend-Monthly, Quarterly, Half Yearly, Annual & Periodic
Exit Load: Nil
NAV (`)
Plan Option Freq NAVRegular Plan Growth - 11.7224Regular Plan Dividend - N.ARegular Plan Dividend Periodic 11.2045Regular Plan Dividend Monthly 10.5170Regular Plan Dividend Half
Yearly10.7168
Regular Plan Dividend Quarterly 10.4220Regular Plan Dividend Annual 10.5957
Name Rating % of NAV
Corporate Bond 92.04%
Power Finance Corporation AAA 11.29%
Rural Electrification Corporation AAA 11.14%
NABARD AAA 11.13%
HDFC AAA 10.28%
Indian Railway Finance Corporation AAA 7.61%
LIC Housing Finance AAA 7.03%
HDB Financial Services AAA 4.66%
Bajaj Finance AAA 4.08%
M&M Financial Services AAA 3.85%
Power Grid Corporation of India AAA 3.59%
Export Import Bank of India AAA 2.56%
Tata Sons AAA 2.21%
Kotak Mahindra Prime AAA 2.07%
Small Industries Dev Bank of India AAA 1.81%
Larsen & Toubro AAA 1.73%
GRUH Finance AAA 1.68%
Reliance Industries AAA 1.28%
Housing & Urban Development Corporation AAA 0.99%
Mahindra Vehicle Mfg AAA 0.81%
NTPC AAA 0.69%
NHPC AAA 0.66%
Reliance Jio Infocomm AAA 0.61%
Axis Finance AAA 0.20%
UltraTech Cement AAA 0.08%
Zero Coupon Bond 1.80%
M&M Financial Services AAA 0.71%
LIC Housing Finance AAA 0.56%
HDFC AAA 0.53%
Net Cash and Cash Equivalent 6.17%
Grand Total 100.00%
Performance TableScheme Name CAGR Returns (%) Current Value of Investment of ` 10,000
1 Year 3 Years 5 YearsSince
Inception1 Year 3 Years 5 Years
SinceInception
IDFC Corporate Bond Fund - Regular Plan - Growth*
5.28% NA NA 8.04% 10,528 NA NA 11,722
CRISIL Short Term Bond Fund Index# 5.38% NA NA 7.67% 10,538 NA NA 11,640
1 Year T-Bill## 5.65% NA NA 6.49% 10,565 NA NA 11,379
The scheme has been in existence for more than 1 year but less than 3 years.Performance based on NAV as on 31/1/2018. Past performance may or may not be sustained in future.The performances given are of regular plan growth option.Regular and Direct Plans have different expense structure. Direct Plan shall have a lower expense ratio excluding distribution expenses, commission expenses etc.For other funds managed by the fund manager, please refer page no. 34 - 36 & the respective fund pages #Benchmark Returns. ##Alternate Benchmark Returns. Standard Deviation calculated on the basis of 1 year history of monthly data *Since Inception Regular Plan - Growth Jan 12, 2016. £The above recurring expense ratio does not include Goods and Service Tax on Investment Management Fees, the proportionate charge in respect of sales beyond T-15 cities subject to maximum of 30 bps on daily net assets and borrowing costs, wherever applicable.
Riskometer
Investors understand that theirprincipal will be at Moderate risk
This product is suitable for investors who are seeking*:
To generate long term optimal returns by active •management.Investment in corporate bonds & money market •instruments.
*Investors should consult their financial advisers if in doubt about whether the product is suitable for them.
Asset Quality
AAA Equivalent100.00%
Maturity Bucket
% NAV
0 10 20 30 40 50 60 70 80 90 100
Upto 1 year
1-3 years
Above 3 years
9.44
4.55
86.01

28
IDFC Credit Opportunities FundAn Open Ended Debt Fund
31st January 2018
FUND FEATURES PORTFOLIO
About the Fund: IDFC Credit opportunities fund aims to provide an optimal risk-reward profile to investors by focusing on companies with well-run management and evolving business prospects or good businesses with improving financial profile.
Nature: Debt
Monthly Avg AUM: ` 1,079.92 Crores
Month end AUM: ` 1088.01 Crores
Inception Date: 03 March 2017
Fund Manager: Mr. Arvind Subramanian (w.e.f. 03rd March 2017) and Khushboo Sharma (w.e.f. 15th May 2017)
Other Parameter:
Modified Duration 2.21 years
Average Maturity 2.73 years
Yield to Maturity 8.38%
Expense Ratio£
Regular 1.53%
Direct 0.29%
Benchmark: 80% CRISIL AA Medium Term Bond Index + 20% CRISIL AAA Short Term Bond Index
SIP (Minimum Amount): ` 1,000/-
SIP Frequency: Monthly
SIP Dates (Monthly): Any day of the month, except 29th, 30th & 31st day of the month
Investment Objective: Refer Pg No from 41 to 42
Minimum Investment Amount: ` 5,000/- and any amount thereafter
Option Available: Growth & Dividend (Payout, Reinvestment & Sweep facility)
Exit Load: 1% if redeemed/switched out within 365 days from the date of allotment
NAV (`)
Plan Option Freq NAV
Regular Plan Growth - 10.5800
Regular Plan Dividend Periodic 10.5799
Regular Plan Dividend Annual 10.5799
Regular Plan Dividend Half Yearly
10.1559
Regular Plan Dividend Quarterly 10.1112
Name Rating % of NAV
Corporate Bond 79.32%
IndusInd Bank AA 6.00%
Axis Bank AA+ 5.89%
Idea Cellular AA+ 5.05%
Afcons Infrastructure AA 5.03%
Vedanta AA 4.61%
*Walwhan Renewable Energy AA(SO) 4.49%
Tata Housing Development Company AA 4.10%
India Infoline Housing Finance AA 4.10%
Mahindra Rural Housing Finance AA+ 3.65%
JM Financial Products AA 3.21%
Tata Motors AA+ 3.17%
Tata Power Company AA- 2.81%
Hindalco Industries AA 2.41%
Power Finance Corporation AAA 2.34%
Vodafone Mobile Services AA 2.30%
Kotak Mahindra Prime AAA 2.29%
L & T Housing Finance AA+ 2.28%
*Tata Power Renewable Energy AA(SO) 2.27%
HDB Financial Services AAA 2.26%
NABARD AAA 2.26%
Indiabulls Housing Finance AAA 1.87%
Sundaram BNP Paribas Home Finance AA+ 1.85%
ICICI Bank AA+ 1.85%
Tata Steel AA 1.41%
JM Financial Credit Solution AA 0.91%
HDFC Bank AA+ 0.46%
State Bank of India AA+ 0.45%
State Government Bond 7.03%
8.39% Rajasthan UDAY BOND - 2023 SOV 4.70%
8.14% Harayana UDAY BOND - 2022 SOV 2.33%
Commercial Paper 4.83%
Shapoorji Pallonji and Company Pvt A1+ 4.83%
Government Bond 2.37%
8.20% - 2022 G-Sec SOV 2.37%
Zero Coupon Bond 1.47%
Aditya Birla Fashion and Retail AA 1.47%
Net Cash and Cash Equivalent 4.99%
Grand Total 100.00%
Riskometer
Investors understand that their principal will be at Moderate risk
This product is suitable for investors who are seeking*:
To generate optimal returns over medium term.•To predominantly invest in a portfolio of •corporate debt securities across the credit spectrum.
*Investors should consult their financial advisers if in doubt about whether the product is suitable for them.
Asset Quality
*Corporate Guarantee from Tata Power
AA+
AA
AA-
AAA Equivalent
24.64%
42.32%
2.81%
30.23%
The scheme has been in existence for less than 1 year, hence performance has not been disclosed. Gsec/SDL yields have been annualized wherever applicable.Regular and Direct Plans have different expense structure. Direct Plan shall have a lower expense ratio excluding distribution expenses, commission expenses etc.For other funds managed by the fund manager, please refer page no. 34 - 36 & the respective fund pages The above recurring expense ratio does not include Goods and Service Tax on Investment Management Fees, the proportionate charge in respect of sales beyond T-15 cities subject to maxi-mum of 30 bps on daily net assets and borrowing costs, wherever applicable.
Maturity Bucket
% NAV
0 10 20 30 40 50 60 70
Upto 1 year
1-3 years
Above 3 years
19.10
39.03
41.86

29
IDFC Super Saver Income Fund – Medium TermAn Open Ended Income Fund
31st January 2018
FUND FEATURES PORTFOLIO
About the Fund: The fund is positioned in the short term fund category and invests in a mix of debt and money market instruments. The overall average maturity of the fund will ordinarily not exceed around 4 years. MT is best suited for investors who want moderate participation. The around 4 year average maturity cap makes the fund well suited to offer lower volatility yet benefit from potential fall in interest rates.
Nature: Debt
Monthly Avg AUM: ` 4,073.40 Crores
Month end AUM: ` 4056.18 Crores
Inception Date: 8 July 2003
Fund Manager: Mr. Suyash Choudhary (w.e.f. 15th September 2015)
Other Parameter:
Standard Deviation (Annualized) 1.34%
Modified Duration 2.22 years
Average Maturity 2.70 years
Yield to Maturity 7.85%
Expense Ratio£
Regular 1.34%
Direct 0.66%
Benchmark: CRISIL Short Term Bond Fund Index
SIP (Minimum Amount): ` 1000/-
SIP Frequency: Monthly
SIP Dates (Monthly): Any day of the month, except 29th, 30th & 31st day of the month
Investment Objective: Refer Pg No from 41 to 42
Minimum Investment Amount: ` 5,000/- and any amount thereafter
Option Available: Growth, Dividend - Daily, Fortnightly (Payout & Reinvestment), Monthly, Bi - Monthly (once in two months), Quarterly & Periodic
Exit Load: 0.50% if redeemed/switched-out within 6 (six) months from the date of allotment (w.e.f. 11th May 2017)
NAV (`)
Plan Option Freq NAVRegular Plan Growth - 28.7427Regular Plan Dividend BiMonthly 11.5674Regular Plan Dividend Fortnightly 10.1443Regular Plan Dividend Monthly 10.1430Regular Plan Dividend Daily 10.1787Regular Plan Dividend Quarterly 10.6924Regular Plan Dividend Periodic 13.1250
Name Rating % of NAV
Corporate Bond 50.62%
Kotak Mahindra Prime AAA 12.24%
HDFC AAA 10.20%
LIC Housing Finance AAA 6.90%
Power Finance Corporation AAA 5.79%
Bajaj Finance AAA 4.44%
HDB Financial Services AAA 3.55%
Rural Electrification Corporation AAA 1.88%
NLC India AAA 1.75%
Reliance Jio Infocomm AAA 1.24%
Indian Railway Finance Corporation AAA 0.99%
NABARD AAA 0.72%
ICICI Bank AAA 0.62%
HDFC Bank AAA 0.25%
Export Import Bank of India AAA 0.03%
Small Industries Dev Bank of India AAA 0.02%
State Government Bond 29.89%
8.39% Rajasthan UDAY BOND - 2023 SOV 5.59%
7.42% Maharashtra SDL - 2022 SOV 4.52%
7.38% Maharashtra UDAY BOND - 2022 SOV 3.72%
7.67% Tamilnadu UDAY BOND - 2023 SOV 3.29%
8.63% Tamilnadu SDL - 2023 SOV 3.19%
7.63% Telangana UDAY BOND - 2023 SOV 2.15%
Performance TableScheme Name CAGR Returns (%) Current Value of Investment of ` 10,000
1 Year 3 Years 5 YearsSince
Inception1 Year 3 Years 5 Years
SinceInception
IDFC Super Saver Income Fund - Medium Term Plan - Regular Plan - Growth*
4.58% 7.23% 7.71% 7.51% 10,458 12,333 14,503 28,743
CRISIL Short Term Bond Fund Index# 5.38% 7.88% 8.53% 7.18% 10,538 12,562 15,062 27,472
1 Year T-Bill## 5.65% 6.97% 7.05% 5.93% 10,565 12,246 14,058 23,153
Performance based on NAV as on 31/1/2018. Past performance may or may not be sustained in future.The performances given are of regular plan growth option.Regular and Direct Plans have different expense structure. Direct Plan shall have a lower expense ratio excluding distribution expenses, commission expenses etc.For other funds managed by the fund manager, please refer page no. 34 - 36 & the respective fund pages #Benchmark Returns. ##Alternate Benchmark Returns. Standard Deviation calculated on the basis of 1 year history of monthly data *Since Inception Regular Plan - Growth Jul 08, 2003. £The above recurring expense ratio does not include Goods and Service Tax on Investment Management Fees, the proportionate charge in respect of sales beyond T-15 cities subject to maximum of 30 bps on daily net assets and borrowing costs, wherever applicable.Gsec/SDL yields have been annualized wherever applicable
Name Rating % of NAV
8.64% Uttar Pradesh UDAY BOND - 2023 SOV 1.27%
8.27% Rajasthan UDAY BOND - 2022 SOV 1.26%
8.64% Andhra Pradesh SDL - 2023 SOV 0.89%
8.39% Rajasthan UDAY BOND - 2019 SOV 0.79%
7.75% Tamil Nadu UDAY BOND - 2023 SOV 0.49%
8.56% RAJASTHAN SDL - 2023 SOV 0.38%
7.68% Madhya Pradesh UDAY BOND - 2023 SOV 0.38%
8.68% Gujarat SDL - 2023 SOV 0.26%
7.78% Tamilnadu UDAY SDL - 2023 SOV 0.25%
7.77% Tamilnadu UDAY BOND - 2023 SOV 0.25%
7.74% Tamilnadu UDAY BOND - 2023 SOV 0.25%
7.7% Tamilnadu UDAY SDL - 2023 SOV 0.25%
7.69% Tamilnadu UDAY SDL - 2023 SOV 0.25%
7.7% Telangana UDAY BOND - 2023 SOV 0.25%
8.51% Uttar Pradesh UDAY BOND - 2023 SOV 0.23%
Government Bond 11.73%
6.84% - 2022 G-Sec SOV 6.65%
8.20% - 2022 G-Sec SOV 5.08%
Certificate of Deposit 4.81%
IndusInd Bank A1+ 4.81%
Net Cash and Cash Equivalent 2.96%
Grand Total 100.00%
Riskometer
Investors understand that theirprincipal will be at Moderate risk
This product is suitable for investors who are seeking*:
To generate optimal returns over short to •medium term.Investments in high quality money market & •debt instruments including G-Sec securities.
*Investors should consult their financial advisers if in doubt about whether the product is suitable for them.
Maturity Bucket Asset Quality
AAA Equivalent100.00%
% NAV
0 10 20 30 40 50 60
Upto 1 year
1-3 years
Above 3 years
24.28
34.87
40.85

30
IDFC Super Saver Income Fund – Investment PlanAn Open Ended Income Fund
31st January 2018
FUND FEATURES PORTFOLIO
About the Fund: An actively managed bond fund which seeks to invest in highly rated money market and debt instruments (including government securities) and aims to generate stable long term returns through mix of accrual income and capital appreciation.
Nature: Debt
Monthly Avg AUM: ` 1,116.87 Crores
Month end AUM: ` 1068.10 Crores
Inception Date: 14 July 2000
Fund Manager: Mr. Suyash Choudhary (Since 15th October 2010)
Other Parameter:
Standard Deviation (Annualized) 3.07%
Modified Duration 5.05 years
Average Maturity 7.18 years
Yield to Maturity 7.75%
Expense Ratio£
Regular 1.62%
Direct 0.86%
Benchmark: CRISIL Composite Bond Fund Index
SIP (Minimum Amount): ` 1000/-
SIP Frequency: Monthly
SIP Dates (Monthly): Any day of the month, except 29th, 30th & 31st day of the month
Investment Objective: Refer Pg No from 41 to 42
Minimum Investment Amount: ` 5,000/- and any amount thereafter
Option Available: Growth, Dividend - Quarterly, Half Yearly, Annual & Periodic
Exit Load: If redeemed/switched out within 365 days from the date of allotment: For 10% of investment : Nil, For remaining investment : 1%
If redeemed/switched out after 365 days from the date of allotment: Nil
NAV (`)
Plan Option Freq NAVRegular Plan Dividend Quarterly 11.2647Regular Plan Growth - 40.8248Regular Plan Dividend Annual 11.3219Regular Plan Dividend Half
Yearly11.2513
Regular Plan Dividend Periodic 13.4061
Name Rating % of NAV
Government Bond 68.41%
8.20% - 2022 G-Sec SOV 25.47%
8.15% - 2026 G-Sec SOV 20.54%
6.68% - 2031 G-Sec SOV 17.41%
7.35% - 2024 G-Sec SOV 2.78%
7.17% - 2028 G-Sec SOV 1.29%
6.84% - 2022 G-Sec SOV 0.64%
7.73% - 2034 G-Sec SOV 0.28%
State Government Bond 26.37%
8.21% Haryana UDAY BOND - 2023 SOV 5.71%
8.39% Rajasthan UDAY BOND - 2023 SOV 4.40%
8.39% Rajasthan UDAY BOND- 2022 SOV 3.34%
8.64% Uttar Pradesh UDAY BOND
- 2023SOV 3.19%
Performance TableScheme Name CAGR Returns (%) Current Value of Investment of ` 10,000
1 Year 3 Years 5 YearsSince
Inception1 Year 3 Years 5 Years
SinceInception
IDFC Super Saver Income Fund - Investment Plan - Regular Plan - Growth*
1.92% 6.27% 7.90% 8.34% 10,192 12,006 14,630 40,825
CRISIL Composite Bond Fund Index# 3.17% 7.97% 8.50% NA 10,317 12,593 15,038 NA
10 Year GOI## -2.43% 6.24% 6.36% NA 9,757 11,995 13,616 NA
Performance based on NAV as on 31/1/2018. Past performance may or may not be sustained in future.The performances given are of regular plan growth option.Regular and Direct Plans have different expense structure. Direct Plan shall have a lower expense ratio excluding distribution expenses, commission expenses etc.For other funds managed by the fund manager, please refer page no. 34 - 36 & the respective fund pages #Benchmark Returns. ##Alternate Benchmark Returns. Standard Deviation calculated on the basis of 1 year history of monthly data *Since Inception Regular Plan - Growth Jul 14, 2000. £The above recurring expense ratio does not include Goods and Service Tax on Investment Management Fees, the proportionate charge in respect of sales beyond T-15 cities subject to maximum of 30 bps on daily net assets and borrowing costs, wherever applicable.Gsec/SDL yields have been annualized wherever applicable
Name Rating % of NAV
8.21% Haryana UDAY BOND - 2022 SOV 2.33%
8.21% Rajasthan UDAY BOND - 2023 SOV 1.90%
7.42% Maharashtra SDL - 2022 SOV 1.58%
7.63% Telangana UDAY BOND - 2023 SOV 1.37%
7.67% Tamilnadu UDAY BOND - 2023 SOV 1.20%
8.51% Uttar Pradesh UDAY BOND
- 2023SOV 0.58%
7.68% Madhya Pradesh UDAY BOND
- 2023SOV 0.48%
8.52% Uttar Pradesh UDAY BOND
- 2022SOV 0.29%
Corporate Bond 1.11%
Power Finance Corporation AAA 1.11%
Net Cash and Cash Equivalent 4.12%
Grand Total 100.00%
Riskometer
Investors understand that theirprincipal will be at Moderate risk
This product is suitable for investors who are seeking*:
To generate long term optimal returns by active •management. Investments in high quality money market & •debt instruments including G-Sec securities.
*Investors should consult their financial advisers if in doubt about whether the product is suitable for them.
Maturity Bucket Asset Quality
AAA Equivalent
100.00%% NAV
0 10 20 30 40 50 60
Upto 1 year
1-3 years
3-5 years
5-10 years
Above 10 years
4.12
0.00
34.76
43.44
17.68

31
IDFC Dynamic Bond FundAn Open Ended Income Fund
31st January 2018
FUND FEATURES PORTFOLIO
About the Fund: The fund is positioned in the income fund category to take exposure across the curve depending upon the fund manager’s underlying interest rate view where we employ the majority of the portfolio. It is a wide structure and conceptually can go anywhere on the curve. The fund plays the trade of the season which we think will sustain for a longer period of time.
Nature: Debt
Monthly Avg AUM: ` 4,160.40 Crores
Month end AUM: ` 3903.27 Crores
Inception Date: 25 June 2002
Fund Manager: Mr. Suyash Choudhary (Since 15th October 2010)
Other Parameter:
Standard Deviation (Annualized) 3.03%
Modified Duration 4.78 years
Average Maturity 6.69 years
Yield to Maturity 7.67%
Expense Ratio£
Regular 1.46%
Direct 0.76%
Benchmark: CRISIL Composite Bond Fund Index
SIP (Minimum Amount): ` 1000/-
SIP Frequency: Monthly
SIP Dates (Monthly): Any day of the month, except 29th, 30th & 31st day of the month
Investment Objective: Refer Pg No from 41 to 42
Minimum Investment Amount: ` 5,000/- and any amount thereafter
Option Available: Growth, Dividend - Quarterly (March, June, September & December), Half Yearly, Annual, Regular & Periodic
Exit Load: Nil (w.e.f. 17th October 2016)
NAV (`)
Plan Option Freq NAVRegular Plan Growth - 20.4035Regular Plan Dividend - 10.4657Regular Plan Dividend Quarterly 10.6227Regular Plan Dividend Annual 10.8262Regular Plan Dividend Half
Yearly10.1598
Regular Plan Dividend Periodic 13.2977
Name Rating % of NAV
Government Bond 76.15%
8.20% - 2022 G-Sec SOV 35.09%
6.68% - 2031 G-Sec SOV 17.24%
8.15% - 2026 G-Sec SOV 12.14%
6.84% - 2022 G-Sec SOV 7.54%
7.35% - 2024 G-Sec SOV 2.79%
7.17% - 2028 G-Sec SOV 1.33%
7.73% - 2034 G-Sec SOV 0.02%
State Government Bond 18.81%
8.21% Haryana UDAY BOND - 2023 SOV 5.59%
8.64% Uttar Pradesh UDAY BOND -
2023SOV 3.10%
8.39% Rajasthan UDAY BOND - 2023 SOV 3.03%
8.21% Rajasthan UDAY BOND - 2023 SOV 1.69%
Performance TableScheme Name CAGR Returns (%) Current Value of Investment of ` 10,000
1 Year 3 Years 5 YearsSince
Inception1 Year 3 Years 5 Years
SinceInception
IDFC Dynamic Bond Fund - Regular Plan - Growth*
2.28% 6.53% 8.12% 8.09% 10,228 12,093 14,776 20,404
CRISIL Composite Bond Fund Index# 3.17% 7.97% 8.50% 8.03% 10,317 12,593 15,038 20,309
10 Year GOI## -2.43% 6.24% 6.36% 5.49% 9,757 11,995 13,616 16,329
Performance based on NAV as on 31/1/2018. Past performance may or may not be sustained in future.The performances given are of regular plan growth option.Regular and Direct Plans have different expense structure. Direct Plan shall have a lower expense ratio excluding distribution expenses, commission expenses etc. Standard Deviation calculated on the basis of 1 year history of monthly dataFor other funds managed by the fund manager, please refer page no. 34 - 36 & the respective fund pages #Benchmark Returns. ##Alternate Benchmark Returns. *Since Inception Regular Plan - Growth Dec 03, 2008. £The above recurring expense ratio does not include Goods and Service Tax on Investment Management Fees, the proportionate charge in respect of sales beyond T-15 cities subject to maximum of 30 bps on daily net assets and borrowing costs, wherever applicable.Gsec/SDL yields have been annualized wherever applicable
Name Rating % of NAV
7.42% Maharashtra SDL - 2022 SOV 1.60%
7.63% Telangana UDAY BOND - 2023 SOV 1.20%
7.67% Tamilnadu UDAY BOND - 2023 SOV 1.07%
8.51% Uttar Pradesh UDAY BOND - 2023 SOV 0.60%
7.68% Madhya Pradesh UDAY BOND -
2023SOV 0.45%
8.52% Uttar Pradesh UDAY BOND - 2022 SOV 0.31%
8.44% Uttar Pradesh UDAY BOND -
2023SOV 0.06%
7.99% Uttar Pradesh SDL - 2026 SOV 0.06%
8.07% Rajasthan SDL - 2026 SOV 0.03%
7.98% Haryana SDL - 2026 SOV 0.02%
Corporate Bond 1.59%
Power Finance Corporation AAA 1.59%
Net Cash and Cash Equivalent 3.44%
Grand Total 100.00%
Riskometer
Investors understand that theirprincipal will be at Moderate risk
This product is suitable for investors who are seeking*:
To generate long term optimal returns by active •management.Investments in high quality money market & •debt instruments including G-Sec securities.
*Investors should consult their financial advisers if in doubt about whether the product is suitable for them.
Maturity Bucket Asset Quality
AAA Equivalent100.00%
% NAV0 10 20 30 40 50 60
Upto 1 year
1-3 years
3-5 years
5-10 years
Above 10 years
3.44
0.00
46.12
33.17
17.27

32
PORTFOLIOName Rating % of NAV
Government Bond 90.75%
6.68% - 2031 G-Sec SOV 38.27%
8.20% - 2022 G-Sec SOV 25.10%
8.15% - 2026 G-Sec SOV 15.21%
7.59% - 2029 G-Sec SOV 6.94%
7.17% - 2028 G-Sec SOV 4.70%
6.84% - 2022 G-Sec SOV 0.51%
State Government Bond 5.23%
7.42% Maharashtra SDL - 2022 SOV 4.16%
8.21% Haryana UDAY BOND - 2022 SOV 0.43%
8.52% Uttar Pradesh UDAY BOND - 2022 SOV 0.32%
7.68% Madhya Pradesh UDAY BOND - 2023 SOV 0.31%
Net Cash and Cash Equivalent 4.02%
Grand Total 100.00%
FUND FEATURES
About the Fund: A dedicated gilt fund with an objective to generate optimal returns with high liquidity by investing in Government Securities.
Nature: Debt | Monthly Avg AUM: ` 96.43 Crores | Month end AUM: ` 95.23 Crores
Inception Date: 29 March 2004 | Fund Manager: Mr. Suyash Choudhary (Since 15th October 2010)
Other Parameter Asset Quality Expense Ratio£
Standard Deviation (Annualized) 3.50% Sovereign 100.00% Regular 0.76%Modified Duration 6.16 years Direct 0.26%Average Maturity 9.34 yearsYield to Maturity 7.71%
Benchmark: I-Sec Composite Index | SIP (Minimum Amount): ` 100/- | SIP Frequency: Monthly | SIP Dates (Monthly): Any day of the month, except 29th, 30th & 31st day of the month | Investment Objective: Refer Pg No from 41 to 42 | Minimum Investment Amount: ` 100/- and any amount thereafter | Option Available: Growth, Dividend - Quarterly, Annual & Periodic | Exit Load: Nil (w.e.f. 11th December 2014). Yields for GSec/SDLs have been annualized wherever applicable.
NAV (`)
Plan Regular Plan Regular Plan Regular Plan Regular Plan
Option Growth Dividend Dividend Dividend
Freq - Quarterly Annual Periodic
NAV 29.5418 11.8213 11.3459 13.8036
Riskometer
Investors understand that theirprincipal will be at Moderate risk
This product is suitable for investors who are seeking*:
To generate optimal returns over •short to medium term.Investments in Government •Securities and Treasury Bills.
*Investors should consult their financial advisers if in doubt about whether the product is suitable for them.
Performance TableScheme Name CAGR Returns (%) Current Value of Investment of ` 10,000
1 Year 3 Years 5 YearsSince
Inception1 Year 3 Years 5 Years
Since Inception
IDFC Government Securities Fund – STP - Regular Plan - Growth*
5.79% 7.92% 9.54% 5.93% 10,579 12,576 15,772 24,995
I-Sec Si-BEX# 5.68% 7.73% 8.00% NA 10,568 12,509 14,699 NA
CRISIL 1 Year T-Bill## 5.65% 6.97% 7.05% 5.96% 10,565 12,246 14,058 25,109Performance based on NAV as on 31/1/2018. Past performance may or may not be sustained in future. The performances given are of regular plan growth option.Regular and Direct Plans have different expense structure. Direct Plan shall have a lower expense ratio excluding distribution expenses, commission expenses etc.For other funds managed by the fund manager, please refer page no. 34 - 36 & the respective fund pages. #Benchmark Returns. ##Alternate Benchmark Returns. *Since Inception Regular Plan - Growth Mar 09, 2002. Standard Deviation calculated on the basis of 1 year history of monthly data Gsec/SDL yields have been annualized wherever applicable£The above recurring expense ratio does not include Goods and Service Tax on Investment Management Fees, the proportionate charge in respect of sales beyond T-15 cities subject to maximum of 30 bps on daily net assets and borrowing costs, wherever applicable.
`
IDFC Government Securities Fund – Short Term PlanAn Open Ended Dedicated Gilt Fund
31st January 2018
FUND FEATURES
About the Fund: The fund is a mix of government bonds, state development loans (SDLs), treasury bills and/or cash management bills. The fund will predominantly invest at the shorter end of the sovereign yield curve.
Nature: Debt | Monthly Avg AUM: ` 87.04 Crores | Month end AUM: ` 76.61 CroresInception Date: 9 March 2002 | Fund Manager: Mr. Harshal Joshi (w.e.f. 15th May 2017)
Other Parameter Asset Quality Expense Ratio£
Standard Deviation (Annualized) 1.67% Sovereign 100.00% Regular 0.39%
Modified Duration 2.30 years Direct 0.34%
Average Maturity 3.00 years
Yield to Maturity 7.16%
Benchmark: I - Sec Si Bex (w.e.f. 30th November 2015) | SIP (Minimum Amount): ` 1,000/- | SIP Frequency: Monthly | SIP Dates (Monthly): Any day of the month, except 29th, 30th & 31st day of the month | Investment Objective: Refer Pg No from 41 to 42 | Minimum Investment Amount: ` 5,000/- and any amount thereafter | Option Available: Growth, Dividend - Weekly, Monthly, Quarterly & Periodic | Exit Load: Nil. Yields for GSec/SDLs have been annualized wherever applicable.
NAV (`)
PlanRegular
Plan Regular
Plan Regular
Plan Regular
Plan Regular
Plan Regular
Plan
Option Growth Dividend Dividend Dividend Dividend Dividend
Freq - Quarterly Annual Periodic Weekly Monthly
NAV 24.9946 10.6697 N.A 13.3955 10.1579 10.3903
PORTFOLIO
Name Rating % of NAV
State Government Bond 51.76%
8.66% Haryana SDL - 2023 SOV 20.27%
8.6% Haryana SDL - 2023 SOV 13.49%
8.21% Haryana UDAY BOND - 2022 SOV 6.63%
7.95% Maharastra SDL - 2023 SOV 6.56%
8.68% Gujarat SDL - 2023 SOV 4.82%
Government Bond 6.93%
8.83% - 2023 G-Sec SOV 6.93%
Net Cash and Cash Equivalent 41.30%
Grand Total 100.00%
Riskometer
Investors understand that theirprincipal will be at Moderate risk
This product is suitable for investors who are seeking*:
To generate short to medium term •optimal returns. Investments in Government •Securities and Treasury Bills.
*Investors should consult their financial advisers if in doubt about whether the product is suitable for them.
IDFC Government Securities Fund – Provident Fund PlanAn Open Ended Dedicated Gilt Fund
31st January 2018
Maturity BucketUpto 1 year 1-3 years 3-5 years 5-10 years Above 10 years
41.30% 0.00% 6.63% 52.07% 0.00%
Maturity Bucket
% NAV
0 20 40 60 80 100
Upto 1 year
1-3 years
3-5 years
5-10 years
Above 10 years
4.02
0.00
30.53
20.23
45.21

33
IDFC Government Securities Fund – Investment PlanAn Open Ended Dedicated Gilt Fund
31st January 2018
FUND FEATURES PORTFOLIO
About the Fund: A dedicated gilt fund with an objective to generate optimal returns with high liquidity by investing in Government Securities.
Nature: Debt
Monthly Avg AUM: ` 503.23 Crores
Month end AUM: ` 494.70 Crores
Inception Date: 9 March 2002
Fund Manager: Mr. Suyash Choudhary (Since 15th October 2010)
Other Parameter:
Standard Deviation (Annualized) 3.47%
Modified Duration 6.11 years
Average Maturity 9.22 years
Yield to Maturity 7.71%
Asset Quality
Sovereign 100.00%
Expense Ratio£
Regular 0.99%
Direct 0.38%
Benchmark: I-Sec Composite Index
SIP (Minimum Amount): ` 1,000/-
SIP Frequency: Monthly
SIP Dates (Monthly): Any day of the month, except 29th, 30th & 31st day of the month
Investment Objective: Refer Pg No from 41 to 42
Minimum Investment Amount: ` 5,000/- and any amount thereafter
Option Available: Growth, Dividend - Quarterly, Half Yearly, Annual, Regular & Periodic
Exit Load: Nil (w.e.f. 15th July 2011)
NAV (`)
Plan Option Freq NAVRegular Plan Dividend - 10.4337Regular Plan Growth - 20.0085Regular Plan Dividend Quarterly 10.7081Regular Plan Dividend Annual 10.6208Regular Plan Dividend Half
Yearly10.3976
Regular Plan Dividend Periodic 13.4994
Name Rating % of NAV
Government Bond 93.71%
6.68% - 2031 G-Sec SOV 36.51%
8.20% - 2022 G-Sec SOV 25.79%
8.15% - 2026 G-Sec SOV 18.98%
7.59% - 2029 G-Sec SOV 5.64%
7.17% - 2028 G-Sec SOV 3.29%
7.35% - 2024 G-Sec SOV 3.00%
6.84% - 2022 G-Sec SOV 0.50%
Name Rating % of NAV
State Government Bond 2.82%
7.42% Maharashtra SDL - 2022 SOV 2.20%
8.52% Uttar Pradesh UDAY BOND - 2022 SOV 0.35%
7.68% Madhya Pradesh UDAY BOND - 2023
SOV 0.24%
8.21% Haryana UDAY BOND - 2022 SOV 0.02%
Net Cash and Cash Equivalent 3.47%
Grand Total 100.00%
Riskometer
Investors understand that theirprincipal will be at Moderate risk
This product is suitable for investors who are seeking*:
To generate long term optimal returns. •Investments in Government Securities and •Treasury Bills.
*Investors should consult their financial advisers if in doubt about whether the product is suitable for them.
Performance TableScheme Name CAGR Returns (%) Current Value of Investment of ` 10,000
1 Year 3 Years 5 YearsSince
Inception1 Year 3 Years 5 Years
SinceInception
IDFC Government Securities Fund – IP - Regular Plan - Growth*
1.46% 6.35% 8.47% 7.86% 10,146 12,034 15,017 20,009
I-Sec Composite Index# 2.73% 7.73% 8.51% 7.96% 10,273 12,509 15,047 20,173
CRISIL 10 Year GOI## -2.43% 6.24% 6.36% 5.49% 9,757 11,995 13,616 16,329
Performance based on NAV as on 31/1/2018. Past performance may or may not be sustained in future.The performances given are of regular plan growth option.Regular and Direct Plans have different expense structure. Direct Plan shall have a lower expense ratio excluding distribution expenses, commission expenses etc.For other funds managed by the fund manager, please refer page no. 34 - 36 & the respective fund pages#Benchmark Returns. ##Alternate Benchmark Returns. Standard Deviation calculated on the basis of 1 year history of monthly data *Since Inception Regular Plan - Growth Dec 03, 2008. £The above recurring expense ratio does not include Goods and Service Tax on Investment Management Fees, the proportionate charge in respect of sales beyond T-15 cities subject to maximum of 30 bps on daily net assets and borrowing costs, wherever applicable.Gsec/SDL yields have been annualized wherever applicable
IDFC Government Securities Fund – Provident Fund PlanAn Open Ended Dedicated Gilt Fund
31st January 2018
Performance Table
Scheme Name CAGR Returns (%) Current Value of Investment of ` 10,000
1 Year 3 Years 5 Years Since Inception 1 Year 3 Years 5 Years Since Inception
IDFC Government Securities Fund - PF Plan - Regular Plan - Growth* 2.11% 7.14% 9.01% 8.13% 10,211 12,303 15,397 29,542
I-Sec Composite Index# 2.73% 7.73% 8.51% 7.37% 10,273 12,509 15,047 26,769
10 Year GOI## -2.43% 6.24% 6.36% 5.29% 9,757 11,995 13,616 20,420
Performance based on NAV as on 31/1/2018. Past performance may or may not be sustained in future. The performances given are of regular plan growth option. Regular and Direct Plans have different expense structure. Direct Plan shall have a lower expense ratio excluding distribution expenses, commission expenses etc.For other funds managed by the fund manager, please refer page no. 34 - 36 & the respective fund pages. #Benchmark Returns. ##Alternate Benchmark Returns. *Since Inception Regular Plan - Growth Mar 29, 2004. Standard Deviation calculated on the basis of 1 year history of monthly data£The above recurring expense ratio does not include Goods and Service Tax on Investment Management Fees, the proportionate charge in respect of sales beyond T-15 cities subject to maximum of 30 bps on daily net assets and borrowing costs, wherever applicable.Gsec/SDL yields have been annualized wherever applicable
Maturity Bucket Asset Quality
Sovereign100.00%% NAV
0 20 40 60 80 100
Upto 1 year
1-3 years
3-5 years
5-10 years
Above 10 years
3.47
0.00
28.86
25.52
42.15

34
Period 1 Year 3 Years 5 Years
ManagingSince
BenchmarkIndex
SchemeReturn (%)
BenchmarkReturn (%)
SchemeReturn (%)
BenchmarkReturn (%)
SchemeReturn (%)
BenchmarkReturn (%)
Fund Manager Name: Mr. Anoop Bhaskar
IDFC Classic Equity Fund 30-04-2016 S&P BSE 200 TRI 32.22% 31.70% 14.27% 11.17% 15.74% 15.95%
IDFC Premier Equity Fund 30-04-2016 S&P BSE 500 TRI 28.48% 33.24% 10.87% 11.98% 19.61% 16.46%
IDFC Sterling Equity Fund 30-04-2016Nifty Free Float Midcap 100 TRI
47.40% 36.60% 16.16% 17.89% 21.79% 21.45%
IDFC Balanced Fund 30-12-2016CRISIL Hybrid 35+65 - Aggressive Index
16.80% 21.04% NA NA NA NA
Mr. Anoop Bhaskar manages 4 schemes of IDFC Mutual Fund.
Fund Manager Name: Mr. Anurag Mittal
IDFC Monthly Income Plan 09-11-2015CRISIL Hybrid 85+15 - Conservative Index
7.89% 7.08% 7.84% 8.57% 9.68% 9.72%
IDFC Cash Fund 09-11-2015 CRISIL Liquid Fund Index 6.60% 6.68% 7.46% 7.39% 8.12% 8.10%
IDFC Ultra Short Term Fund 09-11-2015 CRISIL Liquid Fund Index 6.71% 6.68% 8.04% 7.39% 8.60% 8.10%
IDFC Money Manager Fund – Treasury Plan
09-11-2015 CRISIL Liquid Fund Index 5.74% 6.68% 7.38% 7.39% 7.86% 8.10%
IDFC Banking & PSU Debt Fund 01-08-2014CRISIL Short Term Bond Fund Index
5.38% 5.34% 7.23% 6.94% NA NA
IDFC Corporate Bond Fund 12-01-2016CRISIL Short Term Bond Fund Index
5.28% 5.38% NA NA NA NA
IDFC Balanced Fund 30-12-2016CRISIL Hybrid 35+65 - Aggressive Index
16.80% 21.04% NA NA NA NA
Mr. Anurag Mittal manages 7 schemes of IDFC Mutual Fund.
Fund Manager Name: Mr. Arpit Kapoor
IDFC Equity Fund 01-03-2017 S&P BSE 100 TRI 30.85% 30.26% 8.35% 9.04% 13.35% 14.15%
IDFC Dynamic Equity Fund 01-03-2017CRISIL Hybrid 35+65 - Aggressive Index
16.93% 21.04% 6.09% 10.27% NA NA
IDFC Nifty Fund 01-03-2017 Nifty 50 TRI 29.68% 30.48% 8.53% 9.10% 13.65% 14.18%
IDFC Arbitrage Fund 01-03-2017 CRISIL Liquid Fund Index 5.88% 6.68% 6.38% 7.39% 7.35% 8.10%
IDFC Arbitrage Plus Fund 01-03-2017 CRISIL Liquid Fund Index 4.94% 6.68% 6.05% 7.39% 7.04% 8.10%
Mr. Arpit Kapoor manages 5 schemes of IDFC Mutual Fund.
Fund Manager Name: Mr. Arvind Subramanian
IDFC Dynamic Equity Fund 09-11-2015CRISIL Hybrid 35+65 - Aggressive Index
16.93% 21.04% 6.09% 10.27% NA NA
Mr. Arvind Subramanian manages 2 schemes of IDFC Mutual Fund.
Fund Manager Name: Mr. Bhavin Patadia
IDFC Asset Allocation Fund of Fund - Aggressive Plan
01-03-2017CRISIL Hybrid 35+65 - Aggressive Index
18.88% 21.04% 8.97% 10.27% 12.10% 13.53%
IDFC Asset Allocation Fund of Fund - Conservative Plan
01-03-2017CRISIL Hybrid 85+15 - Conservative Index
9.50% 7.08% 8.16% 8.57% 9.90% 9.72%
IDFC Asset Allocation Fund of Fund - Moderate Plan
01-03-2017CRISIL Hybrid 85+15 - Conservative Index
13.14% 7.08% 8.59% 8.57% 10.87% 9.72%
Mr. Bhavin Patadia manages 3 schemes of IDFC Mutual Fund.
Performance Table (Others Funds Managed by the Fund Managers)
TRI - Total Return IndexPerformance based on NAV as on 31/1/2018. Past Performance may or may not be sustained in futureThe performance details provided herein are of regular plan growth option. Regular and Direct Plans have different expense structure. Direct Plan shall have a lower expense ratio excluding distribution expenses, commission expenses etc.With effect from 1st February 2018, we are comparing the performances of the funds with the total return variant of the benchmark instead of the price return variant

35
Period 1 Year 3 Years 5 Years
ManagingSince
BenchmarkIndex
SchemeReturn (%)
BenchmarkReturn (%)
SchemeReturn (%)
BenchmarkReturn (%)
SchemeReturn (%)
BenchmarkReturn (%)
Fund Manager Name: Mr. Daylynn Pinto
IDFC Tax Advantage (ELSS) Fund
20-10-2016 S&P BSE 200 TRI 44.96% 31.70% 15.71% 11.17% 21.67% 15.95%
IDFC Sterling Equity Fund 20-10-2016Nifty Free Float Midcap 100 TRI
47.40% 36.60% 16.16% 17.89% 21.79% 21.45%
Mr. Daylynn Pinto manages 2 schemes of IDFC Mutual Fund.
Fund Manager Name: Mr. Harshal Joshi
IDFC Arbitrage Fund 15-07-2016 CRISIL Liquid Fund Index 5.88% 6.68% 6.38% 7.39% 7.35% 8.10%
IDFC Arbitrage Plus Fund 15-07-2016 CRISIL Liquid Fund Index 4.94% 6.68% 6.05% 7.39% 7.04% 8.10%
IDFC All Seasons Bond Fund 15-07-2016CRISIL Short-Term Bond Fund Index
5.15% 5.38% 7.39% 7.88% 8.20% 8.53%
IDFC Government Securities Fund – Short Term Plan
15-10-2010 I-Sec Si-BEX 5.79% 5.68% 7.92% 7.73% 9.54% 8.00%
IDFC Cash Fund 15-09-2015 CRISIL Liquid Fund Index 6.60% 6.68% 7.46% 7.39% 8.12% 8.10%
IDFC Money Manager Fund – Treasury Plan
09-11-2015 Crisil Liquid Fund Index 5.74% 6.68% 7.38% 7.39% 7.86% 8.10%
IDFC Money Manager Fund – Investment Plan
15-09-2015CRISIL AAA Short Term Bond Index
5.00% 6.23% 7.58% 8.04% 8.09% 8.58%
IDFC Yearly Series Interval Fund - Series II
12-02-2013CRISIL Short-Term Bond Fund Index
6.66% 5.38% 7.88% 7.88% NA NA
^IDFC Fixed Term Plan - Series 66
23-01-2014Crisil Composite Bond Fund Index
6.34% 3.17% 7.78% 8.16% NA NA
^IDFC Fixed Term Plan - Series 70
07-02-2014Crisil Composite Bond Fund Index
6.22% 3.17% 7.70% 8.16% NA NA
^IDFC Fixed Term Plan - Series 74
21-02-2014Crisil Composite Bond Fund Index
6.29% 3.17% 7.86% 8.16% NA NA
^IDFC Fixed Term Plan - Series 75
26-02-2014Crisil Composite Bond Fund Index
6.35% 3.17% 7.85% 8.16% NA NA
^IDFC Fixed Term Plan - Series 77
05-03-2014Crisil Composite Bond Fund Index
6.33% 3.17% 7.88% 8.16% NA NA
IDFC Fixed Term Plan - Series 78
11-03-2014CRISIL Short-Term Bond Fund Index
6.48% 5.38% 8.05% 7.88% NA NA
^IDFC Fixed Term Plan - Series 79
14-03-2014Crisil Composite Bond Fund Index
6.31% 3.17% 7.88% 8.16% NA NA
^^IDFC Fixed Term Plan - Series 84
12-03-2014Crisil Composite Bond Fund Index
6.47% 3.17% 7.85% 8.08% NA NA
^^IDFC Fixed Term Plan - Series 86
19-03-2014Crisil Composite Bond Fund Index
6.43% 3.17% 7.80% 8.08% NA NA
^^IDFC Fixed Term Plan - Series 88
26-03-2014Crisil Composite Bond Fund Index
6.40% 3.17% 7.92% 8.08% NA NA
^^^IDFC Fixed Term Plan - Series 91
16-04-2014Crisil Composite Bond Fund Index
6.66% 3.17% 8.12% 8.16% NA NA
IDFC Fixed Term Plan - Series 108
08-05-2015Crisil Composite Bond Fund Index
5.68% 3.17% NA NA NA NA
Mr. Harshal Joshi manages 20 schemes of IDFC Mutual Fund.
Fund Manager Name: Mr. Rajendra Kumar Mishra
IDFC Infrastructure Fund 27-06-2013 Nifty Infrastructure TRI 42.29% 24.88% 17.79% 4.61% 17.41% 8.61%
Mr. Rajendra Kumar Mishra manages 1 scheme of IDFC Mutual Fund.
Performance Table (Others Funds Managed by the Fund Managers)
TRI - Total Return IndexPerformance based on NAV as on 31/1/2018. Past Performance may or may not be sustained in futureThe performance details provided herein are of regular plan growth option. Regular and Direct Plans have different expense structure. Direct Plan shall have a lower expense ratio excluding distribution expenses, commission expenses etc.With effect from 1st February 2018, we are comparing the performances of the funds with the total return variant of the benchmark instead of the price return variant

36
Period 1 Year 3 Years 5 Years
ManagingSince
BenchmarkIndex
SchemeReturn (%)
BenchmarkReturn (%)
SchemeReturn (%)
BenchmarkReturn (%)
SchemeReturn (%)
BenchmarkReturn (%)
Fund Manager Name: Mr. Sumit Agrawal
IDFC Equity Fund 01-03-2017 S&P BSE 100 TRI 30.85% 30.26% 8.35% 9.04% 13.35% 14.15%
IDFC Dynamic Equity Fund 01-03-2017CRISIL Hybrid 35+65 - Aggressive Index
16.93% 21.04% 6.09% 10.27% NA NA
IDFC Nifty Fund 01-03-2017 Nifty 50 TRI 29.68% 30.48% 8.53% 9.10% 13.65% 14.18%
IDFC Focused Equity Fund 20-10-2016 Nifty 50 TRI 48.23% 30.48% 12.41% 9.10% 15.39% 14.18%
IDFC Monthly Income Plan 20-10-2016CRISIL Hybrid 85+15 - Conservative Index
7.89% 7.08% 7.84% 8.57% 9.68% 9.72%
Mr. Sumit Agrawal manages 5 schemes of IDFC Mutual Fund.
Fund Manager Name: Mr. Suyash Choudhary
IDFC Super Saver Income Fund – Short Term
11-03-2011CRISIL AAA Short Term Bond Index
5.42% 6.23% 7.38% 8.04% 8.04% 8.58%
IDFC Super Saver Income Fund – Medium Term
15-09-2015CRISIL Short-Term Bond Fund Index
4.58% 5.38% 7.23% 7.88% 7.71% 8.53%
IDFC Super Saver Income Fund – Investment Plan
15-10-2010CRISIL Composite Bond Fund Index
1.92% 3.17% 6.27% 7.97% 7.90% 8.50%
IDFC Dynamic Bond Fund 15-10-2010CRISIL Composite Bond Fund Index
2.28% 3.17% 6.53% 7.97% 8.12% 8.50%
IDFC Government Securities Fund – Investment Plan
15-10-2010 I-Sec Composite Index 1.46% 2.73% 6.35% 7.73% 8.47% 8.51%
IDFC Government Securities Fund – Provident Fund Plan
15-10-2010 I-Sec Composite Index 2.11% 2.73% 7.14% 7.73% 9.01% 8.51%
IDFC Balanced Fund 30-12-2016CRISIL Hybrid 35+65 - Aggressive Index
16.80% 21.04% NA NA NA NA
Mr. Suyash Choudhary manages 7 schemes of IDFC Mutual Fund.
Fund Manager Name: Mr. Yogik Pitti
IDFC Arbitrage Fund 27-06-2013 CRISIL Liquid Fund Index 5.88% 6.68% 6.38% 7.39% 7.35% 8.10%
IDFC Arbitrage Plus Fund 27-06-2013 CRISIL Liquid Fund Index 4.94% 6.68% 6.05% 7.39% 7.04% 8.10%
IDFC Sensex ETF 07-10-2016 S&P BSE Sensex TRI 31.46% 31.74% NA NA NA NA
IDFC Nifty ETF 07-10-2016 Nifty 50 TRI 29.95% 30.48% NA NA NA NA
Mr. Yogik Pitti manages 4 schemes of IDFC Mutual Fund.
TRI - Total Return IndexPerformance based on NAV as on 31/1/2018. Past Performance may or may not be sustained in future.The performance details provided herein are of regular plan growth option. Regular and Direct Plans have different expense structure. Direct Plan shall have a lower expense ratio excluding distribution expenses, commission expenses etc.^Current Index performance adjusted for the period from since inception to April 8, 2015 with the performance of Crisil Short Term Bond fund index (Benchmark) & 1 year T Bill Index (Alternate Benchmark). ^^Current Index performance adjusted for the period from since inception to April 6, 2015 with th e performance of Crisil Short Term Bond fund index (Benchmark) & 1 year T Bill Index (Alternate Benchmark) . ^^^Current Index performance adjusted for the period from since inception to April 20, 2015 with the performance of Crisil Short Term Bond fund index (Benchmark) & 1 year T Bill Index (Alternate Benchmark).With effect from 1st February 2018, we are comparing the performances of the funds with the total return variant of the benchmark instead of the price return variant
Performance Table (Others Funds Managed by the Fund Managers)
ICRA Credit Risk RatingIDFC MMF-TP, IDFC MMF-IP, IDFC SSIF-ST, SSIF-MT, IDFC CBF : “Credit Risk Rating AAAmfs” - The Fund carries the lowest credit risk, similar to that associ-ated with long-term debt obligations rated in the highest credit- quality category.IDFC CASH FUND, IDFC USTF: “Credit Risk Rating A1+mfs” - The highest-credit-quality short-term rating assigned by ICRA to debt funds. Debt funds rated in this category carry the lowest credit risk in the short term and are similar to that of fixed income obligations of highest credit- quality category with maturity of upto one year. This rating should however, not be construed as an indication of the performance of the Mutual Fund scheme or of volatility in its returns.Source: ICRA Ltd.CRISIL Credit Quality RatingIDFC SSIF-IP, IDFC DBF: “CRISIL AAA mfs” - Schemes with this rating are considered to have the highest degree of safety regarding timely receipt of payments from the investments that they have made. The rating of CRISIL is not an opinion on the Asset Management Company’s willingness or ability to make timely payments to the investor. The rating is also not an opinion on the stability of the NAV of the Fund, which could vary with market developments.CRISIL Credit Quality Rating MethodologyCRISIL’s credit quality ratings are based on the analysis of the credit risk of securities held by the fund. CRISIL has developed a Credit Quality Matrix to evaluate fund’s overall level of protection against losses associated with credit default. The matrix is a set of credit factors and credit scores derived scientifically from CRISIL’s rating default and transition rates. For details on closed ended funds, please refer the website www.idfcmf.comFITCH Credit Quality RatingIDFC Cash fund: “IND A1+ mfs” - Schemes with this rating are considered to have very strong degree of safety regarding timely receipt of payments from the investments that they have made.

37
IDFC All Seasons Bond Fund - Regular Plan - Growth 1 Year 3 Years 5 Years 7 Years 10 Years Since InceptionSep 13, 2004
Total Amount Invested (`) 1,20,000 3,60,000 6,00,000 8,40,000 12,00,000 16,10,000
Total Value as on January 31, 2018 (`) 1,22,400 3,98,128 7,27,330 11,15,453 17,94,233 27,91,567
Fund Returns (%) 3.72 6.64 7.63 7.97 7.80 7.82
Total Value of CRISIL Short Term Bond Fund Index# 1,23,010 4,01,291 7,35,260 11,30,806 18,31,691 28,27,810
CRISIL Short Term Bond Fund Index Returns (%)# 4.67 7.17 8.06 8.35 8.19 7.99
Total Value of CRISIL 1 Year T-Bill Index## 1,23,616 3,96,954 7,15,571 10,81,560 17,01,501 25,40,144
CRISIL 1 Year T-Bill Index Returns (%)## 5.62 6.44 6.98 7.10 6.79 6.52
SIP PerformanceMonthly SIP of `10,000
IDFC Cash Fund - Regular Plan - Growth 1 Year 3 Years 5 Years 7 Years 10 Years Since InceptionJun 04, 2008
Total Amount Invested (`) 1,20,000 3,60,000 6,00,000 8,40,000 NA 11,60,000
Total Value as on January 31, 2018 (`) 1,24,234 4,00,480 7,27,086 11,17,072 NA 17,28,452
Fund Returns (%) 6.57 7.03 7.61 8.01 NA 8.01
Total Value of Crisil Liquid Fund Index# 1,24,253 4,00,384 7,26,697 11,12,191 NA 17,08,429
Crisil Liquid Fund Index Returns (%)# 6.60 7.02 7.59 7.88 NA 7.78
Total Value of CRISIL 1 Year T-Bill Index## 1,23,635 3,97,020 7,15,633 10,81,680 NA 16,27,655
CRISIL 1 Year T-Bill Index Returns (%)## 5.63 6.45 6.98 7.11 NA 6.82
IDFC Ultra Short Term Fund - Regular Plan - Growth 1 Year 3 Years 5 Years 7 Years 10 Years Since InceptionJan 17, 2006
Total Amount Invested (`) 1,20,000 3,60,000 6,00,000 8,40,000 12,00,000 14,50,000
Total Value as on January 31, 2018 (`) 1,23,973 4,03,385 7,36,410 11,37,129 18,51,907 24,26,286
Fund Returns (%) 6.18 7.52 8.12 8.51 8.40 8.16
Total Value of Crisil Liquid Fund Index# 1,24,239 4,00,353 7,26,661 11,12,126 17,90,537 23,48,566
Crisil Liquid Fund Index Returns (%)# 6.60 7.02 7.59 7.88 7.76 7.66
Total Value of CRISIL 1 Year T-Bill Index## 1,23,616 3,96,954 7,15,571 10,81,560 17,01,525 21,96,508
CRISIL 1 Year T-Bill Index Returns (%)## 5.62 6.44 6.98 7.10 6.79 6.62
IDFC Money Manager Fund - Investment Plan - Regular Plan - Growth
1 Year 3 Years 5 Years 7 Years 10 Years Since InceptionAug 09, 2004
Total Amount Invested (`) 1,20,000 3,60,000 6,00,000 8,40,000 12,00,000 16,20,000
Total Value as on January 31, 2018 (`) 1,22,386 3,98,039 7,25,374 11,14,677 18,11,042 28,28,101
Fund Returns (%) 3.70 6.63 7.52 7.95 7.98 7.86
Total Value of CRISIL AAA Short Term Index# 1,23,527 4,03,162 7,37,953 11,39,217 18,72,131 29,85,523
CRISIL AAA Short Term Index Returns (%)# 5.48 7.49 8.21 8.56 8.61 8.59
Total Value of CRISIL 1 Year T-Bill Index## 1,23,616 3,96,954 7,15,571 10,81,560 17,01,501 25,62,260
CRISIL 1 Year T-Bill Index Returns (%)## 5.62 6.44 6.98 7.10 6.79 6.51
IDFC Money Manager Fund - Treasury Plan - Regular Plan - Growth
1 Year 3 Years 5 Years 7 Years 10 Years Since InceptionFeb 18, 2003
Total Amount Invested (`) 1,20,000 3,60,000 6,00,000 8,40,000 12,00,000 18,00,000
Total Value as on January 31, 2018 (`) 1,23,369 3,98,715 7,23,168 11,04,663 17,79,612 32,02,667
Fund Returns (%) 5.24 6.74 7.40 7.70 7.64 7.28
Total Value of Crisil Liquid Fund Index# 1,24,239 4,00,353 7,26,661 11,12,126 17,90,525 32,36,004
Crisil Liquid Fund Index Returns (%)# 6.60 7.02 7.59 7.88 7.76 7.41
Total Value of CRISIL 1 Year T-Bill Index## 1,23,616 3,96,954 7,15,571 10,81,560 17,01,480 29,73,460
CRISIL 1 Year T-Bill Index Returns (%)## 5.62 6.44 6.98 7.10 6.79 6.37
IDFC Banking & PSU Debt Fund - Regular Plan - Growth 1 Year 3 Years 5 Years 7 Years 10 Years Since InceptionMar 07, 2013
Total Amount Invested (`) 1,20,000 3,60,000 NA NA NA 5,90,000
Total Value as on January 31, 2018 (`) 1,22,981 3,96,623 NA NA NA 7,06,242
Fund Returns (%) 4.63 6.39 NA NA NA 7.25
Total Value of Crisil Short Term Bond Fund Index# 1,22,797 3,95,450 NA NA NA 7,03,075
Crisil Short Term Bond Fund Index Returns (%)# 4.34 6.19 NA NA NA 7.06
Total Value of CRISIL 1 Year T-Bill Index## 1,23,616 3,96,954 NA NA NA 7,01,488
CRISIL 1 Year T-Bill Index Returns (%)## 5.62 6.44 NA NA NA 6.97
IDFC Super Saver Income Fund - Short Term - Regular Plan - Growth
1 Year 3 Years 5 Years 7 Years 10 Years Since InceptionDec 14, 2000
Total Amount Invested (`) 1,20,000 3,60,000 6,00,000 8,40,000 12,00,000 20,60,000
Total Value as on January 31, 2018 (`) 1,23,058 3,99,064 7,27,290 11,15,674 18,10,538 41,91,222
Fund Returns (%) 4.75 6.80 7.62 7.97 7.97 7.73
Total Value of CRISIL AAA Short Term Index# 1,23,527 4,03,162 7,37,953 11,39,217 18,72,131 NA
CRISIL AAA Short Term Index Returns (%)# 5.48 7.49 8.21 8.56 8.61 NA
Total Value of CRISIL 1 Year T-Bill Index## 1,23,616 3,96,954 7,15,571 10,81,560 17,01,501 36,44,993
CRISIL 1 Year T-Bill Index Returns (%)## 5.62 6.44 6.98 7.10 6.79 6.28
Past performance may or may not be sustained in future.Dividends are assumed to be reinvested and bonus is adjusted. Load is not taken into consideration. To illustrate the advantages of SIP investment, this is how your investment would have grown if you had invested say `10,000 systematically on the first business Day of every month over a period of time. Returns are calculated by using XIRR approach. XIRR helps in calculating return on investment given an initial and final value and a series of cash inflows and outflows with the correct allowance for the time impact of the transactions. The performances given are of regular plan growth option. Regular and Direct Plans have different expense structure. Direct Plan shall have a lower expense ratio excluding distribution expenses, commission expenses etc. #Benchmark Returns. ##Alternate Benchmark Returns. Data as on January 31, 2018.

38
IDFC Corporate Bond Fund - Regular Plan - Growth 1 Year 3 Years 5 Years 7 Years 10 Years Since InceptionJan 12, 2016
Total Amount Invested (`) 1,20,000 NA NA NA NA 2,50,000
Total Value as on January 31, 2018 (`) 1,23,131 NA NA NA NA 2,68,565
Fund Returns (%) 4.86 NA NA NA NA 6.77
Total Value of CRISIL Short Term Bond Fund Index# 1,23,010 NA NA NA NA 2,67,750
CRISIL Short Term Bond Fund Index Returns (%)# 4.67 NA NA NA NA 6.48
Total Value of CRISIL 1 Year T-Bill Index## 1,23,616 NA NA NA NA 2,66,601
CRISIL 1 Year T-Bill Index Returns (%)## 5.62 NA NA NA NA 6.06
IDFC Super Saver Income Fund - Medium Term Plan - Regular Plan - Growth
1 Year 3 Years 5 Years 7 Years 10 Years Since InceptionJuly 08, 2003
Total Amount Invested (`) 1,20,000 3,60,000 6,00,000 8,40,000 12,00,000 17,50,000
Total Value as on January 31, 2018 (`) 1,22,162 3,97,743 7,24,895 11,10,473 18,25,217 32,59,476
Fund Returns (%) 3.35 6.58 7.49 7.84 8.13 8.07
Total Value of CRISIL Short Term Bond Fund Index# 1,23,010 4,01,291 7,35,260 11,30,806 18,31,691 32,02,200
CRISIL Short Term Bond Fund Index Returns (%)# 4.67 7.17 8.06 8.35 8.19 7.84
Total Value of CRISIL 1 Year T-Bill Index## 1,23,616 3,96,954 7,15,571 10,81,560 17,01,501 28,55,959
CRISIL 1 Year T-Bill Index Returns (%)## 5.62 6.44 6.98 7.10 6.79 6.41
IDFC Super Saver Income Fund - Investment Plan - Regular Plan - Growth
1 Year 3 Years 5 Years 7 Years 10 Years Since InceptionJul 14, 2000
Total Amount Invested (`) 1,20,000 3,60,000 6,00,000 8,40,000 12,00,000 21,00,000
Total Value as on January 31, 2018 (`) 1,19,522 3,92,396 7,23,175 11,17,244 18,12,882 43,82,673
Fund Returns (%) -0.74 5.67 7.40 8.01 8.00 7.84
Total Value of CRISIL Composite Bond Fund Index# 1,21,432 4,00,450 7,42,150 11,38,817 18,32,823 NA
CRISIL Composite Bond Fund Index Returns (%)# 2.22 7.03 8.43 8.55 8.20 NA
Total Value of CRISIL 10 Year Gilt Index## 1,17,105 3,84,253 7,04,264 10,64,043 16,66,286 NA
CRISIL 10 Year Gilt Index Returns (%)## -4.43 4.28 6.34 6.65 6.39 NA
IDFC Dynamic Bond Fund - Regular Plan - Growth 1 Year 3 Years 5 Years 7 Years 10 Years Since InceptionDec 03, 2008
Total Amount Invested (`) 1,20,000 3,60,000 6,00,000 8,40,000 NA 11,00,000
Total Value as on January 31, 2018 (`) 1,19,764 3,94,150 7,27,947 11,30,413 NA 16,30,640
Fund Returns (%) -0.36 5.97 7.66 8.34 NA 8.35
Total Value of CRISIL Composite Bond Fund Index# 1,21,432 4,00,450 7,42,150 11,38,817 NA 16,24,090
CRISIL Composite Bond Fund Index Returns (%)# 2.22 7.03 8.43 8.55 NA 8.27
Total Value of CRISIL 10 Year Gilt Index## 1,17,105 3,84,253 7,04,264 10,64,043 NA 14,80,912
CRISIL 10 Year Gilt Index Returns (%)## -4.43 4.28 6.34 6.65 NA 6.33
IDFC G Sec Fund - Investment Plan - Regular Plan - Growth 1 Year 3 Years 5 Years 7 Years 10 Years Since InceptionDec 03, 2008
Total Amount Invested (`) 1,20,000 3,60,000 6,00,000 8,40,000 NA 11,00,000
Total Value as on January 31, 2018 (`) 1,18,817 3,92,238 7,28,015 11,41,140 NA 16,50,893
Fund Returns (%) -1.82 5.64 7.66 8.61 NA 8.61
Total Value of I-Sec Composite Index# 1,21,251 3,99,064 7,41,145 11,45,420 NA 16,40,004
I-Sec Composite Index Returns (%)# 1.93 6.80 8.38 8.71 NA 8.47
Total Value of CRISIL 10 Year Gilt Index## 1,17,105 3,84,253 7,04,264 10,64,043 NA 14,80,912
CRISIL 10 Year Gilt Index Returns (%)## -4.43 4.28 6.34 6.65 NA 6.33
SIP PerformanceMonthly SIP of `10,000
IDFC G Sec Fund - PF Plan - Regular Plan - Growth 1 Year 3 Years 5 Years 7 Years 10 Years Since InceptionMar 29, 2004
Total Amount Invested (`) 1,20,000 3,60,000 6,00,000 8,40,000 12,00,000 16,70,000
Total Value as on January 31, 2018 (`) 1,19,202 3,96,809 7,41,472 11,64,625 19,23,376 32,44,392
Fund Returns (%) -1.23 6.42 8.40 9.18 9.12 9.02
Total Value of I-SEC Composite Index# 1,21,251 3,99,064 7,41,145 11,45,420 18,63,817 30,68,181
I-SEC Composite Index Returns (%)# 1.93 6.80 8.38 8.71 8.52 8.29
Total Value of CRISIL 10 Year Gilt Index## 1,17,105 3,84,253 7,04,264 10,64,043 16,66,286 26,39,477
CRISIL 10 Year Gilt Index Returns (%)## -4.43 4.28 6.34 6.65 6.39 6.30
IDFC G Sec Fund - Short Term Plan - Regular Plan - Growth 1 Year 3 Years 5 Years 7 Years 10 Years Since InceptionMar 09, 2002
Total Amount Invested (`) 1,20,000 3,60,000 6,00,000 8,40,000 12,00,000 19,10,000
Total Value as on January 31, 2018 (`) 1,22,973 4,02,746 7,46,580 11,55,149 18,16,688 33,48,141
Fund Returns (%) 4.62 7.42 8.67 8.95 8.04 6.68
Total Value of I-SEC Si-Bex# 1,23,445 4,01,183 7,31,063 11,18,592 18,04,627 NA
I-SEC Si-Bex Returns (%)# 5.35 7.16 7.83 8.05 7.91 NA
Total Value of CRISIL 1 Year T-Bill Index## 1,23,616 3,96,954 7,15,571 10,81,560 17,01,501 32,42,864
CRISIL 1 Year T-Bill Index Returns (%)## 5.62 6.44 6.98 7.10 6.79 6.31
Past performance may or may not be sustained in future.Dividends are assumed to be reinvested and bonus is adjusted. Load is not taken into consideration. To illustrate the advantages of SIP investment, this is how your investment would have grown if you had invested say `10,000 systematically on the first business Day of every month over a period of time. Returns are calculated by using XIRR approach. XIRR helps in calculating return on investment given an initial and final value and a series of cash inflows and outflows with the correct allowance for the time impact of the transactions. The performances given are of regular plan growth option. Regular and Direct Plans have different expense structure. Direct Plan shall have a lower expense ratio excluding distribution expenses, commission expenses etc. #Benchmark Returns. ##Alternate Benchmark Returns. Data as on January 31, 2018.

39
SIP PerformanceMonthly SIP of `10,000
IDFC Asset Allocation Fund of Fund - Conservative Plan Regular Plan - Growth
1 Year 3 Years 5 Years 7 Years 10 Years Since InceptionFeb 11, 2010
Total Amount Invested (`) 1,20,000 3,60,000 6,00,000 8,40,000 NA 9,60,000
Total Value as on January 31, 2018 (`) 1,25,024 4,11,928 7,67,713 11,95,659 NA 14,29,513
Fund Returns (%) 7.84 8.94 9.79 9.91 NA 9.73
Total Value of Crisil MIP Blended Fund Index# 1,23,724 4,11,710 7,70,588 11,93,231 NA 14,21,598
Crisil MIP Blended Fund Index Returns# 5.79 8.91 9.94 9.86 NA 9.59
Total Value of CRISIL 10 Year Gilt Index## 1,17,105 3,84,253 7,04,264 10,64,043 NA 12,55,975
CRISIL 10 Year Gilt Index Returns (%)## -4.43 4.28 6.34 6.65 NA 6.59
IDFC Asset Allocation Fund of Fund - Moderate Plan Regular Plan - Growth
1 Year 3 Years 5 Years 7 Years 10 Years Since InceptionFeb 11, 2010
Total Amount Invested (`) 1,20,000 3,60,000 6,00,000 8,40,000 NA 9,60,000
Total Value as on January 31, 2018 (`) 1,26,957 4,21,867 7,96,106 12,49,686 NA 14,99,837
Fund Returns 10.90 10.57 11.25 11.15 NA 10.89
Total Value of Crisil MIP Blended Fund Index# 1,23,724 4,11,710 7,70,588 11,93,231 NA 14,21,598
Crisil MIP Blended Fund Index Returns# 5.79 8.91 9.94 9.86 NA 9.59
Total Value of CRISIL 10 Year Gilt Index## 1,17,105 3,84,253 7,04,264 10,64,043 NA 12,55,975
CRISIL 10 Year Gilt Index Returns (%)## -4.43 4.28 6.34 6.65 NA 6.59
IDFC Asset Allocation Fund of Fund - Aggressive Plan Regular Plan - Growth
1 Year 3 Years 5 Years 7 Years 10 Years Since InceptionFeb 11, 2010
Total Amount Invested (`) 1,20,000 3,60,000 6,00,000 8,40,000 NA 9,60,000
Total Value as on January 31, 2018 (`) 1,29,728 4,36,063 8,34,265 13,14,291 NA 15,73,914
Fund Returns 15.33 12.84 13.14 12.56 NA 12.05
Total Value of CRISIL Balanced Fund –Aggressive Index# 1,31,632 4,50,173 8,68,536 13,80,896 NA 16,41,609
CRISIL Balanced Fund –Aggressive Index# 18.41 15.06 14.77 13.94 NA 13.07
Total Value of CRISIL 10 Year Gilt Index## 1,17,105 3,84,253 7,04,264 10,64,043 NA 12,55,975
CRISIL 10 Year Gilt Index Returns (%)## -4.43 4.28 6.34 6.65 NA 6.59
Past performance may or may not be sustained in future.Dividends are assumed to be reinvested and bonus is adjusted. Load is not taken into consideration. To illustrate the advantages of SIP investment, this is how your investment would have grown if you had invested say `10,000 systematically on the first business Day of every month over a period of time. Returns are calculated by using XIRR approach. XIRR helps in calculating return on investment given an initial and final value and a series of cash inflows and outflows with the correct allowance for the time impact of the transactions. The performances given are of regular plan growth option. Regular and Direct Plans have different expense structure. Direct Plan shall have a lower expense ratio excluding distribution expenses, commission expenses etc. #Benchmark Returns. ##Alternate Benchmark Returns. Data as on January 31, 2018.
Date Plan Dividend NAV
IDFC Classic Equity Fund
27-Feb-17 Regular Plan 1.18 15.0036
29-Feb-16 Regular Plan 1.00 11.7719
25-Feb-15 Regular Plan 1.50 15.5029
IDFC Sterling Equity Fund
10-Mar-17 Regular Plan 1.31 18.6235
21-Mar-16 Regular Plan 1.50 15.8685
16-Mar-15 Regular Plan 2.00 20.4495
IDFC Premier Equity Fund
10-Mar-17 Regular Plan 2.32 33.0348
08-Mar-16 Regular Plan 3.50 31.4878
02-Mar-15 Regular Plan 4.50 39.3952
IDFC Focused Equity Fund
10-Nov-17 Regular Plan 2.00 15.6283
24-Jan-17 Regular Plan 1.00 12.1368
28-Jan-16 Regular Plan 1.00 11.5036
23-Jan-15 Regular Plan 1.50 15.4594
IDFC Equity Fund
10-Mar-17 Regular Plan 0.83 13.8551
14-Mar-16 Regular Plan 1.00 12.5271
09-Mar-15 Regular Plan 1.50 16.2722
IDFC Balanced Fund
13-Nov-17 Regular Plan 0.20 10.7448
22-Aug-17 Regular Plan 0.30 10.7588
IDFC Arbitrage Fund
30-Jan-18 Reg Plan Monthly 0.08 12.7210
Dividend HistoryLast 3 Gross Dividends (`/unit) :
Date Plan Dividend NAV
28-Dec-17 Reg Plan Monthly 0.05 12.6861
28-Nov-17 Reg Plan Monthly 0.05 12.6856
29-Mar-17 Reg Plan Annually 1.05 11.4737
IDFC Arbitrage Plus Fund
30-Jan-18 Reg Plan Monthly 0.07 12.1002
28-Dec-17 Reg Plan Monthly 0.03 12.0575
28-Nov-17 Reg Plan Monthly 0.03 12.0588
29-Mar-17 Reg Plan Annually 0.15 10.7249
17-Mar-16 Reg Plan Annually 0.50 10.5424
Date Plan Freq Dividend NAV
IDFC Tax Advantage Fund
18-Sep-17 Reg Plan - 0.62 18.1086
27-Feb-17 Reg Plan - 1.24 15.6964
29-Feb-16 Reg Plan - 1.40 13.0529
IDFC Monthly Income Plan
30-Jan-18 Reg Plan Dividend 0.0660 13.1261
28-Dec-17 Reg Plan Dividend 0.0656 13.0966
29-Nov-17 Reg Plan Dividend 0.0767 13.1831
21-Dec-17 Reg Plan Quarterly 0.2003 13.4311
21-Sep-17 Reg Plan Quarterly 0.2400 13.4916
27-Jun-17 Reg Plan Quarterly 0.2700 13.4949
IDFC Asset Allocation Fund of Fund - CP
29-Nov-17 Reg Plan Dividend 0.2165 14.4607
30-Aug-17 Reg Plan Dividend 0.2200 14.4045
30-May-17 Reg Plan Dividend 0.0700 14.1444
Date Plan Freq Dividend NAV
IDFC Asset Allocation Fund of Fund - MP
29-Nov-17 Reg Plan Dividend 0.2625 16.2043
30-Aug-17 Reg Plan Dividend 0.2600 16.0316
30-May-17 Reg Plan Dividend 0.0500 15.6530
IDFC Asset Allocation Fund of Fund - AP
29-Nov-17 Reg Plan Dividend 0.2986 17.1563
30-Aug-17 Reg Plan Dividend 0.2900 16.7727
30-May-17 Reg Plan Dividend 0.0400 16.2893
IDFC Dynamic Equity Fund
19-Jan-18 Reg Plan - 0.20 11.3148
11-Oct-17 Reg Plan - 0.19 10.9672
14-Jul-17 Reg Plan - 0.19 10.9475
IDFC Corporate Bond Fund
30-Jan-18 Reg Plan Monthly 0.0280 10.5430
29-Nov-17 Reg Plan Monthly 0.0165 10.5315
30-Oct-17 Reg Plan Monthly 0.0605 10.5755
30-Aug-16 Reg Plan Dividend 0.4200 10.6393
17-Mar-16 Reg Plan Dividend 0.0497 10.1017
21-Dec-17 Reg Plan Quarterly 0.0876 10.4663
21-Sep-17 Reg Plan Quarterly 0.1900 10.5864
27-Jun-17 Reg Plan Quarterly 0.2300 10.6344
21-Sep-17 Reg Plan Half Yearly 0.4200 11.0211
22-Mar-17 Reg Plan Half Yearly 0.0800 10.6551
22-Sep-16 Reg Plan Half Yearly 0.2100 10.5177
IDFC All Seasons Bond Fund
21-Sep-17 Reg Plan Half Yearly 0.4700 12.0909

40
Dividend HistoryLast 3 Gross Dividends (`/unit) :
Date Plan Freq Dividend NAV
30-Oct-17 Reg Plan Monthly 0.0437 10.3077
27-Sep-17 Reg Plan Monthly 0.0168 10.2808
21-Dec-17 Reg Plan Quarterly 0.0779 10.9391
21-Sep-17 Reg Plan Quarterly 0.2000 11.0814
27-Jun-17 Reg Plan Quarterly 0.1800 11.0753
29-Mar-17 Reg Plan Annually 0.8000 10.9709
17-Mar-16 Reg Plan Annually 0.0166 10.0537
19-Mar-15 Reg Plan Annually 0.3937 10.4439
IDFC Super Saver Income Fund - Short Term Plan
29-Nov-17 Reg Plan Monthly 0.0173 10.1786
30-Oct-17 Reg Plan Monthly 0.0599 10.2212
27-Sep-17 Reg Plan Monthly 0.0219 10.1832
IDFC SSIF - Medium Term Plan
29-Nov-17 Reg Plan Monthly 0.0224 10.1858
30-Oct-17 Reg Plan Monthly 0.0334 10.1968
27-Sep-17 Reg Plan Monthly 0.0046 10.1680
29-Nov-17 Reg Plan BiMonthly 0.0701 11.6607
27-Sep-17 Reg Plan BiMonthly 0.0800 11.6770
28-Jul-17 Reg Plan BiMonthly 0.1600 11.7594
21-Dec-17 Reg Plan Quarterly 0.0564 10.7462
21-Sep-17 Reg Plan Quarterly 0.1600 10.8683
27-Jun-17 Reg Plan Quarterly 0.2400 10.9663
IDFC Super Saver Income Fund - Investment Plan
21-Sep-17 Reg Plan Quarterly 0.0900 11.5802
27-Jun-17 Reg Plan Quarterly 0.5300 12.0794
22-Dec-16 Reg Plan Quarterly 0.4800 12.0174
21-Sep-17 Reg Plan Half Yearly 0.5100 11.9865
22-Mar-17 Reg Plan Half Yearly 0.4000 11.9401
22-Sep-16 Reg Plan Half Yearly 0.7699 12.1839
29-Mar-17 Reg Plan Annually 1.3100 12.5084
17-Mar-16 Reg Plan Annually 7.5057 18.5321
30-Mar-09 Reg Plan Annually 0.9347 10.9413
IDFC GSF - Provident Fund Plan
21-Sep-17 Reg Plan Quarterly 0.0900 12.2178
27-Jun-17 Reg Plan Quarterly 0.6900 12.8921
22-Dec-16 Reg Plan Quarterly 0.5500 12.7347
29-Mar-17 Reg Plan Annually 1.5100 12.7204
17-Mar-16 Reg Plan Annually 0.4930 11.5107
19-Mar-15 Reg Plan Annually 1.2994 12.2485
IDFC Dynamic Bond Fund
22-Mar-17 Reg Plan - 1.1800 11.4289
17-Mar-16 Reg Plan - 0.4301 10.5543
09-Mar-15 Reg Plan - 1.0833 11.1583
Date Plan Freq Dividend NAV
22-Mar-17 Reg Plan Half Yearly 0.3600 11.9931
22-Sep-16 Reg Plan Half Yearly 0.5800 12.1717
21-Dec-17 Reg Plan Quarterly 0.0755 12.3874
21-Sep-17 Reg Plan Quarterly 0.2200 12.5512
27-Jun-17 Reg Plan Quarterly 0.2500 12.5902
29-Mar-17 Reg Plan Annually 1.0300 12.4920
17-Mar-16 Reg Plan Annually 6.8962 18.3093
IDFC Cash Fund
30-Jan-18 Reg Plan Monthly 5.9269 1006.2570
28-Dec-17 Reg Plan Monthly 4.9824 1005.3125
29-Nov-17 Reg Plan Monthly 5.1570 1005.4871
30-Oct-17 Reg Plan Monthly 5.7701 1006.1002
12-Sep-14 Reg Plan Periodic 208.4395 1277.5068
29-Dec-11 Reg Plan Periodic 17.6009 1003.3606
IDFC Ultra Short Term Fund
30-Jan-18 Reg Plan Monthly 0.0512 10.1535
28-Dec-17 Reg Plan Monthly 0.0252 10.1275
29-Nov-17 Reg Plan Monthly 0.0449 10.1472
12-Sep-14 Reg Plan Periodic 0.9994 11.0480
28-May-13 Reg Plan Periodic 0.6317 10.6676
30-Jan-12 Reg Plan Periodic 0.2375 10.0287
21-Dec-17 Reg Plan Quarterly 0.1414 10.7755
21-Sep-17 Reg Plan Quarterly 0.1600 10.7922
27-Jun-17 Reg Plan Quarterly 0.2000 10.8206
IDFC Money Manager Fund - Treasury Plan
30-Jan-18 Reg Plan Monthly 0.0437 10.2940
28-Dec-17 Reg Plan Monthly 0.0132 10.2635
29-Nov-17 Reg Plan Monthly 0.0365 10.2868
IDFC Banking & PSU Debt Fund
30-Jan-18 Reg Plan Monthly 0.0362 10.1902
29-Nov-17 Reg Plan Monthly 0.0089 10.1629
30-Oct-17 Reg Plan Monthly 0.0749 10.2289
21-Dec-17 Reg Plan Quarterly 0.0968 10.5839
21-Sep-17 Reg Plan Quarterly 0.1800 10.6759
27-Jun-17 Reg Plan Quarterly 0.1500 10.6574
29-Mar-17 Reg Plan Annually 0.7600 10.8781
17-Mar-16 Reg Plan Annually 0.8038 10.9061
19-Mar-15 Reg Plan Annually 0.3851 10.4500
22-Mar-17 Reg Plan - 0.7400 10.8523
17-Mar-16 Reg Plan - 0.8028 10.8927
19-Mar-15 Reg Plan - 0.4276 10.4802
IDFC Money Manager Fund - Investment Plan
29-Nov-17 Reg Plan Monthly 0.0272 10.2912
Date Plan Freq Dividend NAV
21-Sep-17 Reg Plan Quarterly 0.0900 10.9025
27-Jun-17 Reg Plan Quarterly 0.3800 11.2504
22-Mar-17 Reg Plan Quarterly 0.0100 10.8682
29-Mar-17 Reg Plan Annually 1.2800 11.9631
17-Mar-16 Reg Plan Annually 0.4466 10.9642
19-Mar-15 Reg Plan Annually 0.7439 11.2106
21-Sep-17 Reg Plan Half Yearly 0.4700 10.8110
22-Mar-17 Reg Plan Half Yearly 0.3800 10.7821
22-Sep-16 Reg Plan Half Yearly 0.7000 10.9913
IDFC GSF – Investment Plan
21-Sep-17 Reg Plan Quarterly 0.0700 11.0734
27-Jun-17 Reg Plan Quarterly 0.5900 11.6684
22-Dec-16 Reg Plan Quarterly 0.4700 11.5396
29-Mar-17 Reg Plan Annually 1.3300 11.8844
17-Mar-16 Reg Plan Annually 0.3913 10.7679
19-Mar-15 Reg Plan Annually 0.9708 11.2875
22-Mar-17 Reg Plan - 1.2400 11.5375
17-Mar-16 Reg Plan - 0.3826 10.5257
19-Mar-15 Reg Plan - 0.7667 11.2234
21-Sep-17 Reg Plan Half Yearly 0.5200 11.2040
22-Mar-17 Reg Plan Half Yearly 0.3600 11.1213
22-Sep-16 Reg Plan Half Yearly 0.8100 11.4303
IDFC GSF - Short Term Plan
29-Nov-17 Reg Plan Monthly 0.0281 10.4324
30-Oct-17 Reg Plan Monthly 0.0342 10.4385
27-Sep-17 Reg Plan Monthly 0.0230 10.4273
21-Dec-17 Reg Plan Quarterly 0.0676 10.7456
21-Sep-17 Reg Plan Quarterly 0.2000 10.8810
27-Jun-17 Reg Plan Quarterly 0.3100 10.9939
IDFC Credit Opportunities Fund
21-Dec-17 Reg Plan Quarterly 0.0815 10.1633
21-Sep-17 Reg Plan Quarterly 0.1800 10.2782
27-Jun-17 Reg Plan Quarterly 0.2000 10.3088
Dividend is not guaranteed and past performance may or may not be sustained in future. Pursuant to payment of dividend, the NAV of the scheme would fall to the extent of payout and statutory levy (as applicable). Dividend received is subject to applicable dividend distribution tax. Face Value of all above schemes (excluding IDFC Cash Fund) is `10/- per unit. Face value of IDFC Cash Fund is `1000/- per unit. Past performance may or may not be sustained in future.
Total Experience of Fund Managers
Name Years Name Years
Mr. Anoop Bhaskar – Head Equity 27+ Mr. Harshal Joshi 9+
Mr. Anurag Mittal 10+ Ms. Khushboo Sharma 6+
Mr. Arpit Kapoor 12+ Mr. Rajendra Mishra 15+
Mr. Arvind Subramanian 7+ Mr. Sumit Agrawal 12+
Mr. Bhavin Patadia 8+ Mr. Suyash Choudhary - Head Fixed Income 16+
Mr. Daylynn Pinto 12+ Mr. Yogik Pitti 10+
Fund Manager Details

41
How to read Factsheet
Fund Manager
An employee of the asset management company such as a mutual fund or life
insurer, who manages investments of the scheme. He is usually part of a larger
team of fund managers and research analysts.
Application Amount for Fresh Subscription
This is the minimum investment amount for a new investor in a mutual fund
scheme,
Minimum Additional Amount
This is the minimum investment amount for an existing investor in a mutual
fund scheme.
Yield to Maturity
The Yield to Maturity or the YTM is the rate of return anticipated on a bond
if held until maturity. YTM is expressed as an annual rate. The YTM factors in
the bond’s current market price, par value, coupon interest rate and time to
maturity.
SIP
SIP or systematic investment plan works on the principle of making periodic
investments of a fixed sum. It works similar to a recurring bank deposit. For
instance, an investor may opt for an SIP that invests Rs 500 every 15th of the
month in an equity fund for a period of three years.
NAV
The NAV or the net asset value is the total asset value per unit of the
mutual fund after deducting all related and permissible expenses. The NAV
is calculated at the end of every business day. It is the value at which the
investor enters or exits the mutual fund.
Benchmark
A group of securities, usually a market index, whose performance is used
as a standard or benchmark to measure investment performance of mutual
funds, among other investments. Some typical benchmarks include the Nifty,
Sensex, BSE200, BSE500, 10-Year Gsec.
Entry Load
A mutual fund may have a sales charge or load at the time of entry and/or
exit to compensate the distributor/agent. Entry load is charged at the time an
investor purchases the units of a mutual fund. The entry load is added to the
prevailing NAV at the time of investment. For instance, if the NAV is `100 and
the entry load is 1%, the investor will enter the fund at `101.
Note: SEBI, vide circular dated June 30, 2009 has abolished entry loan and
mandated that the upfront commission to distributors will be paid by the
investor directly to the distributor, based on his assessment of various factors
including the services rendered by the distributor.
Exit Load
Exit load is charged at the time an investor redeems the units of a mutual fund. The exit load is deducted from the prevailing NAV at the time of redemption. For instance, if the NAV is ` 100 and the exit load is 1%, the redemption price would be ` s99 per unit.
Modified Duration
Modified duration is the price sensitivity and the percentage change in price for a unit change in yield
Standard Deviation
Standard deviation is a statistical measure of the range of an investment’s performance. When a mutual fund has a high standard deviation, its means its range of performance is wide, implying greater volatility.
Sharpe Ratio
The Sharpe Ratio, named after its founder, the Nobel Laureate William Sharpe, is a measure of risk-adjusted returns. It is calculated using standard deviation and excess return to determine reward per unit of risk.
Beta
Beta is a measure of an investment’s volatility vis-a-vis the market. Beta of less than 1 means that the security will be less volatile than the market. A beta of greater than 1 implies that the security’s price will be more volatile than the market.
AUM
AUM or assets under management refers to the recent / updated cumulative market value of investments managed by a mutual fund or any investment firm.
Holdings
The holdings or the portfolio is a mutual fund’s latest or updated reported statement of investments/securities. These are usually displayed in terms of percentage to net assets or the rupee value or both. The objective is to give investors an idea of where their money is being invested by the fund manager.
Nature of Scheme
The investment objective and underlying investments determine the nature of the mutual fund scheme. For instance, a mutual fund that aims at generating capital appreciation by investing in stock markets is an equity fund or growth fund. Likewise, a mutual fund that aims at capital preservation by investing in debt markets is a debt fund or income fund. Each of these categories may have sub-categories.
Rating Profile
Mutual funds invest in securities after evaluating their creditworthiness as disclosed by the ratings. A depiction of the mutual fund in various investments based on their ratings becomes the rating profile of the fund. Typically, this is a feature of debt funds.
Investment Objective
IDFC Classic Equity Fund The investment objective of the Scheme is to seek to generate long term capital growth from a diversified portfolio of predominantly equity and equity related instruments. However, there is no assurance or guarantee that the objectives of the scheme will be realized.
IDFC Sterling Equity Fund The investment objective of the Scheme is to seek to generate capital appreciation from a diversified portfolio of equity and equity related instruments. The Scheme will predominantly invest in small and midcap equity and equity related instruments. Small and Midcap equity and equity related instruments will be the stocks included in the Nifty Free Float Midcap 100 or equity and equity related instruments of such companies which have a market capitalization lower than the highest components of Nifty Free Float Midcap 100. The Scheme may also invest in stocks other than mid cap stocks (i.e. in stocks, which have a market capitalisation of above the market capitalisation range of the defined small - midcap stocks) and derivatives. On defensive consideration, the Scheme may also invest in debt and money market instruments. In case of discontinuation / suspension of Nifty Free Float Midcap 100, the AMC reserves the right to modify the definition of Mid cap and Small cap companies. In case of such a modification, the interest of investors will be of paramount importance. There can be no assurance that the investment objective of the scheme will be realized.
IDFC Premier Equity Fund The Scheme shall seek to generate long-term capital growth from an actively managed portfolio of predominantly equity and equity related instruments. The Scheme portfolio would acquire, inter alia, small and medium size businesses with good long term potential, which are available at cheap valuations. Such securities would be identified through disciplined fundamental research keeping in view medium to long-term trends in the business environment. The Scheme shall endeavor to accumulate long-term investor wealth by opening subscriptions to units during periods when stocks are available at reasonable valuations. By doing so, the Fund managers would endeavor to prevent short-term money from flowing into the fund which can prove detrimental to the interests of long-term investors. As the scheme would be sold to investors with a long-term investment horizon, it is also expected that the portfolio would remain relatively more insulated to day to day redemption pressures. The fund will close subscription, once it has collected a predetermined “manageable” corpus (approximate amount), which will be decided by the fund manager of the scheme depending on the available investment opportunities in the stock market / if the fund manager is of the opinion that investment opportunities have diminished. Thus the fund manager will endeavour to ensure that there are sufficient assets available to meet the long-term objectives of the fund.
IDFC Focused Equity Fund The investment objective of the Scheme is seek to generate capital appreciation by investing in a concentrated portfolio of equity and equity related instruments up to 30 companies. There is no assurance or guarantee that the objectives of the scheme will be realized.
IDFC Equity Fund The investment objective of the scheme is to seek to generate capital growth from a portfolio of predominantly equity and equity related instruments (including Equity Derivatives). The scheme may also invest in debt & money market instruments to generate reasonable income. However there is no assurance or guarantee that the objectives of the scheme will be realized.
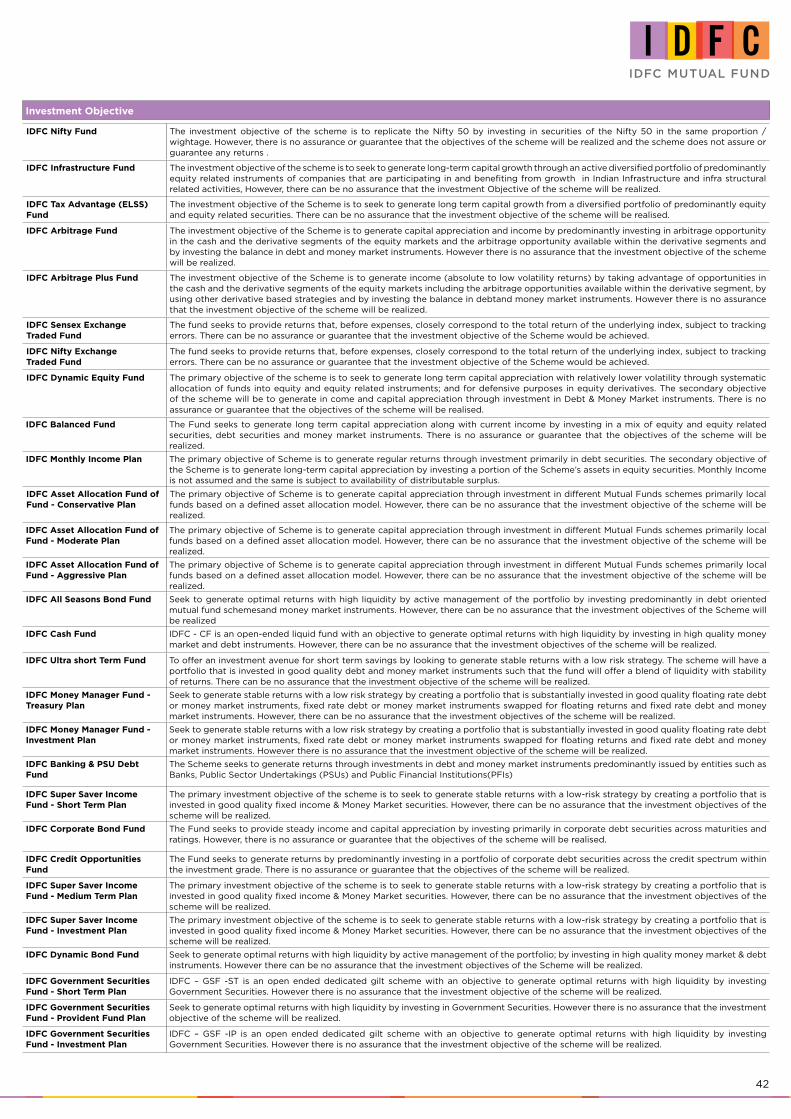
42
Investment Objective
IDFC Nifty Fund The investment objective of the scheme is to replicate the Nifty 50 by investing in securities of the Nifty 50 in the same proportion / wightage. However, there is no assurance or guarantee that the objectives of the scheme will be realized and the scheme does not assure or guarantee any returns .
IDFC Infrastructure Fund The investment objective of the scheme is to seek to generate long-term capital growth through an active diversified portfolio of predominantly equity related instruments of companies that are participating in and benefiting from growth in Indian Infrastructure and infra structural related activities, However, there can be no assurance that the investment Objective of the scheme will be realized.
IDFC Tax Advantage (ELSS) Fund
The investment objective of the Scheme is to seek to generate long term capital growth from a diversified portfolio of predominantly equity and equity related securities. There can be no assurance that the investment objective of the scheme will be realised.
IDFC Arbitrage Fund The investment objective of the Scheme is to generate capital appreciation and income by predominantly investing in arbitrage opportunity in the cash and the derivative segments of the equity markets and the arbitrage opportunity available within the derivative segments and by investing the balance in debt and money market instruments. However there is no assurance that the investment objective of the scheme will be realized.
IDFC Arbitrage Plus Fund The investment objective of the Scheme is to generate income (absolute to low volatility returns) by taking advantage of opportunities in the cash and the derivative segments of the equity markets including the arbitrage opportunities available within the derivative segment, by using other derivative based strategies and by investing the balance in debtand money market instruments. However there is no assurance that the investment objective of the scheme will be realized.
IDFC Sensex Exchange Traded Fund
The fund seeks to provide returns that, before expenses, closely correspond to the total return of the underlying index, subject to tracking errors. There can be no assurance or guarantee that the investment objective of the Scheme would be achieved.
IDFC Nifty Exchange Traded Fund
The fund seeks to provide returns that, before expenses, closely correspond to the total return of the underlying index, subject to tracking errors. There can be no assurance or guarantee that the investment objective of the Scheme would be achieved.
IDFC Dynamic Equity Fund The primary objective of the scheme is to seek to generate long term capital appreciation with relatively lower volatility through systematic allocation of funds into equity and equity related instruments; and for defensive purposes in equity derivatives. The secondary objective of the scheme will be to generate in come and capital appreciation through investment in Debt & Money Market instruments. There is no assurance or guarantee that the objectives of the scheme will be realised.
IDFC Balanced Fund The Fund seeks to generate long term capital appreciation along with current income by investing in a mix of equity and equity related securities, debt securities and money market instruments. There is no assurance or guarantee that the objectives of the scheme will be realized.
IDFC Monthly Income Plan The primary objective of Scheme is to generate regular returns through investment primarily in debt securities. The secondary objective of the Scheme is to generate long-term capital appreciation by investing a portion of the Scheme’s assets in equity securities. Monthly Income is not assumed and the same is subject to availability of distributable surplus.
IDFC Asset Allocation Fund of Fund - Conservative Plan
The primary objective of Scheme is to generate capital appreciation through investment in different Mutual Funds schemes primarily local funds based on a defined asset allocation model. However, there can be no assurance that the investment objective of the scheme will be realized.
IDFC Asset Allocation Fund of Fund - Moderate Plan
The primary objective of Scheme is to generate capital appreciation through investment in different Mutual Funds schemes primarily local funds based on a defined asset allocation model. However, there can be no assurance that the investment objective of the scheme will be realized.
IDFC Asset Allocation Fund of Fund - Aggressive Plan
The primary objective of Scheme is to generate capital appreciation through investment in different Mutual Funds schemes primarily local funds based on a defined asset allocation model. However, there can be no assurance that the investment objective of the scheme will be realized.
IDFC All Seasons Bond Fund Seek to generate optimal returns with high liquidity by active management of the portfolio by investing predominantly in debt oriented mutual fund schemesand money market instruments. However, there can be no assurance that the investment objectives of the Scheme will be realized
IDFC Cash Fund IDFC - CF is an open-ended liquid fund with an objective to generate optimal returns with high liquidity by investing in high quality money market and debt instruments. However, there can be no assurance that the investment objectives of the scheme will be realized.
IDFC Ultra short Term Fund To offer an investment avenue for short term savings by looking to generate stable returns with a low risk strategy. The scheme will have a portfolio that is invested in good quality debt and money market instruments such that the fund will offer a blend of liquidity with stability of returns. There can be no assurance that the investment objective of the scheme will be realized.
IDFC Money Manager Fund - Treasury Plan
Seek to generate stable returns with a low risk strategy by creating a portfolio that is substantially invested in good quality floating rate debt or money market instruments, fixed rate debt or money market instruments swapped for floating returns and fixed rate debt and money market instruments. However, there can be no assurance that the investment objectives of the scheme will be realized.
IDFC Money Manager Fund - Investment Plan
Seek to generate stable returns with a low risk strategy by creating a portfolio that is substantially invested in good quality floating rate debt or money market instruments, fixed rate debt or money market instruments swapped for floating returns and fixed rate debt and money market instruments. However there is no assurance that the investment objective of the scheme will be realized.
IDFC Banking & PSU Debt Fund
The Scheme seeks to generate returns through investments in debt and money market instruments predominantly issued by entities such as Banks, Public Sector Undertakings (PSUs) and Public Financial Institutions(PFIs)
IDFC Super Saver Income Fund - Short Term Plan
The primary investment objective of the scheme is to seek to generate stable returns with a low-risk strategy by creating a portfolio that is invested in good quality fixed income & Money Market securities. However, there can be no assurance that the investment objectives of the scheme will be realized.
IDFC Corporate Bond Fund The Fund seeks to provide steady income and capital appreciation by investing primarily in corporate debt securities across maturities and ratings. However, there is no assurance or guarantee that the objectives of the scheme will be realised.
IDFC Credit Opportunities Fund
The Fund seeks to generate returns by predominantly investing in a portfolio of corporate debt securities across the credit spectrum within the investment grade. There is no assurance or guarantee that the objectives of the scheme will be realized.
IDFC Super Saver Income Fund - Medium Term Plan
The primary investment objective of the scheme is to seek to generate stable returns with a low-risk strategy by creating a portfolio that is invested in good quality fixed income & Money Market securities. However, there can be no assurance that the investment objectives of the scheme will be realized.
IDFC Super Saver Income Fund - Investment Plan
The primary investment objective of the scheme is to seek to generate stable returns with a low-risk strategy by creating a portfolio that is invested in good quality fixed income & Money Market securities. However, there can be no assurance that the investment objectives of the scheme will be realized.
IDFC Dynamic Bond Fund Seek to generate optimal returns with high liquidity by active management of the portfolio; by investing in high quality money market & debt instruments. However there can be no assurance that the investment objectives of the Scheme will be realized.
IDFC Government Securities Fund - Short Term Plan
IDFC – GSF -ST is an open ended dedicated gilt scheme with an objective to generate optimal returns with high liquidity by investing Government Securities. However there is no assurance that the investment objective of the scheme will be realized.
IDFC Government Securities Fund - Provident Fund Plan
Seek to generate optimal returns with high liquidity by investing in Government Securities. However there is no assurance that the investment objective of the scheme will be realized.
IDFC Government Securities Fund - Investment Plan
IDFC – GSF -IP is an open ended dedicated gilt scheme with an objective to generate optimal returns with high liquidity by investing Government Securities. However there is no assurance that the investment objective of the scheme will be realized.


WESTAhmedabad B Wing, 3rd Floor, Chandan House Opp Gruh Finance, Mithakhali Six Roads, Law Garden, Tel.:079-26460923/925
Ahmedabad 380006.Bhopal Plot No. 49, First Floor, Above Tata Capital Limited, M P Nagar, Zone II, Bhopal [M.P.] - 462011.Bhilai 26, Commercial Complex, Nehru Nagar (East), Bhilai, Chhattisgarh, Pin - 490020. Mobile No. 8871144134.Goa F -27 & F -28, 1st Floor, Alfran Plaza, M.G Road, Opp. Don Bosco High School, Panjim - Goa. 403001, Tel.: +91-
0832-6631022.Indore 405, 4th Floor, 21/ 1, D. M. Tower, Race Course Road, Indore - 452 001. Tel.: +91-731-4206927/ 4208048. Fax:
+91-731-4206923.Mumbai ‘One IndiaBulls Centre’ 6th Floor, Jupiter Mills Compound, 841, Senapati Bapat Marg, Elphinstone (W) Mumbai
– 400013. Tel No. 6628 9999Mumbai (Churchgate)
2nd Floor,Ramon House , H.T Parekh Marg, 169,Backbay reclamation, Opp.Aakash wani, Churchgate 400020. Tel.:+912266289999.
Mumbai (Ghatkopar) Mumbai(Thane)
Office No. 308, Zest Business Spaces, M. G. Road, Ghatkopar (East), (Maharashtra) Mumbai- 400077.
Shop No. 1, Konark Towers, Ghantali Devi Road, Thane (West) 400602.
Nagpur Fortune Business Centre, First Floor, 6, VasantVihar, W. H. C. Rd., Shankar Nagar, Nagpur - 440 010. Tel.: +91-712-6451428/ 2525657.
Nasik Shop No - 6, Rajvee Enclave, New Pandit Colony, Off Sharanpur Road, Nasik - 422002. Tel.: 0253-2314611. Mobile: 9823456183.
Pune 1st Floor, Dr. Herekar Park Building, Next to Kamala Nehru Park, Off. Bhandarkar Road, Pune - 411 004. Tel.: +91-20-66020965/ 4.
Raipur T-19,III Floor, Raheja Tower, Near Hotel Celebration, Jail Road, Raipur (C G) - 492001. Tel: 0771-6900699.Rajkot “Star Plaza”, 2nd Floor, Office No. 201, Phulchab Chowk, Rajkot - 360 001. Tel.: +91-281-6620921 / 2475237.Surat U 15/16, Jolly Plaza, Athvagate, Surat - 395 001. Tel.: +91-261-2475060, 2475070.Vadodara 301, 2nd Floor, Earth Complex, Opposite Vaccine Ground, Above Indian Overseas Bank, Old Padra Road,
Vadodara - 380015. Tel No.: 0265 - 2339623/2339624/2339325.NORTHAgra Office No. 307A, 3rd Floor, Block #38/4A, Sumriddhi Business Suites, Sanjay Place, Agra - 282 002. Tel.:+91-
562-4064889Amritsar 6-FUF, 4th Floor Central Mall, Mall Road, Amritsar - 143001. Tel.:+911835030393.Chandigarh SCO 2475 - 76, 1st Floor, Sector 22, Chandigarh - 160 022. Tel.: +91 17 2507 1918 /5071919, Fax: +91-172-5071918.Dehradun G-12 B NCR Plaza, Ground Floor, 24 A, 112/28, Ravindranath Tagore Marg, New Cantt Road, Dehradun-248001.
Mobile: 9897934555, 8171872220Jaipur 301-A, 3rd Floor, Ambition Tower, Agersen Circle, Malan Ka Chaurah, Subash Marg, C-Scheme, Jaipur - 302 001.
Tel. No. : +91-0141- 2360945, 2360947, 2360948Jalandhar 1st floor, Satnam Complex, BMC Chowk, G.T.Road, Jalandhar-144001. Punjab-India. Tel.: 01815018264.Kanpur Office No. 214-215, IInd Floor, KAN Chambers, 14/113, Civil Lines, Kanpur - 208 001. Tel.: +91-512-2331071,
2331119.Lucknow 1st floor, Aryan Business Park, Exchange Cottage, 90.M.G. Marg, Park Road, Lucknow-226001, Mob: 9792999940,
Tel.: 0522-4928100 - 106, 0522-6888012Ludhiana SCO 124, 1st Floor, Feroze Gandhi Market, Ludhiana - 141 001. Tel.: 0161-5022155/ 56/ 57.New Delhi 4th Floor, NarainManzil, 23, Barakhamba Road, New Delhi - 110 001. Tel.: +91-11-47311301/ 02/ 03/ 04/ 05.Varanasi IDFC Asset Management Co. Ltd. 3rd Floor, Premise No. D-64/127, CH, Arihant Complex, Sigra Varanasi - 221010
(U.P). Phone No. 05422226527Gurgaon 117, 1st Floor, Vipul Agora, M. G. Road, Gurgaon - 122 001. Ph: 011-47311336.SOUTHBangalore 6th Floor, East Wing, Raheja Towers, #26 & 27, M. G. Road, Bangalore - 560 001. Tel.: +91-80-43079000/ 01/
02/ 03, Fax - +91-80-43079009.Chennai KRM Tower, 7th floor, No. 1, Harrington Road, Chetpet, Chennai - 600 031. Tel.: +91-44-45644201/ 202.Cochin 39/3993 B2, Gr. Floor, Vantage Point, VRM Rd, Ravipuram, Cochin - 682 016. Tel: +91-484-3012639/ 4029291,
Fax: +91-484-2358639.Coimbatore A Complex , No. 49, Father Randy Street, Azad Road, R. S. Puram, Coimbatore - 641 002. Hyderabad 6-3-885/7/C/2/S2, 2nd Floor, Amit Plaza, Somajiguda, Hyderabad - 500 082. Tel. No. : +91-40-42014646/47
Fax: +91-40-40037521.Madurai No.278, 1st Floor, Nadar Lane, North Perumal Maistry Street, Madurai - 625 001. Tel.: 0452-6455530.Mangalore Shop No 4, Ground Floor, Raj Towers, Balmatta Road, Mangalore – 575001. Tel. : +91 9845287279.Mysore CH 26, Shop No 1, 2nd Floor, 7th Main, 5th Cross ( Veta Building ) Saraswathipuram, Mysore - 570009.Trivandrum T.C.2/3262(6), 1st Floor, RS Complex, Opposite LIC Building, Pattom P O, Trivandrum - 695 004.
Tel. : 9809053381.EASTBhubaneswar Rajdhani House, 1st Floor, 77 Kharvel Nagar, Janpath, Bhubaneswar - 751001. Phone : 0674 6444252 / 0674
2531048 / 0674 2531148.Guwahati 4E, 4th Floor, Ganapati Enclave, G. S. Road, Ulubari, Opp. Bora Service Station, Guwahati - 781 007. Mobile:
9207410763, 9207410764, 9207410765, 9207410766.Jamshedpur IDFC Mutual Fund, Room No.111, 1st Floor, Yashkamal Complex, Main Road, Bistupur, Jamshedpur-831001, Ph No.
0657-2230112/111/222, Mobile No. : 9431102883.Kolkata Oswal Chambers, 1st Floor, 2 Church Lane, Kolkata - 700 001. Tel.: +91-33-40171000/ 1005.Patna 406, Ashiana Hariniwas, New Dakbanglow Road, Patna - 800 001. Tel.: +91-612-6510353. Ranchi : 306, Shrilok
Complex, 4 H B Road, Ranchi-834001 Phone : 0651-2212592/9931156362.Durgapur (West Bengal)
6/2A, Suhatta, 6th Floor, City Centre, Durgapur - 713216. Phone No.: +91 8537867746.
Mutual Fund investments are subject to market risks, read all scheme related documents carefully.