january 2017 home sales report
TRANSCRIPT

Relocation Information & Assistance 800.747.9962
CBSUCCESS.COM/RELOCATION
HOME SALES REPORT January 2017 (as of February 17, 2017)
Video
February 14, 2017
And We’re Off …
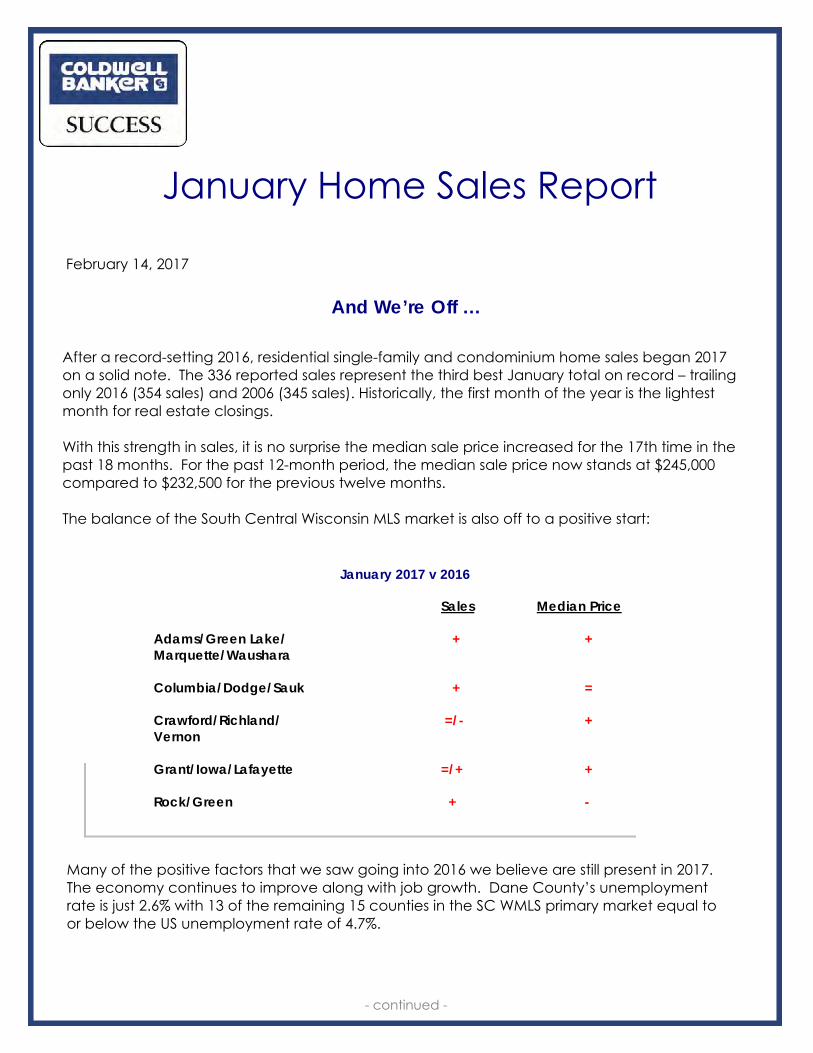
After a record-setting 2016, residential single-family and condominium home sales began 2017 on a solid note. The 336 reported sales represent the third best January total on record – trailing only 2016 (354 sales) and 2006 (345 sales). Historically, the first month of the year is the lightest month for real estate closings.
With this strength in sales, it is no surprise the median sale price increased for the 17th time in the past 18 months. For the past 12-month period, the median sale price now stands at $245,000 compared to $232,500 for the previous twelve months.
The balance of the South Central Wisconsin MLS market is also off to a positive start:
January 2017 v 2016
Sales Median Price
Adams/Green Lake/ + +Marquette/Waushara
Columbia/Dodge/Sauk + =
Crawford/Richland/ =/- + Vernon
Grant/Iowa/Lafayette =/+ +
Rock/Green + -
Many of the positive factors that we saw going into 2016 we believe are still present in 2017. The economy continues to improve along with job growth. Dane County’s unemployment rate is just 2.6% with 13 of the remaining 15 counties in the SC WMLS primary market equal to or below the US unemployment rate of 4.7%.
January Home Sales Report
- continued -

The consumer sentiment index in January, as measured by the University of Michigan, reached its highest level since January 2004. Consumers are optimistic about their jobs, their income and their futures.
Demand continues very strong – especially with more Millennials entering the home ownership market. According the National Association of REALTORS®, the average age of the first-time home buyer is 32 years. In 2017 4.4 million people in the United States will turn 32!
Factors that we will be watching closing as the year progresses include expected increases in the median sale prices – influenced by strong demand and very lean inventories in many markets. Dane County active inventory is 29% less than just one year ago, and 44% less than this time in 2015. For the entire region, active inventory is down 24% compared to last year and 37% compared to 2015.
Another factor to watch will be interest rates. For the week ending February 9, 2017, the average interest rate for a 30-year fixed rate mortgage was 4.17% per Freddie Mac. This is higher than consumers experienced in 2016, when rates stayed below the 4% mark for most of the year. However, we are reminded that during three of the most active real estate markets, interest rates were much higher:
2004: 2005: 2006:
5.84% average (5.45 – 6.29 range) 5.87% average (5.58 – 6.33 range) 6.41% average (6.14 – 6.76 range)
We do not expect interest rates to be the driver of demand as in the recent past but rather improved family wealth and a desire for change will be key factors. Don’t be surprised if buyers attempt to beat the spring market by acting quickly. Hopefully sellers will respond by listing their homes to take advantage of the demand.
- page 2 -

2017 2016 2015 201467 61 61 66
38 33 31 39
176,741 169,515 165,545 126,060
152,750 163,000 145,000 117,000
240 333 401 462
2017 2016 2015 2014523 637 593 637
336 354 327 284
271,152 264,315 245,429 237,053
240,000 232,725 217,500 205,750
1,024 1,433 1,835 2,198
2017 2016 2015 2014131 132 178 181
115 106 102 90
142,717 136,121 110,526 115,058
114,900 129,950 103,500 98,950
389 607 751 934
# New Listings
# New Listings
# Sales
Average Sale Price
JANUARY 2017 STATISTICSCOLUMBIA COUNTY
Current sales reported as of February 13, 2017 - More MLS statistics are available on CBSuccess.com.NOTE - This representation is based in whole or in part on data supplied to the South Central Wisconsin MLS Corporation by its Participants.
The MLS does not guarantee and is not responsible for its accuracy. Data maintained by the MLS does not reflect all real estate activity in the market.
Total # Active Residential Listings at end of Period
Median Sale Price
ROCK COUNTY
Total # Active Residential Listings at end of Period
DANE COUNTY
Average Sale Price
Median Sale Price
Total # Active Residential Listings at end of Period
# Sales
Average Sale Price
Median Sale Price
# New Listings
# Sales
South Central Wisconsin MLS Sold & Active Residential Listings (Including Condos)
46 2
71 3
85 7
126 12
139 10
169 17
171 10
167 22
250 51
335 39
290 49
283 56
246 47
516 83
436 63
580 106
285 50
297 16
119 6
105 3
4,716 652
279,760 240,625
199,900 200,000
Total Types
500,000 - 749,999
750,000 - 999,999
over 1,000,000
180,000 - 199,999
30,000 - 39,999
40,000 - 49,999
50,000 - 59,999
70,000 - 79,999
80,000 - 89,999
200,000 - 249,999
250,000 - 299,999
90,000 - 99,999
100,000 - 119,999
300,000 - 399,999
400,000 - 499,999
120,000 - 139,999
140,000 - 159,999
160,000 - 179,999
Single Family
PRICECLASS/TYPE
less than 30,000
Condo/Co-Op
CURRENT ACTIVE LISTINGS
60,000 - 69,999
Average price
Median price
4 10 3 0
9 599
8555
66 96
6 10 3 2
4333
7 14 8 4
4 16 4 4
15 24 9 8
10 32 7 12
3 34 12 14
4 25 13 12
6 24 18 9
6 60 44 20
4 45 41 5
1 20 38 8
1 9 23 2
0 2 16 0
1000
000 1
94 353 261 106
115,214 183,532 260,945 193,230
103,250 165,500 239,900 166,500 MEDIAN SOLD PRICE
TOTALS REPORTSOLD RESIDENTIAL LISTINGS
PRICE CLASS/TYPE
less than 30,000
30,000 - 39,999
90,000 - 99,999
50,000 - 59,999
750,000 - 999,999
160,000 - 179,999
400,000 - 499,999
60,000 - 69,999
70,000 - 79,999
80,000 - 89,999
Total Types
0-2Bedroom
3Bedroom
300,000 - 399,999
500,000 - 749,999
40,000 - 49,999
100,000 - 119,999
120,000 - 139,999
140,000 - 159,999
250,000 - 299,999
over 1,000,000
4+Bedroom
Condo/Co-Op
AVERAGE SOLD PRICE
180,000 - 199,999
200,000 - 249,999
*Sales for the month & current active listings are reported as of 2/13/17. The Current Active Listings Chart includes all listings available for showings,
including those with offers to purchase. This representation is based in whole or in part on data supplied to the South Central Wisconsin MLS
Corporation by its Participants. The MLS does not guarantee and is not responsible for its accuracy. Data maintained by the MLS does not reflect all
real estate activity in the market.

0
100
200
300
400
500
600
700
800
900
1000
1100
1200
1300
1400
1500
1600
1700
1800
1900
2000
2100
Num
ber o
f Hom
es Sold
Single Family Solds (Inc Condos)Reported by the South Central WI MLS as of 2/13/2017
Dane County Adams, Columbia, Crawford, Dane, Dodge, Grant, Green, Green Lake, Iowa, Lafayette, Marquette, Richland, Rock, Sauk, Vernon & Waushara Counties
Dane County SalesJanuary 2017 ‐ 336January 2016 ‐ 354 January 2015 ‐ 327
Regional County SalesJanuary 2017 ‐ 709January 2016 ‐ 679January 2015 ‐ 621
$100,000
$110,000
$120,000
$130,000
$140,000
$150,000
$160,000
$170,000
$180,000
$190,000
$200,000
$210,000
$220,000
$230,000
$240,000
$250,000
$260,000
$270,000
$280,000
$290,000
$300,000
Median Sale Price for Single Family Solds (Inc Condos)Reported by the South Central WI MLS as of 2/13/2017
Dane County MedianJanuary 2017 ‐ $240,000January 2016 ‐ $232,725January 2015 ‐ $217,500
Regional County MedianJanuary 2017 ‐ $186,000January 2016 ‐ $180,000January 2015 ‐ $165,000
1,000
1,500
2,000
2,500
3,000
3,500
4,000
4,500
5,000
5,500
6,000
6,500
7,000
7,500
8,000
8,500
9,000
9,500
10,000Num
ber o
f Active Listings
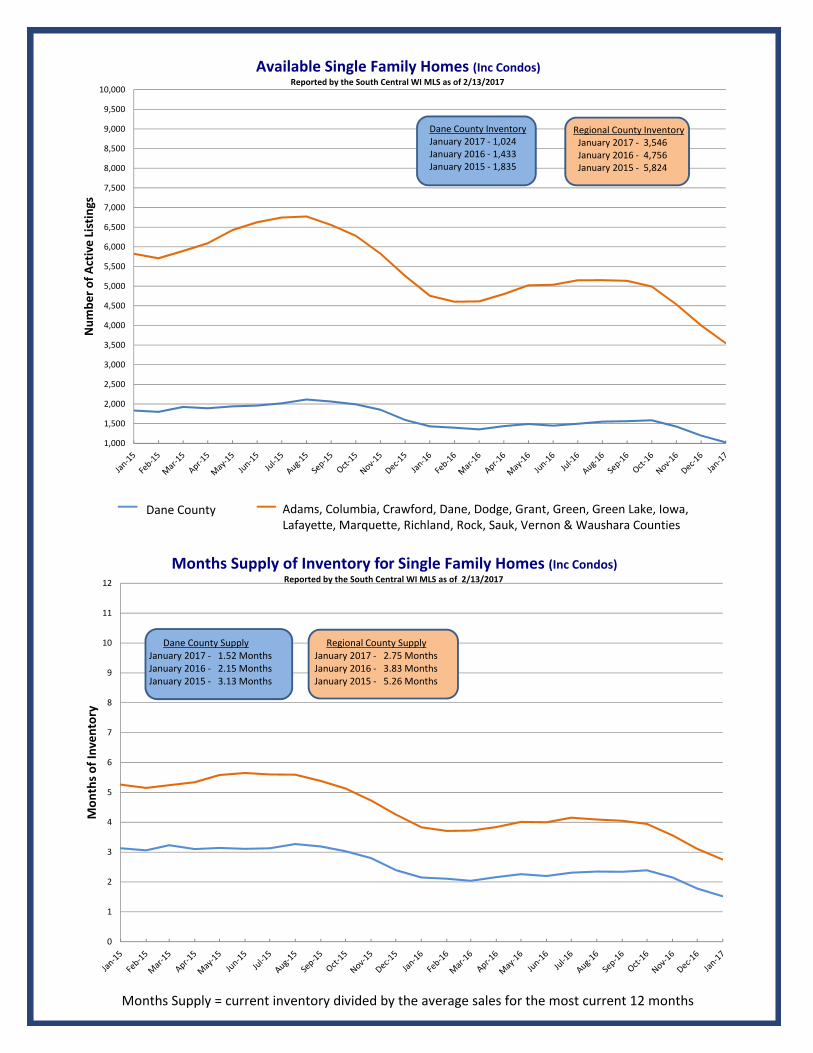
Available Single Family Homes (Inc Condos)Reported by the South Central WI MLS as of 2/13/2017
Dane County InventoryJanuary 2017 ‐ 1,024January 2016 ‐ 1,433January 2015 ‐ 1,835
Regional County InventoryJanuary 2017 ‐ 3,546January 2016 ‐ 4,756January 2015 ‐ 5,824
0
1
2
3
4
5
6
7
8
9
10
11
12
Mon
ths o
f Inven
tory
Months Supply of Inventory for Single Family Homes (Inc Condos)Reported by the South Central WI MLS as of 2/13/2017
Dane County SupplyJanuary 2017 ‐ 1.52 Months January 2016 ‐ 2.15 MonthsJanuary 2015 ‐ 3.13 Months
Regional County SupplyJanuary 2017 ‐ 2.75 MonthsJanuary 2016 ‐ 3.83 MonthsJanuary 2015 ‐ 5.26 Months
Months Supply = current inventory divided by the average sales for the most current 12 months
Dane County Adams, Columbia, Crawford, Dane, Dodge, Grant, Green, Green Lake, Iowa, Lafayette, Marquette, Richland, Rock, Sauk, Vernon & Waushara Counties

Market Update Video
View more Home Sales Reports &
Market Update Videos online
Real Estate Market Statistics—Jan 2017
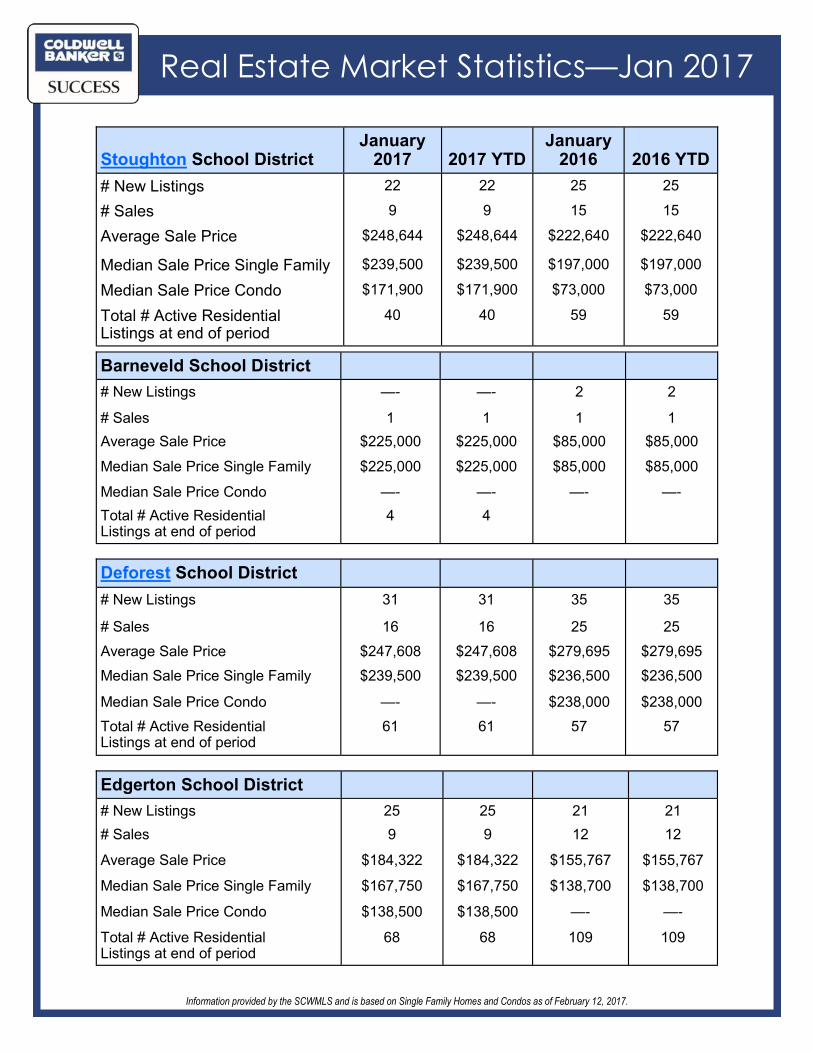
Information provided by the SCWMLS and is based on Single Family Homes and Condos as of February 12, 2017.
Barneveld School District
# New Listings —- —- 2 2
# Sales 1 1 1 1
Average Sale Price $225,000 $225,000 $85,000 $85,000
Median Sale Price Single Family $225,000 $225,000 $85,000 $85,000
Median Sale Price Condo —- —- —- —-
Total # Active Residential Listings at end of period
4 4
Edgerton School District
# New Listings 25 25 21 21
# Sales 9 9 12 12
Average Sale Price $184,322 $184,322 $155,767 $155,767
Median Sale Price Single Family $167,750 $167,750 $138,700 $138,700
Median Sale Price Condo $138,500 $138,500 —- —-
Total # Active Residential Listings at end of period
68 68 109 109
Deforest School District
# New Listings 31 31 35 35
# Sales 16 16 25 25
Average Sale Price $247,608 $247,608 $279,695 $279,695
Median Sale Price Single Family $239,500 $239,500 $236,500 $236,500
Median Sale Price Condo —- —- $238,000 $238,000
Total # Active Residential Listings at end of period
61 61 57 57
Stoughton School District January
2017 2017 YTD January
2016 2016 YTD
# New Listings 22 22 25 25
# Sales 9 9 15 15
Average Sale Price $248,644 $248,644 $222,640 $222,640
Median Sale Price Single Family $239,500 $239,500 $197,000 $197,000
Median Sale Price Condo $171,900 $171,900 $73,000 $73,000
Total # Active Residential Listings at end of period
40 40 59 59

Real Estate Market Statistics—Jan 2017
Information provided by the SCWMLS and is based on Single Family Homes and Condos as of February 12, 2017.
McFarland School District
# New Listings 15 15 15 15
# Sales 4 4 13 13
Average Sale Price $296,875 $296,875 $291,611 $291,611
Median Sale Price Single Family $273,750 $273,750 $289,750 $289,750
Median Sale Price Condo —- —- $259,000 $259,000
Total # Active Residential Listings at end of period
38 38 38 38
Oregon School District
# New Listings 27 27 13 13
# Sales 16 16 10 10
Average Sale Price $289,506 $289,506 $280,809 $280,809
Median Sale Price Single Family $326,800 $326,800 $232,900 $232,900
Median Sale Price Condo $155,000 $155,000 $317,900 $317,900
Total # Active Residential Listings at end of period
44 44 54 54
Mount Horeb School District
# New Listings 13 13 13 13
# Sales 7 7 6 6
Average Sale Price $266,393 $266,393 $273,583 $273,583
Median Sale Price Single Family $220,000 $220,000 $277,500 $277,500
Median Sale Price Condo —- —- —- —-
Total # Active Residential Listings at end of period
22 22 38 38
Lodi School District January
2017 2017 YTD January
2016 2016 YTD
# New Listings 12 12 6 6
# Sales 9 9 6 6
Average Sale Price $237,072 $237,072 $197,667 $197,667
Median Sale Price Single Family $202,450 $202,450 $216,000 $216,000
Median Sale Price Condo $221,000 $221,000 $184,000 $184,000
Total # Active Residential Listings at end of period
56 56 61 61

Real Estate Market Statistics—Jan 2017
Information provided by the SCWMLS and is based on Single Family Homes and Condos as of February 12, 2017.
Community & Neighborhood Videos
Verona School District
# New Listings 28 28 38 38
# Sales 11 11 12 12
Average Sale Price $407,108 $407,108 $190,939 $190,939
Median Sale Price Single Family $360,000 $360,000 $264,950 $264,950
Median Sale Price Condo $535,500 $535,500 $141,750 $141,750
Total # Active Residential Listings at end of period
58 58 84 84
WI Heights School District
# New Listings 4 4 9 9
# Sales 1 1 5 5
Average Sale Price $259,000 $259,000 $161,580 $161,580
Median Sale Price Single Family $259,000 $259,000 $179,900 $179,900
Median Sale Price Condo —- —- —- —-
Total # Active Residential Listings at end of period
14 14 32 32
Sun Prairie School District January
2017 2017 YTD January
2016 2016 YTD
# New Listings 46 46 60 60
# Sales 38 38 40 40
Average Sale Price $245,825 $245,825 $241,164 $241,164
Median Sale Price Single Family $246,919 $246,919 $259,000 $259,000
Median Sale Price Condo $157,900 $157,900 $146,250 $146,250
Total # Active Residential Listings at end of period
60 60 110 110

Real Estate Market Statistics—Jan 2017
Information provided by the SCWMLS and is based on Single Family Homes and Condos as of February 12, 2017.
Visit Coldwell Banker Success online:
CBSuccess.com
Market Update Videos
Home Sales Reports
Property Search
Find an Agent
Middleton-Cross Plains School District
January 2017 2017 YTD
January 2016 2016 YTD
# New Listings 62 62 48 48
# Sales 35 35 18 18
Average Sale Price $328,411 $328,411 $477,830 $477,830
Median Sale Price Single Family $416,625 $416,625 $460,000 $460,000
Median Sale Price Condo $154,000 $154,000 $135,500 $135,500
Total # Active Residential Listings at end of period
107 107 129 129
Waunakee School District
# New Listings 35 35 42 42
# Sales 13 13 17 17
Average Sale Price $381,554 $381,554 $345,206 $345,206
Median Sale Price Single Family $347,400 $347,400 $334,000 $334,000
Median Sale Price Condo $234,400 $234,400 $124,000 $124,000
Total # Active Residential Listings at end of period
82 82 100 100
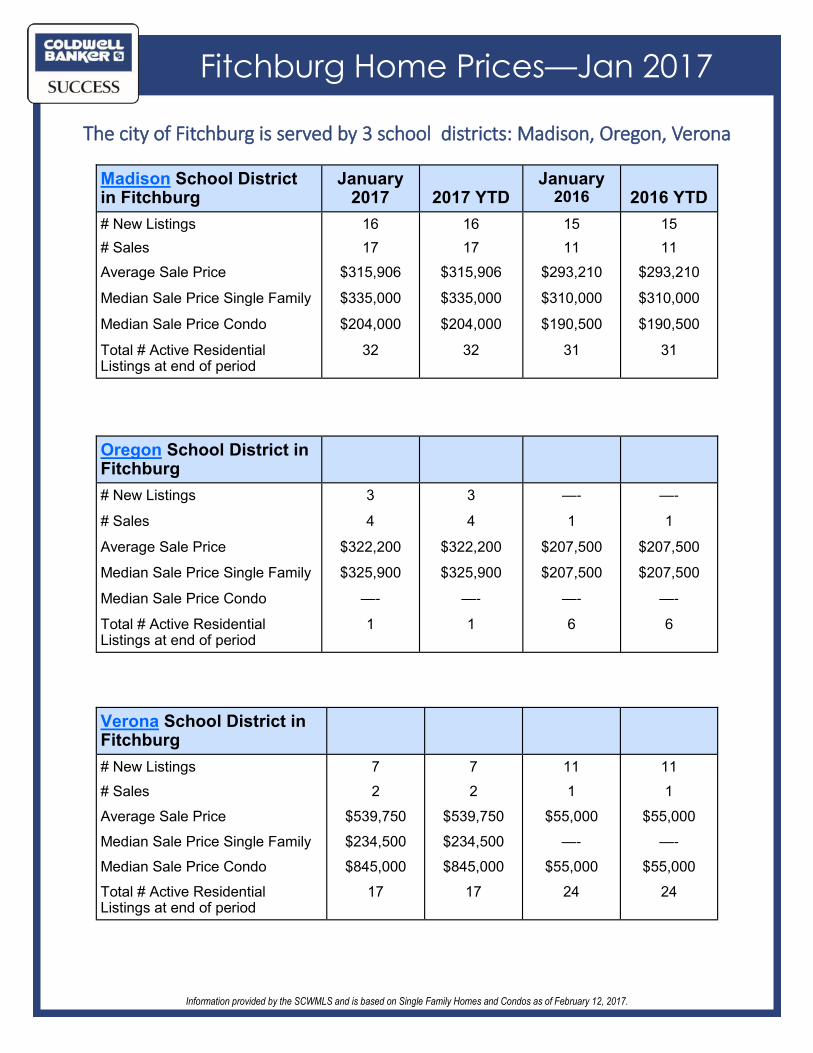
Fitchburg Home Prices—Jan 2017
Information provided by the SCWMLS and is based on Single Family Homes and Condos as of February 12, 2017.
Madison School District in Fitchburg
January 2017
2017 YTD
January 2016
2016 YTD
# New Listings 16 16 15 15
# Sales 17 17 11 11
Average Sale Price $315,906 $315,906 $293,210 $293,210
Median Sale Price Single Family $335,000 $335,000 $310,000 $310,000
Median Sale Price Condo $204,000 $204,000 $190,500 $190,500
Total # Active Residential Listings at end of period
32 32 31 31
Verona School District in Fitchburg
# New Listings 7 7 11 11
# Sales 2 2 1 1
Average Sale Price $539,750 $539,750 $55,000 $55,000
Median Sale Price Single Family $234,500 $234,500 —- —-
Median Sale Price Condo $845,000 $845,000 $55,000 $55,000
Total # Active Residential Listings at end of period
17 17 24 24
Oregon School District in Fitchburg
# New Listings 3 3 —- —-
# Sales 4 4 1 1
Average Sale Price $322,200 $322,200 $207,500 $207,500
Median Sale Price Single Family $325,900 $325,900 $207,500 $207,500
Median Sale Price Condo —- —- —- —-
Total # Active Residential Listings at end of period
1 1 6 6
The city of Fitchburg is served by 3 school districts: Madison, Oregon, Verona

Madison High Schools—Jan 2017
Information provided by the SCWMLS and is based on Single Family Homes and Condos as of February 12, 2017.
Lafollette High School
# New Listings 30 30 64 64
# Sales 33 33 26 26
Average Sale Price $199,189 $199,189 $179,577 $179,577
Median Sale Price Single Family $211,200 $211,200 $186,200 $186,200
Median Sale Price Condo $120,000 $120,000 $109,950 $109,950
Total # Active Residential Listings at end of period
59 59 166 166
West High School
# New Listings 60 60 59 59
# Sales 42 42 41 41
Average Sale Price $345,529 $345,529 $287,544 $287,544
Median Sale Price Single Family $383,500 $383,500 $287,500 $287,500
Median Sale Price Condo $239,950 $239,950 $202,200 $202,200
Total # Active Residential Listings at end of period
96 96 172 172
Memorial High School
# New Listings 65 65 101 101
# Sales 63 63 63 63
Average Sale Price $238,390 $238,390 $265,932 $265,932
Median Sale Price Single Family $261,000 $261,000 $255,000 $255,000
Median Sale Price Condo $160,000 $160,000 $143,000 $143,000
Total # Active Residential Listings at end of period
150 150 254 254
East High School January
2017 2017 YTD January
2016 2016 YTD
# New Listings 45 45 48 48
# Sales 25 25 38 38
Average Sale Price $197,885 $197,885 $174,975 $174,975
Median Sale Price Single Family $187,700 $187,700 $159,900 $159,900
Median Sale Price Condo $102,500 $102,500 $153,000 $153,000
Total # Active Residential Listings at end of period
87 87 133 133
The city of Madison includes 4 high schools.