january 2017 - hdfc mutual...
TRANSCRIPT
January 2017

2 January 2017 Intouch mutually
CONTENTS
pagE NO.MARKET REVIEW .................................................................................................................................................................................................. 3HDFC GRoWTH FunD ........................................................................................................................................................................................... 4HDFC EquITy FunD .............................................................................................................................................................................................. 5HDFC Top 200 FunD ............................................................................................................................................................................................ 6HDFC CApITAl BuIlDER FunD .............................................................................................................................................................................. 7HDFC CoRE & SATEllITE FunD ............................................................................................................................................................................. 8HDFC pREMIER MulTI-CAp FunD ......................................................................................................................................................................... 9HDFC lARGE CAp FunD ........................................................................................................................................................................................ 10HDFC MID-CAp oppoRTunITIES FunD ................................................................................................................................................................. 11HDFC SMAll CAp FunD........................................................................................................................................................................................ 12HDFC lonG TERM ADVAnTAGE FunD .................................................................................................................................................................. 13HDFC TAxSAVER ................................................................................................................................................................................................... 14HDFC InFRASTRuCTuRE FunD .............................................................................................................................................................................. 15HDFC ARBITRAGE FunD........................................................................................................................................................................................ 16HDFC InDEx FunD - SEnSEx plAn ....................................................................................................................................................................... 17HDFC InDEx FunD - nIFTy plAn .......................................................................................................................................................................... 18HDFC InDEx FunD - SEnSEx pluS plAn .............................................................................................................................................................. 19HDFC BAlAnCED FunD ........................................................................................................................................................................................ 20HDFC pRuDEnCE FunD ........................................................................................................................................................................................ 21HDFC CHIlDREn’S GIFT FunD - InVESTMEnT plAn .............................................................................................................................................. 22HDFC CHIlDREn’S GIFT FunD - SAVInGS plAn ..................................................................................................................................................... 23HDFC RETIREMEnT SAVInGS FunD - EquITy plAn ............................................................................................................................................... 24HDFC RETIREMEnT SAVInGS FunD - HyBRID EquITy plAn .................................................................................................................................. 25HDFC RETIREMEnT SAVInGS FunD - HyBRID DEBT plAn...................................................................................................................................... 26HDFC MF MonTHly InCoME plAn - SHoRT TERM plAn ...................................................................................................................................... 27HDFC MF MonTHly InCoME plAn - lonG TERM plAn ....................................................................................................................................... 28HDFC EquITy SAVInGS FunD ............................................................................................................................................................................... 29HDFC MulTIplE yIElD FunD - plAn 2005 ............................................................................................................................................................ 30HDFC InCoME FunD ............................................................................................................................................................................................ 31HDFC HIGH InTEREST FunD - DynAMIC plAn ...................................................................................................................................................... 32HDFC HIGH InTEREST FunD - SHoRT TERM plAn ................................................................................................................................................. 33HDFC SHoRT TERM plAn ...................................................................................................................................................................................... 34HDFC SHoRT TERM oppoRTunITIES FunD ........................................................................................................................................................... 35HDFC MEDIuM TERM oppoRTunITIES FunD ........................................................................................................................................................ 36HDFC GIlT FunD - SHoRT TERM plAn .................................................................................................................................................................. 37HDFC GIlT FunD - lonG TERM plAn .................................................................................................................................................................... 38HDFC FloATInG RATE InCoME FunD - SHoRT TERM plAn .................................................................................................................................. 39HDFC FloATInG RATE InCoME FunD - lonG TERM plAn .................................................................................................................................... 40HDFC lIquID FunD .............................................................................................................................................................................................. 41HDFC CASH MAnAGEMEnT FunD - SAVInGS plAn .............................................................................................................................................. 42HDFC CASH MAnAGEMEnT FunD - TREASuRy ADVAnTAGE plAn ....................................................................................................................... 43HDFC CoRpoRATE DEBT oppoRTunITIES FunD .................................................................................................................................................... 44HDFC BAnKInG AnD pSu DEBT FunD .................................................................................................................................................................. 45pERFoRMAnCE DETAIlS oF SCHEMES MAnAGED By RESpECTIVE FunD MAnAGERS ........................................................................................... 46SCHEME pERFoRMAnCE SuMMARy - REGulAR plAnS ........................................................................................................................................ 47-67SCHEME pERFoRMAnCE SuMMARy - DIRECT plAnS ............................................................................................................................................ 68-95GloSSARy ............................................................................................................................................................................................................. 96HoW To READ FACTSHEET ................................................................................................................................................................................... 96DIVIDEnD HISToRy ............................................................................................................................................................................................... 97-99DISClAIMER ......................................................................................................................................................................................................... 99

Intouch mutually January 2017 3
Market Review
Source for various data points: RBI Website, Bloomberg, Reuters, Union Budget 2017-18 and HDFC AMC Research.
Equity Market update
In run up to budget, Indian equity markets were up ~4% in January 2017 buoyed by better than expected corporate results.
Performance of global equity markets was mixed with emerging markets including India outperforming the developed markets. The table below gives the details of performance of key domestic and global indices.
% Change in Indices CY 2016
CY2017 YTD
S&p BSE India Bankex 7.3 7.5S&p BSE India Capital Goods (3.3) 8.2S&p BSE India FMCG 3.3 5.4S&p BSE India Healthcare (12.9) 0.5S&p BSE India Metal 36.7 15.5S&p BSE India oil & Gas 27.2 5.6S&p BSE India IT (8.0) (5.8)S&p BSE Sensex 1.9 3.9NIFTY 50 3.0 4.6NIFTY Free Float Midcap 100 7.1 7.4
% Change in Indices CY 2016
CY2017 YTD
Dow Jones Industrial Average 13.4 0.5nASDAq 7.5 4.3FTSE 14.4 (0.6)DAx 6.9 0.5CAC 4.9 (2.3)nikkei 0.4 (0.4)Hang Seng 0.4 6.2KoSpI 3.3 2.0Shanghai (12.3) 1.8MSCI Emerging Market Index 8.6 5.4
During the month, Brent crude was down ~3% after being up 23% in 2016. Other commodities barring steel (down 2%) moved up sharply in January. Lead was the best performer, up 18%.
FII’s sold Indian equities worth $0.2bn during January after selling close to $4.5bn in 3QFY17. Inflows in domestic Equity mutual funds continue to be healthy. Inflows in FY17 till December have been ~Rs 45,800 crores including ~Rs 9,200 crores in December and close to ~Rs 26,000 crores in 3QFY17.
The Union budget 2017-18 presented on February 1st was remarkably simple, consistent and without any surprises. In line with the earlier budgets, it was consistent with the government’s strategic direction, the key elements of which are:
• Accelerate growth, job creation and investments.
• Fiscal discipline, low inflation and interest rates
• Focus on agriculture / rural incomes / housing for all by 2022.
• Reduction of informal economy, simplification of taxation and widening of tax base
Indirect tax rates were broadly left untouched as GST is due from July 2017. The budget also does away with the distinction between plan and non-plan expenditure and only retains the revenue – capital split. This budget has also subsumed the railways budget within itself.
Amongst the results declared FMCG and IT earnings have been below expectations, whereas companies in banking related sectors generally delivered results upto or better than expectations.
Equity market have lagged nominal GDP growth for several years now. With a sharp fall in interest rates, improving growth outlook and signs of improving corporate profitability the outlook for equity market is positive. Any volatility in Indian equities induced by global events at a time when the Indian economy is improving on nearly all parameters will be a good opportunity for the discerning investor.
In our opinion therefore, there is merit in increasing allocation to equities (for those with a medium to long term view) and to stay invested.
Debt Market update
The yield on the 10-year benchmark (6.97% GoI 2026) ended the month of January at 6.41% down by 11 bps over the previous month end. The yield on 10-year AAA Corporate Bond ended the month at 7.30% as against 7.46% at the end of December 2016. Thus, corporate bond spreads during the month narrowed to 79 bps as against 83 bps in the previous month.
Liquidity conditions continued to remain positive during the month of January 2017. As against ~Rs.1,59,487 crs of average liquidity absorbed by RBI during the month of December 2016 (along with CMBs ouststanding of to the tune of 5.21 lac crores) through various sources (Liquidity Adjustment Facility, export refinance, marginal standing facility and term repos/reverse repos), ~Rs.2,01,481 crs of liquidity was absorbed by RBI during the month of January 2017 (along with CMBs ouststanding of to the tune of 3.50 lac crores). The overnight rate remained the same at 6.25% as compared with the previous month.
INR closed at 67.87 versus the USD in January as against 67.92 in December. The net FII investment in equities & debt was an outflow of ~US$ 0.5 billion in January 2017. FII’s sold close to US$ 15.9 billion in Indian debt and equity markets in Q4 of 2016.
The annual rate of retail inflation, CPI came in at 3.4% YoY in December 2016, down from 3.6% in November. The fall was largely on account of food inflation, which decelerated to 1.4% from 2.1% in November. Core CPI came in at 4.8% YoY for December 2016. Core inflation has been steadily falling since March 2014 and has been around 4.5-5% over the last one year now.
OutlookIn the Union Budget 2017-18, government has shown commitment to fiscal
prudence by proposing a lower fiscal deficit of 3.2% for FY18 compared to 3.5% for FY17. It has delayed the Fiscal Responsibility and Budget Management (‘FRBM’) fiscal target by a year. i.e. achieve 3% target by FY19 instead of FY18. Considering the domestic and global backdrop, it is a positive step. The fiscal room has been used to increase the capital expenditure from 13.9% of total expenditure in FY17 Revised Estimate (‘RE’) to 14.4% in FY18 Budget Estimate (‘BE’). Fiscal prudence and improvement in quality of expenditure should open up scope for further monetary easing by RBI.
The net market borrowing has increased modestly from Rs 406,708 crores to Rs 423,226 crores and hence markets shall now focus on global yields and oil prices. Even though there is downward bias to interest rates, room for further fall is limited given the sharp fall from 8.8% to 6.5% in last 3 years and hence investors may consider to incrementally invest in short/medium term funds and credit strategies.

4 January 2017 Intouch mutually
0.720.840.951.051.121.201.331.351.711.912.002.342.582.824.074.784.975.295.58
7.378.188.72
25.60
0 5 10 15 20 25 30Telecom - Equipment & Accessories
Consumer DurablesGas
Industrial Capital GoodsCement
OilMiscellaneous
FinanceMinerals/Mining
ChemicalsFerrous MetalsTransportation
Telecom - ServicesNon - Ferrous Metals
Consumer Non DurablesConstruction
Construction ProjectPower
PharmaceuticalsPetroleum Products
AutoSoftware
Banks
INvESTMENT OBjECTIvETo generate long term capital appreciation from a portfolio that is invested predominantly in equity and equity related instruments.
FuND MaNagEr ¥
Srinivas rao ravuri (since April 3, 06) Total Experience: over 19 years
INCEpTION DaTE (Date of allotment)September 11, 2000
Nav Nav pEr uNIT (`)Regular plan - Growth option 147.281Regular plan - Dividend option 30.183Direct plan - Growth option 150.434Direct plan - Dividend option 30.934
aSSETS uNDEr MaNagEMENT (`) IN CrOrEAs on January 31, 2017 1,014.89Average for Month of January, 2017 1,002.12
quaNTITaTIvE DaTaportfolio Turnover Ratio (last 1 year) 28.52%
risk ration Standard Deviation 4.768%n Beta 1.096n Sharpe Ratio* 0.213
Computed for the 3-yr period ended January 31, 2017.Based on month-end nAV.* Risk free rate: 6.25% (Source: FIMMDA MIBoR)
TOTal ExpENSE raTIO (Weighted average for the month) €Regular 2.30%Direct 1.65%
€ Excluding Service Tax on Management Fees.
BENCHMarK INDExS&p BSE SEnSEx
ENTrY lOaDnot Applicable.
ExIT lOaDl In respect of each purchase / switch-in of units, an Exit
load of 1.00% is payable if units are redeemed / switched-out within 1 year from the date of allotment.
l no Exit load is payable if units are redeemed / switched-out after 1 year from the date of allotment.
For further details, please refer to para ‘Exit load’ on pg 46.
plaNSRegular plan, Direct plan
OpTIONSunder Each plan : Growth & Dividend. The Dividend option offers Dividend payout and Reinvestment facility.
MINIMuM applICaTION aMOuNT (under each plan / Option)purchase : ` 5,000 and any amount thereafter.Additional purchase : ` 1,000 and any amount thereafter.
rEDEMpTION prOCEEDSnormally despatched within 3-4 Business Days.
For Tax Benefits / Consequences, Please refer to page 46¥ Dedicated Fund Manager for overseas Investments: Mr Rakesh Vyas (Total Experience: over 12 years).
HDFC Growth Fund (An open-ended growth scheme)
Company Industry+ % to Nav
EquITY & EquITY rElaTED
HDFC Bank ltd. Banks 9.39State Bank of India Banks 6.99Infosys ltd. Software 6.35ICICI Bank ltd. Banks 6.10Reliance Industries ltd. petroleum products 5.25larsen & Toubro ltd. Construction project 4.97ITC ltd. Consumer non
Durables 4.07Tata Motors ltd. DVR Auto 2.97Maruti Suzuki India ltd. Auto 2.90Vedanta ltd. non - Ferrous
Metals 2.82
Total of Top Ten Holdings 51.81
Total Equity & Equity related 96.48
Cash, Cash Equivalents and net Current Assets 3.52
grand Total 100.00For complete portfolio, please visit www.hdfcfund.com
portfolio - Top 10 Holdings
This product is suitable for investors who are seeking ~ riskometer
l Capital appreciation over long term.
l Investment predominantly in equity and equity related instruments.
Investors understand that their principal will be at moderately high risk
~ Investors should consult their financial advisers if in doubt about whether the product is suitable for them.
SIp performanceSince Inception
SIp15 year
SIp10 year
SIp5 year
SIp3 year
SIp1 year
SIpTotal Amount Invested (` ‘000) 1,960.00 1,800.00 1,200.00 600.00 360.00 120.00Mkt Value as on December 30, 2016 (` ‘000) 10,598.02 7,768.31 2,139.73 797.89 406.60 125.62returns (annualised) (%) 18.42 17.64 11.14 11.35 8.07 8.82Benchmark Returns (Annualised) (%) # 12.71 12.41 7.46 6.99 1.73 1.18Addl. Benchmark Ret. (Annualised) (%) ## 12.55 12.31 7.92 7.69 2.79 1.61
past performance may or may not be sustained in the future. # S&p BSE SEnSEx ## nIFTy 50 Index. Assuming ̀ 10,000 invested systematically on the first Business Day of every month over a period of time. CAGR returns are computed after accounting for the cash flow by using XIRR method (investment internal rate of return) for Regular Plan - Growth Option. Load is not taken into consideration for computation of performance. The above investment simulation is for illustrative purposes only and should not be construed as a promise on minimum returns and safeguard of capital. The AMC / Mutual Fund is not guaranteeing or promising or forecasting any returns.
Industry allocation of Equity Holding (% of Net assets)
Face Value per unit: ` 10 unless otherwise specified, + Industry Classification as recommended by AMFI, Data is as of January 31, 2017 unless otherwise specified.
Cumulative performanceDate period Nav
per unit (`)
Scheme returns
(%)^
Benchmark returns
(%)#
additional Benchmark
returns (%) ##
value of Investment of Scheme ` 10000@
Scheme (`) Benchmark (`)#
additional Benchmark
(`)##Dec 31, 15 last 1 year 131.712 6.59 1.95 3.01 10,659 10,195 10,301Dec 31, 14 last 2 years 132.195 3.05 -1.60 -0.59 10,620 9,683 9,883Dec 31, 13 last 3 years 92.540 14.90 7.94 9.10 15,171 12,577 12,985Sep 11, 00 Since Inception 10.000 17.58 11.22 11.16 140,393 56,693 56,208
Discrete 12 month returns (%)period Scheme
^Benchmark
#additional Benchmark
##Dec 31, 15 To Dec 30, 16 6.59 1.95 3.01Dec 31, 14 To Dec 31, 15 -0.37 -5.03 -4.06Dec 31, 13 To Dec 31, 14 42.85 29.89 31.39
^past performance may or may not be sustained in the future. The above returns are for Regular plan - Growth option. Returns greater than 1 year period are compounded annualized (CAGR). # S&p BSE SEnSEx ## nIFTy 50 Index. @ shows the current value of ` 10,000/- invested at the beginning of a given period. For performance of other schemes managed by Srinivas Rao Ravuri, please refer page 46.

Intouch mutually January 2017 5
l INvESTMENT OBjECTIvETo achieve capital appreciation.
l FuND MaNagEr § ¥
prashant jain (since June 19, 03) Total Experience: over 25 years
l INCEpTION DaTE (Date of allotment)January 1, 1995
Nav Nav pEr uNIT (`)Regular plan - Growth option 505.366Regular plan - Dividend option 52.165Direct plan - Growth option 521.263Direct plan - Dividend option 54.089
aSSETS uNDEr MaNagEMENT (`) IN CrOrEAs on January 31, 2017 16,652.54Average for Month of January, 2017 16,195.24
l quaNTITaTIvE DaTaportfolio Turnover Ratio (last 1 year) 16.76%
risk ration Standard Deviation 5.522%n Beta 1.200n Sharpe Ratio* 0.214
Computed for the 3-yr period ended January 31, 2017.Based on month-end nAV.* Risk free rate: 6.25% (Source: FIMMDA MIBoR)
l TOTal ExpENSE raTIO (Weighted average for the month) €Regular 2.16%Direct 1.36%
€ Excluding Service Tax on Management Fees.
l BENCHMarK INDExnIFTy 500 Index
l ENTrY lOaDnot Applicable.
l ExIT lOaDl In respect of each purchase / switch-in of units, an Exit load
of 1.00% is payable if units are redeemed / switched-out within 1 year from the date of allotment.
l no Exit load is payable if units are redeemed / switched-out after 1 year from the date of allotment.
For further details, please refer to para ‘Exit load’ on pg 46.
l plaNSRegular plan, Direct plan
l OpTIONSunder Each plan : Growth & Dividend. The Dividend option offers Dividend payout and Reinvestment facility.
l MINIMuM applICaTION aMOuNT (under each plan / Option)purchase : ` 5,000 and any amount thereafter.Additional purchase : ` 1,000 and any amount thereafter.
l rEDEMpTION prOCEEDSnormally despatched within 3-4 Business Days.
For Tax Benefits / Consequences, Please refer to page 46§ Date of migration from Zurich India Mutual Fund (Close of business hours - June 19, 03
¥ Dedicated Fund Manager for overseas Investments: Mr Rakesh Vyas (Total Experience: over 12 years).
Company Industry+ % to Nav
EquITY & EquITY rElaTED
ICICI Bank ltd. Banks 9.11
State Bank of India Banks 9.01
larsen & Toubro ltd. Construction project 7.54
Infosys ltd. Software 6.01
Maruti Suzuki India ltd. Auto 5.13
HDFC Bank ltd. Banks 4.53
Tata Steel ltd. Ferrous Metals 4.43
Bank of Baroda Banks 2.90
Aurobindo pharma ltd. pharmaceuticals 2.84
Reliance Industries ltd. petroleum products 2.68
Total of Top Ten Holdings 54.18
Total Equity & Equity related Holdings 99.24
Cash, Cash Equivalents and net Current Assets 0.76
grand Total 100.00
For complete portfolio, please visit www.hdfcfund.com
HDFC Equity Fund (An open-ended growth scheme)
portfolio - Top 10 Holdings
This product is suitable for investors who are seeking ~ riskometer
l Capital appreciation over long term.
l Investment predominantly in equity and equity related instruments of medium to large sized companies.
Investors understand that their principal will be at moderately high risk
~ Investors should consult their financial advisers if in doubt about whether the product is suitable for them.
SIp performanceSince Inception
SIp15 year
SIp10 year
SIp5 year
SIp3 year
SIp1 year
SIpTotal Amount Invested (` ‘000) 2,640.00 1,800.00 1,200.00 600.00 360.00 120.00Mkt Value as on December 30, 2016 (` ‘000) 51,702.15 9,413.32 2,383.47 832.99 402.43 126.89returns (annualised) (%) 22.56 19.82 13.16 13.09 7.38 10.85Benchmark Returns (Annualised) (%) # 12.77 13.27 8.98 10.12 5.36 3.01Addl. Benchmark Ret. (Annualised) (%) ## 11.64 12.31 7.92 7.69 2.79 1.61
past performance may or may not be sustained in the future. # nIFTy 500 Index ## nIFTy 50 Index. Assuming ` 10,000 invested systematically on the first Business Day of every month over a period of time. CAGR returns are computed after accounting for the cash flow by using XIRR method (investment internal rate of return) for Regular Plan - Growth Option. load is not taken into consideration for computation of performance. The above investment simulation is for illustrative purposes only and should not be construed as a promise on minimum returns and safeguard of capital. The AMC / Mutual Fund is not guaranteeing or promising or forecasting any returns.
0.110.450.590.640.700.750.851.351.761.992.592.683.023.573.934.435.13
6.848.779.589.89
29.62
0 5 10 15 20 25 30Oil
Industrial ProductsConstruction
Non - Ferrous MetalsTelecom - Services
Consumer DurablesGas
TransportationPesticides
Media And EntertainmentAuto Ancillaries
FinanceCement
Petroleum ProductsPharmaceuticals
Ferrous MetalsIndustrial Capital Goods
PowerConstruction Project
SoftwareAuto
Banks
Industry allocation of Equity Holding (% of Net assets)
Cumulative performanceDate period Nav
per unit (`)
Scheme returns
(%)^
Benchmark returns
(%)#
additional Benchmark
returns (%) ##
value of Investment of Scheme ̀ 10000@
Scheme (`) Benchmark (`)#
additional Benchmark
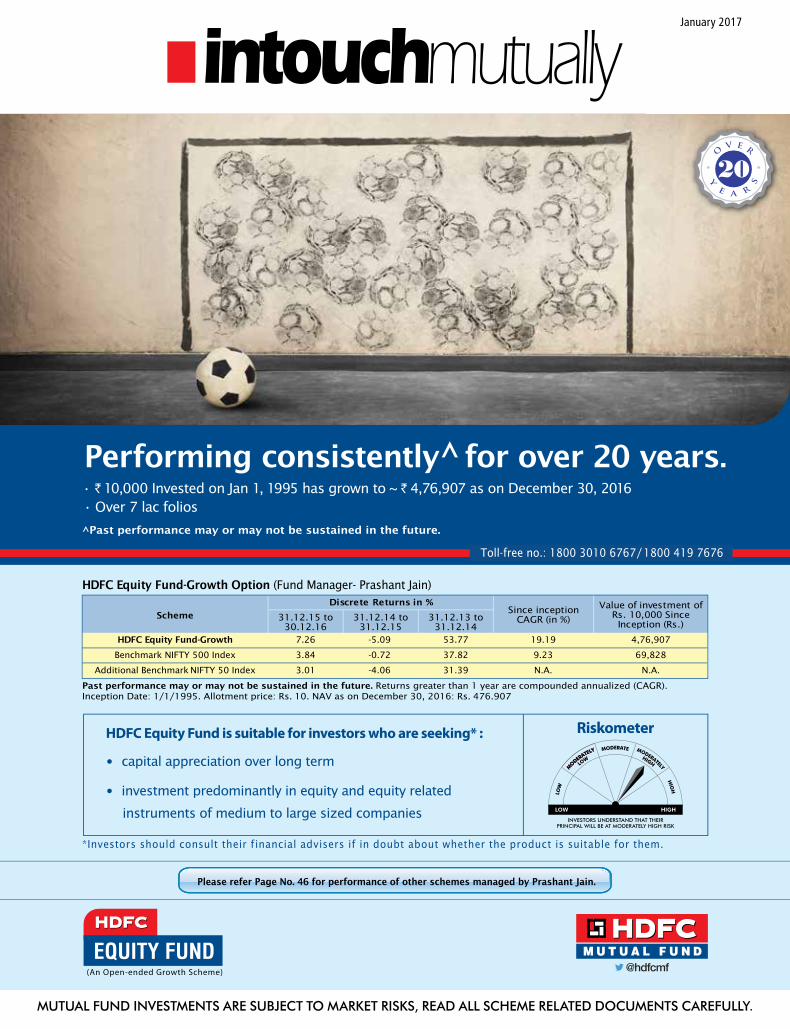
(`)##Dec 31, 15 last 1 year 444.610 7.26 3.84 3.01 10,726 10,384 10,301Dec 31, 14 last 2 years 468.439 0.90 1.53 -0.59 10,181 10,309 9,883Dec 31, 13 last 3 years 304.632 16.11 12.42 9.10 15,655 14,208 12,985Jan 01, 95 Since Inception 10.000 19.19 9.23 n.A. 476,907 69,828 n.A.
Discrete 12 month returns (%)period Scheme
^Benchmark
#additional Benchmark
##Dec 31, 15 To Dec 30, 16 7.26 3.84 3.01Dec 31, 14 To Dec 31, 15 -5.09 -0.72 -4.06Dec 31, 13 To Dec 31, 14 53.77 37.82 31.39
^past performance may or may not be sustained in the future. The above returns are for Regular plan - Growth option. Returns greater than 1 year period are compounded annualized (CAGR). # nIFTy 500 Index ## nIFTy 50 Index. @ shows the current value of ̀ 10,000/- invested at the beginning of a given period. n.A. not Available. For performance of other schemes managed by prashant Jain, please refer page 46.
Face Value per unit: ` 10 unless otherwise specified, + Industry Classification as recommended by AMFI, Data is as of January 31, 2017 unless otherwise specified.

6 January 2017 Intouch mutually
l INvESTMENT OBjECTIvETo generate long term capital appreciation from a portfolio of equity and equity linked instruments. The investment portfolio for equity and equity linked instruments will be primarily drawn from the companies in the BSE 200 Index. Further, the Scheme may also invest in listed companies that would qualify to be in the top 200 by market capitalisation on the BSE even though they may not be listed on the BSE. This includes participation in large Ipos where in the market capitalisation of the company based on issue price would make the company a part of the top 200 companies listed on the BSE based on market capitalisation.
l FuND MaNagEr § ¥
prashant jain (since June 19, 03) Total Experience: over 25 years
l INCEpTION DaTE (Date of allotment)october 11, 1996
Nav Nav pEr uNIT (`)Regular plan - Growth option 372.676Regular plan - Dividend option 50.706Direct plan - Growth option 382.376Direct plan - Dividend option 52.234
aSSETS uNDEr MaNagEMENT (`) IN CrOrEAs on January 31, 2017 13,122.82Average for Month of January, 2017 12,884.42
l quaNTITaTIvE DaTaportfolio Turnover Ratio (last 1 year) 29.27%risk ration Standard Deviation 5.245%n Beta 1.172n Sharpe Ratio* 0.198Computed for the 3-yr period ended January 31, 2017.Based on month-end nAV.* Risk free rate: 6.25% (Source: FIMMDA MIBoR)
l TOTal ExpENSE raTIO (Weighted average for the month) €Regular 2.02%Direct 1.32%€ Excluding Service Tax on Management Fees.
l BENCHMarK INDExS&p BSE 200
l ENTrY lOaDnot Applicable.
l ExIT lOaDl In respect of each purchase / switch-in of units, an Exit
load of 1.00% is payable if units are redeemed / switched-out within 1 year from the date of allotment.
l no Exit load is payable if units are redeemed / switched-out after 1 year from the date of allotment.
For further details, please refer to para ‘Exit load’ on pg 46.
l plaNSRegular plan, Direct plan
l OpTIONSunder Each plan : Growth & Dividend. The Dividend option offers Dividend payout and Reinvestment facility.
l MINIMuM applICaTION aMOuNT (under each plan / Option)purchase : ` 5,000 and any amount thereafter.Additional purchase : ` 1,000 and any amount thereafter.
l rEDEMpTION prOCEEDSnormally despatched within 3-4 Business Days.For Tax Benefits / Consequences, Please refer to page 46 Date of migration from Zurich India Mutual Fund (Close of
business hours - June 19, 03 Dedicated Fund Manager for overseas Investments:
Mr Rakesh Vyas (Total Experience: over 12 years).
HDFC Top 200 Fund (An open-ended growth scheme)
This product is suitable for investors who are seeking ~ riskometer
l Capital appreciation over long term.
l Investment in equity and equity linked instruments including equity derivatives primarily drawn from the companies in the S&p BSE 200 Index.
Investors understand that their principal will be at moderately high risk
~ Investors should consult their financial advisers if in doubt about whether the product is suitable for them.
Company Industry+ % to Nav
EquITY & EquITY rElaTED
State Bank of India Banks 6.63
HDFC Bank ltd. Banks 6.60
ICICI Bank ltd. Banks 6.29
larsen & Toubro ltd. Construction project 5.73
Infosys ltd. Software 4.75
Reliance Industries ltd. petroleum products 3.86
Tata Steel ltd. Ferrous Metals 3.41
Maruti Suzuki India ltd. Auto 3.01
ITC ltd. Consumer non Durables 2.93
Tata Motors ltd. Auto 2.83
Total of Top Ten Holdings 46.04
Total Equity & Equity related Holdings 99.91
Cash, Cash Equivalents and net Current Assets 0.09
grand Total 100.00
For complete portfolio, please visit www.hdfcfund.com
portfolio - Top 10 Holdings
0.190.551.001.161.291.302.042.752.892.933.183.914.645.655.736.056.107.48
11.1929.88
0 5 10 15 20 25 30Non - Ferrous Metals
ChemicalsMedia And Entertainment
GasTransportation
PesticidesTelecom - Services
OilCement
Consumer Non DurablesIndustrial Capital Goods
PharmaceuticalsFerrous Metals
Petroleum ProductsConstruction Project
FinancePower
AutoSoftware
Banks
Industry allocation of Equity Holding (% of Net assets)
SIp performanceSince Inception
SIp15 year
SIp10 year
SIp5 year
SIp3 year
SIp1 year
SIpTotal Amount Invested (` ‘000) 2,430.00 1,800.00 1,200.00 600.00 360.00 120.00Mkt Value as on December 30, 2016 (` ‘000) $$ 27,223.45 9,094.65 2,262.30 808.64 400.72 126.77returns (annualised) (%) $$ 20.37 19.43 12.18 11.89 7.09 10.65Benchmark Returns (Annualised) (%) # 13.26 13.22 8.80 9.52 4.83 2.78Addl. Benchmark Ret. (Annualised) (%) ## 11.96 12.41 7.46 6.99 1.73 1.18
past performance may or may not be sustained in the future. # S&p BSE 200 ## S&p BSE SEnSEx. Assuming ` 10,000 invested systematically on the first Business Day of every month over a period of time. CAGR returns are computed after accounting for the cash flow by using XIRR method (investment internal rate of return) for Regular Plan - Growth Option. Load is not taken into consideration for computation of performance. The above investment simulation is for illustrative purposes only and should not be construed as a promise on minimum returns and safeguard of capital. The AMC / Mutual Fund is not guaranteeing or promising or forecasting any returns.
Cumulative performanceDate period Nav
per unit (`)
Scheme returns
(%)^$$
Benchmark returns
(%)#
additional Benchmark
returns (%) ##
value of Investment of Scheme ̀ 10000@
Scheme (`)$$
Benchmark (`)#
additional Benchmark
(`)##Dec 31, 15 last 1 year 323.900 8.52 3.95 1.95 10,852 10,395 10,195Dec 31, 14 last 2 years 344.904 0.95 1.20 -1.60 10,191 10,242 9,683Dec 31, 13 last 3 years 235.401 14.30 11.53 7.94 14,932 13,874 12,577oct 11, 96 Since Inception 10.000 20.41 12.68 11.11 428,585 111,977 84,247
Discrete 12 month returns (%)period Scheme
^ $$Benchmark
#additional Benchmark
##Dec 31, 15 To Dec 30, 16 8.52 3.95 1.95Dec 31, 14 To Dec 31, 15 -6.09 -1.48 -5.03Dec 31, 13 To Dec 31, 14 46.52 35.47 29.89
^past performance may or may not be sustained in the future. The above returns are for Regular plan - Growth option. Returns greater than 1 year period are compounded annualized (CAGR). # S&p BSE 200 ## S&p BSE SEnSEx. $$ All dividends declared prior to the splitting of the Scheme into Dividend & Growth options are assumed to be reinvested in the units of the Scheme at the then prevailing nAV (ex-dividend nAV). @ shows the current value of ` 10,000/- invested at the beginning of a given period. For performance of other schemes managed by prashant Jain, please refer page 46.
Face Value per unit: ` 10 unless otherwise specified, + Industry Classification as recommended by AMFI, Data is as of January 31, 2017 unless otherwise specified.

Intouch mutually January 2017 7
This is a simple and performing scheme which is eligible for distribution by new cadre of distributors.
l INvESTMENT OBjECTIvETo achieve capital appreciation in the long term.
l FuND MaNagEr ¥
Chirag Setalvad (since April 2, 07) Total Experience: over 19 years &Miten lathia (since May 10, 12) Total Experience: over 16 years
l INCEpTION DaTE (Date of allotment)February 1, 1994
Nav Nav pEr uNIT (`)Regular plan - Growth option 223.409Regular plan - Dividend option 27.219Direct plan - Growth option 229.812Direct plan - Dividend option 28.168
aSSETS uNDEr MaNagEMENT (`) IN CrOrEAs on January 31, 2017 1,367.66Average for Month of January, 2017 1,350.64
l quaNTITaTIvE DaTaportfolio Turnover Ratio (last 1 year) 28.39%risk ration Standard Deviation 4.758%n Beta 1.060n Sharpe Ratio* 0.254Computed for the 3-yr period ended January 31, 2017.Based on month-end nAV.* Risk free rate: 6.25% (Source: FIMMDA MIBoR)
l TOTal ExpENSE raTIO (Weighted average for the month) €Regular 2.47%Direct 1.32%€ Excluding Service Tax on Management Fees.
l BENCHMarK INDExnIFTy 500 Index
l ENTrY lOaDnot Applicable.
l ExIT lOaDl In respect of each purchase / switch-in of units, an Exit
load of 1.00% is payable if units are redeemed / switched-out within 1 year from the date of allotment.
l no Exit load is payable if units are redeemed / switched-out after 1 year from the date of allotment.
For further details, please refer to para ‘Exit load’ on pg 46.
l plaNSRegular plan, Direct plan
l OpTIONSunder Each plan : Growth & Dividend. The Dividend option offers Dividend payout and Reinvestment facility.
l MINIMuM applICaTION aMOuNT (under each plan / Option)purchase : ` 5,000 and any amount thereafter.Additional purchase : ` 1,000 and any amount thereafter.
l rEDEMpTION prOCEEDSnormally despatched within 3-4 Business Days.For Tax Benefits / Consequences, Please refer to page 46¥ Dedicated Fund Manager for overseas Investments: Mr Rakesh Vyas (Total Experience: over 12 years).
HDFC Capital Builder Fund (An open-ended growth scheme)
This product is suitable for investors who are seeking ~ riskometer
l Capital appreciation over long term.
l Investment predominantly in equity and equity related instruments of strong companies.
Investors understand that their principal will be at moderately high risk
~ Investors should consult their financial advisers if in doubt about whether the product is suitable for them.
SIp performanceSince Inception
SIp15 year
SIp10 year
SIp5 year
SIp3 year
SIp1 year
SIpTotal Amount Invested (` ‘000) 2,750.00 1,800.00 1,200.00 600.00 360.00 120.00Mkt Value as on December 30, 2016 (` ‘000) 31,525.52 9,022.40 2,510.07 880.24 415.10 124.03returns (annualised) (%) 17.96 19.34 14.13 15.33 9.48 6.30Benchmark Returns (Annualised) (%) # 12.33 13.27 8.98 10.12 5.36 3.01Addl. Benchmark Ret. (Annualised) (%) ## 11.31 12.31 7.92 7.69 2.79 1.61
past performance may or may not be sustained in the future. # nIFTy 500 Index ## nIFTy 50 Index. Assuming ̀ 10,000 invested systematically on the first Business Day of every month over a period of time. CAGR returns are computed after accounting for the cash flow by using XIRR method (investment internal rate of return) for Regular Plan - Growth Option. Load is not taken into consideration for computation of performance. The above investment simulation is for illustrative purposes only and should not be construed as a promise on minimum returns and safeguard of capital. The AMC / Mutual Fund is not guaranteeing or promising or forecasting any returns.
Company Industry+ % to Nav
EquITY & EquITY rElaTED
HDFC Bank ltd. Banks 8.01ICICI Bank ltd. Banks 4.72Tata Motors ltd. Auto 4.21State Bank of India Banks 4.00Reliance Industries ltd. petroleum products 3.74Infosys ltd. Software 3.39Grasim Industries ltd. Cement 3.35yes Bank ltd. Banks 3.06Cipla ltd. pharmaceuticals 2.95Indusind Bank ltd. Banks 2.88Total of Top Ten Holdings 40.31Total Equity & Equity related Holdings 96.22Cash margin/ Earmarked cash for Futures & options 0.06Cash, Cash Equivalents and net Current Assets 3.72
grand Total 100.00
For complete portfolio, please visit www.hdfcfund.com
portfolio - Top 10 Holdings
0.850.881.151.281.301.701.711.731.781.922.082.302.673.253.354.144.214.285.746.12
8.088.13
27.57
0 5 10 15 20 25 30Industrial Capital Goods
Industrial ProductsRetailing
Non - Ferrous MetalsTelecom - Equipment & Accessories
Auto AncillariesGas
Hotels, Resorts & Other Recreational ActivitiesChemicals
PowerTelecom - Services
Consumer Non DurablesTransportation
Media And EntertainmentCement
Consumer DurablesAuto
ConstructionPetroleum Products
Construction ProjectSoftware
PharmaceuticalsBanks
Industry allocation of Equity Holding (% of Net assets)
Cumulative performanceDate period Nav
per unit (`)
Scheme returns
(%)^
Benchmark returns
(%)#
additional Benchmark
returns (%) ##
value of Investment of Scheme ̀ 10000@
Scheme (`) Benchmark (`)#
additional Benchmark
(`)##Dec 31, 15 last 1 year 204.882 3.83 3.84 3.01 10,383 10,384 10,301Dec 31, 14 last 2 years 195.844 4.22 1.53 -0.59 10,862 10,309 9,883Dec 31, 13 last 3 years 128.883 18.18 12.42 9.10 16,505 14,208 12,985Feb 01, 94 Since Inception 10.000 14.27 8.56 8.62 212,724 65,701 66,555
Discrete 12 month returns (%)period Scheme
^Benchmark
#additional Benchmark
##Dec 31, 15 To Dec 30, 16 3.83 3.84 3.01Dec 31, 14 To Dec 31, 15 4.61 -0.72 -4.06Dec 31, 13 To Dec 31, 14 51.95 37.82 31.39
^past performance may or may not be sustained in the future. The above returns are for Regular plan - Growth option. Returns greater than 1 year period are compounded annualized (CAGR). # nIFTy 500 Index ## nIFTy 50 Index. @ shows the current value of ` 10,000/- invested at the beginning of a given period. For performance of other schemes managed by Chirag Setalvad & Miten lathia, please refer page 46.
Face Value per unit: ` 10 unless otherwise specified, + Industry Classification as recommended by AMFI, Data is as of January 31, 2017 unless otherwise specified.

8 January 2017 Intouch mutually
l INvESTMENT OBjECTIvETo generate capital appreciation through equity investment in companies whose shares are quoting at prices below their true value.
l FuND MaNagEr ¥
vinay Kulkarni (since november 21, 06) Total Experience: over 26 years
l INCEpTION DaTE (Date of allotment)September 17, 2004
Nav Nav pEr uNIT (`)Regular plan - Growth option 66.834Regular plan - Dividend option 19.863Direct plan - Growth option 68.933Direct plan - Dividend option 20.822
aSSETS uNDEr MaNagEMENT (`) IN CrOrEAs on January 31, 2017 574.08Average for Month of January, 2017 566.00
l quaNTITaTIvE DaTaportfolio Turnover Ratio (last 1 year) 16.77%
risk ration Standard Deviation 6.125%n Beta 1.281n Sharpe Ratio* 0.215
Computed for the 3-yr period ended January 31, 2017.Based on month-end nAV.* Risk free rate: 6.25% (Source: FIMMDA MIBoR)
l TOTal ExpENSE raTIO (Weighted average for the month) €Regular 2.42%Direct 1.11%
€ Excluding Service Tax on Management Fees.
l BENCHMarK INDExS&p BSE 200
l ENTrY lOaDnot Applicable.
l ExIT lOaDl In respect of each purchase / switch-in of units, an Exit
load of 1.00% is payable if units are redeemed / switched-out within 1 year from the date of allotment.
l no Exit load is payable if units are redeemed / switched-out after 1 year from the date of allotment.
For further details, please refer to para ‘Exit load’ on pg 46.
l plaNSRegular plan, Direct plan
l OpTIONSunder Each plan : Growth & Dividend. The Dividend option offers Dividend payout and Reinvestment facility.
l MINIMuM applICaTION aMOuNT (under each plan / Option)purchase : ` 5,000 and any amount thereafter.Additional purchase : ` 1,000 and any amount thereafter.
l rEDEMpTION prOCEEDSnormally despatched within 3-4 Business Days.
For Tax Benefits / Consequences, Please refer to page 46¥ Dedicated Fund Manager for overseas Investments: Mr Rakesh Vyas (Total Experience: over 12 years).
HDFC Core & Satellite Fund (An open-ended growth scheme)
This product is suitable for investors who are seeking ~ riskometer
l Capital appreciation over long term.
l Investment primarily in equity and equity related instruments of companies whose shares are quoting at prices below their true value.
Investors understand that their principal will be at moderately high risk
~ Investors should consult their financial advisers if in doubt about whether the product is suitable for them.
SIp performanceSince Inception
SIp10 year
SIp5 year
SIp3 year
SIp1 year
SIpTotal Amount Invested (` ‘000) 1,480.00 1,200.00 600.00 360.00 120.00Mkt Value as on December 30, 2016 (` ‘000) 3,300.57 2,175.81 839.21 412.86 126.13returns (annualised) (%) 12.27 11.45 13.39 9.11 9.62Benchmark Returns (Annualised) (%) # 9.98 8.80 9.52 4.83 2.78Addl. Benchmark Ret. (Annualised) (%) ## 9.15 7.46 6.99 1.73 1.18
past performance may or may not be sustained in the future. # S&p BSE 200 ## S&p BSE SEnSEx. Assuming ̀ 10,000 invested systematically on the first Business Day of every month over a period of time. CAGR returns are computed after accounting for the cash flow by using XIRR method (investment internal rate of return) for Regular Plan - Growth Option. Load is not taken into consideration for computation of performance. The above investment simulation is for illustrative purposes only and should not be construed as a promise on minimum returns and safeguard of capital. The AMC / Mutual Fund is not guaranteeing or promising or forecasting any returns.
Company Industry+ % to Nav
EquITY & EquITY rElaTEDBharat petroleum Corporation ltd. petroleum products 6.97larsen & Toubro ltd. Construction project 6.60Tata Motors ltd. DVR Auto 6.42Grasim Industries ltd. Cement 6.35Cipla ltd. pharmaceuticals 6.13Bharat Electronics ltd. Industrial Capital
Goods 5.86ICICI Bank ltd. Banks 5.31nHpC ltd. power 5.04Maruti Suzuki India ltd. Auto 4.62State Bank of India Banks 4.54Total of Top Ten Holdings 57.84Total Equity & Equity related Holdings 98.08Credit Exposure Au Financiers (India) ltd. FITCH - A+ 0.71Total Credit Exposure 0.71Cash, Cash Equivalents and net Current Assets 1.21grand Total 100.00For complete portfolio, please visit www.hdfcfund.com
portfolio - Top 10 Holdings
1.06
1.34
1.72
2.15
2.49
3.38
3.45
3.77
6.13
6.35
6.97
9.85
10.05
11.04
11.28
17.05
0 2 4 6 8 10 12 14 16 18
Media And Entertainment
Construction
Finance
Transportation
Healthcare Services
Auto Ancillaries
Commercial Services
Software
Pharmaceuticals
Cement
Petroleum Products
Banks
Construction Project
Auto
Power
Industrial Capital Goods
Industry allocation of Equity Holding (% of Net assets)
Cumulative performanceDate period Nav
per unit (`)
Scheme returns
(%)^
Benchmark returns
(%)#
additional Benchmark
returns (%) ##
value of Investment of Scheme ̀ 10000@
Scheme (`) Benchmark (`)#
additional Benchmark
(`)##Dec 31, 15 last 1 year 61.821 2.10 3.95 1.95 10,210 10,395 10,195Dec 31, 14 last 2 years 58.881 3.54 1.20 -1.60 10,720 10,242 9,683Dec 31, 13 last 3 years 38.879 17.53 11.53 7.94 16,235 13,874 12,577Sep 17, 04 Since Inception 10.000 16.17 13.69 13.59 63,122 48,444 47,879
Discrete 12 month returns (%)period Scheme
^Benchmark
#additional Benchmark
##Dec 31, 15 To Dec 30, 16 2.10 3.95 1.95Dec 31, 14 To Dec 31, 15 4.99 -1.48 -5.03Dec 31, 13 To Dec 31, 14 51.45 35.47 29.89
^past performance may or may not be sustained in the future. The above returns are for Regular plan - Growth option. Returns greater than 1 year period are compounded annualized (CAGR). # S&p BSE 200 ## S&p BSE SEnSEx. @ shows the current value of ` 10,000/- invested at the beginning of a given period. For performance of other schemes managed by Vinay Kulkarni, please refer page 46.
Face Value per unit: ` 10 unless otherwise specified, + Industry Classification as recommended by AMFI, Data is as of January 31, 2017 unless otherwise specified.

Intouch mutually January 2017 9
l INvESTMENT OBjECTIvETo generate capital appreciation in the long term through equity investments by investing in a diversified portfolio of Mid Cap and large Cap ‘blue chip’ companies.
l FuND MaNagEr ¥
vinay Kulkarni (since november 21, 06) Total Experience: over 26 years
l INCEpTION DaTE (Date of allotment)April 6, 2005
Nav Nav pEr uNIT (`)Regular plan - Growth option 45.859Regular plan - Dividend option 14.135Direct plan - Growth option 46.954Direct plan - Dividend option 14.532
aSSETS uNDEr MaNagEMENT (`) IN CrOrEAs on January 31, 2017 291.08Average for Month of January, 2017 285.62
l quaNTITaTIvE DaTaportfolio Turnover Ratio (last 1 year) 6.94%risk ration Standard Deviation 6.005%n Beta 1.277n Sharpe Ratio* 0.189Computed for the 3-yr period ended January 31, 2017.Based on month-end nAV.* Risk free rate: 6.25% (Source: FIMMDA MIBoR)
l TOTal ExpENSE raTIO (Weighted average for the month) €Regular 2.54%Direct 1.94%€ Excluding Service Tax on Management Fees.
l BENCHMarK INDExnIFTy 500 Index
l ENTrY lOaDnot Applicable.
l ExIT lOaDl In respect of each purchase / switch-in of units, an Exit
load of 1.00% is payable if units are redeemed / switched-out within 1 year from the date of allotment.
l no Exit load is payable if units are redeemed / switched-out after 1 year from the date of allotment.
For further details, please refer to para ‘Exit load’ on pg 46.
l plaNSRegular plan, Direct plan
l OpTIONSunder Each plan : Growth & Dividend. The Dividend option offers Dividend payout and Reinvestment facility.
l MINIMuM applICaTION aMOuNT (under each plan / Option)purchase : ` 5,000 and any amount thereafter.Additional purchase : ` 1,000 and any amount thereafter.
l rEDEMpTION prOCEEDSnormally despatched within 3-4 Business Days.
l SEgMENT-WISE BrEaK-up OF EquITY HOlDINg (% OF NET aSSETS)large Cap 29.26%Mid Cap 68.72%
For Tax Benefits / Consequences, Please refer to page 46¥ Dedicated Fund Manager for overseas Investments: Mr Rakesh Vyas (Total Experience: over 12 years).
HDFC Premier Multi-cap Fund (An open-ended growth scheme)
This product is suitable for investors who are seeking ~ riskometer
l Capital appreciation over long term.
l Investment predominantly in equity and equity related instruments of Mid Cap and large Cap ‘blue chip’ companies.
Investors understand that their principal will be at moderately high risk
~ Investors should consult their financial advisers if in doubt about whether the product is suitable for them.
SIp performanceSince Inception
SIp10 year
SIp5 year
SIp3 year
SIp1 year
SIpTotal Amount Invested (` ‘000) 1,410.00 1,200.00 600.00 360.00 120.00Mkt Value as on December 30, 2016 (` ‘000) 2,685.38 2,021.38 789.22 393.18 125.04returns (annualised) (%) 10.45 10.06 10.91 5.81 7.89Benchmark Returns (Annualised) (%) # 9.47 8.98 10.12 5.36 3.01Addl. Benchmark Ret. (Annualised) (%) ## 8.85 7.92 7.69 2.79 1.61
past performance may or may not be sustained in the future. # nIFTy 500 Index ## nIFTy 50 Index. Assuming ` 10,000 invested systematically on the first Business Day of every month over a period of time. CAGR returns are computed after accounting for the cash flow by using XIRR method (investment internal rate of return) for Regular Plan - Growth Option. Load is not taken into consideration for computation of performance. The above investment simulation is for illustrative purposes only and should not be construed as a promise on minimum returns and safeguard of capital. The AMC / Mutual Fund is not guaranteeing or promising or forecasting any returns.
Company Industry+ % to Nav
EquITY & EquITY rElaTEDState Bank of India Banks 8.77ICICI Bank ltd. Banks 6.98Tata Motors ltd. DVR Auto 6.80Bank of Baroda Banks 5.02Infosys ltd. Software 4.79Bharat petroleum Corporation ltd. petroleum products 4.70Hindustan Construction Company ltd. Construction project 4.41Grasim Industries ltd. Cement 4.36Bharat Electronics ltd. Industrial Capital
Goods 4.23punjab national Bank Banks 4.19Total of Top Ten Holdings 54.25
Total Equity & Equity related Holdings 97.98
Cash, Cash Equivalents and net Current Assets 2.02
grand Total 100.00
For complete portfolio, please visit www.hdfcfund.com
portfolio - Top 10 Holdings
0.97
1.26
1.60
2.21
3.16
4.15
4.19
4.22
4.36
4.70
4.79
10.02
10.85
11.77
29.73
0 5 10 15 20 25 30
Telecom - Equipment & Accessories
Oil
Hotels, Resorts & Other Recreational Activities
Power
Pharmaceuticals
Ferrous Metals
Consumer Durables
Construction
Cement
Petroleum Products
Software
Industrial Capital Goods
Auto
Construction Project
Banks
Industry allocation of Equity Holding (% of Net assets)
Cumulative performanceDate period Nav
per unit (`)
Scheme returns
(%)^
Benchmark returns
(%)#
additional Benchmark
returns (%) ##
value of Investment of Scheme ̀ 10000@
Scheme (`) Benchmark (`)#
additional Benchmark
(`)##Dec 31, 15 last 1 year 42.948 0.17 3.84 3.01 10,017 10,384 10,301Dec 31, 14 last 2 years 43.476 -0.53 1.53 -0.59 9,895 10,309 9,883Dec 31, 13 last 3 years 28.590 14.59 12.42 9.10 15,047 14,208 12,985Apr 06, 05 Since Inception 10.000 13.23 12.20 12.42 43,019 38,643 39,558
Discrete 12 month returns (%)period Scheme
^Benchmark
#additional Benchmark
##Dec 31, 15 To Dec 30, 16 0.17 3.84 3.01Dec 31, 14 To Dec 31, 15 -1.21 -0.72 -4.06Dec 31, 13 To Dec 31, 14 52.07 37.82 31.39
^past performance may or may not be sustained in the future. The above returns are for Regular plan - Growth option. Returns greater than 1 year period are compounded annualized (CAGR). # nIFTy 500 Index ## nIFTy 50 Index. @ shows the current value of ` 10,000/- invested at the beginning of a given period. For performance of other schemes managed by Vinay Kulkarni, please refer page 46.
Face Value per unit: ` 10 unless otherwise specified, + Industry Classification as recommended by AMFI, Data is as of January 31, 2017 unless otherwise specified.

10 January 2017 Intouch mutually
l INvESTMENT OBjECTIvETo provide long-term capital appreciation by investing predominantly in large cap companies.
l FuND MaNagEr § ¥
vinay Kulkarni (since June 28, 14) Total Experience: over 26 years
l INCEpTION DaTE (Date of allotment)February 18, 1994
Nav Nav pEr uNIT (`)Regular plan - Growth option 91.580Regular plan - Dividend option 21.397Direct plan - Growth option 92.312Direct plan - Dividend option 23.825
aSSETS uNDEr MaNagEMENT (`) IN CrOrEAs on January 31, 2017 1,172.50Average for Month of January, 2017 1,156.06
l quaNTITaTIvE DaTaportfolio Turnover Ratio (last 1 year) 16.11%
risk ration Standard Deviation 4.236%n Beta 0.975n Sharpe Ratio* 0.101
Computed for the 3-yr period ended January 31, 2017.Based on month-end nAV.* Risk free rate: 6.25% (Source: FIMMDA MIBoR)
l TOTal ExpENSE raTIO (Weighted average for the month) €Regular 2.21%Direct 2.11%
€ Excluding Service Tax on Management Fees.
l BENCHMarK INDEx
nIFTy 50 Index
l ENTrY lOaDnot Applicable.
l ExIT lOaDl In respect of each purchase / switch-in of units, an Exit
load of 1.00% is payable if units are redeemed / switched-out within 1 year from the date of allotment.
l no Exit load is payable if units are redeemed / switched-out after 1 year from the date of allotment.
For further details, please refer to para ‘Exit load’ on pg 46.
l plaNSRegular plan, Direct plan
l OpTIONSunder Each plan : Growth & Dividend. The Dividend option offers Dividend payout and Reinvestment facility.
l MINIMuM applICaTION aMOuNT (under each plan / Option)purchase : ` 5,000 and any amount thereafter.Additional purchase : ` 1,000 and any amount thereafter.
l rEDEMpTION prOCEEDSnormally despatched within 3-4 Business Days.
For Tax Benefits / Consequences, Please refer to page 46§ Date of migration from Morgan Stanley Mutual Fund (Close of business hours - June 27, 14¥ Dedicated Fund Manager for overseas Investments: Mr Rakesh Vyas (Total Experience: over 12 years).
HDFC Large Cap Fund (An open-ended equity scheme)
This product is suitable for investors who are seeking ~ riskometer
l Capital appreciation over long term.
l Investment in equity and equity related instruments of large Cap companies.
Investors understand that their principal will be at moderately high risk
~ Investors should consult their financial advisers if in doubt about whether the product is suitable for them.
SIp performanceSince Inception
SIp5 year
SIp3 year
SIp1 year
SIpTotal Amount Invested (` ‘000) 1,040.00 600.00 360.00 120.00Mkt Value as on December 30, 2016 (` ‘000) $$ 1,497.43 723.63 375.92 123.00returns (annualised) (%) $$ 8.21 7.43 2.83 4.67Benchmark Returns (Annualised) (%) # 8.53 7.69 2.79 1.61Addl. Benchmark Ret. (Annualised) (%) ## 8.09 6.99 1.73 1.18
past performance may or may not be sustained in the future. # nIFTy 50 Index ## S&p BSE SEnSEx. Assuming ̀ 10,000 invested systematically on the first Business Day of every month over a period of time. CAGR returns are computed after accounting for the cash flow by using XIRR method (investment internal rate of return) for Regular Plan - Growth Option. Load is not taken into consideration for computation of performance. The above investment simulation is for illustrative purposes only and should not be construed as a promise on minimum returns and safeguard of capital. The AMC / Mutual Fund is not guaranteeing or promising or forecasting any returns.
0.84
1.12
1.87
2.86
3.15
6.99
7.87
8.00
14.30
16.41
35.67
0 5 10 15 20 25 30 35 40
Gas
Transportation
Oil
Power
Cement
Consumer Non Durables
Software
Construction Project
Auto
Petroleum Products
Banks
Industry allocation of Equity Holding (% of Net assets)
Cumulative performanceDate period Nav
per unit (`)
Scheme returns
(%)^$$
Benchmark returns
(%)#
additional Benchmark
returns (%) ##
value of Investment of Scheme ̀ 10000@
Scheme (`)$$
Benchmark (`)#
additional Benchmark
(`)##Dec 31, 15 last 1 year 84.214 3.92 3.01 1.95 10,392 10,301 10,195Dec 31, 14 last 2 years 88.497 -0.56 -0.59 -1.60 9,889 9,883 9,683Dec 31, 13 last 3 years 69.430 8.02 9.10 7.94 12,604 12,985 12,577Feb 18, 94 Since Inception 10.000 10.53 8.63 8.74 98,715 66,435 68,011
Discrete 12 month returns (%)period Scheme
^$$Benchmark
#additional Benchmark
##Dec 31, 15 To Dec 30, 16 3.92 3.01 1.95Dec 31, 14 To Dec 31, 15 -4.84 -4.06 -5.03Dec 31, 13 To Dec 31, 14 27.46 31.39 29.89
^past performance may or may not be sustained in the future. The above returns are for Regular plan - Growth option. Returns greater than 1 year period are compounded annualized (CAGR). # nIFTy 50 Index ## S&p BSE SEnSEx. @ shows the current value of ` 10,000/- invested at the beginning of a given period. $$ All dividends declared prior to the splitting of the Scheme into Dividend & Growth options are assumed to be reinvested in the units of the Scheme at the then prevailing nAV. For performance of other schemes managed by Vinay Kulkarni, please refer page 46.
Company Industry+ % to Nav
EquITY & EquITY rElaTEDHDFC Bank ltd. Banks 9.04ICICI Bank ltd. Banks 8.92State Bank of India Banks 8.87Reliance Industries ltd. petroleum products 8.33larsen & Toubro ltd. Construction project 8.00Bharat petroleum Corporation ltd. petroleum products 7.48ITC ltd. Consumer non
Durables 6.99Tata Motors ltd. DVR Auto 6.60Axis Bank ltd. Banks 6.56Infosys ltd. Software 5.04Total of Top Ten Holdings 75.83
Investment in aDr/gDr/Foreign SecuritiesCognizant Technology Solutions Corp Software 2.83Total Equity & Equity related Holdings 99.08Cash, Cash Equivalents and net Current Assets 0.92
grand Total 100.00
For complete portfolio, please visit www.hdfcfund.comInvestment in Foreign Securities (` in Crore) 33.12
portfolio - Top 10 Holdings
Face Value per unit: ` 10 unless otherwise specified, + Industry Classification as recommended by AMFI, Data is as of January 31, 2017 unless otherwise specified.
Intouch mutually January 2017 11
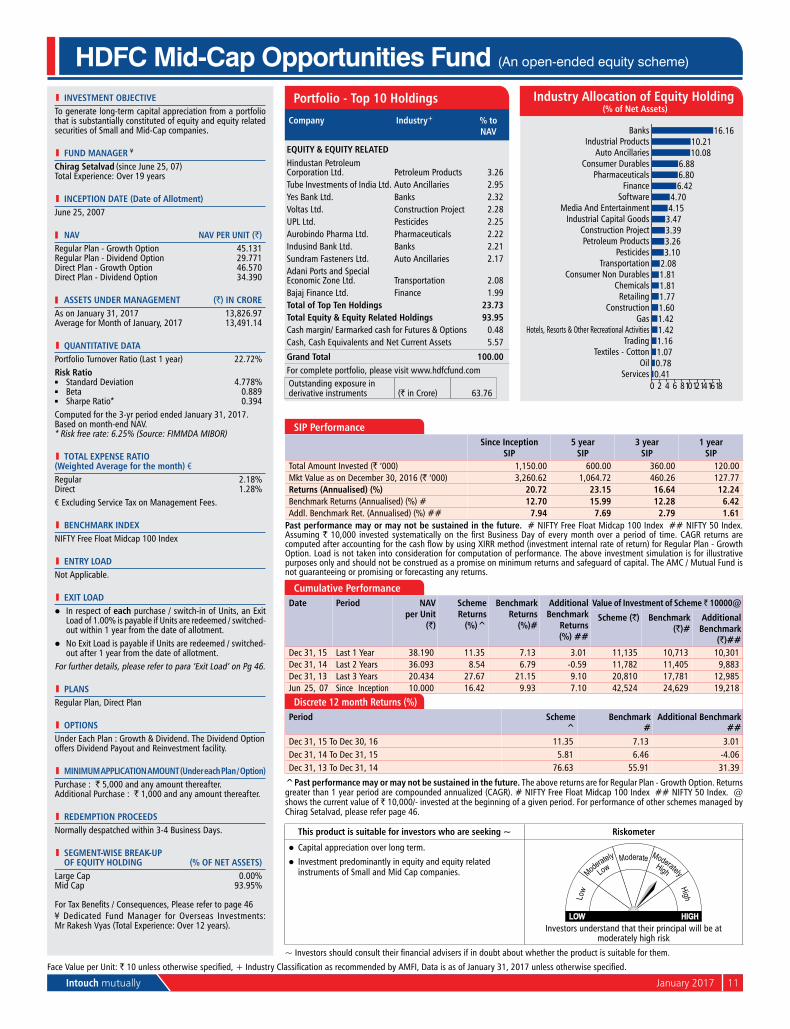
l INvESTMENT OBjECTIvETo generate long-term capital appreciation from a portfolio that is substantially constituted of equity and equity related securities of Small and Mid-Cap companies.
l FuND MaNagEr ¥
Chirag Setalvad (since June 25, 07) Total Experience: over 19 years
l INCEpTION DaTE (Date of allotment)June 25, 2007
Nav Nav pEr uNIT (`)Regular plan - Growth option 45.131Regular plan - Dividend option 29.771Direct plan - Growth option 46.570Direct plan - Dividend option 34.390
aSSETS uNDEr MaNagEMENT (`) IN CrOrEAs on January 31, 2017 13,826.97Average for Month of January, 2017 13,491.14
l quaNTITaTIvE DaTaportfolio Turnover Ratio (last 1 year) 22.72%risk ration Standard Deviation 4.778%n Beta 0.889n Sharpe Ratio* 0.394Computed for the 3-yr period ended January 31, 2017.Based on month-end nAV.* Risk free rate: 6.25% (Source: FIMMDA MIBoR)
l TOTal ExpENSE raTIO (Weighted average for the month) €Regular 2.18%Direct 1.28%€ Excluding Service Tax on Management Fees.
l BENCHMarK INDExnIFTy Free Float Midcap 100 Index
l ENTrY lOaDnot Applicable.
l ExIT lOaDl In respect of each purchase / switch-in of units, an Exit
load of 1.00% is payable if units are redeemed / switched-out within 1 year from the date of allotment.
l no Exit load is payable if units are redeemed / switched-out after 1 year from the date of allotment.
For further details, please refer to para ‘Exit load’ on pg 46.
l plaNSRegular plan, Direct plan
l OpTIONSunder Each plan : Growth & Dividend. The Dividend option offers Dividend payout and Reinvestment facility.
l MINIMuM applICaTION aMOuNT (under each plan / Option)purchase : ` 5,000 and any amount thereafter.Additional purchase : ` 1,000 and any amount thereafter.
l rEDEMpTION prOCEEDSnormally despatched within 3-4 Business Days.
l SEgMENT-WISE BrEaK-up OF EquITY HOlDINg (% OF NET aSSETS)large Cap 0.00%Mid Cap 93.95%
For Tax Benefits / Consequences, Please refer to page 46¥ Dedicated Fund Manager for overseas Investments: Mr Rakesh Vyas (Total Experience: over 12 years).
HDFC Mid-Cap Opportunities Fund (An open-ended equity scheme)
This product is suitable for investors who are seeking ~ riskometer
l Capital appreciation over long term.
l Investment predominantly in equity and equity related instruments of Small and Mid Cap companies.
Investors understand that their principal will be at moderately high risk
~ Investors should consult their financial advisers if in doubt about whether the product is suitable for them.
SIp performanceSince Inception
SIp5 year
SIp3 year
SIp1 year
SIpTotal Amount Invested (` ‘000) 1,150.00 600.00 360.00 120.00Mkt Value as on December 30, 2016 (` ‘000) 3,260.62 1,064.72 460.26 127.77returns (annualised) (%) 20.72 23.15 16.64 12.24Benchmark Returns (Annualised) (%) # 12.70 15.99 12.28 6.42Addl. Benchmark Ret. (Annualised) (%) ## 7.94 7.69 2.79 1.61
past performance may or may not be sustained in the future. # nIFTy Free Float Midcap 100 Index ## nIFTy 50 Index. Assuming ` 10,000 invested systematically on the first Business Day of every month over a period of time. CAGR returns are computed after accounting for the cash flow by using XIRR method (investment internal rate of return) for Regular Plan - Growth option. load is not taken into consideration for computation of performance. The above investment simulation is for illustrative purposes only and should not be construed as a promise on minimum returns and safeguard of capital. The AMC / Mutual Fund is not guaranteeing or promising or forecasting any returns.
Company Industry+ % to Nav
EquITY & EquITY rElaTEDHindustan petroleum Corporation ltd. petroleum products 3.26Tube Investments of India ltd. Auto Ancillaries 2.95yes Bank ltd. Banks 2.32Voltas ltd. Construction project 2.28upl ltd. pesticides 2.25Aurobindo pharma ltd. pharmaceuticals 2.22Indusind Bank ltd. Banks 2.21Sundram Fasteners ltd. Auto Ancillaries 2.17Adani ports and Special Economic Zone ltd. Transportation 2.08Bajaj Finance ltd. Finance 1.99Total of Top Ten Holdings 23.73Total Equity & Equity related Holdings 93.95Cash margin/ Earmarked cash for Futures & options 0.48Cash, Cash Equivalents and net Current Assets 5.57
grand Total 100.00For complete portfolio, please visit www.hdfcfund.comoutstanding exposure in derivative instruments (` in Crore) 63.76
portfolio - Top 10 Holdings
0.410.781.071.161.421.421.601.771.811.812.083.103.263.393.474.154.70
6.426.806.88
10.0810.21
16.16
0 2 4 6 81012141618Services
OilTextiles - Cotton
TradingHotels, Resorts & Other Recreational Activities
GasConstruction
RetailingChemicals
Consumer Non DurablesTransportation
PesticidesPetroleum Products
Construction ProjectIndustrial Capital Goods
Media And EntertainmentSoftware
FinancePharmaceuticals
Consumer DurablesAuto Ancillaries
Industrial ProductsBanks
Industry allocation of Equity Holding (% of Net assets)
Cumulative performanceDate period Nav
per unit (`)
Scheme returns
(%)^
Benchmark returns
(%)#
additional Benchmark
returns (%) ##
value of Investment of Scheme ̀ 10000@
Scheme (`) Benchmark (`)#
additional Benchmark
(`)##Dec 31, 15 last 1 year 38.190 11.35 7.13 3.01 11,135 10,713 10,301Dec 31, 14 last 2 years 36.093 8.54 6.79 -0.59 11,782 11,405 9,883Dec 31, 13 last 3 years 20.434 27.67 21.15 9.10 20,810 17,781 12,985Jun 25, 07 Since Inception 10.000 16.42 9.93 7.10 42,524 24,629 19,218
Discrete 12 month returns (%)period Scheme
^Benchmark
#additional Benchmark
##Dec 31, 15 To Dec 30, 16 11.35 7.13 3.01Dec 31, 14 To Dec 31, 15 5.81 6.46 -4.06Dec 31, 13 To Dec 31, 14 76.63 55.91 31.39
^past performance may or may not be sustained in the future. The above returns are for Regular plan - Growth option. Returns greater than 1 year period are compounded annualized (CAGR). # nIFTy Free Float Midcap 100 Index ## nIFTy 50 Index. @ shows the current value of ` 10,000/- invested at the beginning of a given period. For performance of other schemes managed by Chirag Setalvad, please refer page 46.
Face Value per unit: ` 10 unless otherwise specified, + Industry Classification as recommended by AMFI, Data is as of January 31, 2017 unless otherwise specified.
12 January 2017 Intouch mutually
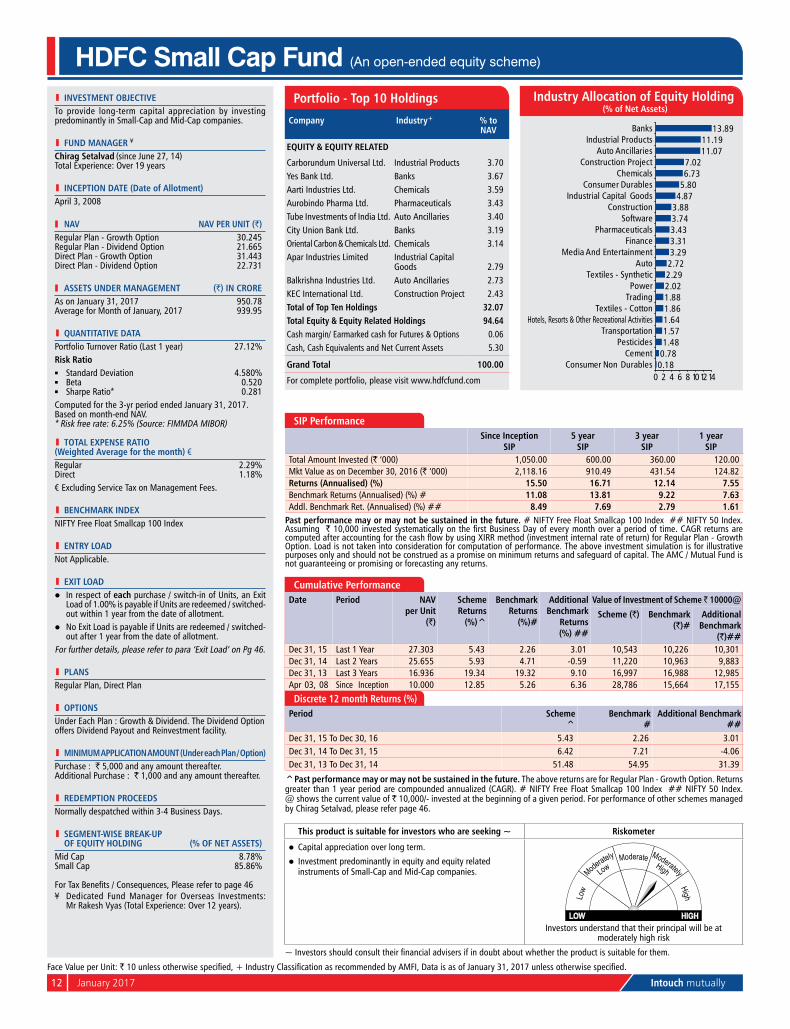
l INvESTMENT OBjECTIvETo provide long-term capital appreciation by investing predominantly in Small-Cap and Mid-Cap companies.
l FuND MaNagEr ¥
Chirag Setalvad (since June 27, 14) Total Experience: over 19 years
l INCEpTION DaTE (Date of allotment)April 3, 2008
Nav Nav pEr uNIT (`)Regular plan - Growth option 30.245Regular plan - Dividend option 21.665Direct plan - Growth option 31.443Direct plan - Dividend option 22.731
aSSETS uNDEr MaNagEMENT (`) IN CrOrEAs on January 31, 2017 950.78Average for Month of January, 2017 939.95
l quaNTITaTIvE DaTaportfolio Turnover Ratio (last 1 year) 27.12%risk ration Standard Deviation 4.580%n Beta 0.520n Sharpe Ratio* 0.281Computed for the 3-yr period ended January 31, 2017.Based on month-end nAV.* Risk free rate: 6.25% (Source: FIMMDA MIBoR)
l TOTal ExpENSE raTIO (Weighted average for the month) €Regular 2.29%Direct 1.18%€ Excluding Service Tax on Management Fees.
l BENCHMarK INDExnIFTy Free Float Smallcap 100 Index
l ENTrY lOaDnot Applicable.
l ExIT lOaDl In respect of each purchase / switch-in of units, an Exit
load of 1.00% is payable if units are redeemed / switched-out within 1 year from the date of allotment.
l no Exit load is payable if units are redeemed / switched-out after 1 year from the date of allotment.
For further details, please refer to para ‘Exit load’ on pg 46.
l plaNSRegular plan, Direct plan
l OpTIONSunder Each plan : Growth & Dividend. The Dividend option offers Dividend payout and Reinvestment facility.
l MINIMuM applICaTION aMOuNT (under each plan / Option)purchase : ` 5,000 and any amount thereafter.Additional purchase : ` 1,000 and any amount thereafter.
l rEDEMpTION prOCEEDSnormally despatched within 3-4 Business Days.
l SEgMENT-WISE BrEaK-up OF EquITY HOlDINg (% OF NET aSSETS)Mid Cap 8.78%Small Cap 85.86%
For Tax Benefits / Consequences, Please refer to page 46¥ Dedicated Fund Manager for overseas Investments:
Mr Rakesh Vyas (Total Experience: over 12 years).
HDFC Small Cap Fund (An open-ended equity scheme)
This product is suitable for investors who are seeking ~ riskometer
l Capital appreciation over long term.
l Investment predominantly in equity and equity related instruments of Small-Cap and Mid-Cap companies.
Investors understand that their principal will be at moderately high risk
~ Investors should consult their financial advisers if in doubt about whether the product is suitable for them.
SIp performanceSince Inception
SIp5 year
SIp3 year
SIp1 year
SIpTotal Amount Invested (` ‘000) 1,050.00 600.00 360.00 120.00Mkt Value as on December 30, 2016 (` ‘000) 2,118.16 910.49 431.54 124.82returns (annualised) (%) 15.50 16.71 12.14 7.55Benchmark Returns (Annualised) (%) # 11.08 13.81 9.22 7.63Addl. Benchmark Ret. (Annualised) (%) ## 8.49 7.69 2.79 1.61
past performance may or may not be sustained in the future. # nIFTy Free Float Smallcap 100 Index ## nIFTy 50 Index. Assuming ` 10,000 invested systematically on the first Business Day of every month over a period of time. CAGR returns are computed after accounting for the cash flow by using XIRR method (investment internal rate of return) for Regular Plan - Growth option. load is not taken into consideration for computation of performance. The above investment simulation is for illustrative purposes only and should not be construed as a promise on minimum returns and safeguard of capital. The AMC / Mutual Fund is not guaranteeing or promising or forecasting any returns.
Company Industry+ % to Nav
EquITY & EquITY rElaTED
Carborundum universal ltd. Industrial products 3.70yes Bank ltd. Banks 3.67Aarti Industries ltd. Chemicals 3.59Aurobindo pharma ltd. pharmaceuticals 3.43Tube Investments of India ltd. Auto Ancillaries 3.40City union Bank ltd. Banks 3.19oriental Carbon & Chemicals ltd. Chemicals 3.14Apar Industries limited Industrial Capital
Goods 2.79Balkrishna Industries ltd. Auto Ancillaries 2.73KEC International ltd. Construction project 2.43Total of Top Ten Holdings 32.07Total Equity & Equity related Holdings 94.64Cash margin/ Earmarked cash for Futures & options 0.06Cash, Cash Equivalents and net Current Assets 5.30
grand Total 100.00
For complete portfolio, please visit www.hdfcfund.com
portfolio - Top 10 Holdings
0.180.781.481.571.641.861.882.022.292.723.293.313.433.743.884.875.806.737.02
11.0711.19
13.89
0 2 4 6 8 101214Consumer Non Durables
CementPesticides
TransportationHotels, Resorts & Other Recreational Activities
Textiles - CottonTradingPower
Textiles - SyntheticAuto
Media And EntertainmentFinance
PharmaceuticalsSoftware
ConstructionIndustrial Capital Goods
Consumer DurablesChemicals
Construction ProjectAuto Ancillaries
Industrial ProductsBanks
Industry allocation of Equity Holding (% of Net assets)
Cumulative performanceDate period Nav
per unit (`)
Scheme returns
(%)^
Benchmark returns
(%)#
additional Benchmark
returns (%) ##
value of Investment of Scheme ̀ 10000@
Scheme (`) Benchmark (`)#
additional Benchmark
(`)##Dec 31, 15 last 1 year 27.303 5.43 2.26 3.01 10,543 10,226 10,301Dec 31, 14 last 2 years 25.655 5.93 4.71 -0.59 11,220 10,963 9,883Dec 31, 13 last 3 years 16.936 19.34 19.32 9.10 16,997 16,988 12,985Apr 03, 08 Since Inception 10.000 12.85 5.26 6.36 28,786 15,664 17,155
Discrete 12 month returns (%)period Scheme
^Benchmark
#additional Benchmark
##Dec 31, 15 To Dec 30, 16 5.43 2.26 3.01Dec 31, 14 To Dec 31, 15 6.42 7.21 -4.06Dec 31, 13 To Dec 31, 14 51.48 54.95 31.39
^past performance may or may not be sustained in the future. The above returns are for Regular plan - Growth option. Returns greater than 1 year period are compounded annualized (CAGR). # nIFTy Free Float Smallcap 100 Index ## nIFTy 50 Index. @ shows the current value of ` 10,000/- invested at the beginning of a given period. For performance of other schemes managed by Chirag Setalvad, please refer page 46.
Face Value per unit: ` 10 unless otherwise specified, + Industry Classification as recommended by AMFI, Data is as of January 31, 2017 unless otherwise specified.

Intouch mutually January 2017 13
l INvESTMENT OBjECTIvETo generate long term capital appreciation from a portfolio that is invested predominantly in equity and equity related instruments.
l FuND MaNagEr ¥
Chirag Setalvad (since April 2, 07) Total Experience: over 19 years
l INCEpTION DaTE (Date of allotment)January 2, 2001
Nav Nav pEr uNIT (`)Regular plan - Growth option 271.317Regular plan - Dividend option 40.101Direct plan - Growth option 277.579Direct plan - Dividend option 41.861
aSSETS uNDEr MaNagEMENT (`) IN CrOrEAs on January 31, 2017 1,283.93Average for Month of January, 2017 1,260.76
l quaNTITaTIvE DaTaportfolio Turnover Ratio (last 1 year) 9.95%
risk ration Standard Deviation 4.265%n Beta 0.982n Sharpe Ratio* 0.249
Computed for the 3-yr period ended January 31, 2017.Based on month-end nAV.* Risk free rate: 6.25% (Source: FIMMDA MIBoR)
l TOTal ExpENSE raTIO (Weighted average for the month) €Regular 2.29%Direct 1.64%
€ Excluding Service Tax on Management Fees.
l BENCHMarK INDExS&p BSE SEnSEx
l ENTrY lOaDnot Applicable.
l ExIT lOaDnil
l plaNSRegular plan, Direct plan
l OpTIONSunder Each plan : Growth & Dividend. The Dividend option offers Dividend payout facility.
l MINIMuM applICaTION aMOuNT (under each plan / Option)purchase : ` 500 and in multiples of ` 500 thereafter.Additional purchase : ̀ 500 and in multiples of ̀ 500 thereafter.
l rEDEMpTION prOCEEDSnormally despatched within 3-4 Business Days.
l lOCK-IN pErIOD3 years from the date of allotment of the respective units
For Tax Benefits / Consequences, Please refer to page 46¥ Dedicated Fund Manager for overseas Investments: Mr Rakesh Vyas (Total Experience: over 12 years).
HDFC Long Term Advantage Fund (An open-ended equity linked saving scheme with a lock-in period of 3 years)
This product is suitable for investors who are seeking ~ riskometer
l Capital appreciation over long term.
l Investment predominantly in equity and equity related instruments.
Investors understand that their principal will be at moderately high risk
~ Investors should consult their financial advisers if in doubt about whether the product is suitable for them.
SIp performanceSince Inception
SIp15 year
SIp10 year
SIp5 year
SIp3 year
SIp1 year
SIpTotal Amount Invested (` ‘000) 1,920.00 1,800.00 1,200.00 600.00 360.00 120.00Mkt Value as on December 30, 2016 (` ‘000) 12,001.68 8,693.33 2,411.56 869.86 419.83 128.49returns (annualised) (%) 20.35 18.92 13.38 14.85 10.25 13.40Benchmark Returns (Annualised) (%) # 12.74 12.41 7.46 6.99 1.73 1.18Addl. Benchmark Ret. (Annualised) (%) ## 12.59 12.31 7.92 7.69 2.79 1.61
past performance may or may not be sustained in the future. # S&p BSE SEnSEx ## nIFTy 50 Index. Assuming ̀ 10,000 invested systematically on the first Business Day of every month over a period of time. CAGR returns are computed after accounting for the cash flow by using XIRR method (investment internal rate of return) for Regular Plan - Growth Option. load is not taken into consideration for computation of performance. The above investment simulation is for illustrative purposes only and should not be construed as a promise on minimum returns and safeguard of capital. The AMC / Mutual Fund is not guaranteeing or promising or forecasting any returns.
Company Industry+ % to Nav
EquITY & EquITY rElaTED
ICICI Bank ltd. Banks 6.28HDFC Bank ltd. Banks 5.51Infosys ltd. Software 5.50Reliance Industries ltd. petroleum products 5.37State Bank of India Banks 5.27Tata Motors ltd. DVR Auto 4.79larsen & Toubro ltd. Construction project 4.56Bharat petroleum Corporation ltd. petroleum products 4.37Housing Development Finance Corporation ltd.£ Finance 4.26
Vesuvius India ltd. Industrial products 3.91
Total of Top Ten Holdings 49.82
Total Equity & Equity related Holdings 94.32
Cash, Cash Equivalents and net Current Assets 5.68
grand Total 100.00
For complete portfolio, please visit www.hdfcfund.com£ Co-sponsor
portfolio - Top 10 Holdings
0.33
1.08
1.08
1.19
1.35
1.59
1.93
2.42
3.32
4.19
4.26
5.03
6.24
8.55
9.58
9.74
12.84
19.60
0 5 10 15 20Media And Entertainment
Ferrous Metals
Telecom - Services
Chemicals
Pharmaceuticals
Trading
Industrial Capital Goods
Power
Consumer Non Durables
Consumer Durables
Finance
Construction Project
Auto Ancillaries
Auto
Software
Petroleum Products
Industrial Products
Banks
Industry allocation of Equity Holding (% of Net assets)
Cumulative performanceDate period Nav
per unit (`)
Scheme returns
(%)^
Benchmark returns
(%)#
additional Benchmark
returns (%) ##
value of Investment of Scheme ̀ 10000@
Scheme (`) Benchmark (`)#
additional Benchmark
(`)##Dec 31, 15 last 1 year 230.008 13.02 1.95 3.01 11,302 10,195 10,301Dec 31, 14 last 2 years 235.667 5.02 -1.60 -0.59 11,030 9,683 9,883Dec 31, 13 last 3 years 162.886 16.86 7.94 9.10 15,959 12,577 12,985Jan 02, 01 Since Inception 10.000 22.58 12.54 12.34 259,945 66,253 64,364
Discrete 12 month returns (%)period Scheme
^Benchmark
#additional Benchmark
##Dec 31, 15 To Dec 30, 16 13.02 1.95 3.01Dec 31, 14 To Dec 31, 15 -2.40 -5.03 -4.06Dec 31, 13 To Dec 31, 14 44.68 29.89 31.39
^past performance may or may not be sustained in the future. The above returns are for Regular plan - Growth option. Returns greater than 1 year period are compounded annualized (CAGR). # S&p BSE SEnSEx ## nIFTy 50 Index. @ shows the current value of ` 10,000/- invested at the beginning of a given period. For performance of other schemes managed by Chirag Setalvad, please refer page 46.
Face Value per unit: ` 10 unless otherwise specified, + Industry Classification as recommended by AMFI, Data is as of January 31, 2017 unless otherwise specified.

14 January 2017 Intouch mutually
l INvESTMENT OBjECTIvETo achieve long term growth of capital.
l FuND MaNagEr ¥
vinay Kulkarni (since november 21, 06) Total Experience: over 26 years
l INCEpTION DaTE (Date of allotment)March 31, 1996
Nav Nav pEr uNIT (`)Regular plan - Growth option 433.314Regular plan - Dividend option 62.191Direct plan - Growth option 443.719Direct plan - Dividend option 64.001
aSSETS uNDEr MaNagEMENT (`) IN CrOrEAs on January 31, 2017 5,589.15Average for Month of January, 2017 5,437.82
l quaNTITaTIvE DaTaportfolio Turnover Ratio (last 1 year) 36.85%
risk ration Standard Deviation 5.397%n Beta 1.157n Sharpe Ratio* 0.222
Computed for the 3-yr period ended January 31, 2017.Based on month-end nAV.* Risk free rate: 6.25% (Source: FIMMDA MIBoR)
l TOTal ExpENSE raTIO (Weighted average for the month) €Regular 2.17%Direct 1.47%
€ Excluding Service Tax on Management Fees.
l BENCHMarK INDExnIFTy 500 Index
l ENTrY lOaDnot Applicable.
l ExIT lOaDnil
l plaNSRegular plan, Direct plan
l OpTIONSunder Each plan : Growth & Dividend. The Dividend option offers Dividend payout facility.
l MINIMuM applICaTION aMOuNT (under each plan / Option)purchase : ` 500 and in multiples of ` 500 thereafter.Additional purchase : ̀ 500 and in multiples of ̀ 500 thereafter.
l rEDEMpTION prOCEEDSnormally despatched within 3-4 Business Days (Redemption is subject to completion of lock-in period, if applicable).
l lOCK-IN pErIOD3 years from the date of allotment of the respective units
For Tax Benefits / Consequences, Please refer to page 46¥ Dedicated Fund Manager for overseas Investments: Mr Rakesh Vyas (Total Experience: over 12 years).
HDFC TaxSaver (An open-ended equity linked saving scheme with a lock-in period of 3 years)
This product is suitable for investors who are seeking ~ riskometer
l Growth of capital over long term.
l Investment predominantly in equity and equity related instruments.
Investors understand that their principal will be at moderately high risk
~ Investors should consult their financial advisers if in doubt about whether the product is suitable for them.
Company Industry+ % to Nav
EquITY & EquITY rElaTED
State Bank of India Banks 8.08ICICI Bank ltd. Banks 5.57larsen & Toubro ltd. Construction project 5.44HDFC Bank ltd. Banks 5.00Tata Motors ltd. DVR Auto 4.87Bharat petroleum Corporation ltd. petroleum products 4.02Bharat Electronics ltd. Industrial Capital
Goods 3.84Cipla ltd. pharmaceuticals 3.77Reliance Industries ltd. petroleum products 3.37Tata Steel ltd. Ferrous Metals 3.19Total of Top Ten Holdings 47.15
Total Equity & Equity related Holdings 99.65Cash margin/ Earmarked cash for Futures & options 0.05Cash, Cash Equivalents and net Current Assets 0.30
grand Total 100.00
For complete portfolio, please visit www.hdfcfund.com
portfolio - Top 10 Holdings
0.060.320.570.580.710.911.131.261.371.531.552.482.723.063.193.624.925.005.355.777.507.67
10.2228.16
0 5 10 15 20 25 30Diversified Consumer Service
PesticidesMedia And Entertainment
Hotels, Resorts & Other Recreational ActivitiesTelecom - Services
Non - Ferrous MetalsChemicals
TransportationOil
Industrial ProductsGas
Auto AncillariesConsumer Durables
Consumer Non DurablesFerrous Metals
CementPharmaceuticals
PowerSoftware
Industrial Capital GoodsPetroleum Products
AutoConstruction Project
Banks
Industry allocation of Equity Holding (% of Net assets)
SIp performanceSince Inception
SIp15 year
SIp10 year
SIp5 year
SIp3 year
SIp1 year
SIpTotal Amount Invested (` ‘000) 2,490.00 1,800.00 1,200.00 600.00 360.00 120.00Mkt Value as on December 30, 2016 (` ‘000) $$ 51,082.84 9,153.49 2,315.38 838.79 405.07 127.91returns (annualised) (%) $$ 24.41 19.51 12.62 13.37 7.82 12.47Benchmark Returns (Annualised) (%) # 13.16 13.27 8.98 10.12 5.36 3.01Addl. Benchmark Ret. (Annualised) (%) ## 11.92 12.31 7.92 7.69 2.79 1.61
past performance may or may not be sustained in the future. # nIFTy 500 Index ## nIFTy 50 Index. Assuming ` 10,000 invested systematically on the first Business Day of every month over a period of time. CAGR returns are computed after accounting for the cash flow by using XIRR method (investment internal rate of return) for Regular Plan - Growth Option. Load is not taken into consideration for computation of performance. The above investment simulation is for illustrative purposes only and should not be construed as a promise on minimum returns and safeguard of capital. The AMC / Mutual Fund is not guaranteeing or promising or forecasting any returns.
Cumulative performanceDate period Nav
per unit (`)
Scheme returns
(%)^$$
Benchmark returns
(%)#
additional Benchmark
returns (%) ##
value of Investment of Scheme ̀ 10000@
Scheme (`)$$
Benchmark (`)#
additional Benchmark
(`)##Dec 31, 15 last 1 year 375.880 7.57 3.84 3.01 10,757 10,384 10,301Dec 31, 14 last 2 years 400.904 0.43 1.53 -0.59 10,085 10,309 9,883Dec 31, 13 last 3 years 256.398 16.40 12.42 9.10 15,769 14,208 12,985Mar 31, 96 Since Inception 10.000 24.95 11.71 n.A. 1,019,938 99,736 n.A.
Discrete 12 month returns (%)period Scheme
^$$Benchmark
#additional Benchmark
##Dec 31, 15 To Dec 30, 16 7.57 3.84 3.01Dec 31, 14 To Dec 31, 15 -6.24 -0.72 -4.06Dec 31, 13 To Dec 31, 14 56.36 37.82 31.39
^past performance may or may not be sustained in the future. The above returns are for Regular plan - Growth option. Returns greater than 1 year period are compounded annualized (CAGR). # nIFTy 500 Index ## nIFTy 50 Index. $$ All dividends declared prior to the splitting of the Scheme into Dividend & Growth options are assumed to be reinvested in the units of the Scheme at the then prevailing nAV (ex-dividend nAV). @ shows the current value of ̀ 10,000/- invested at the beginning of a given period. n.A.: not Available. For performance of other schemes managed by Vinay Kulkarni, please refer page 46.
Face Value per unit: ` 10 unless otherwise specified, + Industry Classification as recommended by AMFI, Data is as of January 31, 2017 unless otherwise specified.
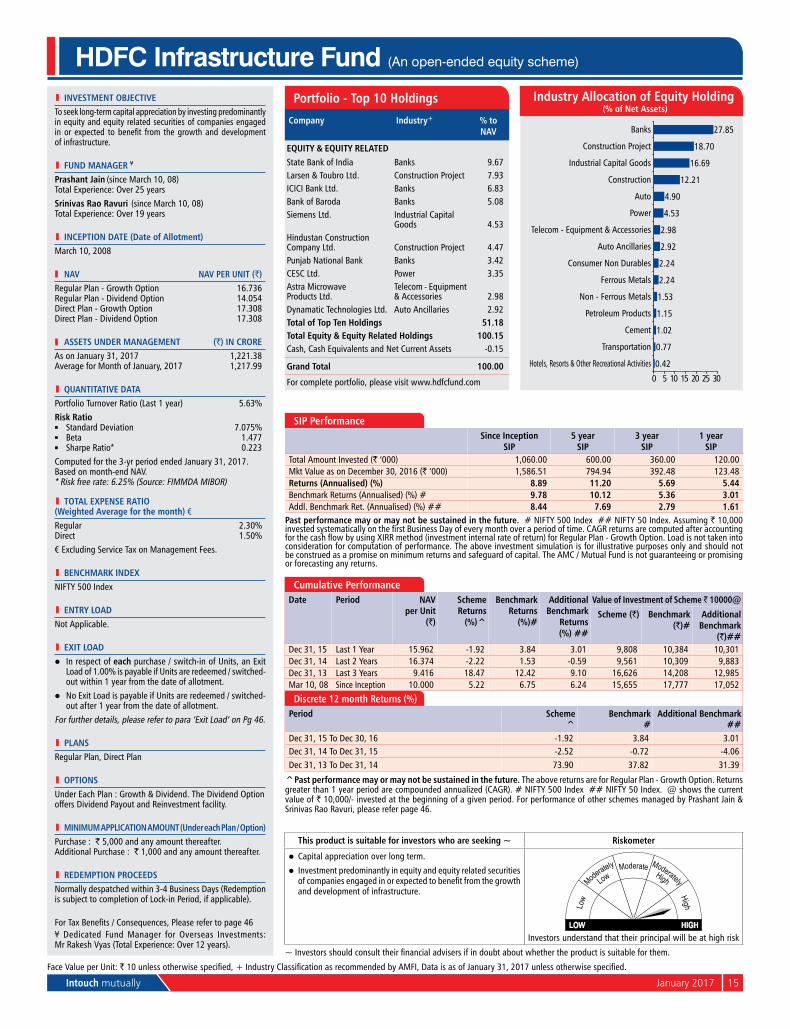
Intouch mutually January 2017 15
l INvESTMENT OBjECTIvETo seek long-term capital appreciation by investing predominantly in equity and equity related securities of companies engaged in or expected to benefit from the growth and development of infrastructure.
l FuND MaNagEr ¥
prashant jain (since March 10, 08) Total Experience: over 25 yearsSrinivas rao ravuri (since March 10, 08) Total Experience: over 19 years
l INCEpTION DaTE (Date of allotment)March 10, 2008
Nav Nav pEr uNIT (`)Regular plan - Growth option 16.736Regular plan - Dividend option 14.054Direct plan - Growth option 17.308Direct plan - Dividend option 17.308
aSSETS uNDEr MaNagEMENT (`) IN CrOrEAs on January 31, 2017 1,221.38Average for Month of January, 2017 1,217.99
l quaNTITaTIvE DaTaportfolio Turnover Ratio (last 1 year) 5.63%risk ration Standard Deviation 7.075%n Beta 1.477n Sharpe Ratio* 0.223Computed for the 3-yr period ended January 31, 2017.Based on month-end nAV.* Risk free rate: 6.25% (Source: FIMMDA MIBoR)
l TOTal ExpENSE raTIO (Weighted average for the month) €Regular 2.30%Direct 1.50%€ Excluding Service Tax on Management Fees.
l BENCHMarK INDExnIFTy 500 Index
l ENTrY lOaDnot Applicable.
l ExIT lOaDl In respect of each purchase / switch-in of units, an Exit
load of 1.00% is payable if units are redeemed / switched-out within 1 year from the date of allotment.
l no Exit load is payable if units are redeemed / switched-out after 1 year from the date of allotment.
For further details, please refer to para ‘Exit load’ on pg 46.
l plaNSRegular plan, Direct plan
l OpTIONSunder Each plan : Growth & Dividend. The Dividend option offers Dividend payout and Reinvestment facility.
l MINIMuM applICaTION aMOuNT (under each plan / Option)purchase : ` 5,000 and any amount thereafter.Additional purchase : ` 1,000 and any amount thereafter.
l rEDEMpTION prOCEEDSnormally despatched within 3-4 Business Days (Redemption is subject to completion of lock-in period, if applicable).
For Tax Benefits / Consequences, Please refer to page 46¥ Dedicated Fund Manager for overseas Investments: Mr Rakesh Vyas (Total Experience: over 12 years).
HDFC Infrastructure Fund (An open-ended equity scheme)
This product is suitable for investors who are seeking ~ riskometer
l Capital appreciation over long term.
l Investment predominantly in equity and equity related securities of companies engaged in or expected to benefit from the growth and development of infrastructure.
Investors understand that their principal will be at high risk
~ Investors should consult their financial advisers if in doubt about whether the product is suitable for them.
SIp performanceSince Inception
SIp5 year
SIp3 year
SIp1 year
SIpTotal Amount Invested (` ‘000) 1,060.00 600.00 360.00 120.00Mkt Value as on December 30, 2016 (` ‘000) 1,586.51 794.94 392.48 123.48returns (annualised) (%) 8.89 11.20 5.69 5.44Benchmark Returns (Annualised) (%) # 9.78 10.12 5.36 3.01Addl. Benchmark Ret. (Annualised) (%) ## 8.44 7.69 2.79 1.61
past performance may or may not be sustained in the future. # nIFTy 500 Index ## nIFTy 50 Index. Assuming ` 10,000 invested systematically on the first Business Day of every month over a period of time. CAGR returns are computed after accounting for the cash flow by using XIRR method (investment internal rate of return) for Regular Plan - Growth Option. Load is not taken into consideration for computation of performance. The above investment simulation is for illustrative purposes only and should not be construed as a promise on minimum returns and safeguard of capital. The AMC / Mutual Fund is not guaranteeing or promising or forecasting any returns.
Company Industry+ % to Nav
EquITY & EquITY rElaTEDState Bank of India Banks 9.67larsen & Toubro ltd. Construction project 7.93ICICI Bank ltd. Banks 6.83Bank of Baroda Banks 5.08Siemens ltd. Industrial Capital
Goods 4.53Hindustan Construction Company ltd. Construction project 4.47punjab national Bank Banks 3.42CESC ltd. power 3.35Astra Microwave products ltd.
Telecom - Equipment & Accessories 2.98
Dynamatic Technologies ltd. Auto Ancillaries 2.92Total of Top Ten Holdings 51.18Total Equity & Equity related Holdings 100.15Cash, Cash Equivalents and net Current Assets -0.15
grand Total 100.00
For complete portfolio, please visit www.hdfcfund.com
portfolio - Top 10 Holdings
0.42
0.77
1.02
1.15
1.53
2.24
2.24
2.92
2.98
4.53
4.90
12.21
16.69
18.70
27.85
0 5 10 15 20 25 30
Hotels, Resorts & Other Recreational Activities
Transportation
Cement
Petroleum Products
Non - Ferrous Metals
Ferrous Metals
Consumer Non Durables
Auto Ancillaries
Telecom - Equipment & Accessories
Power
Auto
Construction
Industrial Capital Goods
Construction Project
Banks
Industry allocation of Equity Holding (% of Net assets)
Cumulative performanceDate period Nav
per unit (`)
Scheme returns
(%)^
Benchmark returns
(%)#
additional Benchmark
returns (%) ##
value of Investment of Scheme ̀ 10000@
Scheme (`) Benchmark (`)#
additional Benchmark
(`)##Dec 31, 15 last 1 year 15.962 -1.92 3.84 3.01 9,808 10,384 10,301Dec 31, 14 last 2 years 16.374 -2.22 1.53 -0.59 9,561 10,309 9,883Dec 31, 13 last 3 years 9.416 18.47 12.42 9.10 16,626 14,208 12,985Mar 10, 08 Since Inception 10.000 5.22 6.75 6.24 15,655 17,777 17,052
Discrete 12 month returns (%)period Scheme
^Benchmark
#additional Benchmark
##Dec 31, 15 To Dec 30, 16 -1.92 3.84 3.01Dec 31, 14 To Dec 31, 15 -2.52 -0.72 -4.06Dec 31, 13 To Dec 31, 14 73.90 37.82 31.39
^past performance may or may not be sustained in the future. The above returns are for Regular plan - Growth option. Returns greater than 1 year period are compounded annualized (CAGR). # nIFTy 500 Index ## nIFTy 50 Index. @ shows the current value of ` 10,000/- invested at the beginning of a given period. For performance of other schemes managed by prashant Jain & Srinivas Rao Ravuri, please refer page 46.
Face Value per unit: ` 10 unless otherwise specified, + Industry Classification as recommended by AMFI, Data is as of January 31, 2017 unless otherwise specified.

16 January 2017 Intouch mutually
l INvESTMENT OBjECTIvETo generate income through arbitrage opportunities between cash and derivative market and arbitrage opportunities within the derivative segment and by deployment of surplus cash in debt securities and money market instruments.
l FuND MaNagEr ¥
Krishan Kumar Daga (since September 10, 15) Total Experience: over 27 years
l INCEpTION DaTE (Date of allotment)october 23, 2007
Nav Nav pEr uNIT (`)retail planRegular plan - Growth option 19.143Regular plan - Dividend option 14.216Regular plan - quarterly Dividend option 13.605Direct plan - Growth option 19.472Direct plan - quarterly Dividend option 14.754Wholesale planRegular plan - Growth option 19.505Regular plan - Dividend option 10.517Regular plan - Monthly Dividend option 10.888Direct plan - Growth option 12.283Direct plan - Dividend option 10.735Direct plan - Monthly Dividend option 10.490
aSSETS uNDEr MaNagEMENT (`) IN CrOrEAs on January 31, 2017 4,261.25Average for Month of January, 2017 4,268.72
l quaNTITaTIvE DaTaportfolio Turnover Ratio (last 1 year) 367.92%
l TOTal ExpENSE raTIO (Weighted average for the month) €Regular 0.75%Direct 0.25%€ Excluding Service Tax on Management Fees.
l BENCHMarK INDExCRISIl liquid Fund Index
l ENTrY lOaDnot Applicable.
l ExIT lOaDl In respect of each purchase / switch-in of units, an Exit
load of 0.25% is payable if units are redeemed / switched-out within 1 month from the date of allotment.
l no Exit load is payable if units are redeemed / switched-out after 1 month from the date of allotment.
For further details, please refer to para ‘Exit load’ on pg 46.
l plaNS(Wholesale plan) - Regular plan(Wholesale plan) - Direct plan
l OpTIONSunder Each plan : Growth & Dividend. Dividend option offers Monthly Dividend option and normal Dividend option with payout and Reinvestment facility.
l MINIMuM applICaTION aMOuNT (under each plan / Option)purchase / Additional purchase: ` 1 lakh and any amount thereafter.
l rEDEMpTION prOCEEDSnormally despatched within 3-4 Business Days.
For Tax Benefits / Consequences, Please refer to page 46¥ Dedicated Fund Manager for overseas Investments: Mr Rakesh Vyas (Total Experience: over 12 years).
HDFC Arbitrage Fund (An open-ended equity scheme)
This product is suitable for investors who are seeking ~ riskometer
l Income over short term.
l Income through arbitrage opportunities between cash and derivative market and arbitrage opportunities within the derivative segment.
Investors understand that their principal will be at moderately low risk
~ Investors should consult their financial advisers if in doubt about whether the product is suitable for them.
Company Industry+ % to Nav
EquITY & EquITY rElaTED (quantity fully hedged using futures/options)HDFC Bank ltd. Banks 4.12Infosys ltd. Software 4.09Reliance Industries ltd. petroleum products 3.57Sun pharmaceuticals Industries ltd. pharmaceuticals 2.74Tata Steel ltd. Ferrous Metals 2.74Housing Development Finance Corporation ltd.£ Finance 2.62ITC ltd. Consumer non
Durables 2.61Hindalco Industries ltd. non - Ferrous Metals 2.09Maruti Suzuki India ltd. Auto 2.07Adani ports and Special Economic Zone ltd. Transportation 2.05Total of Top Ten Holdings 28.70Total Equity & Equity related Holdings 65.60CD/Cp, Credit ExposureTata Capital Financial Services ltd. ICRA - AA+ 4.74Vedanta ltd. CRISIl - AA- 2.40Deutsche Investments India pvt. ltd. CRISIL - A1+ 2.32l&T Finance ltd. CARE - AA+ 2.01Tata Sons ltd. CRISIl - AAA 1.77Shriram Transport Finance Co. ltd. CRISIL - AA+ 1.18Mahindra & Mahindra Financial Services ltd. CRISIL - A1+ 1.15Au Financiers (India) ltd. FITCH - A1+ 1.11Raymond ltd. CARE - AA 0.80Syndicate Bank CARE - AA- 0.59Total of Top Ten Holdings 18.07Total CD/Cp, Credit Exposure 18.64Short Term Deposits as margin for Futures & options 14.29other Cash, Cash Equivalents and net Current Assets 1.47
grand Total 100.00For complete portfolio, please visit www.hdfcfund.comoutstanding exposure in derivative instruments (` in Crore) 2,803.43
£ Co-sponsor
portfolio - Top 10 Holdings
0.010.070.100.190.190.250.610.710.720.810.861.021.181.23
2.062.092.51
3.083.20
3.805.645.67
6.496.897.45
8.77
0 1 2 3 4 5 6 7 8 9Telecom - ServicesIndustrial Products
ServicesChemicals
Telecom - Equipment & AccessoriesPesticides
Industrial Capital GoodsTextile Products
GasConstruction
Construction ProjectAuto Ancillaries
OilPower
TransportationNon - Ferrous Metals
CementMedia And Entertainment
Ferrous MetalsPetroleum Products
Consumer Non DurablesFinance
AutoPharmaceuticals
SoftwareBanks
Industry allocation of Equity Holding (% of Net assets)
Cumulative performanceDate period Nav
per unit (`)
Scheme returns
(%)^
Benchmark returns
(%)#
additional Benchmark
returns (%) ##
value of Investment of Scheme ̀ 10000@
Scheme (`) Benchmark (`)#
additional Benchmark
(`)##Dec 31, 15 last 1 year 18.232 6.64 7.48 3.01 10,664 10,748 10,301Dec 31, 14 last 2 years 16.944 7.12 7.86 -0.59 11,475 11,633 9,883Dec 31, 13 last 3 years 15.698 7.39 8.31 9.10 12,386 12,705 12,985oct 23, 07 Since Inception 10.000 7.50 7.63 4.47 19,443 19,666 14,955
Discrete 12 month returns (%)period Scheme
^Benchmark
#additional Benchmark
##Dec 31, 15 To Dec 30, 16 6.64 7.48 3.01Dec 31, 14 To Dec 31, 15 7.60 8.23 -4.06Dec 31, 13 To Dec 31, 14 7.94 9.21 31.39
^past performance may or may not be sustained in the future. The above returns are for Regular plan - Growth option. Returns greater than 1 year period are compounded annualized (CAGR). # CRISIl liquid Fund Index ## nIFTy 50 Index. @ shows the current value of ` 10,000/- invested at the beginning of a given period. Scheme performance is not strictly comparable with that of its Additional Benchmark since the scheme does not take directional call in equity markets but is limited to availing arbitrage opportunities, etc. For performance of other schemes managed by Krishan Kumar Daga, please refer page 46.
Face Value per unit: ` 10 unless otherwise specified, + Industry Classification as recommended by AMFI, Data is as of January 31, 2017 unless otherwise specified.
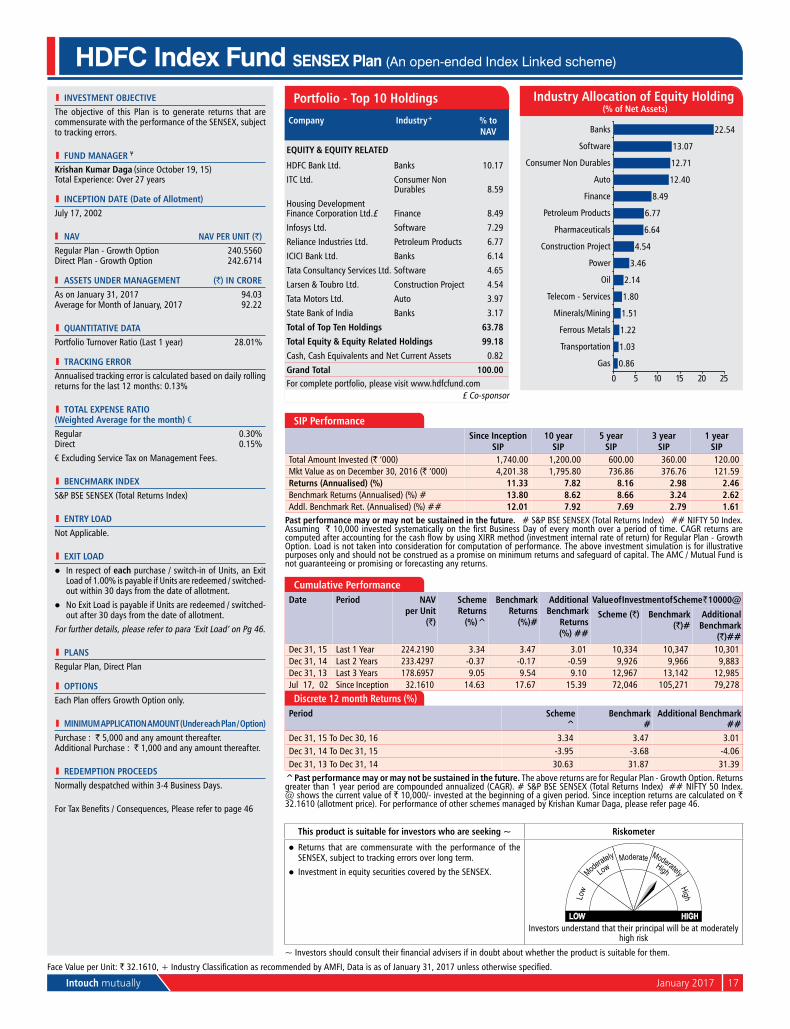
Intouch mutually January 2017 17
l INvESTMENT OBjECTIvEThe objective of this plan is to generate returns that are commensurate with the performance of the SEnSEx, subject to tracking errors.
l FuND MaNagEr ¥
Krishan Kumar Daga (since october 19, 15) Total Experience: over 27 years
l INCEpTION DaTE (Date of allotment)July 17, 2002
Nav Nav pEr uNIT (`)Regular plan - Growth option 240.5560Direct plan - Growth option 242.6714
aSSETS uNDEr MaNagEMENT (`) IN CrOrEAs on January 31, 2017 94.03Average for Month of January, 2017 92.22
l quaNTITaTIvE DaTaportfolio Turnover Ratio (last 1 year) 28.01%
l TraCKINg ErrOrAnnualised tracking error is calculated based on daily rolling returns for the last 12 months: 0.13%
l TOTal ExpENSE raTIO (Weighted average for the month) €Regular 0.30%Direct 0.15%
€ Excluding Service Tax on Management Fees.
l BENCHMarK INDExS&p BSE SEnSEx (Total Returns Index)
l ENTrY lOaDnot Applicable.
l ExIT lOaDl In respect of each purchase / switch-in of units, an Exit
load of 1.00% is payable if units are redeemed / switched-out within 30 days from the date of allotment.
l no Exit load is payable if units are redeemed / switched-out after 30 days from the date of allotment.
For further details, please refer to para ‘Exit load’ on pg 46.
l plaNSRegular plan, Direct plan
l OpTIONSEach plan offers Growth option only.
l MINIMuM applICaTION aMOuNT (under each plan / Option)purchase : ` 5,000 and any amount thereafter.Additional purchase : ` 1,000 and any amount thereafter.
l rEDEMpTION prOCEEDSnormally despatched within 3-4 Business Days.
For Tax Benefits / Consequences, Please refer to page 46
HDFC Index Fund SENSEX Plan (An open-ended Index Linked scheme)
This product is suitable for investors who are seeking ~ riskometer
l Returns that are commensurate with the performance of the SEnSEx, subject to tracking errors over long term.
l Investment in equity securities covered by the SEnSEx.
Investors understand that their principal will be at moderately high risk
~ Investors should consult their financial advisers if in doubt about whether the product is suitable for them.
SIp performanceSince Inception
SIp10 year
SIp5 year
SIp3 year
SIp1 year
SIpTotal Amount Invested (` ‘000) 1,740.00 1,200.00 600.00 360.00 120.00Mkt Value as on December 30, 2016 (` ‘000) 4,201.38 1,795.80 736.86 376.76 121.59returns (annualised) (%) 11.33 7.82 8.16 2.98 2.46Benchmark Returns (Annualised) (%) # 13.80 8.62 8.66 3.24 2.62Addl. Benchmark Ret. (Annualised) (%) ## 12.01 7.92 7.69 2.79 1.61
past performance may or may not be sustained in the future. # S&p BSE SEnSEx (Total Returns Index) ## nIFTy 50 Index. Assuming ` 10,000 invested systematically on the first Business Day of every month over a period of time. CAGR returns are computed after accounting for the cash flow by using XIRR method (investment internal rate of return) for Regular Plan - Growth option. load is not taken into consideration for computation of performance. The above investment simulation is for illustrative purposes only and should not be construed as a promise on minimum returns and safeguard of capital. The AMC / Mutual Fund is not guaranteeing or promising or forecasting any returns.
Company Industry+ % to Nav
EquITY & EquITY rElaTED
HDFC Bank ltd. Banks 10.17
ITC ltd. Consumer non Durables 8.59
Housing Development Finance Corporation ltd.£ Finance 8.49
Infosys ltd. Software 7.29
Reliance Industries ltd. petroleum products 6.77
ICICI Bank ltd. Banks 6.14
Tata Consultancy Services ltd. Software 4.65
larsen & Toubro ltd. Construction project 4.54
Tata Motors ltd. Auto 3.97
State Bank of India Banks 3.17
Total of Top Ten Holdings 63.78
Total Equity & Equity related Holdings 99.18
Cash, Cash Equivalents and net Current Assets 0.82
grand Total 100.00For complete portfolio, please visit www.hdfcfund.com
£ Co-sponsor
portfolio - Top 10 Holdings
0.86
1.03
1.22
1.51
1.80
2.14
3.46
4.54
6.64
6.77
8.49
12.40
12.71
13.07
22.54
0 5 10 15 20 25
Gas
Transportation
Ferrous Metals
Minerals/Mining
Telecom - Services
Oil
Power
Construction Project
Pharmaceuticals
Petroleum Products
Finance
Auto
Consumer Non Durables
Software
Banks
Industry allocation of Equity Holding (% of Net assets)
Cumulative performanceDate period Nav
per unit (`)
Scheme returns
(%)^
Benchmark returns
(%)#
additional Benchmark
returns (%) ##
value of Investment of Scheme ̀ 10000@
Scheme (`) Benchmark (`)#
additional Benchmark
(`)##Dec 31, 15 last 1 year 224.2190 3.34 3.47 3.01 10,334 10,347 10,301Dec 31, 14 last 2 years 233.4297 -0.37 -0.17 -0.59 9,926 9,966 9,883Dec 31, 13 last 3 years 178.6957 9.05 9.54 9.10 12,967 13,142 12,985Jul 17, 02 Since Inception 32.1610 14.63 17.67 15.39 72,046 105,271 79,278
Discrete 12 month returns (%)period Scheme
^Benchmark
#additional Benchmark
##Dec 31, 15 To Dec 30, 16 3.34 3.47 3.01Dec 31, 14 To Dec 31, 15 -3.95 -3.68 -4.06Dec 31, 13 To Dec 31, 14 30.63 31.87 31.39
^past performance may or may not be sustained in the future. The above returns are for Regular plan - Growth option. Returns greater than 1 year period are compounded annualized (CAGR). # S&p BSE SEnSEx (Total Returns Index) ## nIFTy 50 Index. @ shows the current value of ` 10,000/- invested at the beginning of a given period. Since inception returns are calculated on ` 32.1610 (allotment price). For performance of other schemes managed by Krishan Kumar Daga, please refer page 46.
Face Value per unit: ` 32.1610, + Industry Classification as recommended by AMFI, Data is as of January 31, 2017 unless otherwise specified.

18 January 2017 Intouch mutually
l INvESTMENT OBjECTIvEThe objective of this plan is to generate returns that are commensurate with the performance of the nIFTy, subject to tracking errors.
l FuND MaNagEr ¥
Krishan Kumar Daga (since october 19, 15) Total Experience: over 27 years
l INCEpTION DaTE (Date of allotment)July 17, 2002
Nav Nav pEr uNIT (`)Regular plan - Growth option 76.1245Direct plan - Growth option 76.6569
aSSETS uNDEr MaNagEMENT (`) IN CrOrEAs on January 31, 2017 185.22Average for Month of January, 2017 197.38
l quaNTITaTIvE DaTaportfolio Turnover Ratio (last 1 year) 27.37%
l TraCKINg ErrOrAnnualised tracking error is calculated based on daily rolling returns for the last 12 months: 0.10%
l TOTal ExpENSE raTIO (Weighted average for the month) €Regular 0.50%Direct 0.35%
€ Excluding Service Tax on Management Fees.
l BENCHMarK INDExnIFTy 50 Index (Total Returns Index)
l ENTrY lOaDnot Applicable.
l ExIT lOaDl In respect of each purchase / switch-in of units, an Exit
load of 1.00% is payable if units are redeemed / switched-out within 3 months from the date of allotment.
l no Exit load is payable if units are redeemed / switched-out after 3 months from the date of allotment.
For further details, please refer to para ‘Exit load’ on pg 46.
l plaNSRegular plan, Direct plan
l OpTIONSEach plan offers Growth option only.
l MINIMuM applICaTION aMOuNT (under each plan / Option)purchase : ` 5,000 and any amount thereafter.Additional purchase : ` 1,000 and any amount thereafter.
l rEDEMpTION prOCEEDSnormally despatched within 3-4 Business Days.
For Tax Benefits / Consequences, Please refer to page 46
HDFC Index Fund NIFTY Plan (An open-ended Index Linked scheme)
This product is suitable for investors who are seeking ~ riskometer
l Returns that are commensurate with the performance of the nIFTy, subject to tracking errors over long term.
l Investment in equity securities covered by the nIFTy.
Investors understand that their principal will be at moderately high risk
~ Investors should consult their financial advisers if in doubt about whether the product is suitable for them.
SIp performanceSince Inception
SIp10 year
SIp5 year
SIp3 year
SIp1 year
SIpTotal Amount Invested (` ‘000) 1,740.00 1,200.00 600.00 360.00 120.00Mkt Value as on December 30, 2016 (` ‘000) 4,154.91 1,808.83 743.84 380.52 121.51returns (annualised) (%) 11.19 7.96 8.53 3.64 2.35Benchmark Returns (Annualised) (%) # 13.57 9.21 9.04 4.06 2.95Addl. Benchmark Ret. (Annualised) (%) ## 12.05 7.46 6.99 1.73 1.18
past performance may or may not be sustained in the future. # nIFTy 50 Index (Total Returns Index) ## S&p BSE SEnSEx. Assuming ` 10,000 invested systematically on the first Business Day of every month over a period of time. CAGR returns are computed after accounting for the cash flow by using XIRR method (investment internal rate of return) for Regular Plan - Growth option. load is not taken into consideration for computation of performance. The above investment simulation is for illustrative purposes only and should not be construed as a promise on minimum returns and safeguard of capital. The AMC / Mutual Fund is not guaranteeing or promising or forecasting any returns.
Company Industry+ % to Nav
EquITY & EquITY rElaTEDHDFC Bank ltd. Banks 8.26ITC ltd. Consumer non
Durables 6.97Housing Development Finance Corporation ltd.£ Finance 6.90Infosys ltd. Software 5.91Reliance Industries ltd. petroleum products 5.51ICICI Bank ltd. Banks 4.99Tata Consultancy Services ltd. Software 3.78larsen & Toubro ltd. Construction project 3.78Tata Motors ltd. Auto 3.23Kotak Mahindra Bank ltd. Banks 2.95Total of Top Ten Holdings 52.28Total Equity & Equity related Holdings 100.46Cash, Cash Equivalents and net Current Assets -0.46
grand Total 100.00For complete portfolio, please visit www.hdfcfund.com
£ Co-sponsor
portfolio - Top 10 Holdings
0.400.500.640.700.780.790.850.991.241.741.903.153.273.78
6.016.646.90
10.3111.6112.99
25.27
0 5 10 15 20 25 30Industrial Capital Goods
Telecom - Equipment & AccessoriesAuto Ancillaries
GasNon - Ferrous Metals
TransportationMedia And Entertainment
Ferrous MetalsMinerals/Mining
OilTelecom - Services
CementPower
Construction ProjectPharmaceuticals
Petroleum ProductsFinance
Consumer Non DurablesAuto
SoftwareBanks
Industry allocation of Equity Holding (% of Net assets)
Cumulative performanceDate period Nav
per unit (`)
Scheme returns
(%)^
Benchmark returns
(%)#
additional Benchmark
returns (%) ##
value of Investment of Scheme ̀ 10000@
Scheme (`) Benchmark (`)#
additional Benchmark
(`)##Dec 31, 15 last 1 year 70.1722 3.81 4.39 1.95 10,381 10,439 10,195Dec 31, 14 last 2 years 72.4060 0.30 0.62 -1.60 10,061 10,125 9,683Dec 31, 13 last 3 years 54.7785 9.97 10.40 7.94 13,299 13,456 12,577Jul 17, 02 Since Inception 10.3260 14.46 17.05 15.73 70,548 97,496 82,792
Discrete 12 month returns (%)period Scheme
^Benchmark
#additional Benchmark
##Dec 31, 15 To Dec 30, 16 3.81 4.39 1.95Dec 31, 14 To Dec 31, 15 -3.09 -3.01 -5.03Dec 31, 13 To Dec 31, 14 32.18 32.90 29.89
^past performance may or may not be sustained in the future. The above returns are for Regular plan - Growth option. Returns greater than 1 year period are compounded annualized (CAGR). # nIFTy 50 Index (Total Returns Index). ## S&p BSE SEnSEx. @ shows the current value of ` 10,000/- invested at the beginning of a given period. Since inception returns are calculated on ` 10.3260 (allotment price). For performance of other schemes managed by Krishan Kumar Daga, please refer page 46.
Face Value per unit: ` 10.3260, + Industry Classification as recommended by AMFI, Data is as of January 31, 2017 unless otherwise specified.
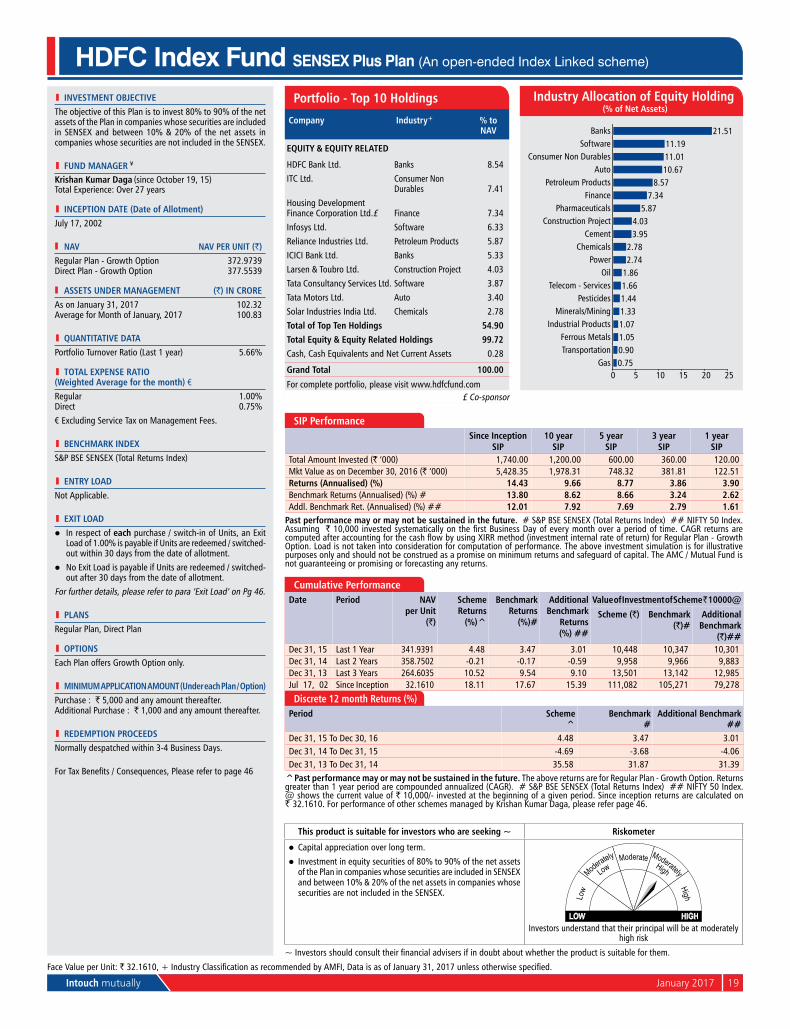
Intouch mutually January 2017 19
l INvESTMENT OBjECTIvEThe objective of this plan is to invest 80% to 90% of the net assets of the plan in companies whose securities are included in SEnSEx and between 10% & 20% of the net assets in companies whose securities are not included in the SEnSEx.
l FuND MaNagEr ¥
Krishan Kumar Daga (since october 19, 15) Total Experience: over 27 years
l INCEpTION DaTE (Date of allotment)July 17, 2002
Nav Nav pEr uNIT (`)Regular plan - Growth option 372.9739Direct plan - Growth option 377.5539
aSSETS uNDEr MaNagEMENT (`) IN CrOrEAs on January 31, 2017 102.32Average for Month of January, 2017 100.83
l quaNTITaTIvE DaTaportfolio Turnover Ratio (last 1 year) 5.66%
l TOTal ExpENSE raTIO (Weighted average for the month) €Regular 1.00%Direct 0.75%
€ Excluding Service Tax on Management Fees.
l BENCHMarK INDExS&p BSE SEnSEx (Total Returns Index)
l ENTrY lOaDnot Applicable.
l ExIT lOaDl In respect of each purchase / switch-in of units, an Exit
load of 1.00% is payable if units are redeemed / switched-out within 30 days from the date of allotment.
l no Exit load is payable if units are redeemed / switched-out after 30 days from the date of allotment.
For further details, please refer to para ‘Exit load’ on pg 46.
l plaNSRegular plan, Direct plan
l OpTIONSEach plan offers Growth option only.
l MINIMuM applICaTION aMOuNT (under each plan / Option)purchase : ` 5,000 and any amount thereafter.Additional purchase : ` 1,000 and any amount thereafter.
l rEDEMpTION prOCEEDSnormally despatched within 3-4 Business Days.
For Tax Benefits / Consequences, Please refer to page 46
HDFC Index Fund SENSEX Plus Plan (An open-ended Index Linked scheme)
This product is suitable for investors who are seeking ~ riskometer
l Capital appreciation over long term.
l Investment in equity securities of 80% to 90% of the net assets of the plan in companies whose securities are included in SEnSEx and between 10% & 20% of the net assets in companies whose securities are not included in the SEnSEx.
Investors understand that their principal will be at moderately high risk
~ Investors should consult their financial advisers if in doubt about whether the product is suitable for them.
Cumulative performanceDate period Nav
per unit (`)
Scheme returns
(%)^
Benchmark returns
(%)#
additional Benchmark
returns (%) ##
value of Investment of Scheme ̀ 10000@
Scheme (`) Benchmark (`)#
additional Benchmark
(`)##Dec 31, 15 last 1 year 341.9391 4.48 3.47 3.01 10,448 10,347 10,301Dec 31, 14 last 2 years 358.7502 -0.21 -0.17 -0.59 9,958 9,966 9,883Dec 31, 13 last 3 years 264.6035 10.52 9.54 9.10 13,501 13,142 12,985Jul 17, 02 Since Inception 32.1610 18.11 17.67 15.39 111,082 105,271 79,278
Discrete 12 month returns (%)period Scheme
^Benchmark
#additional Benchmark
##Dec 31, 15 To Dec 30, 16 4.48 3.47 3.01Dec 31, 14 To Dec 31, 15 -4.69 -3.68 -4.06Dec 31, 13 To Dec 31, 14 35.58 31.87 31.39
^past performance may or may not be sustained in the future. The above returns are for Regular plan - Growth option. Returns greater than 1 year period are compounded annualized (CAGR). # S&p BSE SEnSEx (Total Returns Index) ## nIFTy 50 Index. @ shows the current value of ` 10,000/- invested at the beginning of a given period. Since inception returns are calculated on ` 32.1610. For performance of other schemes managed by Krishan Kumar Daga, please refer page 46.
SIp performanceSince Inception
SIp10 year
SIp5 year
SIp3 year
SIp1 year
SIpTotal Amount Invested (` ‘000) 1,740.00 1,200.00 600.00 360.00 120.00Mkt Value as on December 30, 2016 (` ‘000) 5,428.35 1,978.31 748.32 381.81 122.51returns (annualised) (%) 14.43 9.66 8.77 3.86 3.90Benchmark Returns (Annualised) (%) # 13.80 8.62 8.66 3.24 2.62Addl. Benchmark Ret. (Annualised) (%) ## 12.01 7.92 7.69 2.79 1.61
past performance may or may not be sustained in the future. # S&p BSE SEnSEx (Total Returns Index) ## nIFTy 50 Index. Assuming ` 10,000 invested systematically on the first Business Day of every month over a period of time. CAGR returns are computed after accounting for the cash flow by using XIRR method (investment internal rate of return) for Regular Plan - Growth option. load is not taken into consideration for computation of performance. The above investment simulation is for illustrative purposes only and should not be construed as a promise on minimum returns and safeguard of capital. The AMC / Mutual Fund is not guaranteeing or promising or forecasting any returns.
Company Industry+ % to Nav
EquITY & EquITY rElaTED
HDFC Bank ltd. Banks 8.54
ITC ltd. Consumer non Durables 7.41
Housing Development Finance Corporation ltd.£ Finance 7.34
Infosys ltd. Software 6.33
Reliance Industries ltd. petroleum products 5.87
ICICI Bank ltd. Banks 5.33
larsen & Toubro ltd. Construction project 4.03
Tata Consultancy Services ltd. Software 3.87
Tata Motors ltd. Auto 3.40
Solar Industries India ltd. Chemicals 2.78
Total of Top Ten Holdings 54.90Total Equity & Equity related Holdings 99.72Cash, Cash Equivalents and net Current Assets 0.28
grand Total 100.00
For complete portfolio, please visit www.hdfcfund.com£ Co-sponsor
portfolio - Top 10 Holdings
0.750.901.051.071.331.441.661.862.742.78
3.954.03
5.877.34
8.5710.6711.0111.19
21.51
0 5 10 15 20 25Gas
TransportationFerrous Metals
Industrial ProductsMinerals/Mining
PesticidesTelecom - Services
OilPower
ChemicalsCement
Construction ProjectPharmaceuticals
FinancePetroleum Products
AutoConsumer Non Durables
SoftwareBanks
Industry allocation of Equity Holding (% of Net assets)
Face Value per unit: ` 32.1610, + Industry Classification as recommended by AMFI, Data is as of January 31, 2017 unless otherwise specified.
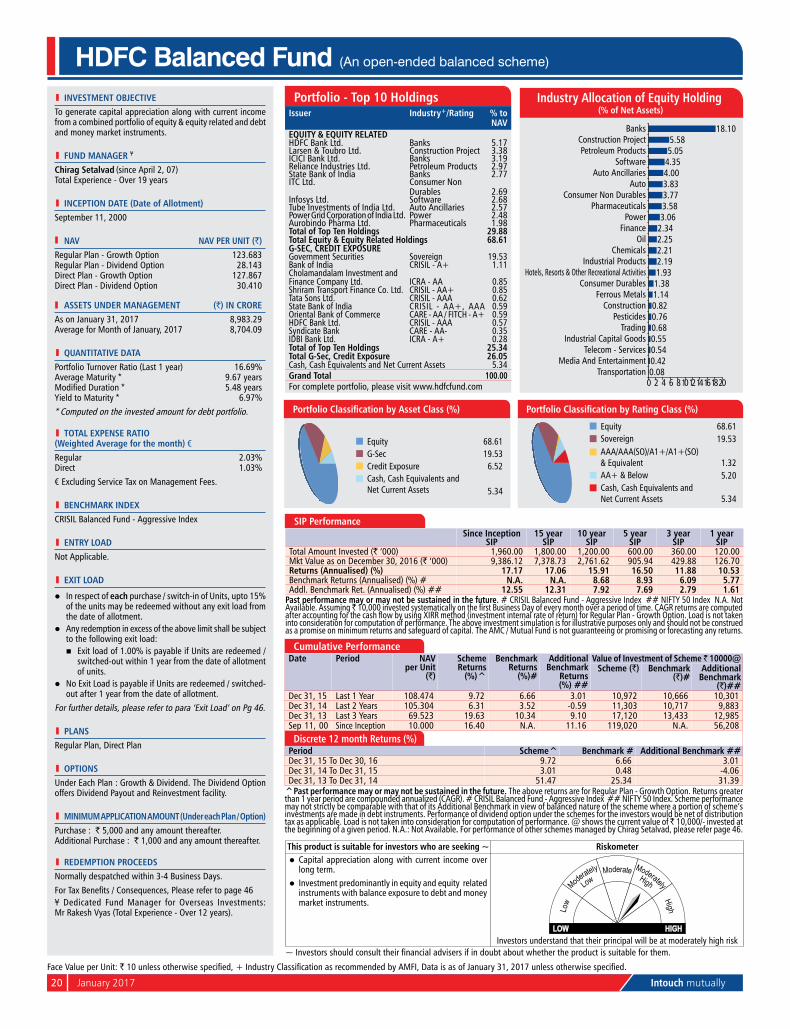
20 January 2017 Intouch mutually
HDFC Balanced Fund (An open-ended balanced scheme)
portfolio - Top 10 HoldingsIssuer Industry+/rating % to
NavEquITY & EquITY rElaTEDHDFC Bank ltd. Banks 5.17larsen & Toubro ltd. Construction project 3.38ICICI Bank ltd. Banks 3.19Reliance Industries ltd. petroleum products 2.97State Bank of India Banks 2.77ITC ltd. Consumer non
Durables 2.69Infosys ltd. Software 2.68Tube Investments of India ltd. Auto Ancillaries 2.57power Grid Corporation of India ltd. power 2.48Aurobindo pharma ltd. pharmaceuticals 1.98Total of Top Ten Holdings 29.88Total Equity & Equity related Holdings 68.61g-SEC, CrEDIT ExpOSurEGovernment Securities Sovereign 19.53Bank of India CRISIL - A+ 1.11Cholamandalam Investment and Finance Company ltd. ICRA - AA 0.85Shriram Transport Finance Co. ltd. CRISIL - AA+ 0.85Tata Sons ltd. CRISIl - AAA 0.62State Bank of India CRISIL - AA+, AAA 0.59oriental Bank of Commerce CARE - AA / FITCH - A+ 0.59HDFC Bank ltd. CRISIl - AAA 0.57Syndicate Bank CARE - AA- 0.35IDBI Bank ltd. ICRA - A+ 0.28Total of Top Ten Holdings 25.34Total g-Sec, Credit Exposure 26.05Cash, Cash Equivalents and net Current Assets 5.34grand Total 100.00For complete portfolio, please visit www.hdfcfund.com
This product is suitable for investors who are seeking ~ riskometerl Capital appreciation along with current income over
long term.l Investment predominantly in equity and equity related
instruments with balance exposure to debt and money market instruments.
Investors understand that their principal will be at moderately high risk~ Investors should consult their financial advisers if in doubt about whether the product is suitable for them.
Industry allocation of Equity Holding (% of Net assets)
0.080.420.540.550.680.760.821.141.381.932.192.212.252.343.063.583.773.834.004.355.055.58
18.10
0 2 4 6 8101214161820Transportation
Media And EntertainmentTelecom - Services
Industrial Capital GoodsTrading
PesticidesConstruction
Ferrous MetalsConsumer Durables
Hotels, Resorts & Other Recreational ActivitiesIndustrial Products
ChemicalsOil
FinancePower
PharmaceuticalsConsumer Non Durables
AutoAuto Ancillaries
SoftwarePetroleum Products
Construction ProjectBanks
Equity 68.61G-Sec 19.53Credit Exposure 6.52Cash, Cash Equivalents and net Current Assets 5.34
Equity 68.61Sovereign 19.53AAA/AAA(SO)/A1+/A1+(SO) & Equivalent 1.32AA+ & Below 5.20Cash, Cash Equivalents and net Current Assets 5.34
Portfolio Classification by Asset Class (%) Portfolio Classification by Rating Class (%)
SIp performanceSince Inception
SIp15 year
SIp10 year
SIp5 year
SIp3 year
SIp1 year
SIpTotal Amount Invested (` ‘000) 1,960.00 1,800.00 1,200.00 600.00 360.00 120.00 Mkt Value as on December 30, 2016 (` ‘000) 9,386.12 7,378.73 2,761.62 905.94 429.88 126.70 returns (annualised) (%) 17.17 17.06 15.91 16.50 11.88 10.53Benchmark Returns (Annualised) (%) # N.a. N.a. 8.68 8.93 6.09 5.77Addl. Benchmark Ret. (Annualised) (%) ## 12.55 12.31 7.92 7.69 2.79 1.61
past performance may or may not be sustained in the future. # CRISIl Balanced Fund - Aggressive Index ## nIFTy 50 Index n.A. not Available. Assuming ̀ 10,000 invested systematically on the first Business Day of every month over a period of time. CAGR returns are computed after accounting for the cash flow by using XIRR method (investment internal rate of return) for Regular Plan - Growth Option. Load is not taken into consideration for computation of performance. The above investment simulation is for illustrative purposes only and should not be construed as a promise on minimum returns and safeguard of capital. The AMC / Mutual Fund is not guaranteeing or promising or forecasting any returns.
l INvESTMENT OBjECTIvETo generate capital appreciation along with current income from a combined portfolio of equity & equity related and debt and money market instruments.
l FuND MaNagEr ¥
Chirag Setalvad (since April 2, 07) Total Experience - over 19 years
l INCEpTION DaTE (Date of allotment)September 11, 2000
Nav Nav pEr uNIT (`)Regular plan - Growth option 123.683Regular plan - Dividend option 28.143Direct plan - Growth option 127.867Direct plan - Dividend option 30.410
aSSETS uNDEr MaNagEMENT (`) IN CrOrEAs on January 31, 2017 8,983.29Average for Month of January, 2017 8,704.09
l quaNTITaTIvE DaTaportfolio Turnover Ratio (last 1 year) 16.69%Average Maturity * 9.67 yearsModified Duration * 5.48 yearsyield to Maturity * 6.97%* Computed on the invested amount for debt portfolio.
l TOTal ExpENSE raTIO (Weighted average for the month) €Regular 2.03%Direct 1.03%
€ Excluding Service Tax on Management Fees.
l BENCHMarK INDExCRISIl Balanced Fund - Aggressive Index
l ENTrY lOaDnot Applicable.
l ExIT lOaD
l In respect of each purchase / switch-in of units, upto 15% of the units may be redeemed without any exit load from the date of allotment.
l Any redemption in excess of the above limit shall be subject to the following exit load:
n Exit load of 1.00% is payable if units are redeemed / switched-out within 1 year from the date of allotment of units.
l no Exit load is payable if units are redeemed / switched-out after 1 year from the date of allotment.
For further details, please refer to para ‘Exit load’ on pg 46.
l plaNSRegular plan, Direct plan
l OpTIONSunder Each plan : Growth & Dividend. The Dividend option offers Dividend payout and Reinvestment facility.
l MINIMuM applICaTION aMOuNT (under each plan / Option)purchase : ` 5,000 and any amount thereafter.Additional purchase : ` 1,000 and any amount thereafter.
l rEDEMpTION prOCEEDSnormally despatched within 3-4 Business Days.
For Tax Benefits / Consequences, Please refer to page 46¥ Dedicated Fund Manager for overseas Investments: Mr Rakesh Vyas (Total Experience - over 12 years).
Cumulative performanceDate period Nav
per unit (`)
Scheme returns
(%)^
Benchmark returns
(%)#
additional Benchmark
returns (%) ##
value of Investment of Scheme ̀ 10000@Scheme (`) Benchmark
(`)#additional
Benchmark (`)##
Dec 31, 15 last 1 year 108.474 9.72 6.66 3.01 10,972 10,666 10,301Dec 31, 14 last 2 years 105.304 6.31 3.52 -0.59 11,303 10,717 9,883Dec 31, 13 last 3 years 69.523 19.63 10.34 9.10 17,120 13,433 12,985Sep 11, 00 Since Inception 10.000 16.40 n.A. 11.16 119,020 n.A. 56,208
Discrete 12 month returns (%)period Scheme^ Benchmark # additional Benchmark ##Dec 31, 15 To Dec 30, 16 9.72 6.66 3.01Dec 31, 14 To Dec 31, 15 3.01 0.48 -4.06Dec 31, 13 To Dec 31, 14 51.47 25.34 31.39
^past performance may or may not be sustained in the future. The above returns are for Regular plan - Growth option. Returns greater than 1 year period are compounded annualized (CAGR). # CRISIl Balanced Fund - Aggressive Index ## nIFTy 50 Index. Scheme performance may not strictly be comparable with that of its Additional Benchmark in view of balanced nature of the scheme where a portion of scheme’s investments are made in debt instruments. performance of dividend option under the schemes for the investors would be net of distribution tax as applicable. load is not taken into consideration for computation of performance. @ shows the current value of ̀ 10,000/- invested at the beginning of a given period. n.A.: not Available. For performance of other schemes managed by Chirag Setalvad, please refer page 46.
Face Value per unit: ` 10 unless otherwise specified, + Industry Classification as recommended by AMFI, Data is as of January 31, 2017 unless otherwise specified.

Intouch mutually January 2017 21
l INvESTMENT OBjECTIvETo provide periodic returns and capital appreciation over a long period of time, from a judicious mix of equity and debt investments, with the aim to prevent / minimise any capital erosion. under normal circumstances, it is envisaged that the debt : equity mix would vary between 25:75 and 40:60 respectively. This mix may achieve the investment objective, may result in regular income, capital appreciation and may also prevent capital erosion.
l FuND MaNagEr § ¥
prashant jain (since June 19, 03) Total Experience: over 25 years
l INCEpTION DaTE (Date of allotment)February 1, 1994
Nav Nav pEr uNIT (`)Regular plan - Growth option 429.729Regular plan - Dividend option 29.781Direct plan - Growth option 442.145Direct plan - Dividend option 34.159
aSSETS uNDEr MaNagEMENT (`) IN CrOrEAs on January 31, 2017 16,468.57Average for Month of January, 2017 15,925.77
l quaNTITaTIvE DaTaportfolio Turnover Ratio (last 1 year) 64.63%Average Maturity * 11.93 yearsModified Duration * 6.07 yearsyield to Maturity * 7.90%* Computed on the invested amount for debt portfolio.
l TOTal ExpENSE raTIO (Weighted average for the month) €Regular 2.26%Direct 1.03%€ Excluding Service Tax on Management Fees.
l BENCHMarK INDExCRISIl Balanced Fund - Aggressive Index
l ENTrY lOaDnot Applicable.
l ExIT lOaDl In respect of each purchase / switch-in of units, upto 15%
of the units may be redeemed without any exit load from the date of allotment.
l Any redemption in excess of the above limit shall be subject to the following exit load:
n Exit load of 1.00% is payable if units are redeemed / switched-out within 1 year from the date of allotment of units.
l no Exit load is payable if units are redeemed / switched-out after 1 year from the date of allotment..
For further details, please refer to para ‘Exit load’ on pg 46.
l plaNSRegular plan, Direct plan
l OpTIONSunder Each plan : Growth & Dividend. The Dividend option offers Dividend payout and Reinvestment facility.
l MINIMuM applICaTION aMOuNT (under each plan / Option)purchase : ` 5,000 and any amount thereafter.Additional purchase : ` 1,000 and any amount thereafter.
l rEDEMpTION prOCEEDSnormally despatched within 3-4 Business Days.For Tax Benefits / Consequences, Please refer to page 46§ Date of migration from Zurich India Mutual Fund (Close of business hours - June 19, 03¥ Dedicated Fund Manager for overseas Investments: Mr Rakesh Vyas (Total Experience - over 12 years).
HDFC Prudence Fund (An open-ended balanced scheme)
This product is suitable for investors who are seeking ~ riskometerl periodic income with capital appreciation and
prevention of capital erosion over long term.
l Investment predominantly in equity and equity related instruments with balance exposure to debt and money market instruments.
Investors understand that their principal will be at moderately high risk~ Investors should consult their financial advisers if in doubt about whether the product is suitable for them.
SIp performanceSince Inception
SIp15 year
SIp10 year
SIp5 year
SIp3 year
SIp1 year
SIpTotal Amount Invested (` ‘000) 2,750.00 1,800.00 1,200.00 600.00 360.00 120.00 Mkt Value as on December 30, 2016 (` ‘000) $$ 45,322.83 8,798.99 2,578.36 871.73 423.06 128.71 returns (annualised) (%) $$ 20.41 19.06 14.63 14.93 10.78 13.76Benchmark Returns (Annualised) (%) # N.a. N.a. 8.68 8.93 6.09 5.77Addl. Benchmark Ret. (Annualised) (%) ## 11.31 12.31 7.92 7.69 2.79 1.61
past performance may or may not be sustained in the future. # CRISIl Balanced Fund - Aggressive Index ## nIFTy 50 Index. n.A. not Available. Assuming ` 10,000 invested systematically on the first Business Day of every month over a period of time. CAGR returns are computed after accounting for the cash flow by using XIRR method (investment internal rate of return) for Regular Plan-Growth Option. Load is not taken into consideration for computation of performance. The above investment simulation is for illustrative purposes only and should not be construed as a promise on minimum returns and safeguard of capital. The AMC/Mutual Fund is not guaranteeing or promising or forecasting any returns.
portfolio - Top 10 HoldingsIssuer Industry+/rating % to NavEquITY & EquITY rElaTEDState Bank of India Banks 6.86larsen & Toubro ltd. Construction project 6.74ICICI Bank ltd. Banks 6.39Infosys ltd. Software 4.38Tata Steel ltd. Ferrous Metals 3.41Maruti Suzuki India ltd. Auto 2.04Aarti Industries ltd. Chemicals 1.75Bank of Baroda Banks 1.46Adani ports and Special Economic Zone ltd. Transportation 1.41power Grid Corporation of India ltd. power 1.33Total of Top Ten Holdings 35.77INvESTMENT IN aDr/gDr/FOrEIgN SECurITIESCognizant Technology Solutions Corp Software 0.22Total Equity & Equity related Holdings 73.92g-SEC, CrEDIT ExpOSurEGovernment Securities Sovereign 9.87State Bank of India CRISIL - AAA / AA+ 3.17Canara Bank FITCH - AA 2.25union Bank of India FITCH - AA 1.84IDBI Bank ltd. CRISIL - A / ICRA-A+ 1.37Axis Bank ltd. CRISIl - AA 0.91Syndicate Bank CARE - AA- 0.80HDFC Bank ltd. CRISIl - AAA 0.78Bank of India CRISIL - A+ 0.48Andhra Bank CARE - AA- 0.13Total of Top Ten Holdings 21.60Total g-Sec, Credit Exposure 21.96Short Term Deposits as margin for Futures & options 0.10other Cash, Cash Equivalents and net Current Assets 4.02grand Total 100.00For complete portfolio, please visit www.hdfcfund.comInvestment in Foreign Securities (` in Crore) 36.39
Equity 73.92G-Sec 9.87Credit Exposure 12.09Cash, Cash Equivalents and net Current Assets 4.12
Portfolio Classification by Asset Class (%)
Industry allocation of Equity Holding (% of Net assets)
0.040.080.150.280.320.500.710.720.930.971.311.311.331.581.611.872.052.142.212.38
4.154.244.294.38
7.257.71
19.41
0 5 10 15 20Textile Products
GasTextiles - SyntheticTelecom - Services
Telecom - Equipment & AccessoriesConsumer Non Durables
Industrial ProductsCommercial Services
ConstructionMedia And Entertainment
OilCementFinance
PesticidesTransportation
Consumer DurablesPharmaceuticals
ChemicalsAuto Ancillaries
Petroleum ProductsFerrous Metals
Industrial Capital GoodsPower
AutoSoftware
Construction ProjectBanks
Face Value per unit: ` 10 unless otherwise specified, + Industry Classification as recommended by AMFI, Data is as of January 31, 2017 unless otherwise specified.
Equity 73.92Sovereign 9.87AAA/AAA(SO)/A1+/A1+(SO) & Equivalent 0.92AA+ & Below 11.17Cash, Cash Equivalents and net Current Assets 4.12
Portfolio Classification by Rating Class (%)
Cumulative performanceDate period Nav
per unit (`)
Scheme returns
(%)^$$
Benchmark returns
(%)#
additional Benchmark
returns (%) ##
value of Investment of Scheme ̀ 10000@Scheme (`)
$$Benchmark
(`)#additional
Benchmark (`)##
Dec 31, 15 last 1 year 374.380 9.43 6.66 3.01 10,943 10,666 10,301Dec 31, 14 last 2 years 373.297 4.76 3.52 -0.59 10,975 10,717 9,883Dec 31, 13 last 3 years 245.973 18.54 10.34 9.10 16,656 13,433 12,985Feb 01, 94 Since Inception 10.000 18.90 n.A. 8.62 529,523 n.A. 66,555
Discrete 12 month returns (%)period Scheme^$$ Benchmark # additional Benchmark ##Dec 31, 15 To Dec 30, 16 9.43 6.66 3.01Dec 31, 14 To Dec 31, 15 0.29 0.48 -4.06Dec 31, 13 To Dec 31, 14 51.76 25.34 31.39
^past performance may or may not be sustained in the future. The above returns are for Regular plan-Growth option. Returns greater than 1 year period are compounded annualized (CAGR). Scheme performance may not strictly be comparable with that of its Additional Benchmark in view of balanced nature of the scheme where a portion of scheme’s investments are made in debt instruments. # CRISIl Balanced Fund - Aggressive Index ## nIFTy 50 Index. @ shows the current value of ` 10,000/- invested at the beginning of a given period. $$ All dividends declared prior to the splitting of the Scheme into Dividend & Growth options are assumed to be reinvested in the units of the Scheme at the then prevailing nAV (ex-dividend nAV). n.A.: not Available. For performance of other schemes managed by prashant Jain, please refer page 46.

22 January 2017 Intouch mutually
l INvESTMENT OBjECTIvETo generate long term capital appreciation.
l FuND MaNagEr ¥
Chirag Setalvad (since April 2, 07) Total Experience - over 19 years
l INCEpTION DaTE (Date of allotment)March 2, 2001
Nav Nav pEr uNIT (`)Regular plan 93.583Direct plan 96.344
aSSETS uNDEr MaNagEMENT (`) IN CrOrEAs on January 31, 2017 1,315.21Average for Month of January, 2017 1,285.11
l quaNTITaTIvE DaTaportfolio Turnover Ratio (last 1 year) 3.03%Average Maturity * 8.42 yearsModified Duration * 4.84 yearsyield to Maturity * 6.99%* Computed on the invested amount for debt portfolio.
l TOTal ExpENSE raTIO (Weighted average for the month) €Regular 2.19%Direct 1.20%€ Excluding Service Tax on Management Fees.
l BENCHMarK INDExCRISIl Balanced Fund - Aggressive Index
l ENTrY lOaDnot Applicable.
l ExIT lOaDl For units subject to lock-in period: nIll For units not subject to lock-in period: n 3.00% if the units are redeemed / switched-out within
one year from the date of allotment; n 2.00% if the units are redeemed / switched-out between
the first and second year from the date of allotment; n 1.00% if the units are redeemed / switched-out between
the second and third year from the date of allotment; n nil if the units are redeemed / switched-out after third
year from the date of allotment.For further details, please refer to para ‘Exit load’ on pg 46.
l plaNSRegular plan, Direct plan
l OpTIONSnil
l MINIMuM applICaTION aMOuNT (under each plan / Option)purchase : ` 5,000 and any amount thereafter.Additional purchase : ` 1,000 and any amount thereafter.
l rEDEMpTION prOCEEDSnormally despatched within 3-4 Business Days (Redemption is subject to completion of lock-in period, if opted).
l lOCK-IN pErIODIf opted : Until the Unit holder (being the beneficiary child) attains the age of 18 years or until completion of 3 years from the date of allotment which ever is later.
For Tax Benefits / Consequences, Please refer to page 46¥ Dedicated Fund Manager for overseas Investments:
Mr Rakesh Vyas (Total Experience - over 12 years).Ω Eligibility (of Unit holder) : Children less than 18 years of
age as on the date of investment by the Investor / Applicant are eligible as unit holders in the Scheme.
π Personal Accident Insurance Cover for Parent / Legal Guardian (upto the age of 80 years) of the unit holder, equivalent to 10 times the cost value of the outstanding units held by the unit holder under all the applications / account statements / folios, subject to a maximum amount of ` 10 lakhs per unit holder. The insurance premium in respect of the personal accident insurance cover will be borne by the AMC. This accident insurance cover is subject to conditions of the group personal accident insurance policy.
HDFC Children’s Gift Fund Investment Plan (An open-ended balanced scheme) Ω π
This product is suitable for investors who are seeking ~ riskometerl Capital appreciation over long term.
l Investment in equity and equity related instruments as well as debt and money market instruments.
Investors understand that their principal will be at moderately high risk~ Investors should consult their financial advisers if in doubt about whether the product is suitable for them.
SIp performanceSince Inception
SIp15 year
SIp10 year
SIp5 Year
SIp3 Year
SIp1 Year
SIpTotal Amount Invested (` ‘000) 1,900.00 1,800.00 1,200.00 600.00 360.00 120.00 Mkt Value as on December 30, 2016 (` ‘000) $ 8,019.35 6,846.77 2,709.75 869.37 415.34 124.50 returns (annualised) (%) $ 16.41 16.20 15.55 14.82 9.52 7.05Benchmark Returns (Annualised) (%) # N.a. N.a. 8.68 8.93 6.09 5.77Addl. Benchmark Ret. (Annualised) (%) ## 12.61 12.31 7.92 7.69 2.79 1.61
past performance may or may not be sustained in the future. # CRISIl Balanced Fund - Aggressive Index ## nIFTy 50 Index. n.A. not Available. Assuming ` 10,000 invested systematically on the first Business Day of every month over a period of time. CAGR returns are computed after accounting for the cash flow by using XIRR method (investment internal rate of return) for Regular Plan-Growth Option. Load is not taken into consideration for computation of performance. The above investment simulation is for illustrative purposes only and should not be construed as a promise on minimum returns and safeguard of capital. The AMC/Mutual Fund is not guaranteeing or promising or forecasting any returns.
Cumulative performanceDate period Nav
per unit (`)
Scheme returns (%)^$
Benchmark returns
(%)#
additional Benchmark
returns (%) ##
value of Investment of Scheme ̀ 10000@Scheme (`)
$Benchmark
(`)#additional
Benchmark (`)##
Dec 31, 15 last 1 year 83.752 7.70 6.66 3.01 10,770 10,666 10,301Dec 31, 14 last 2 years 81.757 5.04 3.52 -0.59 11,032 10,717 9,883Dec 31, 13 last 3 years 57.132 16.44 10.34 9.10 15,788 13,433 12,985Mar 02, 01 Since Inception 10.000 16.81 n.A. 12.28 117,257 n.A. 62,662Discrete 12 month returns (%)
period Scheme ^$
Benchmark #
additional Benchmark ##
Dec 31, 15 To Dec 30, 16 7.70 6.66 3.01Dec 31, 14 To Dec 31, 15 2.44 0.48 -4.06Dec 31, 13 To Dec 31, 14 43.10 25.34 31.39
^past performance may or may not be sustained in the future. The above returns are for Regular plan - Growth option. Returns greater than 1 year period are compounded annualized (CAGR). Scheme performance may not strictly be comparable with that of its Additional Benchmark in view of balanced nature of the scheme where a portion of scheme’s investments are made in debt instruments. # CRISIl Balanced Fund - Aggressive Index ## nIFTy 50 Index. @ shows the current value of ̀ 10,000/- invested at the beginning of a given period. $ Adjusted for Bonus units declared under the Scheme. n.A.: not Available. For performance of other schemes managed by Chirag Setalvad, please refer page 46.
portfolio - Top 10 HoldingsIssuer Industry+/rating % to
NavEquITY & EquITY rElaTEDHDFC Bank ltd. Banks 5.13ICICI Bank ltd. Banks 3.67Infosys ltd. Software 3.32State Bank of India Banks 3.27Reliance Industries ltd. petroleum products 2.78larsen & Toubro ltd. Construction project 2.77Motherson Sumi Systems ltd. Auto Ancillaries 2.35Britannia Industries ltd. Consumer non
Durables 1.90Vedanta ltd. non - Ferrous Metals 1.83Fag Bearings India ltd. Industrial products 1.67Total of Top Ten Holdings 28.69Total Equity & Equity related Holdings 71.22g-SEC, CrEDIT ExpOSurEGovernment Securities Sovereign 16.63Tata Motors Finance ltd. CRISIl - AA 2.69Tata Sons ltd. CRISIl - AAA 2.53State Bank of India CRISIL - AA+ 0.77Vedanta ltd. CRISIl - AA- 0.39Total g-Sec, Credit Exposure 23.01Cash, Cash Equivalents and net Current Assets 5.77grand Total 100.00For complete portfolio, please visit www.hdfcfund.com
Industry allocation of Equity Holding (% of Net assets)
0.040.240.460.480.791.051.061.461.611.651.832.012.072.782.803.073.073.344.014.73
7.0410.40
15.23
0 2 4 6 8 10121416Transportation
FertilisersServices
Industrial Capital GoodsTelecom - Services
ConstructionFerrous Metals
PesticidesPower
Hotels, Resorts & Other Recreational ActivitiesNon - Ferrous Metals
Media And EntertainmentConsumer DurablesPetroleum Products
Consumer Non DurablesAuto
PharmaceuticalsFinance
Auto AncillariesConstruction Project
SoftwareIndustrial Products
Banks
Equity 71.22G-Sec 16.63Credit Exposure 6.38Cash, Cash Equivalents and net Current Assets 5.77
Portfolio Classification by Asset Class (%)
Equity 71.22Sovereign 16.63AAA/AAA(SO)/A1+/A1+(SO) & Equivalent 2.53AA+ & Below 3.85Cash, Cash Equivalents and net Current Assets 5.77
Portfolio Classification by Rating Class (%)
Face Value per unit: ` 10 unless otherwise specified, + Industry Classification as recommended by AMFI, Data is as of January 31, 2017 unless otherwise specified.
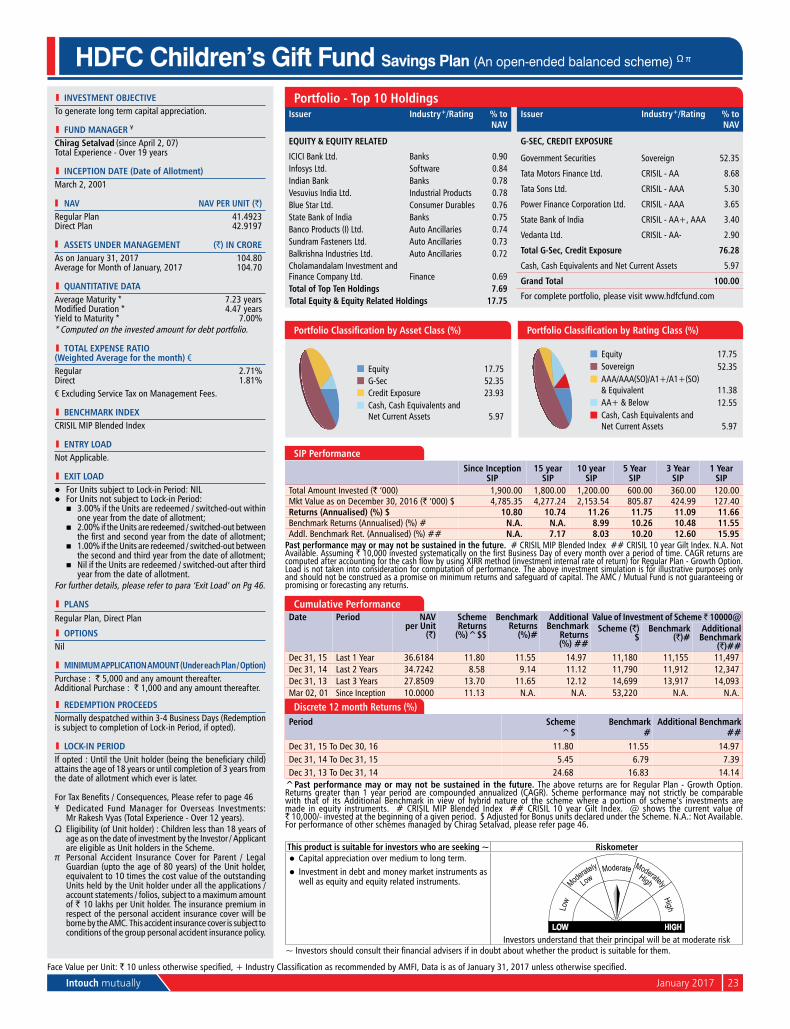
Intouch mutually January 2017 23
HDFC Children’s Gift Fund Savings Plan (An open-ended balanced scheme) Ω π
l INvESTMENT OBjECTIvETo generate long term capital appreciation.
l FuND MaNagEr ¥
Chirag Setalvad (since April 2, 07) Total Experience - over 19 years
l INCEpTION DaTE (Date of allotment)March 2, 2001
Nav Nav pEr uNIT (`)Regular plan 41.4923Direct plan 42.9197
aSSETS uNDEr MaNagEMENT (`) IN CrOrEAs on January 31, 2017 104.80Average for Month of January, 2017 104.70
l quaNTITaTIvE DaTaAverage Maturity * 7.23 yearsModified Duration * 4.47 yearsyield to Maturity * 7.00%* Computed on the invested amount for debt portfolio.
l TOTal ExpENSE raTIO (Weighted average for the month) €Regular 2.71%Direct 1.81%€ Excluding Service Tax on Management Fees.
l BENCHMarK INDExCRISIl MIp Blended Index
l ENTrY lOaDnot Applicable.
l ExIT lOaDl For units subject to lock-in period: nIll For units not subject to lock-in period: n 3.00% if the units are redeemed / switched-out within
one year from the date of allotment; n 2.00% if the units are redeemed / switched-out between
the first and second year from the date of allotment; n 1.00% if the units are redeemed / switched-out between
the second and third year from the date of allotment; n nil if the units are redeemed / switched-out after third
year from the date of allotment.For further details, please refer to para ‘Exit load’ on pg 46.
l plaNSRegular plan, Direct plan
l OpTIONSnil
l MINIMuM applICaTION aMOuNT (under each plan / Option)purchase : ` 5,000 and any amount thereafter.Additional purchase : ` 1,000 and any amount thereafter.
l rEDEMpTION prOCEEDSnormally despatched within 3-4 Business Days (Redemption is subject to completion of lock-in period, if opted).
l lOCK-IN pErIODIf opted : Until the Unit holder (being the beneficiary child) attains the age of 18 years or until completion of 3 years from the date of allotment which ever is later.
For Tax Benefits / Consequences, Please refer to page 46¥ Dedicated Fund Manager for overseas Investments:
Mr Rakesh Vyas (Total Experience - over 12 years).Ω Eligibility (of Unit holder) : Children less than 18 years of
age as on the date of investment by the Investor / Applicant are eligible as unit holders in the Scheme.
π Personal Accident Insurance Cover for Parent / Legal Guardian (upto the age of 80 years) of the unit holder, equivalent to 10 times the cost value of the outstanding units held by the unit holder under all the applications / account statements / folios, subject to a maximum amount of ` 10 lakhs per unit holder. The insurance premium in respect of the personal accident insurance cover will be borne by the AMC. This accident insurance cover is subject to conditions of the group personal accident insurance policy.
SIp performanceSince Inception
SIp15 year
SIp10 year
SIp5 Year
SIp3 Year
SIp1 Year
SIpTotal Amount Invested (` ‘000) 1,900.00 1,800.00 1,200.00 600.00 360.00 120.00 Mkt Value as on December 30, 2016 (` ‘000) $ 4,785.35 4,277.24 2,153.54 805.87 424.99 127.40 returns (annualised) (%) $ 10.80 10.74 11.26 11.75 11.09 11.66Benchmark Returns (Annualised) (%) # N.a. N.a. 8.99 10.26 10.48 11.55Addl. Benchmark Ret. (Annualised) (%) ## N.a. 7.17 8.03 10.20 12.60 15.95
past performance may or may not be sustained in the future. # CRISIl MIp Blended Index ## CRISIl 10 year Gilt Index. n.A. not Available. Assuming ` 10,000 invested systematically on the first Business Day of every month over a period of time. CAGR returns are computed after accounting for the cash flow by using XIRR method (investment internal rate of return) for Regular Plan - Growth Option. load is not taken into consideration for computation of performance. The above investment simulation is for illustrative purposes only and should not be construed as a promise on minimum returns and safeguard of capital. The AMC / Mutual Fund is not guaranteeing or promising or forecasting any returns.
Cumulative performanceDate period Nav
per unit (`)
Scheme returns
(%)^$$
Benchmark returns
(%)#
additional Benchmark
returns (%) ##
value of Investment of Scheme ̀ 10000@Scheme (`)
$Benchmark
(`)#additional
Benchmark (`)##
Dec 31, 15 last 1 year 36.6184 11.80 11.55 14.97 11,180 11,155 11,497Dec 31, 14 last 2 years 34.7242 8.58 9.14 11.12 11,790 11,912 12,347Dec 31, 13 last 3 years 27.8509 13.70 11.65 12.12 14,699 13,917 14,093Mar 02, 01 Since Inception 10.0000 11.13 n.A. n.A. 53,220 n.A. n.A.
Discrete 12 month returns (%)period Scheme
^$Benchmark
#additional Benchmark
##Dec 31, 15 To Dec 30, 16 11.80 11.55 14.97Dec 31, 14 To Dec 31, 15 5.45 6.79 7.39Dec 31, 13 To Dec 31, 14 24.68 16.83 14.14
^past performance may or may not be sustained in the future. The above returns are for Regular plan - Growth option. Returns greater than 1 year period are compounded annualized (CAGR). Scheme performance may not strictly be comparable with that of its Additional Benchmark in view of hybrid nature of the scheme where a portion of scheme’s investments are made in equity instruments. # CRISIl MIp Blended Index ## CRISIl 10 year Gilt Index. @ shows the current value of ` 10,000/- invested at the beginning of a given period. $ Adjusted for Bonus units declared under the Scheme. n.A.: not Available. For performance of other schemes managed by Chirag Setalvad, please refer page 46.
portfolio - Top 10 HoldingsIssuer Industry+/rating % to
Nav
EquITY & EquITY rElaTED
ICICI Bank ltd. Banks 0.90Infosys ltd. Software 0.84Indian Bank Banks 0.78Vesuvius India ltd. Industrial products 0.78Blue Star ltd. Consumer Durables 0.76State Bank of India Banks 0.75Banco products (I) ltd. Auto Ancillaries 0.74Sundram Fasteners ltd. Auto Ancillaries 0.73Balkrishna Industries ltd. Auto Ancillaries 0.72Cholamandalam Investment and Finance Company ltd. Finance 0.69Total of Top Ten Holdings 7.69Total Equity & Equity related Holdings 17.75
Issuer Industry+/rating % to Nav
g-SEC, CrEDIT ExpOSurE
Government Securities Sovereign 52.35
Tata Motors Finance ltd. CRISIl - AA 8.68
Tata Sons ltd. CRISIl - AAA 5.30
power Finance Corporation ltd. CRISIl - AAA 3.65
State Bank of India CRISIL - AA+, AAA 3.40
Vedanta ltd. CRISIl - AA- 2.90
Total g-Sec, Credit Exposure 76.28
Cash, Cash Equivalents and net Current Assets 5.97
grand Total 100.00
For complete portfolio, please visit www.hdfcfund.com
Equity 17.75G-Sec 52.35Credit Exposure 23.93Cash, Cash Equivalents and net Current Assets 5.97
Portfolio Classification by Asset Class (%)
Equity 17.75Sovereign 52.35AAA/AAA(SO)/A1+/A1+(SO) & Equivalent 11.38AA+ & Below 12.55Cash, Cash Equivalents and net Current Assets 5.97
Portfolio Classification by Rating Class (%)
Face Value per unit: ` 10 unless otherwise specified, + Industry Classification as recommended by AMFI, Data is as of January 31, 2017 unless otherwise specified.
This product is suitable for investors who are seeking ~ riskometerl Capital appreciation over medium to long term.l Investment in debt and money market instruments as
well as equity and equity related instruments.
Investors understand that their principal will be at moderate risk~ Investors should consult their financial advisers if in doubt about whether the product is suitable for them.
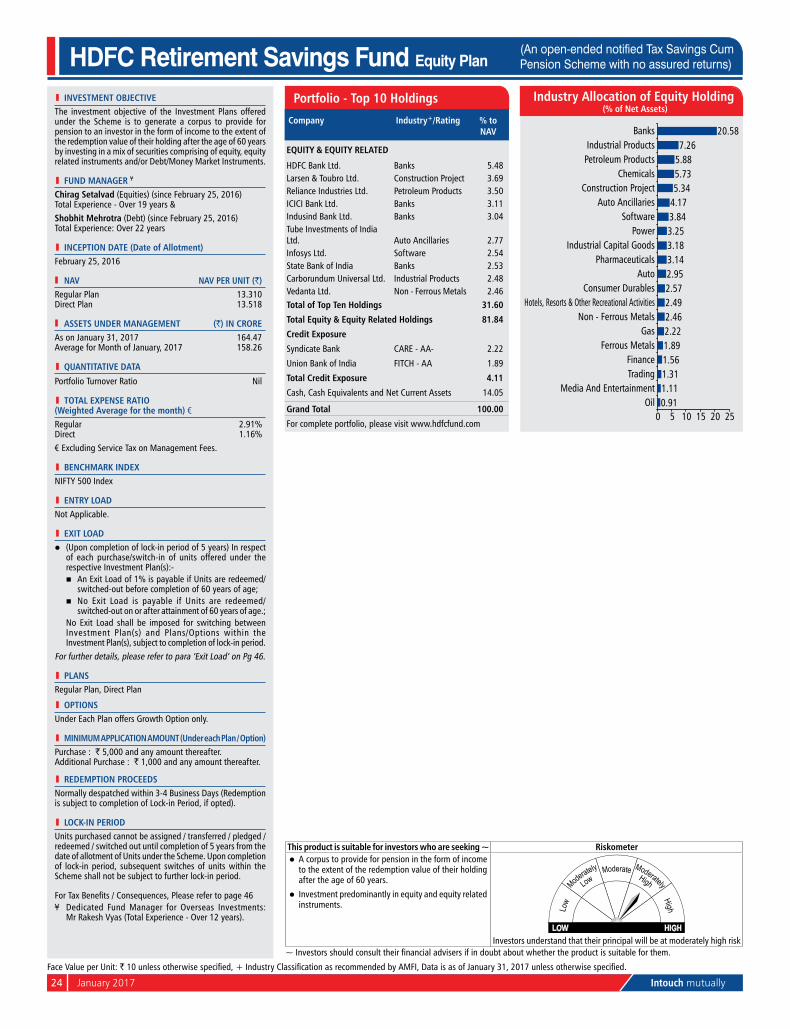
24 January 2017 Intouch mutually
l INvESTMENT OBjECTIvEThe investment objective of the Investment plans offered under the Scheme is to generate a corpus to provide for pension to an investor in the form of income to the extent of the redemption value of their holding after the age of 60 years by investing in a mix of securities comprising of equity, equity related instruments and/or Debt/Money Market Instruments.
l FuND MaNagEr ¥
Chirag Setalvad (Equities) (since February 25, 2016) Total Experience - over 19 years &Shobhit Mehrotra (Debt) (since February 25, 2016) Total Experience: over 22 years
l INCEpTION DaTE (Date of allotment)February 25, 2016
Nav Nav pEr uNIT (`)Regular plan 13.310Direct plan 13.518
aSSETS uNDEr MaNagEMENT (`) IN CrOrEAs on January 31, 2017 164.47Average for Month of January, 2017 158.26
l quaNTITaTIvE DaTa
portfolio Turnover Ratio nil
l TOTal ExpENSE raTIO (Weighted average for the month) €Regular 2.91%Direct 1.16%€ Excluding Service Tax on Management Fees.
l BENCHMarK INDExnIFTy 500 Index
l ENTrY lOaDnot Applicable.
l ExIT lOaDl (upon completion of lock-in period of 5 years) In respect
of each purchase/switch-in of units offered under the respective Investment plan(s):-
n An Exit load of 1% is payable if units are redeemed/switched-out before completion of 60 years of age;
n no Exit load is payable if units are redeemed/switched-out on or after attainment of 60 years of age.;
no Exit load shall be imposed for switching between Investment plan(s) and plans/options within the Investment plan(s), subject to completion of lock-in period.
For further details, please refer to para ‘Exit load’ on pg 46.
l plaNSRegular plan, Direct plan
l OpTIONSunder Each plan offers Growth option only.
l MINIMuM applICaTION aMOuNT (under each plan / Option)purchase : ` 5,000 and any amount thereafter.Additional purchase : ` 1,000 and any amount thereafter.
l rEDEMpTION prOCEEDSnormally despatched within 3-4 Business Days (Redemption is subject to completion of lock-in period, if opted).
l lOCK-IN pErIODunits purchased cannot be assigned / transferred / pledged / redeemed / switched out until completion of 5 years from the date of allotment of units under the Scheme. upon completion of lock-in period, subsequent switches of units within the Scheme shall not be subject to further lock-in period.
For Tax Benefits / Consequences, Please refer to page 46¥ Dedicated Fund Manager for overseas Investments:
Mr Rakesh Vyas (Total Experience - over 12 years).
Face Value per unit: ` 10 unless otherwise specified, + Industry Classification as recommended by AMFI, Data is as of January 31, 2017 unless otherwise specified.
This product is suitable for investors who are seeking ~ riskometerl A corpus to provide for pension in the form of income
to the extent of the redemption value of their holding after the age of 60 years.
l Investment predominantly in equity and equity related instruments.
Investors understand that their principal will be at moderately high risk~ Investors should consult their financial advisers if in doubt about whether the product is suitable for them.
HDFC Retirement Savings Fund Equity Plan(An open-ended notified Tax Savings Cum Pension Scheme with no assured returns)
Company Industry+/rating % to Nav
EquITY & EquITY rElaTED
HDFC Bank ltd. Banks 5.48larsen & Toubro ltd. Construction project 3.69Reliance Industries ltd. petroleum products 3.50ICICI Bank ltd. Banks 3.11Indusind Bank ltd. Banks 3.04Tube Investments of India ltd. Auto Ancillaries 2.77Infosys ltd. Software 2.54State Bank of India Banks 2.53Carborundum universal ltd. Industrial products 2.48Vedanta ltd. non - Ferrous Metals 2.46Total of Top Ten Holdings 31.60
Total Equity & Equity related Holdings 81.84
Credit Exposure
Syndicate Bank CARE - AA- 2.22
union Bank of India FITCH - AA 1.89
Total Credit Exposure 4.11
Cash, Cash Equivalents and net Current Assets 14.05
grand Total 100.00
For complete portfolio, please visit www.hdfcfund.com
portfolio - Top 10 Holdings
0.911.111.311.561.892.222.462.492.572.953.143.183.253.844.175.345.735.887.26
20.58
0 5 10 15 20 25Oil
Media And EntertainmentTradingFinance
Ferrous MetalsGas
Non - Ferrous MetalsHotels, Resorts & Other Recreational Activities
Consumer DurablesAuto
PharmaceuticalsIndustrial Capital Goods
PowerSoftware
Auto AncillariesConstruction Project
ChemicalsPetroleum ProductsIndustrial Products
Banks
Industry allocation of Equity Holding (% of Net assets)

Intouch mutually January 2017 25
l INvESTMENT OBjECTIvEThe investment objective of the Investment plans offered under the Scheme is to generate a corpus to provide for pension to an investor in the form of income to the extent of the redemption value of their holding after the age of 60 years by investing in a mix of securities comprising of equity, equity related instruments and/or Debt/Money Market Instruments.
l FuND MaNagEr ¥
Chirag Setalvad (Equities) (since February 25, 2016) Total Experience - over 19 years &Shobhit Mehrotra (Debt) (since February 25, 2016) Total Experience: over 22 years
l INCEpTION DaTE (Date of allotment)February 25, 2016
Nav Nav pEr uNIT (`)Regular plan 13.059Direct plan 13.275
aSSETS uNDEr MaNagEMENT (`) IN CrOrEAs on January 31, 2017 87.43Average for Month of January, 2017 84.99
l quaNTITaTIvE DaTa
portfolio Turnover Ratio 0.84%
l TOTal ExpENSE raTIO (Weighted average for the month) €Regular 3.00%Direct 1.25%€ Excluding Service Tax on Management Fees.
l BENCHMarK INDExCRISIl Balanced Fund Index
l ENTrY lOaDnot Applicable.
l ExIT lOaDl (upon completion of lock-in period of 5 years) In respect
of each purchase/switch-in of units offered under the respective Investment plan(s):-
n An Exit load of 1% is payable if units are redeemed/switched-out before completion of 60 years of age;
n no Exit load is payable if units are redeemed/switched-out on or after attainment of 60 years of age.;
no Exit load shall be imposed for switching between Investment plan(s) and plans/options within the Investment plan(s), subject to completion of lock-in period.
For further details, please refer to para ‘Exit load’ on pg 46.
l plaNSRegular plan, Direct plan
l OpTIONSunder Each plan offers Growth option only.
l MINIMuM applICaTION aMOuNT (under each plan / Option)purchase : ` 5,000 and any amount thereafter.Additional purchase : ` 1,000 and any amount thereafter.
l rEDEMpTION prOCEEDSnormally despatched within 3-4 Business Days (Redemption is subject to completion of lock-in period, if opted).
l lOCK-IN pErIODunits purchased cannot be assigned / transferred / pledged / redeemed / switched out until completion of 5 years from the date of allotment of units under the Scheme. upon completion of lock-in period, subsequent switches of units within the Scheme shall not be subject to further lock-in period.
For Tax Benefits / Consequences, Please refer to page 46¥ Dedicated Fund Manager for overseas Investments:
Mr Rakesh Vyas (Total Experience - over 12 years).
Face Value per unit: ` 10 unless otherwise specified, + Industry Classification as recommended by AMFI, Data is as of January 31, 2017 unless otherwise specified.
This product is suitable for investors who are seeking ~ riskometerl A corpus to provide for pension in the form of income
to the extent of the redemption value of their holding after the age of 60 years.
l Investment predominantly in equity and equity related instruments & balance in debt and money market instruments.
Investors understand that their principal will be at moderately high risk~ Investors should consult their financial advisers if in doubt about whether the product is suitable for them.
HDFC Retirement Savings Fund Hybrid Equity Plan(An open-ended notified Tax Savings Cum Pension Scheme with no assured returns)
Company Industry+/rating % to Nav
EquITY & EquITY rElaTEDHDFC Bank ltd. Banks 4.08State Bank of India Banks 2.95larsen & Toubro ltd. Construction project 2.56Reliance Industries ltd. petroleum products 2.51ICICI Bank ltd. Banks 2.25City union Bank ltd. Banks 2.23Tube Investments of India ltd. Auto Ancillaries 2.17Vedanta ltd. non - Ferrous Metals 2.03Infosys ltd. Software 2.00Mahanagar Gas ltd. Gas 1.86Total of Top Ten Holdings 24.64Total Equity & Equity related Holdings 66.19g-SEC, CrEDIT ExpOSurEState Bank of India CRISIL - AA+ 9.86Government Securities Sovereign 5.89Syndicate Bank CARE - AA- 4.17Reliance Jio Infocomm limited CRISIl - AAA 3.08IDBI Bank ltd. ICRA - A+ 2.64Total g-Sec, Credit Exposure 25.64Cash, Cash Equivalents and net Current Assets 8.17
grand Total 100.00
For complete portfolio, please visit www.hdfcfund.com
portfolio - Top 10 Holdings
0.941.021.181.381.781.862.032.162.302.472.502.833.473.714.114.555.06
6.7916.05
0 2 4 6 8 1012141618Media And Entertainment
TradingFinance
Ferrous MetalsHotels, Resorts & Other Recreational Activities
GasNon - Ferrous Metals
PharmaceuticalsAuto
Industrial Capital GoodsPower
ChemicalsConsumer DurablesPetroleum Products
SoftwareConstruction Project
Auto AncillariesIndustrial Products
Banks
Industry allocation of Equity Holding (% of Net assets)
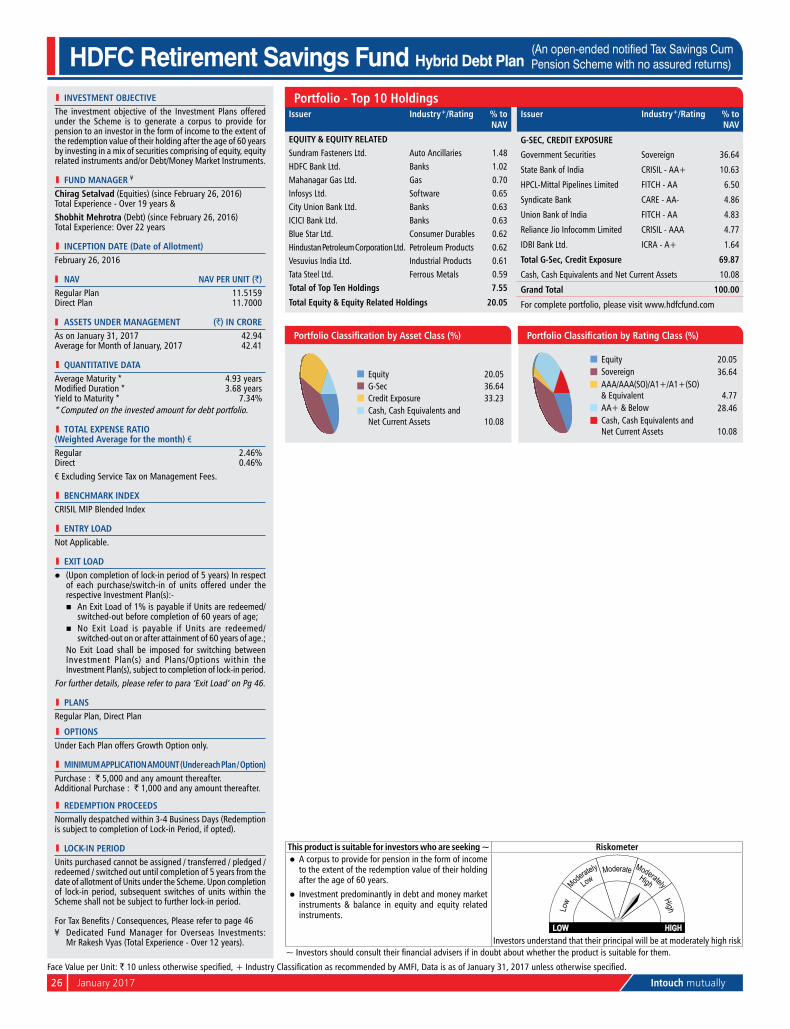
26 January 2017 Intouch mutually
l INvESTMENT OBjECTIvEThe investment objective of the Investment plans offered under the Scheme is to generate a corpus to provide for pension to an investor in the form of income to the extent of the redemption value of their holding after the age of 60 years by investing in a mix of securities comprising of equity, equity related instruments and/or Debt/Money Market Instruments.
l FuND MaNagEr ¥
Chirag Setalvad (Equities) (since February 26, 2016) Total Experience - over 19 years &Shobhit Mehrotra (Debt) (since February 26, 2016) Total Experience: over 22 years
l INCEpTION DaTE (Date of allotment)February 26, 2016
Nav Nav pEr uNIT (`)Regular plan 11.5159Direct plan 11.7000
aSSETS uNDEr MaNagEMENT (`) IN CrOrEAs on January 31, 2017 42.94Average for Month of January, 2017 42.41
l quaNTITaTIvE DaTaAverage Maturity * 4.93 yearsModified Duration * 3.68 yearsyield to Maturity * 7.34%* Computed on the invested amount for debt portfolio.
l TOTal ExpENSE raTIO (Weighted average for the month) €Regular 2.46%Direct 0.46%€ Excluding Service Tax on Management Fees.
l BENCHMarK INDExCRISIl MIp Blended Index
l ENTrY lOaDnot Applicable.
l ExIT lOaDl (upon completion of lock-in period of 5 years) In respect
of each purchase/switch-in of units offered under the respective Investment plan(s):-
n An Exit load of 1% is payable if units are redeemed/switched-out before completion of 60 years of age;
n no Exit load is payable if units are redeemed/switched-out on or after attainment of 60 years of age.;
no Exit load shall be imposed for switching between Investment plan(s) and plans/options within the Investment plan(s), subject to completion of lock-in period.
For further details, please refer to para ‘Exit load’ on pg 46.
l plaNSRegular plan, Direct plan
l OpTIONSunder Each plan offers Growth option only.
l MINIMuM applICaTION aMOuNT (under each plan / Option)purchase : ` 5,000 and any amount thereafter.Additional purchase : ` 1,000 and any amount thereafter.
l rEDEMpTION prOCEEDSnormally despatched within 3-4 Business Days (Redemption is subject to completion of lock-in period, if opted).
l lOCK-IN pErIODunits purchased cannot be assigned / transferred / pledged / redeemed / switched out until completion of 5 years from the date of allotment of units under the Scheme. upon completion of lock-in period, subsequent switches of units within the Scheme shall not be subject to further lock-in period.
For Tax Benefits / Consequences, Please refer to page 46¥ Dedicated Fund Manager for overseas Investments:
Mr Rakesh Vyas (Total Experience - over 12 years).
portfolio - Top 10 HoldingsIssuer Industry+/rating % to
Nav
EquITY & EquITY rElaTEDSundram Fasteners ltd. Auto Ancillaries 1.48HDFC Bank ltd. Banks 1.02Mahanagar Gas ltd. Gas 0.70Infosys ltd. Software 0.65City union Bank ltd. Banks 0.63ICICI Bank ltd. Banks 0.63Blue Star ltd. Consumer Durables 0.62Hindustan petroleum Corporation ltd. petroleum products 0.62Vesuvius India ltd. Industrial products 0.61Tata Steel ltd. Ferrous Metals 0.59Total of Top Ten Holdings 7.55
Total Equity & Equity related Holdings 20.05
Issuer Industry+/rating % to Nav
g-SEC, CrEDIT ExpOSurE
Government Securities Sovereign 36.64
State Bank of India CRISIL - AA+ 10.63
HpCl-Mittal pipelines limited FITCH - AA 6.50
Syndicate Bank CARE - AA- 4.86
union Bank of India FITCH - AA 4.83
Reliance Jio Infocomm limited CRISIl - AAA 4.77
IDBI Bank ltd. ICRA - A+ 1.64
Total g-Sec, Credit Exposure 69.87
Cash, Cash Equivalents and net Current Assets 10.08
grand Total 100.00
For complete portfolio, please visit www.hdfcfund.com
Equity 20.05G-Sec 36.64Credit Exposure 33.23Cash, Cash Equivalents and net Current Assets 10.08
Portfolio Classification by Asset Class (%)
Equity 20.05Sovereign 36.64AAA/AAA(SO)/A1+/A1+(SO) & Equivalent 4.77AA+ & Below 28.46Cash, Cash Equivalents and net Current Assets 10.08
Portfolio Classification by Rating Class (%)
Face Value per unit: ` 10 unless otherwise specified, + Industry Classification as recommended by AMFI, Data is as of January 31, 2017 unless otherwise specified.
This product is suitable for investors who are seeking ~ riskometerl A corpus to provide for pension in the form of income
to the extent of the redemption value of their holding after the age of 60 years.
l Investment predominantly in debt and money market instruments & balance in equity and equity related instruments.
Investors understand that their principal will be at moderately high risk~ Investors should consult their financial advisers if in doubt about whether the product is suitable for them.
HDFC Retirement Savings Fund Hybrid Debt Plan(An open-ended notified Tax Savings Cum Pension Scheme with no assured returns)

Intouch mutually January 2017 27
l INvESTMENT OBjECTIvETo generate regular returns through investment primarily in Debt and Money Market Instruments. The secondary objective of the Scheme is to generate long-term capital appreciation by investing a portion of the Scheme’s assets in equity and equity related instruments. Monthly Income is not assured & is subject to availability of distributable surplus.
l FuND MaNagEr ¥
vinay Kulkarni (Equities) (since november 21, 06) Total Experience: over 26 years &Shobhit Mehrotra (Debt) (since February 16, 04) Total Experience: over 22 years
l INCEpTION DaTE (Date of allotment)December 26, 2003
Nav Nav pEr uNIT (`)Regular plan - Growth option 28.0838Regular plan - Monthly Dividend option 11.4462Regular plan - quarterly Dividend option 11.9196Direct plan - Growth option 28.9129Direct plan - Monthly Dividend option 12.0387Direct plan - quarterly Dividend option 12.3272
aSSETS uNDEr MaNagEMENT (`) IN CrOrEAs on January 31, 2017 287.36Average for Month of January, 2017 286.56
l quaNTITaTIvE DaTaAverage Maturity * 6.80 yearsModified Duration * 4.50 yearsyield to Maturity * 7.36%* Computed on the invested amount for debt portfolio.
l TOTal ExpENSE raTIO (Weighted average for the month) €Regular 2.55%Direct 1.45%€ Excluding Service Tax on Management Fees.
l BENCHMarK INDExCRISIl MIp Blended Index
l ENTrY lOaDnot Applicable.
l ExIT lOaDl In respect of each purchase / switch-in of units, 15% of
the units (“the limit”) may be redeemed without any exit load from the date of allotment.
l Any redemption in excess of the limit shall be subject to the following exit load:
n Exit load of 1.00% is payable if units are redeemed / switched-out within 1 year from the date of allotment of units.
l no Exit load is payable if units are redeemed / switched-out after 1 year from the date of allotment.
For further details, please refer to para ‘Exit load’ on pg 46.
l plaNSRegular plan, Direct plan
l OpTIONSunder Each plan : Growth, Monthly Dividend & quarterly Dividend option. The Dividend option offers Dividend payout and Reinvestment facility.
l MINIMuM applICaTION aMOuNT (under each plan / Option)purchase :(Growth & quarterly Dividend option) - ` 5,000 and any amount thereafter.(Monthly Dividend option) - ̀ 25,000 and any amount thereafter.Additional purchase : ` 1,000 and any amount thereafter.
l rEDEMpTION prOCEEDSnormally despatched within 3-4 Business Days.
For Tax Benefits / Consequences, Please refer to page 46¥ Dedicated Fund Manager for overseas Investments:
Mr Rakesh Vyas (Total Experience - over 12 years).
This product is suitable for investors who are seeking ~ riskometerl Regular income over medium to long term.
l Investment in debt and money market instruments as well as equity and equity related instruments.
Investors understand that their principal will be at moderately high risk~ Investors should consult their financial advisers if in doubt about whether the product is suitable for them.
SIp performanceSince Inception
SIp10 year
SIp5 Year
SIp3 Year
SIp1 Year
SIpTotal Amount Invested (` ‘000) 1,570.00 1,200.00 600.00 360.00 120.00Mkt Value as on December 30, 2016 (` ‘000) 2,764.73 1,864.96 755.09 408.31 126.53returns (annualised) (%) 8.24 8.54 9.13 8.36 10.27Benchmark Returns (Annualised) (%) # 8.68 8.99 10.26 10.48 11.55Addl. Benchmark Ret. (Annualised) (%) ## 7.41 8.03 10.20 12.60 15.95
past performance may or may not be sustained in the future. # CRISIl MIp Blended Index ## CRISIl 10 year Gilt Index. Assuming ` 10,000 invested systematically on the first Business Day of every month over a period of time. CAGR returns are computed after accounting for the cash flow by using XIRR method (investment internal rate of return) for Regular Plan - Growth option. load is not taken into consideration for computation of performance. The above investment simulation is for illustrative purposes only and should not be construed as a promise on minimum returns and safeguard of capital. The AMC / Mutual Fund is not guaranteeing or promising or forecasting any returns.
portfolio - Top 10 Holdings
HDFC MF MIP - Short Term Plan (An open-ended income scheme. Monthly income is not assured and is subject to availability of distributable surplus)
Cumulative performanceDate period Nav
per unit (`)
Scheme returns
(%)^
Benchmark returns
(%)#
additional Benchmark
returns (%) ##
value of Investment of Scheme ̀ 10000@Scheme (`) Benchmark
(`)#additional
Benchmark (`)##
Dec 31, 15 last 1 year 25.1767 9.25 11.55 14.97 10,925 11,155 11,497Dec 31, 14 last 2 years 24.3732 6.23 9.14 11.12 11,286 11,912 12,347Dec 31, 13 last 3 years 20.6142 10.09 11.65 12.12 13,344 13,917 14,093Dec 26, 03 Since Inception 10.0000 8.08 7.97 5.83 27,507 27,130 20,907Discrete 12 month returns (%)
period Scheme ^
Benchmark #
additional Benchmark ##
Dec 31, 15 To Dec 30, 16 9.25 11.55 14.97Dec 31, 14 To Dec 31, 15 3.30 6.79 7.39Dec 31, 13 To Dec 31, 14 18.24 16.83 14.14
^past performance may or may not be sustained in the future. The above returns are for Regular plan - Growth option. Returns greater than 1 year period are compounded annualized (CAGR). Scheme performance may not strictly be comparable with that of its Additional Benchmark in view of hybrid nature of the scheme where a portion of scheme’s investments are made in equity instruments. # CRISIl MIp Blended Index ## CRISIl 10 year Gilt Index. @ shows the current value of ` 10,000/- invested at the beginning of a given period. For performance of other schemes managed by Vinay Kulkarni (Equities) and Shobhit Mehrotra (Debt), please refer page 46.
Equity 19.36G-Sec, SDl 42.53Credit Exposure 34.87Cash, Cash Equivalents and net Current Assets 3.24
Portfolio Classification by Asset Class (%)
Equity 19.36Sovereign 42.53AAA/AAA(SO)/A1+/A1+(SO) & Equivalent 13.65AA+ & Below 21.22Cash, Cash Equivalents and net Current Assets 3.24
Portfolio Classification by Rating Class (%)
Face Value per unit: ̀ 10 unless otherwise specified, + Industry Classification as recommended by AMFI, CD - Certificate of Deposit; CP - Commercial Papers. Data is as of January 31, 2017 unless otherwise specified.
Issuer Industry+/rating % to Nav
EquITY & EquITY rElaTEDnHpC ltd. power 1.51Bank of Baroda Banks 1.44ICICI Bank ltd. Banks 1.40State Bank of India Banks 1.36KEC International ltd. Construction project 0.93HDFC Bank ltd. Banks 0.90Cipla ltd. pharmaceuticals 0.80Solar Industries India ltd. Chemicals 0.74larsen & Toubro ltd. Construction project 0.73oil India ltd. oil 0.71Total of Top Ten Holdings 10.52Total Equity & Equity related Holdings 19.36g-SEC, SDl, CrEDIT ExpOSurEGovernment Securities Sovereign 42.53State Bank of India CRISIL - AA+, AAA 5.35
Issuer Industry+/rating % to Nav
Infiniti Retail Ltd. (Subsidiary of Tata Sons) CARE - A+ 4.95Hindalco Industries ltd. CRISIl - AA- 3.70Rural Electrification Corporation Ltd. CRISIl - AAA 2.28Tata Steel ltd. BRICKSWoRKS
- AA- 1.92Export - Import Bank of India C R I S I l - A A A 1.87India Infoline Housing Finance ltd. CRISIl - AA 1.83Syndicate Bank CARE - AA- 1.81Aarti Industries ltd. CRISIl - AA- 1.80
Total of Top Ten Holdings 68.04
Total g-Sec, SDl, Credit Exposure 77.40
Cash, Cash Equivalents and net Current Assets 3.24
grand Total 100.00For complete portfolio, please visit www.hdfcfund.com
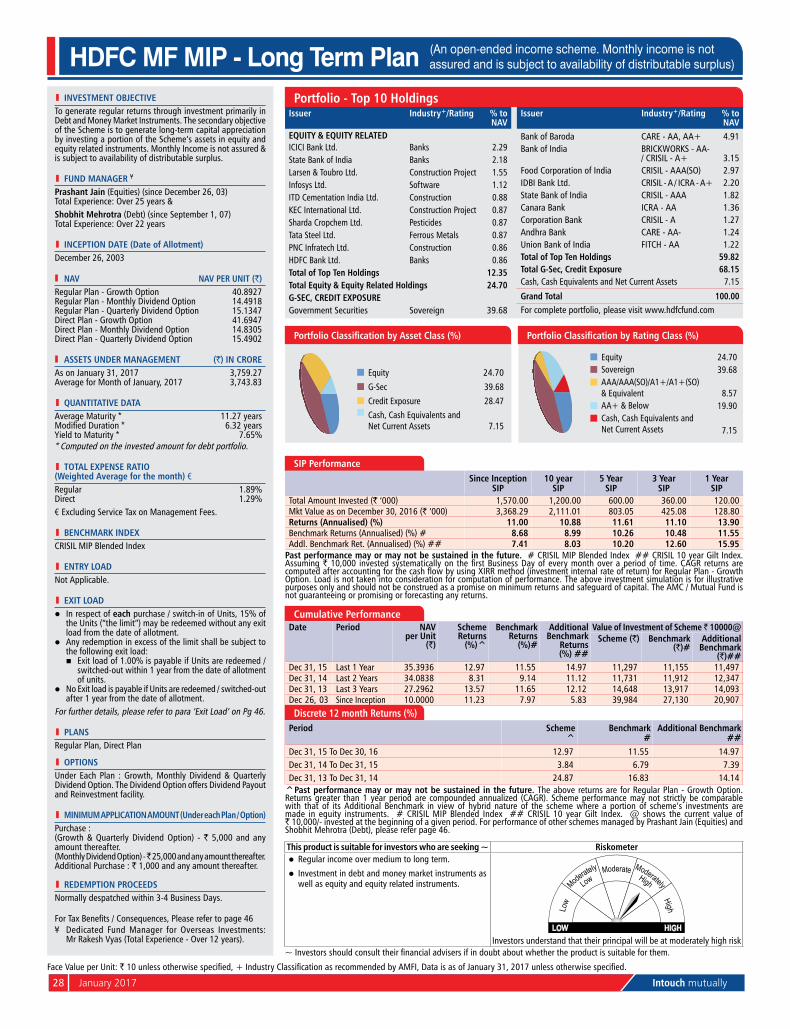
28 January 2017 Intouch mutually
l INvESTMENT OBjECTIvETo generate regular returns through investment primarily in Debt and Money Market Instruments. The secondary objective of the Scheme is to generate long-term capital appreciation by investing a portion of the Scheme’s assets in equity and equity related instruments. Monthly Income is not assured & is subject to availability of distributable surplus.
l FuND MaNagEr ¥
prashant jain (Equities) (since December 26, 03) Total Experience: over 25 years &Shobhit Mehrotra (Debt) (since September 1, 07) Total Experience: over 22 years
l INCEpTION DaTE (Date of allotment)December 26, 2003
Nav Nav pEr uNIT (`)Regular plan - Growth option 40.8927Regular plan - Monthly Dividend option 14.4918Regular plan - quarterly Dividend option 15.1347Direct plan - Growth option 41.6947Direct plan - Monthly Dividend option 14.8305Direct plan - quarterly Dividend option 15.4902
aSSETS uNDEr MaNagEMENT (`) IN CrOrEAs on January 31, 2017 3,759.27Average for Month of January, 2017 3,743.83
l quaNTITaTIvE DaTaAverage Maturity * 11.27 yearsModified Duration * 6.32 yearsyield to Maturity * 7.65%* Computed on the invested amount for debt portfolio.
l TOTal ExpENSE raTIO (Weighted average for the month) €Regular 1.89%Direct 1.29%€ Excluding Service Tax on Management Fees.
l BENCHMarK INDExCRISIl MIp Blended Index
l ENTrY lOaDnot Applicable.
l ExIT lOaDl In respect of each purchase / switch-in of units, 15% of
the units (“the limit”) may be redeemed without any exit load from the date of allotment.
l Any redemption in excess of the limit shall be subject to the following exit load:
n Exit load of 1.00% is payable if units are redeemed / switched-out within 1 year from the date of allotment of units.
l no Exit load is payable if units are redeemed / switched-out after 1 year from the date of allotment.
For further details, please refer to para ‘Exit load’ on pg 46.
l plaNSRegular plan, Direct plan
l OpTIONSunder Each plan : Growth, Monthly Dividend & quarterly Dividend option. The Dividend option offers Dividend payout and Reinvestment facility.
l MINIMuM applICaTION aMOuNT (under each plan / Option)purchase :(Growth & quarterly Dividend option) - ` 5,000 and any amount thereafter.(Monthly Dividend option) - ̀ 25,000 and any amount thereafter.Additional purchase : ` 1,000 and any amount thereafter.
l rEDEMpTION prOCEEDSnormally despatched within 3-4 Business Days.
For Tax Benefits / Consequences, Please refer to page 46¥ Dedicated Fund Manager for overseas Investments:
Mr Rakesh Vyas (Total Experience - over 12 years).
This product is suitable for investors who are seeking ~ riskometerl Regular income over medium to long term.
l Investment in debt and money market instruments as well as equity and equity related instruments.
Investors understand that their principal will be at moderately high risk~ Investors should consult their financial advisers if in doubt about whether the product is suitable for them.
SIp performanceSince Inception
SIp10 year
SIp5 Year
SIp3 Year
SIp1 Year
SIpTotal Amount Invested (` ‘000) 1,570.00 1,200.00 600.00 360.00 120.00Mkt Value as on December 30, 2016 (` ‘000) 3,368.29 2,111.01 803.05 425.08 128.80returns (annualised) (%) 11.00 10.88 11.61 11.10 13.90Benchmark Returns (Annualised) (%) # 8.68 8.99 10.26 10.48 11.55Addl. Benchmark Ret. (Annualised) (%) ## 7.41 8.03 10.20 12.60 15.95
past performance may or may not be sustained in the future. # CRISIl MIp Blended Index ## CRISIl 10 year Gilt Index. Assuming ` 10,000 invested systematically on the first Business Day of every month over a period of time. CAGR returns are computed after accounting for the cash flow by using XIRR method (investment internal rate of return) for Regular Plan - Growth option. load is not taken into consideration for computation of performance. The above investment simulation is for illustrative purposes only and should not be construed as a promise on minimum returns and safeguard of capital. The AMC / Mutual Fund is not guaranteeing or promising or forecasting any returns.
portfolio - Top 10 Holdings
HDFC MF MIP - Long Term Plan (An open-ended income scheme. Monthly income is not assured and is subject to availability of distributable surplus)
Cumulative performanceDate period Nav
per unit (`)
Scheme returns
(%)^
Benchmark returns
(%)#
additional Benchmark
returns (%) ##
value of Investment of Scheme ̀ 10000@Scheme (`) Benchmark
(`)#additional
Benchmark (`)##
Dec 31, 15 last 1 year 35.3936 12.97 11.55 14.97 11,297 11,155 11,497Dec 31, 14 last 2 years 34.0838 8.31 9.14 11.12 11,731 11,912 12,347Dec 31, 13 last 3 years 27.2962 13.57 11.65 12.12 14,648 13,917 14,093Dec 26, 03 Since Inception 10.0000 11.23 7.97 5.83 39,984 27,130 20,907
Discrete 12 month returns (%)period Scheme
^Benchmark
#additional Benchmark
##Dec 31, 15 To Dec 30, 16 12.97 11.55 14.97Dec 31, 14 To Dec 31, 15 3.84 6.79 7.39Dec 31, 13 To Dec 31, 14 24.87 16.83 14.14
^past performance may or may not be sustained in the future. The above returns are for Regular plan - Growth option. Returns greater than 1 year period are compounded annualized (CAGR). Scheme performance may not strictly be comparable with that of its Additional Benchmark in view of hybrid nature of the scheme where a portion of scheme’s investments are made in equity instruments. # CRISIl MIp Blended Index ## CRISIl 10 year Gilt Index. @ shows the current value of ` 10,000/- invested at the beginning of a given period. For performance of other schemes managed by prashant Jain (Equities) and Shobhit Mehrotra (Debt), please refer page 46.
Equity 24.70Sovereign 39.68AAA/AAA(SO)/A1+/A1+(SO) & Equivalent 8.57AA+ & Below 19.90Cash, Cash Equivalents and net Current Assets 7.15
Portfolio Classification by Rating Class (%)
Face Value per unit: ` 10 unless otherwise specified, + Industry Classification as recommended by AMFI, Data is as of January 31, 2017 unless otherwise specified.
Equity 24.70
G-Sec 39.68
Credit Exposure 28.47Cash, Cash Equivalents and net Current Assets 7.15
Portfolio Classification by Asset Class (%)
Issuer Industry+/rating % to Nav
EquITY & EquITY rElaTEDICICI Bank ltd. Banks 2.29State Bank of India Banks 2.18larsen & Toubro ltd. Construction project 1.55Infosys ltd. Software 1.12ITD Cementation India ltd. Construction 0.88KEC International ltd. Construction project 0.87Sharda Cropchem ltd. pesticides 0.87Tata Steel ltd. Ferrous Metals 0.87pnC Infratech ltd. Construction 0.86HDFC Bank ltd. Banks 0.86Total of Top Ten Holdings 12.35Total Equity & Equity related Holdings 24.70g-SEC, CrEDIT ExpOSurEGovernment Securities Sovereign 39.68
Issuer Industry+/rating % to Nav
Bank of Baroda CARE - AA, AA+ 4.91Bank of India BRICKWoRKS - AA-
/ CRISIL - A+ 3.15Food Corporation of India CRISIl - AAA(So) 2.97IDBI Bank ltd. CRISIL - A / ICRA - A+ 2.20State Bank of India CRISIl - AAA 1.82Canara Bank ICRA - AA 1.36Corporation Bank CRISIl - A 1.27Andhra Bank CARE - AA- 1.24union Bank of India FITCH - AA 1.22Total of Top Ten Holdings 59.82Total g-Sec, Credit Exposure 68.15Cash, Cash Equivalents and net Current Assets 7.15
grand Total 100.00For complete portfolio, please visit www.hdfcfund.com

Intouch mutually January 2017 29
l INvESTMENT OBjECTIvETo provide capital appreciation and income distribution to the investors using arbitrage opportunities, investment in equity / equity related instruments and debt / money market instruments.
l FuND MaNagEr ¥
vinay Kulkarni (Equities) (since november 21, 06) Total Experience: over 26 years Krishan Kumar Daga (Equities) (since January 08, 16) Total Experience: over 27 yearsanil Bamboli (Debt) (since September 17, 04) Total Experience: over 22 years
l INCEpTION DaTE (Date of allotment)September 17, 2004
Nav Nav pEr uNIT (`)Regular plan - Growth option 31.156Regular plan - Dividend option 11.435Direct plan - Growth option 31.981Direct plan - Dividend option 11.788
aSSETS uNDEr MaNagEMENT (`) IN CrOrEAs on January 31, 2017 479.96Average for Month of January, 2017 438.26
l quaNTITaTIvE DaTaportfolio Turnover Ratio 78.60% (w.e.f December 16, 2015)Average Maturity * 1.79 yearsModified Duration * 1.43 yearsyield to Maturity * 7.37%* Computed on the invested amount for debt portfolio.
l TOTal ExpENSE raTIO (Weighted average for the month) €Regular 2.38%Direct 0.76%
€ Excluding Service Tax on Management Fees.
l BENCHMarK INDEx40% CRISIl liquid Fund Index, 30% Crisil Short Term Bond Fund Index and 30% nIFTy 50
l ENTrY lOaDnot Applicable.
l ExIT lOaDl In respect of each purchase / switch-in of units, upto 15%
of the units may be redeemed without any exit load from the date of allotment.
l Any redemption in excess of the above limit shall be subject to the following exit load:
n Exit load of 1.00% is payable if units are redeemed / switched-out within 1 year from the date of allotment of units.
l no Exit load is payable if units are redeemed / switched-out after 1 year from the date of allotment.
For further details, please refer to para ‘Exit load’ on pg 46.
l plaNSRegular plan, Direct plan
l OpTIONSunder Each plan : Growth & Dividend. The Dividend option offers Dividend payout and Reinvestment facility.
l MINIMuM applICaTION aMOuNT (under each plan / Option)purchase : ` 5,000 and any amount thereafter.Additional purchase : ` 1,000 and any amount thereafter.
l rEDEMpTION prOCEEDSnormally despatched within 3-4 Business Days.
For Tax Benefits / Consequences, Please refer to page 46¥ Dedicated Fund Manager for overseas Investments: Mr Rakesh Vyas (Total Experience - over 12 years).
Face Value per unit: ̀ 10 unless otherwise specified, + Industry Classification as recommended by AMFI, CD - Certificate of Deposit; CP - Commercial Papers. Data is as of January 31, 2017 unless otherwise specified.
HDFC Equity Savings Fund (An open-ended equity scheme)
portfolio - Top 10 HoldingsIssuer Industry+/rating % to
Nav
EquITY & EquITY rElaTEDICICI Bank ltd. Banks 5.88State Bank of India Banks 3.19Hindalco Industries ltd. non - Ferrous Metals 2.95Sun pharmaceuticals Industries ltd. pharmaceuticals 2.60Axis Bank ltd. Banks 2.45HDFC Bank ltd. Banks 2.24Asian paints limited Consumer non
Durables 2.24Tata Steel ltd. Ferrous Metals 2.16Reliance Industries ltd. petroleum products 2.05Tata Motors ltd. DVR Auto 2.03Total of Top Ten Holdings 27.79Total Equity & Equity related Holdings 65.52CrEDIT ExpOSurE Housing Development Finance Corporation ltd.£ CRISIl - AAA 10.46Repco Home Finance ltd ICRA - AA- 2.86Mahindra & Mahindra Financial Services ltd. FITCH - AAA 2.56lIC Housing Finance ltd. CRISIl - AAA 2.14State Bank of India CRISIL - AA+ 2.11Syndicate Bank CARE - AA- 2.08union Bank of India FITCH - AA 1.05power Finance Corporation ltd. CRISIl - AAA 0.76Total Credit Exposure 24.02Short Term Deposits as margin for Futures & options 8.09other Cash, Cash Equivalents and net Current Assets 2.37grand Total 100.00For complete portfolio, please visit www.hdfcfund.comoutstanding exposure in derivative instruments (` in Crore) 128.56
Hedged position in Equity & Equity related instrumentsoutstanding derivative exposure (% age) 26.79
£ Co-sponsor
This product is suitable for investors who are seeking ~ riskometerl Capital appreciation while generating income over
medium to long term.l provide capital appreciation and income distribution
to the investors by using equity and equity related instruments, arbitrage opportunities, and investments in debt and money market instruments.
Investors understand that their principal will be at moderately high risk~ Investors should consult their financial advisers if in doubt about whether the product is suitable for them.
SIp performanceSince Inception SIp 10 year SIp 5 Year SIp 3 Year SIp 1 Year SIp
Total Amount Invested (` ‘000) 1,480.00 1,200.00 600.00 360.00 120.00Mkt Value as on December 30, 2016 (` ‘000) 2,761.14 1,995.95 772.58 418.92 129.93returns (annualised) (%) 9.63 9.82 10.05 10.10 15.73Benchmark Returns (Annualised) (%) # 8.84 8.51 8.67 7.02 6.48Addl. Benchmark Ret. (Annualised) (%) ## 7.63 8.03 10.20 12.60 15.95
past performance may or may not be sustained in the future. # 30% NIFTY 50 + 40% CRISIL Liquid Fund Index + 30% CRISIL Short Term Bond Fund Index ## CRISIl 10 year Gilt Index. n.A. not Available. Assuming ` 10,000 invested systematically on the first Business Day of every month over a period of time. CAGR returns are computed after accounting for the cash flow by using XIRR method (investment internal rate of return) for Regular plan - Growth option. load is not taken into consideration for computation of performance. The above investment simulation is for illustrative purposes only and should not be construed as a promise on minimum returns and safeguard of capital. The AMC / Mutual Fund is not guaranteeing or promising or forecasting any returns.
Cumulative performanceDate period Nav
per unit (`)
Scheme returns
(%)^
Benchmark returns
(%)#
additional Benchmark
returns (%) ##
value of Investment of Scheme ̀ 10000@Scheme (`) Benchmark
(`)#additional
Benchmark (`)##
Dec 31, 15 last 1 year 26.4650 14.13 5.35 14.97 11,413 10,535 11,497Dec 31, 14 last 2 years 25.9362 7.91 3.08 11.12 11,645 10,626 12,347Dec 31, 13 last 3 years 22.4127 10.46 9.01 12.12 13,476 12,954 14,093Sep 17, 04 Since Inception 10.0000 9.41 10.25 6.34 30,204 33,178 21,281
Discrete 12 month returns (%)period Scheme^ Benchmark# additional Benchmark##Dec 31, 15 To Dec 30, 16 14.13 5.35 14.97Dec 31, 14 To Dec 31, 15 2.04 0.87 7.39Dec 31, 13 To Dec 31, 14 15.72 21.90 14.14
^past performance may or may not be sustained in the future. The above returns are for Regular plan - Growth option. Returns greater than 1 year period are compounded annualized (CAGR). # 30% NIFTY 50 + 40% CRISIL Liquid Fund Index + 30% CRISIL Short Term Bond Fund Index ## CRISIl 10 year Gilt Index. Scheme performance may not strictly be comparable with that of its Additional Benchmark, since a portion of scheme’s investments are made in equity instruments. performance of dividend option under the schemes for the investors would be net of distribution tax as applicable. load is not taken into consideration for computation of performance. @ shows the current value of ` 10,000/- invested at the beginning of a given period. For performance of other schemes managed by Vinay Kulkarni (Equities), Krishan Kumar Daga (Equities) and Anil Bamboli (Debt), please refer page 46.
Industry allocation of Equity Holding (% of Net assets)
0.180.250.300.420.510.530.600.610.680.810.950.951.171.411.872.342.452.953.093.323.433.934.485.485.51
17.30
0 2 4 6 8 101214161820Chemicals
Industrial ProductsMinerals/Mining
Media And EntertainmentPesticides
Diversified Consumer ServiceConstruction
TransportationGas
Telecom - ServicesPower
Hotels, Resorts & Other Recreational ActivitiesSoftwareCement
Consumer DurablesIndustrial Capital Goods
OilNon - Ferrous Metals
FinanceFerrous Metals
Construction ProjectPetroleum Products
Consumer Non DurablesAuto
PharmaceuticalsBanks
Equity 65.52AAA/AAA(SO)/A1+/A1+(SO) & Equivalent 24.01AA+ & Below 8.10Cash, Cash Equivalents and net Current Assets 2.37
Portfolio Classification by Rating Class (%)

30 January 2017 Intouch mutually
HDFC Multiple Yield Fund - Plan 2005 (An open-ended income scheme)
This product is suitable for investors who are seeking ~ riskometerl positive returns over medium term with low risk of
capital loss over medium term.l Investment in debt and money market instruments
with maturity of 15 months (85%) as well as equity and equity related instruments (15%).
Investors understand that their principal will be at moderate risk~ Investors should consult their financial advisers if in doubt about whether the product is suitable for them.
SIp performanceSince Inception
SIp10 year
SIp5 Year
SIp3 Year
SIp1 Year
SIpTotal Amount Invested (` ‘000) 1,370.00 1,200.00 600.00 360.00 120.00Mkt Value as on December 30, 2016 (` ‘000) 2,474.35 2,021.18 772.39 411.51 125.95returns (annualised) (%) 9.91 10.06 10.04 8.89 9.34Benchmark Returns (Annualised) (%) # 8.82 8.99 10.26 10.48 11.55Addl. Benchmark Ret. (Annualised) (%) ## 6.73 6.89 7.63 7.73 7.13
past performance may or may not be sustained in the future. # CRISIl MIp Blended Index ## CRISIl 1 year T-Bill Index. Assuming ` 10,000 invested systematically on the first Business Day of every month over a period of time. CAGR returns are computed after accounting for the cash flow by using XIRR method (investment internal rate of return) for Regular Plan - Growth option. load is not taken into consideration for computation of performance. The above investment simulation is for illustrative purposes only and should not be construed as a promise on minimum returns and safeguard of capital. The AMC / Mutual Fund is not guaranteeing or promising or forecasting any returns.
l INvESTMENT OBjECTIvETo generate positive returns over medium time frame with low risk of capital loss over medium time frame.However, there can be no assurance that the investment objective of the Scheme will be achieved.
l FuND MaNagEr ¥
Chirag Setalvad (Equities) (since April 2, 07) Total Experience - over 19 years &anil Bamboli (Debt) (since August 17, 05) Total Experience: over 22 years
l INCEpTION DaTE (Date of allotment)August 17, 2005
Nav Nav pEr uNIT (`)Regular plan - Growth option 28.3148Regular plan - Dividend option 12.1817Direct plan - Growth option 28.9988Direct plan - Dividend option 12.9805
aSSETS uNDEr MaNagEMENT (`) IN CrOrEAs on January 31, 2017 171.05Average for Month of January, 2017 170.92
l quaNTITaTIvE DaTaAverage Maturity * 187 daysModified Duration * 173 daysyield to Maturity * 6.84%* Computed on the invested amount for debt portfolio.
l TOTal ExpENSE raTIO (Weighted average for the month) €Regular 1.77%Direct 1.22%
€ Excluding Service Tax on Management Fees.
l BENCHMarK INDExCRISIl MIp Blended Index
l ENTrY lOaDnot Applicable.
l ExIT lOaDl In respect of each purchase / switch-in of units, an Exit
load of 1.00% is payable if units are redeemed / switched-out within 15 months from the date of allotment.
l no Exit load is payable if units are redeemed / switched-out after 15 months from the date of allotment.
For further details, please refer to para ‘Exit load’ on pg 46.
l plaNSRegular plan, Direct plan
l OpTIONSunder Each plan : Growth & Dividend. The Dividend option offers Dividend payout and Reinvestment facility.
l MINIMuM applICaTION aMOuNT (under each plan / Option)purchase : ` 5,000 and any amount thereafter.Additional purchase : ` 1,000 and any amount thereafter.
l rEDEMpTION prOCEEDSnormally despatched within 3-4 Business Days.
For Tax Benefits / Consequences, Please refer to page 46¥ Dedicated Fund Manager for overseas Investments: Mr Rakesh Vyas (Total Experience - over 12 years).
Cumulative performanceDate period Nav
per unit (`)
Scheme returns
(%)^
Benchmark returns
(%)#
additional Benchmark
returns (%) ##
value of Investment of Scheme ̀ 10000@Scheme (`) Benchmark
(`)#additional
Benchmark (`)##
Dec 31, 15 last 1 year 25.6833 8.91 11.55 7.27 10,891 11,155 10,727Dec 31, 14 last 2 years 24.5370 6.77 9.14 7.75 11,400 11,912 11,609Dec 31, 13 last 3 years 20.3744 11.14 11.65 8.02 13,729 13,917 12,603Aug 17, 05 Since Inception 10.0000 9.46 8.43 6.21 27,972 25,122 19,851Discrete 12 month returns (%)
period Scheme ^
Benchmark #
additional Benchmark ##
Dec 31, 15 To Dec 30, 16 8.91 11.55 7.27Dec 31, 14 To Dec 31, 15 4.67 6.79 8.22Dec 31, 13 To Dec 31, 14 20.43 16.83 8.56
^past performance may or may not be sustained in the future. The above returns are for Regular plan - Growth option. Returns greater than 1 year period are compounded annualized (CAGR). # CRISIl MIp Blended Index ## CRISIl 1 year T-Bill Index. Scheme performance may not strictly be comparable with that of its Additional Benchmark in view of hybrid nature of the scheme where a portion of scheme’s investments are made in equity instruments. performance of dividend option under the schemes for the investors would be net of distribution tax as applicable. load is not taken into consideration for computation of performance. @ shows the current value of ` 10,000/- invested at the beginning of a given period. For performance of other schemes managed by Chirag Setalvad (Equities) and Anil Bamboli (Debt), please refer page 46.
Equity 17.89CD/Cp 31.54Credit Exposure 44.97Cash, Cash Equivalents and net Current Assets 5.60
Portfolio Classification by Asset Class (%)
Equity 17.89AAA/AAA(SO)/A1+/A1+(SO) & Equivalent 62.00AA+ & Below 14.51Cash, Cash Equivalents and net Current Assets 5.60
Portfolio Classification by Rating Class (%)
portfolio - Top 10 HoldingsIssuer Industry+/rating % to
Nav
EquITY & EquITY rElaTEDState Bank of India Banks 1.23Tata Motors ltd. DVR Auto 0.97Rural Electrification Corporation Ltd. Finance 0.91Infosys ltd. Software 0.81VST Industries ltd. Consumer non
Durables 0.80Jagran prakashan ltd. Media And
Entertainment 0.78Vesuvius India ltd. Industrial products 0.77V.S.T Tillers Tractors ltd. Auto 0.76Torrent pharmaceuticals ltd. pharmaceuticals 0.76Carborundum universal ltd. Industrial products 0.75Total of Top Ten Holdings 8.54Total Equity & Equity related Holdings 17.89CD/Cp, CrEDIT ExpOSurEHousing Development Finance Corporation ltd.£ CRISIl - AAA 11.76
Issuer Industry+/rating % to Nav
ICICI Bank ltd. CARE - A1+ 11.42Credit Suisse AG CRISIL - A1+ 9.82Export - Import Bank of India CRISIl - AAA 9.82Shriram Transport Finance Co. ltd. CRISIL - AA+ 5.89Cholamandalam Investment and Finance Company ltd. ICRA - AA 5.86power Finance Corporation ltd. CRISIl - AAA 5.33Adani ports and Special Economic Zone ltd. ICRA - A1+ 5.16power Grid Corporation of India ltd. CRISIl - AAA 3.55Family Credit limited CARE - A1+ 2.84Total of Top Ten Holdings 71.45Total CD/Cp, Credit Exposure 76.51
Cash, Cash Equivalents and net Current Assets 5.60
grand Total 100.00
For complete portfolio, please visit www.hdfcfund.com£ Co-sponsor
Face Value per unit: ̀ 10 unless otherwise specified, + Industry Classification as recommended by AMFI, CD - Certificate of Deposit; CP - Commercial Papers. Data is as of January 31, 2017 unless otherwise specified.

Intouch mutually January 2017 31
HDFC Income Fund (An open-ended income scheme)
portfolio - Top 10 HoldingsIssuer rating % to
Nav
g-SEC, CrEDIT ExpOSurE
Government Securities Sovereign 71.97
Tata power Co. ltd. CRISIl - AA- 2.76
State Bank of India CRISIL - AA+ 2.34
oriental Bank of Commerce FITCH - A+ 1.54
nTpC ltd. CRISIl - AAA 1.28
Food Corporation of India CRISIl - AAA(So) 1.28
Tata Steel ltd. BRICKSWoRKS - AA- 1.27
union Bank of India FITCH - AA 1.16
Issuer rating % to Nav
Andhra pradesh Expressway ltd. ICRA - AAA(So) 0.60
Bank of Baroda CARE - AA 0.42
Total of Top Ten Holdings 84.62
Total g-Sec, Credit Exposure 84.62
Cash, Cash Equivalents and net Current Assets 15.38
grand Total 100.00
For complete portfolio, please visit www.hdfcfund.com
This product is suitable for investors who are seeking ~ riskometer
l Regular income over medium to long term.l To optimise returns while maintaining a balance of
safety, yield and liquidity by investment in debt and money market instruments.
Investors understand that their principal will be at moderate risk
~ Investors should consult their financial advisers if in doubt about whether the product is suitable for them.
l INvESTMENT OBjECTIvETo optimise returns while maintaining a balance of safety, yield and liquidity.
l FuND MaNagEr ¥
Shobhit Mehrotra (since September 11, 07) Total Experience: over 22 years
l INCEpTION DaTE (Date of allotment)September 11, 2000
Nav Nav pEr uNIT (`)Regular plan - Growth option 37.8838Regular plan - quarterly Dividend option 11.4215Regular plan - normal Dividend option 11.9458Direct plan - Growth option 39.2626Direct plan - quarterly Dividend option 11.8565Direct plan - normal Dividend option 12.4167
aSSETS uNDEr MaNagEMENT (`) IN CrOrEAs on January 31, 2017 2,167.21Average for Month of January, 2017 2,186.63
l quaNTITaTIvE DaTaAverage Maturity * 15.78 yearsModified Duration * 7.75 yearsyield to Maturity * 7.15%* Computed on the invested amount for debt portfolio.
l TOTal ExpENSE raTIO (Weighted average for the month) €Regular 1.92%Direct 1.02%
€ Excluding Service Tax on Management Fees.
l BENCHMarK INDExCRISIl Composite Bond Fund Index
l ENTrY lOaDnot Applicable.
l ExIT lOaDnil
l plaNSRegular plan, Direct plan
l OpTIONSunder Each plan : Growth, quarterly Dividend & normal Dividend. Both Dividend options offer payout and Reinvestment facility.
l MINIMuM applICaTION aMOuNT (under each plan / Option)purchase : ` 5,000 and any amount thereafter.Additional purchase : ` 1,000 and any amount thereafter.
l rEDEMpTION prOCEEDSnormally despatched within 3-4 Business Days.
For Tax Benefits / Consequences, Please refer to page 46¥ Dedicated Fund Manager for overseas Investments: Mr Rakesh Vyas (Total Experience - over 12 years).
Cumulative performanceDate period Nav
per unit (`)
Scheme returns
(%)^
Benchmark returns
(%)#
additional Benchmark
returns (%) ##
value of Investment of Scheme ̀ 10000@
Scheme (`) Benchmark (`)#
additional Benchmark
(`)##Dec 31, 15 last 1 year 32.8100 14.49 12.93 14.97 11,449 11,293 11,497Dec 31, 14 last 2 years 31.1515 9.81 10.76 11.12 12,059 12,268 12,347Dec 31, 13 last 3 years 26.9302 11.73 11.93 12.12 13,949 14,023 14,093Sep 11, 00 Since Inception 10.0000 8.45 n.A. n.A. 37,566 n.A. n.A.
Discrete 12 month returns (%)period Scheme
^Benchmark
#additional Benchmark
##Dec 31, 15 To Dec 30, 16 14.49 12.93 14.97Dec 31, 14 To Dec 31, 15 5.32 8.63 7.39Dec 31, 13 To Dec 31, 14 15.67 14.31 14.14
^past performance may or may not be sustained in the future. The above returns are for Regular plan - Growth option. Returns greater than 1 year period are compounded annualized (CAGR). # CRISIl Composite Bond Fund Index ## CRISIl 10 year Gilt Index. Scheme performance may not strictly be comparable with that of its Additional Benchmark in view of hybrid nature of the scheme where a portion of scheme’s investments are made in equity instruments. performance of dividend option under the schemes for the investors would be net of distribution tax as applicable. load is not taken into consideration for computation of performance. @ shows the current value of ̀ 10,000/- invested at the beginning of a given period. n.A.: not Available. For performance of other schemes managed by Shobhit Mehrotra, please refer page 46.
G-Sec 71.97Credit Exposure 12.65Cash, Cash Equivalents and net Current Assets 15.38
Portfolio Classification by Asset Class (%)
Sovereign 71.97AAA/AAA(SO)/A1+/A1+(SO) & Equivalent 3.16AA+ & Below 9.49Cash, Cash Equivalents and net Current Assets 15.38
Portfolio Classification by Rating Class (%)
Face Value per unit: ` 10 unless otherwise specified, + Industry Classification as recommended by AMFI, Data is as of January 31, 2017 unless otherwise specified.
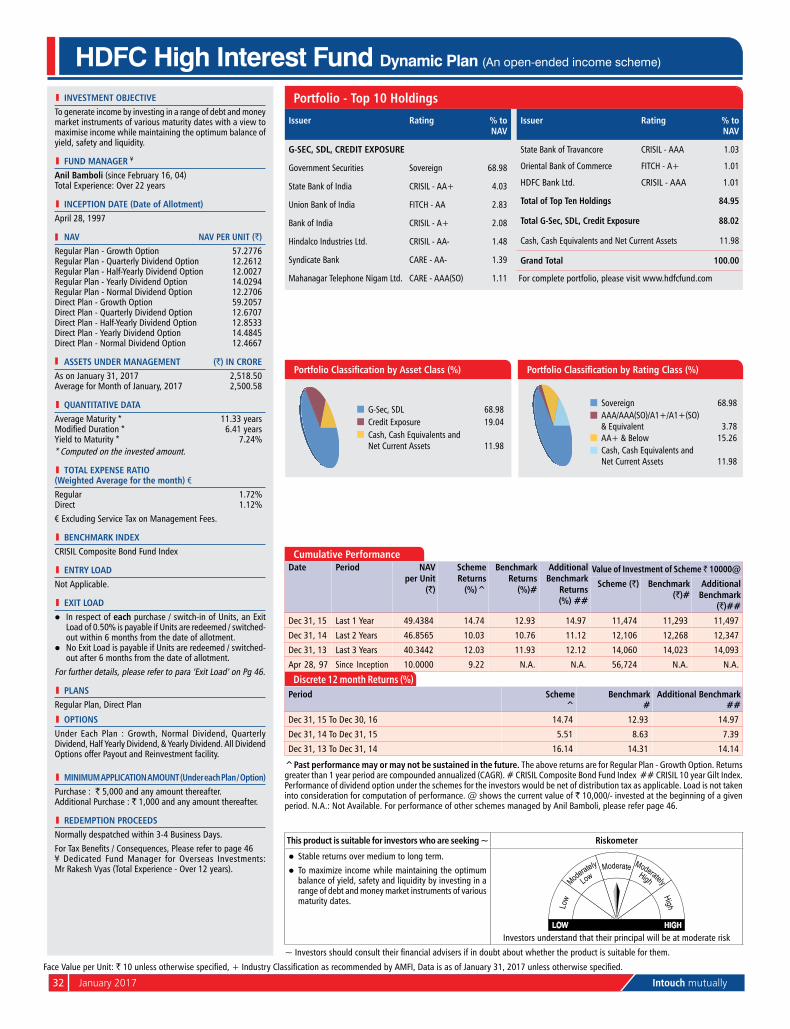
32 January 2017 Intouch mutually
l INvESTMENT OBjECTIvETo generate income by investing in a range of debt and money market instruments of various maturity dates with a view to maximise income while maintaining the optimum balance of yield, safety and liquidity.
l FuND MaNagEr ¥
anil Bamboli (since February 16, 04) Total Experience: over 22 years
l INCEpTION DaTE (Date of allotment)April 28, 1997
Nav Nav pEr uNIT (`)Regular plan - Growth option 57.2776Regular plan - quarterly Dividend option 12.2612Regular plan - Half-yearly Dividend option 12.0027Regular plan - yearly Dividend option 14.0294Regular plan - normal Dividend option 12.2706Direct plan - Growth option 59.2057Direct plan - quarterly Dividend option 12.6707Direct plan - Half-yearly Dividend option 12.8533Direct plan - yearly Dividend option 14.4845Direct plan - normal Dividend option 12.4667
aSSETS uNDEr MaNagEMENT (`) IN CrOrEAs on January 31, 2017 2,518.50Average for Month of January, 2017 2,500.58
l quaNTITaTIvE DaTaAverage Maturity * 11.33 yearsModified Duration * 6.41 yearsyield to Maturity * 7.24%* Computed on the invested amount.
l TOTal ExpENSE raTIO (Weighted average for the month) €Regular 1.72%Direct 1.12%
€ Excluding Service Tax on Management Fees.
l BENCHMarK INDExCRISIl Composite Bond Fund Index
l ENTrY lOaDnot Applicable.
l ExIT lOaDl In respect of each purchase / switch-in of units, an Exit
load of 0.50% is payable if units are redeemed / switched-out within 6 months from the date of allotment.
l no Exit load is payable if units are redeemed / switched-out after 6 months from the date of allotment.
For further details, please refer to para ‘Exit load’ on pg 46.
l plaNSRegular plan, Direct plan
l OpTIONSunder Each plan : Growth, normal Dividend, quarterly Dividend, Half yearly Dividend, & yearly Dividend. All Dividend options offer payout and Reinvestment facility.
l MINIMuM applICaTION aMOuNT (under each plan / Option)purchase : ` 5,000 and any amount thereafter. Additional purchase : ` 1,000 and any amount thereafter.
l rEDEMpTION prOCEEDSnormally despatched within 3-4 Business Days.For Tax Benefits / Consequences, Please refer to page 46¥ Dedicated Fund Manager for overseas Investments: Mr Rakesh Vyas (Total Experience - over 12 years).
HDFC High Interest Fund Dynamic Plan (An open-ended income scheme)
portfolio - Top 10 Holdings
Issuer rating % to Nav
g-SEC, SDl, CrEDIT ExpOSurE
Government Securities Sovereign 68.98
State Bank of India CRISIL - AA+ 4.03
union Bank of India FITCH - AA 2.83
Bank of India CRISIL - A+ 2.08
Hindalco Industries ltd. CRISIl - AA- 1.48
Syndicate Bank CARE - AA- 1.39
Mahanagar Telephone nigam ltd. CARE - AAA(So) 1.11
Issuer rating % to Nav
State Bank of Travancore CRISIl - AAA 1.03
oriental Bank of Commerce FITCH - A+ 1.01
HDFC Bank ltd. CRISIl - AAA 1.01
Total of Top Ten Holdings 84.95
Total g-Sec, SDl, Credit Exposure 88.02
Cash, Cash Equivalents and net Current Assets 11.98
grand Total 100.00
For complete portfolio, please visit www.hdfcfund.com
This product is suitable for investors who are seeking ~ riskometer
l Stable returns over medium to long term.l To maximize income while maintaining the optimum
balance of yield, safety and liquidity by investing in a range of debt and money market instruments of various maturity dates.
Investors understand that their principal will be at moderate risk
~ Investors should consult their financial advisers if in doubt about whether the product is suitable for them.
G-Sec, SDl 68.98Credit Exposure 19.04Cash, Cash Equivalents and net Current Assets 11.98
Portfolio Classification by Asset Class (%)
Sovereign 68.98AAA/AAA(SO)/A1+/A1+(SO) & Equivalent 3.78AA+ & Below 15.26Cash, Cash Equivalents and net Current Assets 11.98
Portfolio Classification by Rating Class (%)
Face Value per unit: ` 10 unless otherwise specified, + Industry Classification as recommended by AMFI, Data is as of January 31, 2017 unless otherwise specified.
Cumulative performanceDate period Nav
per unit (`)
Scheme returns
(%)^
Benchmark returns
(%)#
additional Benchmark
returns (%) ##
value of Investment of Scheme ̀ 10000@
Scheme (`) Benchmark (`)#
additional Benchmark
(`)##
Dec 31, 15 last 1 year 49.4384 14.74 12.93 14.97 11,474 11,293 11,497
Dec 31, 14 last 2 years 46.8565 10.03 10.76 11.12 12,106 12,268 12,347
Dec 31, 13 last 3 years 40.3442 12.03 11.93 12.12 14,060 14,023 14,093
Apr 28, 97 Since Inception 10.0000 9.22 n.A. n.A. 56,724 n.A. n.A.
Discrete 12 month returns (%)period Scheme
^Benchmark
#additional Benchmark
##
Dec 31, 15 To Dec 30, 16 14.74 12.93 14.97
Dec 31, 14 To Dec 31, 15 5.51 8.63 7.39
Dec 31, 13 To Dec 31, 14 16.14 14.31 14.14
^past performance may or may not be sustained in the future. The above returns are for Regular plan - Growth option. Returns greater than 1 year period are compounded annualized (CAGR). # CRISIl Composite Bond Fund Index ## CRISIl 10 year Gilt Index. performance of dividend option under the schemes for the investors would be net of distribution tax as applicable. load is not taken into consideration for computation of performance. @ shows the current value of ` 10,000/- invested at the beginning of a given period. n.A.: not Available. For performance of other schemes managed by Anil Bamboli, please refer page 46.
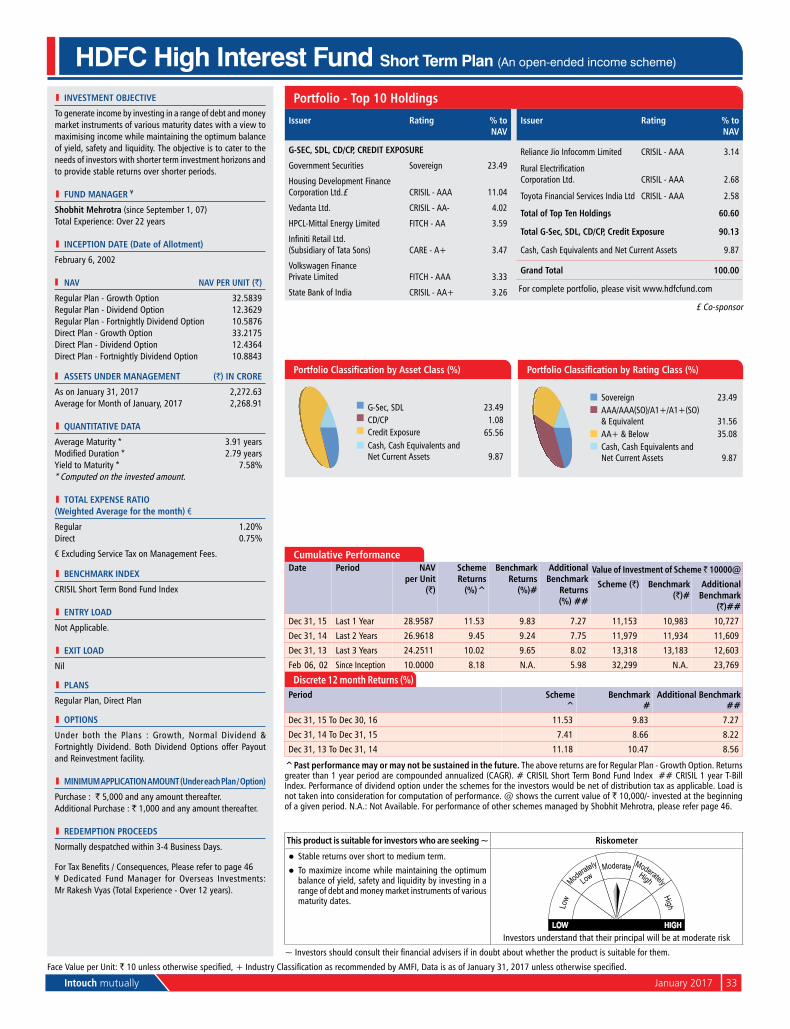
Intouch mutually January 2017 33
HDFC High Interest Fund Short Term Plan (An open-ended income scheme)
This product is suitable for investors who are seeking ~ riskometer
l Stable returns over short to medium term.l To maximize income while maintaining the optimum
balance of yield, safety and liquidity by investing in a range of debt and money market instruments of various maturity dates.
Investors understand that their principal will be at moderate risk
~ Investors should consult their financial advisers if in doubt about whether the product is suitable for them.
portfolio - Top 10 Holdings
Issuer rating % to Nav
g-SEC, SDl, CD/Cp, CrEDIT ExpOSurE
Government Securities Sovereign 23.49
Housing Development Finance Corporation ltd.£ CRISIl - AAA 11.04
Vedanta ltd. CRISIl - AA- 4.02
HpCl-Mittal Energy limited FITCH - AA 3.59
Infiniti Retail Ltd. (Subsidiary of Tata Sons) CARE - A+ 3.47
Volkswagen Finance private limited FITCH - AAA 3.33
State Bank of India CRISIL - AA+ 3.26
Issuer rating % to Nav
Reliance Jio Infocomm limited CRISIl - AAA 3.14
Rural Electrification Corporation ltd. CRISIl - AAA 2.68
Toyota Financial Services India ltd CRISIl - AAA 2.58
Total of Top Ten Holdings 60.60
Total g-Sec, SDl, CD/Cp, Credit Exposure 90.13
Cash, Cash Equivalents and net Current Assets 9.87
grand Total 100.00
For complete portfolio, please visit www.hdfcfund.com
Cumulative performanceDate period Nav
per unit (`)
Scheme returns
(%)^
Benchmark returns
(%)#
additional Benchmark
returns (%) ##
value of Investment of Scheme ̀ 10000@
Scheme (`) Benchmark (`)#
additional Benchmark
(`)##
Dec 31, 15 last 1 year 28.9587 11.53 9.83 7.27 11,153 10,983 10,727
Dec 31, 14 last 2 years 26.9618 9.45 9.24 7.75 11,979 11,934 11,609
Dec 31, 13 last 3 years 24.2511 10.02 9.65 8.02 13,318 13,183 12,603
Feb 06, 02 Since Inception 10.0000 8.18 n.A. 5.98 32,299 n.A. 23,769
Discrete 12 month returns (%)period Scheme
^Benchmark
#additional Benchmark
##
Dec 31, 15 To Dec 30, 16 11.53 9.83 7.27
Dec 31, 14 To Dec 31, 15 7.41 8.66 8.22
Dec 31, 13 To Dec 31, 14 11.18 10.47 8.56
^past performance may or may not be sustained in the future. The above returns are for Regular plan - Growth option. Returns greater than 1 year period are compounded annualized (CAGR). # CRISIl Short Term Bond Fund Index ## CRISIl 1 year T-Bill Index. performance of dividend option under the schemes for the investors would be net of distribution tax as applicable. load is not taken into consideration for computation of performance. @ shows the current value of ` 10,000/- invested at the beginning of a given period. n.A.: not Available. For performance of other schemes managed by Shobhit Mehrotra, please refer page 46.
Sovereign 23.49AAA/AAA(SO)/A1+/A1+(SO) & Equivalent 31.56AA+ & Below 35.08Cash, Cash Equivalents and net Current Assets 9.87
Portfolio Classification by Rating Class (%)
G-Sec, SDl 23.49CD/Cp 1.08Credit Exposure 65.56Cash, Cash Equivalents and net Current Assets 9.87
Portfolio Classification by Asset Class (%)
l INvESTMENT OBjECTIvE
To generate income by investing in a range of debt and money market instruments of various maturity dates with a view to maximising income while maintaining the optimum balance of yield, safety and liquidity. The objective is to cater to the needs of investors with shorter term investment horizons and to provide stable returns over shorter periods.
l FuND MaNagEr ¥
Shobhit Mehrotra (since September 1, 07)
Total Experience: over 22 years
l INCEpTION DaTE (Date of allotment)
February 6, 2002
Nav Nav pEr uNIT (`)
Regular plan - Growth option 32.5839Regular plan - Dividend option 12.3629Regular plan - Fortnightly Dividend option 10.5876Direct plan - Growth option 33.2175Direct plan - Dividend option 12.4364Direct plan - Fortnightly Dividend option 10.8843
aSSETS uNDEr MaNagEMENT (`) IN CrOrE
As on January 31, 2017 2,272.63Average for Month of January, 2017 2,268.91
l quaNTITaTIvE DaTa
Average Maturity * 3.91 yearsModified Duration * 2.79 yearsyield to Maturity * 7.58%* Computed on the invested amount.
l TOTal ExpENSE raTIO (Weighted average for the month) €
Regular 1.20%Direct 0.75%
€ Excluding Service Tax on Management Fees.
l BENCHMarK INDEx
CRISIl Short Term Bond Fund Index
l ENTrY lOaD
not Applicable.
l ExIT lOaD
nil
l plaNS
Regular plan, Direct plan
l OpTIONS
under both the plans : Growth, normal Dividend & Fortnightly Dividend. Both Dividend options offer payout and Reinvestment facility.
l MINIMuM applICaTION aMOuNT (under each plan / Option)
purchase : ` 5,000 and any amount thereafter. Additional purchase : ` 1,000 and any amount thereafter.
l rEDEMpTION prOCEEDS
normally despatched within 3-4 Business Days.
For Tax Benefits / Consequences, Please refer to page 46¥ Dedicated Fund Manager for overseas Investments: Mr Rakesh Vyas (Total Experience - over 12 years).
Face Value per unit: ` 10 unless otherwise specified, + Industry Classification as recommended by AMFI, Data is as of January 31, 2017 unless otherwise specified.
£ Co-sponsor
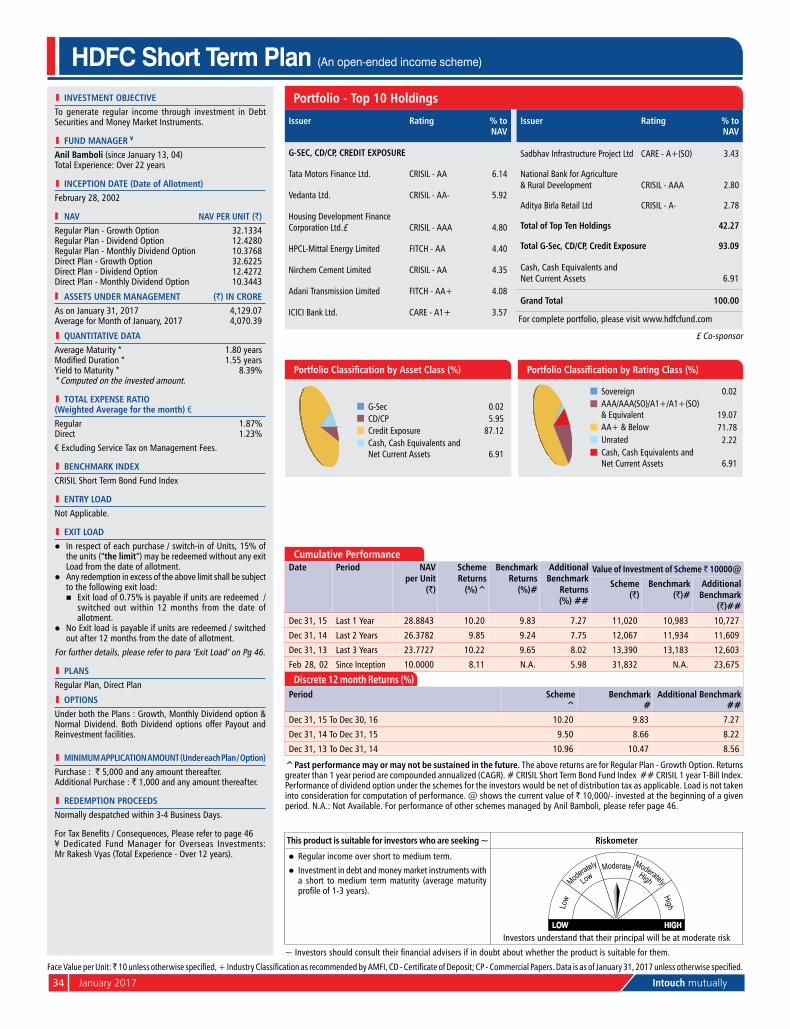
34 January 2017 Intouch mutually
HDFC Short Term Plan (An open-ended income scheme)
Issuer rating % to Nav
g-SEC, CD/Cp, CrEDIT ExpOSurE
Tata Motors Finance ltd. CRISIl - AA 6.14
Vedanta ltd. CRISIl - AA- 5.92
Housing Development Finance Corporation ltd.£ CRISIl - AAA 4.80
HpCl-Mittal Energy limited FITCH - AA 4.40
nirchem Cement limited CRISIl - AA 4.35
Adani Transmission limited FITCH - AA+ 4.08
ICICI Bank ltd. CARE - A1+ 3.57
Issuer rating % to Nav
Sadbhav Infrastructure project ltd CARE - A+(SO) 3.43
national Bank for Agriculture & Rural Development CRISIl - AAA 2.80
Aditya Birla Retail ltd CRISIl - A- 2.78
Total of Top Ten Holdings 42.27
Total g-Sec, CD/Cp, Credit Exposure 93.09
Cash, Cash Equivalents and net Current Assets 6.91
grand Total 100.00
For complete portfolio, please visit www.hdfcfund.com
This product is suitable for investors who are seeking ~ riskometer
l Regular income over short to medium term.l Investment in debt and money market instruments with
a short to medium term maturity (average maturity profile of 1-3 years).
Investors understand that their principal will be at moderate risk
~ Investors should consult their financial advisers if in doubt about whether the product is suitable for them.
Cumulative performanceDate period Nav
per unit (`)
Scheme returns
(%)^
Benchmark returns
(%)#
additional Benchmark
returns (%) ##
value of Investment of Scheme ̀ 10000@
Scheme (`)
Benchmark (`)#
additional Benchmark
(`)##
Dec 31, 15 last 1 year 28.8843 10.20 9.83 7.27 11,020 10,983 10,727
Dec 31, 14 last 2 years 26.3782 9.85 9.24 7.75 12,067 11,934 11,609
Dec 31, 13 last 3 years 23.7727 10.22 9.65 8.02 13,390 13,183 12,603
Feb 28, 02 Since Inception 10.0000 8.11 n.A. 5.98 31,832 n.A. 23,675
Discrete 12 month returns (%)period Scheme
^Benchmark
#additional Benchmark
##
Dec 31, 15 To Dec 30, 16 10.20 9.83 7.27
Dec 31, 14 To Dec 31, 15 9.50 8.66 8.22
Dec 31, 13 To Dec 31, 14 10.96 10.47 8.56
^past performance may or may not be sustained in the future. The above returns are for Regular plan - Growth option. Returns greater than 1 year period are compounded annualized (CAGR). # CRISIl Short Term Bond Fund Index ## CRISIl 1 year T-Bill Index. performance of dividend option under the schemes for the investors would be net of distribution tax as applicable. load is not taken into consideration for computation of performance. @ shows the current value of ` 10,000/- invested at the beginning of a given period. n.A.: not Available. For performance of other schemes managed by Anil Bamboli, please refer page 46.
G-Sec 0.02CD/Cp 5.95Credit Exposure 87.12Cash, Cash Equivalents and net Current Assets 6.91
Portfolio Classification by Asset Class (%)
Sovereign 0.02AAA/AAA(SO)/A1+/A1+(SO) & Equivalent 19.07AA+ & Below 71.78unrated 2.22Cash, Cash Equivalents and net Current Assets 6.91
Portfolio Classification by Rating Class (%)
l INvESTMENT OBjECTIvETo generate regular income through investment in Debt Securities and Money Market Instruments.
l FuND MaNagEr ¥
anil Bamboli (since January 13, 04) Total Experience: over 22 years
l INCEpTION DaTE (Date of allotment)February 28, 2002
Nav Nav pEr uNIT (`)Regular plan - Growth option 32.1334Regular plan - Dividend option 12.4280Regular plan - Monthly Dividend option 10.3768Direct plan - Growth option 32.6225Direct plan - Dividend option 12.4272Direct plan - Monthly Dividend option 10.3443
aSSETS uNDEr MaNagEMENT (`) IN CrOrEAs on January 31, 2017 4,129.07Average for Month of January, 2017 4,070.39
l quaNTITaTIvE DaTaAverage Maturity * 1.80 yearsModified Duration * 1.55 yearsyield to Maturity * 8.39%* Computed on the invested amount.
l TOTal ExpENSE raTIO (Weighted average for the month) €Regular 1.87%Direct 1.23%
€ Excluding Service Tax on Management Fees.
l BENCHMarK INDExCRISIl Short Term Bond Fund Index
l ENTrY lOaDnot Applicable.
l ExIT lOaDl In respect of each purchase / switch-in of units, 15% of
the units (“the limit”) may be redeemed without any exit load from the date of allotment.
l Any redemption in excess of the above limit shall be subject to the following exit load:
n Exit load of 0.75% is payable if units are redeemed / switched out within 12 months from the date of allotment.
l no Exit load is payable if units are redeemed / switched out after 12 months from the date of allotment.
For further details, please refer to para ‘Exit load’ on pg 46.
l plaNSRegular plan, Direct plan
l OpTIONSunder both the plans : Growth, Monthly Dividend option & normal Dividend. Both Dividend options offer payout and Reinvestment facilities.
l MINIMuM applICaTION aMOuNT (under each plan / Option)purchase : ` 5,000 and any amount thereafter. Additional purchase : ` 1,000 and any amount thereafter.
l rEDEMpTION prOCEEDSnormally despatched within 3-4 Business Days.
For Tax Benefits / Consequences, Please refer to page 46¥ Dedicated Fund Manager for overseas Investments: Mr Rakesh Vyas (Total Experience - over 12 years).
portfolio - Top 10 Holdings
Face Value per unit: ̀ 10 unless otherwise specified, + Industry Classification as recommended by AMFI, CD - Certificate of Deposit; CP - Commercial Papers. Data is as of January 31, 2017 unless otherwise specified.
£ Co-sponsor

Intouch mutually January 2017 35
HDFC Short Term Opportunities Fund (An open-ended income scheme)
portfolio - Top 10 Holdings
This product is suitable for investors who are seeking ~ riskometer
l Regular income over short to medium term.l Investment in debt and money market instruments and
government securities with maturities not exceeding 36 months.
Investors understand that their principal will be at moderately low risk
~ Investors should consult their financial advisers if in doubt about whether the product is suitable for them.
Cumulative performanceDate period Nav
per unit (`)
Scheme returns
(%)^
Benchmark returns
(%)#
additional Benchmark
returns (%) ##
value of Investment of Scheme ̀ 10000@
Scheme (`) Benchmark (`)#
additional Benchmark
(`)##
Dec 31, 15 last 1 year 16.1799 9.31 9.83 7.27 10,931 10,983 10,727
Dec 31, 14 last 2 years 14.8852 9.00 9.24 7.75 11,882 11,934 11,609
Dec 31, 13 last 3 years 13.4818 9.47 9.65 8.02 13,118 13,183 12,603
Jun 25, 10 Since Inception 10.0000 9.14 8.63 7.04 17,686 17,161 15,584
Discrete 12 month returns (%)period Scheme
^Benchmark
#additional Benchmark
##
Dec 31, 15 To Dec 30, 16 9.31 9.83 7.27
Dec 31, 14 To Dec 31, 15 8.70 8.66 8.22
Dec 31, 13 To Dec 31, 14 10.41 10.47 8.56
^past performance may or may not be sustained in the future. The above returns are for Regular plan - Growth option. Returns greater than 1 year period are compounded annualized (CAGR). # CRISIl Short Term Bond Fund Index ## CRISIl 1 year T-Bill Index. performance of dividend option under the schemes for the investors would be net of distribution tax as applicable. load is not taken into consideration for computation of performance. @ shows the current value of ` 10,000/- invested at the beginning of a given period. For performance of other schemes managed by Anil Bamboli, please refer page 46.
Issuer rating % to Nav
g-SEC, SDl, CD/Cp, CrEDIT ExpOSurE
Government Securities Sovereign 11.45
Housing Development Finance Corporation ltd.£ CRISIl - AAA 10.61
national Bank for Agriculture & Rural Development CRISIl - AAA 9.18
power Finance Corporation ltd. CRISIl - AAA 7.52
onGC petro additions limited (opAl) CRISIl - AAA(So) 6.37
lIC Housing Finance ltd. CARE - AAA / CRISIl - AAA 6.14
Issuer rating % to Nav
Small Industries Development Bank of India CARE - AAA 4.54
Reliance Jio Infocomm limited CRISIl - AAA 3.92
Export - Import Bank of India CRISIl - AAA 2.84
Cholamandalam Investment and Finance Company ltd. ICRA - AA 2.58
Total of Top Ten Holdings 65.15
Total g-Sec, SDl, CD/Cp, Credit Exposure 97.21
Cash, Cash Equivalents and net Current Assets 2.79
grand Total 100.00
For complete portfolio, please visit www.hdfcfund.com
£ Co-sponsor
G-Sec, SDl 11.45CD/Cp 3.49Credit Exposure 82.27Cash, Cash Equivalents and net Current Assets 2.79
Portfolio Classification by Asset Class (%)
Sovereign 11.45AAA/AAA(SO)/A1+/A1+(SO) & Equivalent 74.51AA+ & Below 11.25Cash, Cash Equivalents and net Current Assets 2.79
Portfolio Classification by Rating Class (%)
Face Value per unit: ̀ 10 unless otherwise specified, + Industry Classification as recommended by AMFI, CD - Certificate of Deposit; CP - Commercial Papers. Data is as of January 31, 2017 unless otherwise specified.
l INvESTMENT OBjECTIvETo generate regular income through investments in Debt/ Money Market Instruments and Government Securities with maturities not exceeding 36 months.
l FuND MaNagEr ¥
anil Bamboli (since June 25, 10) Total Experience: over 22 years
l INCEpTION DaTE (Date of allotment)June 25, 2010
Nav Nav pEr uNIT (`)Regular plan - Growth option 17.8327Regular plan - Fortnightly Dividend option 10.2301Regular plan - normal Dividend option 11.9901Direct plan - Growth option 17.9399Direct plan - Fortnightly Dividend option 10.2905Direct plan - normal Dividend option 11.9930
aSSETS uNDEr MaNagEMENT (`) IN CrOrEAs on January 31, 2017 9,315.71Average for Month of January, 2017 9,585.67
l quaNTITaTIvE DaTaAverage Maturity * 1.57 yearsModified Duration * 1.35 yearsyield to Maturity * 7.09%* Computed on the invested amount.
l TOTal ExpENSE raTIO (Weighted average for the month) €Regular 0.36%Direct 0.21%
€ Excluding Service Tax on Management Fees.
l BENCHMarK INDExCRISIl Short Term Bond Fund Index
l ENTrY lOaDnot Applicable.
l ExIT lOaDnil
l plaNSRegular plan, Direct plan
l OpTIONSunder Each plan: Growth, Fortnightly Dividend & normal Dividend. Both Dividend options offer payout and Reinvestment facilities.
l MINIMuM applICaTION aMOuNT (under each plan / Option)purchase : ` 5,000 and any amount thereafter. Additional purchase : ` 1,000 and any amount thereafter.
l rEDEMpTION prOCEEDSnormally despatched within 3-4 Business Days.
For Tax Benefits / Consequences, Please refer to page 46¥ Dedicated Fund Manager for overseas Investments: Mr Rakesh Vyas (Total Experience - over 12 years).
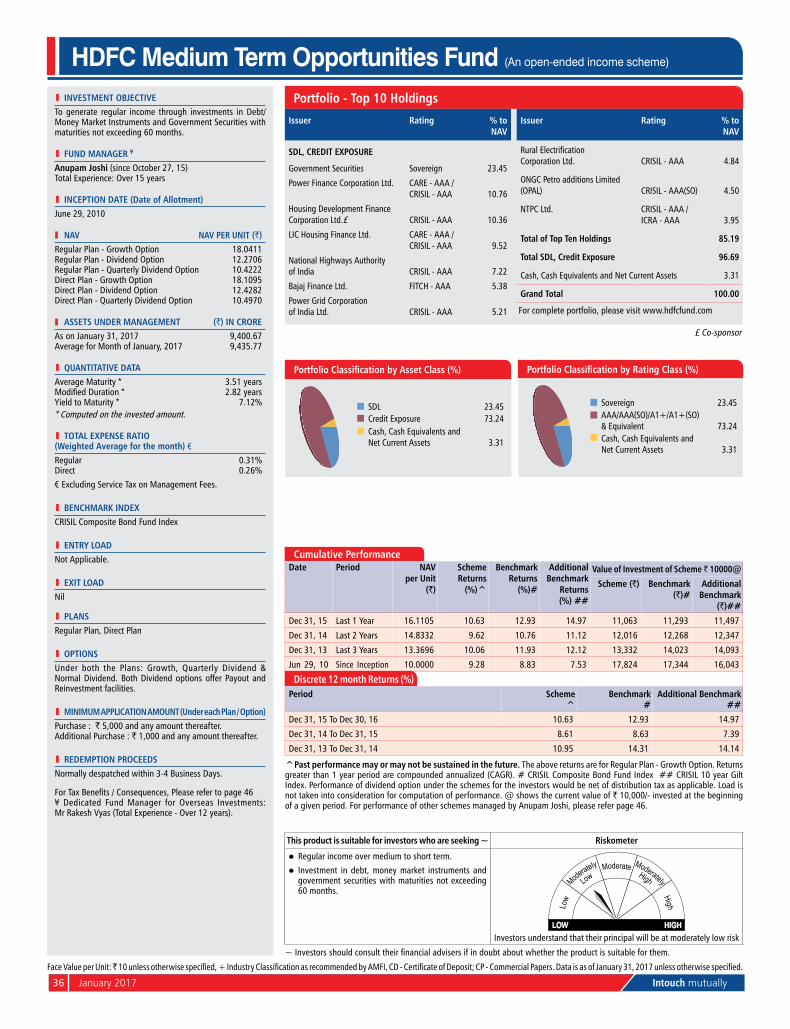
36 January 2017 Intouch mutually
l INvESTMENT OBjECTIvETo generate regular income through investments in Debt/ Money Market Instruments and Government Securities with maturities not exceeding 60 months.
l FuND MaNagEr ¥
anupam joshi (since october 27, 15) Total Experience: over 15 years
l INCEpTION DaTE (Date of allotment)June 29, 2010
Nav Nav pEr uNIT (`)Regular plan - Growth option 18.0411Regular plan - Dividend option 12.2706Regular plan - quarterly Dividend option 10.4222Direct plan - Growth option 18.1095Direct plan - Dividend option 12.4282Direct plan - quarterly Dividend option 10.4970
aSSETS uNDEr MaNagEMENT (`) IN CrOrEAs on January 31, 2017 9,400.67Average for Month of January, 2017 9,435.77
l quaNTITaTIvE DaTaAverage Maturity * 3.51 yearsModified Duration * 2.82 yearsyield to Maturity * 7.12%* Computed on the invested amount.
l TOTal ExpENSE raTIO (Weighted average for the month) €Regular 0.31%Direct 0.26%
€ Excluding Service Tax on Management Fees.
l BENCHMarK INDExCRISIl Composite Bond Fund Index
l ENTrY lOaDnot Applicable.
l ExIT lOaDnil
l plaNSRegular plan, Direct plan
l OpTIONSunder both the plans: Growth, quarterly Dividend & normal Dividend. Both Dividend options offer payout and Reinvestment facilities.
l MINIMuM applICaTION aMOuNT (under each plan / Option)purchase : ` 5,000 and any amount thereafter. Additional purchase : ` 1,000 and any amount thereafter.
l rEDEMpTION prOCEEDSnormally despatched within 3-4 Business Days.
For Tax Benefits / Consequences, Please refer to page 46¥ Dedicated Fund Manager for overseas Investments: Mr Rakesh Vyas (Total Experience - over 12 years).
HDFC Medium Term Opportunities Fund (An open-ended income scheme)
portfolio - Top 10 Holdings
This product is suitable for investors who are seeking ~ riskometer
l Regular income over medium to short term.l Investment in debt, money market instruments and
government securities with maturities not exceeding 60 months.
Investors understand that their principal will be at moderately low risk
~ Investors should consult their financial advisers if in doubt about whether the product is suitable for them.
Cumulative performanceDate period Nav
per unit (`)
Scheme returns
(%)^
Benchmark returns
(%)#
additional Benchmark
returns (%) ##
value of Investment of Scheme ̀ 10000@
Scheme (`) Benchmark (`)#
additional Benchmark
(`)##
Dec 31, 15 last 1 year 16.1105 10.63 12.93 14.97 11,063 11,293 11,497
Dec 31, 14 last 2 years 14.8332 9.62 10.76 11.12 12,016 12,268 12,347
Dec 31, 13 last 3 years 13.3696 10.06 11.93 12.12 13,332 14,023 14,093
Jun 29, 10 Since Inception 10.0000 9.28 8.83 7.53 17,824 17,344 16,043
Discrete 12 month returns (%)period Scheme
^Benchmark
#additional Benchmark
##
Dec 31, 15 To Dec 30, 16 10.63 12.93 14.97
Dec 31, 14 To Dec 31, 15 8.61 8.63 7.39
Dec 31, 13 To Dec 31, 14 10.95 14.31 14.14
^past performance may or may not be sustained in the future. The above returns are for Regular plan - Growth option. Returns greater than 1 year period are compounded annualized (CAGR). # CRISIl Composite Bond Fund Index ## CRISIl 10 year Gilt Index. performance of dividend option under the schemes for the investors would be net of distribution tax as applicable. load is not taken into consideration for computation of performance. @ shows the current value of ` 10,000/- invested at the beginning of a given period. For performance of other schemes managed by Anupam Joshi, please refer page 46.
Issuer rating % to Nav
SDl, CrEDIT ExpOSurE
Government Securities Sovereign 23.45
power Finance Corporation ltd. CARE - AAA / CRISIl - AAA 10.76
Housing Development Finance Corporation ltd.£ CRISIl - AAA 10.36
lIC Housing Finance ltd. CARE - AAA / CRISIl - AAA 9.52
national Highways Authority of India CRISIl - AAA 7.22
Bajaj Finance ltd. FITCH - AAA 5.38
power Grid Corporation of India ltd. CRISIl - AAA 5.21
Issuer rating % to Nav
Rural Electrification Corporation ltd. CRISIl - AAA 4.84
onGC petro additions limited (opAl) CRISIl - AAA(So) 4.50
nTpC ltd. CRISIl - AAA / ICRA - AAA 3.95
Total of Top Ten Holdings 85.19
Total SDl, Credit Exposure 96.69
Cash, Cash Equivalents and net Current Assets 3.31
grand Total 100.00
For complete portfolio, please visit www.hdfcfund.com
£ Co-sponsor
SDl 23.45Credit Exposure 73.24Cash, Cash Equivalents and net Current Assets 3.31
Portfolio Classification by Asset Class (%)
Face Value per unit: ̀ 10 unless otherwise specified, + Industry Classification as recommended by AMFI, CD - Certificate of Deposit; CP - Commercial Papers. Data is as of January 31, 2017 unless otherwise specified.
Sovereign 23.45AAA/AAA(SO)/A1+/A1+(SO) & Equivalent 73.24Cash, Cash Equivalents and net Current Assets 3.31
Portfolio Classification by Rating Class (%)

Intouch mutually January 2017 37
l INvESTMENT OBjECTIvETo generate credit risk-free returns through investments in sovereign securities issued by the Central Government and/or State Government.
l FuND MaNagEr ¥
anil Bamboli (since September 1, 07) Total Experience: over 22 years
l INCEpTION DaTE (Date of allotment)July 25, 2001
Nav Nav pEr uNIT (`)Regular plan - Growth option 27.2401Regular plan - Dividend option 11.3964Direct plan - Growth option 27.5615Direct plan - Dividend option 11.5597
aSSETS uNDEr MaNagEMENT (`) IN CrOrEAs on January 31, 2017 470.49Average for Month of January, 2017 518.63
l quaNTITaTIvE DaTaAverage Maturity * 5.55 yearsModified Duration * 4.22 yearsyield to Maturity * 6.58%* Computed on the invested amount.
l TOTal ExpENSE raTIO (Weighted average for the month) €Regular 0.38%Direct 0.13%
€ Excluding Service Tax on Management Fees.
l BENCHMarK INDExI-Sec Si-Bex
l ENTrY lOaDnot Applicable.
l ExIT lOaDnil
l plaNSRegular plan, Direct plan
l OpTIONSunder both the plans: Growth & Dividend option (Dividend option offers Dividend payout and Reinvestment facility.
l MINIMuM applICaTION aMOuNT (under each plan / Option)purchase : ` 5,000 and any amount thereafter. Additional purchase : ` 1,000 and any amount thereafter.
l rEDEMpTION prOCEEDSnormally despatched within 3-4 Business Days.
For Tax Benefits / Consequences, Please refer to page 46¥ Dedicated Fund Manager for overseas Investments: Mr Rakesh Vyas (Total Experience - over 12 years).
HDFC Gilt Fund Short Term Plan (An open-ended income scheme)
portfolio - Top 10 Holdings
Issuer rating % to Nav
g-SEC, SDl
7.68 GoI 2023 Sovereign 20.28
8.35 GoI 2022 Sovereign 17.12
7.35 GoI 2024 Sovereign 12.15
8.2 GoI 2022 Sovereign 11.33
7.16 GoI 2023 Sovereign 10.91
8.13 GoI 2022 Sovereign 5.67
8.08 GoI 2022 Sovereign 5.65
Issuer rating % to Nav
8.12 GoI 2020 Sovereign 4.49
State Government of Gujarat Sovereign 1.15
6.35 GoI 2020 Sovereign 1.06
Total of Top Ten Holdings 89.81
Total g-Sec, SDl 90.97
Cash, Cash Equivalents and net Current Assets 9.03
grand Total 100.00
For complete portfolio, please visit www.hdfcfund.com
This product is suitable for investors who are seeking ~ riskometer
l Credit risk free returns over short to medium term.l Investment in sovereign securities issued by Central
/ State Government with short to medium term maturities.
Investors understand that their principal will be at moderate risk
~ Investors should consult their financial advisers if in doubt about whether the product is suitable for them.
Cumulative performanceDate period Nav
per unit (`)
Scheme returns
(%)^
Benchmark returns
(%)#
additional Benchmark
returns (%) ##
value of Investment of Scheme ̀ 10000@
Scheme (`) Benchmark (`)#
additional Benchmark
(`)##
Dec 31, 15 last 1 year 24.1827 11.92 9.12 7.27 11,192 10,912 10,727
Dec 31, 14 last 2 years 22.2374 10.32 9.07 7.75 12,171 11,896 11,609
Dec 31, 13 last 3 years 20.1750 10.29 9.17 8.02 13,415 13,011 12,603
Jul 25, 01 Since Inception 10.0000 6.66 n.A. 6.11 27,065 n.A. 24,973
Discrete 12 month returns (%)period Scheme
^Benchmark
#additional Benchmark
##
Dec 31, 15 To Dec 30, 16 11.92 9.12 7.27
Dec 31, 14 To Dec 31, 15 8.75 9.02 8.22
Dec 31, 13 To Dec 31, 14 10.22 9.37 8.56
^past performance may or may not be sustained in the future. The above returns are for Regular plan - Growth option. Returns greater than 1 year period are compounded annualized (CAGR). # I-Sec Si-Bex ## CRISIl 1 year T-Bill Index. performance of dividend option under the schemes for the investors would be net of distribution tax as applicable. load is not taken into consideration for computation of performance. @ shows the current value of ` 10,000/- invested at the beginning of a given period. n.A.: not Available. For performance of other schemes managed by Anil Bamboli, please refer page 46.
G-Sec, SDl 90.97Cash, Cash Equivalents and net Current Assets 9.03
Portfolio Classification by Asset Class (%)
Sovereign 90.97Cash, Cash Equivalents and net Current Assets 9.03
Portfolio Classification by Rating Class (%)
Face Value per unit: ` 10 unless otherwise specified, + Industry Classification as recommended by AMFI, Data is as of January 31, 2017 unless otherwise specified.

38 January 2017 Intouch mutually
l INvESTMENT OBjECTIvETo generate credit risk-free returns through investments in sovereign securities issued by the Central Government and/or State Government.
l FuND MaNagEr ¥
anil Bamboli (since September 1, 07) Total Experience: over 22 years
l INCEpTION DaTE (Date of allotment)July 25, 2001
Nav Nav pEr uNIT (`)Regular plan - Growth option 34.3584Regular plan - Dividend option 11.4584Direct plan - Growth option 34.9238Direct plan - Dividend option 11.6920
aSSETS uNDEr MaNagEMENT (`) IN CrOrEAs on January 31, 2017 2,868.21Average for Month of January, 2017 2,977.18
l quaNTITaTIvE DaTaAverage Maturity * 16.51 yearsModified Duration * 8.26 yearsyield to Maturity * 7.00%* Computed on the invested amount.
l TOTal ExpENSE raTIO (Weighted average for the month) €Regular 0.82%Direct 0.37%
€ Excluding Service Tax on Management Fees.
l BENCHMarK INDExI-Sec li-Bex
l ENTrY lOaDnot Applicable.
l ExIT lOaDnil
l plaNSRegular plan, Direct plan
l OpTIONSunder both the plans: Growth & Dividend option (Dividend option offers Dividend payout and Reinvestment facility.
l MINIMuM applICaTION aMOuNT (under each plan / Option)purchase : ` 5,000 and any amount thereafter. Additional purchase : ` 1,000 and any amount thereafter.
l rEDEMpTION prOCEEDSnormally despatched within 3-4 Business Days.
For Tax Benefits / Consequences, Please refer to page 46¥ Dedicated Fund Manager for overseas Investments: Mr Rakesh Vyas (Total Experience - over 12 years).
HDFC Gilt Fund Long Term Plan (An open-ended income scheme)
portfolio - Top 10 Holdings
Issuer rating % to Nav
g-SEC, SDl
8.3 GoI 2040 Sovereign 16.38
8.24 GoI 2033 Sovereign 14.85
8.32 GoI 2032 Sovereign 9.55
State Government of Rajasthan Sovereign 8.51
7.73 GoI 2034 Sovereign 8.37
8.17 GoI 2044 Sovereign 7.79
8.08 GoI 2022 Sovereign 4.08
Issuer rating % to Nav
7.61 GoI 2030 Sovereign 3.19
8.3 GoI 2042 Sovereign 3.13
6.57 GoI 2033 Sovereign 3.07
Total of Top Ten Holdings 78.92
Total g-Sec, SDl 87.45
Cash, Cash Equivalents and net Current Assets 12.55
grand Total 100.00
For complete portfolio, please visit www.hdfcfund.com
This product is suitable for investors who are seeking ~ riskometer
l Credit risk free returns over medium to long term.l Investment in sovereign securities issued by Central /
State Government with medium to long term maturities.
Investors understand that their principal will be at moderate risk
~ Investors should consult their financial advisers if in doubt about whether the product is suitable for them.
Cumulative performanceDate period Nav
per unit (`)
Scheme returns
(%)^
Benchmark returns
(%)#
additional Benchmark
returns (%) ##
value of Investment of Scheme ̀ 10000@
Scheme (`) Benchmark (`)#
additional Benchmark
(`)##
Dec 31, 15 last 1 year 29.2066 16.57 16.76 14.97 11,657 11,676 11,497
Dec 31, 14 last 2 years 27.5777 11.11 12.03 11.12 12,345 12,550 12,347
Dec 31, 13 last 3 years 23.1688 13.69 14.54 12.12 14,694 15,027 14,093
Jul 25, 01 Since Inception 10.0000 8.26 n.A. n.A. 34,045 n.A. n.A.
Discrete 12 month returns (%)period Scheme
^Benchmark
#additional Benchmark
##
Dec 31, 15 To Dec 30, 16 16.57 16.76 14.97
Dec 31, 14 To Dec 31, 15 5.91 7.48 7.39
Dec 31, 13 To Dec 31, 14 19.03 19.74 14.14
^past performance may or may not be sustained in the future. The above returns are for Regular plan - Growth option. Returns greater than 1 year period are compounded annualized (CAGR). # I-Sec li-Bex ## CRISIl 10 year Gilt Index. performance of dividend option under the schemes for the investors would be net of distribution tax as applicable. load is not taken into consideration for computation of performance. @ shows the current value of ` 10,000/- invested at the beginning of a given period. n.A.: not Available. For performance of other schemes managed by Anil Bamboli, please refer page 46.
G-Sec, SDl 87.45Cash, Cash Equivalents and net Current Assets 12.55
Portfolio Classification by Asset Class (%)
Sovereign 87.45Cash, Cash Equivalents and net Current Assets 12.55
Portfolio Classification by Rating Class (%)
Face Value per unit: ` 10 unless otherwise specified, + Industry Classification as recommended by AMFI, Data is as of January 31, 2017 unless otherwise specified.
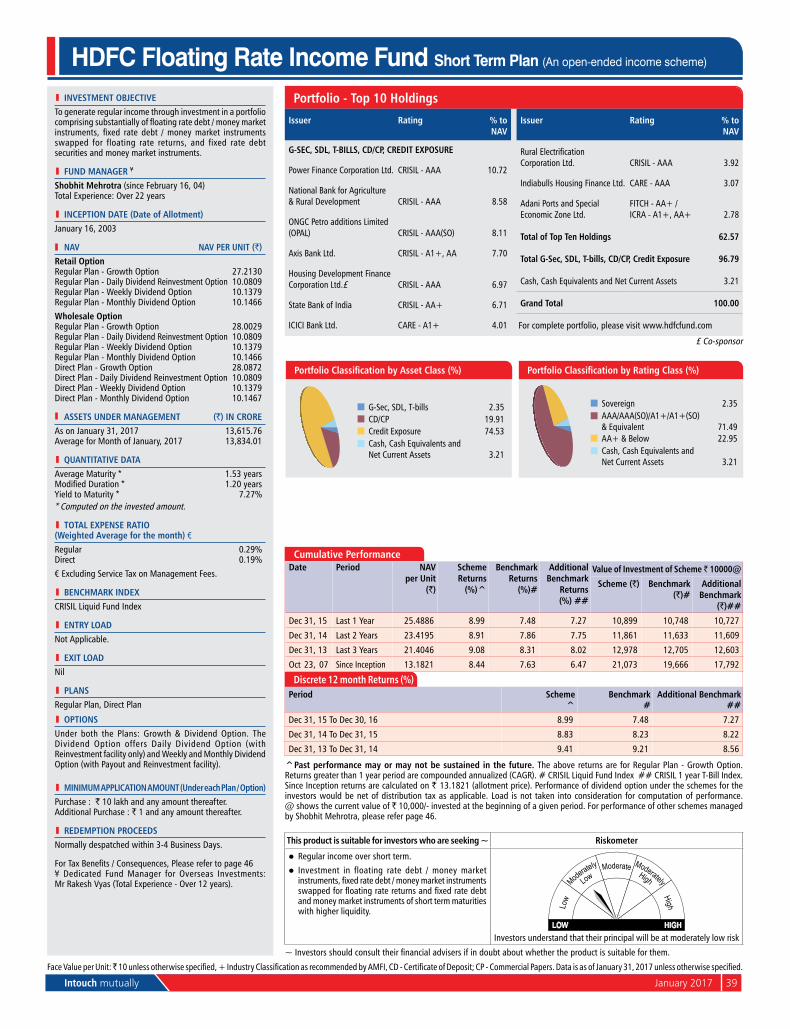
Intouch mutually January 2017 39
l INvESTMENT OBjECTIvETo generate regular income through investment in a portfolio comprising substantially of floating rate debt / money market instruments, fixed rate debt / money market instruments swapped for floating rate returns, and fixed rate debt securities and money market instruments.
l FuND MaNagEr ¥
Shobhit Mehrotra (since February 16, 04) Total Experience: over 22 years
l INCEpTION DaTE (Date of allotment)January 16, 2003
Nav Nav pEr uNIT (`)retail OptionRegular plan - Growth option 27.2130Regular plan - Daily Dividend Reinvestment option 10.0809Regular plan - Weekly Dividend option 10.1379Regular plan - Monthly Dividend option 10.1466Wholesale OptionRegular plan - Growth option 28.0029Regular plan - Daily Dividend Reinvestment option 10.0809Regular plan - Weekly Dividend option 10.1379Regular plan - Monthly Dividend option 10.1466Direct plan - Growth option 28.0872Direct plan - Daily Dividend Reinvestment option 10.0809Direct plan - Weekly Dividend option 10.1379Direct plan - Monthly Dividend option 10.1467
aSSETS uNDEr MaNagEMENT (`) IN CrOrEAs on January 31, 2017 13,615.76Average for Month of January, 2017 13,834.01
l quaNTITaTIvE DaTaAverage Maturity * 1.53 yearsModified Duration * 1.20 yearsyield to Maturity * 7.27%* Computed on the invested amount.
l TOTal ExpENSE raTIO (Weighted average for the month) €Regular 0.29%Direct 0.19%
€ Excluding Service Tax on Management Fees.
l BENCHMarK INDExCRISIl liquid Fund Index
l ENTrY lOaDnot Applicable.
l ExIT lOaDnil
l plaNSRegular plan, Direct plan
l OpTIONSunder both the plans: Growth & Dividend option. The Dividend option offers Daily Dividend option (with Reinvestment facility only) and Weekly and Monthly Dividend option (with payout and Reinvestment facility).
l MINIMuM applICaTION aMOuNT (under each plan / Option)purchase : ` 10 lakh and any amount thereafter. Additional purchase : ` 1 and any amount thereafter.
l rEDEMpTION prOCEEDSnormally despatched within 3-4 Business Days.
For Tax Benefits / Consequences, Please refer to page 46¥ Dedicated Fund Manager for overseas Investments: Mr Rakesh Vyas (Total Experience - over 12 years).
HDFC Floating Rate Income Fund Short Term Plan (An open-ended income scheme)
portfolio - Top 10 Holdings
This product is suitable for investors who are seeking ~ riskometer
l Regular income over short term.l Investment in floating rate debt / money market
instruments, fixed rate debt / money market instruments swapped for floating rate returns and fixed rate debt and money market instruments of short term maturities with higher liquidity.
Investors understand that their principal will be at moderately low risk
~ Investors should consult their financial advisers if in doubt about whether the product is suitable for them.
Issuer rating % to Nav
g-SEC, SDl, T-BIllS, CD/Cp, CrEDIT ExpOSurE
power Finance Corporation ltd. CRISIl - AAA 10.72
national Bank for Agriculture & Rural Development CRISIl - AAA 8.58
onGC petro additions limited (opAl) CRISIl - AAA(So) 8.11
Axis Bank ltd. CRISIL - A1+, AA 7.70
Housing Development Finance Corporation ltd.£ CRISIl - AAA 6.97
State Bank of India CRISIL - AA+ 6.71
ICICI Bank ltd. CARE - A1+ 4.01
Issuer rating % to Nav
Rural Electrification Corporation ltd. CRISIl - AAA 3.92
Indiabulls Housing Finance ltd. CARE - AAA 3.07
Adani ports and Special Economic Zone ltd.
FITCH - AA+ / ICRA - A1+, AA+ 2.78
Total of Top Ten Holdings 62.57
Total g-Sec, SDl, T-bills, CD/Cp, Credit Exposure 96.79
Cash, Cash Equivalents and net Current Assets 3.21
grand Total 100.00
For complete portfolio, please visit www.hdfcfund.com
£ Co-sponsor
Face Value per unit: ̀ 10 unless otherwise specified, + Industry Classification as recommended by AMFI, CD - Certificate of Deposit; CP - Commercial Papers. Data is as of January 31, 2017 unless otherwise specified.
Cumulative performanceDate period Nav
per unit (`)
Scheme returns
(%)^
Benchmark returns
(%)#
additional Benchmark
returns (%) ##
value of Investment of Scheme ̀ 10000@
Scheme (`) Benchmark (`)#
additional Benchmark
(`)##
Dec 31, 15 last 1 year 25.4886 8.99 7.48 7.27 10,899 10,748 10,727
Dec 31, 14 last 2 years 23.4195 8.91 7.86 7.75 11,861 11,633 11,609
Dec 31, 13 last 3 years 21.4046 9.08 8.31 8.02 12,978 12,705 12,603
oct 23, 07 Since Inception 13.1821 8.44 7.63 6.47 21,073 19,666 17,792
Discrete 12 month returns (%)period Scheme
^Benchmark
#additional Benchmark
##
Dec 31, 15 To Dec 30, 16 8.99 7.48 7.27
Dec 31, 14 To Dec 31, 15 8.83 8.23 8.22
Dec 31, 13 To Dec 31, 14 9.41 9.21 8.56
^past performance may or may not be sustained in the future. The above returns are for Regular plan - Growth option. Returns greater than 1 year period are compounded annualized (CAGR). # CRISIl liquid Fund Index ## CRISIl 1 year T-Bill Index. Since Inception returns are calculated on ` 13.1821 (allotment price). performance of dividend option under the schemes for the investors would be net of distribution tax as applicable. load is not taken into consideration for computation of performance. @ shows the current value of ` 10,000/- invested at the beginning of a given period. For performance of other schemes managed by Shobhit Mehrotra, please refer page 46.
G-Sec, SDl, T-bills 2.35CD/Cp 19.91Credit Exposure 74.53Cash, Cash Equivalents and net Current Assets 3.21
Portfolio Classification by Asset Class (%)
Sovereign 2.35AAA/AAA(SO)/A1+/A1+(SO) & Equivalent 71.49AA+ & Below 22.95Cash, Cash Equivalents and net Current Assets 3.21
Portfolio Classification by Rating Class (%)
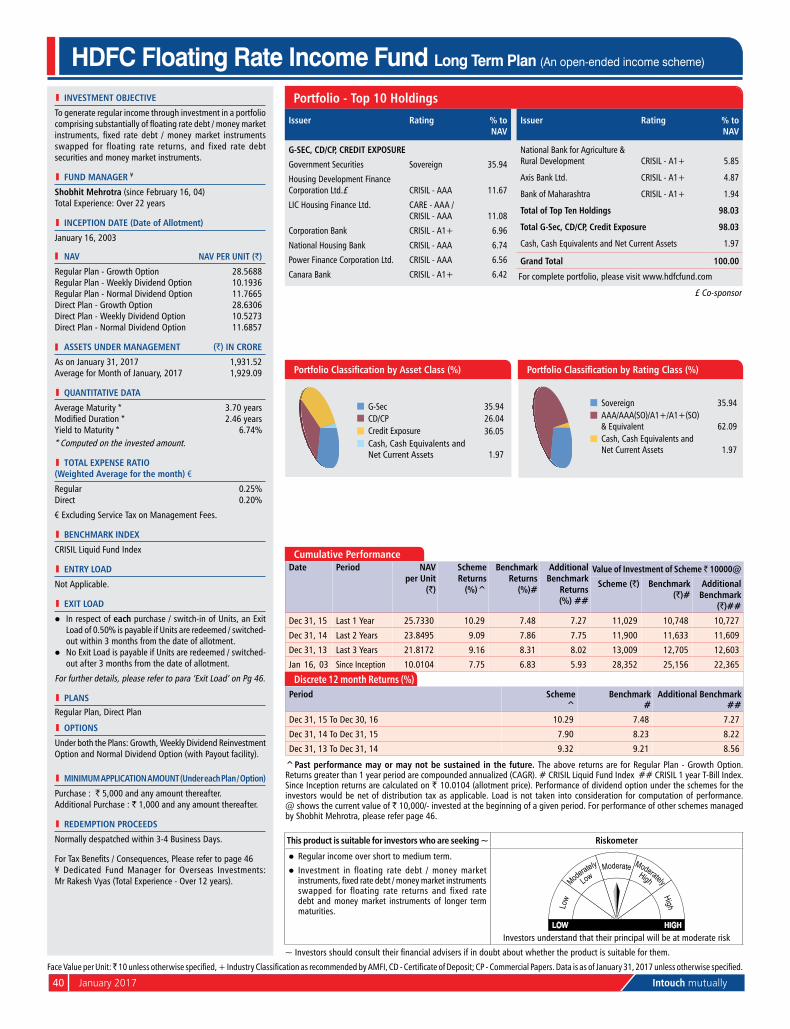
40 January 2017 Intouch mutually
l INvESTMENT OBjECTIvE
To generate regular income through investment in a portfolio comprising substantially of floating rate debt / money market instruments, fixed rate debt / money market instruments swapped for floating rate returns, and fixed rate debt securities and money market instruments.
l FuND MaNagEr ¥
Shobhit Mehrotra (since February 16, 04)
Total Experience: over 22 years
l INCEpTION DaTE (Date of allotment)
January 16, 2003
Nav Nav pEr uNIT (`)
Regular plan - Growth option 28.5688Regular plan - Weekly Dividend option 10.1936Regular plan - normal Dividend option 11.7665Direct plan - Growth option 28.6306Direct plan - Weekly Dividend option 10.5273Direct plan - normal Dividend option 11.6857
aSSETS uNDEr MaNagEMENT (`) IN CrOrE
As on January 31, 2017 1,931.52Average for Month of January, 2017 1,929.09
l quaNTITaTIvE DaTa
Average Maturity * 3.70 yearsModified Duration * 2.46 yearsyield to Maturity * 6.74%* Computed on the invested amount.
l TOTal ExpENSE raTIO (Weighted average for the month) €
Regular 0.25%Direct 0.20%
€ Excluding Service Tax on Management Fees.
l BENCHMarK INDEx
CRISIl liquid Fund Index
l ENTrY lOaD
not Applicable.
l ExIT lOaD
l In respect of each purchase / switch-in of units, an Exit load of 0.50% is payable if units are redeemed / switched-out within 3 months from the date of allotment.
l no Exit load is payable if units are redeemed / switched-out after 3 months from the date of allotment.
For further details, please refer to para ‘Exit load’ on pg 46.
l plaNSRegular plan, Direct plan
l OpTIONS
under both the plans: Growth, Weekly Dividend Reinvestment option and normal Dividend option (with payout facility).
l MINIMuM applICaTION aMOuNT (under each plan / Option)
purchase : ` 5,000 and any amount thereafter. Additional purchase : ` 1,000 and any amount thereafter.
l rEDEMpTION prOCEEDS
normally despatched within 3-4 Business Days.
For Tax Benefits / Consequences, Please refer to page 46¥ Dedicated Fund Manager for overseas Investments: Mr Rakesh Vyas (Total Experience - over 12 years).
HDFC Floating Rate Income Fund Long Term Plan (An open-ended income scheme)
portfolio - Top 10 Holdings
Issuer rating % to Nav
g-SEC, CD/Cp, CrEDIT ExpOSurE
Government Securities Sovereign 35.94
Housing Development Finance Corporation ltd.£ CRISIl - AAA 11.67
lIC Housing Finance ltd. CARE - AAA / CRISIl - AAA 11.08
Corporation Bank CRISIL - A1+ 6.96
national Housing Bank CRISIl - AAA 6.74
power Finance Corporation ltd. CRISIl - AAA 6.56
Canara Bank CRISIL - A1+ 6.42
Issuer rating % to Nav
national Bank for Agriculture & Rural Development CRISIL - A1+ 5.85
Axis Bank ltd. CRISIL - A1+ 4.87
Bank of Maharashtra CRISIL - A1+ 1.94
Total of Top Ten Holdings 98.03
Total g-Sec, CD/Cp, Credit Exposure 98.03
Cash, Cash Equivalents and net Current Assets 1.97
grand Total 100.00
For complete portfolio, please visit www.hdfcfund.com
This product is suitable for investors who are seeking ~ riskometer
l Regular income over short to medium term.l Investment in floating rate debt / money market
instruments, fixed rate debt / money market instruments swapped for floating rate returns and fixed rate debt and money market instruments of longer term maturities.
Investors understand that their principal will be at moderate risk
~ Investors should consult their financial advisers if in doubt about whether the product is suitable for them.
G-Sec 35.94CD/Cp 26.04Credit Exposure 36.05Cash, Cash Equivalents and net Current Assets 1.97
Portfolio Classification by Asset Class (%)
Sovereign 35.94AAA/AAA(SO)/A1+/A1+(SO) & Equivalent 62.09Cash, Cash Equivalents and net Current Assets 1.97
Portfolio Classification by Rating Class (%)
Face Value per unit: ̀ 10 unless otherwise specified, + Industry Classification as recommended by AMFI, CD - Certificate of Deposit; CP - Commercial Papers. Data is as of January 31, 2017 unless otherwise specified.
Cumulative performanceDate period Nav
per unit (`)
Scheme returns
(%)^
Benchmark returns
(%)#
additional Benchmark
returns (%) ##
value of Investment of Scheme ̀ 10000@
Scheme (`) Benchmark (`)#
additional Benchmark
(`)##
Dec 31, 15 last 1 year 25.7330 10.29 7.48 7.27 11,029 10,748 10,727
Dec 31, 14 last 2 years 23.8495 9.09 7.86 7.75 11,900 11,633 11,609
Dec 31, 13 last 3 years 21.8172 9.16 8.31 8.02 13,009 12,705 12,603
Jan 16, 03 Since Inception 10.0104 7.75 6.83 5.93 28,352 25,156 22,365
Discrete 12 month returns (%)period Scheme
^Benchmark
#additional Benchmark
##
Dec 31, 15 To Dec 30, 16 10.29 7.48 7.27
Dec 31, 14 To Dec 31, 15 7.90 8.23 8.22
Dec 31, 13 To Dec 31, 14 9.32 9.21 8.56
^past performance may or may not be sustained in the future. The above returns are for Regular plan - Growth option. Returns greater than 1 year period are compounded annualized (CAGR). # CRISIl liquid Fund Index ## CRISIl 1 year T-Bill Index. Since Inception returns are calculated on ` 10.0104 (allotment price). performance of dividend option under the schemes for the investors would be net of distribution tax as applicable. load is not taken into consideration for computation of performance. @ shows the current value of ` 10,000/- invested at the beginning of a given period. For performance of other schemes managed by Shobhit Mehrotra, please refer page 46.
£ Co-sponsor
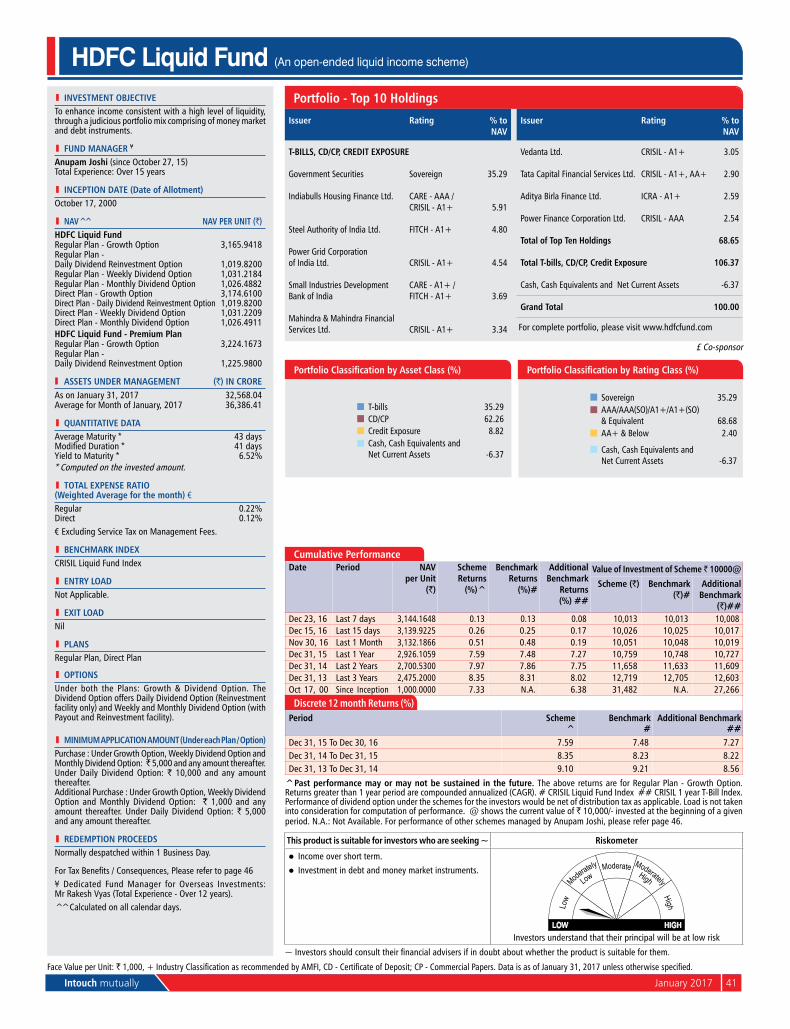
Intouch mutually January 2017 41
l INvESTMENT OBjECTIvETo enhance income consistent with a high level of liquidity, through a judicious portfolio mix comprising of money market and debt instruments.
l FuND MaNagEr ¥
anupam joshi (since october 27, 15) Total Experience: over 15 years
l INCEpTION DaTE (Date of allotment)october 17, 2000
l Nav^̂ Nav pEr uNIT (`)HDFC liquid FundRegular plan - Growth option 3,165.9418Regular plan - Daily Dividend Reinvestment option 1,019.8200Regular plan - Weekly Dividend option 1,031.2184Regular plan - Monthly Dividend option 1,026.4882Direct plan - Growth option 3,174.6100Direct plan - Daily Dividend Reinvestment option 1,019.8200Direct plan - Weekly Dividend option 1,031.2209Direct plan - Monthly Dividend option 1,026.4911HDFC liquid Fund - premium planRegular plan - Growth option 3,224.1673Regular plan - Daily Dividend Reinvestment option 1,225.9800
aSSETS uNDEr MaNagEMENT (`) IN CrOrEAs on January 31, 2017 32,568.04Average for Month of January, 2017 36,386.41
l quaNTITaTIvE DaTaAverage Maturity * 43 daysModified Duration * 41 daysyield to Maturity * 6.52%* Computed on the invested amount.
l TOTal ExpENSE raTIO (Weighted average for the month) €Regular 0.22%Direct 0.12%€ Excluding Service Tax on Management Fees.
l BENCHMarK INDExCRISIl liquid Fund Index
l ENTrY lOaDnot Applicable.
l ExIT lOaDnil
l plaNSRegular plan, Direct plan
l OpTIONSunder both the plans: Growth & Dividend option. The Dividend option offers Daily Dividend option (Reinvestment facility only) and Weekly and Monthly Dividend option (with payout and Reinvestment facility).
l MINIMuM applICaTION aMOuNT (under each plan / Option)purchase : under Growth option, Weekly Dividend option and Monthly Dividend option: ̀ 5,000 and any amount thereafter. under Daily Dividend option: ` 10,000 and any amount thereafter.Additional purchase : under Growth option, Weekly Dividend option and Monthly Dividend option: ` 1,000 and any amount thereafter. under Daily Dividend option: ` 5,000 and any amount thereafter.
l rEDEMpTION prOCEEDSnormally despatched within 1 Business Day.
For Tax Benefits / Consequences, Please refer to page 46¥ Dedicated Fund Manager for overseas Investments: Mr Rakesh Vyas (Total Experience - over 12 years).^̂ Calculated on all calendar days.
HDFC Liquid Fund (An open-ended liquid income scheme)
portfolio - Top 10 Holdings
Issuer rating % to Nav
T-BIllS, CD/Cp, CrEDIT ExpOSurE
Government Securities Sovereign 35.29
Indiabulls Housing Finance ltd. CARE - AAA / CRISIL - A1+ 5.91
Steel Authority of India ltd. FITCH - A1+ 4.80
power Grid Corporation of India ltd. CRISIL - A1+ 4.54
Small Industries Development Bank of India
CARE - A1+ / FITCH - A1+ 3.69
Mahindra & Mahindra Financial Services ltd. CRISIL - A1+ 3.34
Issuer rating % to Nav
Vedanta ltd. CRISIL - A1+ 3.05
Tata Capital Financial Services ltd. CRISIL - A1+, AA+ 2.90
Aditya Birla Finance ltd. ICRA - A1+ 2.59
power Finance Corporation ltd. CRISIl - AAA 2.54
Total of Top Ten Holdings 68.65
Total T-bills, CD/Cp, Credit Exposure 106.37
Cash, Cash Equivalents and net Current Assets -6.37
grand Total 100.00
For complete portfolio, please visit www.hdfcfund.com
This product is suitable for investors who are seeking ~ riskometer
l Income over short term.l Investment in debt and money market instruments.
Investors understand that their principal will be at low risk
~ Investors should consult their financial advisers if in doubt about whether the product is suitable for them.
Face Value per unit: ` 1,000, + Industry Classification as recommended by AMFI, CD - Certificate of Deposit; CP - Commercial Papers. Data is as of January 31, 2017 unless otherwise specified.
Cumulative performanceDate period Nav
per unit (`)
Scheme returns
(%)^
Benchmark returns
(%)#
additional Benchmark
returns (%) ##
value of Investment of Scheme ̀ 10000@
Scheme (`) Benchmark (`)#
additional Benchmark
(`)##Dec 23, 16 last 7 days 3,144.1648 0.13 0.13 0.08 10,013 10,013 10,008Dec 15, 16 last 15 days 3,139.9225 0.26 0.25 0.17 10,026 10,025 10,017nov 30, 16 last 1 Month 3,132.1866 0.51 0.48 0.19 10,051 10,048 10,019Dec 31, 15 last 1 year 2,926.1059 7.59 7.48 7.27 10,759 10,748 10,727Dec 31, 14 last 2 years 2,700.5300 7.97 7.86 7.75 11,658 11,633 11,609Dec 31, 13 last 3 years 2,475.2000 8.35 8.31 8.02 12,719 12,705 12,603oct 17, 00 Since Inception 1,000.0000 7.33 n.A. 6.38 31,482 n.A. 27,266
Discrete 12 month returns (%)period Scheme
^Benchmark
#additional Benchmark
##Dec 31, 15 To Dec 30, 16 7.59 7.48 7.27Dec 31, 14 To Dec 31, 15 8.35 8.23 8.22Dec 31, 13 To Dec 31, 14 9.10 9.21 8.56
^past performance may or may not be sustained in the future. The above returns are for Regular plan - Growth option. Returns greater than 1 year period are compounded annualized (CAGR). # CRISIl liquid Fund Index ## CRISIl 1 year T-Bill Index. performance of dividend option under the schemes for the investors would be net of distribution tax as applicable. load is not taken into consideration for computation of performance. @ shows the current value of ` 10,000/- invested at the beginning of a given period. n.A.: not Available. For performance of other schemes managed by Anupam Joshi, please refer page 46.
T-bills 35.29CD/Cp 62.26Credit Exposure 8.82Cash, Cash Equivalents and net Current Assets -6.37
Portfolio Classification by Asset Class (%)
Sovereign 35.29AAA/AAA(SO)/A1+/A1+(SO) & Equivalent 68.68AA+ & Below 2.40
Cash, Cash Equivalents and net Current Assets -6.37
Portfolio Classification by Rating Class (%)
£ Co-sponsor
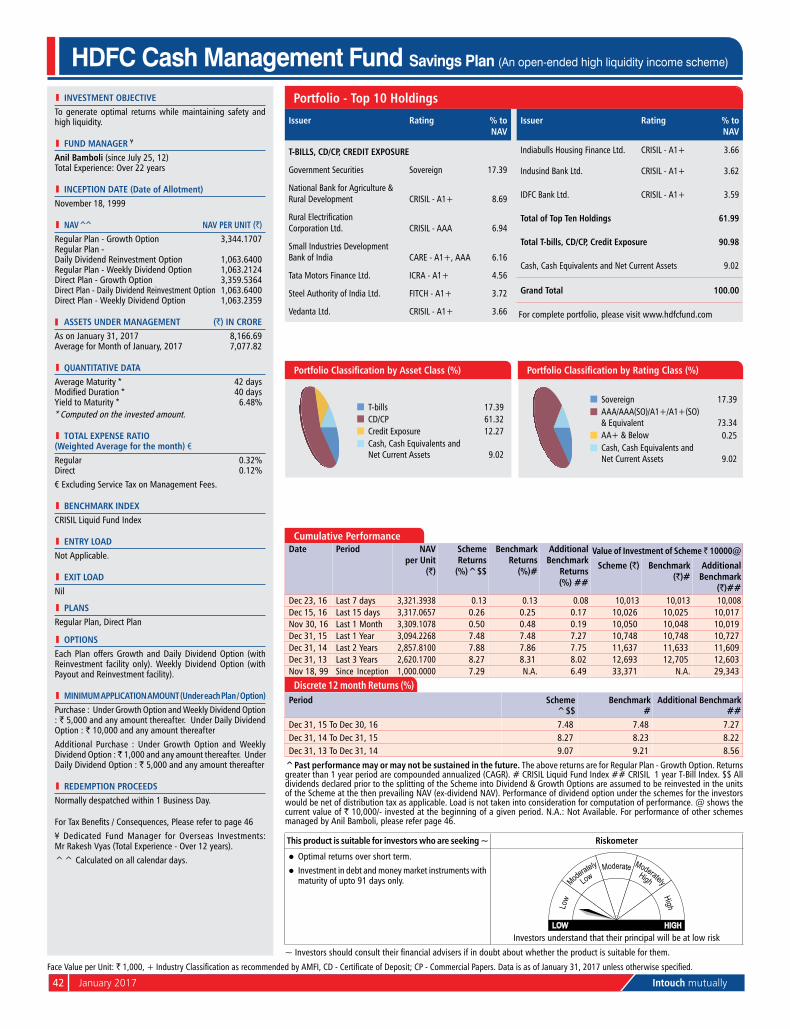
42 January 2017 Intouch mutually
l INvESTMENT OBjECTIvETo generate optimal returns while maintaining safety and high liquidity.
l FuND MaNagEr ¥
anil Bamboli (since July 25, 12) Total Experience: over 22 years
l INCEpTION DaTE (Date of allotment)november 18, 1999
l Nav^̂ Nav pEr uNIT (`)Regular plan - Growth option 3,344.1707Regular plan - Daily Dividend Reinvestment option 1,063.6400Regular plan - Weekly Dividend option 1,063.2124Direct plan - Growth option 3,359.5364Direct plan - Daily Dividend Reinvestment option 1,063.6400Direct plan - Weekly Dividend option 1,063.2359
aSSETS uNDEr MaNagEMENT (`) IN CrOrEAs on January 31, 2017 8,166.69Average for Month of January, 2017 7,077.82
l quaNTITaTIvE DaTaAverage Maturity * 42 daysModified Duration * 40 daysyield to Maturity * 6.48%* Computed on the invested amount.
l TOTal ExpENSE raTIO (Weighted average for the month) €Regular 0.32%Direct 0.12%
€ Excluding Service Tax on Management Fees.
l BENCHMarK INDExCRISIl liquid Fund Index
l ENTrY lOaDnot Applicable.
l ExIT lOaDnil
l plaNSRegular plan, Direct plan
l OpTIONSEach plan offers Growth and Daily Dividend option (with Reinvestment facility only). Weekly Dividend option (with payout and Reinvestment facility).
l MINIMuM applICaTION aMOuNT (under each plan / Option)purchase : under Growth option and Weekly Dividend option : ` 5,000 and any amount thereafter. under Daily Dividend option : ` 10,000 and any amount thereafterAdditional purchase : under Growth option and Weekly Dividend option : ̀ 1,000 and any amount thereafter. under Daily Dividend option : ` 5,000 and any amount thereafter
l rEDEMpTION prOCEEDSnormally despatched within 1 Business Day.
For Tax Benefits / Consequences, Please refer to page 46¥ Dedicated Fund Manager for overseas Investments: Mr Rakesh Vyas (Total Experience - over 12 years).
^^ Calculated on all calendar days.
HDFC Cash Management Fund Savings Plan (An open-ended high liquidity income scheme)
portfolio - Top 10 Holdings
Issuer rating % to Nav
T-BIllS, CD/Cp, CrEDIT ExpOSurE
Government Securities Sovereign 17.39
national Bank for Agriculture & Rural Development CRISIL - A1+ 8.69
Rural Electrification Corporation ltd. CRISIl - AAA 6.94
Small Industries Development Bank of India CARE - A1+, AAA 6.16
Tata Motors Finance ltd. ICRA - A1+ 4.56
Steel Authority of India ltd. FITCH - A1+ 3.72
Vedanta ltd. CRISIL - A1+ 3.66
Issuer rating % to Nav
Indiabulls Housing Finance ltd. CRISIL - A1+ 3.66
Indusind Bank ltd. CRISIL - A1+ 3.62
IDFC Bank ltd. CRISIL - A1+ 3.59
Total of Top Ten Holdings 61.99
Total T-bills, CD/Cp, Credit Exposure 90.98
Cash, Cash Equivalents and net Current Assets 9.02
grand Total 100.00
For complete portfolio, please visit www.hdfcfund.com
This product is suitable for investors who are seeking ~ riskometer
l optimal returns over short term.l Investment in debt and money market instruments with
maturity of upto 91 days only.
Investors understand that their principal will be at low risk
~ Investors should consult their financial advisers if in doubt about whether the product is suitable for them.
Cumulative performanceDate period Nav
per unit (`)
Scheme returns
(%)^$$
Benchmark returns
(%)#
additional Benchmark
returns (%) ##
value of Investment of Scheme ̀ 10000@
Scheme (`) Benchmark (`)#
additional Benchmark
(`)##Dec 23, 16 last 7 days 3,321.3938 0.13 0.13 0.08 10,013 10,013 10,008Dec 15, 16 last 15 days 3,317.0657 0.26 0.25 0.17 10,026 10,025 10,017nov 30, 16 last 1 Month 3,309.1078 0.50 0.48 0.19 10,050 10,048 10,019Dec 31, 15 last 1 year 3,094.2268 7.48 7.48 7.27 10,748 10,748 10,727Dec 31, 14 last 2 years 2,857.8100 7.88 7.86 7.75 11,637 11,633 11,609Dec 31, 13 last 3 years 2,620.1700 8.27 8.31 8.02 12,693 12,705 12,603nov 18, 99 Since Inception 1,000.0000 7.29 n.A. 6.49 33,371 n.A. 29,343
Discrete 12 month returns (%)period Scheme
^$$Benchmark
#additional Benchmark
##Dec 31, 15 To Dec 30, 16 7.48 7.48 7.27Dec 31, 14 To Dec 31, 15 8.27 8.23 8.22Dec 31, 13 To Dec 31, 14 9.07 9.21 8.56
^past performance may or may not be sustained in the future. The above returns are for Regular plan - Growth option. Returns greater than 1 year period are compounded annualized (CAGR). # CRISIl liquid Fund Index ## CRISIl 1 year T-Bill Index. $$ All dividends declared prior to the splitting of the Scheme into Dividend & Growth options are assumed to be reinvested in the units of the Scheme at the then prevailing nAV (ex-dividend nAV). performance of dividend option under the schemes for the investors would be net of distribution tax as applicable. load is not taken into consideration for computation of performance. @ shows the current value of ` 10,000/- invested at the beginning of a given period. n.A.: not Available. For performance of other schemes managed by Anil Bamboli, please refer page 46.
Face Value per unit: ` 1,000, + Industry Classification as recommended by AMFI, CD - Certificate of Deposit; CP - Commercial Papers. Data is as of January 31, 2017 unless otherwise specified.
T-bills 17.39CD/Cp 61.32Credit Exposure 12.27Cash, Cash Equivalents and net Current Assets 9.02
Portfolio Classification by Asset Class (%)
Sovereign 17.39AAA/AAA(SO)/A1+/A1+(SO) & Equivalent 73.34AA+ & Below 0.25Cash, Cash Equivalents and net Current Assets 9.02
Portfolio Classification by Rating Class (%)

Intouch mutually January 2017 43
l INvESTMENT OBjECTIvETo generate regular income through investment in debt securities and money market instruments.
l FuND MaNagEr ¥
anupam joshi (since october 27, 15) Total Experience: over 15 years
l INCEpTION DaTE (Date of allotment)november 18, 1999
l Nav Nav pEr uNIT (`)retail OptionRegular plan - Growth option 34.0925Regular plan - Daily Dividend Reinvestment option 10.1428Regular plan - Weekly Dividend option 10.1604Regular plan - Monthly Dividend option 10.1424Direct plan - Growth option 35.1125Direct plan - Daily Dividend Reinvestment option 10.0655Direct plan - Weekly Dividend option 10.1901Direct plan - Monthly Dividend option 10.1451Wholesale OptionRegular plan - Growth option 35.7438Regular plan - Daily Dividend Reinvestment option 10.1574Regular plan - Weekly Dividend option 10.1620Regular plan - Monthly Dividend option 10.1625
aSSETS uNDEr MaNagEMENT (`) IN CrOrEAs on January 31, 2017 12,351.27Average for Month of January, 2017 12,181.54
l quaNTITaTIvE DaTaAverage Maturity * 1.84 yearsModified Duration * 1.48 yearsyield to Maturity * 7.47%* Computed on the invested amount.
l TOTal ExpENSE raTIO (Weighted average for the month) €Regular 0.95%Direct 0.25%€ Excluding Service Tax on Management Fees.
l BENCHMarK INDExCRISIl liquid Fund Index
l ENTrY lOaDnot Applicable.
l ExIT lOaDnil
l plaNSRegular plan, Direct plan
l OpTIONSretail Option: Each plan offers Growth and Dividend option. Dividend option offers Daily Dividend option with Reinvestment facility only and Weekly and Monthly Dividend option with payout and Reinvestment facility.
l MINIMuM applICaTION aMOuNT (under each plan / Option)retail Option : Growth, Weekly and Monthly Dividend option: purchase : ` 5,000 and any amount thereafter. Additional purchase : ̀ 1,000 and any amount thereafter. Daily Dividend option : purchase : ` 10,000 and any amount thereafter. Additional purchase : ` 5,000 and any amount thereafter.
l rEDEMpTION prOCEEDSnormally despatched within 3-4 Business Days.
For Tax Benefits / Consequences, Please refer to page 46¥ Dedicated Fund Manager for overseas Investments: Mr Rakesh Vyas (Total Experience - over 12 years).^^ Calculated on all calendar days.
HDFC Cash Management Fund Treasury Advantage Plan (An open-ended income scheme)
portfolio - Top 10 Holdings
This product is suitable for investors who are seeking ~ riskometer
l Regular income over short term.l Investment in debt and money market instruments.
Investors understand that their principal will be at moderately low risk
~ Investors should consult their financial advisers if in doubt about whether the product is suitable for them.
Cumulative performanceDate period Nav
per unit (`)
Scheme returns
(%)^
Benchmark returns
(%)#
additional Benchmark
returns (%) ##
value of Investment of Scheme ̀ 10000@
Scheme (`) Benchmark (`)#
additional Benchmark
(`)##
Dec 31, 15 last 1 year 31.1351 8.62 7.48 7.27 10,862 10,748 10,727
Dec 31, 14 last 2 years 28.9181 8.14 7.86 7.75 11,694 11,633 11,609
Dec 31, 13 last 3 years 26.6762 8.23 8.31 8.02 12,677 12,705 12,603
nov 18, 99 Since Inception 10.0000 7.37 n.A. 6.49 33,818 n.A. 29,343
Discrete 12 month returns (%)period Scheme
^Benchmark
#additional Benchmark
##
Dec 31, 15 To Dec 30, 16 8.62 7.48 7.27
Dec 31, 14 To Dec 31, 15 7.67 8.23 8.22
Dec 31, 13 To Dec 31, 14 8.40 9.21 8.56
^past performance may or may not be sustained in the future. The above returns are for Regular plan - Growth option. Returns greater than 1 year period are compounded annualized (CAGR). # CRISIl liquid Fund Index ## CRISIl 1 year T-Bill Index. performance of dividend option under the schemes for the investors would be net of distribution tax as applicable. load is not taken into consideration for computation of performance. @ shows the current value of ` 10,000/- invested at the beginning of a given period. n.A.: not Available. For performance of other schemes managed by Anupam Joshi, please refer page 46.
Issuer rating % to Nav
g-SEC, SDl, CD/Cp, CrEDIT ExpOSurE
power Finance Corporation ltd. CRISIl - AAA 9.14
onGC petro Additions limited (opAl) CRISIl - AAA(So) 6.91
national Bank for Agriculture & Rural Development CRISIL - A1+, AAA 6.41
State Bank of India CRISIL - AA+, AAA 5.27
Government Securities Sovereign 5.00
Housing Development Finance Corporation ltd.£ CRISIl - AAA 4.56
Issuer rating % to Nav
Rural Electrification Corporation ltd. CRISIl - AAA 4.23
nirchem Cement limited CRISIl - AA 2.79
petronet lnG ltd. CRISIL - AA+ 2.71
Axis Bank ltd. CRISIL - A1+, AA 2.47
Total of Top Ten Holdings 49.49
Total g-Sec, SDl, CD/Cp, Credit Exposure 96.94
Cash, Cash Equivalents and net Current Assets 3.06
grand Total 100.00
For complete portfolio, please visit www.hdfcfund.com
Face Value per unit: ̀ 10 unless otherwise specified, + Industry Classification as recommended by AMFI, CD - Certificate of Deposit; CP - Commercial Papers. Data is as of January 31, 2017 unless otherwise specified.
G-Sec, SDl 5.00CD/Cp 6.29Credit Exposure 85.65Cash, Cash Equivalents and net Current Assets 3.06
Portfolio Classification by Asset Class (%)
Sovereign 5.00AAA/AAA(SO)/A1+/A1+(SO) & Equivalent 49.53AA+ & Below 42.23unrated 0.18Cash, Cash Equivalents and net Current Assets 3.06
Portfolio Classification by Rating Class (%)
£ Co-sponsor
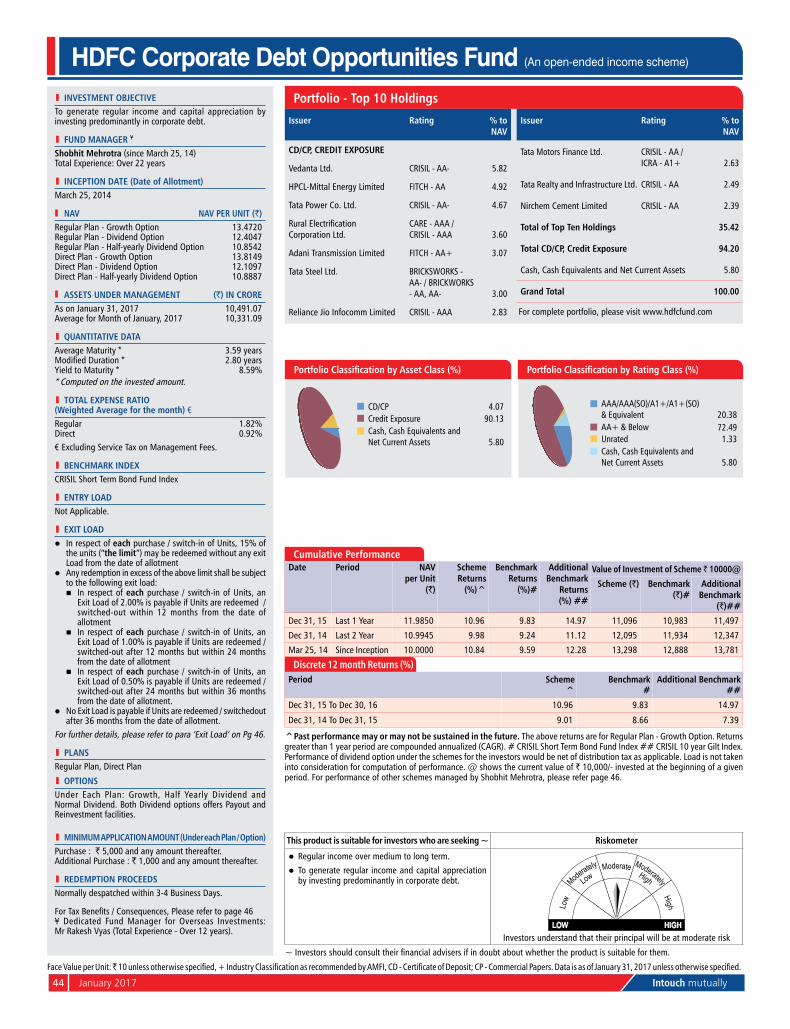
44 January 2017 Intouch mutually
l INvESTMENT OBjECTIvETo generate regular income and capital appreciation by investing predominantly in corporate debt.
l FuND MaNagEr ¥
Shobhit Mehrotra (since March 25, 14) Total Experience: over 22 years
l INCEpTION DaTE (Date of allotment)March 25, 2014
Nav Nav pEr uNIT (`)Regular plan - Growth option 13.4720Regular plan - Dividend option 12.4047Regular plan - Half-yearly Dividend option 10.8542Direct plan - Growth option 13.8149Direct plan - Dividend option 12.1097Direct plan - Half-yearly Dividend option 10.8887
aSSETS uNDEr MaNagEMENT (`) IN CrOrEAs on January 31, 2017 10,491.07Average for Month of January, 2017 10,331.09
l quaNTITaTIvE DaTaAverage Maturity * 3.59 yearsModified Duration * 2.80 yearsyield to Maturity * 8.59%* Computed on the invested amount.
l TOTal ExpENSE raTIO (Weighted average for the month) €Regular 1.82%Direct 0.92%€ Excluding Service Tax on Management Fees.
l BENCHMarK INDExCRISIl Short Term Bond Fund Index
l ENTrY lOaDnot Applicable.
l ExIT lOaDl In respect of each purchase / switch-in of units, 15% of
the units (“the limit”) may be redeemed without any exit load from the date of allotment
l Any redemption in excess of the above limit shall be subject to the following exit load:
n In respect of each purchase / switch-in of units, an Exit load of 2.00% is payable if units are redeemed / switched-out within 12 months from the date of allotment
n In respect of each purchase / switch-in of units, an Exit load of 1.00% is payable if units are redeemed / switched-out after 12 months but within 24 months from the date of allotment
n In respect of each purchase / switch-in of units, an Exit load of 0.50% is payable if units are redeemed / switched-out after 24 months but within 36 months from the date of allotment.
l no Exit load is payable if units are redeemed / switchedout after 36 months from the date of allotment.
For further details, please refer to para ‘Exit load’ on pg 46.
l plaNSRegular plan, Direct plan
l OpTIONSunder Each plan: Growth, Half yearly Dividend and normal Dividend. Both Dividend options offers payout and Reinvestment facilities.
l MINIMuM applICaTION aMOuNT (under each plan / Option)purchase : ` 5,000 and any amount thereafter. Additional purchase : ` 1,000 and any amount thereafter.
l rEDEMpTION prOCEEDSnormally despatched within 3-4 Business Days.
For Tax Benefits / Consequences, Please refer to page 46¥ Dedicated Fund Manager for overseas Investments: Mr Rakesh Vyas (Total Experience - over 12 years).
HDFC Corporate Debt Opportunities Fund (An open-ended income scheme)
portfolio - Top 10 Holdings
Issuer rating % to Nav
CD/Cp, CrEDIT ExpOSurE
Vedanta ltd. CRISIl - AA- 5.82
HpCl-Mittal Energy limited FITCH - AA 4.92
Tata power Co. ltd. CRISIl - AA- 4.67
Rural Electrification Corporation ltd.
CARE - AAA / CRISIl - AAA 3.60
Adani Transmission limited FITCH - AA+ 3.07
Tata Steel ltd. BRICKSWoRKS - AA- / BRICKWoRKS - AA, AA- 3.00
Reliance Jio Infocomm limited CRISIl - AAA 2.83
Issuer rating % to Nav
Tata Motors Finance ltd. CRISIl - AA / ICRA - A1+ 2.63
Tata Realty and Infrastructure ltd. CRISIl - AA 2.49
nirchem Cement limited CRISIl - AA 2.39
Total of Top Ten Holdings 35.42
Total CD/Cp, Credit Exposure 94.20
Cash, Cash Equivalents and net Current Assets 5.80
grand Total 100.00
For complete portfolio, please visit www.hdfcfund.com
This product is suitable for investors who are seeking ~ riskometer
l Regular income over medium to long term.l To generate regular income and capital appreciation
by investing predominantly in corporate debt.
Investors understand that their principal will be at moderate risk
~ Investors should consult their financial advisers if in doubt about whether the product is suitable for them.
HDFC Corporate Debt Opportunities Fund
CD/Cp 4.07Credit Exposure 90.13Cash, Cash Equivalents and net Current Assets 5.80
Portfolio Classification by Asset Class (%)
AAA/AAA(SO)/A1+/A1+(SO) & Equivalent 20.38AA+ & Below 72.49unrated 1.33Cash, Cash Equivalents and net Current Assets 5.80
Portfolio Classification by Rating Class (%)
Face Value per unit: ̀ 10 unless otherwise specified, + Industry Classification as recommended by AMFI, CD - Certificate of Deposit; CP - Commercial Papers. Data is as of January 31, 2017 unless otherwise specified.
Cumulative performanceDate period Nav
per unit (`)
Scheme returns
(%)^
Benchmark returns
(%)#
additional Benchmark
returns (%) ##
value of Investment of Scheme ̀ 10000@
Scheme (`) Benchmark (`)#
additional Benchmark
(`)##
Dec 31, 15 last 1 year 11.9850 10.96 9.83 14.97 11,096 10,983 11,497
Dec 31, 14 last 2 year 10.9945 9.98 9.24 11.12 12,095 11,934 12,347
Mar 25, 14 Since Inception 10.0000 10.84 9.59 12.28 13,298 12,888 13,781
Discrete 12 month returns (%)period Scheme
^Benchmark
#additional Benchmark
##
Dec 31, 15 To Dec 30, 16 10.96 9.83 14.97
Dec 31, 14 To Dec 31, 15 9.01 8.66 7.39
^past performance may or may not be sustained in the future. The above returns are for Regular plan - Growth option. Returns greater than 1 year period are compounded annualized (CAGR). # CRISIl Short Term Bond Fund Index ## CRISIl 10 year Gilt Index. performance of dividend option under the schemes for the investors would be net of distribution tax as applicable. load is not taken into consideration for computation of performance. @ shows the current value of ` 10,000/- invested at the beginning of a given period. For performance of other schemes managed by Shobhit Mehrotra, please refer page 46.

Intouch mutually January 2017 45
l INvESTMENT OBjECTIvE
To generate regular income through investments in debt and money market instruments consisting predominantly of securities issued by entities such as Scheduled Commercial Banks and public Sector undertakings. There is no assurance that the investment objective of the Scheme will be realized.
l FuND MaNagEr ¥
anil Bamboli (since Mar 26, 14)
Total Experience: over 22 years
l INCEpTION DaTE (Date of allotment)
March 26, 2014
Nav Nav pEr uNIT (`)
Regular plan - Growth option 13.1540Regular plan - Dividend option 10.2628Direct plan - Growth option 13.2069Direct plan - Dividend option 10.3085
aSSETS uNDEr MaNagEMENT (`) IN CrOrE
As on January 31, 2017 3,235.93Average for Month of January, 2017 3,178.33
l quaNTITaTIvE DaTa
Average Maturity * 4.81 yearsModified Duration * 3.39 yearsyield to Maturity * 7.81%* Computed on the invested amount.
l TOTal ExpENSE raTIO (Weighted average for the month) €
Regular 0.70%Direct 0.25%
€ Excluding Service Tax on Management Fees.
l BENCHMarK INDEx
CRISIl Short Term Bond Fund Index
l ENTrY lOaD
not Applicable.
l ExIT lOaD
nil
l plaNS
Regular plan, Direct plan
l OpTIONS
under Each plan: Growth & Dividend. The Dividend option offers Dividend payout and Reinvestment facility.
l MINIMuM applICaTION aMOuNT (under each plan / Option)
purchase : ` 5,000 and any amount thereafter.
l rEDEMpTION prOCEEDS
normally despatched within 3-4 Business Days.
For Tax Benefits / Consequences, Please refer to page 46¥ Dedicated Fund Manager for overseas Investments: Mr Rakesh Vyas (Total Experience - over 12 years).
HDFC Banking and PSU Debt Fund (An open-ended income scheme)
portfolio - Top 10 Holdings
This product is suitable for investors who are seeking ~ riskometer
l Regular income over medium to long term.l Investments in debt and money market instruments
consisting predominantly of securities issued by Scheduled Commercial Banks and public Sector undertakings.
Investors understand that their principal will be at moderately low risk
~ Investors should consult their financial advisers if in doubt about whether the product is suitable for them.
Issuer rating % to Nav
g-SEC, SDl, CD/Cp, CrEDIT ExpOSurE
power Finance Corporation ltd. CRISIl - AAA 9.38
Mahanagar Telephone nigam ltd.
CARE - AAA(So) / CRISIl - AAA(So) 8.08
Syndicate Bank CARE - AA- 6.98
Export - Import Bank of India CRISIl - AAA 6.98
Food Corporation of India CRISIl - AAA(So) 6.04
power Grid Corporation of India ltd. CRISIl - AAA 5.60
Rural Electrification Corporation ltd. CRISIl - AAA 4.97
Issuer rating % to Nav
Bank of India BRICKWoRKS - AA- / CRISIL - A+ 4.37
union Bank of India FITCH - AA 4.20
national Bank for Agriculture & Rural Development CRISIl - AAA 3.93
Total of Top Ten Holdings 60.53
Total g-Sec, SDl, CD/Cp, Credit Exposure 94.06
Cash, Cash Equivalents and net Current Assets 5.94
grand Total 100.00
For complete portfolio, please visit www.hdfcfund.com
Face Value per unit: ̀ 10 unless otherwise specified, + Industry Classification as recommended by AMFI, CD - Certificate of Deposit; CP - Commercial Papers. Data is as of January 31, 2017 unless otherwise specified.
G-Sec, SDl 2.15CD/Cp 2.27Credit Exposure 89.64
Cash, Cash Equivalents and net Current Assets 5.94
Portfolio Classification by Asset Class (%)
Sovereign 2.15
AAA/AAA(SO)/A1+/A1+(SO) & Equivalent 59.68AA+ & Below 32.23
Cash, Cash Equivalents and net Current Assets 5.94
Portfolio Classification by Rating Class (%)
Cumulative performanceDate period Nav
per unit (`)
Scheme returns
(%)^
Benchmark returns
(%)#
additional Benchmark
returns (%) ##
value of Investment of Scheme ̀ 10000@
Scheme (`) Benchmark (`)#
additional Benchmark
(`)##
Dec 31, 15 last 1 year 11.7371 10.83 9.83 7.27 11,083 10,983 10,727
Dec 31, 14 last 2 year 10.6939 10.29 9.24 7.75 12,164 11,934 11,609
Mar 26, 14 Since Inception 10.0000 9.97 9.60 8.00 13,008 12,887 12,373
Discrete 12 month returns (%)period Scheme
^Benchmark
#additional Benchmark
##
Dec 31, 15 To Dec 30, 16 10.83 9.83 7.27
Dec 31, 14 To Dec 31, 15 9.76 8.66 8.22
^past performance may or may not be sustained in the future. The above returns are for Regular plan - Growth option. Returns greater than 1 year period are compounded annualized (CAGR). # CRISIl Short Term Bond Fund Index ## CRISIl 1 year T-Bill Index. performance of dividend option under the schemes for the investors would be net of distribution tax as applicable. load is not taken into consideration for computation of performance. @ shows the current value of ` 10,000/- invested at the beginning of a given period. For performance of other schemes managed by Anil Bamboli, please refer page 46.
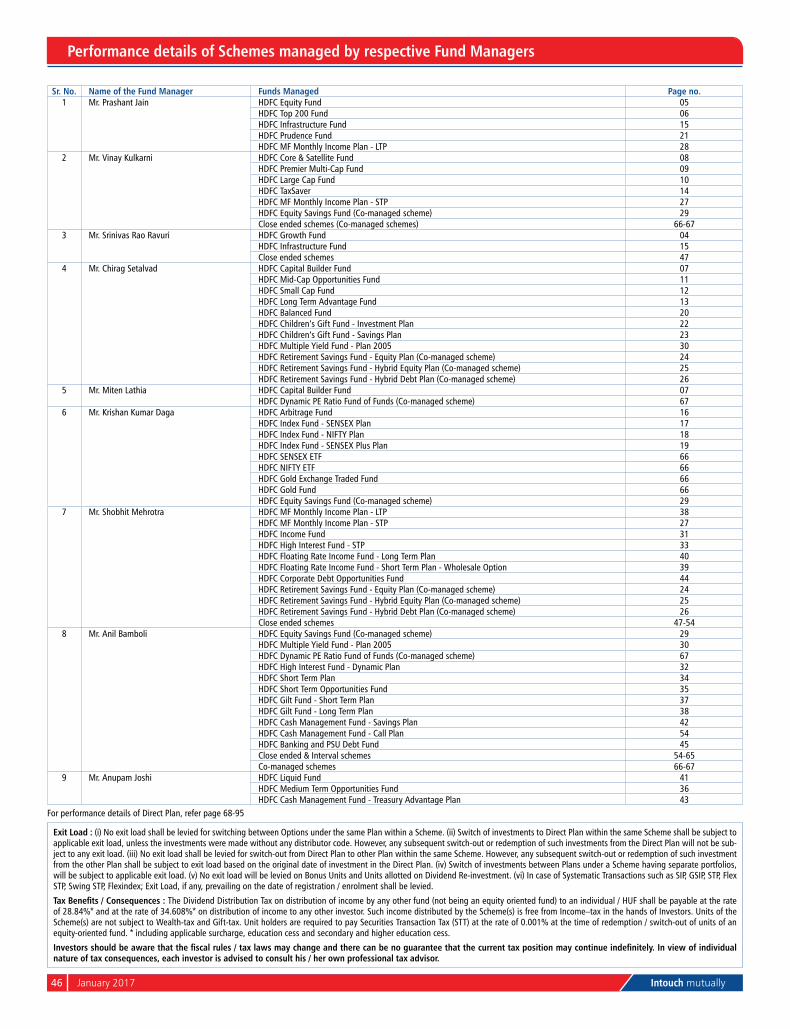
46 January 2017 Intouch mutually
Performance details of Schemes managed by respective Fund Managers
Sr. No. Name of the Fund Manager Funds Managed Page no.1 Mr. Prashant Jain HDFC Equity Fund 05
HDFC Top 200 Fund 06HDFC Infrastructure Fund 15HDFC Prudence Fund 21HDFC MF Monthly Income Plan - LTP 28
2 Mr. Vinay Kulkarni HDFC Core & Satellite Fund 08HDFC Premier Multi-Cap Fund 09HDFC Large Cap Fund 10HDFC TaxSaver 14HDFC MF Monthly Income Plan - STP 27HDFC Equity Savings Fund (Co-managed scheme) 29Close ended schemes (Co-managed schemes) 66-67
3 Mr. Srinivas Rao Ravuri HDFC Growth Fund 04HDFC Infrastructure Fund 15Close ended schemes 47
4 Mr. Chirag Setalvad HDFC Capital Builder Fund 07HDFC Mid-Cap Opportunities Fund 11HDFC Small Cap Fund 12HDFC Long Term Advantage Fund 13HDFC Balanced Fund 20HDFC Children’s Gift Fund - Investment Plan 22HDFC Children’s Gift Fund - Savings Plan 23HDFC Multiple Yield Fund - Plan 2005 30HDFC Retirement Savings Fund - Equity Plan (Co-managed scheme) 24HDFC Retirement Savings Fund - Hybrid Equity Plan (Co-managed scheme) 25HDFC Retirement Savings Fund - Hybrid Debt Plan (Co-managed scheme) 26
5 Mr. Miten Lathia HDFC Capital Builder Fund 07HDFC Dynamic PE Ratio Fund of Funds (Co-managed scheme) 67
6 Mr. Krishan Kumar Daga HDFC Arbitrage Fund 16HDFC Index Fund - SEnSEx Plan 17HDFC Index Fund - nIFTY Plan 18HDFC Index Fund - SEnSEx Plus Plan 19HDFC SEnSEx ETF 66HDFC nIFTY ETF 66HDFC Gold Exchange Traded Fund 66HDFC Gold Fund 66HDFC Equity Savings Fund (Co-managed scheme) 29
7 Mr. Shobhit Mehrotra HDFC MF Monthly Income Plan - LTP 38HDFC MF Monthly Income Plan - STP 27HDFC Income Fund 31HDFC High Interest Fund - STP 33HDFC Floating Rate Income Fund - Long Term Plan 40HDFC Floating Rate Income Fund - Short Term Plan - Wholesale Option 39HDFC Corporate Debt Opportunities Fund 44HDFC Retirement Savings Fund - Equity Plan (Co-managed scheme) 24HDFC Retirement Savings Fund - Hybrid Equity Plan (Co-managed scheme) 25HDFC Retirement Savings Fund - Hybrid Debt Plan (Co-managed scheme) 26Close ended schemes 47-54
8 Mr. Anil Bamboli HDFC Equity Savings Fund (Co-managed scheme) 29HDFC Multiple Yield Fund - Plan 2005 30HDFC Dynamic PE Ratio Fund of Funds (Co-managed scheme) 67HDFC High Interest Fund - Dynamic Plan 32HDFC Short Term Plan 34HDFC Short Term Opportunities Fund 35HDFC Gilt Fund - Short Term Plan 37HDFC Gilt Fund - Long Term Plan 38HDFC Cash Management Fund - Savings Plan 42HDFC Cash Management Fund - Call Plan 54HDFC Banking and PSU Debt Fund 45Close ended & Interval schemes 54-65Co-managed schemes 66-67
9 Mr. Anupam Joshi HDFC Liquid Fund 41HDFC Medium Term Opportunities Fund 36HDFC Cash Management Fund - Treasury Advantage Plan 43
For performance details of Direct Plan, refer page 68-95
Exit Load : (i) no exit load shall be levied for switching between Options under the same Plan within a Scheme. (ii) Switch of investments to Direct Plan within the same Scheme shall be subject to applicable exit load, unless the investments were made without any distributor code. However, any subsequent switch-out or redemption of such investments from the Direct Plan will not be sub-ject to any exit load. (iii) no exit load shall be levied for switch-out from Direct Plan to other Plan within the same Scheme. However, any subsequent switch-out or redemption of such investment from the other Plan shall be subject to exit load based on the original date of investment in the Direct Plan. (iv) Switch of investments between Plans under a Scheme having separate portfolios, will be subject to applicable exit load. (v) no exit load will be levied on Bonus Units and Units allotted on Dividend Re-investment. (vi) In case of Systematic Transactions such as SIP, GSIP, STP, Flex STP, Swing STP, Flexindex; Exit Load, if any, prevailing on the date of registration / enrolment shall be levied.
Tax Benefits / Consequences : The Dividend Distribution Tax on distribution of income by any other fund (not being an equity oriented fund) to an individual / HUF shall be payable at the rate of 28.84%* and at the rate of 34.608%* on distribution of income to any other investor. Such income distributed by the Scheme(s) is free from Income–tax in the hands of Investors. Units of the Scheme(s) are not subject to Wealth-tax and Gift-tax. Unit holders are required to pay Securities Transaction Tax (STT) at the rate of 0.001% at the time of redemption / switch-out of units of an equity-oriented fund. * including applicable surcharge, education cess and secondary and higher education cess.
Investors should be aware that the fiscal rules / tax laws may change and there can be no guarantee that the current tax position may continue indefinitely. In view of individual nature of tax consequences, each investor is advised to consult his / her own professional tax advisor.

Intouch mutually January 2017 47
SCHEME PERFORMANCE - REGULAR PLAN - GROWTH OPTION (FUND MANAGER-WISE)
SRINIVAS RAO RAVURIHDFC RAJIV GANDHI EQUITY SAVINGS SCHEME - SERIES II NAV as on December 30, 2016 ` 14.406A. Cumulative PerformanceDate Period NAV
per Unit (`)
Scheme Returns
(%)^
Benchmark Returns
(%)#
Additional Benchmark
Returns (%) ##
Value of Investment of Scheme ` 10000@
Scheme (`) Benchmark (`)#
Additional Benchmark
(`)##Dec 31, 15 Last 1 Year 13.199 9.14 3.57 1.95 10,914 10,357 10,195Dec 31, 14 Last 2 Years 13.804 2.16 0.10 -1.60 10,436 10,021 9,683Mar 14, 14 Since Inception 10.000 13.93 9.73 7.39 14,406 12,968 12,208
B. Discrete 12 month Returns (%) Period Scheme
^Benchmark
#Additional
Benchmark ##
Dec 31, 15 To Dec 30, 16 9.14 3.57 1.95Dec 31, 14 To Dec 31, 15 -4.38 -3.25 -5.03
^Past performance may or may not be sustained in the future. Returns greater than 1 year period are compounded annualized (CAGR). # S&P BSE 100 ## S&P BSE SEnSEx
HDFC FOCUSED EQUITY FUND - PLAN A NAV as on December 30, 2016 ` 10.100A. Cumulative PerformanceDate Period NAV
per Unit (`)
Scheme Returns
(%)^
Benchmark Returns
(%)#
Additional Benchmark
Returns (%) ##
Value of Investment of Scheme ` 10000@
Scheme (`) Benchmark (`)#
Additional Benchmark
(`)##Dec 31, 15 Last 1 Year 9.473 6.62 3.57 1.95 10,662 10,357 10,195Feb 23, 15 Since Inception 10.000 0.54 -2.86 -4.46 10,100 9,478 9,189
B. Discrete 12 month Returns (%) Period Scheme
^Benchmark
#Additional
Benchmark ##
Dec 31, 15 To Dec 30, 16 6.62 3.57 1.95^Past performance may or may not be sustained in the future. Returns greater than 1 year period are compounded annualized (CAGR). # S&P BSE 100 ## S&P BSE SEnSEx
HDFC FOCUSED EQUITY FUND - PLAN B NAV as on December 30, 2016 ` 10.766A. Cumulative PerformanceDate Period NAV
per Unit (`)
Scheme Returns
(%)^
Benchmark Returns
(%)#
Additional Benchmark
Returns (%) ##
Value of Investment of Scheme ` 10000@
Scheme (`) Benchmark (`)#
Additional Benchmark
(`)##Dec 31, 15 Last 1 Year 9.897 8.78 3.57 1.95 10,878 10,357 10,195May 06, 15 Since Inception 10.000 4.56 1.15 -0.21 10,766 10,191 9,966
B. Discrete 12 month Returns (%) Period Scheme
^Benchmark
#Additional
Benchmark ##
Dec 31, 15 To Dec 30, 16 8.78 3.57 1.95^Past performance may or may not be sustained in the future. Returns greater than 1 year period are compounded annualized (CAGR). # S&P BSE 100 ## S&P BSE SEnSEx
SHOBHIT MEHROTRAHDFC FMP 538D NOVEMBER 2013 (1) NAV as on December 30, 2016 ` 12.9175A. Cumulative PerformanceDate Period NAV
per Unit (`)
Scheme Returns
(%)^
Benchmark Returns
(%)#
Additional Benchmark
Returns (%) ##
Value of Investment of Scheme ` 10000@
Scheme (`) Benchmark (`)#
Additional Benchmark
(`)##Dec 31, 15 Last 1 Year 11.9363 8.22 9.83 7.27 10,822 10,983 10,727Dec 31, 14 Last 2 Years 11.0266 8.24 9.24 7.75 11,715 11,934 11,609Dec 31, 13 Last 3 Years 10.0827 8.61 9.65 8.02 12,812 13,183 12,603nov 28, 13 Since Inception 10.0000 8.64 9.64 8.00 12,918 13,289 12,685
B. Discrete 12 month Returns (%) Period Scheme
^Benchmark
#Additional
Benchmark ##
Dec 31, 15 To Dec 30, 16 8.22 9.83 7.27Dec 31, 14 To Dec 31, 15 8.25 8.66 8.22Dec 31, 13 To Dec 31, 14 9.36 10.47 8.56
^Past performance may or may not be sustained in the future. Returns greater than 1 year period are compounded annualized (CAGR). # CRISIL Short Term Bond Fund Index ## CRISIL 1 year T-Bill Index
HDFC FMP 540D DECEMBER 2013 (1) NAV as on December 30, 2016 ` 12.8311A. Cumulative PerformanceDate Period NAV
per Unit (`)
Scheme Returns
(%)^
Benchmark Returns
(%)#
Additional Benchmark
Returns (%) ##
Value of Investment of Scheme ` 10000@
Scheme (`) Benchmark (`)#
Additional Benchmark
(`)##Dec 31, 15 Last 1 Year 11.8892 7.92 9.83 7.27 10,792 10,983 10,727Dec 31, 14 Last 2 Years 10.9972 8.02 9.24 7.75 11,668 11,934 11,609Dec 31, 13 Last 3 Years 10.0525 8.48 9.65 8.02 12,764 13,183 12,603Dec 10, 13 Since Inception 10.0000 8.49 9.65 7.99 12,831 13,255 12,648
B. Discrete 12 month Returns (%) Period Scheme
^Benchmark
#Additional
Benchmark ##
Dec 31, 15 To Dec 30, 16 7.92 9.83 7.27Dec 31, 14 To Dec 31, 15 8.11 8.66 8.22Dec 31, 13 To Dec 31, 14 9.40 10.47 8.56
^Past performance may or may not be sustained in the future. Returns greater than 1 year period are compounded annualized (CAGR). # CRISIL Short Term Bond Fund Index ## CRISIL 1 year T-Bill Index
HDFC FMP 554D NOVEMBER 2013 (1) NAV as on December 30, 2016 ` 12.9609A. Cumulative PerformanceDate Period NAV
per Unit (`)
Scheme Returns
(%)^
Benchmark Returns
(%)#
Additional Benchmark
Returns (%) ##
Value of Investment of Scheme ` 10000@
Scheme (`) Benchmark (`)#
Additional Benchmark
(`)##Dec 31, 15 Last 1 Year 11.9662 8.31 9.83 7.27 10,831 10,983 10,727Dec 31, 14 Last 2 Years 11.0700 8.20 9.24 7.75 11,708 11,934 11,609Dec 31, 13 Last 3 Years 10.1405 8.52 9.65 8.02 12,781 13,183 12,603nov 12, 13 Since Inception 10.0000 8.63 9.68 8.00 12,961 13,358 12,727
B. Discrete 12 month Returns (%) Period Scheme
^Benchmark
#Additional
Benchmark ##
Dec 31, 15 To Dec 30, 16 8.31 9.83 7.27Dec 31, 14 To Dec 31, 15 8.10 8.66 8.22Dec 31, 13 To Dec 31, 14 9.17 10.47 8.56
^Past performance may or may not be sustained in the future. Returns greater than 1 year period are compounded annualized (CAGR). # CRISIL Short Term Bond Fund Index ## CRISIL 1 year T-Bill Index
Performance of dividend option under the schemes for the investors would be net of distribution tax as applicable. Load is not taken into consideration for computation of performance.@ shows the current value of ` 10,000/- invested at the beginning of a given period. n.A.: not Available
Performance of FMP schemes, being close-ended in nature, is not strictly comparable with that of open-ended schemes since the investment strategy for FMP schemes is primarily buy-and-hold whereas open-ended schemes are actively managed.

48 January 2017 Intouch mutually
HDFC FMP 572D OCTOBER 2013 (1) NAV as on December 30, 2016 ` 13.0337A. Cumulative PerformanceDate Period NAV
per Unit (`)
Scheme Returns
(%)^
Benchmark Returns
(%)#
Additional Benchmark
Returns (%) ##
Value of Investment of Scheme ` 10000@
Scheme (`) Benchmark (`)#
Additional Benchmark
(`)##Dec 31, 15 Last 1 Year 12.0324 8.32 9.83 7.27 10,832 10,983 10,727Dec 31, 14 Last 2 Years 11.1220 8.25 9.24 7.75 11,719 11,934 11,609Dec 31, 13 Last 3 Years 10.1707 8.62 9.65 8.02 12,815 13,183 12,603Oct 18, 13 Since Inception 10.0000 8.62 9.57 7.96 13,034 13,399 12,780
B. Discrete 12 month Returns (%) Period Scheme
^Benchmark
#Additional
Benchmark ##
Dec 31, 15 To Dec 30, 16 8.32 9.83 7.27Dec 31, 14 To Dec 31, 15 8.19 8.66 8.22Dec 31, 13 To Dec 31, 14 9.35 10.47 8.56
^Past performance may or may not be sustained in the future. Returns greater than 1 year period are compounded annualized (CAGR). # CRISIL Short Term Bond Fund Index ## CRISIL 1 year T-Bill Index
HDFC FMP 923D NOVEMBER 2013 (1) NAV as on December 30, 2016 ` 12.9445A. Cumulative PerformanceDate Period NAV
per Unit (`)
Scheme Returns
(%)^
Benchmark Returns
(%)#
Additional Benchmark
Returns (%) ##
Value of Investment of Scheme ` 10000@
Scheme (`) Benchmark (`)#
Additional Benchmark
(`)##Dec 31, 15 Last 1 Year 12.0258 7.64 9.83 7.27 10,764 10,983 10,727Dec 31, 14 Last 2 Years 11.1460 7.77 9.24 7.75 11,614 11,934 11,609Dec 31, 13 Last 3 Years 10.0940 8.64 9.65 8.02 12,824 13,183 12,603nov 21, 13 Since Inception 10.0000 8.65 9.67 8.02 12,945 13,324 12,711
B. Discrete 12 month Returns (%) Period Scheme
^Benchmark
#Additional
Benchmark ##
Dec 31, 15 To Dec 30, 16 7.64 9.83 7.27Dec 31, 14 To Dec 31, 15 7.89 8.66 8.22Dec 31, 13 To Dec 31, 14 10.42 10.47 8.56
^Past performance may or may not be sustained in the future. Returns greater than 1 year period are compounded annualized (CAGR). # CRISIL Short Term Bond Fund Index ## CRISIL 1 year T-Bill Index
HDFC FMP 1919D JANUARY 2013 (1) NAV as on December 30, 2016 ` 14.1933A. Cumulative PerformanceDate Period NAV
per Unit (`)
Scheme Returns
(%)^
Benchmark Returns
(%)#
Additional Benchmark
Returns (%) ##
Value of Investment of Scheme ` 10000@
Scheme (`) Benchmark (`)#
Additional Benchmark
(`)##Dec 31, 15 Last 1 Year 12.9846 9.31 12.93 7.27 10,931 11,293 10,727Dec 31, 14 Last 2 Years 11.8952 9.23 10.76 7.75 11,932 12,268 11,609Dec 31, 13 Last 3 Years 10.5480 10.40 11.93 8.02 13,456 14,023 12,603Jan 08, 13 Since Inception 10.0000 9.20 9.71 7.44 14,193 14,457 13,302
B. Discrete 12 month Returns (%) Period Scheme
^Benchmark
#Additional
Benchmark ##
Dec 31, 15 To Dec 30, 16 9.31 12.93 7.27Dec 31, 14 To Dec 31, 15 9.16 8.63 8.22Dec 31, 13 To Dec 31, 14 12.77 14.31 8.56
^Past performance may or may not be sustained in the future. Returns greater than 1 year period are compounded annualized (CAGR). # CRISIL Composite Bond Fund Index ## CRISIL 1 year T-Bill Index
HDFC FMP 3360D MARCH 2014 (1) NAV as on December 30, 2016 ` 12.2810A. Cumulative PerformanceDate Period NAV
per Unit (`)
Scheme Returns
(%)^
Benchmark Returns
(%)#
Additional Benchmark
Returns (%) ##
Value of Investment of Scheme ` 10000@
Scheme (`) Benchmark (`)#
Additional Benchmark
(`)##Dec 31, 15 Last 1 Year 10.5405 16.51 12.93 14.97 11,651 11,293 11,497Dec 31, 14 Last 2 Years 10.3118 9.13 10.76 11.12 11,910 12,268 12,347Mar 26, 14 Since Inception 10.0000 7.71 12.02 12.27 12,281 13,690 13,774
B. Discrete 12 month Returns (%) Period Scheme
^Benchmark
#Additional
Benchmark ##
Dec 31, 15 To Dec 30, 16 16.51 12.93 14.97Dec 31, 14 To Dec 31, 15 2.22 8.63 7.39
^Past performance may or may not be sustained in the future. Returns greater than 1 year period are compounded annualized (CAGR). # CRISIL Composite Bond Fund Index ## CRISIL 10 year Gilt Index
HDFC FMP 366D MARCH 2014 (2) NAV as on December 30, 2016 ` 12.5852A. Cumulative PerformanceDate Period NAV
per Unit (`)
Scheme Returns
(%)^
Benchmark Returns
(%)#
Additional Benchmark
Returns (%) ##
Value of Investment of Scheme ` 10000@
Scheme (`) Benchmark (`)#
Additional Benchmark
(`)##Dec 31, 15 Last 1 Year 11.6064 8.43 9.83 7.27 10,843 10,983 10,727Dec 31, 14 Last 2 Years 10.7068 8.42 9.24 7.75 11,754 11,934 11,609Mar 26, 14 Since Inception 10.0000 8.66 9.60 8.00 12,585 12,887 12,373
B. Discrete 12 month Returns (%) Period Scheme
^Benchmark
#Additional
Benchmark ##
Dec 31, 15 To Dec 30, 16 8.43 9.83 7.27Dec 31, 14 To Dec 31, 15 8.40 8.66 8.22
^Past performance may or may not be sustained in the future. Returns greater than 1 year period are compounded annualized (CAGR). # CRISIL Short Term Bond Fund Index ## CRISIL 1 year T-Bill Index
HDFC FMP 377D MARCH 2014 (1) NAV as on December 30, 2016 ` 12.5261A. Cumulative PerformanceDate Period NAV
per Unit (`)
Scheme Returns
(%)^
Benchmark Returns
(%)#
Additional Benchmark
Returns (%) ##
Value of Investment of Scheme ` 10000@
Scheme (`) Benchmark (`)#
Additional Benchmark
(`)##Dec 31, 15 Last 1 Year 11.5454 8.49 9.83 7.27 10,849 10,983 10,727Dec 31, 14 Last 2 Years 10.6866 8.27 9.24 7.75 11,721 11,934 11,609Mar 27, 14 Since Inception 10.0000 8.49 9.60 8.00 12,526 12,884 12,370
B. Discrete 12 month Returns (%) Period Scheme
^Benchmark
#Additional
Bttenchmark ##
Dec 31, 15 To Dec 30, 16 8.49 9.83 7.27Dec 31, 14 To Dec 31, 15 8.04 8.66 8.22
^Past performance may or may not be sustained in the future. Returns greater than 1 year period are compounded annualized (CAGR). # CRISIL Short Term Bond Fund Index ## CRISIL 1 year T-Bill Index
SCHEME PERFORMANCE - REGULAR PLAN - GROWTH OPTION (FUND MANAGER-WISE)SHOBHIT MEHROTRA....CONTINUED
Performance of dividend option under the schemes for the investors would be net of distribution tax as applicable. Load is not taken into consideration for computation of performance.@ shows the current value of ` 10,000/- invested at the beginning of a given period. n.A.: not Available
Performance of FMP schemes, being close-ended in nature, is not strictly comparable with that of open-ended schemes since the investment strategy for FMP schemes is primarily buy-and-hold whereas open-ended schemes are actively managed.
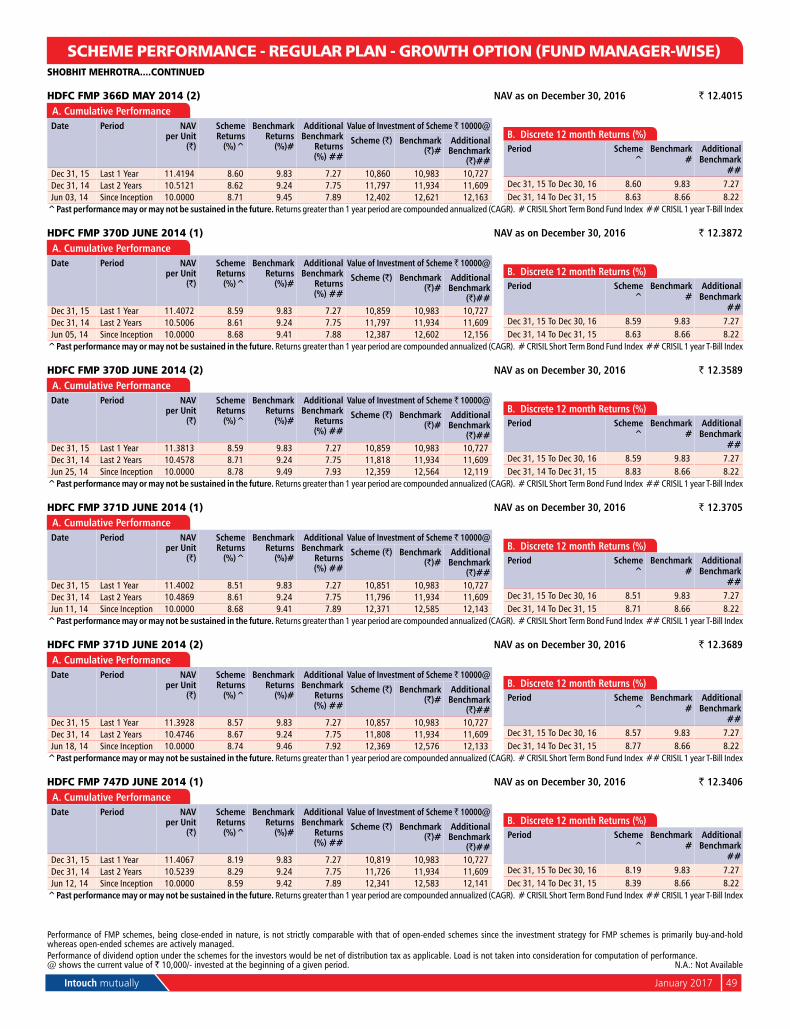
Intouch mutually January 2017 49
HDFC FMP 366D MAY 2014 (2) NAV as on December 30, 2016 ` 12.4015A. Cumulative PerformanceDate Period NAV
per Unit (`)
Scheme Returns
(%)^
Benchmark Returns
(%)#
Additional Benchmark
Returns (%) ##
Value of Investment of Scheme ` 10000@
Scheme (`) Benchmark (`)#
Additional Benchmark
(`)##Dec 31, 15 Last 1 Year 11.4194 8.60 9.83 7.27 10,860 10,983 10,727Dec 31, 14 Last 2 Years 10.5121 8.62 9.24 7.75 11,797 11,934 11,609Jun 03, 14 Since Inception 10.0000 8.71 9.45 7.89 12,402 12,621 12,163
B. Discrete 12 month Returns (%) Period Scheme
^Benchmark
#Additional
Benchmark ##
Dec 31, 15 To Dec 30, 16 8.60 9.83 7.27Dec 31, 14 To Dec 31, 15 8.63 8.66 8.22
^Past performance may or may not be sustained in the future. Returns greater than 1 year period are compounded annualized (CAGR). # CRISIL Short Term Bond Fund Index ## CRISIL 1 year T-Bill Index
HDFC FMP 370D JUNE 2014 (1) NAV as on December 30, 2016 ` 12.3872A. Cumulative PerformanceDate Period NAV
per Unit (`)
Scheme Returns
(%)^
Benchmark Returns
(%)#
Additional Benchmark
Returns (%) ##
Value of Investment of Scheme ` 10000@
Scheme (`) Benchmark (`)#
Additional Benchmark
(`)##Dec 31, 15 Last 1 Year 11.4072 8.59 9.83 7.27 10,859 10,983 10,727Dec 31, 14 Last 2 Years 10.5006 8.61 9.24 7.75 11,797 11,934 11,609Jun 05, 14 Since Inception 10.0000 8.68 9.41 7.88 12,387 12,602 12,156
B. Discrete 12 month Returns (%) Period Scheme
^Benchmark
#Additional
Benchmark ##
Dec 31, 15 To Dec 30, 16 8.59 9.83 7.27Dec 31, 14 To Dec 31, 15 8.63 8.66 8.22
^Past performance may or may not be sustained in the future. Returns greater than 1 year period are compounded annualized (CAGR). # CRISIL Short Term Bond Fund Index ## CRISIL 1 year T-Bill Index
HDFC FMP 370D JUNE 2014 (2) NAV as on December 30, 2016 ` 12.3589A. Cumulative PerformanceDate Period NAV
per Unit (`)
Scheme Returns
(%)^
Benchmark Returns
(%)#
Additional Benchmark
Returns (%) ##
Value of Investment of Scheme ` 10000@
Scheme (`) Benchmark (`)#
Additional Benchmark
(`)##Dec 31, 15 Last 1 Year 11.3813 8.59 9.83 7.27 10,859 10,983 10,727Dec 31, 14 Last 2 Years 10.4578 8.71 9.24 7.75 11,818 11,934 11,609Jun 25, 14 Since Inception 10.0000 8.78 9.49 7.93 12,359 12,564 12,119
B. Discrete 12 month Returns (%) Period Scheme
^Benchmark
#Additional
Benchmark ##
Dec 31, 15 To Dec 30, 16 8.59 9.83 7.27Dec 31, 14 To Dec 31, 15 8.83 8.66 8.22
^Past performance may or may not be sustained in the future. Returns greater than 1 year period are compounded annualized (CAGR). # CRISIL Short Term Bond Fund Index ## CRISIL 1 year T-Bill Index
HDFC FMP 371D JUNE 2014 (1) NAV as on December 30, 2016 ` 12.3705A. Cumulative PerformanceDate Period NAV
per Unit (`)
Scheme Returns
(%)^
Benchmark Returns
(%)#
Additional Benchmark
Returns (%) ##
Value of Investment of Scheme ` 10000@
Scheme (`) Benchmark (`)#
Additional Benchmark
(`)##Dec 31, 15 Last 1 Year 11.4002 8.51 9.83 7.27 10,851 10,983 10,727Dec 31, 14 Last 2 Years 10.4869 8.61 9.24 7.75 11,796 11,934 11,609Jun 11, 14 Since Inception 10.0000 8.68 9.41 7.89 12,371 12,585 12,143
B. Discrete 12 month Returns (%) Period Scheme
^Benchmark
#Additional
Benchmark ##
Dec 31, 15 To Dec 30, 16 8.51 9.83 7.27Dec 31, 14 To Dec 31, 15 8.71 8.66 8.22
^Past performance may or may not be sustained in the future. Returns greater than 1 year period are compounded annualized (CAGR). # CRISIL Short Term Bond Fund Index ## CRISIL 1 year T-Bill Index
HDFC FMP 371D JUNE 2014 (2) NAV as on December 30, 2016 ` 12.3689A. Cumulative PerformanceDate Period NAV
per Unit (`)
Scheme Returns
(%)^
Benchmark Returns
(%)#
Additional Benchmark
Returns (%) ##
Value of Investment of Scheme ` 10000@
Scheme (`) Benchmark (`)#
Additional Benchmark
(`)##Dec 31, 15 Last 1 Year 11.3928 8.57 9.83 7.27 10,857 10,983 10,727Dec 31, 14 Last 2 Years 10.4746 8.67 9.24 7.75 11,808 11,934 11,609Jun 18, 14 Since Inception 10.0000 8.74 9.46 7.92 12,369 12,576 12,133
B. Discrete 12 month Returns (%) Period Scheme
^Benchmark
#Additional
Benchmark ##
Dec 31, 15 To Dec 30, 16 8.57 9.83 7.27Dec 31, 14 To Dec 31, 15 8.77 8.66 8.22
^Past performance may or may not be sustained in the future. Returns greater than 1 year period are compounded annualized (CAGR). # CRISIL Short Term Bond Fund Index ## CRISIL 1 year T-Bill Index
HDFC FMP 747D JUNE 2014 (1) NAV as on December 30, 2016 ` 12.3406A. Cumulative PerformanceDate Period NAV
per Unit (`)
Scheme Returns
(%)^
Benchmark Returns
(%)#
Additional Benchmark
Returns (%) ##
Value of Investment of Scheme ` 10000@
Scheme (`) Benchmark (`)#
Additional Benchmark
(`)##Dec 31, 15 Last 1 Year 11.4067 8.19 9.83 7.27 10,819 10,983 10,727Dec 31, 14 Last 2 Years 10.5239 8.29 9.24 7.75 11,726 11,934 11,609Jun 12, 14 Since Inception 10.0000 8.59 9.42 7.89 12,341 12,583 12,141
B. Discrete 12 month Returns (%) Period Scheme
^Benchmark
#Additional
Benchmark ##
Dec 31, 15 To Dec 30, 16 8.19 9.83 7.27Dec 31, 14 To Dec 31, 15 8.39 8.66 8.22
^Past performance may or may not be sustained in the future. Returns greater than 1 year period are compounded annualized (CAGR). # CRISIL Short Term Bond Fund Index ## CRISIL 1 year T-Bill Index
SCHEME PERFORMANCE - REGULAR PLAN - GROWTH OPTION (FUND MANAGER-WISE)SHOBHIT MEHROTRA....CONTINUED
Performance of dividend option under the schemes for the investors would be net of distribution tax as applicable. Load is not taken into consideration for computation of performance.@ shows the current value of ` 10,000/- invested at the beginning of a given period. n.A.: not Available
Performance of FMP schemes, being close-ended in nature, is not strictly comparable with that of open-ended schemes since the investment strategy for FMP schemes is primarily buy-and-hold whereas open-ended schemes are actively managed.

50 January 2017 Intouch mutually
HDFC FMP 371D JUNE 2014 (3) NAV as on December 30, 2016 ` 12.3220A. Cumulative PerformanceDate Period NAV
per Unit (`)
Scheme Returns
(%)^
Benchmark Returns
(%)#
Additional Benchmark
Returns (%) ##
Value of Investment of Scheme ` 10000@
Scheme (`) Benchmark (`)#
Additional Benchmark
(`)##Dec 31, 15 Last 1 Year 11.3342 8.72 9.83 7.27 10,872 10,983 10,727Dec 31, 14 Last 2 Years 10.4379 8.65 9.24 7.75 11,805 11,934 11,609Jul 02, 14 Since Inception 10.0000 8.72 9.46 7.91 12,322 12,535 12,094
B. Discrete 12 month Returns (%) Period Scheme
^Benchmark
#Additional
Benchmark ##
Dec 31, 15 To Dec 30, 16 8.72 9.83 7.27Dec 31, 14 To Dec 31, 15 8.59 8.66 8.22
^Past performance may or may not be sustained in the future. Returns greater than 1 year period are compounded annualized (CAGR). # CRISIL Short Term Bond Fund Index ## CRISIL 1 year T-Bill Index
HDFC FMP 750D JUNE 2014 (1) NAV as on December 30, 2016 ` 12.2609A. Cumulative PerformanceDate Period NAV
per Unit (`)
Scheme Returns
(%)^
Benchmark Returns
(%)#
Additional Benchmark
Returns (%) ##
Value of Investment of Scheme ` 10000@
Scheme (`) Benchmark (`)#
Additional Benchmark
(`)##Dec 31, 15 Last 1 Year 11.3510 8.02 9.83 7.27 10,802 10,983 10,727Dec 31, 14 Last 2 Years 10.4848 8.14 9.24 7.75 11,694 11,934 11,609Jul 09, 14 Since Inception 10.0000 8.57 9.48 7.92 12,261 12,518 12,080
B. Discrete 12 month Returns (%) Period Scheme
^Benchmark
#Additional
Benchmark ##
Dec 31, 15 To Dec 30, 16 8.02 9.83 7.27Dec 31, 14 To Dec 31, 15 8.26 8.66 8.22
^Past performance may or may not be sustained in the future. Returns greater than 1 year period are compounded annualized (CAGR). # CRISIL Short Term Bond Fund Index ## CRISIL 1 year T-Bill Index
HDFC FMP 1123D JULY 2014 (1) NAV as on December 30, 2016 ` 12.3955A. Cumulative PerformanceDate Period NAV
per Unit (`)
Scheme Returns
(%)^
Benchmark Returns
(%)#
Additional Benchmark
Returns (%) ##
Value of Investment of Scheme ` 10000@
Scheme (`) Benchmark (`)#
Additional Benchmark
(`)##Dec 31, 15 Last 1 Year 11.4200 8.54 12.93 7.27 10,854 11,293 10,727Dec 31, 14 Last 2 Years 10.4880 8.71 10.76 7.75 11,819 12,268 11,609Aug 05, 14 Since Inception 10.0000 9.34 11.91 7.94 12,396 13,108 12,018
B. Discrete 12 month Returns (%) Period Scheme
^Benchmark
#Additional
Benchmark ##
Dec 31, 15 To Dec 30, 16 8.54 12.93 7.27Dec 31, 14 To Dec 31, 15 8.89 8.63 8.22
^Past performance may or may not be sustained in the future. Returns greater than 1 year period are compounded annualized (CAGR). # CRISIL Composite Bond Fund Index ## CRISIL 1 year T-Bill Index
HDFC FMP 1116D JULY 2014 (1) NAV as on December 30, 2016 ` 12.3691A. Cumulative PerformanceDate Period NAV
per Unit (`)
Scheme Returns
(%)^
Benchmark Returns
(%)#
Additional Benchmark
Returns (%) ##
Value of Investment of Scheme ` 10000@
Scheme (`) Benchmark (`)#
Additional Benchmark
(`)##Dec 31, 15 Last 1 Year 11.3969 8.53 12.93 7.27 10,853 11,293 10,727Dec 31, 14 Last 2 Years 10.4683 8.70 10.76 7.75 11,816 12,268 11,609Aug 12, 14 Since Inception 10.0000 9.32 11.99 7.94 12,369 13,101 12,001
B. Discrete 12 month Returns (%) Period Scheme
^Benchmark
#Additional
Benchmark ##
Dec 31, 15 To Dec 30, 16 8.53 12.93 7.27Dec 31, 14 To Dec 31, 15 8.87 8.63 8.22
^Past performance may or may not be sustained in the future. Returns greater than 1 year period are compounded annualized (CAGR). # CRISIL Composite Bond Fund Index ## CRISIL 1 year T-Bill Index
HDFC FMP 1184D JANUARY 2015 (1) NAV as on December 30, 2016 ` 12.1628A. Cumulative PerformanceDate Period NAV
per Unit (`)
Scheme Returns
(%)^
Benchmark Returns
(%)#
Additional Benchmark
Returns (%) ##
Value of Investment of Scheme ` 10000@
Scheme (`) Benchmark (`)#
Additional Benchmark
(`)##Dec 31, 15 Last 1 Year 10.9208 11.37 12.93 7.27 11,137 11,293 10,727Jan 29, 15 Since Inception 10.0000 10.73 10.27 7.66 12,163 12,065 11,522
B. Discrete 12 month Returns (%) Period Scheme
^Benchmark
#Additional
Benchmark ##
Dec 31, 15 To Dec 30, 16 11.37 12.93 7.27^Past performance may or may not be sustained in the future. Returns greater than 1 year period are compounded annualized (CAGR). # CRISIL Composite Bond Fund Index ## CRISIL 1 year T-Bill Index
HDFC FMP 1157D FEBRUARY 2015 (1) NAV as on December 30, 2016 ` 11.7147A. Cumulative PerformanceDate Period NAV
per Unit (`)
Scheme Returns
(%)^
Benchmark Returns
(%)#
Additional Benchmark
Returns (%) ##
Value of Investment of Scheme ` 10000@
Scheme (`) Benchmark (`)#
Additional Benchmark
(`)##Dec 31, 15 Last 1 Year 10.7178 9.30 12.93 7.27 10,930 11,293 10,727Feb 25, 15 Since Inception 10.0000 8.95 10.46 7.72 11,715 12,016 11,473
B. Discrete 12 month Returns (%) Period Scheme
^Benchmark
#Additional
Benchmark ##
Dec 31, 15 To Dec 30, 16 9.30 12.93 7.27^Past performance may or may not be sustained in the future. Returns greater than 1 year period are compounded annualized (CAGR). # CRISIL Composite Bond Fund Index ## CRISIL 1 year T-Bill Index
SCHEME PERFORMANCE - REGULAR PLAN - GROWTH OPTION (FUND MANAGER-WISE)SHOBHIT MEHROTRA....CONTINUED
Performance of dividend option under the schemes for the investors would be net of distribution tax as applicable. Load is not taken into consideration for computation of performance.@ shows the current value of ` 10,000/- invested at the beginning of a given period. n.A.: not Available
Performance of FMP schemes, being close-ended in nature, is not strictly comparable with that of open-ended schemes since the investment strategy for FMP schemes is primarily buy-and-hold whereas open-ended schemes are actively managed.

Intouch mutually January 2017 51
HDFC FMP 1135D MARCH 2015 (1) NAV as on December 30, 2016 ` 11.6495A. Cumulative PerformanceDate Period NAV
per Unit (`)
Scheme Returns
(%)^
Benchmark Returns
(%)#
Additional Benchmark
Returns (%) ##
Value of Investment of Scheme ` 10000@
Scheme (`) Benchmark (`)#
Additional Benchmark
(`)##Dec 31, 15 Last 1 Year 10.6578 9.30 12.93 7.27 10,930 11,293 10,727Mar 19, 15 Since Inception 10.0000 8.92 10.65 7.69 11,650 11,981 11,415
B. Discrete 12 month Returns (%) Period Scheme
^Benchmark
#Additional
Benchmark ##
Dec 31, 15 To Dec 30, 16 9.30 12.93 7.27^Past performance may or may not be sustained in the future. Returns greater than 1 year period are compounded annualized (CAGR). # CRISIL Composite Bond Fund Index ## CRISIL 1 year T-Bill Index
HDFC FMP 1128D MARCH 2015 (1) NAV as on December 30, 2016 ` 11.6108A. Cumulative PerformanceDate Period NAV
per Unit (`)
Scheme Returns
(%)^
Benchmark Returns
(%)#
Additional Benchmark
Returns (%) ##
Value of Investment of Scheme ` 10000@
Scheme (`) Benchmark (`)#
Additional Benchmark
(`)##Dec 31, 15 Last 1 Year 10.6344 9.18 12.93 7.27 10,918 11,293 10,727Mar 26, 15 Since Inception 10.0000 8.82 10.77 7.65 11,611 11,981 11,391
B. Discrete 12 month Returns (%) Period Scheme
^Benchmark
#Additional
Benchmark ##
Dec 31, 15 To Dec 30, 16 9.18 12.93 7.27^Past performance may or may not be sustained in the future. Returns greater than 1 year period are compounded annualized (CAGR). # CRISIL Composite Bond Fund Index ## CRISIL 1 year T-Bill Index
HDFC FMP 369D APRIL 2014 (1) NAV as on December 30, 2016 ` 12.5455A. Cumulative PerformanceDate Period NAV
per Unit (`)
Scheme Returns
(%)^
Benchmark Returns
(%)#
Additional Benchmark
Returns (%) ##
Value of Investment of Scheme ` 10000@
Scheme (`) Benchmark (`)#
Additional Benchmark
(`)##Dec 31, 15 Last 1 Year 11.5646 8.48 9.83 7.27 10,848 10,983 10,727Dec 31, 14 Last 2 Years 10.6884 8.34 9.24 7.75 11,737 11,934 11,609Apr 04, 14 Since Inception 10.0000 8.62 9.62 8.03 12,546 12,863 12,360
B. Discrete 12 month Returns (%) Period Scheme
^Benchmark
#Additional
Benchmark ##
Dec 31, 15 To Dec 30, 16 8.48 9.83 7.27Dec 31, 14 To Dec 31, 15 8.20 8.66 8.22
^Past performance may or may not be sustained in the future. Returns greater than 1 year period are compounded annualized (CAGR). # CRISIL Composite Bond Fund Index ## CRISIL 1 year T-Bill Index
HDFC FMP 370D APRIL 2014 (1) NAV as on December 30, 2016 ` 12.5225A. Cumulative PerformanceDate Period NAV
per Unit (`)
Scheme Returns
(%)^
Benchmark Returns
(%)#
Additional Benchmark
Returns (%) ##
Value of Investment of Scheme ` 10000@
Scheme (`) Benchmark (`)#
Additional Benchmark
(`)##Dec 31, 15 Last 1 Year 11.5419 8.50 9.83 7.27 10,850 10,983 10,727Dec 31, 14 Last 2 Years 10.6773 8.30 9.24 7.75 11,728 11,934 11,609Apr 10, 14 Since Inception 10.0000 8.60 9.62 8.04 12,523 12,846 12,346
B. Discrete 12 month Returns (%) Period Scheme
^Benchmark
#Additional
Benchmark ##
Dec 31, 15 To Dec 30, 16 8.50 9.83 7.27Dec 31, 14 To Dec 31, 15 8.10 8.66 8.22
^Past performance may or may not be sustained in the future. Returns greater than 1 year period are compounded annualized (CAGR). # CRISIL Composite Bond Fund Index ## CRISIL 1 year T-Bill Index
HDFC FMP 1100D APRIL 2014 (1) NAV as on December 30, 2016 ` 12.6358A. Cumulative PerformanceDate Period NAV
per Unit (`)
Scheme Returns
(%)^
Benchmark Returns
(%)#
Additional Benchmark
Returns (%) ##
Value of Investment of Scheme ` 10000@
Scheme (`) Benchmark (`)#
Additional Benchmark
(`)##Dec 31, 15 Last 1 Year 11.6747 8.23 12.93 7.27 10,823 11,293 10,727Dec 31, 14 Last 2 Years 10.7516 8.41 10.76 7.75 11,752 12,268 11,609Apr 22, 14 Since Inception 10.0000 9.08 12.07 8.03 12,636 13,591 12,311
B. Discrete 12 month Returns (%) Period Scheme
^Benchmark
#Additional
Benchmark ##
Dec 31, 15 To Dec 30, 16 8.23 12.93 7.27Dec 31, 14 To Dec 31, 15 8.59 8.63 8.22
^Past performance may or may not be sustained in the future. Returns greater than 1 year period are compounded annualized (CAGR). # CRISIL Composite Bond Fund Index ## CRISIL 1 year T-Bill Index
HDFC FMP 370D APRIL 2014 (2) NAV as on December 30, 2016 ` 12.5136A. Cumulative PerformanceDate Period NAV
per Unit (`)
Scheme Returns
(%)^
Benchmark Returns
(%)#
Additional Benchmark
Returns (%) ##
Value of Investment of Scheme ` 10000@
Scheme (`) Benchmark (`)#
Additional Benchmark
(`)##Dec 31, 15 Last 1 Year 11.5408 8.43 9.83 7.27 10,843 10,983 10,727Dec 31, 14 Last 2 Years 10.6604 8.34 9.24 7.75 11,738 11,934 11,609Apr 16, 14 Since Inception 10.0000 8.63 9.61 8.04 12,514 12,822 12,330
B. Discrete 12 month Returns (%) Period Scheme
^Benchmark
#Additional
Benchmark ##
Dec 31, 15 To Dec 30, 16 8.43 9.83 7.27Dec 31, 14 To Dec 31, 15 8.26 8.66 8.22
^Past performance may or may not be sustained in the future. Returns greater than 1 year period are compounded annualized (CAGR). # CRISIL Composite Bond Fund Index ## CRISIL 1 year T-Bill Index
SCHEME PERFORMANCE - REGULAR PLAN - GROWTH OPTION (FUND MANAGER-WISE)SHOBHIT MEHROTRA....CONTINUED
Performance of dividend option under the schemes for the investors would be net of distribution tax as applicable. Load is not taken into consideration for computation of performance.@ shows the current value of ` 10,000/- invested at the beginning of a given period. n.A.: not Available
Performance of FMP schemes, being close-ended in nature, is not strictly comparable with that of open-ended schemes since the investment strategy for FMP schemes is primarily buy-and-hold whereas open-ended schemes are actively managed.

52 January 2017 Intouch mutually
Performance of dividend option under the schemes for the investors would be net of distribution tax as applicable. Load is not taken into consideration for computation of performance.@ shows the current value of ` 10,000/- invested at the beginning of a given period. n.A.: not Available
Performance of FMP schemes, being close-ended in nature, is not strictly comparable with that of open-ended schemes since the investment strategy for FMP schemes is primarily buy-and-hold whereas open-ended schemes are actively managed.
HDFC FMP 369D APRIL 2014 (2) NAV as on December 30, 2016 ` 12.4899A. Cumulative PerformanceDate Period NAV
per Unit (`)
Scheme Returns
(%)^
Benchmark Returns
(%)#
Additional Benchmark
Returns (%) ##
Value of Investment of Scheme ` 10000@
Scheme (`) Benchmark (`)#
Additional Benchmark
(`)##Dec 31, 15 Last 1 Year 11.5218 8.40 9.83 7.27 10,840 10,983 10,727Dec 31, 14 Last 2 Years 10.6499 8.29 9.24 7.75 11,728 11,934 11,609Apr 17, 14 Since Inception 10.0000 8.56 9.59 8.04 12,490 12,814 12,327
B. Discrete 12 month Returns (%) Period Scheme
^Benchmark
#Additional
Benchmark ##
Dec 31, 15 To Dec 30, 16 8.40 9.83 7.27Dec 31, 14 To Dec 31, 15 8.19 8.66 8.22
^Past performance may or may not be sustained in the future. Returns greater than 1 year period are compounded annualized (CAGR). # CRISIL Composite Bond Fund Index ## CRISIL 1 year T-Bill Index
HDFC FMP 370D APRIL 2014 (3) NAV as on December 30, 2016 ` 12.5046A. Cumulative PerformanceDate Period NAV
per Unit (`)
Scheme Returns
(%)^
Benchmark Returns
(%)#
Additional Benchmark
Returns (%) ##
Value of Investment of Scheme ` 10000@
Scheme (`) Benchmark (`)#
Additional Benchmark
(`)##Dec 31, 15 Last 1 Year 11.5393 8.37 9.83 7.27 10,837 10,983 10,727Dec 31, 14 Last 2 Years 10.6414 8.40 9.24 7.75 11,751 11,934 11,609Apr 23, 14 Since Inception 10.0000 8.66 9.59 8.02 12,505 12,794 12,307
B. Discrete 12 month Returns (%) Period Scheme
^Benchmark
#Additional
Benchmark ##
Dec 31, 15 To Dec 30, 16 8.37 9.83 7.27Dec 31, 14 To Dec 31, 15 8.44 8.66 8.22
^Past performance may or may not be sustained in the future. Returns greater than 1 year period are compounded annualized (CAGR). # CRISIL Composite Bond Fund Index ## CRISIL 1 year T-Bill Index
HDFC FMP 367D APRIL 2014 (1) NAV as on December 30, 2016 ` 12.4981A. Cumulative PerformanceDate Period NAV
per Unit (`)
Scheme Returns
(%)^
Benchmark Returns
(%)#
Additional Benchmark
Returns (%) ##
Value of Investment of Scheme ` 10000@
Scheme (`) Benchmark (`)#
Additional Benchmark
(`)##Dec 31, 15 Last 1 Year 11.5253 8.44 9.83 7.27 10,844 10,983 10,727Dec 31, 14 Last 2 Years 10.6206 8.48 9.24 7.75 11,768 11,934 11,609Apr 29, 14 Since Inception 10.0000 8.70 9.59 8.03 12,498 12,774 12,293
B. Discrete 12 month Returns (%) Period Scheme
^Benchmark
#Additional
Benchmark ##
Dec 31, 15 To Dec 30, 16 8.44 9.83 7.27Dec 31, 14 To Dec 31, 15 8.52 8.66 8.22
^Past performance may or may not be sustained in the future. Returns greater than 1 year period are compounded annualized (CAGR). # CRISIL Composite Bond Fund Index ## CRISIL 1 year T-Bill Index
HDFC FMP 370D APRIL 2014 (4) NAV as on December 30, 2016 ` 12.5010A. Cumulative PerformanceDate Period NAV
per Unit (`)
Scheme Returns
(%)^
Benchmark Returns
(%)#
Additional Benchmark
Returns (%) ##
Value of Investment of Scheme ` 10000@
Scheme (`) Benchmark (`)#
Additional Benchmark
(`)##Dec 31, 15 Last 1 Year 11.5384 8.34 9.83 7.27 10,834 10,983 10,727Dec 31, 14 Last 2 Years 10.6253 8.47 9.24 7.75 11,765 11,934 11,609Apr 30, 14 Since Inception 10.0000 8.72 9.59 8.02 12,501 12,770 12,288
B. Discrete 12 month Returns (%) Period Scheme
^Benchmark
#Additional
Benchmark ##
Dec 31, 15 To Dec 30, 16 8.34 9.83 7.27Dec 31, 14 To Dec 31, 15 8.59 8.66 8.22
^Past performance may or may not be sustained in the future. Returns greater than 1 year period are compounded annualized (CAGR). # CRISIL Composite Bond Fund Index ## CRISIL 1 year T-Bill Index
HDFC FMP 730D APRIL 2014 (1) NAV as on December 30, 2016 ` 12.4091A. Cumulative PerformanceDate Period NAV
per Unit (`)
Scheme Returns
(%)^
Benchmark Returns
(%)#
Additional Benchmark
Returns (%) ##
Value of Investment of Scheme ` 10000@
Scheme (`) Benchmark (`)#
Additional Benchmark
(`)##Dec 31, 15 Last 1 Year 11.5042 7.87 9.83 7.27 10,787 10,983 10,727Dec 31, 14 Last 2 Years 10.6289 8.05 9.24 7.75 11,675 11,934 11,609May 13, 14 Since Inception 10.0000 8.53 9.53 7.99 12,409 12,710 12,246
B. Discrete 12 month Returns (%) Period Scheme
^Benchmark
#Additional
Benchmark ##
Dec 31, 15 To Dec 30, 16 7.87 9.83 7.27Dec 31, 14 To Dec 31, 15 8.24 8.66 8.22
^Past performance may or may not be sustained in the future. Returns greater than 1 year period are compounded annualized (CAGR). # CRISIL Composite Bond Fund Index ## CRISIL 1 year T-Bill Index
HDFC FMP 367D MAY 2014 (1) NAV as on December 30, 2016 ` 12.4893A. Cumulative PerformanceDate Period NAV
per Unit (`)
Scheme Returns
(%)^
Benchmark Returns
(%)#
Additional Benchmark
Returns (%) ##
Value of Investment of Scheme ` 10000@
Scheme (`) Benchmark (`)#
Additional Benchmark
(`)##Dec 31, 15 Last 1 Year 11.5156 8.46 9.83 7.27 10,846 10,983 10,727Dec 31, 14 Last 2 Years 10.6069 8.51 9.24 7.75 11,775 11,934 11,609May 06, 14 Since Inception 10.0000 8.73 9.56 8.00 12,489 12,744 12,266
B. Discrete 12 month Returns (%) Period Scheme
^Benchmark
#Additional
Benchmark ##
Dec 31, 15 To Dec 30, 16 8.46 9.83 7.27Dec 31, 14 To Dec 31, 15 8.57 8.66 8.22
^Past performance may or may not be sustained in the future. Returns greater than 1 year period are compounded annualized (CAGR). # CRISIL Composite Bond Fund Index ## CRISIL 1 year T-Bill Index
SCHEME PERFORMANCE - REGULAR PLAN - GROWTH OPTION (FUND MANAGER-WISE)SHOBHIT MEHROTRA....CONTINUED
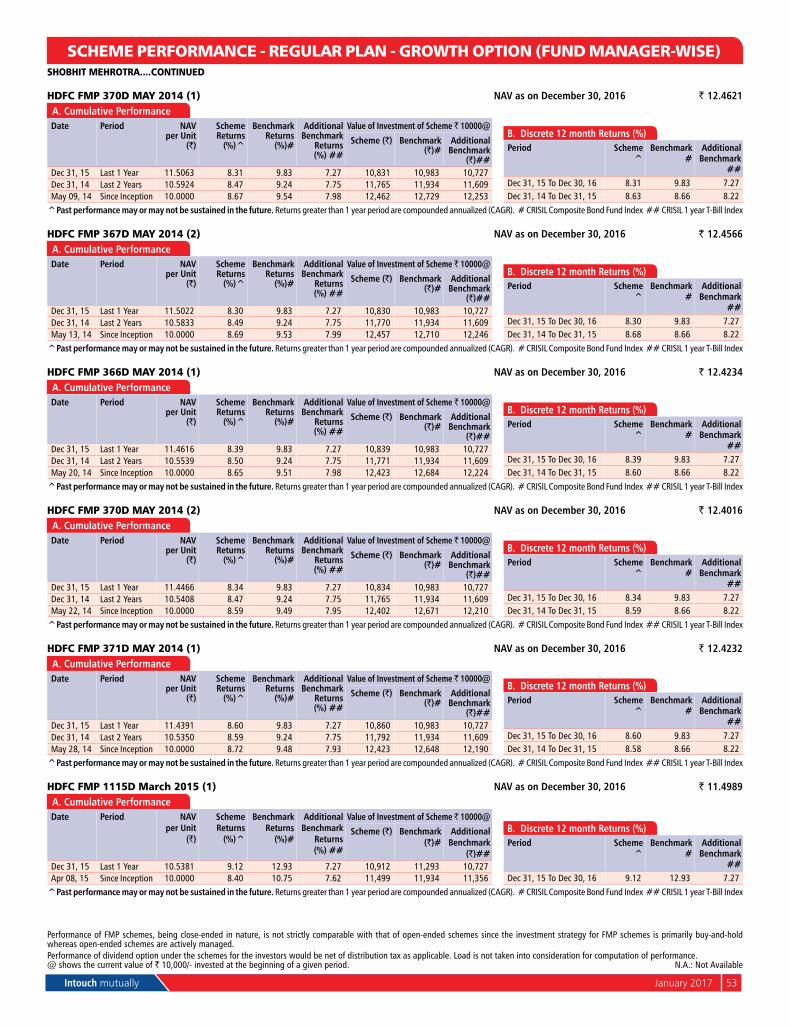
Intouch mutually January 2017 53
HDFC FMP 370D MAY 2014 (1) NAV as on December 30, 2016 ` 12.4621A. Cumulative PerformanceDate Period NAV
per Unit (`)
Scheme Returns
(%)^
Benchmark Returns
(%)#
Additional Benchmark
Returns (%) ##
Value of Investment of Scheme ` 10000@
Scheme (`) Benchmark (`)#
Additional Benchmark
(`)##Dec 31, 15 Last 1 Year 11.5063 8.31 9.83 7.27 10,831 10,983 10,727Dec 31, 14 Last 2 Years 10.5924 8.47 9.24 7.75 11,765 11,934 11,609May 09, 14 Since Inception 10.0000 8.67 9.54 7.98 12,462 12,729 12,253
B. Discrete 12 month Returns (%) Period Scheme
^Benchmark
#Additional
Benchmark ##
Dec 31, 15 To Dec 30, 16 8.31 9.83 7.27Dec 31, 14 To Dec 31, 15 8.63 8.66 8.22
^Past performance may or may not be sustained in the future. Returns greater than 1 year period are compounded annualized (CAGR). # CRISIL Composite Bond Fund Index ## CRISIL 1 year T-Bill Index
HDFC FMP 367D MAY 2014 (2) NAV as on December 30, 2016 ` 12.4566A. Cumulative PerformanceDate Period NAV
per Unit (`)
Scheme Returns
(%)^
Benchmark Returns
(%)#
Additional Benchmark
Returns (%) ##
Value of Investment of Scheme ` 10000@
Scheme (`) Benchmark (`)#
Additional Benchmark
(`)##Dec 31, 15 Last 1 Year 11.5022 8.30 9.83 7.27 10,830 10,983 10,727Dec 31, 14 Last 2 Years 10.5833 8.49 9.24 7.75 11,770 11,934 11,609May 13, 14 Since Inception 10.0000 8.69 9.53 7.99 12,457 12,710 12,246
B. Discrete 12 month Returns (%) Period Scheme
^Benchmark
#Additional
Benchmark ##
Dec 31, 15 To Dec 30, 16 8.30 9.83 7.27Dec 31, 14 To Dec 31, 15 8.68 8.66 8.22
^Past performance may or may not be sustained in the future. Returns greater than 1 year period are compounded annualized (CAGR). # CRISIL Composite Bond Fund Index ## CRISIL 1 year T-Bill Index
HDFC FMP 366D MAY 2014 (1) NAV as on December 30, 2016 ` 12.4234A. Cumulative PerformanceDate Period NAV
per Unit (`)
Scheme Returns
(%)^
Benchmark Returns
(%)#
Additional Benchmark
Returns (%) ##
Value of Investment of Scheme ` 10000@
Scheme (`) Benchmark (`)#
Additional Benchmark
(`)##Dec 31, 15 Last 1 Year 11.4616 8.39 9.83 7.27 10,839 10,983 10,727Dec 31, 14 Last 2 Years 10.5539 8.50 9.24 7.75 11,771 11,934 11,609May 20, 14 Since Inception 10.0000 8.65 9.51 7.98 12,423 12,684 12,224
B. Discrete 12 month Returns (%) Period Scheme
^Benchmark
#Additional
Benchmark ##
Dec 31, 15 To Dec 30, 16 8.39 9.83 7.27Dec 31, 14 To Dec 31, 15 8.60 8.66 8.22
^Past performance may or may not be sustained in the future. Returns greater than 1 year period are compounded annualized (CAGR). # CRISIL Composite Bond Fund Index ## CRISIL 1 year T-Bill Index
HDFC FMP 370D MAY 2014 (2) NAV as on December 30, 2016 ` 12.4016A. Cumulative PerformanceDate Period NAV
per Unit (`)
Scheme Returns
(%)^
Benchmark Returns
(%)#
Additional Benchmark
Returns (%) ##
Value of Investment of Scheme ` 10000@
Scheme (`) Benchmark (`)#
Additional Benchmark
(`)##Dec 31, 15 Last 1 Year 11.4466 8.34 9.83 7.27 10,834 10,983 10,727Dec 31, 14 Last 2 Years 10.5408 8.47 9.24 7.75 11,765 11,934 11,609May 22, 14 Since Inception 10.0000 8.59 9.49 7.95 12,402 12,671 12,210
B. Discrete 12 month Returns (%) Period Scheme
^Benchmark
#Additional
Benchmark ##
Dec 31, 15 To Dec 30, 16 8.34 9.83 7.27Dec 31, 14 To Dec 31, 15 8.59 8.66 8.22
^Past performance may or may not be sustained in the future. Returns greater than 1 year period are compounded annualized (CAGR). # CRISIL Composite Bond Fund Index ## CRISIL 1 year T-Bill Index
HDFC FMP 371D MAY 2014 (1) NAV as on December 30, 2016 ` 12.4232A. Cumulative PerformanceDate Period NAV
per Unit (`)
Scheme Returns
(%)^
Benchmark Returns
(%)#
Additional Benchmark
Returns (%) ##
Value of Investment of Scheme ` 10000@
Scheme (`) Benchmark (`)#
Additional Benchmark
(`)##Dec 31, 15 Last 1 Year 11.4391 8.60 9.83 7.27 10,860 10,983 10,727Dec 31, 14 Last 2 Years 10.5350 8.59 9.24 7.75 11,792 11,934 11,609May 28, 14 Since Inception 10.0000 8.72 9.48 7.93 12,423 12,648 12,190
B. Discrete 12 month Returns (%) Period Scheme
^Benchmark
#Additional
Benchmark ##
Dec 31, 15 To Dec 30, 16 8.60 9.83 7.27Dec 31, 14 To Dec 31, 15 8.58 8.66 8.22
^Past performance may or may not be sustained in the future. Returns greater than 1 year period are compounded annualized (CAGR). # CRISIL Composite Bond Fund Index ## CRISIL 1 year T-Bill Index
HDFC FMP 1115D March 2015 (1) NAV as on December 30, 2016 ` 11.4989A. Cumulative PerformanceDate Period NAV
per Unit (`)
Scheme Returns
(%)^
Benchmark Returns
(%)#
Additional Benchmark
Returns (%) ##
Value of Investment of Scheme ` 10000@
Scheme (`) Benchmark (`)#
Additional Benchmark
(`)##Dec 31, 15 Last 1 Year 10.5381 9.12 12.93 7.27 10,912 11,293 10,727Apr 08, 15 Since Inception 10.0000 8.40 10.75 7.62 11,499 11,934 11,356
B. Discrete 12 month Returns (%) Period Scheme
^Benchmark
#Additional
Benchmark ##
Dec 31, 15 To Dec 30, 16 9.12 12.93 7.27^Past performance may or may not be sustained in the future. Returns greater than 1 year period are compounded annualized (CAGR). # CRISIL Composite Bond Fund Index ## CRISIL 1 year T-Bill Index
SCHEME PERFORMANCE - REGULAR PLAN - GROWTH OPTION (FUND MANAGER-WISE)SHOBHIT MEHROTRA....CONTINUED
Performance of dividend option under the schemes for the investors would be net of distribution tax as applicable. Load is not taken into consideration for computation of performance.@ shows the current value of ` 10,000/- invested at the beginning of a given period. n.A.: not Available
Performance of FMP schemes, being close-ended in nature, is not strictly comparable with that of open-ended schemes since the investment strategy for FMP schemes is primarily buy-and-hold whereas open-ended schemes are actively managed.

54 January 2017 Intouch mutually
HDFC FMP 1106D May 2015 (1) NAV as on December 30, 2016 ` 11.4684A. Cumulative PerformanceDate Period NAV
per Unit (`)
Scheme Returns
(%)^
Benchmark Returns
(%)#
Additional Benchmark
Returns (%) ##
Value of Investment of Scheme ` 10000@
Scheme (`) Benchmark (`)#
Additional Benchmark
(`)##Dec 31, 15 Last 1 Year 10.4898 9.33 12.93 7.27 10,933 11,293 10,727May 20, 15 Since Inception 10.0000 8.85 11.17 7.61 11,468 11,867 11,258
B. Discrete 12 month Returns (%) Period Scheme
^Benchmark
#Additional
Benchmark ##
Dec 31, 15 To Dec 30, 16 9.33 12.93 7.27^Past performance may or may not be sustained in the future. Returns greater than 1 year period are compounded annualized (CAGR). # CRISIL Composite Bond Fund Index ## CRISIL 1 year T-Bill Index
HDFC FMP 1127D May 2015 (1) NAV as on December 30, 2016 ` 11.4913A. Cumulative PerformanceDate Period NAV
per Unit (`)
Scheme Returns
(%)^
Benchmark Returns
(%)#
Additional Benchmark
Returns (%) ##
Value of Investment of Scheme ` 10000@
Scheme (`) Benchmark (`)#
Additional Benchmark
(`)##Dec 31, 15 Last 1 Year 10.4210 10.27 12.93 7.27 11,027 11,293 10,727Jun 10, 15 Since Inception 10.0000 9.33 11.75 7.53 11,491 11,891 11,199
B. Discrete 12 month Returns (%) Period Scheme
^Benchmark
#Additional
Benchmark ##
Dec 31, 15 To Dec 30, 16 10.27 12.93 7.27^Past performance may or may not be sustained in the future. Returns greater than 1 year period are compounded annualized (CAGR). # CRISIL Composite Bond Fund Index ## CRISIL 1 year T-Bill Index
HDFC FMP 1112D June 2015 (1) NAV as on December 30, 2016 ` 11.4045A. Cumulative PerformanceDate Period NAV
per Unit (`)
Scheme Returns
(%)^
Benchmark Returns
(%)#
Additional Benchmark
Returns (%) ##
Value of Investment of Scheme ` 10000@
Scheme (`) Benchmark (`)#
Additional Benchmark
(`)##Dec 31, 15 Last 1 Year 10.4296 9.35 12.93 7.27 10,935 11,293 10,727Jul 02, 15 Since Inception 10.0000 9.17 11.80 7.48 11,405 11,820 11,142
B. Discrete 12 month Returns (%) Period Scheme
^Benchmark
#Additional
Benchmark ##
Dec 31, 15 To Dec 30, 16 9.35 12.93 7.27^Past performance may or may not be sustained in the future. Returns greater than 1 year period are compounded annualized (CAGR). # CRISIL Composite Bond Fund Index ## CRISIL 1 year T-Bill Index
HDFC FMP 1105D December 2015 (1) NAV as on December 30, 2016 ` 10.9219A. Cumulative PerformanceDate Period NAV
per Unit (`)
Scheme Returns
(%)^
Benchmark Returns
(%)#
Additional Benchmark
Returns (%) ##
Value of Investment of Scheme ` 10000@
Scheme (`) Benchmark (`)#
Additional Benchmark
(`)##Dec 31, 15 Last 1 Year 10.0109 9.10 12.93 7.27 10,910 11,293 10,727Dec 30, 15 Since Inception 10.0000 9.19 12.90 7.23 10,922 11,294 10,725
B. Discrete 12 month Returns (%) Period Scheme
^Benchmark
#Additional
Benchmark ##
Dec 31, 15 To Dec 30, 16 9.10 12.93 7.27^Past performance may or may not be sustained in the future. Returns greater than 1 year period are compounded annualized (CAGR). # CRISIL Composite Bond Fund Index ## CRISIL 1 year T-Bill IndexPerformance of FMP schemes, being close-ended in nature, is not strictly comparable with that of open-ended schemes since the investment strategy for FMP schemes is primarily buy-and-hold whereas open-ended schemes are actively managed.
ANIL BAMBOLIHDFC CASH MANAGEMENT FUND - CALL PLAN NAV as on December 30, 2016 ` 2,464.6377 A. Cumulative PerformanceDate Period NAV
per Unit (`)
Scheme Returns
(%)^
Benchmark Returns
(%)#
Additional Benchmark
Returns (%) ##
Value of Investment of Scheme ` 10000@
Scheme (`) Benchmark (`)#
Additional Benchmark
(`)##Dec 23, 16 Last 7 days 2,461.8523 0.11 0.13 0.08 10,011 10,013 10,008Dec 15, 16 Last 15 days 2,458.6729 0.24 0.25 0.17 10,024 10,025 10,017nov 30, 16 Last 1 Month 2,452.8446 0.48 0.48 0.19 10,048 10,048 10,019Dec 31, 15 Last 1 Year 2,316.1874 6.41 7.48 7.27 10,641 10,748 10,727Dec 31, 14 Last 2 Year 2,158.7600 6.85 7.86 7.75 11,417 11,633 11,609Dec 31, 13 Last 3 Years 1,995.9000 7.28 8.31 8.02 12,349 12,705 12,603Feb 06, 02 Since Inception 1,000.0000 6.24 n.A. 5.98 24,646 n.A. 23,769
B. Discrete 12 month Returns (%) Period Scheme
^Benchmark
#Additional
Benchmark ##
Dec 31, 15 To Dec 30, 16 6.41 7.48 7.27Dec 31, 14 To Dec 31, 15 7.29 8.23 8.22Dec 31, 13 To Dec 31, 14 8.16 9.21 8.56
^Past performance may or may not be sustained in the future. Returns greater than 1 year period are compounded annualized (CAGR). # CRISIL Liquid Fund Index ## CRISIL 1 year T-Bill Index.
HDFC ANNUAL INTERVAL FUND - SERIES I - PLAN A NAV as on December 30, 2016 ` 13.8510
A. Cumulative PerformanceDate Period NAV
per Unit (`)
Scheme Returns
(%)^
Benchmark Returns
(%)#
Additional Benchmark
Returns (%) ##
Value of Investment of Scheme ` 10000@
Scheme (`) Benchmark (`)#
Additional Benchmark
(`)##Dec 31, 15 Last 1 Year 12.8235 8.01 9.83 7.27 10,801 10,983 10,727Dec 31, 14 Last 2 Years 11.7948 8.37 9.24 7.75 11,743 11,934 11,609Dec 31, 13 Last 3 Years 10.7614 8.78 9.65 8.02 12,871 13,183 12,603Mar 06, 13 Since Inception 10.0000 8.90 9.38 7.43 13,851 14,087 13,151
B. Discrete 12 month Returns (%) Period Scheme
^Benchmark
#Additional
Benchmark ##
Dec 31, 15 To Dec 30, 16 8.01 9.83 7.27Dec 31, 14 To Dec 31, 15 8.72 8.66 8.22Dec 31, 13 To Dec 31, 14 9.60 10.47 8.56
^Past performance may or may not be sustained in the future. Returns greater than 1 year period are compounded annualized (CAGR). # CRISIL Short Term Bond Fund Index ## CRISIL 1 year T-Bill Index.Scheme performance may not strictly be comparable with that of its Additional Benchmark as the scheme can invest only in instruments having maturity upto the opening of the immediately following specified transaction period, which is at annual intervals.
SCHEME PERFORMANCE - REGULAR PLAN - GROWTH OPTION (FUND MANAGER-WISE)
Performance of dividend option under the schemes for the investors would be net of distribution tax as applicable. Load is not taken into consideration for computation of performance.@ shows the current value of ` 10,000/- invested at the beginning of a given period. n.A.: not Available
SHOBHIT MEHROTRA....CONTINUED

Intouch mutually January 2017 55
HDFC ANNUAL INTERVAL FUND - SERIES I - PLAN B NAV as on December 30, 2016 ` 13.7542A. Cumulative PerformanceDate Period NAV
per Unit (`)
Scheme Returns
(%)^
Benchmark Returns
(%)#
Additional Benchmark
Returns (%) ##
Value of Investment of Scheme ` 10000@
Scheme (`) Benchmark (`)#
Additional Benchmark
(`)##Dec 31, 15 Last 1 Year 12.7460 7.91 9.83 7.27 10,791 10,983 10,727Dec 31, 14 Last 2 Years 11.7250 8.31 9.24 7.75 11,731 11,934 11,609Dec 31, 13 Last 3 Years 10.7164 8.67 9.65 8.02 12,835 13,183 12,603Mar 14, 13 Since Inception 10.0000 8.75 9.35 7.42 13,754 14,045 13,128
B. Discrete 12 month Returns (%) Period Scheme
^Benchmark
#Additional
Benchmark ##
Dec 31, 15 To Dec 30, 16 7.91 9.83 7.27Dec 31, 14 To Dec 31, 15 8.71 8.66 8.22Dec 31, 13 To Dec 31, 14 9.41 10.47 8.56
^Past performance may or may not be sustained in the future. Returns greater than 1 year period are compounded annualized (CAGR). # CRISIL Short Term Bond Fund Index ## CRISIL 1 year T-Bill Index.Scheme performance may not strictly be comparable with that of its Additional Benchmark as the scheme can invest only in instruments having maturity upto the opening of the immediately following specified transaction period, which is at annual intervals.
HDFC DEBT FUND FOR CANCER CURE - 2014 NAV as on December 30, 2016 ` 10.2528A. Cumulative PerformanceDate Period NAV
per Unit (`)
Scheme Returns
(%)^
Benchmark Returns
(%)#
Additional Benchmark
Returns (%) ##
Value of Investment of Scheme ` 10000@
Scheme (`) Benchmark (`)#
Additional Benchmark
(`)##Dec 31, 15 Last 1 Year 10.3595 7.01 9.83 7.27 10,701 10,983 10,727Dec 31, 14 Last 2 Years 10.4198 7.61 9.24 7.75 11,581 11,934 11,609Mar 18, 14 Since Inception 10.0000 8.86 9.64 8.03 12,670 12,927 12,404
B. Discrete 12 month Returns (%) Period Scheme
^Benchmark
#Additional
Benchmark ##
Dec 31, 15 To Dec 30, 16 7.01 9.83 7.27Dec 31, 14 To Dec 31, 15 8.22 8.66 8.22
^Past performance may or may not be sustained in the future. Returns greater than 1 year period are compounded annualized (CAGR). # CRISIL Short-Term Bond Fund Index ## CRISIL 1 year T-Bill Index.Performance of close-ended Scheme is not strictly comparable with that of open-ended schemes since the investment strategy for close ended schemes is primarily buy and hold whereas open ended schemes are actively managed. Returns of HDFC Debt Fund For Cancer Cure - 2014 are computed based on nAV of Dividend Option and all dividends (after statutory levy) are assumed to be reinvested in the units of the scheme at the then prevailing nAV (ex-dividend nAV).
HDFC FMP 370D JULY 2013 (3) NAV as on December 30, 2016 ` 13.4609A. Cumulative PerformanceDate Period NAV
per Unit (`)
Scheme Returns
(%)^
Benchmark Returns
(%)#
Additional Benchmark
Returns (%) ##
Value of Investment of Scheme ` 10000@
Scheme (`) Benchmark (`)#
Additional Benchmark
(`)##Dec 31, 15 Last 1 Year 12.4641 8.00 9.83 7.27 10,800 10,983 10,727Dec 31, 14 Last 2 Years 11.4830 8.27 9.24 7.75 11,722 11,934 11,609Dec 31, 13 Last 3 Years 10.4269 8.89 9.65 8.02 12,910 13,183 12,603Jul 31, 13 Since Inception 10.0000 9.08 9.85 8.10 13,461 13,789 13,052
B. Discrete 12 month Returns (%) Period Scheme
^Benchmark
#Additional
Benchmark ##
Dec 31, 15 To Dec 30, 16 8.00 9.83 7.27Dec 31, 14 To Dec 31, 15 8.54 8.66 8.22Dec 31, 13 To Dec 31, 14 10.13 10.47 8.56
^Past performance may or may not be sustained in the future. Returns greater than 1 year period are compounded annualized (CAGR). # CRISIL Short Term Bond Fund Index ## CRISIL 1 year T-Bill Index
HDFC FMP 370D AUGUST 2013 (1) NAV as on December 30, 2016 ` 13.4605A. Cumulative PerformanceDate Period NAV
per Unit (`)
Scheme Returns
(%)^
Benchmark Returns
(%)#
Additional Benchmark
Returns (%) ##
Value of Investment of Scheme ` 10000@
Scheme (`) Benchmark (`)#
Additional Benchmark
(`)##Dec 31, 15 Last 1 Year 12.4389 8.21 9.83 7.27 10,821 10,983 10,727Dec 31, 14 Last 2 Years 11.4589 8.38 9.24 7.75 11,747 11,934 11,609Dec 31, 13 Last 3 Years 10.4144 8.93 9.65 8.02 12,925 13,183 12,603Aug 08, 13 Since Inception 10.0000 9.14 9.79 8.05 13,461 13,735 13,010
B. Discrete 12 month Returns (%) Period Scheme
^Benchmark
#Additional
Benchmark ##
Dec 31, 15 To Dec 30, 16 8.21 9.83 7.27Dec 31, 14 To Dec 31, 15 8.55 8.66 8.22Dec 31, 13 To Dec 31, 14 10.03 10.47 8.56
^Past performance may or may not be sustained in the future. Returns greater than 1 year period are compounded annualized (CAGR). # CRISIL Short Term Bond Fund Index ## CRISIL 1 year T-Bill Index
HDFC FMP 370D AUGUST 2013 (2) NAV as on December 30, 2016 ` 13.5047A. Cumulative PerformanceDate Period NAV
per Unit (`)
Scheme Returns
(%)^
Benchmark Returns
(%)#
Additional Benchmark
Returns (%) ##
Value of Investment of Scheme ` 10000@
Scheme (`) Benchmark (`)#
Additional Benchmark
(`)##Dec 31, 15 Last 1 Year 12.4764 8.24 9.83 7.27 10,824 10,983 10,727Dec 31, 14 Last 2 Years 11.4832 8.45 9.24 7.75 11,760 11,934 11,609Dec 31, 13 Last 3 Years 10.4437 8.95 9.65 8.02 12,931 13,183 12,603Aug 14, 13 Since Inception 10.0000 9.29 9.91 8.17 13,505 13,764 13,043
B. Discrete 12 month Returns (%) Period Scheme
^Benchmark
#Additional
Benchmark ##
Dec 31, 15 To Dec 30, 16 8.24 9.83 7.27Dec 31, 14 To Dec 31, 15 8.65 8.66 8.22Dec 31, 13 To Dec 31, 14 9.95 10.47 8.56
^Past performance may or may not be sustained in the future. Returns greater than 1 year period are compounded annualized (CAGR). # CRISIL Short Term Bond Fund Index ## CRISIL 1 year T-Bill Index
SCHEME PERFORMANCE - REGULAR PLAN - GROWTH OPTION (FUND MANAGER-WISE)
Performance of dividend option under the schemes for the investors would be net of distribution tax as applicable. Load is not taken into consideration for computation of performance.@ shows the current value of ` 10,000/- invested at the beginning of a given period. n.A.: not Available
Performance of FMP schemes, being close-ended in nature, is not strictly comparable with that of open-ended schemes since the investment strategy for FMP schemes is primarily buy-and-hold whereas open-ended schemes are actively managed.
ANIL BAMBOLI....CONTINUED
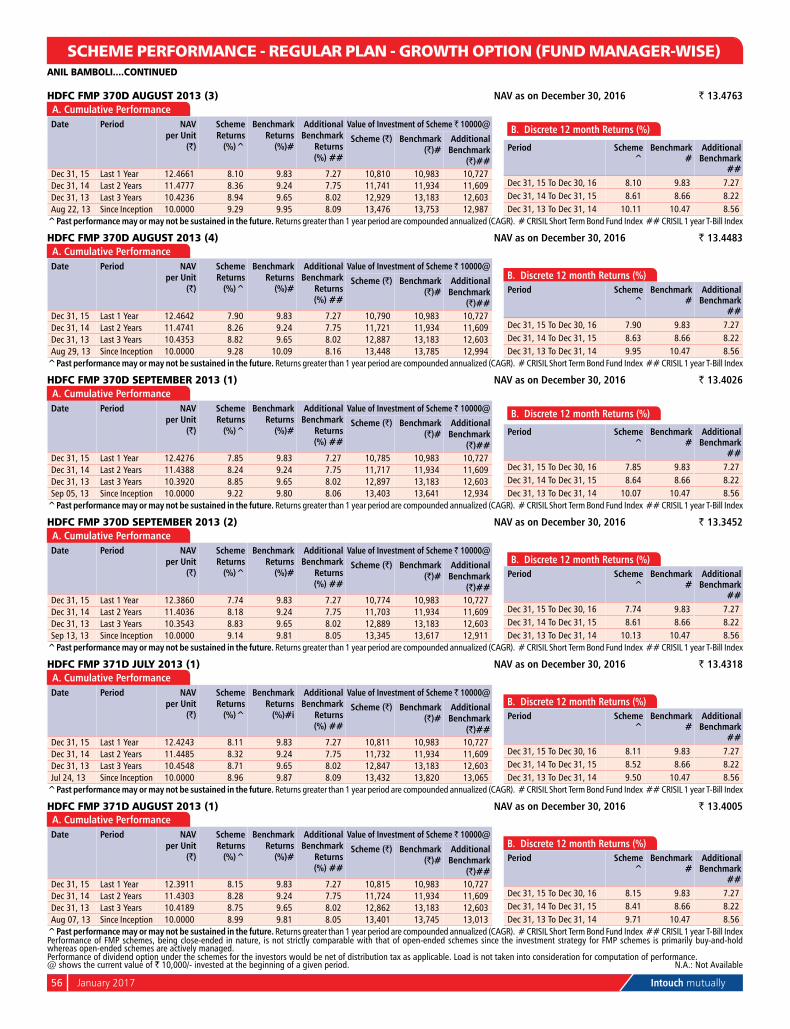
56 January 2017 Intouch mutually
HDFC FMP 370D AUGUST 2013 (3) NAV as on December 30, 2016 ` 13.4763A. Cumulative PerformanceDate Period NAV
per Unit (`)
Scheme Returns
(%)^
Benchmark Returns
(%)#
Additional Benchmark
Returns (%) ##
Value of Investment of Scheme ` 10000@
Scheme (`) Benchmark (`)#
Additional Benchmark
(`)##Dec 31, 15 Last 1 Year 12.4661 8.10 9.83 7.27 10,810 10,983 10,727Dec 31, 14 Last 2 Years 11.4777 8.36 9.24 7.75 11,741 11,934 11,609Dec 31, 13 Last 3 Years 10.4236 8.94 9.65 8.02 12,929 13,183 12,603Aug 22, 13 Since Inception 10.0000 9.29 9.95 8.09 13,476 13,753 12,987
B. Discrete 12 month Returns (%)
Period Scheme ^
Benchmark #
Additional Benchmark
##Dec 31, 15 To Dec 30, 16 8.10 9.83 7.27Dec 31, 14 To Dec 31, 15 8.61 8.66 8.22Dec 31, 13 To Dec 31, 14 10.11 10.47 8.56
^Past performance may or may not be sustained in the future. Returns greater than 1 year period are compounded annualized (CAGR). # CRISIL Short Term Bond Fund Index ## CRISIL 1 year T-Bill Index
HDFC FMP 370D AUGUST 2013 (4) NAV as on December 30, 2016 ` 13.4483A. Cumulative PerformanceDate Period NAV
per Unit (`)
Scheme Returns
(%)^
Benchmark Returns
(%)#
Additional Benchmark
Returns (%) ##
Value of Investment of Scheme ` 10000@
Scheme (`) Benchmark (`)#
Additional Benchmark
(`)##Dec 31, 15 Last 1 Year 12.4642 7.90 9.83 7.27 10,790 10,983 10,727Dec 31, 14 Last 2 Years 11.4741 8.26 9.24 7.75 11,721 11,934 11,609Dec 31, 13 Last 3 Years 10.4353 8.82 9.65 8.02 12,887 13,183 12,603Aug 29, 13 Since Inception 10.0000 9.28 10.09 8.16 13,448 13,785 12,994
B. Discrete 12 month Returns (%) Period Scheme
^Benchmark
#Additional
Benchmark ##
Dec 31, 15 To Dec 30, 16 7.90 9.83 7.27Dec 31, 14 To Dec 31, 15 8.63 8.66 8.22Dec 31, 13 To Dec 31, 14 9.95 10.47 8.56
^Past performance may or may not be sustained in the future. Returns greater than 1 year period are compounded annualized (CAGR). # CRISIL Short Term Bond Fund Index ## CRISIL 1 year T-Bill Index
HDFC FMP 370D SEPTEMBER 2013 (1) NAV as on December 30, 2016 ` 13.4026A. Cumulative PerformanceDate Period NAV
per Unit (`)
Scheme Returns
(%)^
Benchmark Returns
(%)#
Additional Benchmark
Returns (%) ##
Value of Investment of Scheme ` 10000@
Scheme (`) Benchmark (`)#
Additional Benchmark
(`)##Dec 31, 15 Last 1 Year 12.4276 7.85 9.83 7.27 10,785 10,983 10,727Dec 31, 14 Last 2 Years 11.4388 8.24 9.24 7.75 11,717 11,934 11,609Dec 31, 13 Last 3 Years 10.3920 8.85 9.65 8.02 12,897 13,183 12,603Sep 05, 13 Since Inception 10.0000 9.22 9.80 8.06 13,403 13,641 12,934
B. Discrete 12 month Returns (%)
Period Scheme ^
Benchmark #
Additional Benchmark
##Dec 31, 15 To Dec 30, 16 7.85 9.83 7.27Dec 31, 14 To Dec 31, 15 8.64 8.66 8.22Dec 31, 13 To Dec 31, 14 10.07 10.47 8.56
^Past performance may or may not be sustained in the future. Returns greater than 1 year period are compounded annualized (CAGR). # CRISIL Short Term Bond Fund Index ## CRISIL 1 year T-Bill Index
HDFC FMP 370D SEPTEMBER 2013 (2) NAV as on December 30, 2016 ` 13.3452A. Cumulative PerformanceDate Period NAV
per Unit (`)
Scheme Returns
(%)^
Benchmark Returns
(%)#
Additional Benchmark
Returns (%) ##
Value of Investment of Scheme ` 10000@
Scheme (`) Benchmark (`)#
Additional Benchmark
(`)##Dec 31, 15 Last 1 Year 12.3860 7.74 9.83 7.27 10,774 10,983 10,727Dec 31, 14 Last 2 Years 11.4036 8.18 9.24 7.75 11,703 11,934 11,609Dec 31, 13 Last 3 Years 10.3543 8.83 9.65 8.02 12,889 13,183 12,603Sep 13, 13 Since Inception 10.0000 9.14 9.81 8.05 13,345 13,617 12,911
B. Discrete 12 month Returns (%)Period Scheme
^Benchmark
#Additional
Benchmark ##
Dec 31, 15 To Dec 30, 16 7.74 9.83 7.27Dec 31, 14 To Dec 31, 15 8.61 8.66 8.22Dec 31, 13 To Dec 31, 14 10.13 10.47 8.56
^Past performance may or may not be sustained in the future. Returns greater than 1 year period are compounded annualized (CAGR). # CRISIL Short Term Bond Fund Index ## CRISIL 1 year T-Bill Index
HDFC FMP 371D JULY 2013 (1) NAV as on December 30, 2016 ` 13.4318A. Cumulative PerformanceDate Period NAV
per Unit (`)
Scheme Returns
(%)^
Benchmark Returns
(%)#i
Additional Benchmark
Returns (%) ##
Value of Investment of Scheme ` 10000@
Scheme (`) Benchmark (`)#
Additional Benchmark
(`)##Dec 31, 15 Last 1 Year 12.4243 8.11 9.83 7.27 10,811 10,983 10,727Dec 31, 14 Last 2 Years 11.4485 8.32 9.24 7.75 11,732 11,934 11,609Dec 31, 13 Last 3 Years 10.4548 8.71 9.65 8.02 12,847 13,183 12,603Jul 24, 13 Since Inception 10.0000 8.96 9.87 8.09 13,432 13,820 13,065
B. Discrete 12 month Returns (%) Period Scheme
^Benchmark
#Additional
Benchmark ##
Dec 31, 15 To Dec 30, 16 8.11 9.83 7.27Dec 31, 14 To Dec 31, 15 8.52 8.66 8.22Dec 31, 13 To Dec 31, 14 9.50 10.47 8.56
^Past performance may or may not be sustained in the future. Returns greater than 1 year period are compounded annualized (CAGR). # CRISIL Short Term Bond Fund Index ## CRISIL 1 year T-Bill Index
HDFC FMP 371D AUGUST 2013 (1) NAV as on December 30, 2016 ` 13.4005A. Cumulative PerformanceDate Period NAV
per Unit (`)
Scheme Returns
(%)^
Benchmark Returns
(%)#
Additional Benchmark
Returns (%) ##
Value of Investment of Scheme ` 10000@
Scheme (`) Benchmark (`)#
Additional Benchmark
(`)##Dec 31, 15 Last 1 Year 12.3911 8.15 9.83 7.27 10,815 10,983 10,727Dec 31, 14 Last 2 Years 11.4303 8.28 9.24 7.75 11,724 11,934 11,609Dec 31, 13 Last 3 Years 10.4189 8.75 9.65 8.02 12,862 13,183 12,603Aug 07, 13 Since Inception 10.0000 8.99 9.81 8.05 13,401 13,745 13,013
B. Discrete 12 month Returns (%) Period Scheme
^Benchmark
#Additional
Benchmark ##
Dec 31, 15 To Dec 30, 16 8.15 9.83 7.27Dec 31, 14 To Dec 31, 15 8.41 8.66 8.22Dec 31, 13 To Dec 31, 14 9.71 10.47 8.56
^Past performance may or may not be sustained in the future. Returns greater than 1 year period are compounded annualized (CAGR). # CRISIL Short Term Bond Fund Index ## CRISIL 1 year T-Bill Index
SCHEME PERFORMANCE - REGULAR PLAN - GROWTH OPTION (FUND MANAGER-WISE)
Performance of dividend option under the schemes for the investors would be net of distribution tax as applicable. Load is not taken into consideration for computation of performance.@ shows the current value of ` 10,000/- invested at the beginning of a given period. n.A.: not Available
Performance of FMP schemes, being close-ended in nature, is not strictly comparable with that of open-ended schemes since the investment strategy for FMP schemes is primarily buy-and-hold whereas open-ended schemes are actively managed.
ANIL BAMBOLI....CONTINUED

Intouch mutually January 2017 57
HDFC FMP 504D DECEMBER 2013 (1) NAV as on December 30, 2016 ` 12.8402A. Cumulative PerformanceDate Period NAV
per Unit (`)
Scheme Returns
(%)^
Benchmark Returns
(%)#
Additional Benchmark
Returns (%) ##
Value of Investment of Scheme ` 10000@
Scheme (`) Benchmark (`)#
Additional Benchmark
(`)##Dec 31, 15 Last 1 Year 11.8588 8.28 9.83 7.27 10,828 10,983 10,727Dec 31, 14 Last 2 Years 10.9546 8.26 9.24 7.75 11,721 11,934 11,609Dec 31, 13 Last 3 Years 10.0005 8.69 9.65 8.02 12,840 13,183 12,603Dec 27, 13 Since Inception 10.0000 8.66 9.65 8.01 12,840 13,198 12,610
B. Discrete 12 month Returns (%) Period Scheme
^Benchmark
#Additional
Benchmark ##
Dec 31, 15 To Dec 30, 16 8.28 9.83 7.27Dec 31, 14 To Dec 31, 15 8.25 8.66 8.22Dec 31, 13 To Dec 31, 14 9.54 10.47 8.56
^Past performance may or may not be sustained in the future. Returns greater than 1 year period are compounded annualized (CAGR). # CRISIL Short Term Bond Fund Index ## CRISIL 1 year T-Bill Index
HDFC FMP 531D DECEMBER 2013 (1) NAV as on December 30, 2016 ` 12.8162A. Cumulative PerformanceDate Period NAV
per Unit (`)
Scheme Returns
(%)^
Benchmark Returns
(%)#
Additional Benchmark
Returns (%) ##
Value of Investment of Scheme ` 10000@
Scheme (`) Benchmark (`)#
Additional Benchmark
(`)##Dec 31, 15 Last 1 Year 11.8819 7.86 9.83 7.27 10,786 10,983 10,727Dec 31, 14 Last 2 Years 10.9641 8.12 9.24 7.75 11,689 11,934 11,609Dec 31, 13 Last 3 Years 10.0178 8.56 9.65 8.02 12,793 13,183 12,603Dec 20, 13 Since Inception 10.0000 8.53 9.64 7.99 12,816 13,215 12,622
B. Discrete 12 month Returns (%) Period Scheme
^Benchmark
#Additional
Benchmark ##
Dec 31, 15 To Dec 30, 16 7.86 9.83 7.27Dec 31, 14 To Dec 31, 15 8.37 8.66 8.22Dec 31, 13 To Dec 31, 14 9.45 10.47 8.56
^Past performance may or may not be sustained in the future. Returns greater than 1 year period are compounded annualized (CAGR). # CRISIL Short Term Bond Fund Index ## CRISIL 1 year T-Bill Index
HDFC FMP 1143D JULY 2013 (1) NAV as on December 30, 2016 ` 13.5073A. Cumulative PerformanceDate Period NAV
per Unit (`)
Scheme Returns
(%)^
Benchmark Returns
(%)#
Additional Benchmark
Returns (%) ##
Value of Investment of Scheme ` 10000@
Scheme (`) Benchmark (`)#
Additional Benchmark
(`)##Dec 31, 15 Last 1 Year 12.5176 7.91 12.93 7.27 10,791 11,293 10,727Dec 31, 14 Last 2 Years 11.5679 8.06 10.76 7.75 11,677 12,268 11,609Dec 31, 13 Last 3 Years 10.4276 9.01 11.93 8.02 12,953 14,023 12,603Aug 06, 13 Since Inception 10.0000 9.24 11.17 8.05 13,507 14,340 13,016
B. Discrete 12 month Returns (%) Period Scheme
^Benchmark
#Additional
Benchmark ##
Dec 31, 15 To Dec 30, 16 7.91 12.93 7.27Dec 31, 14 To Dec 31, 15 8.21 8.63 8.22Dec 31, 13 To Dec 31, 14 10.94 14.31 8.56
^Past performance may or may not be sustained in the future. Returns greater than 1 year period are compounded annualized (CAGR). # CRISIL Composite Bond Fund Index ## CRISIL 1 year T-Bill Index
HDFC FMP 1846D AUGUST 2013 (1) NAV as on December 30, 2016 ` 13.8030A. Cumulative PerformanceDate Period NAV
per Unit (`)
Scheme Returns
(%)^
Benchmark Returns
(%)#
Additional Benchmark
Returns (%) ##
Value of Investment of Scheme ` 10000@
Scheme (`) Benchmark (`)#
Additional Benchmark
(`)##Dec 31, 15 Last 1 Year 12.7119 8.58 12.93 7.27 10,858 11,293 10,727Dec 31, 14 Last 2 Years 11.7257 8.50 10.76 7.75 11,772 12,268 11,609Dec 31, 13 Last 3 Years 10.4768 9.63 11.93 8.02 13,175 14,023 12,603Aug 14, 13 Since Inception 10.0000 10.00 11.68 8.17 13,803 14,528 13,043
B. Discrete 12 month Returns (%) Period Scheme
^Benchmark
#Additional
Benchmark ##
Dec 31, 15 To Dec 30, 16 8.58 12.93 7.27Dec 31, 14 To Dec 31, 15 8.41 8.63 8.22Dec 31, 13 To Dec 31, 14 11.92 14.31 8.56
^Past performance may or may not be sustained in the future. Returns greater than 1 year period are compounded annualized (CAGR). # CRISIL Composite Bond Fund Index ## CRISIL 1 year T-Bill Index
HDFC FMP 1875D AUGUST 2013 (1) NAV as on December 30, 2016 ` 13.9121A. Cumulative PerformanceDate Period NAV
per Unit (`)
Scheme Returns
(%)^
Benchmark Returns
(%)#
Additional Benchmark
Returns (%) ##
Value of Investment of Scheme ` 10000@
Scheme (`) Benchmark (`)#
Additional Benchmark
(`)##Dec 31, 15 Last 1 Year 12.7227 9.35 12.93 7.27 10,935 11,293 10,727Dec 31, 14 Last 2 Years 11.6605 9.23 10.76 7.75 11,931 12,268 11,609Dec 31, 13 Last 3 Years 10.3752 10.27 11.93 8.02 13,409 14,023 12,603Sep 04, 13 Since Inception 10.0000 10.45 11.52 8.06 13,912 14,368 12,937
B. Discrete 12 month Returns (%) Period Scheme
^Benchmark
#Additional
Benchmark ##
Dec 31, 15 To Dec 30, 16 9.35 12.93 7.27Dec 31, 14 To Dec 31, 15 9.11 8.63 8.22Dec 31, 13 To Dec 31, 14 12.39 14.31 8.56
^Past performance may or may not be sustained in the future. Returns greater than 1 year period are compounded annualized (CAGR). # CRISIL Composite Bond Fund Index ## CRISIL 1 year T-Bill Index
HDFC FMP 1095D MARCH 2014 (1) NAV as on December 30, 2016 ` 13.0187A. Cumulative PerformanceDate Period NAV
per Unit (`)
Scheme Returns
(%)^
Benchmark Returns
(%)#
Additional Benchmark
Returns (%) ##
Value of Investment of Scheme ` 10000@
Scheme (`) Benchmark (`)#
Additional Benchmark
(`)##Dec 31, 15 Last 1 Year 11.9514 8.93 9.83 7.27 10,893 10,983 10,727Dec 31, 14 Last 2 Years 10.8611 9.48 9.24 7.75 11,987 11,934 11,609Mar 26, 14 Since Inception 10.0000 10.00 9.60 8.00 13,019 12,887 12,373
B. Discrete 12 month Returns (%) Period Scheme
^Benchmark
#Additional
Benchmark ##
Dec 31, 15 To Dec 30, 16 8.93 9.83 7.27Dec 31, 14 To Dec 31, 15 10.04 8.66 8.22
^Past performance may or may not be sustained in the future. Returns greater than 1 year period are compounded annualized (CAGR). # CRISIL Short Term Bond Fund Index ## CRISIL 1 year T-Bill Index
SCHEME PERFORMANCE - REGULAR PLAN - GROWTH OPTION (FUND MANAGER-WISE)ANIL BAMBOLI....CONTINUED
Performance of dividend option under the schemes for the investors would be net of distribution tax as applicable. Load is not taken into consideration for computation of performance.@ shows the current value of ` 10,000/- invested at the beginning of a given period. n.A.: not Available
Performance of FMP schemes, being close-ended in nature, is not strictly comparable with that of open-ended schemes since the investment strategy for FMP schemes is primarily buy-and-hold whereas open-ended schemes are actively managed.

58 January 2017 Intouch mutually
HDFC FMP 1127D MARCH 2014 (1) NAV as on December 30, 2016 ` 13.2078A. Cumulative PerformanceDate Period NAV
per Unit (`)
Scheme Returns
(%)^
Benchmark Returns
(%)#
Additional Benchmark
Returns (%) ##
Value of Investment of Scheme ` 10000@
Scheme (`) Benchmark (`)#
Additional Benchmark
(`)##Dec 31, 15 Last 1 Year 12.1715 8.51 12.93 7.27 10,851 11,293 10,727Dec 31, 14 Last 2 Years 10.9699 9.73 10.76 7.75 12,040 12,268 11,609Mar 25, 14 Since Inception 10.0000 10.57 12.03 8.00 13,208 13,698 12,377
B. Discrete 12 month Returns (%) Period Scheme
^Benchmark
#Additional
Benchmark ##
Dec 31, 15 To Dec 30, 16 8.51 12.93 7.27Dec 31, 14 To Dec 31, 15 10.95 8.63 8.22
^Past performance may or may not be sustained in the future. Returns greater than 1 year period are compounded annualized (CAGR). # CRISIL Composite Bond Fund Index ## CRISIL 1 year T-Bill Index
HDFC FMP 1175D JANUARY 2014 (1) NAV as on December 30, 2016 ` 13.4197A. Cumulative PerformanceDate Period NAV
per Unit (`)
Scheme Returns
(%)^
Benchmark Returns
(%)#
Additional Benchmark
Returns (%) ##
Value of Investment of Scheme ` 10000@
Scheme (`) Benchmark (`)#
Additional Benchmark
(`)##Dec 31, 15 Last 1 Year 12.3738 8.45 12.93 7.27 10,845 11,293 10,727Dec 31, 14 Last 2 Years 11.1734 9.59 10.76 7.75 12,010 12,268 11,609Feb 05, 14 Since Inception 10.0000 10.67 11.93 8.06 13,420 13,867 12,523
B. Discrete 12 month Returns (%) Period Scheme
^Benchmark
#Additional
Benchmark ##
Dec 31, 15 To Dec 30, 16 8.45 12.93 7.27Dec 31, 14 To Dec 31, 15 10.74 8.63 8.22
^Past performance may or may not be sustained in the future. Returns gre ater than 1 year period are compounded annualized (CAGR). # CRISIL Composite Bond Fund Index ## CRISIL 1 year T-Bill Index
HDFC FMP 366D MARCH 2014 (1) NAV as on December 30, 2016 ` 12.6286A. Cumulative PerformanceDate Period NAV
per Unit (`)
Scheme Returns
(%)^
Benchmark Returns
(%)#
Additional Benchmark
Returns (%) ##
Value of Investment of Scheme ` 10000@
Scheme (`) Benchmark (`)#
Additional Benchmark
(`)##Dec 31, 15 Last 1 Year 11.6699 8.22 9.83 7.27 10,822 10,983 10,727Dec 31, 14 Last 2 Years 10.7479 8.40 9.24 7.75 11,750 11,934 11,609Mar 19, 14 Since Inception 10.0000 8.74 9.63 8.01 12,629 12,921 12,395
B. Discrete 12 month Returns (%) Period Scheme
^Benchmark
#Additional
Benchmark ##
Dec 31, 15 To Dec 30, 16 8.22 9.83 7.27Dec 31, 14 To Dec 31, 15 8.58 8.66 8.22
^Past performance may or may not be sustained in the future. Returns greater than 1 year period are compounded annualized (CAGR). # CRISIL Short Term Bond Fund Index ## CRISIL 1 year T-Bill Index
HDFC FMP 369D FEBRUARY 2014 (1) NAV as on December 30, 2016 ` 12.7798A. Cumulative PerformanceDate Period NAV
per Unit (`)
Scheme Returns
(%)^
Benchmark Returns
(%)#
Additional Benchmark
Returns (%) ##
Value of Investment of Scheme ` 10000@
Scheme (`) Benchmark (`)#
Additional Benchmark
(`)##Dec 31, 15 Last 1 Year 11.8050 8.26 9.83 7.27 10,826 10,983 10,727Dec 31, 14 Last 2 Years 10.8682 8.44 9.24 7.75 11,759 11,934 11,609Feb 07, 14 Since Inception 10.0000 8.84 9.67 8.06 12,780 13,065 12,515
B. Discrete 12 month Returns (%) Period Scheme
^Benchmark
#Additional
Benchmark ##
Dec 31, 15 To Dec 30, 16 8.26 9.83 7.27Dec 31, 14 To Dec 31, 15 8.62 8.66 8.22
^Past performance may or may not be sustained in the future. Returns greater than 1 year period are compounded annualized (CAGR). # CRISIL Short Term Bond Fund Index ## CRISIL 1 year T-Bill Index
HDFC FMP 369D FEBRUARY 2014 (2) NAV as on December 30, 2016 ` 12.7697A. Cumulative PerformanceDate Period NAV
per Unit (`)
Scheme Returns
(%)^
Benchmark Returns
(%)#
Additional Benchmark
Returns (%) ##
Value of Investment of Scheme ` 10000@
Scheme (`) Benchmark (`)#
Additional Benchmark
(`)##Dec 31, 15 Last 1 Year 11.7639 8.55 9.83 7.27 10,855 10,983 10,727Dec 31, 14 Last 2 Years 10.8441 8.52 9.24 7.75 11,776 11,934 11,609Feb 21, 14 Since Inception 10.0000 8.93 9.72 8.03 12,770 13,034 12,471
B. Discrete 12 month Returns (%) Period Scheme
^Benchmark
#Additional
Benchmark ##
Dec 31, 15 To Dec 30, 16 8.55 9.83 7.27Dec 31, 14 To Dec 31, 15 8.48 8.66 8.22
^Past performance may or may not be sustained in the future. Returns greater than 1 year period are compounded annualized (CAGR). # CRISIL Short Term Bond Fund Index ## CRISIL 1 year T-Bill Index
HDFC FMP 369D JANUARY 2014 (1) NAV as on December 30, 2016 ` 12.7403A. Cumulative PerformanceDate Period NAV
per Unit (`)
Scheme Returns
(%)^
Benchmark Returns
(%)#
Additional Benchmark
Returns (%) ##
Value of Investment of Scheme ` 10000@
Scheme (`) Benchmark (`)#
Additional Benchmark
(`)##Dec 31, 15 Last 1 Year 11.8170 7.81 9.83 7.27 10,781 10,983 10,727Dec 31, 14 Last 2 Years 10.8989 8.12 9.24 7.75 11,690 11,934 11,609Jan 16, 14 Since Inception 10.0000 8.54 9.61 7.92 12,740 13,116 12,527
B. Discrete 12 month Returns (%) Period Scheme
^Benchmark
#Additional
Benchmark ##
Dec 31, 15 To Dec 30, 16 7.81 9.83 7.27Dec 31, 14 To Dec 31, 15 8.42 8.66 8.22
^Past performance may or may not be sustained in the future. Returns greater than 1 year period are compounded annualized (CAGR). # CRISIL Short Term Bond Fund Index ## CRISIL 1 year T-Bill Index
SCHEME PERFORMANCE - REGULAR PLAN - GROWTH OPTION (FUND MANAGER-WISE)ANIL BAMBOLI....CONTINUED
Performance of dividend option under the schemes for the investors would be net of distribution tax as applicable. Load is not taken into consideration for computation of performance.@ shows the current value of ` 10,000/- invested at the beginning of a given period. n.A.: not Available
Performance of FMP schemes, being close-ended in nature, is not strictly comparable with that of open-ended schemes since the investment strategy for FMP schemes is primarily buy-and-hold whereas open-ended schemes are actively managed.

Intouch mutually January 2017 59
HDFC FMP 369D MARCH 2014 (1) NAV as on December 30, 2016 ` 12.7008A. Cumulative PerformanceDate Period NAV
per Unit (`)
Scheme Returns
(%)^
Benchmark Returns
(%)#
Additional Benchmark
Returns (%) ##
Value of Investment of Scheme ` 10000@
Scheme (`) Benchmark (`)#
Additional Benchmark
(`)##Dec 31, 15 Last 1 Year 11.7231 8.34 9.83 7.27 10,834 10,983 10,727Dec 31, 14 Last 2 Years 10.8020 8.43 9.24 7.75 11,758 11,934 11,609Mar 07, 14 Since Inception 10.0000 8.85 9.69 8.05 12,701 12,979 12,441
B. Discrete 12 month Returns (%) Period Scheme
^Benchmark
#Additional
Benchmark ##
Dec 31, 15 To Dec 30, 16 8.34 9.83 7.27Dec 31, 14 To Dec 31, 15 8.53 8.66 8.22
^Past performance may or may not be sustained in the future. Returns greater than 1 year period are compounded annualized (CAGR). # CRISIL Short Term Bond Fund Index ## CRISIL 1 year T-Bill Index
HDFC FMP 369D MARCH 2014 (2) NAV as on December 30, 2016 ` 12.6612A. Cumulative Performance
Date Period NAV per Unit
(`)
Scheme Returns
(%)^
Benchmark Returns
(%)#
Additional Benchmark
Returns (%) ##
Value of Investment of Scheme ` 10000@
Scheme (`) Benchmark (`)#
Additional Benchmark
(`)##Dec 31, 15 Last 1 Year 11.6908 8.30 9.83 7.27 10,830 10,983 10,727Dec 31, 14 Last 2 Years 10.7733 8.41 9.24 7.75 11,752 11,934 11,609Mar 13, 14 Since Inception 10.0000 8.78 9.65 8.04 12,661 12,947 12,421
B. Discrete 12 month Returns (%) Period Scheme
^Benchmark
#Additional
Benchmark ##
Dec 31, 15 To Dec 30, 16 8.30 9.83 7.27Dec 31, 14 To Dec 31, 15 8.52 8.66 8.22
^Past performance may or may not be sustained in the future. Returns greater than 1 year period are compounded annualized (CAGR). # CRISIL Short Term Bond Fund Index ## CRISIL 1 year T-Bill Index
HDFC FMP 369D MARCH 2014 (3) NAV as on December 30, 2016 ` 12.6181A. Cumulative PerformanceDate Period NAV
per Unit (`)
Scheme Returns
(%)^
Benchmark Returns
(%)#
Additional Benchmark
Returns (%) ##
Value of Investment of Scheme ` 10000@
Scheme (`) Benchmark (`)#
Additional Benchmark
(`)##Dec 31, 15 Last 1 Year 11.6465 8.34 9.83 7.27 10,834 10,983 10,727Dec 31, 14 Last 2 Years 10.7307 8.44 9.24 7.75 11,759 11,934 11,609Mar 21, 14 Since Inception 10.0000 8.72 9.61 8.00 12,618 12,905 12,387
B. Discrete 12 month Returns (%) Period Scheme
^Benchmark
#Additional
Benchmark ##
Dec 31, 15 To Dec 30, 16 8.34 9.83 7.27Dec 31, 14 To Dec 31, 15 8.53 8.66 8.22
^Past performance may or may not be sustained in the future. Returns greater than 1 year period are compounded annualized (CAGR). # CRISIL Short Term Bond Fund Index ## CRISIL 1 year T-Bill Index
HDFC FMP 370D FEBRUARY 2014 (1) NAV as on December 30, 2016 ` 12.7786A. Cumulative PerformanceDate Period NAV
per Unit (`)
Scheme Returns
(%)^
Benchmark Returns
(%)#
Additional Benchmark
Returns (%) ##
Value of Investment of Scheme ` 10000@
Scheme (`) Benchmark (`)#
Additional Benchmark
(`)##Dec 31, 15 Last 1 Year 11.7919 8.37 9.83 7.27 10,837 10,983 10,727Dec 31, 14 Last 2 Years 10.8583 8.48 9.24 7.75 11,769 11,934 11,609Feb 14, 14 Since Inception 10.0000 8.90 9.71 8.07 12,779 13,056 12,502
B. Discrete 12 month Returns (%) Period Scheme
^Benchmark
#Additional
Benchmark ##
Dec 31, 15 To Dec 30, 16 8.37 9.83 7.27Dec 31, 14 To Dec 31, 15 8.60 8.66 8.22
^Past performance may or may not be sustained in the future. Returns greater than 1 year period are compounded annualized (CAGR). # CRISIL Short Term Bond Fund Index ## CRISIL 1 year T-Bill Index
HDFC FMP 370D JANUARY 2014 (1) NAV as on December 30, 2016 ` 12.7308A. Cumulative PerformanceDate Period NAV
per Unit (`)
Scheme Returns
(%)^
Benchmark Returns
(%)#
Additional Benchmark
Returns (%) ##
Value of Investment of Scheme ` 10000@
Scheme (`) Benchmark (`)#
Additional Benchmark
(`)##Dec 31, 15 Last 1 Year 11.7922 7.96 9.83 7.27 10,796 10,983 10,727Dec 31, 14 Last 2 Years 10.8802 8.17 9.24 7.75 11,701 11,934 11,609Jan 24, 14 Since Inception 10.0000 8.58 9.63 7.98 12,731 13,096 12,525
B. Discrete 12 month Returns (%) Period Scheme
^Benchmark
#Additional
Benchmark ##
Dec 31, 15 To Dec 30, 16 7.96 9.83 7.27Dec 31, 14 To Dec 31, 15 8.38 8.66 8.22
^Past performance may or may not be sustained in the future. Returns greater than 1 year period are compounded annualized (CAGR). # CRISIL Short Term Bond Fund Index ## CRISIL 1 year T-Bill Index
HDFC FMP 370D MARCH 2014 (1) NAV as on December 30, 2016 ` 12.7262A. Cumulative PerformanceDate Period NAV
per Unit (`)
Scheme Returns
(%)^
Benchmark Returns
(%)#
Additional Benchmark
Returns (%) ##
Value of Investment of Scheme ` 10000@
Scheme (`) Benchmark (`)#
Additional Benchmark
(`)##Dec 31, 15 Last 1 Year 11.7411 8.39 9.83 7.27 10,839 10,983 10,727Dec 31, 14 Last 2 Years 10.8222 8.44 9.24 7.75 11,759 11,934 11,609Mar 05, 14 Since Inception 10.0000 8.91 9.71 8.06 12,726 12,993 12,449
B. Discrete 12 month Returns (%) Period Scheme
^Benchmark
#Additional
Benchmark ##
Dec 31, 15 To Dec 30, 16 8.39 9.83 7.27Dec 31, 14 To Dec 31, 15 8.49 8.66 8.22
^Past performance may or may not be sustained in the future. Returns greater than 1 year period are compounded annualized (CAGR). # CRISIL Short Term Bond Fund Index ## CRISIL 1 year T-Bill Index
SCHEME PERFORMANCE - REGULAR PLAN - GROWTH OPTION (FUND MANAGER-WISE)ANIL BAMBOLI....CONTINUED
Performance of dividend option under the schemes for the investors would be net of distribution tax as applicable. Load is not taken into consideration for computation of performance.@ shows the current value of ` 10,000/- invested at the beginning of a given period. n.A.: not Available
Performance of FMP schemes, being close-ended in nature, is not strictly comparable with that of open-ended schemes since the investment strategy for FMP schemes is primarily buy-and-hold whereas open-ended schemes are actively managed.
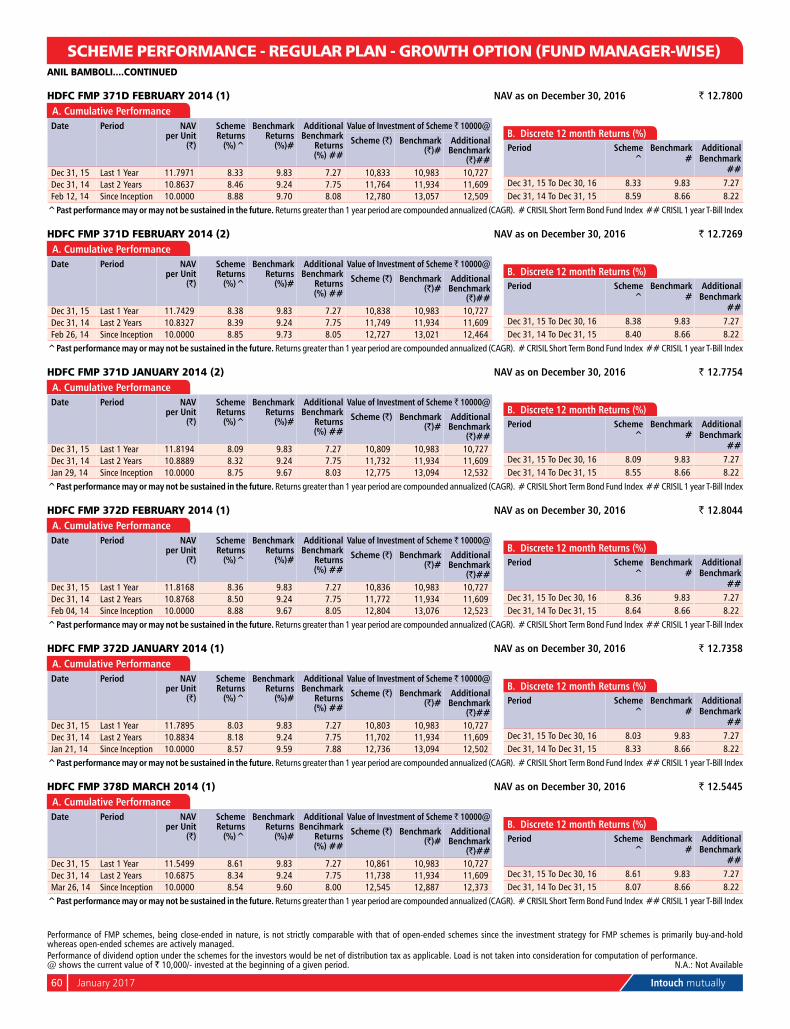
60 January 2017 Intouch mutually
HDFC FMP 371D FEBRUARY 2014 (1) NAV as on December 30, 2016 ` 12.7800A. Cumulative PerformanceDate Period NAV
per Unit (`)
Scheme Returns
(%)^
Benchmark Returns
(%)#
Additional Benchmark
Returns (%) ##
Value of Investment of Scheme ` 10000@
Scheme (`) Benchmark (`)#
Additional Benchmark
(`)##Dec 31, 15 Last 1 Year 11.7971 8.33 9.83 7.27 10,833 10,983 10,727Dec 31, 14 Last 2 Years 10.8637 8.46 9.24 7.75 11,764 11,934 11,609Feb 12, 14 Since Inception 10.0000 8.88 9.70 8.08 12,780 13,057 12,509
B. Discrete 12 month Returns (%) Period Scheme
^Benchmark
#Additional
Benchmark ##
Dec 31, 15 To Dec 30, 16 8.33 9.83 7.27Dec 31, 14 To Dec 31, 15 8.59 8.66 8.22
^Past performance may or may not be sustained in the future. Returns greater than 1 year period are compounded annualized (CAGR). # CRISIL Short Term Bond Fund Index ## CRISIL 1 year T-Bill Index
HDFC FMP 371D FEBRUARY 2014 (2) NAV as on December 30, 2016 ` 12.7269A. Cumulative PerformanceDate Period NAV
per Unit (`)
Scheme Returns
(%)^
Benchmark Returns
(%)#
Additional Benchmark
Returns (%) ##
Value of Investment of Scheme ` 10000@
Scheme (`) Benchmark (`)#
Additional Benchmark
(`)##Dec 31, 15 Last 1 Year 11.7429 8.38 9.83 7.27 10,838 10,983 10,727Dec 31, 14 Last 2 Years 10.8327 8.39 9.24 7.75 11,749 11,934 11,609Feb 26, 14 Since Inception 10.0000 8.85 9.73 8.05 12,727 13,021 12,464
B. Discrete 12 month Returns (%) Period Scheme
^Benchmark
#Additional
Benchmark ##
Dec 31, 15 To Dec 30, 16 8.38 9.83 7.27Dec 31, 14 To Dec 31, 15 8.40 8.66 8.22
^Past performance may or may not be sustained in the future. Returns greater than 1 year period are compounded annualized (CAGR). # CRISIL Short Term Bond Fund Index ## CRISIL 1 year T-Bill Index
HDFC FMP 371D JANUARY 2014 (2) NAV as on December 30, 2016 ` 12.7754A. Cumulative PerformanceDate Period NAV
per Unit (`)
Scheme Returns
(%)^
Benchmark Returns
(%)#
Additional Benchmark
Returns (%) ##
Value of Investment of Scheme ` 10000@
Scheme (`) Benchmark (`)#
Additional Benchmark
(`)##Dec 31, 15 Last 1 Year 11.8194 8.09 9.83 7.27 10,809 10,983 10,727Dec 31, 14 Last 2 Years 10.8889 8.32 9.24 7.75 11,732 11,934 11,609Jan 29, 14 Since Inception 10.0000 8.75 9.67 8.03 12,775 13,094 12,532
B. Discrete 12 month Returns (%) Period Scheme
^Benchmark
#Additional
Benchmark ##
Dec 31, 15 To Dec 30, 16 8.09 9.83 7.27Dec 31, 14 To Dec 31, 15 8.55 8.66 8.22
^Past performance may or may not be sustained in the future. Returns greater than 1 year period are compounded annualized (CAGR). # CRISIL Short Term Bond Fund Index ## CRISIL 1 year T-Bill Index
HDFC FMP 372D FEBRUARY 2014 (1) NAV as on December 30, 2016 ` 12.8044A. Cumulative PerformanceDate Period NAV
per Unit (`)
Scheme Returns
(%)^
Benchmark Returns
(%)#
Additional Benchmark
Returns (%) ##
Value of Investment of Scheme ` 10000@
Scheme (`) Benchmark (`)#
Additional Benchmark
(`)##Dec 31, 15 Last 1 Year 11.8168 8.36 9.83 7.27 10,836 10,983 10,727Dec 31, 14 Last 2 Years 10.8768 8.50 9.24 7.75 11,772 11,934 11,609Feb 04, 14 Since Inception 10.0000 8.88 9.67 8.05 12,804 13,076 12,523
B. Discrete 12 month Returns (%) Period Scheme
^Benchmark
#Additional
Benchmark ##
Dec 31, 15 To Dec 30, 16 8.36 9.83 7.27Dec 31, 14 To Dec 31, 15 8.64 8.66 8.22
^Past performance may or may not be sustained in the future. Returns greater than 1 year period are compounded annualized (CAGR). # CRISIL Short Term Bond Fund Index ## CRISIL 1 year T-Bill Index
HDFC FMP 372D JANUARY 2014 (1) NAV as on December 30, 2016 ` 12.7358A. Cumulative PerformanceDate Period NAV
per Unit (`)
Scheme Returns
(%)^
Benchmark Returns
(%)#
Additional Benchmark
Returns (%) ##
Value of Investment of Scheme ` 10000@
Scheme (`) Benchmark (`)#
Additional Benchmark
(`)##Dec 31, 15 Last 1 Year 11.7895 8.03 9.83 7.27 10,803 10,983 10,727Dec 31, 14 Last 2 Years 10.8834 8.18 9.24 7.75 11,702 11,934 11,609Jan 21, 14 Since Inception 10.0000 8.57 9.59 7.88 12,736 13,094 12,502
B. Discrete 12 month Returns (%) Period Scheme
^Benchmark
#Additional
Benchmark ##
Dec 31, 15 To Dec 30, 16 8.03 9.83 7.27Dec 31, 14 To Dec 31, 15 8.33 8.66 8.22
^Past performance may or may not be sustained in the future. Returns greater than 1 year period are compounded annualized (CAGR). # CRISIL Short Term Bond Fund Index ## CRISIL 1 year T-Bill Index
HDFC FMP 378D MARCH 2014 (1) NAV as on December 30, 2016 ` 12.5445A. Cumulative PerformanceDate Period NAV
per Unit (`)
Scheme Returns
(%)^
Benchmark Returns
(%)#
Additional Bencihmark
Returns (%) ##
Value of Investment of Scheme ` 10000@
Scheme (`) Benchmark (`)#
Additional Benchmark
(`)##Dec 31, 15 Last 1 Year 11.5499 8.61 9.83 7.27 10,861 10,983 10,727Dec 31, 14 Last 2 Years 10.6875 8.34 9.24 7.75 11,738 11,934 11,609Mar 26, 14 Since Inception 10.0000 8.54 9.60 8.00 12,545 12,887 12,373
B. Discrete 12 month Returns (%) Period Scheme
^Benchmark
#Additional
Benchmark ##
Dec 31, 15 To Dec 30, 16 8.61 9.83 7.27Dec 31, 14 To Dec 31, 15 8.07 8.66 8.22
^Past performance may or may not be sustained in the future. Returns greater than 1 year period are compounded annualized (CAGR). # CRISIL Short Term Bond Fund Index ## CRISIL 1 year T-Bill Index
SCHEME PERFORMANCE - REGULAR PLAN - GROWTH OPTION (FUND MANAGER-WISE)ANIL BAMBOLI....CONTINUED
Performance of dividend option under the schemes for the investors would be net of distribution tax as applicable. Load is not taken into consideration for computation of performance.@ shows the current value of ` 10,000/- invested at the beginning of a given period. n.A.: not Available
Performance of FMP schemes, being close-ended in nature, is not strictly comparable with that of open-ended schemes since the investment strategy for FMP schemes is primarily buy-and-hold whereas open-ended schemes are actively managed.

Intouch mutually January 2017 61
HDFC FMP 384D MARCH 2014 (1) NAV as on December 30, 2016 ` 12.5653A. Cumulative PerformanceDate Period NAV
per Unit (`)
Scheme Returns
(%)^
Benchmark Returns
(%)#
Additional Benchmark
Returns (%) ##
Value of Investment of Scheme ` 10000@
Scheme (`) Benchmark (`)#
Additional Benchmark
(`)##Dec 31, 15 Last 1 Year 11.5821 8.49 9.83 7.27 10,849 10,983 10,727Dec 31, 14 Last 2 Years 10.7228 8.25 9.24 7.75 11,718 11,934 11,609Mar 20, 14 Since Inception 10.0000 8.55 9.63 8.01 12,565 12,915 12,393
B. Discrete 12 month Returns (%) Period Scheme
^Benchmark
#Additional
Benchmark ##
Dec 31, 15 To Dec 30, 16 8.49 9.83 7.27Dec 31, 14 To Dec 31, 15 8.01 8.66 8.22
^Past performance may or may not be sustained in the future. Returns greater than 1 year period are compounded annualized (CAGR). # CRISIL Short Term Bond Fund Index ## CRISIL 1 year T-Bill Index
HDFC FMP 390D MARCH 2014 (1) NAV as on December 30, 2016 ` 12.5971A. Cumulative PerformanceDate Period NAV
per Unit (`)
Scheme Returns
(%)^
Benchmark Returns
(%)#
Additional Benchmark
Returns (%) ##
Value of Investment of Scheme ` 10000@
Scheme (`) Benchmark (`)#
Additional Benchmark
(`)##Dec 31, 15 Last 1 Year 11.6114 8.49 9.83 7.27 10,849 10,983 10,727Dec 31, 14 Last 2 Years 10.7417 8.29 9.24 7.75 11,727 11,934 11,609Mar 14, 14 Since Inception 10.0000 8.60 9.65 8.03 12,597 12,943 12,414
B. Discrete 12 month Returns (%) Period Scheme
^Benchmark
#Additional
Benchmark ##
Dec 31, 15 To Dec 30, 16 8.49 9.83 7.27Dec 31, 14 To Dec 31, 15 8.10 8.66 8.22
^Past performance may or may not be sustained in the future. Returns greater than 1 year period are compounded annualized (CAGR). # CRISIL Short Term Bond Fund Index ## CRISIL 1 year T-Bill Index
HDFC FMP 400D MARCH 2014 (1) NAV as on December 30, 2016 ` 12.6147A. Cumulative PerformanceDate Period NAV
per Unit (`)
Scheme Returns
(%)^
Benchmark Returns
(%)#
Additional Benchmark
Returns (%) ##
Value of Investment of Scheme ` 10000@
Scheme (`) Benchmark (`)#
Additional Benchmark
(`)##Dec 31, 15 Last 1 Year 11.6282 8.48 9.83 7.27 10,848 10,983 10,727Dec 31, 14 Last 2 Years 10.7591 8.28 9.24 7.75 11,725 11,934 11,609Mar 11, 14 Since Inception 10.0000 8.62 9.66 8.05 12,615 12,955 12,429
B. Discrete 12 month Returns (%) Period Scheme
^Benchmark
#Additional
Benchmark ##
Dec 31, 15 To Dec 30, 16 8.48 9.83 7.27Dec 31, 14 To Dec 31, 15 8.08 8.66 8.22
^Past performance may or may not be sustained in the future. Returns greater than 1 year period are compounded annualized (CAGR). # CRISIL Short Term Bond Fund Index ## CRISIL 1 year T-Bill Index
HDFC FMP 434D FEBRUARY 2014 (1) NAV as on December 30, 2016 ` 12.7111A. Cumulative PerformanceDate Period NAV
per Unit (`)
Scheme Returns
(%)^
Benchmark Returns
(%)#
Additional Benchmark
Returns (%) ##
Value of Investment of Scheme ` 10000@
Scheme (`) Benchmark (`)#
Additional Benchmark
(`)##Dec 31, 15 Last 1 Year 11.7258 8.40 9.83 7.27 10,840 10,983 10,727Dec 31, 14 Last 2 Years 10.8027 8.47 9.24 7.75 11,767 11,934 11,609Feb 25, 14 Since Inception 10.0000 8.79 9.73 8.05 12,711 13,024 12,465
B. Discrete 12 month Returns (%) Period Scheme
^Benchmark
#Additional
Benchmark ##
Dec 31, 15 To Dec 30, 16 8.40 9.83 7.27Dec 31, 14 To Dec 31, 15 8.55 8.66 8.22
^Past performance may or may not be sustained in the future. Returns greater than 1 year period are compounded annualized (CAGR). # CRISIL Short Term Bond Fund Index ## CRISIL 1 year T-Bill Index
HDFC FMP 435D MARCH 2014 (1) NAV as on December 30, 2016 ` 12.6806A. Cumulative PerformanceDate Period NAV
per Unit (`)
Scheme Returns
(%)^
Benchmark Returns
(%)#
Additional Benchmark
Returns (%) ##
Value of Investment of Scheme ` 10000@
Scheme (`) Benchmark (`)#
Additional Benchmark
(`)##Dec 31, 15 Last 1 Year 11.7105 8.28 9.83 7.27 10,828 10,983 10,727Dec 31, 14 Last 2 Years 10.7783 8.47 9.24 7.75 11,765 11,934 11,609Mar 06, 14 Since Inception 10.0000 8.78 9.71 8.06 12,681 12,990 12,446
B. Discrete 12 month Returns (%) Period Scheme
^Benchmark
#Additional
Benchmark ##
Dec 31, 15 To Dec 30, 16 8.28 9.83 7.27Dec 31, 14 To Dec 31, 15 8.65 8.66 8.22
^Past performance may or may not be sustained in the future. Returns greater than 1 year period are compounded annualized (CAGR). # CRISIL Short Term Bond Fund Index ## CRISIL 1 year T-Bill Index
HDFC FMP 441D FEBRUARY 2014 (1) NAV as on December 30, 2016 ` 12.7397A. Cumulative PerformanceDate Period NAV
per Unit (`)
Scheme Returns
(%)^
Benchmark Returns
(%)#
Additional Benchmark
Returns (%) ##
Value of Investment of Scheme ` 10000@
Scheme (`) Benchmark (`)#
Additional Benchmark
(`)##Dec 31, 15 Last 1 Year 11.7541 8.39 9.83 7.27 10,839 10,983 10,727Dec 31, 14 Last 2 Years 10.8221 8.50 9.24 7.75 11,772 11,934 11,609Feb 18, 14 Since Inception 10.0000 8.82 9.71 8.07 12,740 13,041 12,491
B. Discrete 12 month Returns (%) Period Scheme
^Benchmark
#Additional
Benchmark ##
Dec 31, 15 To Dec 30, 16 8.39 9.83 7.27Dec 31, 14 To Dec 31, 15 8.61 8.66 8.22
^Past performance may or may not be sustained in the future. Returns greater than 1 year period are compounded annualized (CAGR). # CRISIL Short Term Bond Fund Index ## CRISIL 1 year T-Bill Index
SCHEME PERFORMANCE - REGULAR PLAN - GROWTH OPTION (FUND MANAGER-WISE)ANIL BAMBOLI....CONTINUED
Performance of dividend option under the schemes for the investors would be net of distribution tax as applicable. Load is not taken into consideration for computation of performance.@ shows the current value of ` 10,000/- invested at the beginning of a given period. n.A.: not Available
Performance of FMP schemes, being close-ended in nature, is not strictly comparable with that of open-ended schemes since the investment strategy for FMP schemes is primarily buy-and-hold whereas open-ended schemes are actively managed.
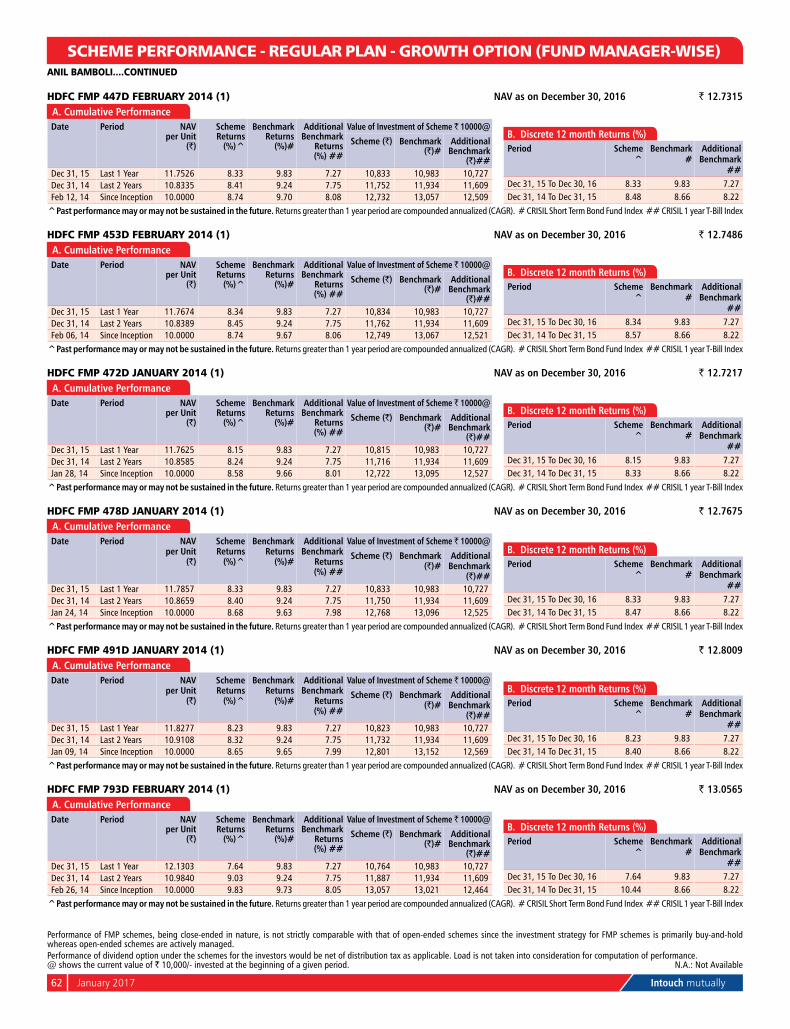
62 January 2017 Intouch mutually
Performance of dividend option under the schemes for the investors would be net of distribution tax as applicable. Load is not taken into consideration for computation of performance.@ shows the current value of ` 10,000/- invested at the beginning of a given period. n.A.: not Available
Performance of FMP schemes, being close-ended in nature, is not strictly comparable with that of open-ended schemes since the investment strategy for FMP schemes is primarily buy-and-hold whereas open-ended schemes are actively managed.
HDFC FMP 447D FEBRUARY 2014 (1) NAV as on December 30, 2016 ` 12.7315A. Cumulative PerformanceDate Period NAV
per Unit (`)
Scheme Returns
(%)^
Benchmark Returns
(%)#
Additional Benchmark
Returns (%) ##
Value of Investment of Scheme ` 10000@
Scheme (`) Benchmark (`)#
Additional Benchmark
(`)##Dec 31, 15 Last 1 Year 11.7526 8.33 9.83 7.27 10,833 10,983 10,727Dec 31, 14 Last 2 Years 10.8335 8.41 9.24 7.75 11,752 11,934 11,609Feb 12, 14 Since Inception 10.0000 8.74 9.70 8.08 12,732 13,057 12,509
B. Discrete 12 month Returns (%) Period Scheme
^Benchmark
#Additional
Benchmark ##
Dec 31, 15 To Dec 30, 16 8.33 9.83 7.27Dec 31, 14 To Dec 31, 15 8.48 8.66 8.22
^Past performance may or may not be sustained in the future. Returns greater than 1 year period are compounded annualized (CAGR). # CRISIL Short Term Bond Fund Index ## CRISIL 1 year T-Bill Index
HDFC FMP 453D FEBRUARY 2014 (1) NAV as on December 30, 2016 ` 12.7486A. Cumulative PerformanceDate Period NAV
per Unit (`)
Scheme Returns
(%)^
Benchmark Returns
(%)#
Additional Benchmark
Returns (%) ##
Value of Investment of Scheme ` 10000@
Scheme (`) Benchmark (`)#
Additional Benchmark
(`)##Dec 31, 15 Last 1 Year 11.7674 8.34 9.83 7.27 10,834 10,983 10,727Dec 31, 14 Last 2 Years 10.8389 8.45 9.24 7.75 11,762 11,934 11,609Feb 06, 14 Since Inception 10.0000 8.74 9.67 8.06 12,749 13,067 12,521
B. Discrete 12 month Returns (%) Period Scheme
^Benchmark
#Additional
Benchmark ##
Dec 31, 15 To Dec 30, 16 8.34 9.83 7.27Dec 31, 14 To Dec 31, 15 8.57 8.66 8.22
^Past performance may or may not be sustained in the future. Returns greater than 1 year period are compounded annualized (CAGR). # CRISIL Short Term Bond Fund Index ## CRISIL 1 year T-Bill Index
HDFC FMP 472D JANUARY 2014 (1) NAV as on December 30, 2016 ` 12.7217A. Cumulative PerformanceDate Period NAV
per Unit (`)
Scheme Returns
(%)^
Benchmark Returns
(%)#
Additional Benchmark
Returns (%) ##
Value of Investment of Scheme ` 10000@
Scheme (`) Benchmark (`)#
Additional Benchmark
(`)##Dec 31, 15 Last 1 Year 11.7625 8.15 9.83 7.27 10,815 10,983 10,727Dec 31, 14 Last 2 Years 10.8585 8.24 9.24 7.75 11,716 11,934 11,609Jan 28, 14 Since Inception 10.0000 8.58 9.66 8.01 12,722 13,095 12,527
B. Discrete 12 month Returns (%) Period Scheme
^Benchmark
#Additional
Benchmark ##
Dec 31, 15 To Dec 30, 16 8.15 9.83 7.27Dec 31, 14 To Dec 31, 15 8.33 8.66 8.22
^Past performance may or may not be sustained in the future. Returns greater than 1 year period are compounded annualized (CAGR). # CRISIL Short Term Bond Fund Index ## CRISIL 1 year T-Bill Index
HDFC FMP 478D JANUARY 2014 (1) NAV as on December 30, 2016 ` 12.7675A. Cumulative PerformanceDate Period NAV
per Unit (`)
Scheme Returns
(%)^
Benchmark Returns
(%)#
Additional Benchmark
Returns (%) ##
Value of Investment of Scheme ` 10000@
Scheme (`) Benchmark (`)#
Additional Benchmark
(`)##Dec 31, 15 Last 1 Year 11.7857 8.33 9.83 7.27 10,833 10,983 10,727Dec 31, 14 Last 2 Years 10.8659 8.40 9.24 7.75 11,750 11,934 11,609Jan 24, 14 Since Inception 10.0000 8.68 9.63 7.98 12,768 13,096 12,525
B. Discrete 12 month Returns (%) Period Scheme
^Benchmark
#Additional
Benchmark ##
Dec 31, 15 To Dec 30, 16 8.33 9.83 7.27Dec 31, 14 To Dec 31, 15 8.47 8.66 8.22
^Past performance may or may not be sustained in the future. Returns greater than 1 year period are compounded annualized (CAGR). # CRISIL Short Term Bond Fund Index ## CRISIL 1 year T-Bill Index
HDFC FMP 491D JANUARY 2014 (1) NAV as on December 30, 2016 ` 12.8009A. Cumulative PerformanceDate Period NAV
per Unit (`)
Scheme Returns
(%)^
Benchmark Returns
(%)#
Additional Benchmark
Returns (%) ##
Value of Investment of Scheme ` 10000@
Scheme (`) Benchmark (`)#
Additional Benchmark
(`)##Dec 31, 15 Last 1 Year 11.8277 8.23 9.83 7.27 10,823 10,983 10,727Dec 31, 14 Last 2 Years 10.9108 8.32 9.24 7.75 11,732 11,934 11,609Jan 09, 14 Since Inception 10.0000 8.65 9.65 7.99 12,801 13,152 12,569
B. Discrete 12 month Returns (%) Period Scheme
^Benchmark
#Additional
Benchmark ##
Dec 31, 15 To Dec 30, 16 8.23 9.83 7.27Dec 31, 14 To Dec 31, 15 8.40 8.66 8.22
^Past performance may or may not be sustained in the future. Returns greater than 1 year period are compounded annualized (CAGR). # CRISIL Short Term Bond Fund Index ## CRISIL 1 year T-Bill Index
HDFC FMP 793D FEBRUARY 2014 (1) NAV as on December 30, 2016 ` 13.0565A. Cumulative PerformanceDate Period NAV
per Unit (`)
Scheme Returns
(%)^
Benchmark Returns
(%)#
Additional Benchmark
Returns (%) ##
Value of Investment of Scheme ` 10000@
Scheme (`) Benchmark (`)#
Additional Benchmark
(`)##Dec 31, 15 Last 1 Year 12.1303 7.64 9.83 7.27 10,764 10,983 10,727Dec 31, 14 Last 2 Years 10.9840 9.03 9.24 7.75 11,887 11,934 11,609Feb 26, 14 Since Inception 10.0000 9.83 9.73 8.05 13,057 13,021 12,464
B. Discrete 12 month Returns (%) Period Scheme
^Benchmark
#Additional
Benchmark ##
Dec 31, 15 To Dec 30, 16 7.64 9.83 7.27Dec 31, 14 To Dec 31, 15 10.44 8.66 8.22
^Past performance may or may not be sustained in the future. Returns greater than 1 year period are compounded annualized (CAGR). # CRISIL Short Term Bond Fund Index ## CRISIL 1 year T-Bill Index
SCHEME PERFORMANCE - REGULAR PLAN - GROWTH OPTION (FUND MANAGER-WISE)ANIL BAMBOLI....CONTINUED

Intouch mutually January 2017 63
HDFC FMP 840D JANUARY 2014 (1) NAV as on December 30, 2016 ` 12.8753A. Cumulative PerformanceDate Period NAV
per Unit (`)
Scheme Returns
(%)^
Benchmark Returns
(%)#
Additional Benchmark
Returns (%) ##
Value of Investment of Scheme ` 10000@
Scheme (`) Benchmark (`)#
Additional Benchmark
(`)##Dec 31, 15 Last 1 Year 11.9478 7.76 9.83 7.27 10,776 10,983 10,727Dec 31, 14 Last 2 Years 10.9710 8.33 9.24 7.75 11,736 11,934 11,609Feb 06, 14 Since Inception 10.0000 9.11 9.67 8.06 12,875 13,067 12,521
B. Discrete 12 month Returns (%) Period Scheme
^Benchmark
#Additional
Benchmark ##
Dec 31, 15 To Dec 30, 16 7.76 9.83 7.27Dec 31, 14 To Dec 31, 15 8.90 8.66 8.22
^Past performance may or may not be sustained in the future. Returns greater than 1 year period are compounded annualized (CAGR). # CRISIL Short Term Bond Fund Index ## CRISIL 1 year T-Bill Index
HDFC FMP 1113D AUGUST 2014 (1) NAV as on December 30, 2016 ` 12.3440A. Cumulative PerformanceDate Period NAV
per Unit (`)
Scheme Returns
(%)^
Benchmark Returns
(%)#i
Additional Benchmark
Returns (%) ##
Value of Investment of Scheme ` 10000@
Scheme (`) Benchmark (`)#
Additional Benchmark
(`)##Dec 31, 15 Last 1 Year 11.3601 8.66 12.93 7.27 10,866 11,293 10,727Dec 31, 14 Last 2 Years 10.4368 8.75 10.76 7.75 11,827 12,268 11,609Aug 27, 14 Since Inception 10.0000 9.39 11.90 7.93 12,344 13,017 11,959
B. Discrete 12 month Returns (%) Period Scheme
^Benchmark
#Additional
Benchmark ##
Dec 31, 15 To Dec 30, 16 8.66 12.93 7.27Dec 31, 14 To Dec 31, 15 8.85 8.63 8.22
^Past performance may or may not be sustained in the future. Returns greater than 1 year period are compounded annualized (CAGR). # CRISIL Composite Bond Fund Index ## CRISIL 1 year T-Bill Index
HDFC FMP 1099D AUGUST 2014 (1) NAV as on December 30, 2016 ` 12.3259A. Cumulative PerformanceDate Period NAV
per Unit (`)
Scheme Returns
(%)^
Benchmark Returns
(%)#
Additional Benchmark
Returns (%) ##
Value of Investment of Scheme ` 10000@
Scheme (`) Benchmark (`)#
Additional Benchmark
(`)##Dec 31, 15 Last 1 Year 11.3435 8.66 12.93 7.27 10,866 11,293 10,727Dec 31, 14 Last 2 Years 10.4143 8.79 10.76 7.75 11,836 12,268 11,609Sep 05, 14 Since Inception 10.0000 9.43 11.89 7.92 12,326 12,980 11,934
B. Discrete 12 month Returns (%) Period Scheme
^Benchmark
#Additional
Benchmark ##
Dec 31, 15 To Dec 30, 16 8.66 12.93 7.27Dec 31, 14 To Dec 31, 15 8.92 8.63 8.22
^Past performance may or may not be sustained in the future. Returns greater than 1 year period are compounded annualized (CAGR). # CRISIL Composite Bond Fund Index ## CRISIL 1 year T-Bill Index
HDFC FMP 1134D SEPTEMBER 2014 (1) NAV as on December 30, 2016 ` 12.4208A. Cumulative PerformanceDate Period NAV
per Unit (`)
Scheme Returns
(%)^
Benchmark Returns
(%)#
Additional Benchmark
Returns (%) ##
Value of Investment of Scheme ` 10000@
Scheme (`) Benchmark (`)#
Additional Benchmark
(`)##Dec 31, 15 Last 1 Year 11.3512 9.42 12.93 7.27 10,942 11,293 10,727Dec 31, 14 Last 2 Years 10.3801 9.39 10.76 7.75 11,966 12,268 11,609Sep 19, 14 Since Inception 10.0000 9.96 11.81 7.92 12,421 12,903 11,900
B. Discrete 12 month Returns (%) Period Scheme
^Benchmark
#Additional
Benchmark ##
Dec 31, 15 To Dec 30, 16 9.42 12.93 7.27Dec 31, 14 To Dec 31, 15 9.36 8.63 8.22
^Past performance may or may not be sustained in the future. Returns greater than 1 year period are compounded annualized (CAGR). # CRISIL Composite Bond Fund Index ## CRISIL 1 year T-Bill Index
HDFC FMP 1128D SEPTEMBER 2014 (1) NAV as on December 30, 2016 ` 12.2695A. Cumulative PerformanceDate Period NAV
per Unit (`)
Scheme Returns
(%)^
Benchmark Returns
(%)#
Additional Benchmark
Returns (%) ##
Value of Investment of Scheme ` 10000@
Scheme (`) Benchmark (`)#
Additional Benchmark
(`)##Dec 31, 15 Last 1 Year 11.2763 8.81 12.93 7.27 10,881 11,293 10,727Dec 31, 14 Last 2 Years 10.3526 8.87 10.76 7.75 11,852 12,268 11,609Sep 25, 14 Since Inception 10.0000 9.45 11.83 7.93 12,270 12,883 11,886
B. Discrete 12 month Returns (%) Period Scheme
^Benchmark
#Additional
Benchmark ##
Dec 31, 15 To Dec 30, 16 8.81 12.93 7.27Dec 31, 14 To Dec 31, 15 8.92 8.63 8.22
^Past performance may or may not be sustained in the future. Returns greater than 1 year period are compounded annualized (CAGR). # CRISIL Composite Bond Fund Index ## CRISIL 1 year T-Bill Index
HDFC FMP 1125D SEPTEMBER 2014 (1) NAV as on December 30, 2016 ` 12.1899A. Cumulative PerformanceDate Period NAV
per Unit (`)
Scheme Returns
(%)^
Benchmark Returns
(%)#
Additional Benchmark
Returns (%) ##
Value of Investment of Scheme ` 10000@
Scheme (`) Benchmark (`)#
Additional Benchmark
(`)##Dec 31, 15 Last 1 Year 11.1900 8.94 12.93 7.27 10,894 11,293 10,727Dec 31, 14 Last 2 Year 10.2706 8.94 10.76 7.75 11,869 12,268 11,609Oct 10, 14 Since Inception 10.0000 9.31 11.75 7.91 12,190 12,803 11,845
B. Discrete 12 month Returns (%) Period Scheme
^Benchmark
#Additional
Benchmark ##
Dec 31, 15 To Dec 30, 16 8.94 12.93 7.27Dec 31, 14 To Dec 31, 15 8.95 8.63 8.22
^Past performance may or may not be sustained in the future. Returns greater than 1 year period are compounded annualized (CAGR). # CRISIL Composite Bond Fund Index ## CRISIL 1 year T-Bill Index
SCHEME PERFORMANCE - REGULAR PLAN - GROWTH OPTION (FUND MANAGER-WISE)
Performance of dividend option under the schemes for the investors would be net of distribution tax as applicable. Load is not taken into consideration for computation of performance.@ shows the current value of ` 10,000/- invested at the beginning of a given period. n.A.: not Available
ANIL BAMBOLI....CONTINUED
Performance of FMP schemes, being close-ended in nature, is not strictly comparable with that of open-ended schemes since the investment strategy for FMP schemes is primarily buy-and-hold whereas open-ended schemes are actively managed.

64 January 2017 Intouch mutually
SCHEME PERFORMANCE - REGULAR PLAN - GROWTH OPTION (FUND MANAGER-WISE)
Performance of FMP schemes, being close-ended in nature, is not strictly comparable with that of open-ended schemes since the investment strategy for FMP schemes is primarily buy-and-hold whereas open-ended schemes are actively managed.Performance of dividend option under the schemes for the investors would be net of distribution tax as applicable. Load is not taken into consideration for computation of performance.@ shows the current value of ` 10,000/- invested at the beginning of a given period. n.A.: not Available
HDFC FMP 1113D OCTOBER 2014 (1) NAV as on December 30, 2016 ` 12.0983A. Cumulative PerformanceDate Period NAV
per Unit (`)
Scheme Returns
(%)^
Benchmark Returns
(%)#
Additional Benchmark
Returns (%) ##
Value of Investment of Scheme ` 10000@
Scheme (`) Benchmark (`)#
Additional Benchmark
(`)##Dec 31, 15 Last 1 Year 11.1066 8.93 12.93 7.27 10,893 11,293 10,727Dec 31, 14 Last 2 Year 10.1928 8.95 10.76 7.75 11,869 12,268 11,609Oct 22, 14 Since Inception 10.0000 9.08 11.52 7.86 12,098 12,700 11,804
B. Discrete 12 month Returns (%) Period Scheme
^Benchmark
#Additional
Benchmark ##
Dec 31, 15 To Dec 30, 16 8.93 12.93 7.27Dec 31, 14 To Dec 31, 15 8.97 8.63 8.22
^Past performance may or may not be sustained in the future. Returns greater than 1 year period are compounded annualized (CAGR). # CRISIL Composite Bond Fund Index ## CRISIL 1 year T-Bill Index
HDFC FMP 1107D OCTOBER 2014 (1) NAV as on December 30, 2016 ` 11.9963A. Cumulative PerformanceDate Period NAV
per Unit (`)
Scheme Returns
(%)^
Benchmark Returns
(%)#
Additional Benchmark
Returns (%) ##
Value of Investment of Scheme ` 10000@
Scheme (`) Benchmark (`)#
Additional Benchmark
(`)##Dec 31, 15 Last 1 Year 11.0086 8.97 12.93 7.27 10,897 11,293 10,727Dec 31, 14 Last 2 Year 10.1057 8.95 10.76 7.75 11,871 12,268 11,609nov 11, 14 Since Inception 10.0000 8.89 11.07 7.82 11,996 12,515 11,745
B. Discrete 12 month Returns (%) Period Scheme
^Benchmark
#Additional
Benchmark ##
Dec 31, 15 To Dec 30, 16 8.97 12.93 7.27Dec 31, 14 To Dec 31, 15 8.93 8.63 8.22
^Past performance may or may not be sustained in the future. Returns greater than 1 year period are compounded annualized (CAGR). # CRISIL Composite Bond Fund Index ## CRISIL 1 year T-Bill Index
HDFC FMP 1113D NOVEMBER 2014 (1) NAV as on December 30, 2016 ` 11.9400A. Cumulative PerformanceDate Period NAV
per Unit (`)
Scheme Returns
(%)^
Benchmark Returns
(%)#
Additional Benchmark
Returns (%) ##
Value of Investment of Scheme ` 10000@
Scheme (`) Benchmark (`)#
Additional Benchmark
(`)##Dec 31, 15 Last 1 Year 10.9558 8.98 12.93 7.27 10,898 11,293 10,727Dec 31, 14 Last 2 Year 10.0556 8.97 10.76 7.75 11,874 12,268 11,609nov 26, 14 Since Inception 10.0000 8.83 11.01 7.80 11,940 12,448 11,705
B. Discrete 12 month Returns (%) Period Scheme
^Benchmark
#Additional
Benchmark ##
Dec 31, 15 To Dec 30, 16 8.98 12.93 7.27Dec 31, 14 To Dec 31, 15 8.95 8.63 8.22
^Past performance may or may not be sustained in the future. Returns greater than 1 year period are compounded annualized (CAGR). # CRISIL Composite Bond Fund Index ## CRISIL 1 year T-Bill Index
HDFC FMP 1111D NOVEMBER 2014 (1) NAV as on December 30, 2016 ` 11.8819A. Cumulative PerformanceDate Period NAV
per Unit (`)
Scheme Returns
(%)^
Benchmark Returns
(%)#
Additional Benchmark
Returns (%) ##
Value of Investment of Scheme ` 10000@
Scheme (`) Benchmark (`)#
Additional Benchmark
(`)##Dec 31, 15 Last 1 Year 10.8726 9.28 12.93 7.27 10,928 11,293 10,727Dec 31, 14 Last 2 Year 10.0213 8.89 10.76 7.75 11,857 12,268 11,609Dec 05, 14 Since Inception 10.0000 8.68 10.65 7.80 11,882 12,333 11,683
B. Discrete 12 month Returns (%) Period Scheme
^Benchmark
#Additional
Benchmark ##
Dec 31, 15 To Dec 30, 16 9.28 12.93 7.27Dec 31, 14 To Dec 31, 15 8.49 8.63 8.22
^Past performance may or may not be sustained in the future. Returns greater than 1 year period are compounded annualized (CAGR). # CRISIL Composite Bond Fund Index ## CRISIL 1 year T-Bill Index
HDFC FMP 1107D DECEMBER 2014 (1) NAV as on December 30, 2016 ` 11.8090A. Cumulative PerformanceDate Period NAV
per Unit (`)
Scheme Returns
(%)^
Benchmark Returns
(%)#
Additional Benchmark
Returns (%) ##
Value of Investment of Scheme ` 10000@
Scheme (`) Benchmark (`)#
Additional Benchmark
(`)##Dec 31, 15 Last 1 Year 10.8561 8.78 12.93 7.27 10,878 11,293 10,727Jan 06, 15 Since Inception 10.0000 8.74 10.90 7.75 11,809 12,278 11,597
B. Discrete 12 month Returns (%) Period Scheme
^Benchmark
#Additional
Benchmark ##
Dec 31, 15 To Dec 30, 16 8.78 12.93 7.27
^Past performance may or may not be sustained in the future. Returns greater than 1 year period are compounded annualized (CAGR). # CRISIL Composite Bond Fund Index ## CRISIL 1 year T-Bill Index
HDFC FMP 1115D JANUARY 2015 (1) NAV as on December 30, 2016 ` 11.7551A. Cumulative PerformanceDate Period NAV
per Unit (`)
Scheme Returns
(%)^
Benchmark Returns
(%)#
Additional Benchmark
Returns (%) ##
Value of Investment of Scheme ` 10000@
Scheme (`) Benchmark (`)#
Additional Benchmark
(`)##Dec 31, 15 Last 1 Year 10.7896 8.95 12.93 7.27 10,895 11,293 10,727Jan 14, 15 Since Inception 10.0000 8.59 10.64 7.72 11,755 12,193 11,570
B. Discrete 12 month Returns (%) Period Scheme
^Benchmark
#Additional
Benchmark ##
Dec 31, 15 To Dec 30, 16 8.95 12.93 7.27^Past performance may or may not be sustained in the future. Returns greater than 1 year period are compounded annualized (CAGR). # CRISIL Composite Bond Fund Index ## CRISIL 1 year T-Bill Index
ANIL BAMBOLI....CONTINUED

Intouch mutually January 2017 65
HDFC FMP 1134D July 2015 (1) NAV as on December 30, 2016 ` 11.3534A. Cumulative PerformanceDate Period NAV
per Unit (`)
Scheme Returns
(%)^
Benchmark Returns
(%)#
Additional Benchmark
Returns (%) ##
Value of Investment of Scheme ` 10000@
Scheme (`) Benchmark (`)#
Additional Benchmark
(`)##Dec 31, 15 Last 1 Year 10.3657 9.53 12.93 7.27 10,953 11,293 10,727Jul 15, 15 Since Inception 10.0000 9.06 11.90 7.45 11,353 11,788 11,109
B. Discrete 12 month Returns (%) Period Scheme
^Benchmark
#Additional
Benchmark ##
Dec 31, 15 To Dec 30, 16 9.53 12.93 7.27^Past performance may or may not be sustained in the future. Returns greater than 1 year period are compounded annualized (CAGR). # CRISIL Composite Bond Fund Index ## CRISIL 1 year T-Bill Index
HDFC FMP 1126D July 2015 (1) NAV as on December 30, 2016 ` 11.2383A. Cumulative PerformanceDate Period NAV
per Unit (`)
Scheme Returns
(%)^
Benchmark Returns
(%)#
Additional Benchmark
Returns (%) ##
Value of Investment of Scheme ` 10000@
Scheme (`) Benchmark (`)#
Additional Benchmark
(`)##Dec 31, 15 Last 1 Year 10.3187 8.91 12.93 7.27 10,891 11,293 10,727Jul 23, 15 Since Inception 10.0000 8.44 11.88 7.46 11,238 11,755 11,092
B. Discrete 12 month Returns (%) Period Scheme
^Benchmark
#Additional
Benchmark ##
Dec 31, 15 To Dec 30, 16 8.91 12.93 7.27^Past performance may or may not be sustained in the future. Returns greater than 1 year period are compounded annualized (CAGR). # CRISIL Composite Bond Fund Index ## CRISIL 1 year T-Bill Index
HDFC FMP 1141D July 2015 (1) NAV as on December 30, 2016 ` 11.2227A. Cumulative PerformanceDate Period NAV
per Unit (`)
Scheme Returns
(%)^
Benchmark Returns
(%)#
Additional Benchmark
Returns (%) ##
Value of Investment of Scheme ` 10000@
Scheme (`) Benchmark (`)#
Additional Benchmark
(`)##Dec 31, 15 Last 1 Year 10.2792 9.18 12.93 7.27 10,918 11,293 10,727Aug 06, 15 Since Inception 10.0000 8.57 11.81 7.46 11,223 11,695 11,062
B. Discrete 12 month Returns (%) Period Scheme
^Benchmark
#Additional
Benchmark ##
Dec 31, 15 To Dec 30, 16 9.18 12.93 7.27^Past performance may or may not be sustained in the future. Returns greater than 1 year period are compounded annualized (CAGR). # CRISIL Composite Bond Fund Index ## CRISIL 1 year T-Bill Index
HDFC FMP 1108D September 2015 (1) NAV as on December 30, 2016 ` 11.1290A. Cumulative PerformanceDate Period NAV
per Unit (`)
Scheme Returns
(%)^
Benchmark Returns
(%)#
Additional Benchmark
Returns (%) ##
Value of Investment of Scheme ` 10000@
Scheme (`) Benchmark (`)#
Additional Benchmark
(`)##Dec 31, 15 Last 1 Year 10.1945 9.17 12.93 7.27 10,917 11,293 10,727Sep 23, 15 Since Inception 10.0000 8.78 11.99 7.42 11,129 11,548 10,953
B. Discrete 12 month Returns (%) Period Scheme
^Benchmark
#Additional
Benchmark ##
Dec 31, 15 To Dec 30, 16 9.17 12.93 7.27^Past performance may or may not be sustained in the future. Returns greater than 1 year period are compounded annualized (CAGR). # CRISIL Composite Bond Fund Index ## CRISIL 1 year T-Bill Index
HDFC FMP 1105D October 2015 (1) NAV as on December 30, 2016 ` 11.0135A. Cumulative PerformanceDate Period NAV
per Unit (`)
Scheme Returns
(%)^
Benchmark Returns
(%)#
Additional Benchmark
Returns (%) ##
Value of Investment of Scheme ` 10000@
Scheme (`) Benchmark (`)#
Additional Benchmark
(`)##Dec 31, 15 Last 1 Year 10.0837 9.22 12.93 7.27 10,922 11,293 10,727Oct 15, 15 Since Inception 10.0000 8.30 11.31 7.16 11,014 11,385 10,874
B. Discrete 12 month Returns (%) Period Scheme
^Benchmark
#Additional
Benchmark ##
Dec 31, 15 To Dec 30, 16 9.22 12.93 7.27^Past performance may or may not be sustained in the future. Returns greater than 1 year period are compounded annualized (CAGR). # CRISIL Composite Bond Fund Index ## CRISIL 1 year T-Bill Index
HDFC FMP 1111D November 2015 (1) NAV as on December 30, 2016 ` 10.9372A. Cumulative PerformanceDate Period NAV
per Unit (`)
Scheme Returns
(%)^
Benchmark Returns
(%)#
Additional Benchmark
Returns (%) ##
Value of Investment of Scheme ` 10000@
Scheme (`) Benchmark (`)#
Additional Benchmark
(`)##Dec 31, 15 Last 1 Year 10.0245 9.10 12.93 7.27 10,910 11,293 10,727Dec 03, 15 Since Inception 10.0000 8.68 12.15 7.21 10,937 11,314 10,778
B. Discrete 12 month Returns (%) Period Scheme
^Benchmark
#Additional
Benchmark ##
Dec 31, 15 To Dec 30, 16 9.10 12.93 7.27^Past performance may or may not be sustained in the future. Returns greater than 1 year period are compounded annualized (CAGR). # CRISIL Composite Bond Fund Index ## CRISIL 1 year T-Bill Index
SCHEME PERFORMANCE - REGULAR PLAN - GROWTH OPTION (FUND MANAGER-WISE)ANIL BAMBOLI....CONTINUED
Performance of dividend option under the schemes for the investors would be net of distribution tax as applicable. Load is not taken into consideration for computation of performance.@ shows the current value of ` 10,000/- invested at the beginning of a given period. n.A.: not Available
Performance of FMP schemes, being close-ended in nature, is not strictly comparable with that of open-ended schemes since the investment strategy for FMP schemes is primarily buy-and-hold whereas open-ended schemes are actively managed.

66 January 2017 Intouch mutually
SCHEME PERFORMANCE - REGULAR PLAN - GROWTH OPTION (FUND MANAGER-WISE)
KRISHAN KUMAR DAGAHDFC GOLD EXCHANGE TRADED FUND* NAV as on December 30, 2016 ` 2,610.9082
A. Cumulative PerformanceDate Period NAV per Unit
(`)Scheme
Returns (%)^Benchmark
Returns (%)#Value of Investment of Scheme ` 10000@
Scheme (`) Benchmark (`)#Dec 31, 15 Last 1 Year 2,366.0439 10.35 11.57 11,035 11,157Dec 31, 14 Last 2 Years 2,575.8398 0.68 1.76 10,136 10,355Dec 31, 13 Last 3 Years 2,554.2262 0.73 1.81 10,222 10,554Aug 13, 10 Since Inception 1,800.3288 5.99 6.68 14,502 15,112
B. Discrete 12 month Returns (%) Period Scheme
^Benchmark
#Dec 31, 15 To Dec 30, 16 10.35 11.57Dec 31, 14 To Dec 31, 15 -8.14 -7.19Dec 31, 13 To Dec 31, 14 0.85 1.92
^Past performance may or may not be sustained in the future. Returns greater than 1 year period are compounded annualized (CAGR). # Domestic Price of Physical Gold. Since inception returns are calculated on ` 1800.3288 (allotment price) * Currently, there are no Options being offered under the Scheme.
HDFC GOLD FUND NAV as on December 30, 2016 ` 9.4116
A. Cumulative PerformanceDate Period NAV per Unit
(`)Scheme
Returns (%)^Benchmark
Returns (%)#Value of Investment of Scheme ` 10000@
Scheme (`) Benchmark (`)#Dec 31, 15 Last 1 Year 8.5516 10.06 11.57 11,006 11,157Dec 31, 14 Last 2 Years 9.2217 1.02 1.76 10,206 10,355Dec 31, 13 Last 3 Years 10.2190 -2.71 1.81 9,210 10,554nov 01, 11 Since Inception 10.0000 -1.17 0.57 9,412 10,298
B. Discrete 12 month Returns (%) Period Scheme
^Benchmark
#Dec 31, 15 To Dec 30, 16 10.06 11.57Dec 31, 14 To Dec 31, 15 -7.27 -7.19Dec 31, 13 To Dec 31, 14 -9.76 1.92
^Past performance may or may not be sustained in the future. Returns greater than 1 year period are compounded annualized (CAGR). # Domestic Price of Physical Gold
HDFC SENSEX ETF NAV as on December 30, 2016 ` 2,705.590A. Cumulative PerformanceDate Period NAV
per Unit (`)
Scheme Returns
(%)^
Benchmark Returns
(%)#
Additional Benchmark
Returns (%) ##
Value of Investment of Scheme ` 10000@
Scheme (`) Benchmark (`)#
Additional Benchmark
(`)##Dec 31, 15 Last 1 Year 2,606.220 3.81 1.95 3.01 10,381 10,195 10,301Dec 09, 15 Since Inception 2,503.610 7.59 5.98 7.09 10,807 10,635 10,753
B. Discrete 12 month Returns (%) Period Scheme
^Benchmark
#Additional
Benchmark ##
Dec 31, 15 To Dec 30, 16 3.81 1.95 3.01^Past performance may or may not be sustained in the future. Returns greater than 1 year period are compounded annualized (CAGR). # S&P BSE SEnSEx Index ## nIFTY 50 Index
HDFC NIFTY ETF NAV as on December 30, 2016 ` 827.820A. Cumulative PerformanceDate Period NAV
per Unit (`)
Scheme Returns
(%)^
Benchmark Returns
(%)#
Additional Benchmark
Returns (%) ##
Value of Investment of Scheme ` 10000@
Scheme (`) Benchmark (`)#
Additional Benchmark
(`)##Dec 31, 15 Last 1 Year 793.280 4.35 3.01 1.95 10,435 10,301 10,195Dec 09, 15 Since Inception 761.250 8.23 7.09 5.98 10,874 10,753 10,635
B. Discrete 12 month Returns (%) Period Scheme
^Benchmark
#Additional
Benchmark ##
Dec 31, 15 To Dec 30, 16 4.35 3.01 1.95^Past performance may or may not be sustained in the future. Returns greater than 1 year period are compounded annualized (CAGR). # nIFTY 50 Index ## S&P BSE SEnSEx Index
CO-MANAGED BY VINAY KULKARNI & ANIL BAMBOLIHDFC CPO - II - 36M MAY 2014 NAV as on December 30, 2016 ` 11.6532A. Cumulative PerformanceDate Period NAV
per Unit (`)
Scheme Returns
(%)^
Benchmark Returns
(%)#
Additional Benchmark
Returns (%) ##
Value of Investment of Scheme ` 10000@
Scheme (`) Benchmark (`)#
Additional Benchmark
(`)##Dec 31, 15 Last 1 Year 11.0371 5.58 11.55 7.27 10,558 11,155 10,727Dec 31, 14 Last 2 Years 10.5606 5.05 9.14 7.75 11,035 11,912 11,609Jun 05, 14 Since Inception 10.0000 6.13 10.29 7.88 11,653 12,865 12,156
B. Discrete 12 month Returns (%) Period Scheme
^Benchmark
#Additional
Benchmark ##
Dec 31, 15 To Dec 30, 16 5.58 11.55 7.27Dec 31, 14 To Dec 31, 15 4.51 6.79 8.22
^Past performance may or may not be sustained in the future. Returns greater than 1 year period are compounded annualized (CAGR). # CRISIL MIP Blended Index ## CRISIL 1 year T-Bill Index
HDFC CPO - II - 36M JUNE 2014 NAV as on December 30, 2016 ` 11.6369A. Cumulative PerformanceDate Period NAV
per Unit (`)
Scheme Returns
(%)^
Benchmark Returns
(%)#
Additional Benchmark
Returns (%) ##
Value of Investment of Scheme ` 10000@
Scheme (`) Benchmark (`)#
Additional Benchmark
(`)##Dec 31, 15 Last 1 Year 11.0349 5.46 11.55 7.27 10,546 11,155 10,727Dec 31, 14 Last 2 Years 10.5508 5.02 9.14 7.75 11,029 11,912 11,609Jun 30, 14 Since Inception 10.0000 6.24 10.43 7.93 11,637 12,821 12,105
B. Discrete 12 month Returns (%) Period Scheme
^Benchmark
#Additional
Benchmark ##
Dec 31, 15 To Dec 30, 16 5.46 11.55 7.27Dec 31, 14 To Dec 31, 15 4.59 6.79 8.22
^Past performance may or may not be sustained in the future. Returns greater than 1 year period are compounded annualized (CAGR). # CRISIL MIP Blended Index ## CRISIL 1 year T-Bill IndexPerformance of close-ended Scheme is not strictly comparable with that of open-ended schemes since the investment strategy for close-ended schemes is primarily buy and hold whereas open ended schemes are actively managed.Performance of dividend option under the schemes for the investors would be net of distribution tax as applicable. Load is not taken into consideration for computation of performance.@ shows the current value of ` 10,000/- invested at the beginning of a given period. n.A.: not Available
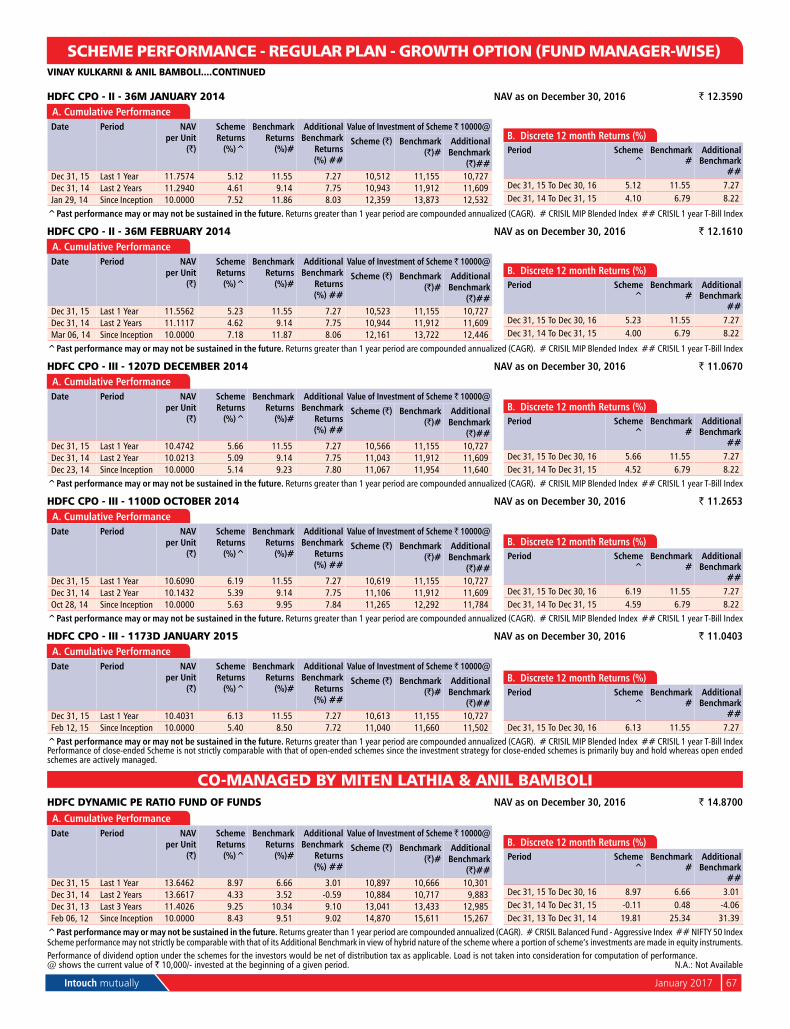
Intouch mutually January 2017 67
SCHEME PERFORMANCE - REGULAR PLAN - GROWTH OPTION (FUND MANAGER-WISE)
HDFC CPO - II - 36M JANUARY 2014 NAV as on December 30, 2016 ` 12.3590A. Cumulative PerformanceDate Period NAV
per Unit (`)
Scheme Returns
(%)^
Benchmark Returns
(%)#
Additional Benchmark
Returns (%) ##
Value of Investment of Scheme ` 10000@
Scheme (`) Benchmark (`)#
Additional Benchmark
(`)##Dec 31, 15 Last 1 Year 11.7574 5.12 11.55 7.27 10,512 11,155 10,727Dec 31, 14 Last 2 Years 11.2940 4.61 9.14 7.75 10,943 11,912 11,609Jan 29, 14 Since Inception 10.0000 7.52 11.86 8.03 12,359 13,873 12,532
B. Discrete 12 month Returns (%) Period Scheme
^Benchmark
#Additional
Benchmark ##
Dec 31, 15 To Dec 30, 16 5.12 11.55 7.27Dec 31, 14 To Dec 31, 15 4.10 6.79 8.22
^Past performance may or may not be sustained in the future. Returns greater than 1 year period are compounded annualized (CAGR). # CRISIL MIP Blended Index ## CRISIL 1 year T-Bill Index
HDFC CPO - II - 36M FEBRUARY 2014 NAV as on December 30, 2016 ` 12.1610A. Cumulative PerformanceDate Period NAV
per Unit (`)
Scheme Returns
(%)^
Benchmark Returns
(%)#
Additional Benchmark
Returns (%) ##
Value of Investment of Scheme ` 10000@
Scheme (`) Benchmark (`)#
Additional Benchmark
(`)##Dec 31, 15 Last 1 Year 11.5562 5.23 11.55 7.27 10,523 11,155 10,727Dec 31, 14 Last 2 Years 11.1117 4.62 9.14 7.75 10,944 11,912 11,609Mar 06, 14 Since Inception 10.0000 7.18 11.87 8.06 12,161 13,722 12,446
B. Discrete 12 month Returns (%) Period Scheme
^Benchmark
#Additional
Benchmark ##
Dec 31, 15 To Dec 30, 16 5.23 11.55 7.27Dec 31, 14 To Dec 31, 15 4.00 6.79 8.22
^Past performance may or may not be sustained in the future. Returns greater than 1 year period are compounded annualized (CAGR). # CRISIL MIP Blended Index ## CRISIL 1 year T-Bill Index
HDFC CPO - III - 1207D DECEMBER 2014 NAV as on December 30, 2016 ` 11.0670A. Cumulative PerformanceDate Period NAV
per Unit (`)
Scheme Returns
(%)^
Benchmark Returns
(%)#
Additional Benchmark
Returns (%) ##
Value of Investment of Scheme ` 10000@
Scheme (`) Benchmark (`)#
Additional Benchmark
(`)##Dec 31, 15 Last 1 Year 10.4742 5.66 11.55 7.27 10,566 11,155 10,727Dec 31, 14 Last 2 Year 10.0213 5.09 9.14 7.75 11,043 11,912 11,609Dec 23, 14 Since Inception 10.0000 5.14 9.23 7.80 11,067 11,954 11,640
B. Discrete 12 month Returns (%) Period Scheme
^Benchmark
#Additional
Benchmark ##
Dec 31, 15 To Dec 30, 16 5.66 11.55 7.27Dec 31, 14 To Dec 31, 15 4.52 6.79 8.22
^Past performance may or may not be sustained in the future. Returns greater than 1 year period are compounded annualized (CAGR). # CRISIL MIP Blended Index ## CRISIL 1 year T-Bill Index
HDFC CPO - III - 1100D OCTOBER 2014 NAV as on December 30, 2016 ` 11.2653A. Cumulative PerformanceDate Period NAV
per Unit (`)
Scheme Returns
(%)^
Benchmark Returns
(%)#
Additional Benchmark
Returns (%) ##
Value of Investment of Scheme ` 10000@
Scheme (`) Benchmark (`)#
Additional Benchmark
(`)##Dec 31, 15 Last 1 Year 10.6090 6.19 11.55 7.27 10,619 11,155 10,727Dec 31, 14 Last 2 Year 10.1432 5.39 9.14 7.75 11,106 11,912 11,609Oct 28, 14 Since Inception 10.0000 5.63 9.95 7.84 11,265 12,292 11,784
B. Discrete 12 month Returns (%) Period Scheme
^Benchmark
#Additional
Benchmark ##
Dec 31, 15 To Dec 30, 16 6.19 11.55 7.27Dec 31, 14 To Dec 31, 15 4.59 6.79 8.22
^Past performance may or may not be sustained in the future. Returns greater than 1 year period are compounded annualized (CAGR). # CRISIL MIP Blended Index ## CRISIL 1 year T-Bill Index
HDFC CPO - III - 1173D JANUARY 2015 NAV as on December 30, 2016 ` 11.0403A. Cumulative PerformanceDate Period NAV
per Unit (`)
Scheme Returns
(%)^
Benchmark Returns
(%)#
Additional Benchmark
Returns (%) ##
Value of Investment of Scheme ` 10000@
Scheme (`) Benchmark (`)#
Additional Benchmark
(`)##Dec 31, 15 Last 1 Year 10.4031 6.13 11.55 7.27 10,613 11,155 10,727Feb 12, 15 Since Inception 10.0000 5.40 8.50 7.72 11,040 11,660 11,502
B. Discrete 12 month Returns (%) Period Scheme
^Benchmark
#Additional
Benchmark ##
Dec 31, 15 To Dec 30, 16 6.13 11.55 7.27^Past performance may or may not be sustained in the future. Returns greater than 1 year period are compounded annualized (CAGR). # CRISIL MIP Blended Index ## CRISIL 1 year T-Bill IndexPerformance of close-ended Scheme is not strictly comparable with that of open-ended schemes since the investment strategy for close-ended schemes is primarily buy and hold whereas open ended schemes are actively managed.
CO-MANAGED BY MITEN LATHIA & ANIL BAMBOLIHDFC DYNAMIC PE RATIO FUND OF FUNDS NAV as on December 30, 2016 ` 14.8700
A. Cumulative PerformanceDate Period NAV
per Unit (`)
Scheme Returns
(%)^
Benchmark Returns
(%)#
Additional Benchmark
Returns (%) ##
Value of Investment of Scheme ` 10000@
Scheme (`) Benchmark (`)#
Additional Benchmark
(`)##Dec 31, 15 Last 1 Year 13.6462 8.97 6.66 3.01 10,897 10,666 10,301Dec 31, 14 Last 2 Years 13.6617 4.33 3.52 -0.59 10,884 10,717 9,883Dec 31, 13 Last 3 Years 11.4026 9.25 10.34 9.10 13,041 13,433 12,985Feb 06, 12 Since Inception 10.0000 8.43 9.51 9.02 14,870 15,611 15,267
B. Discrete 12 month Returns (%) Period Scheme
^Benchmark
#Additional
Benchmark ##
Dec 31, 15 To Dec 30, 16 8.97 6.66 3.01Dec 31, 14 To Dec 31, 15 -0.11 0.48 -4.06Dec 31, 13 To Dec 31, 14 19.81 25.34 31.39
^Past performance may or may not be sustained in the future. Returns greater than 1 year period are compounded annualized (CAGR). # CRISIL Balanced Fund - Aggressive Index ## nIFTY 50 IndexScheme performance may not strictly be comparable with that of its Additional Benchmark in view of hybrid nature of the scheme where a portion of scheme’s investments are made in equity instruments.Performance of dividend option under the schemes for the investors would be net of distribution tax as applicable. Load is not taken into consideration for computation of performance.@ shows the current value of ` 10,000/- invested at the beginning of a given period. n.A.: not Available
VINAY KULKARNI & ANIL BAMBOLI....CONTINUED

68 January 2017 Intouch mutually
SCHEME PERFORMANCE - DIRECT PLAN - GROWTH OPTION (FUND MANAGER-WISE)
PRASHANT JAINHDFC EQUITY FUND NAV as on December 30, 2016 ` 491.564A. Cumulative PerformanceDate Period NAV
per Unit (`)
Scheme Returns
(%)^
Benchmark Returns
(%)#
Additional Benchmark
Returns (%) ##
Value of Investment of Scheme ` 10000@
Scheme (`) Benchmark (`)#
Additional Benchmark
(`)##Dec 31, 15 Last 1 Year 454.473 8.16 3.84 3.01 10,816 10,384 10,301Dec 31, 14 Last 2 Years 474.909 1.74 1.53 -0.59 10,351 10,309 9,883Dec 31, 13 Last 3 Years 306.670 17.03 12.42 9.10 16,029 14,208 12,985Jan 01, 13 Since Inception 296.876 13.45 9.91 8.30 16,558 14,589 13,756
B. Discrete 12 month Returns (%) Period Scheme
^Benchmark
#Additional
Benchmark ##
Dec 31, 15 To Dec 30, 16 8.16 3.84 3.01Dec 31, 14 To Dec 31, 15 -4.30 -0.72 -4.06Dec 31, 13 To Dec 31, 14 54.86 37.82 31.39
^Past performance may or may not be sustained in the future. Returns greater than 1 year period are compounded annualized (CAGR). # nIFTY 500 Index ## nIFTY 50 Index
HDFC TOP 200 FUND NAV as on December 30, 2016 ` 360.427A. Cumulative PerformanceDate Period NAV
per Unit (`)
Scheme Returns
(%)^
Benchmark Returns
(%)#
Additional Benchmark
Returns (%) ##
Value of Investment of Scheme ` 10000@
Scheme (`) Benchmark (`)#
Additional Benchmark
(`)##Dec 31, 15 Last 1 Year 329.752 9.30 3.95 1.95 10,930 10,395 10,195Dec 31, 14 Last 2 Years 348.854 1.65 1.20 -1.60 10,332 10,242 9,683Dec 31, 13 Last 3 Years 236.726 15.04 11.53 7.94 15,225 13,874 12,577Jan 01, 13 Since Inception 228.943 12.02 9.46 7.99 15,743 14,353 13,598
B. Discrete 12 month Returns (%)Period Scheme
^Benchmark
#Additional
Benchmark ##
Dec 31, 15 To Dec 30, 16 9.30 3.95 1.95Dec 31, 14 To Dec 31, 15 -5.48 -1.48 -5.03Dec 31, 13 To Dec 31, 14 47.37 35.47 29.89
^Past performance may or may not be sustained in the future. Returns greater than 1 year period are compounded annualized (CAGR). # S&P BSE 200 ## S&P BSE SEnSEx
HDFC PRUDENCE FUND NAV as on December 30, 2016 ` 421.084A. Cumulative PerformanceDate Period NAV
per Unit (`)
Scheme Returns
(%)^
Benchmark Returns
(%)#
Additional Benchmark
Returns (%) ##
Value of Investment of Scheme ` 10000@
Scheme (`) Benchmark (`)#
Additional Benchmark
(`)##Dec 31, 15 Last 1 Year 381.429 10.40 6.66 3.01 11,040 10,666 10,301Dec 31, 14 Last 2 Years 377.591 5.60 3.52 -0.59 11,152 10,717 9,883Dec 31, 13 Last 3 Years 247.365 19.40 10.34 9.10 17,023 13,433 12,985Jan 01, 13 Since Inception 243.322 14.71 9.10 8.30 17,306 14,164 13,756
B. Discrete 12 month Returns (%)Period Scheme
^Benchmark
#Additional
Benchmark ##
Dec 31, 15 To Dec 30, 16 10.40 6.66 3.01Dec 31, 14 To Dec 31, 15 1.02 0.48 -4.06Dec 31, 13 To Dec 31, 14 52.65 25.34 31.39
^Past performance may or may not be sustained in the future. Returns greater than 1 year period are compounded annualized (CAGR). # CRISIL Balanced Fund - Aggressive Index ## nIFTY 50 IndexScheme performance may not strictly be comparable with that of its Additional Benchmark in view of balanced nature of the scheme where a portion of scheme’s investments are made in debt instruments.
VINAY KULKARNIHDFC CORE & SATELLITE FUND NAV as on December 30, 2016 ` 65.027A. Cumulative PerformanceDate Period NAV
per Unit (`)
Scheme Returns
(%)^
Benchmark Returns
(%)#
Additional Benchmark
Returns (%) ##
Value of Investment of Scheme ` 10000@
Scheme (`) Benchmark (`)#
Additional Benchmark
(`)##Dec 31, 15 Last 1 Year 62.899 3.38 3.95 1.95 10,338 10,395 10,195Dec 31, 14 Last 2 Years 59.509 4.53 1.20 -1.60 10,927 10,242 9,683Dec 31, 13 Last 3 Years 39.084 18.49 11.53 7.94 16,638 13,874 12,577Jan 01, 13 Since Inception 40.302 12.71 9.46 7.99 16,135 14,353 13,598
B. Discrete 12 month Returns (%)Period Scheme
^Benchmark
#Additional
Benchmark ##
Dec 31, 15 To Dec 30, 16 3.38 3.95 1.95Dec 31, 14 To Dec 31, 15 5.70 -1.48 -5.03Dec 31, 13 To Dec 31, 14 52.26 35.47 29.89
^Past performance may or may not be sustained in the future. Returns greater than 1 year period are compounded annualized (CAGR). # S&P BSE 200 ## S&P BSE SEnSEx
HDFC PREMIER MULTI-CAP FUND NAV as on December 30, 2016 ` 44.022A. Cumulative PerformanceDate Period NAV
per Unit (`)
Scheme Returns
(%)^
Benchmark Returns
(%)#
Additional Benchmark
Returns (%) ##
Value of Investment of Scheme ` 10000@
Scheme (`) Benchmark (`)#
Additional Benchmark
(`)##Dec 31, 15 Last 1 Year 43.686 0.77 3.84 3.01 10,077 10,384 10,301Dec 31, 14 Last 2 Years 43.936 0.10 1.53 -0.59 10,020 10,309 9,883Dec 31, 13 Last 3 Years 28.738 15.28 12.42 9.10 15,318 14,208 12,985Jan 01, 13 Since Inception 28.957 11.05 9.91 8.30 15,203 14,589 13,756
B. Discrete 12 month Returns (%)Period Scheme
^Benchmark
#Additional
Benchmark ##
Dec 31, 15 To Dec 30, 16 0.77 3.84 3.01Dec 31, 14 To Dec 31, 15 -0.57 -0.72 -4.06Dec 31, 13 To Dec 31, 14 52.88 37.82 31.39
^Past performance may or may not be sustained in the future. Returns greater than 1 year period are compounded annualized (CAGR). # nIFTY 500 Index ## nIFTY 50 Index
Performance of dividend option under the schemes for the investors would be net of distribution tax as applicable. Load is not taken into consideration for computation of performance.@ shows the current value of ` 10,000/- invested at the beginning of a given period. n.A.: not Available

Intouch mutually January 2017 69
HDFC LARGE CAP FUND NAV as on December 30, 2016 ` 88.205A. Cumulative PerformanceDate Period NAV
per Unit (`)
Scheme Returns
(%)^
Benchmark Returns
(%)#
Additional Benchmark
Returns (%) ##
Value of Investment of Scheme ` 10000@
Scheme (`) Benchmark (`)#
Additional Benchmark
(`)##Dec 31, 15 Last 1 Year 84.753 4.07 3.01 1.95 10,407 10,301 10,195Dec 31, 14 Last 2 Years 88.989 -0.44 -0.59 -1.60 9,912 9,883 9,683Dec 31, 13 Last 3 Years 69.639 8.20 9.10 7.94 12,666 12,985 12,577Jan 01, 13 Since Inception 66.927 7.15 8.30 7.99 13,179 13,756 13,598
B. Discrete 12 month Returns (%)Period Scheme
^Benchmark
#Additional
Benchmark ##
Dec 31, 15 To Dec 30, 16 4.07 3.01 1.95Dec 31, 14 To Dec 31, 15 -4.76 -4.06 -5.03Dec 31, 13 To Dec 31, 14 27.79 31.39 29.89
^Past performance may or may not be sustained in the future. Returns greater than 1 year period are compounded annualized (CAGR). # nIFTY 50 Index ## S&P BSE SEnSEx
HDFC TAXSAVER NAV as on December 30, 2016 ` 413.772A. Cumulative PerformanceDate Period NAV
per Unit (`)
Scheme Returns
(%)^
Benchmark Returns
(%)#
Additional Benchmark
Returns (%) ##
Value of Investment of Scheme ` 10000@
Scheme (`) Benchmark (`)#
Additional Benchmark
(`)##Dec 31, 15 Last 1 Year 382.113 8.29 3.84 3.01 10,829 10,384 10,301Dec 31, 14 Last 2 Years 405.644 1.00 1.53 -0.59 10,200 10,309 9,883Dec 31, 13 Last 3 Years 258.084 17.04 12.42 9.10 16,032 14,208 12,985Jan 01, 13 Since Inception 246.413 13.84 9.91 8.30 16,792 14,589 13,756
B. Discrete 12 month Returns (%)Period Scheme
^Benchmark
#Additional
Benchmark ##
Dec 31, 15 To Dec 30, 16 8.29 3.84 3.01Dec 31, 14 To Dec 31, 15 -5.80 -0.72 -4.06Dec 31, 13 To Dec 31, 14 57.18 37.82 31.39
^Past performance may or may not be sustained in the future. Returns greater than 1 year period are compounded annualized (CAGR). # nIFTY 500 Index ## nIFTY 50 Index
CHIRAG SETALVAD
HDFC MID-CAP OPPORTUNITIES FUND NAV as on December 30, 2016 ` 43.845A. Cumulative PerformanceDate Period NAV
per Unit (`)
Scheme Returns
(%)^
Benchmark Returns
(%)#
Additional Benchmark
Returns (%) ##
Value of Investment of Scheme ` 10000@
Scheme (`) Benchmark (`)#
Additional Benchmark
(`)##Dec 31, 15 Last 1 Year 39.011 12.39 7.13 3.01 11,239 10,713 10,301Dec 31, 14 Last 2 Years 36.519 9.57 6.79 -0.59 12,006 11,405 9,883Dec 31, 13 Last 3 Years 20.534 28.77 21.15 9.10 21,352 17,781 12,985Jan 01, 13 Since Inception 18.799 23.60 13.66 8.30 23,323 16,683 13,756
B. Discrete 12 month Returns (%)Period Scheme
^Benchmark
#Additional
Benchmark ##
Dec 31, 15 To Dec 30, 16 12.39 7.13 3.01Dec 31, 14 To Dec 31, 15 6.82 6.46 -4.06Dec 31, 13 To Dec 31, 14 77.85 55.91 31.39
^Past performance may or may not be sustained in the future. Returns greater than 1 year period are compounded annualized (CAGR). # nIFTY Free Float Midcap 100 Index ## nIFTY 50 Index
HDFC SMALL CAP FUND NAV as on December 30, 2016 ` 29.896
A. Cumulative PerformanceDate Period NAV
per Unit (`)
Scheme Returns
(%)^
Benchmark Returns
(%)#
Additional Benchmark
Returns (%) ##
Value of Investment of Scheme ` 10000@
Scheme (`) Benchmark (`)#
Additional Benchmark
(`)##Dec 31, 15 Last 1 Year 27.998 6.78 2.26 3.01 10,678 10,226 10,301Dec 31, 14 Last 2 Years 25.973 7.29 4.71 -0.59 11,510 10,963 9,883Dec 31, 13 Last 3 Years 17.021 20.65 19.32 9.10 17,564 16,988 12,985Jan 01, 13 Since Inception 15.909 17.10 11.28 8.30 18,792 15,331 13,756
B. Discrete 12 month Returns (%) Period Scheme
^Benchmark
#Additional
Benchmark ##
Dec 31, 15 To Dec 30, 16 6.78 2.26 3.01Dec 31, 14 To Dec 31, 15 7.80 7.21 -4.06Dec 31, 13 To Dec 31, 14 52.59 54.95 31.39
^Past performance may or may not be sustained in the future. Returns greater than 1 year period are compounded annualized (CAGR). # nIFTY Free Float Smallcap 100 Index ## nIFTY 50 Index
HDFC BALANCED FUND NAV as on December 30, 2016 ` 122.938A. Cumulative PerformanceDate Period NAV
per Unit (`)
Scheme Returns
(%)^
Benchmark Returns
(%)#
Additional Benchmark
Returns (%) ##
Value of Investment of Scheme ` 10000@
Scheme (`) Benchmark (`)#
Additional Benchmark
(`)##Dec 31, 15 Last 1 Year 110.802 10.95 6.66 3.01 11,095 10,666 10,301Dec 31, 14 Last 2 Years 106.524 7.43 3.52 -0.59 11,541 10,717 9,883Dec 31, 13 Last 3 Years 69.869 20.73 10.34 9.10 17,596 13,433 12,985Jan 01, 13 Since Inception 64.365 17.57 9.10 8.30 19,100 14,164 13,756
B. Discrete 12 month Returns (%)Period Scheme
^Benchmark
#Additional
Benchmark ##
Dec 31, 15 To Dec 30, 16 10.95 6.66 3.01Dec 31, 14 To Dec 31, 15 4.02 0.48 -4.06Dec 31, 13 To Dec 31, 14 52.46 25.34 31.39
^Past performance may or may not be sustained in the future. Returns greater than 1 year period are compounded annualized (CAGR). # CRISIL Balanced Fund - Aggressive Index ## nIFTY 50 IndexScheme performance may not strictly be comparable with that of its Additional Benchmark in view of balanced nature of the scheme where a portion of scheme’s investments are made in debt instruments.
SCHEME PERFORMANCE - DIRECT PLAN - GROWTH OPTION (FUND MANAGER-WISE)VINAY KULKARNI....CONTINUED
Performance of dividend option under the schemes for the investors would be net of distribution tax as applicable. Load is not taken into consideration for computation of performance.@ shows the current value of ` 10,000/- invested at the beginning of a given period. n.A.: not Available
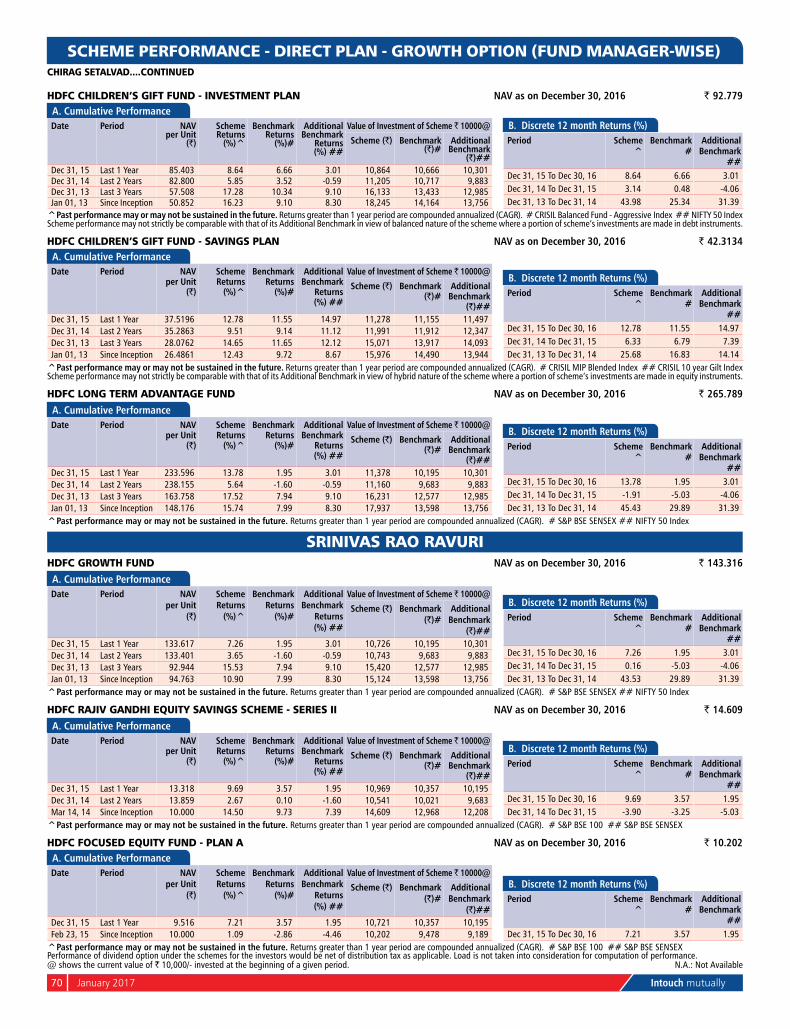
70 January 2017 Intouch mutually
HDFC CHILDREN’S GIFT FUND - INVESTMENT PLAN NAV as on December 30, 2016 ` 92.779A. Cumulative PerformanceDate Period NAV
per Unit (`)
Scheme Returns
(%)^
Benchmark Returns
(%)#
Additional Benchmark
Returns (%) ##
Value of Investment of Scheme ` 10000@
Scheme (`) Benchmark (`)#
Additional Benchmark
(`)##Dec 31, 15 Last 1 Year 85.403 8.64 6.66 3.01 10,864 10,666 10,301Dec 31, 14 Last 2 Years 82.800 5.85 3.52 -0.59 11,205 10,717 9,883Dec 31, 13 Last 3 Years 57.508 17.28 10.34 9.10 16,133 13,433 12,985Jan 01, 13 Since Inception 50.852 16.23 9.10 8.30 18,245 14,164 13,756
B. Discrete 12 month Returns (%)Period Scheme
^Benchmark
#Additional
Benchmark ##
Dec 31, 15 To Dec 30, 16 8.64 6.66 3.01Dec 31, 14 To Dec 31, 15 3.14 0.48 -4.06Dec 31, 13 To Dec 31, 14 43.98 25.34 31.39
^Past performance may or may not be sustained in the future. Returns greater than 1 year period are compounded annualized (CAGR). # CRISIL Balanced Fund - Aggressive Index ## nIFTY 50 IndexScheme performance may not strictly be comparable with that of its Additional Benchmark in view of balanced nature of the scheme where a portion of scheme’s investments are made in debt instruments.
HDFC CHILDREN’S GIFT FUND - SAVINGS PLAN NAV as on December 30, 2016 ` 42.3134A. Cumulative PerformanceDate Period NAV
per Unit (`)
Scheme Returns
(%)^
Benchmark Returns
(%)#
Additional Benchmark
Returns (%) ##
Value of Investment of Scheme ` 10000@
Scheme (`) Benchmark (`)#
Additional Benchmark
(`)##Dec 31, 15 Last 1 Year 37.5196 12.78 11.55 14.97 11,278 11,155 11,497Dec 31, 14 Last 2 Years 35.2863 9.51 9.14 11.12 11,991 11,912 12,347Dec 31, 13 Last 3 Years 28.0762 14.65 11.65 12.12 15,071 13,917 14,093Jan 01, 13 Since Inception 26.4861 12.43 9.72 8.67 15,976 14,490 13,944
B. Discrete 12 month Returns (%)Period Scheme
^Benchmark
#Additional
Benchmark ##
Dec 31, 15 To Dec 30, 16 12.78 11.55 14.97Dec 31, 14 To Dec 31, 15 6.33 6.79 7.39Dec 31, 13 To Dec 31, 14 25.68 16.83 14.14
^Past performance may or may not be sustained in the future. Returns greater than 1 year period are compounded annualized (CAGR). # CRISIL MIP Blended Index ## CRISIL 10 year Gilt IndexScheme performance may not strictly be comparable with that of its Additional Benchmark in view of hybrid nature of the scheme where a portion of scheme’s investments are made in equity instruments.
HDFC LONG TERM ADVANTAGE FUND NAV as on December 30, 2016 ` 265.789
A. Cumulative PerformanceDate Period NAV
per Unit (`)
Scheme Returns
(%)^
Benchmark Returns
(%)#
Additional Benchmark
Returns (%) ##
Value of Investment of Scheme ` 10000@
Scheme (`) Benchmark (`)#
Additional Benchmark
(`)##Dec 31, 15 Last 1 Year 233.596 13.78 1.95 3.01 11,378 10,195 10,301Dec 31, 14 Last 2 Years 238.155 5.64 -1.60 -0.59 11,160 9,683 9,883Dec 31, 13 Last 3 Years 163.758 17.52 7.94 9.10 16,231 12,577 12,985Jan 01, 13 Since Inception 148.176 15.74 7.99 8.30 17,937 13,598 13,756
B. Discrete 12 month Returns (%)Period Scheme
^Benchmark
#Additional
Benchmark ##
Dec 31, 15 To Dec 30, 16 13.78 1.95 3.01Dec 31, 14 To Dec 31, 15 -1.91 -5.03 -4.06Dec 31, 13 To Dec 31, 14 45.43 29.89 31.39
^Past performance may or may not be sustained in the future. Returns greater than 1 year period are compounded annualized (CAGR). # S&P BSE SEnSEx ## nIFTY 50 Index
SRINIVAS RAO RAVURIHDFC GROWTH FUND NAV as on December 30, 2016 ` 143.316
A. Cumulative PerformanceDate Period NAV
per Unit (`)
Scheme Returns
(%)^
Benchmark Returns
(%)#
Additional Benchmark
Returns (%) ##
Value of Investment of Scheme ` 10000@
Scheme (`) Benchmark (`)#
Additional Benchmark
(`)##Dec 31, 15 Last 1 Year 133.617 7.26 1.95 3.01 10,726 10,195 10,301Dec 31, 14 Last 2 Years 133.401 3.65 -1.60 -0.59 10,743 9,683 9,883Dec 31, 13 Last 3 Years 92.944 15.53 7.94 9.10 15,420 12,577 12,985Jan 01, 13 Since Inception 94.763 10.90 7.99 8.30 15,124 13,598 13,756
B. Discrete 12 month Returns (%)Period Scheme
^Benchmark
#Additional
Benchmark ##
Dec 31, 15 To Dec 30, 16 7.26 1.95 3.01Dec 31, 14 To Dec 31, 15 0.16 -5.03 -4.06Dec 31, 13 To Dec 31, 14 43.53 29.89 31.39
^Past performance may or may not be sustained in the future. Returns greater than 1 year period are compounded annualized (CAGR). # S&P BSE SEnSEx ## nIFTY 50 Index
HDFC RAJIV GANDHI EQUITY SAVINGS SCHEME - SERIES II NAV as on December 30, 2016 ` 14.609
A. Cumulative PerformanceDate Period NAV
per Unit (`)
Scheme Returns
(%)^
Benchmark Returns
(%)#
Additional Benchmark
Returns (%) ##
Value of Investment of Scheme ` 10000@
Scheme (`) Benchmark (`)#
Additional Benchmark
(`)##Dec 31, 15 Last 1 Year 13.318 9.69 3.57 1.95 10,969 10,357 10,195Dec 31, 14 Last 2 Years 13.859 2.67 0.10 -1.60 10,541 10,021 9,683Mar 14, 14 Since Inception 10.000 14.50 9.73 7.39 14,609 12,968 12,208
B. Discrete 12 month Returns (%)Period Scheme
^Benchmark
#Additional
Benchmark ##
Dec 31, 15 To Dec 30, 16 9.69 3.57 1.95Dec 31, 14 To Dec 31, 15 -3.90 -3.25 -5.03
^Past performance may or may not be sustained in the future. Returns greater than 1 year period are compounded annualized (CAGR). # S&P BSE 100 ## S&P BSE SEnSEx
HDFC FOCUSED EQUITY FUND - PLAN A NAV as on December 30, 2016 ` 10.202A. Cumulative PerformanceDate Period NAV
per Unit (`)
Scheme Returns
(%)^
Benchmark Returns
(%)#
Additional Benchmark
Returns (%) ##
Value of Investment of Scheme ` 10000@
Scheme (`) Benchmark (`)#
Additional Benchmark
(`)##Dec 31, 15 Last 1 Year 9.516 7.21 3.57 1.95 10,721 10,357 10,195Feb 23, 15 Since Inception 10.000 1.09 -2.86 -4.46 10,202 9,478 9,189
B. Discrete 12 month Returns (%)Period Scheme
^Benchmark
#Additional
Benchmark ##
Dec 31, 15 To Dec 30, 16 7.21 3.57 1.95^Past performance may or may not be sustained in the future. Returns greater than 1 year period are compounded annualized (CAGR). # S&P BSE 100 ## S&P BSE SEnSEx
SCHEME PERFORMANCE - DIRECT PLAN - GROWTH OPTION (FUND MANAGER-WISE)CHIRAG SETALVAD....CONTINUED
Performance of dividend option under the schemes for the investors would be net of distribution tax as applicable. Load is not taken into consideration for computation of performance.@ shows the current value of ` 10,000/- invested at the beginning of a given period. n.A.: not Available

Intouch mutually January 2017 71
SCHEME PERFORMANCE - DIRECT PLAN - GROWTH OPTION (FUND MANAGER-WISE)
HDFC FOCUSED EQUITY FUND - PLAN B NAV as on December 30, 2016 ` 10.868A. Cumulative PerformanceDate Period NAV
per Unit (`)
Scheme Returns
(%)^
Benchmark Returns
(%)#
Additional Benchmark
Returns (%) ##
Value of Investment of Scheme ` 10000@
Scheme (`) Benchmark (`)#
Additional Benchmark
(`)##Dec 31, 15 Last 1 Year 9.935 9.39 3.57 1.95 10,939 10,357 10,195May 06, 15 Since Inception 10.000 5.16 1.15 -0.21 10,868 10,191 9,966
B. Discrete 12 month Returns (%)Period Scheme
^Benchmark
#Additional
Benchmark ##
Dec 31, 15 To Dec 30, 16 9.39 3.57 1.95^Past performance may or may not be sustained in the future. Returns greater than 1 year period are compounded annualized (CAGR). # S&P BSE 100 ## S&P BSE SEnSEx
SHOBHIT MEHROTRAHDFC INCOME FUND NAV as on December 30, 2016 ` 38.9021A. Cumulative PerformanceDate Period NAV
per Unit (`)
Scheme Returns
(%)^
Benchmark Returns
(%)#
Additional Benchmark
Returns (%) ##
Value of Investment of Scheme ` 10000@
Scheme (`) Benchmark (`)#
Additional Benchmark
(`)##Dec 31, 15 Last 1 Year 33.6762 15.52 12.93 14.97 11,552 11,293 11,497Dec 31, 14 Last 2 Years 31.6427 10.88 10.76 11.12 12,294 12,268 12,347Dec 31, 13 Last 3 Years 27.1233 12.77 11.93 12.12 14,343 14,023 14,093Jan 01, 13 Since Inception 26.4718 10.11 9.79 8.67 14,696 14,526 13,944
B. Discrete 12 month Returns (%)Period Scheme
^Benchmark
#Additional
Benchmark ##
Dec 31, 15 To Dec 30, 16 15.52 12.93 14.97Dec 31, 14 To Dec 31, 15 6.43 8.63 7.39Dec 31, 13 To Dec 31, 14 16.66 14.31 14.14
^Past performance may or may not be sustained in the future. Returns greater than 1 year period are compounded annualized (CAGR). # CRISIL Composite Bond Fund Index ## CRISIL 10 year Gilt Index
HDFC HIGH INTEREST FUND - STP NAV as on December 30, 2016 ` 32.9137A. Cumulative PerformanceDate Period NAV
per Unit (`)
Scheme Returns
(%)^
Benchmark Returns
(%)#
Additional Benchmark
Returns (%) ##
Value of Investment of Scheme ` 10000@
Scheme (`) Benchmark (`)#
Additional Benchmark
(`)##Dec 31, 15 Last 1 Year 29.3833 12.01 9.83 7.27 11,201 10,983 10,727Dec 31, 14 Last 2 Years 27.2040 9.99 9.24 7.75 12,099 11,934 11,609Dec 31, 13 Last 3 Years 24.3519 10.56 9.65 8.02 13,516 13,183 12,603Jan 01, 13 Since Inception 22.6787 9.77 9.30 7.47 14,513 14,267 13,336
B. Discrete 12 month Returns (%)Period Scheme
^Benchmark
#Additional
Benchmark ##
Dec 31, 15 To Dec 30, 16 12.01 9.83 7.27Dec 31, 14 To Dec 31, 15 8.01 8.66 8.22Dec 31, 13 To Dec 31, 14 11.71 10.47 8.56
^Past performance may or may not be sustained in the future. Returns greater than 1 year period are compounded annualized (CAGR). # CRISIL Short Term Bond Fund Index ## CRISIL 1 year T-Bill Index
HDFC FLOATING RATE INCOME FUND - STP - WHOLESALE OPTION NAV as on December 30, 2016 ` 27.8599A. Cumulative PerformanceDate Period NAV
per Unit (`)
Scheme Returns
(%)^
Benchmark Returns
(%)#
Additional Benchmark
Returns (%) ##
Value of Investment of Scheme ` 10000@
Scheme (`) Benchmark (`)#
Additional Benchmark
(`)##Dec 31, 15 Last 1 Year 25.5375 9.09 7.48 7.27 10,909 10,748 10,727Dec 31, 14 Last 2 Years 23.4435 9.01 7.86 7.75 11,884 11,633 11,609Dec 31, 13 Last 3 Years 21.4157 9.16 8.31 8.02 13,009 12,705 12,603Jan 01, 13 Since Inception 19.6301 9.15 8.49 7.47 14,192 13,850 13,336
B. Discrete 12 month Returns (%)Period Scheme
^Benchmark
#Additional
Benchmark ##
Dec 31, 15 To Dec 30, 16 9.09 7.48 7.27Dec 31, 14 To Dec 31, 15 8.93 8.23 8.22Dec 31, 13 To Dec 31, 14 9.47 9.21 8.56
^Past performance may or may not be sustained in the future. Returns greater than 1 year period are compounded annualized (CAGR). # CRISIL Liquid Fund Index ## CRISIL 1 year T-Bill Index
HDFC FLOATING RATE INCOME FUND - LTP NAV as on December 30, 2016 ` 28.4417A. Cumulative PerformanceDate Period NAV
per Unit (`)
Scheme Returns
(%)^
Benchmark Returns
(%)#
Additional Benchmark
Returns (%) ##
Value of Investment of Scheme ` 10000@
Scheme (`) Benchmark (`)#
Additional Benchmark
(`)##Dec 31, 15 Last 1 Year 25.7746 10.35 7.48 7.27 11,035 10,748 10,727Dec 31, 14 Last 2 Years 23.8762 9.14 7.86 7.75 11,912 11,633 11,609Dec 31, 13 Last 3 Years 21.8268 9.22 8.31 8.02 13,031 12,705 12,603Jan 01, 13 Since Inception 20.0689 9.11 8.49 7.47 14,172 13,850 13,336
B. Discrete 12 month Returns (%)Period Scheme
^Benchmark
#Additional
Benchmark ##
Dec 31, 15 To Dec 30, 16 10.35 7.48 7.27Dec 31, 14 To Dec 31, 15 7.95 8.23 8.22Dec 31, 13 To Dec 31, 14 9.39 9.21 8.56
^Past performance may or may not be sustained in the future. Returns greater than 1 year period are compounded annualized (CAGR). # CRISIL Liquid Fund Index ## CRISIL 1 year T-Bill Index
HDFC CORPORATE DEBT OPPORTUNITIES FUND NAV as on December 30, 2016 ` 13.6260A. Cumulative PerformanceDate Period NAV
per Unit (`)
Scheme Returns
(%)^
Benchmark Returns
(%)#
Additional Benchmark
Returns (%) ##
Value of Investment of Scheme ` 10000@
Scheme (`) Benchmark (`)#
Additional Benchmark
(`)##Dec 31, 15 Last 1 Year 12.1638 12.02 9.83 14.97 11,202 10,983 11,497Dec 31, 14 Last 2 Year 11.0454 11.07 9.24 11.12 12,336 11,934 12,347Mar 25, 14 Since Inception 10.0000 11.82 9.59 12.28 13,626 12,888 13,781
B. Discrete 12 month Returns (%)Period Scheme
^Benchmark
#Additional
Benchmark ##
Dec 31, 15 To Dec 30, 16 12.02 9.83 14.97Dec 31, 14 To Dec 31, 15 10.13 8.66 7.39
^Past performance may or may not be sustained in the future. Returns greater than 1 year period are compounded annualized (CAGR). # CRISIL Short Term Bond Fund Index ## CRISIL 10 year Gilt Index
Performance of dividend option under the schemes for the investors would be net of distribution tax as applicable. Load is not taken into consideration for computation of performance.@ shows the current value of ` 10,000/- invested at the beginning of a given period. n.A.: not Available
SRINIVAS RAO RAVURI....CONTINUED

72 January 2017 Intouch mutually
SCHEME PERFORMANCE - DIRECT PLAN - GROWTH OPTION (FUND MANAGER-WISE)
HDFC FMP 538D NOVEMBER 2013 (1) NAV as on December 30, 2016 ` 13.0053A. Cumulative PerformanceDate Period NAV
per Unit (`)
Scheme Returns
(%)^
Benchmark Returns
(%)#
Additional Benchmark
Returns (%) ##
Value of Investment of Scheme ` 10000@
Scheme (`) Benchmark (`)#
Additional Benchmark
(`)##Dec 31, 15 Last 1 Year 12.0054 8.33 9.83 7.27 10,833 10,983 10,727Dec 31, 14 Last 2 Years 11.0689 8.39 9.24 7.75 11,749 11,934 11,609Dec 31, 13 Last 3 Years 10.0860 8.84 9.65 8.02 12,894 13,183 12,603nov 28, 13 Since Inception 10.0000 8.87 9.64 8.00 13,005 13,289 12,685
B. Discrete 12 month Returns (%)Period Scheme
^Benchmark
#Additional
Benchmark ##
Dec 31, 15 To Dec 30, 16 8.33 9.83 7.27Dec 31, 14 To Dec 31, 15 8.46 8.66 8.22Dec 31, 13 To Dec 31, 14 9.75 10.47 8.56
^Past performance may or may not be sustained in the future. Returns greater than 1 year period are compounded annualized (CAGR). # CRISIL Short Term Bond Fund Index ## CRISIL 1 year T-Bill Index
HDFC FMP 540D DECEMBER 2013 (1) NAV as on December 30, 2016 ` 12.9181A. Cumulative PerformanceDate Period NAV
per Unit (`)
Scheme Returns
(%)^
Benchmark Returns
(%)#
Additional Benchmark
Returns (%) ##
Value of Investment of Scheme ` 10000@
Scheme (`) Benchmark (`)#
Additional Benchmark
(`)##Dec 31, 15 Last 1 Year 11.9579 8.03 9.83 7.27 10,803 10,983 10,727Dec 31, 14 Last 2 Years 11.0381 8.18 9.24 7.75 11,703 11,934 11,609Dec 31, 13 Last 3 Years 10.0546 8.71 9.65 8.02 12,848 13,183 12,603Dec 10, 13 Since Inception 10.0000 8.73 9.65 7.99 12,918 13,255 12,648
B. Discrete 12 month Returns (%)Period Scheme
^Benchmark
#Additional
Benchmark ##
Dec 31, 15 To Dec 30, 16 8.03 9.83 7.27Dec 31, 14 To Dec 31, 15 8.33 8.66 8.22Dec 31, 13 To Dec 31, 14 9.78 10.47 8.56
^Past performance may or may not be sustained in the future. Returns greater than 1 year period are compounded annualized (CAGR). # CRISIL Short Term Bond Fund Index ## CRISIL 1 year T-Bill Index
HDFC FMP 554D NOVEMBER 2013 (1) NAV as on December 30, 2016 ` 13.0500A. Cumulative PerformanceDate Period NAV
per Unit (`)
Scheme Returns
(%)^
Benchmark Returns
(%)#
Additional Benchmark
Returns (%) ##
Value of Investment of Scheme ` 10000@
Scheme (`) Benchmark (`)#
Additional Benchmark
(`)##Dec 31, 15 Last 1 Year 12.0364 8.42 9.83 7.27 10,842 10,983 10,727Dec 31, 14 Last 2 Years 11.1133 8.36 9.24 7.75 11,743 11,934 11,609Dec 31, 13 Last 3 Years 10.1450 8.76 9.65 8.02 12,863 13,183 12,603nov 12, 13 Since Inception 10.0000 8.86 9.68 8.00 13,050 13,358 12,727
B. Discrete 12 month Returns (%)Period Scheme
^Benchmark
#Additional
Benchmark ##
Dec 31, 15 To Dec 30, 16 8.42 9.83 7.27Dec 31, 14 To Dec 31, 15 8.31 8.66 8.22Dec 31, 13 To Dec 31, 14 9.54 10.47 8.56
^Past performance may or may not be sustained in the future. Returns greater than 1 year period are compounded annualized (CAGR). # CRISIL Short Term Bond Fund Index ## CRISIL 1 year T-Bill Index
HDFC FMP 572D OCTOBER 2013 (1) NAV as on December 30, 2016 ` 13.1371A. Cumulative PerformanceDate Period NAV
per Unit (`)
Scheme Returns
(%)^
Benchmark Returns
(%)#
Additional Benchmark
Returns (%) ##
Value of Investment of Scheme ` 10000@
Scheme (`) Benchmark (`)#
Additional Benchmark
(`)##Dec 31, 15 Last 1 Year 12.1157 8.43 9.83 7.27 10,843 10,983 10,727Dec 31, 14 Last 2 Years 11.1758 8.42 9.24 7.75 11,755 11,934 11,609Dec 31, 13 Last 3 Years 10.1791 8.88 9.65 8.02 12,906 13,183 12,603Oct 18, 13 Since Inception 10.0000 8.89 9.57 7.96 13,137 13,399 12,780
B. Discrete 12 month Returns (%)Period Scheme
^Benchmark
#Additional
Benchmark ##
Dec 31, 15 To Dec 30, 16 8.43 9.83 7.27Dec 31, 14 To Dec 31, 15 8.41 8.66 8.22Dec 31, 13 To Dec 31, 14 9.79 10.47 8.56
^Past performance may or may not be sustained in the future. Returns greater than 1 year period are compounded annualized (CAGR). # CRISIL Short Term Bond Fund Index ## CRISIL 1 year T-Bill Index
HDFC FMP 923D NOVEMBER 2013 (1) NAV as on December 30, 2016 ` 13.0637A. Cumulative PerformanceDate Period NAV
per Unit (`)
Scheme Returns
(%)^
Benchmark Returns
(%)#
Additional Benchmark
Returns (%) ##
Value of Investment of Scheme ` 10000@
Scheme (`) Benchmark (`)#
Additional Benchmark
(`)##Dec 31, 15 Last 1 Year 12.1124 7.85 9.83 7.27 10,785 10,983 10,727Dec 31, 14 Last 2 Years 11.1882 8.06 9.24 7.75 11,676 11,934 11,609Dec 31, 13 Last 3 Years 10.0979 8.96 9.65 8.02 12,937 13,183 12,603nov 21, 13 Since Inception 10.0000 8.97 9.67 8.02 13,064 13,324 12,711
B. Discrete 12 month Returns (%)Period Scheme
^Benchmark
#Additional
Benchmark ##
Dec 31, 15 To Dec 30, 16 7.85 9.83 7.27Dec 31, 14 To Dec 31, 15 8.26 8.66 8.22Dec 31, 13 To Dec 31, 14 10.80 10.47 8.56
^Past performance may or may not be sustained in the future. Returns greater than 1 year period are compounded annualized (CAGR). # CRISIL Short Term Bond Fund Index ## CRISIL 1 year T-Bill Index
HDFC FMP 1919D JANUARY 2013 (1) NAV as on December 30, 2016 ` 14.1933A. Cumulative PerformanceDate Period NAV
per Unit (`)
Scheme Returns
(%)^
Benchmark Returns
(%)#
Additional Benchmark
Returns (%) ##
Value of Investment of Scheme ` 10000@
Scheme (`) Benchmark (`)#
Additional Benchmark
(`)##Dec 31, 15 Last 1 Year 12.9846 9.31 12.93 7.27 10,931 11,293 10,727Dec 31, 14 Last 2 Years 11.8952 9.23 10.76 7.75 11,932 12,268 11,609Dec 31, 13 Last 3 Years 10.5480 10.40 11.93 8.02 13,456 14,023 12,603Jan 08, 13 Since Inception 10.0000 9.20 9.71 7.44 14,193 14,457 13,302
B. Discrete 12 month Returns (%)Period Scheme
^Benchmark
#Additional
Benchmark ##
Dec 31, 15 To Dec 30, 16 9.31 12.93 7.27Dec 31, 14 To Dec 31, 15 9.16 8.63 8.22Dec 31, 13 To Dec 31, 14 12.77 14.31 8.56
^Past performance may or may not be sustained in the future. Returns greater than 1 year period are compounded annualized (CAGR). # CRISIL Composite Bond Fund Index ## CRISIL 1 year T-Bill Index
SHOBHIT MEHROTRA....CONTINUED
Performance of dividend option under the schemes for the investors would be net of distribution tax as applicable. Load is not taken into consideration for computation of performance.@ shows the current value of ` 10,000/- invested at the beginning of a given period. n.A.: not Available
Performance of FMP schemes, being close-ended in nature, is not strictly comparable with that of open-ended schemes since the investment strategy for FMP schemes is primarily buy-and-hold whereas open-ended schemes are actively managed.

Intouch mutually January 2017 73
SCHEME PERFORMANCE - DIRECT PLAN - GROWTH OPTION (FUND MANAGER-WISE)
HDFC FMP 3360D MARCH 2014 (1) NAV as on December 30, 2016 ` 12.3152A. Cumulative PerformanceDate Period NAV
per Unit (`)
Scheme Returns
(%)^
Benchmark Returns
(%)#
Additional Benchmark
Returns (%) ##
Value of Investment of Scheme ` 10000@
Scheme (`) Benchmark (`)#
Additional Benchmark
(`)##Dec 31, 15 Last 1 Year 10.5592 16.63 12.93 14.97 11,663 11,293 11,497Dec 31, 14 Last 2 Years 10.3198 9.24 10.76 11.12 11,934 12,268 12,347Mar 26, 14 Since Inception 10.0000 7.82 12.02 12.27 12,315 13,690 13,774
B. Discrete 12 month Returns (%)Period Scheme
^Benchmark
#Additional
Benchmark ##
Dec 31, 15 To Dec 30, 16 16.63 12.93 14.97Dec 31, 14 To Dec 31, 15 2.32 8.63 7.39
^Past performance may or may not be sustained in the future. Returns greater than 1 year period are compounded annualized (CAGR). # CRISIL Composite Bond Fund Index ## CRISIL 10 year Gilt Index
HDFC FMP 366D MARCH 2014 (2) NAV as on December 30, 2016 ` 12.6136A. Cumulative PerformanceDate Period NAV
per Unit (`)
Scheme Returns
(%)^
Benchmark Returns
(%)#
Additional Benchmark
Returns (%) ##
Value of Investment of Scheme ` 10000@
Scheme (`) Benchmark (`)#
Additional Benchmark
(`)##Dec 31, 15 Last 1 Year 11.6210 8.54 9.83 7.27 10,854 10,983 10,727Dec 31, 14 Last 2 Years 10.7109 8.52 9.24 7.75 11,776 11,934 11,609Mar 26, 14 Since Inception 10.0000 8.75 9.60 8.00 12,614 12,887 12,373
B. Discrete 12 month Returns (%)Period Scheme
^Benchmark
#Additional
Benchmark ##
Dec 31, 15 To Dec 30, 16 8.54 9.83 7.27Dec 31, 14 To Dec 31, 15 8.50 8.66 8.22
^Past performance may or may not be sustained in the future. Returns greater than 1 year period are compounded annualized (CAGR). # CRISIL Short Term Bond Fund Index ## CRISIL 1 year T-Bill Index
HDFC FMP 377D MARCH 2014 (1) NAV as on December 30, 2016 ` 12.5930A. Cumulative PerformanceDate Period NAV
per Unit (`)
Scheme Returns
(%)^
Benchmark Returns
(%)#
Additional Benchmark
Returns (%) ##
Value of Investment of Scheme ` 10000@
Scheme (`) Benchmark (`)#
Additional Benchmark
(`)##Dec 31, 15 Last 1 Year 11.5955 8.60 9.83 7.27 10,860 10,983 10,727Dec 31, 14 Last 2 Years 10.7152 8.41 9.24 7.75 11,752 11,934 11,609Mar 27, 14 Since Inception 10.0000 8.70 9.60 8.00 12,593 12,884 12,370
B. Discrete 12 month Returns (%)Period Scheme
^Benchmark
#Additional
Benchmark ##
Dec 31, 15 To Dec 30, 16 8.60 9.83 7.27Dec 31, 14 To Dec 31, 15 8.22 8.66 8.22
^Past performance may or may not be sustained in the future. Returns greater than 1 year period are compounded annualized (CAGR). # CRISIL Short Term Bond Fund Index ## CRISIL 1 year T-Bill Index
HDFC FMP 366D MAY 2014 (2) NAV as on December 30, 2016 ` 12.4273A. Cumulative PerformanceDate Period NAV
per Unit (`)
Scheme Returns
(%)^
Benchmark Returns
(%)#
Additional Benchmark
Returns (%) ##
Value of Investment of Scheme ` 10000@
Scheme (`) Benchmark (`)#
Additional Benchmark
(`)##Dec 31, 15 Last 1 Year 11.4316 8.71 9.83 7.27 10,871 10,983 10,727Dec 31, 14 Last 2 Years 10.5152 8.71 9.24 7.75 11,818 11,934 11,609Jun 03, 14 Since Inception 10.0000 8.79 9.45 7.89 12,427 12,621 12,163
B. Discrete 12 month Returns (%)Period Scheme
^Benchmark
#Additional
Benchmark ##
Dec 31, 15 To Dec 30, 16 8.71 9.83 7.27Dec 31, 14 To Dec 31, 15 8.72 8.66 8.22
^Past performance may or may not be sustained in the future. Returns greater than 1 year period are compounded annualized (CAGR). # CRISIL Short Term Bond Fund Index ## CRISIL 1 year T-Bill Index
HDFC FMP 370D JUNE 2014 (1) NAV as on December 30, 2016 ` 12.4147A. Cumulative PerformanceDate Period NAV
per Unit (`)
Scheme Returns
(%)^
Benchmark Returns
(%)#
Additional Benchmark
Returns (%) ##
Value of Investment of Scheme ` 10000@
Scheme (`) Benchmark (`)#
Additional Benchmark
(`)##Dec 31, 15 Last 1 Year 11.4212 8.70 9.83 7.27 10,870 10,983 10,727Dec 31, 14 Last 2 Years 10.5052 8.71 9.24 7.75 11,818 11,934 11,609Jun 05, 14 Since Inception 10.0000 8.77 9.41 7.88 12,415 12,602 12,156
B. Discrete 12 month Returns (%)Period Scheme
^Benchmark
#Additional
Benchmark ##
Dec 31, 15 To Dec 30, 16 8.70 9.83 7.27Dec 31, 14 To Dec 31, 15 8.72 8.66 8.22
^Past performance may or may not be sustained in the future. Returns greater than 1 year period are compounded annualized (CAGR). # CRISIL Short Term Bond Fund Index ## CRISIL 1 year T-Bill Index
HDFC FMP 370D JUNE 2014 (2) NAV as on December 30, 2016 ` 12.3838A. Cumulative PerformanceDate Period NAV
per Unit (`)
Scheme Returns
(%)^
Benchmark Returns
(%)#
Additional Benchmark
Returns (%) ##
Value of Investment of Scheme ` 10000@
Scheme (`) Benchmark (`)#
Additional Benchmark
(`)##Dec 31, 15 Last 1 Year 11.3928 8.70 9.83 7.27 10,870 10,983 10,727Dec 31, 14 Last 2 Years 10.4606 8.80 9.24 7.75 11,839 11,934 11,609Jun 25, 14 Since Inception 10.0000 8.86 9.49 7.93 12,384 12,564 12,119
B. Discrete 12 month Returns (%)Period Scheme
^Benchmark
#Additional
Benchmark ##
Dec 31, 15 To Dec 30, 16 8.70 9.83 7.27Dec 31, 14 To Dec 31, 15 8.91 8.66 8.22
^Past performance may or may not be sustained in the future. Returns greater than 1 year period are compounded annualized (CAGR). # CRISIL Short Term Bond Fund Index ## CRISIL 1 year T-Bill Index
SHOBHIT MEHROTRA....CONTINUED
Performance of dividend option under the schemes for the investors would be net of distribution tax as applicable. Load is not taken into consideration for computation of performance.@ shows the current value of ` 10,000/- invested at the beginning of a given period. n.A.: not Available
Performance of FMP schemes, being close-ended in nature, is not strictly comparable with that of open-ended schemes since the investment strategy for FMP schemes is primarily buy-and-hold whereas open-ended schemes are actively managed.

74 January 2017 Intouch mutually
SCHEME PERFORMANCE - DIRECT PLAN - GROWTH OPTION (FUND MANAGER-WISE)
HDFC FMP 371D JUNE 2014 (1) NAV as on December 30, 2016 ` 12.3960A. Cumulative PerformanceDate Period NAV
per Unit (`)
Scheme Returns
(%)^
Benchmark Returns
(%)#
Additional Benchmark
Returns (%) ##
Value of Investment of Scheme ` 10000@
Scheme (`) Benchmark (`)#
Additional Benchmark
(`)##Dec 31, 15 Last 1 Year 11.4123 8.62 9.83 7.27 10,862 10,983 10,727Dec 31, 14 Last 2 Years 10.4899 8.71 9.24 7.75 11,817 11,934 11,609Jun 11, 14 Since Inception 10.0000 8.77 9.41 7.89 12,396 12,585 12,143
B. Discrete 12 month Returns (%)Period Scheme
^Benchmark
#Additional
Benchmark ##
Dec 31, 15 To Dec 30, 16 8.62 9.83 7.27Dec 31, 14 To Dec 31, 15 8.79 8.66 8.22
^Past performance may or may not be sustained in the future. Returns greater than 1 year period are compounded annualized (CAGR). # CRISIL Short Term Bond Fund Index ## CRISIL 1 year T-Bill Index
HDFC FMP 371D JUNE 2014 (2) NAV as on December 30, 2016 ` 12.3940A. Cumulative PerformanceDate Period NAV
per Unit (`)
Scheme Returns
(%)^
Benchmark Returns
(%)#
Additional Benchmark
Returns (%) ##
Value of Investment of Scheme ` 10000@
Scheme (`) Benchmark (`)#
Additional Benchmark
(`)##Dec 31, 15 Last 1 Year 11.4045 8.68 9.83 7.27 10,868 10,983 10,727Dec 31, 14 Last 2 Years 10.4774 8.76 9.24 7.75 11,829 11,934 11,609Jun 18, 14 Since Inception 10.0000 8.83 9.46 7.92 12,394 12,576 12,133
B. Discrete 12 month Returns (%)Period Scheme
^Benchmark
#Additional
Benchmark ##
Dec 31, 15 To Dec 30, 16 8.68 9.83 7.27Dec 31, 14 To Dec 31, 15 8.85 8.66 8.22
^Past performance may or may not be sustained in the future. Returns greater than 1 year period are compounded annualized (CAGR). # CRISIL Short Term Bond Fund Index ## CRISIL 1 year T-Bill Index
HDFC FMP 747D JUNE 2014 (1) NAV as on December 30, 2016 ` 12.4236A. Cumulative PerformanceDate Period NAV
per Unit (`)
Scheme Returns
(%)^
Benchmark Returns
(%)#
Additional Benchmark
Returns (%) ##
Value of Investment of Scheme ` 10000@
Scheme (`) Benchmark (`)#
Additional Benchmark
(`)##Dec 31, 15 Last 1 Year 11.4608 8.40 9.83 7.27 10,840 10,983 10,727Dec 31, 14 Last 2 Years 10.5421 8.56 9.24 7.75 11,785 11,934 11,609Jun 12, 14 Since Inception 10.0000 8.87 9.42 7.89 12,424 12,583 12,141
B. Discrete 12 month Returns (%)Period Scheme
^Benchmark
#Additional
Benchmark ##
Dec 31, 15 To Dec 30, 16 8.40 9.83 7.27Dec 31, 14 To Dec 31, 15 8.71 8.66 8.22
^Past performance may or may not be sustained in the future. Returns greater than 1 year period are compounded annualized (CAGR). # CRISIL Short Term Bond Fund Index ## CRISIL 1 year T-Bill Index
HDFC FMP 371D JUNE 2014 (3) NAV as on December 30, 2016 ` 12.3466A. Cumulative PerformanceDate Period NAV
per Unit (`)
Scheme Returns
(%)^
Benchmark Returns
(%)#
Additional Benchmark
Returns (%) ##
Value of Investment of Scheme ` 10000@
Scheme (`) Benchmark (`)#
Additional Benchmark
(`)##Dec 31, 15 Last 1 Year 11.3455 8.82 9.83 7.27 10,882 10,983 10,727Dec 31, 14 Last 2 Years 10.4406 8.75 9.24 7.75 11,826 11,934 11,609Jul 02, 14 Since Inception 10.0000 8.80 9.46 7.91 12,347 12,535 12,094
B. Discrete 12 month Returns (%)Period Scheme
^Benchmark
#Additional
Benchmark ##
Dec 31, 15 To Dec 30, 16 8.82 9.83 7.27Dec 31, 14 To Dec 31, 15 8.67 8.66 8.22
^Past performance may or may not be sustained in the future. Returns greater than 1 year period are compounded annualized (CAGR). # CRISIL Short Term Bond Fund Index ## CRISIL 1 year T-Bill Index
HDFC FMP 750D JUNE 2014 (1) NAV as on December 30, 2016 ` 12.3421A. Cumulative PerformanceDate Period NAV
per Unit (`)
Scheme Returns
(%)^
Benchmark Returns
(%)#
Additional Benchmark
Returns (%) ##
Value of Investment of Scheme ` 10000@
Scheme (`) Benchmark (`)#
Additional Benchmark
(`)##Dec 31, 15 Last 1 Year 11.4016 8.25 9.83 7.27 10,825 10,983 10,727Dec 31, 14 Last 2 Years 10.5000 8.42 9.24 7.75 11,754 11,934 11,609Jul 09, 14 Since Inception 10.0000 8.86 9.48 7.92 12,342 12,518 12,080
B. Discrete 12 month Returns (%)Period Scheme
^Benchmark
#Additional
Benchmark ##
Dec 31, 15 To Dec 30, 16 8.25 9.83 7.27Dec 31, 14 To Dec 31, 15 8.59 8.66 8.22
^Past performance may or may not be sustained in the future. Returns greater than 1 year period are compounded annualized (CAGR). # CRISIL Short Term Bond Fund Index ## CRISIL 1 year T-Bill Index
HDFC FMP 1123D JULY 2014 (1) NAV as on December 30, 2016 ` 12.4853A. Cumulative PerformanceDate Period NAV
per Unit (`)
Scheme Returns
(%)^
Benchmark Returns
(%)#
Additional Benchmark
Returns (%) ##
Value of Investment of Scheme ` 10000@
Scheme (`) Benchmark (`)#
Additional Benchmark
(`)##Dec 31, 15 Last 1 Year 11.4683 8.87 12.93 7.27 10,887 11,293 10,727Dec 31, 14 Last 2 Years 10.5008 9.04 10.76 7.75 11,890 12,268 11,609Aug 05, 14 Since Inception 10.0000 9.67 11.91 7.94 12,485 13,108 12,018
B. Discrete 12 month Returns (%)Period Scheme
^Benchmark
#Additional
Benchmark ##
Dec 31, 15 To Dec 30, 16 8.87 12.93 7.27Dec 31, 14 To Dec 31, 15 9.21 8.63 8.22
^Past performance may or may not be sustained in the future. Returns greater than 1 year period are compounded annualized (CAGR). # CRISIL Composite Bond Fund Index ## CRISIL 1 year T-Bill Index
SHOBHIT MEHROTRA....CONTINUED
Performance of dividend option under the schemes for the investors would be net of distribution tax as applicable. Load is not taken into consideration for computation of performance.@ shows the current value of ` 10,000/- invested at the beginning of a given period. n.A.: not Available
Performance of FMP schemes, being close-ended in nature, is not strictly comparable with that of open-ended schemes since the investment strategy for FMP schemes is primarily buy-and-hold whereas open-ended schemes are actively managed.

Intouch mutually January 2017 75
SCHEME PERFORMANCE - DIRECT PLAN - GROWTH OPTION (FUND MANAGER-WISE)
HDFC FMP 1116D JULY 2014 (1) NAV as on December 30, 2016 ` 12.4579A. Cumulative PerformanceDate Period NAV
per Unit (`)
Scheme Returns
(%)^
Benchmark Returns
(%)#
Additional Benchmark
Returns (%) ##
Value of Investment of Scheme ` 10000@
Scheme (`) Benchmark (`)#
Additional Benchmark
(`)##Dec 31, 15 Last 1 Year 11.4444 8.86 12.93 7.27 10,886 11,293 10,727Dec 31, 14 Last 2 Years 10.4805 9.03 10.76 7.75 11,887 12,268 11,609Aug 12, 14 Since Inception 10.0000 9.65 11.99 7.94 12,458 13,101 12,001
B. Discrete 12 month Returns (%)Period Scheme
^Benchmark
#Additional
Benchmark ##
Dec 31, 15 To Dec 30, 16 8.86 12.93 7.27Dec 31, 14 To Dec 31, 15 9.20 8.63 8.22
^Past performance may or may not be sustained in the future. Returns greater than 1 year period are compounded annualized (CAGR). # CRISIL Composite Bond Fund Index ## CRISIL 1 year T-Bill Index
HDFC FMP 1184D JANUARY 2015 (1) NAV as on December 30, 2016 ` 12.2331A. Cumulative PerformanceDate Period NAV
per Unit (`)
Scheme Returns
(%)^
Benchmark Returns
(%)#
Additional Benchmark
Returns (%) ##
Value of Investment of Scheme ` 10000@
Scheme (`) Benchmark (`)#
Additional Benchmark
(`)##Dec 31, 15 Last 1 Year 10.9510 11.71 12.93 7.27 11,171 11,293 10,727Jan 29, 15 Since Inception 10.0000 11.07 10.27 7.66 12,233 12,065 11,522
B. Discrete 12 month Returns (%)Period Scheme
^Benchmark
#Additional
Benchmark ##
Dec 31, 15 To Dec 30, 16 11.71 12.93 7.27^Past performance may or may not be sustained in the future. Returns greater than 1 year period are compounded annualized (CAGR). # CRISIL Composite Bond Fund Index ## CRISIL 1 year T-Bill Index
HDFC FMP 1157D FEBRUARY 2015 (1) NAV as on December 30, 2016 ` 11.7797A. Cumulative PerformanceDate Period NAV
per Unit (`)
Scheme Returns
(%)^
Benchmark Returns
(%)#
Additional Benchmark
Returns (%) ##
Value of Investment of Scheme ` 10000@
Scheme (`) Benchmark (`)#
Additional Benchmark
(`)##Dec 31, 15 Last 1 Year 10.7450 9.63 12.93 7.27 10,963 11,293 10,727Feb 25, 15 Since Inception 10.0000 9.28 10.46 7.72 11,780 12,016 11,473
B. Discrete 12 month Returns (%)Period Scheme
^Benchmark
#Additional
Benchmark ##
Dec 31, 15 To Dec 30, 16 9.63 12.93 7.27^Past performance may or may not be sustained in the future. Returns greater than 1 year period are compounded annualized (CAGR). # CRISIL Composite Bond Fund Index ## CRISIL 1 year T-Bill Index
HDFC FMP 1135D MARCH 2015 (1) NAV as on December 30, 2016 ` 11.7127A. Cumulative PerformanceDate Period NAV
per Unit (`)
Scheme Returns
(%)^
Benchmark Returns
(%)#
Additional Benchmark
Returns (%) ##
Value of Investment of Scheme ` 10000@
Scheme (`) Benchmark (`)#
Additional Benchmark
(`)##Dec 31, 15 Last 1 Year 10.6835 9.63 12.93 7.27 10,963 11,293 10,727Mar 19, 15 Since Inception 10.0000 9.25 10.65 7.69 11,713 11,981 11,415
B. Discrete 12 month Returns (%)Period Scheme
^Benchmark
#Additional
Benchmark ##
Dec 31, 15 To Dec 30, 16 9.63 12.93 7.27^Past performance may or may not be sustained in the future. Returns greater than 1 year period are compounded annualized (CAGR). # CRISIL Composite Bond Fund Index ## CRISIL 1 year T-Bill Index
HDFC FMP 1128D MARCH 2015 (1) NAV as on December 30, 2016 ` 11.6726A. Cumulative PerformanceDate Period NAV
per Unit (`)
Scheme Returns
(%)^
Benchmark Returns
(%)#
Additional Benchmark
Returns (%) ##
Value of Investment of Scheme ` 10000@
Scheme (`) Benchmark (`)#
Additional Benchmark
(`)##Dec 31, 15 Last 1 Year 10.6589 9.51 12.93 7.27 10,951 11,293 10,727Mar 26, 15 Since Inception 10.0000 9.15 10.77 7.65 11,673 11,981 11,391
B. Discrete 12 month Returns (%)Period Scheme
^Benchmark
#Additional
Benchmark ##
Dec 31, 15 To Dec 30, 16 9.51 12.93 7.27^Past performance may or may not be sustained in the future. Returns greater than 1 year period are compounded annualized (CAGR). # CRISIL Composite Bond Fund Index ## CRISIL 1 year T-Bill Index
HDFC FMP 369D APRIL 2014 (1) NAV as on December 30, 2016 ` 12.5737A. Cumulative PerformanceDate Period NAV
per Unit (`)
Scheme Returns
(%)^
Benchmark Returns
(%)#
Additional Benchmark
Returns (%) ##
Value of Investment of Scheme ` 10000@
Scheme (`) Benchmark (`)#
Additional Benchmark
(`)##Dec 31, 15 Last 1 Year 11.5790 8.59 9.83 7.27 10,859 10,983 10,727Dec 31, 14 Last 2 Years 10.6924 8.44 9.24 7.75 11,759 11,934 11,609Apr 04, 14 Since Inception 10.0000 8.71 9.62 8.03 12,574 12,863 12,360
B. Discrete 12 month Returns (%)Period Scheme
^Benchmark
#Additional
Benchmark ##
Dec 31, 15 To Dec 30, 16 8.59 9.83 7.27Dec 31, 14 To Dec 31, 15 8.29 8.66 8.22
^Past performance may or may not be sustained in the future. Returns greater than 1 year period are compounded annualized (CAGR). # CRISIL Composite Bond Fund Index ## CRISIL 1 year T-Bill Index
SHOBHIT MEHROTRA....CONTINUED
Performance of dividend option under the schemes for the investors would be net of distribution tax as applicable. Load is not taken into consideration for computation of performance.@ shows the current value of ` 10,000/- invested at the beginning of a given period. n.A.: not Available
Performance of FMP schemes, being close-ended in nature, is not strictly comparable with that of open-ended schemes since the investment strategy for FMP schemes is primarily buy-and-hold whereas open-ended schemes are actively managed.
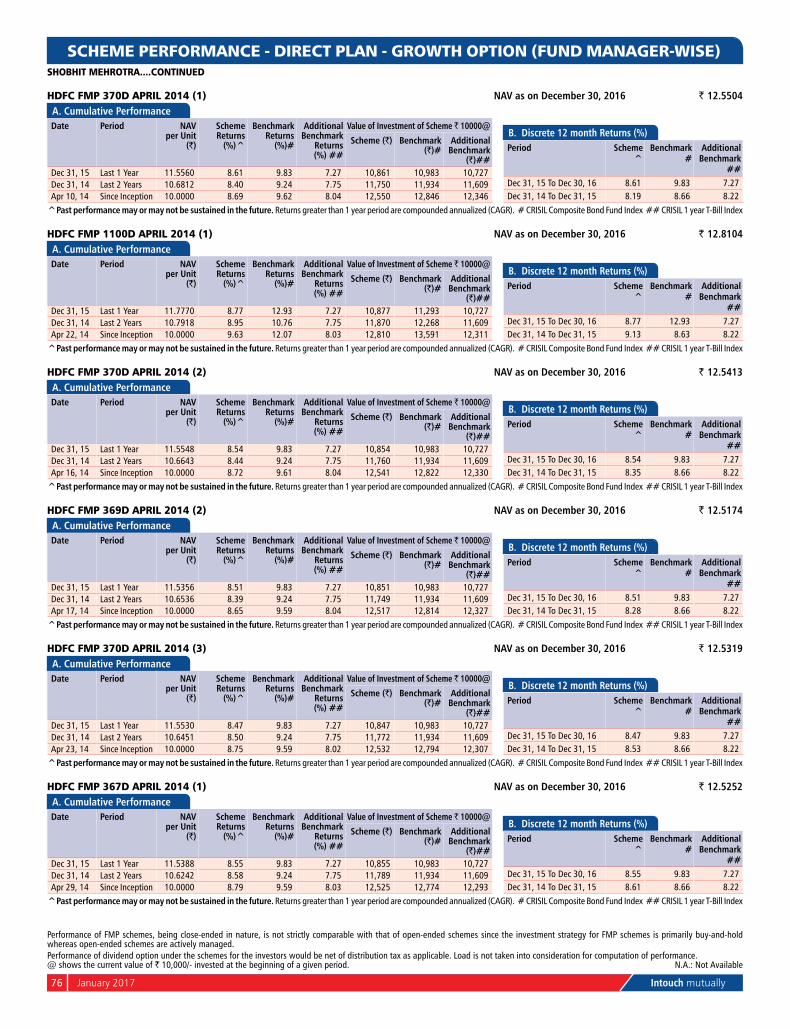
76 January 2017 Intouch mutually
Performance of dividend option under the schemes for the investors would be net of distribution tax as applicable. Load is not taken into consideration for computation of performance.@ shows the current value of ` 10,000/- invested at the beginning of a given period. n.A.: not Available
SCHEME PERFORMANCE - DIRECT PLAN - GROWTH OPTION (FUND MANAGER-WISE)
HDFC FMP 370D APRIL 2014 (1) NAV as on December 30, 2016 ` 12.5504A. Cumulative PerformanceDate Period NAV
per Unit (`)
Scheme Returns
(%)^
Benchmark Returns
(%)#
Additional Benchmark
Returns (%) ##
Value of Investment of Scheme ` 10000@
Scheme (`) Benchmark (`)#
Additional Benchmark
(`)##Dec 31, 15 Last 1 Year 11.5560 8.61 9.83 7.27 10,861 10,983 10,727Dec 31, 14 Last 2 Years 10.6812 8.40 9.24 7.75 11,750 11,934 11,609Apr 10, 14 Since Inception 10.0000 8.69 9.62 8.04 12,550 12,846 12,346
B. Discrete 12 month Returns (%)Period Scheme
^Benchmark
#Additional
Benchmark ##
Dec 31, 15 To Dec 30, 16 8.61 9.83 7.27Dec 31, 14 To Dec 31, 15 8.19 8.66 8.22
^Past performance may or may not be sustained in the future. Returns greater than 1 year period are compounded annualized (CAGR). # CRISIL Composite Bond Fund Index ## CRISIL 1 year T-Bill Index
HDFC FMP 1100D APRIL 2014 (1) NAV as on December 30, 2016 ` 12.8104A. Cumulative PerformanceDate Period NAV
per Unit (`)
Scheme Returns
(%)^
Benchmark Returns
(%)#
Additional Benchmark
Returns (%) ##
Value of Investment of Scheme ` 10000@
Scheme (`) Benchmark (`)#
Additional Benchmark
(`)##Dec 31, 15 Last 1 Year 11.7770 8.77 12.93 7.27 10,877 11,293 10,727Dec 31, 14 Last 2 Years 10.7918 8.95 10.76 7.75 11,870 12,268 11,609Apr 22, 14 Since Inception 10.0000 9.63 12.07 8.03 12,810 13,591 12,311
B. Discrete 12 month Returns (%)Period Scheme
^Benchmark
#Additional
Benchmark ##
Dec 31, 15 To Dec 30, 16 8.77 12.93 7.27Dec 31, 14 To Dec 31, 15 9.13 8.63 8.22
^Past performance may or may not be sustained in the future. Returns greater than 1 year period are compounded annualized (CAGR). # CRISIL Composite Bond Fund Index ## CRISIL 1 year T-Bill Index
HDFC FMP 370D APRIL 2014 (2) NAV as on December 30, 2016 ` 12.5413A. Cumulative PerformanceDate Period NAV
per Unit (`)
Scheme Returns
(%)^
Benchmark Returns
(%)#
Additional Benchmark
Returns (%) ##
Value of Investment of Scheme ` 10000@
Scheme (`) Benchmark (`)#
Additional Benchmark
(`)##Dec 31, 15 Last 1 Year 11.5548 8.54 9.83 7.27 10,854 10,983 10,727Dec 31, 14 Last 2 Years 10.6643 8.44 9.24 7.75 11,760 11,934 11,609Apr 16, 14 Since Inception 10.0000 8.72 9.61 8.04 12,541 12,822 12,330
B. Discrete 12 month Returns (%)Period Scheme
^Benchmark
#Additional
Benchmark ##
Dec 31, 15 To Dec 30, 16 8.54 9.83 7.27Dec 31, 14 To Dec 31, 15 8.35 8.66 8.22
^Past performance may or may not be sustained in the future. Returns greater than 1 year period are compounded annualized (CAGR). # CRISIL Composite Bond Fund Index ## CRISIL 1 year T-Bill Index
HDFC FMP 369D APRIL 2014 (2) NAV as on December 30, 2016 ` 12.5174A. Cumulative PerformanceDate Period NAV
per Unit (`)
Scheme Returns
(%)^
Benchmark Returns
(%)#
Additional Benchmark
Returns (%) ##
Value of Investment of Scheme ` 10000@
Scheme (`) Benchmark (`)#
Additional Benchmark
(`)##Dec 31, 15 Last 1 Year 11.5356 8.51 9.83 7.27 10,851 10,983 10,727Dec 31, 14 Last 2 Years 10.6536 8.39 9.24 7.75 11,749 11,934 11,609Apr 17, 14 Since Inception 10.0000 8.65 9.59 8.04 12,517 12,814 12,327
B. Discrete 12 month Returns (%)Period Scheme
^Benchmark
#Additional
Benchmark ##
Dec 31, 15 To Dec 30, 16 8.51 9.83 7.27Dec 31, 14 To Dec 31, 15 8.28 8.66 8.22
^Past performance may or may not be sustained in the future. Returns greater than 1 year period are compounded annualized (CAGR). # CRISIL Composite Bond Fund Index ## CRISIL 1 year T-Bill Index
HDFC FMP 370D APRIL 2014 (3) NAV as on December 30, 2016 ` 12.5319A. Cumulative PerformanceDate Period NAV
per Unit (`)
Scheme Returns
(%)^
Benchmark Returns
(%)#
Additional Benchmark
Returns (%) ##
Value of Investment of Scheme ` 10000@
Scheme (`) Benchmark (`)#
Additional Benchmark
(`)##Dec 31, 15 Last 1 Year 11.5530 8.47 9.83 7.27 10,847 10,983 10,727Dec 31, 14 Last 2 Years 10.6451 8.50 9.24 7.75 11,772 11,934 11,609Apr 23, 14 Since Inception 10.0000 8.75 9.59 8.02 12,532 12,794 12,307
B. Discrete 12 month Returns (%)Period Scheme
^Benchmark
#Additional
Benchmark ##
Dec 31, 15 To Dec 30, 16 8.47 9.83 7.27Dec 31, 14 To Dec 31, 15 8.53 8.66 8.22
^Past performance may or may not be sustained in the future. Returns greater than 1 year period are compounded annualized (CAGR). # CRISIL Composite Bond Fund Index ## CRISIL 1 year T-Bill Index
HDFC FMP 367D APRIL 2014 (1) NAV as on December 30, 2016 ` 12.5252A. Cumulative PerformanceDate Period NAV
per Unit (`)
Scheme Returns
(%)^
Benchmark Returns
(%)#
Additional Benchmark
Returns (%) ##
Value of Investment of Scheme ` 10000@
Scheme (`) Benchmark (`)#
Additional Benchmark
(`)##Dec 31, 15 Last 1 Year 11.5388 8.55 9.83 7.27 10,855 10,983 10,727Dec 31, 14 Last 2 Years 10.6242 8.58 9.24 7.75 11,789 11,934 11,609Apr 29, 14 Since Inception 10.0000 8.79 9.59 8.03 12,525 12,774 12,293
B. Discrete 12 month Returns (%)Period Scheme
^Benchmark
#Additional
Benchmark ##
Dec 31, 15 To Dec 30, 16 8.55 9.83 7.27Dec 31, 14 To Dec 31, 15 8.61 8.66 8.22
^Past performance may or may not be sustained in the future. Returns greater than 1 year period are compounded annualized (CAGR). # CRISIL Composite Bond Fund Index ## CRISIL 1 year T-Bill Index
SHOBHIT MEHROTRA....CONTINUED
Performance of FMP schemes, being close-ended in nature, is not strictly comparable with that of open-ended schemes since the investment strategy for FMP schemes is primarily buy-and-hold whereas open-ended schemes are actively managed.
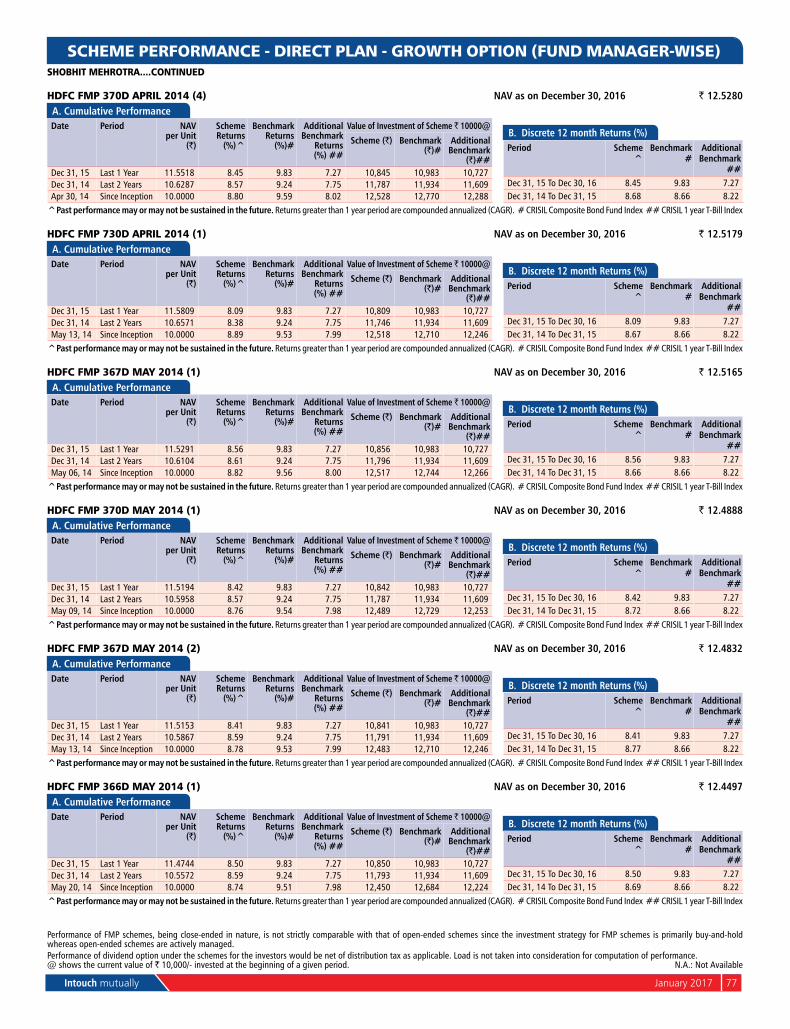
Intouch mutually January 2017 77
SCHEME PERFORMANCE - DIRECT PLAN - GROWTH OPTION (FUND MANAGER-WISE)
HDFC FMP 370D APRIL 2014 (4) NAV as on December 30, 2016 ` 12.5280A. Cumulative PerformanceDate Period NAV
per Unit (`)
Scheme Returns
(%)^
Benchmark Returns
(%)#
Additional Benchmark
Returns (%) ##
Value of Investment of Scheme ` 10000@
Scheme (`) Benchmark (`)#
Additional Benchmark
(`)##Dec 31, 15 Last 1 Year 11.5518 8.45 9.83 7.27 10,845 10,983 10,727Dec 31, 14 Last 2 Years 10.6287 8.57 9.24 7.75 11,787 11,934 11,609Apr 30, 14 Since Inception 10.0000 8.80 9.59 8.02 12,528 12,770 12,288
B. Discrete 12 month Returns (%)Period Scheme
^Benchmark
#Additional
Benchmark ##
Dec 31, 15 To Dec 30, 16 8.45 9.83 7.27Dec 31, 14 To Dec 31, 15 8.68 8.66 8.22
^Past performance may or may not be sustained in the future. Returns greater than 1 year period are compounded annualized (CAGR). # CRISIL Composite Bond Fund Index ## CRISIL 1 year T-Bill Index
HDFC FMP 730D APRIL 2014 (1) NAV as on December 30, 2016 ` 12.5179A. Cumulative PerformanceDate Period NAV
per Unit (`)
Scheme Returns
(%)^
Benchmark Returns
(%)#
Additional Benchmark
Returns (%) ##
Value of Investment of Scheme ` 10000@
Scheme (`) Benchmark (`)#
Additional Benchmark
(`)##Dec 31, 15 Last 1 Year 11.5809 8.09 9.83 7.27 10,809 10,983 10,727Dec 31, 14 Last 2 Years 10.6571 8.38 9.24 7.75 11,746 11,934 11,609May 13, 14 Since Inception 10.0000 8.89 9.53 7.99 12,518 12,710 12,246
B. Discrete 12 month Returns (%)Period Scheme
^Benchmark
#Additional
Benchmark ##
Dec 31, 15 To Dec 30, 16 8.09 9.83 7.27Dec 31, 14 To Dec 31, 15 8.67 8.66 8.22
^Past performance may or may not be sustained in the future. Returns greater than 1 year period are compounded annualized (CAGR). # CRISIL Composite Bond Fund Index ## CRISIL 1 year T-Bill Index
HDFC FMP 367D MAY 2014 (1) NAV as on December 30, 2016 ` 12.5165A. Cumulative PerformanceDate Period NAV
per Unit (`)
Scheme Returns
(%)^
Benchmark Returns
(%)#
Additional Benchmark
Returns (%) ##
Value of Investment of Scheme ` 10000@
Scheme (`) Benchmark (`)#
Additional Benchmark
(`)##Dec 31, 15 Last 1 Year 11.5291 8.56 9.83 7.27 10,856 10,983 10,727Dec 31, 14 Last 2 Years 10.6104 8.61 9.24 7.75 11,796 11,934 11,609May 06, 14 Since Inception 10.0000 8.82 9.56 8.00 12,517 12,744 12,266
B. Discrete 12 month Returns (%)Period Scheme
^Benchmark
#Additional
Benchmark ##
Dec 31, 15 To Dec 30, 16 8.56 9.83 7.27Dec 31, 14 To Dec 31, 15 8.66 8.66 8.22
^Past performance may or may not be sustained in the future. Returns greater than 1 year period are compounded annualized (CAGR). # CRISIL Composite Bond Fund Index ## CRISIL 1 year T-Bill Index
HDFC FMP 370D MAY 2014 (1) NAV as on December 30, 2016 ` 12.4888A. Cumulative PerformanceDate Period NAV
per Unit (`)
Scheme Returns
(%)^
Benchmark Returns
(%)#
Additional Benchmark
Returns (%) ##
Value of Investment of Scheme ` 10000@
Scheme (`) Benchmark (`)#
Additional Benchmark
(`)##Dec 31, 15 Last 1 Year 11.5194 8.42 9.83 7.27 10,842 10,983 10,727Dec 31, 14 Last 2 Years 10.5958 8.57 9.24 7.75 11,787 11,934 11,609May 09, 14 Since Inception 10.0000 8.76 9.54 7.98 12,489 12,729 12,253
B. Discrete 12 month Returns (%)Period Scheme
^Benchmark
#Additional
Benchmark ##
Dec 31, 15 To Dec 30, 16 8.42 9.83 7.27Dec 31, 14 To Dec 31, 15 8.72 8.66 8.22
^Past performance may or may not be sustained in the future. Returns greater than 1 year period are compounded annualized (CAGR). # CRISIL Composite Bond Fund Index ## CRISIL 1 year T-Bill Index
HDFC FMP 367D MAY 2014 (2) NAV as on December 30, 2016 ` 12.4832A. Cumulative PerformanceDate Period NAV
per Unit (`)
Scheme Returns
(%)^
Benchmark Returns
(%)#
Additional Benchmark
Returns (%) ##
Value of Investment of Scheme ` 10000@
Scheme (`) Benchmark (`)#
Additional Benchmark
(`)##Dec 31, 15 Last 1 Year 11.5153 8.41 9.83 7.27 10,841 10,983 10,727Dec 31, 14 Last 2 Years 10.5867 8.59 9.24 7.75 11,791 11,934 11,609May 13, 14 Since Inception 10.0000 8.78 9.53 7.99 12,483 12,710 12,246
B. Discrete 12 month Returns (%)Period Scheme
^Benchmark
#Additional
Benchmark ##
Dec 31, 15 To Dec 30, 16 8.41 9.83 7.27Dec 31, 14 To Dec 31, 15 8.77 8.66 8.22
^Past performance may or may not be sustained in the future. Returns greater than 1 year period are compounded annualized (CAGR). # CRISIL Composite Bond Fund Index ## CRISIL 1 year T-Bill Index
HDFC FMP 366D MAY 2014 (1) NAV as on December 30, 2016 ` 12.4497A. Cumulative PerformanceDate Period NAV
per Unit (`)
Scheme Returns
(%)^
Benchmark Returns
(%)#
Additional Benchmark
Returns (%) ##
Value of Investment of Scheme ` 10000@
Scheme (`) Benchmark (`)#
Additional Benchmark
(`)##Dec 31, 15 Last 1 Year 11.4744 8.50 9.83 7.27 10,850 10,983 10,727Dec 31, 14 Last 2 Years 10.5572 8.59 9.24 7.75 11,793 11,934 11,609May 20, 14 Since Inception 10.0000 8.74 9.51 7.98 12,450 12,684 12,224
B. Discrete 12 month Returns (%)Period Scheme
^Benchmark
#Additional
Benchmark ##
Dec 31, 15 To Dec 30, 16 8.50 9.83 7.27Dec 31, 14 To Dec 31, 15 8.69 8.66 8.22
^Past performance may or may not be sustained in the future. Returns greater than 1 year period are compounded annualized (CAGR). # CRISIL Composite Bond Fund Index ## CRISIL 1 year T-Bill Index
Performance of dividend option under the schemes for the investors would be net of distribution tax as applicable. Load is not taken into consideration for computation of performance.@ shows the current value of ` 10,000/- invested at the beginning of a given period. n.A.: not Available
Performance of FMP schemes, being close-ended in nature, is not strictly comparable with that of open-ended schemes since the investment strategy for FMP schemes is primarily buy-and-hold whereas open-ended schemes are actively managed.
SHOBHIT MEHROTRA....CONTINUED
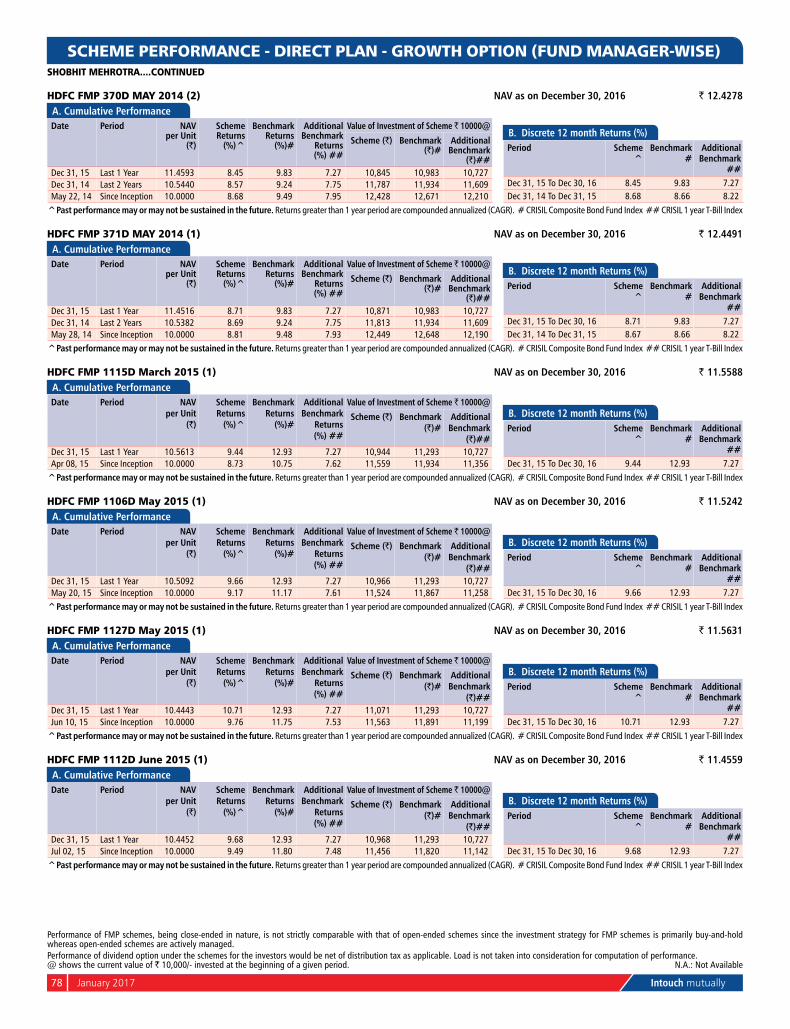
78 January 2017 Intouch mutually
SCHEME PERFORMANCE - DIRECT PLAN - GROWTH OPTION (FUND MANAGER-WISE)
HDFC FMP 370D MAY 2014 (2) NAV as on December 30, 2016 ` 12.4278A. Cumulative PerformanceDate Period NAV
per Unit (`)
Scheme Returns
(%)^
Benchmark Returns
(%)#
Additional Benchmark
Returns (%) ##
Value of Investment of Scheme ` 10000@
Scheme (`) Benchmark (`)#
Additional Benchmark
(`)##Dec 31, 15 Last 1 Year 11.4593 8.45 9.83 7.27 10,845 10,983 10,727Dec 31, 14 Last 2 Years 10.5440 8.57 9.24 7.75 11,787 11,934 11,609May 22, 14 Since Inception 10.0000 8.68 9.49 7.95 12,428 12,671 12,210
B. Discrete 12 month Returns (%)Period Scheme
^Benchmark
#Additional
Benchmark ##
Dec 31, 15 To Dec 30, 16 8.45 9.83 7.27Dec 31, 14 To Dec 31, 15 8.68 8.66 8.22
^Past performance may or may not be sustained in the future. Returns greater than 1 year period are compounded annualized (CAGR). # CRISIL Composite Bond Fund Index ## CRISIL 1 year T-Bill Index
HDFC FMP 371D MAY 2014 (1) NAV as on December 30, 2016 ` 12.4491A. Cumulative PerformanceDate Period NAV
per Unit (`)
Scheme Returns
(%)^
Benchmark Returns
(%)#
Additional Benchmark
Returns (%) ##
Value of Investment of Scheme ` 10000@
Scheme (`) Benchmark (`)#
Additional Benchmark
(`)##Dec 31, 15 Last 1 Year 11.4516 8.71 9.83 7.27 10,871 10,983 10,727Dec 31, 14 Last 2 Years 10.5382 8.69 9.24 7.75 11,813 11,934 11,609May 28, 14 Since Inception 10.0000 8.81 9.48 7.93 12,449 12,648 12,190
B. Discrete 12 month Returns (%)Period Scheme
^Benchmark
#Additional
Benchmark ##
Dec 31, 15 To Dec 30, 16 8.71 9.83 7.27Dec 31, 14 To Dec 31, 15 8.67 8.66 8.22
^Past performance may or may not be sustained in the future. Returns greater than 1 year period are compounded annualized (CAGR). # CRISIL Composite Bond Fund Index ## CRISIL 1 year T-Bill Index
HDFC FMP 1115D March 2015 (1) NAV as on December 30, 2016 ` 11.5588A. Cumulative PerformanceDate Period NAV
per Unit (`)
Scheme Returns
(%)^
Benchmark Returns
(%)#
Additional Benchmark
Returns (%) ##
Value of Investment of Scheme ` 10000@
Scheme (`) Benchmark (`)#
Additional Benchmark
(`)##Dec 31, 15 Last 1 Year 10.5613 9.44 12.93 7.27 10,944 11,293 10,727Apr 08, 15 Since Inception 10.0000 8.73 10.75 7.62 11,559 11,934 11,356
B. Discrete 12 month Returns (%)Period Scheme
^Benchmark
#Additional
Benchmark ##
Dec 31, 15 To Dec 30, 16 9.44 12.93 7.27^Past performance may or may not be sustained in the future. Returns greater than 1 year period are compounded annualized (CAGR). # CRISIL Composite Bond Fund Index ## CRISIL 1 year T-Bill Index
HDFC FMP 1106D May 2015 (1) NAV as on December 30, 2016 ` 11.5242A. Cumulative PerformanceDate Period NAV
per Unit (`)
Scheme Returns
(%)^
Benchmark Returns
(%)#
Additional Benchmark
Returns (%) ##
Value of Investment of Scheme ` 10000@
Scheme (`) Benchmark (`)#
Additional Benchmark
(`)##Dec 31, 15 Last 1 Year 10.5092 9.66 12.93 7.27 10,966 11,293 10,727May 20, 15 Since Inception 10.0000 9.17 11.17 7.61 11,524 11,867 11,258
B. Discrete 12 month Returns (%)Period Scheme
^Benchmark
#Additional
Benchmark ##
Dec 31, 15 To Dec 30, 16 9.66 12.93 7.27^Past performance may or may not be sustained in the future. Returns greater than 1 year period are compounded annualized (CAGR). # CRISIL Composite Bond Fund Index ## CRISIL 1 year T-Bill Index
HDFC FMP 1127D May 2015 (1) NAV as on December 30, 2016 ` 11.5631A. Cumulative PerformanceDate Period NAV
per Unit (`)
Scheme Returns
(%)^
Benchmark Returns
(%)#
Additional Benchmark
Returns (%) ##
Value of Investment of Scheme ` 10000@
Scheme (`) Benchmark (`)#
Additional Benchmark
(`)##Dec 31, 15 Last 1 Year 10.4443 10.71 12.93 7.27 11,071 11,293 10,727Jun 10, 15 Since Inception 10.0000 9.76 11.75 7.53 11,563 11,891 11,199
B. Discrete 12 month Returns (%)Period Scheme
^Benchmark
#Additional
Benchmark ##
Dec 31, 15 To Dec 30, 16 10.71 12.93 7.27^Past performance may or may not be sustained in the future. Returns greater than 1 year period are compounded annualized (CAGR). # CRISIL Composite Bond Fund Index ## CRISIL 1 year T-Bill Index
HDFC FMP 1112D June 2015 (1) NAV as on December 30, 2016 ` 11.4559A. Cumulative PerformanceDate Period NAV
per Unit (`)
Scheme Returns
(%)^
Benchmark Returns
(%)#
Additional Benchmark
Returns (%) ##
Value of Investment of Scheme ` 10000@
Scheme (`) Benchmark (`)#
Additional Benchmark
(`)##Dec 31, 15 Last 1 Year 10.4452 9.68 12.93 7.27 10,968 11,293 10,727Jul 02, 15 Since Inception 10.0000 9.49 11.80 7.48 11,456 11,820 11,142
B. Discrete 12 month Returns (%)Period Scheme
^Benchmark
#Additional
Benchmark ##
Dec 31, 15 To Dec 30, 16 9.68 12.93 7.27^Past performance may or may not be sustained in the future. Returns greater than 1 year period are compounded annualized (CAGR). # CRISIL Composite Bond Fund Index ## CRISIL 1 year T-Bill Index
Performance of dividend option under the schemes for the investors would be net of distribution tax as applicable. Load is not taken into consideration for computation of performance.@ shows the current value of ` 10,000/- invested at the beginning of a given period. n.A.: not Available
Performance of FMP schemes, being close-ended in nature, is not strictly comparable with that of open-ended schemes since the investment strategy for FMP schemes is primarily buy-and-hold whereas open-ended schemes are actively managed.
SHOBHIT MEHROTRA....CONTINUED

Intouch mutually January 2017 79
SCHEME PERFORMANCE - DIRECT PLAN - GROWTH OPTION (FUND MANAGER-WISE)
HDFC FMP 1105D December 2015 (1) NAV as on December 30, 2016 ` 11.0149A. Cumulative PerformanceDate Period NAV
per Unit (`)
Scheme Returns
(%)^
Benchmark Returns
(%)#
Additional Benchmark
Returns (%) ##
Value of Investment of Scheme ` 1 0@
Scheme (`) Benchmark (`)#
Additional Benchmark
(`)##Dec 31, 15 Last 1 Year 10.0104 10.03 12.93 7.27 11,003 11,293 10,727Dec 30, 15 Since Inception 10.0000 10.12 12.90 7.23 11,015 11,294 10,725
B. Discrete 12 month Returns (%)Period Scheme
^Benchmark
#Additional
Benchmark ##
Dec 31, 15 To Dec 30, 16 10.03 12.93 7.27^Past performance may or may not be sustained in the future. Returns greater than 1 year period are compounded annualized (CAGR). # CRISIL Composite Bond Fund Index ## CRISIL 1 year T-Bill IndexPerformance of FMP schemes, being close-ended in nature, is not strictly comparable with that of open-ended schemes since the investment strategy for FMP schemes is primarily buy-and-hold whereas open-ended schemes are actively managed.
KRISHAN KUMAR DAGAHDFC ARBITRAGE FUND - WHOLESALE PLAN NAV as on December 30, 2016 ` 12.238A. Cumulative PerformanceDate Period NAV
per Unit (`)
Scheme Returns
(%)^
Benchmark Returns
(%)#
Additional Benchmark
Returns (%) ##
Value of Investment of Scheme ` 10000@
Scheme (`) Benchmark (`)#
Additional Benchmark
(`)##Dec 31, 15 Last 1 Year 11.418 7.18 7.48 3.01 10,718 10,748 10,301Dec 31, 14 Last 2 Years 10.579 7.56 7.86 -0.59 11,568 11,633 9,883Apr 07, 14 Since Inception 10.000 7.67 8.16 7.63 12,238 12,393 12,227
B. Discrete 12 month Returns (%)Period Scheme
^Benchmark
#Additional
Benchmark ##
Dec 31, 15 To Dec 30, 16 7.18 7.48 3.01Dec 31, 14 To Dec 31, 15 7.93 8.23 -4.06
^Past performance may or may not be sustained in the future. Returns greater than 1 year period are compounded annualized (CAGR). # CRISIL Liquid Fund Index ## nIFTY 50 IndexScheme performance is not strictly comparable with that of its Additional Benchmark since the scheme does not take directional call in equity markets but is limited to availing arbitrage opportunities, etc.
HDFC INDEX FUND - SENSEX PLAN NAV as on December 30, 2016 ` 233.7134A. Cumulative PerformanceDate Period NAV
per Unit (`)
Scheme Returns
(%)^
Benchmark Returns
(%)#
Additional Benchmark
Returns (%) ##
Value of Investment of Scheme ` 10000@
Scheme (`) Benchmark (`)#
Additional Benchmark
(`)##Dec 31, 15 Last 1 Year 225.8330 3.49 3.47 3.01 10,349 10,347 10,301Dec 31, 14 Last 2 Years 234.7671 -0.22 -0.17 -0.59 9,955 9,966 9,883Dec 31, 13 Last 3 Years 179.2906 9.24 9.54 9.10 13,035 13,142 12,985Jan 01, 13 Since Inception 163.6338 9.33 9.62 8.30 14,283 14,434 13,756
B. Discrete 12 month Returns (%)Period Scheme
^Benchmark
#Additional
Benchmark ##
Dec 31, 15 To Dec 30, 16 3.49 3.47 3.01Dec 31, 14 To Dec 31, 15 -3.81 -3.68 -4.06Dec 31, 13 To Dec 31, 14 30.94 31.87 31.39
^Past performance may or may not be sustained in the future. Returns greater than 1 year period are compounded annualized (CAGR). # S&P BSE SEnSEx (Total Returns Index) ## nIFTY 50 Index.
HDFC INDEX FUND - NIFTY PLAN NAV as on December 30, 2016 ` 73.3474A. Cumulative PerformanceDate Period NAV
per Unit (`)
Scheme Returns
(%)^
Benchmark Returns
(%)#
Additional Benchmark
Returns (%) ##
Value of Investment of Scheme ` 10000@
Scheme (`) Benchmark (`)#
Additional Benchmark
(`)##Dec 31, 15 Last 1 Year 70.5487 3.97 4.39 1.95 10,397 10,439 10,195Dec 31, 14 Last 2 Years 72.6810 0.46 0.62 -1.60 10,092 10,125 9,683Dec 31, 13 Last 3 Years 54.9011 10.14 10.40 7.94 13,360 13,456 12,577Jan 01, 13 Since Inception 51.3793 9.31 9.61 7.99 14,276 14,430 13,598
B. Discrete 12 month Returns (%)Period Scheme
^Benchmark
#Additional
Benchmark ##
Dec 31, 15 To Dec 30, 16 3.97 4.39 1.95Dec 31, 14 To Dec 31, 15 -2.93 -3.01 -5.03Dec 31, 13 To Dec 31, 14 32.39 32.90 29.89
^Past performance may or may not be sustained in the future. Returns greater than 1 year period are compounded annualized (CAGR). # nIFTY 50 Index (Total Returns Index) ## S&P BSE SEnSEx.
HDFC INDEX FUND - SENSEX PLUS PLAN NAV as on December 30, 2016 ` 361.5533A. Cumulative PerformanceDate Period NAV
per Unit (`)
Scheme Returns
(%)^
Benchmark Returns
(%)#
Additional Benchmark
Returns (%) ##
Value of Investment of Scheme ` 10000@
Scheme (`) Benchmark (`)#
Additional Benchmark
(`)##Dec 31, 15 Last 1 Year 345.1776 4.74 3.47 3.01 10,474 10,347 10,301Dec 31, 14 Last 2 Years 361.0474 0.07 -0.17 -0.59 10,014 9,966 9,883Dec 31, 13 Last 3 Years 265.4628 10.85 9.54 9.10 13,620 13,142 12,985Jan 01, 13 Since Inception 251.2631 9.53 9.62 8.30 14,389 14,434 13,756
B. Discrete 12 month Returns (%)Period Scheme
^Benchmark
#Additional
Benchmark ##
Dec 31, 15 To Dec 30, 16 4.74 3.47 3.01Dec 31, 14 To Dec 31, 15 -4.40 -3.68 -4.06Dec 31, 13 To Dec 31, 14 36.01 31.87 31.39
^Past performance may or may not be sustained in the future. Returns greater than 1 year period are compounded annualized (CAGR). # S&P BSE SEnSEx (Total Returns Index) ## nIFTY 50 Index.
HDFC GOLD FUND NAV as on December 30, 2016 ` 9.5420A. Cumulative PerformanceDate Period NAV per Unit
(`)Scheme Returns
(%)^Benchmark
Returns (%)#Value of Investment of Scheme ̀ 10000@
Scheme (`) Benchmark (`)#Dec 31, 15 Last 1 Year 8.6302 10.57 11.57 11,057 11,157Dec 31, 14 Last 2 Years 9.2632 1.49 1.76 10,301 10,355Dec 31, 13 Last 3 Years 10.2380 -2.32 1.81 9,320 10,554Jan 01, 13 Since Inception 11.0586 -3.62 -2.19 8,629 9,151
B. Discrete 12 month Returns (%)Period Scheme
^Benchmark
#Dec 31, 15 To Dec 30, 16 10.57 11.57Dec 31, 14 To Dec 31, 15 -6.83 -7.19Dec 31, 13 To Dec 31, 14 -9.52 1.92
^Past performance may or may not be sustained in the future. Returns greater than 1 year period are compounded annualized (CAGR). # Domestic Price of Physical Gold.Performance of dividend option under the schemes for the investors would be net of distribution tax as applicable. Load is not taken into consideration for computation of performance.@ shows the current value of ` 10,000/- invested at the beginning of a given period. n.A.: not Available
SHOBHIT MEHROTRA....CONTINUED
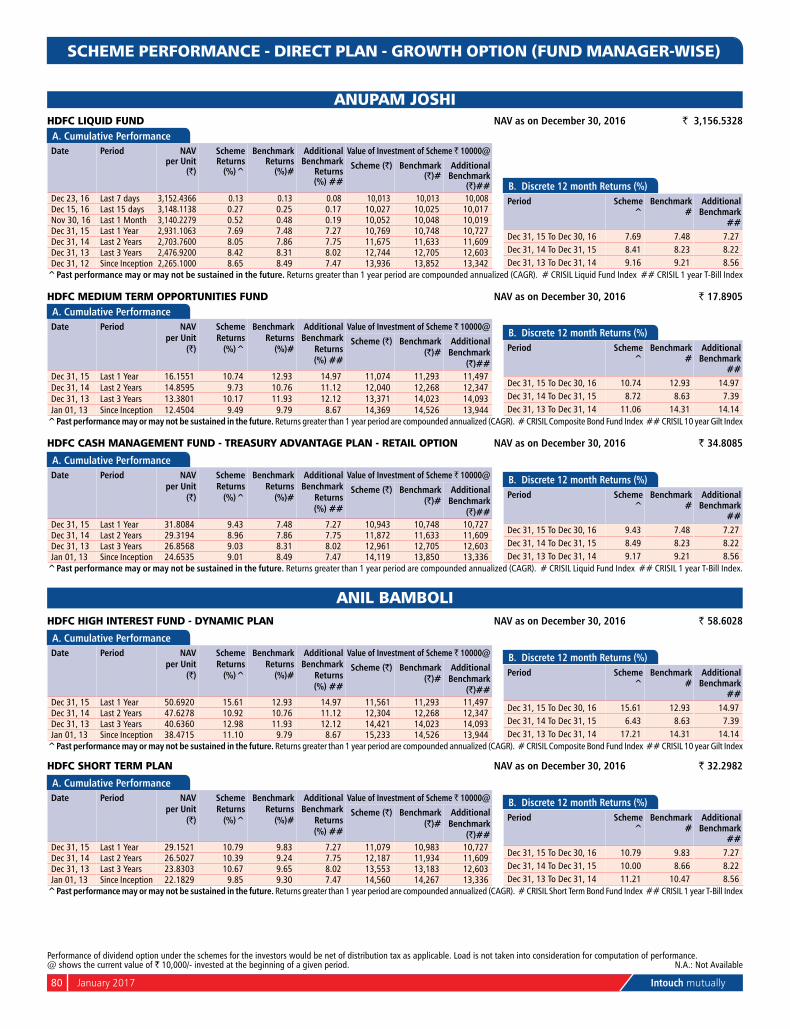
80 January 2017 Intouch mutually
Performance of dividend option under the schemes for the investors would be net of distribution tax as applicable. Load is not taken into consideration for computation of performance.@ shows the current value of ` 10,000/- invested at the beginning of a given period. n.A.: not Available
SCHEME PERFORMANCE - DIRECT PLAN - GROWTH OPTION (FUND MANAGER-WISE)
ANUPAM JOSHIHDFC LIQUID FUND NAV as on December 30, 2016 ` 3,156.5328 A. Cumulative PerformanceDate Period NAV
per Unit (`)
Scheme Returns
(%)^
Benchmark Returns
(%)#
Additional Benchmark
Returns (%) ##
Value of Investment of Scheme ` 10000@
Scheme (`) Benchmark (`)#
Additional Benchmark
(`)##Dec 23, 16 Last 7 days 3,152.4366 0.13 0.13 0.08 10,013 10,013 10,008Dec 15, 16 Last 15 days 3,148.1138 0.27 0.25 0.17 10,027 10,025 10,017nov 30, 16 Last 1 Month 3,140.2279 0.52 0.48 0.19 10,052 10,048 10,019Dec 31, 15 Last 1 Year 2,931.1063 7.69 7.48 7.27 10,769 10,748 10,727Dec 31, 14 Last 2 Years 2,703.7600 8.05 7.86 7.75 11,675 11,633 11,609Dec 31, 13 Last 3 Years 2,476.9200 8.42 8.31 8.02 12,744 12,705 12,603Dec 31, 12 Since Inception 2,265.1000 8.65 8.49 7.47 13,936 13,852 13,342
B. Discrete 12 month Returns (%)Period Scheme
^Benchmark
#Additional
Benchmark ##
Dec 31, 15 To Dec 30, 16 7.69 7.48 7.27Dec 31, 14 To Dec 31, 15 8.41 8.23 8.22Dec 31, 13 To Dec 31, 14 9.16 9.21 8.56
^Past performance may or may not be sustained in the future. Returns greater than 1 year period are compounded annualized (CAGR). # CRISIL Liquid Fund Index ## CRISIL 1 year T-Bill Index
HDFC MEDIUM TERM OPPORTUNITIES FUND NAV as on December 30, 2016 ` 17.8905A. Cumulative PerformanceDate Period NAV
per Unit (`)
Scheme Returns
(%)^
Benchmark Returns
(%)#
Additional Benchmark
Returns (%) ##
Value of Investment of Scheme ` 10000@
Scheme (`) Benchmark (`)#
Additional Benchmark
(`)##Dec 31, 15 Last 1 Year 16.1551 10.74 12.93 14.97 11,074 11,293 11,497Dec 31, 14 Last 2 Years 14.8595 9.73 10.76 11.12 12,040 12,268 12,347Dec 31, 13 Last 3 Years 13.3801 10.17 11.93 12.12 13,371 14,023 14,093Jan 01, 13 Since Inception 12.4504 9.49 9.79 8.67 14,369 14,526 13,944
B. Discrete 12 month Returns (%)Period Scheme
^Benchmark
#Additional
Benchmark ##
Dec 31, 15 To Dec 30, 16 10.74 12.93 14.97Dec 31, 14 To Dec 31, 15 8.72 8.63 7.39Dec 31, 13 To Dec 31, 14 11.06 14.31 14.14
^Past performance may or may not be sustained in the future. Returns greater than 1 year period are compounded annualized (CAGR). # CRISIL Composite Bond Fund Index ## CRISIL 10 year Gilt Index
HDFC CASH MANAGEMENT FUND - TREASURY ADVANTAGE PLAN - RETAIL OPTION NAV as on December 30, 2016 ` 34.8085
A. Cumulative PerformanceDate Period NAV
per Unit (`)
Scheme Returns
(%)^
Benchmark Returns
(%)#
Additional Benchmark
Returns (%) ##
Value of Investment of Scheme ` 10000@
Scheme (`) Benchmark (`)#
Additional Benchmark
(`)##Dec 31, 15 Last 1 Year 31.8084 9.43 7.48 7.27 10,943 10,748 10,727Dec 31, 14 Last 2 Years 29.3194 8.96 7.86 7.75 11,872 11,633 11,609Dec 31, 13 Last 3 Years 26.8568 9.03 8.31 8.02 12,961 12,705 12,603Jan 01, 13 Since Inception 24.6535 9.01 8.49 7.47 14,119 13,850 13,336
B. Discrete 12 month Returns (%)Period Scheme
^Benchmark
#Additional
Benchmark ##
Dec 31, 15 To Dec 30, 16 9.43 7.48 7.27Dec 31, 14 To Dec 31, 15 8.49 8.23 8.22Dec 31, 13 To Dec 31, 14 9.17 9.21 8.56
^Past performance may or may not be sustained in the future. Returns greater than 1 year period are compounded annualized (CAGR). # CRISIL Liquid Fund Index ## CRISIL 1 year T-Bill Index.
ANIL BAMBOLIHDFC HIGH INTEREST FUND - DYNAMIC PLAN NAV as on December 30, 2016 ` 58.6028
A. Cumulative PerformanceDate Period NAV
per Unit (`)
Scheme Returns
(%)^
Benchmark Returns
(%)#
Additional Benchmark
Returns (%) ##
Value of Investment of Scheme ` 10000@
Scheme (`) Benchmark (`)#
Additional Benchmark
(`)##Dec 31, 15 Last 1 Year 50.6920 15.61 12.93 14.97 11,561 11,293 11,497Dec 31, 14 Last 2 Years 47.6278 10.92 10.76 11.12 12,304 12,268 12,347Dec 31, 13 Last 3 Years 40.6360 12.98 11.93 12.12 14,421 14,023 14,093Jan 01, 13 Since Inception 38.4715 11.10 9.79 8.67 15,233 14,526 13,944
B. Discrete 12 month Returns (%)Period Scheme
^Benchmark
#Additional
Benchmark ##
Dec 31, 15 To Dec 30, 16 15.61 12.93 14.97Dec 31, 14 To Dec 31, 15 6.43 8.63 7.39Dec 31, 13 To Dec 31, 14 17.21 14.31 14.14
^Past performance may or may not be sustained in the future. Returns greater than 1 year period are compounded annualized (CAGR). # CRISIL Composite Bond Fund Index ## CRISIL 10 year Gilt Index
HDFC SHORT TERM PLAN NAV as on December 30, 2016 ` 32.2982
A. Cumulative PerformanceDate Period NAV
per Unit (`)
Scheme Returns
(%)^
Benchmark Returns
(%)#
Additional Benchmark
Returns (%) ##
Value of Investment of Scheme ` 10000@
Scheme (`) Benchmark (`)#
Additional Benchmark
(`)##Dec 31, 15 Last 1 Year 29.1521 10.79 9.83 7.27 11,079 10,983 10,727Dec 31, 14 Last 2 Years 26.5027 10.39 9.24 7.75 12,187 11,934 11,609Dec 31, 13 Last 3 Years 23.8303 10.67 9.65 8.02 13,553 13,183 12,603Jan 01, 13 Since Inception 22.1829 9.85 9.30 7.47 14,560 14,267 13,336
B. Discrete 12 month Returns (%)Period Scheme
^Benchmark
#Additional
Benchmark ##
Dec 31, 15 To Dec 30, 16 10.79 9.83 7.27Dec 31, 14 To Dec 31, 15 10.00 8.66 8.22Dec 31, 13 To Dec 31, 14 11.21 10.47 8.56
^Past performance may or may not be sustained in the future. Returns greater than 1 year period are compounded annualized (CAGR). # CRISIL Short Term Bond Fund Index ## CRISIL 1 year T-Bill Index

Intouch mutually January 2017 81
SCHEME PERFORMANCE - DIRECT PLAN - GROWTH OPTION (FUND MANAGER-WISE)
HDFC SHORT TERM OPPORTUNITIES FUND NAV as on December 30, 2016 ` 17.7899
A. Cumulative PerformanceDate Period NAV
per Unit (`)
Scheme Returns
(%)^
Benchmark Returns
(%)#
Additional Benchmark
Returns (%) ##
Value of Investment of Scheme ` 10000@
Scheme (`) Benchmark (`)#
Additional Benchmark
(`)##Dec 31, 15 Last 1 Year 16.2498 9.48 9.83 7.27 10,948 10,983 10,727Dec 31, 14 Last 2 Years 14.9217 9.19 9.24 7.75 11,922 11,934 11,609Dec 31, 13 Last 3 Years 13.4953 9.65 9.65 8.02 13,182 13,183 12,603Jan 01, 13 Since Inception 12.4477 9.34 9.30 7.47 14,292 14,267 13,336
B. Discrete 12 month Returns (%)Period Scheme
^Benchmark
#Additional
Benchmark ##
Dec 31, 15 To Dec 30, 16 9.48 9.83 7.27Dec 31, 14 To Dec 31, 15 8.90 8.66 8.22Dec 31, 13 To Dec 31, 14 10.57 10.47 8.56
^Past performance may or may not be sustained in the future. Returns greater than 1 year period are compounded annualized (CAGR). # CRISIL Short Term Bond Fund Index ## CRISIL 1 year T-Bill Index
HDFC GILT FUND - SHORT TERM PLAN NAV as on December 30, 2016 ` 27.3783
A. Cumulative PerformanceDate Period NAV
per Unit (`)
Scheme Returns
(%)^
Benchmark Returns
(%)#
Additional Benchmark
Returns (%) ##
Value of Investment of Scheme ` 10000@
Scheme (`) Benchmark (`)#
Additional Benchmark
(`)##Dec 31, 15 Last 1 Year 24.3905 12.25 9.12 7.27 11,225 10,912 10,727Dec 31, 14 Last 2 Years 22.3604 10.65 9.07 7.75 12,244 11,896 11,609Dec 31, 13 Last 3 Years 20.2327 10.61 9.17 8.02 13,532 13,011 12,603Jan 01, 13 Since Inception 19.0767 9.46 8.68 7.47 14,352 13,945 13,336
B. Discrete 12 month Returns (%)Period Scheme
^Benchmark
#Additional
Benchmark ##
Dec 31, 15 To Dec 30, 16 12.25 9.12 7.27Dec 31, 14 To Dec 31, 15 9.08 9.02 8.22Dec 31, 13 To Dec 31, 14 10.52 9.37 8.56
^Past performance may or may not be sustained in the future. Returns greater than 1 year period are compounded annualized (CAGR). # I-Sec Si-Bex ## CRISIL 1 year T-Bill Index
HDFC GILT FUND - LONG TERM PLAN NAV as on December 30, 2016 ` 34.5918
A. Cumulative PerformanceDate Period NAV
per Unit (`)
Scheme Returns
(%)^
Benchmark Returns
(%)#
Additional Benchmark
Returns (%) ##
Value of Investment of Scheme ` 10000@
Scheme (`) Benchmark (`)#
Additional Benchmark
(`)##Dec 31, 15 Last 1 Year 29.5367 17.11 16.76 14.97 11,711 11,676 11,497Dec 31, 14 Last 2 Years 27.7435 11.66 12.03 11.12 12,468 12,550 12,347Dec 31, 13 Last 3 Years 23.2262 14.20 14.54 12.12 14,893 15,027 14,093Jan 01, 13 Since Inception 22.9789 10.77 10.93 8.67 15,054 15,139 13,944
B. Discrete 12 month Returns (%)Period Scheme
^Benchmark
#Additional
Benchmark ##
Dec 31, 15 To Dec 30, 16 17.11 16.76 14.97Dec 31, 14 To Dec 31, 15 6.46 7.48 7.39Dec 31, 13 To Dec 31, 14 19.45 19.74 14.14
^Past performance may or may not be sustained in the future. Returns greater than 1 year period are compounded annualized (CAGR). # I-Sec Li-Bex ## CRISIL 10 year Gilt Index
HDFC CASH MANAGEMENT FUND - SAVINGS PLAN NAV as on December 30, 2016 ` 3,340.3831
A. Cumulative PerformanceDate Period NAV
per Unit (`)
Scheme Returns
(%)^
Benchmark Returns
(%)#
Additional Benchmark
Returns (%) ##
Value of Investment of Scheme ` 10000@
Scheme (`) Benchmark (`)#
Additional Benchmark
(`)##Dec 23, 16 Last 7 days 3,335.9415 0.13 0.13 0.08 10,013 10,013 10,008Dec 15, 16 Last 15 days 3,331.4481 0.27 0.25 0.17 10,027 10,025 10,017nov 30, 16 Last 1 Month 3,323.1830 0.52 0.48 0.19 10,052 10,048 10,019Dec 31, 15 Last 1 Year 3,101.6925 7.70 7.48 7.27 10,770 10,748 10,727Dec 31, 14 Last 2 Years 2,860.9100 8.06 7.86 7.75 11,676 11,633 11,609Dec 31, 13 Last 3 Years 2,621.6900 8.41 8.31 8.02 12,741 12,705 12,603Dec 31, 12 Since Inception 2,399.2000 8.63 8.49 7.47 13,923 13,852 13,342
B. Discrete 12 month Returns (%)Period Scheme
^Benchmark
#Additional
Benchmark ##
Dec 31, 15 To Dec 30, 16 7.70 7.48 7.27Dec 31, 14 To Dec 31, 15 8.42 8.23 8.22Dec 31, 13 To Dec 31, 14 9.12 9.21 8.56
^Past performance may or may not be sustained in the future. Returns greater than 1 year period are compounded annualized (CAGR). # CRISIL Liquid Fund Index ## CRISIL 1 year T-Bill Index.
HDFC CASH MANAGEMENT FUND - CALL PLAN NAV as on December 30, 2016 ` 2,470.5696
A. Cumulative PerformanceDate Period NAV
per Unit (`)
Scheme Returns
(%)^
Benchmark Returns
(%)#
Additional Benchmark
Returns (%) ##
Value of Investment of Scheme ` 10000@
Scheme (`) Benchmark (`)#
Additional Benchmark
(`)##Dec 23, 16 Last 7 days 2,467.7540 0.11 0.13 0.08 10,011 10,013 10,008Dec 15, 16 Last 15 days 2,464.5401 0.24 0.25 0.17 10,024 10,025 10,017nov 30, 16 Last 1 Month 2,458.6468 0.48 0.48 0.19 10,048 10,048 10,019Dec 31, 15 Last 1 Year 2,320.1969 6.48 7.48 7.27 10,648 10,748 10,727Dec 31, 14 Last 2 Years 2,160.9600 6.92 7.86 7.75 11,433 11,633 11,609Dec 31, 13 Last 3 Years 1,996.9900 7.35 8.31 8.02 12,371 12,705 12,603Dec 31, 12 Since Inception 1,844.4600 7.58 8.49 7.47 13,395 13,852 13,342
B. Discrete 12 month Returns (%)Period Scheme
^Benchmark
#Additional
Benchmark ##
Dec 31, 15 To Dec 30, 16 6.48 7.48 7.27Dec 31, 14 To Dec 31, 15 7.37 8.23 8.22Dec 31, 13 To Dec 31, 14 8.21 9.21 8.56
^Past performance may or may not be sustained in the future. Returns greater than 1 year period are compounded annualized (CAGR). # CRISIL Liquid Fund Index ## CRISIL 1 year T-Bill Index.
Performance of dividend option under the schemes for the investors would be net of distribution tax as applicable. Load is not taken into consideration for computation of performance.@ shows the current value of ` 10,000/- invested at the beginning of a given period. n.A.: not Available
ANIL BAMBOLI....CONTINUED

82 January 2017 Intouch mutually
SCHEME PERFORMANCE - DIRECT PLAN - GROWTH OPTION (FUND MANAGER-WISE)
HDFC BANKING AND PSU DEBT FUND NAV as on December 30, 2016 ` 13.0553
A. Cumulative PerformanceDate Period NAV
per Unit (`)
Scheme Returns
(%)^
Benchmark Returns
(%)#
Additional Benchmark
Returns (%) ##
Value of Investment of Scheme ` 10000@
Scheme (`) Benchmark (`)#
Additional Benchmark
(`)##Dec 31, 15 Last 1 Year 11.7473 11.13 9.83 7.27 11,113 10,983 10,727Dec 31, 14 Last 2 Year 10.6980 10.47 9.24 7.75 12,203 11,934 11,609Mar 26, 14 Since Inception 10.0000 10.11 9.60 8.00 13,055 12,887 12,373
B. Discrete 12 month Returns (%)Period Scheme
^Benchmark
#Additional
Benchmark ##
Dec 31, 15 To Dec 30, 16 11.13 9.83 7.27Dec 31, 14 To Dec 31, 15 9.81 8.66 8.22
^Past performance may or may not be sustained in the future. Returns greater than 1 year period are compounded annualized (CAGR). # CRISIL Short Term Bond Fund Index ## CRISIL 1 year T-Bill Index
HDFC ANNUAL INTERVAL FUND - SERIES I - PLAN A NAV as on December 30, 2016 ` 13.8798
A. Cumulative PerformanceDate Period NAV
per Unit (`)
Scheme Returns
(%)^
Benchmark Returns
(%)#
Additional Benchmark
Returns (%) ##
Value of Investment of Scheme ` 10000@
Scheme (`) Benchmark (`)#
Additional Benchmark
(`)##Dec 31, 15 Last 1 Year 12.8419 8.08 9.83 7.27 10,808 10,983 10,727Dec 31, 14 Last 2 Years 11.8058 8.43 9.24 7.75 11,757 11,934 11,609Dec 31, 13 Last 3 Years 10.7658 8.84 9.65 8.02 12,892 13,183 12,603Mar 06, 13 Since Inception 10.0000 8.96 9.38 7.43 13,880 14,087 13,151
B. Discrete 12 month Returns (%)Period Scheme
^Benchmark
#Additional
Benchmark ##
Dec 31, 15 To Dec 30, 16 8.08 9.83 7.27Dec 31, 14 To Dec 31, 15 8.78 8.66 8.22Dec 31, 13 To Dec 31, 14 9.66 10.47 8.56
^Past performance may or may not be sustained in the future. Returns greater than 1 year period are compounded annualized (CAGR). # CRISIL Short Term Bond Fund Index ## CRISIL 1 year T-Bill Index.Scheme performance may not strictly be comparable with that of its Additional Benchmark as the scheme can invest only in instruments having maturity upto the opening of the immediately following specified transaction period, which is at annual intervals.
HDFC ANNUAL INTERVAL FUND - SERIES I - PLAN B NAV as on December 30, 2016 ` 13.7923
A. Cumulative PerformanceDate Period NAV
per Unit (`)
Scheme Returns
(%)^
Benchmark Returns
(%)#
Additional Benchmark
Returns (%) ##
Value of Investment of Scheme ` 10000@
Scheme (`) Benchmark (`)#
Additional Benchmark
(`)##Dec 31, 15 Last 1 Year 12.7680 8.02 9.83 7.27 10,802 10,983 10,727Dec 31, 14 Last 2 Years 11.7394 8.39 9.24 7.75 11,749 11,934 11,609Dec 31, 13 Last 3 Years 10.7207 8.76 9.65 8.02 12,865 13,183 12,603Mar 14, 13 Since Inception 10.0000 8.83 9.35 7.42 13,792 14,045 13,128
B. Discrete 12 month Returns (%)Period Scheme
^Benchmark
#Additional
Benchmark ##
Dec 31, 15 To Dec 30, 16 8.02 9.83 7.27Dec 31, 14 To Dec 31, 15 8.76 8.66 8.22Dec 31, 13 To Dec 31, 14 9.50 10.47 8.56
^Past performance may or may not be sustained in the future. Returns greater than 1 year period are compounded annualized (CAGR). # CRISIL Short Term Bond Fund Index ## CRISIL 1 year T-Bill Index.Scheme performance may not strictly be comparable with that of its Additional Benchmark as the scheme can invest only in instruments having maturity upto the opening of the immediately following specified transaction period, which is at annual intervals.
HDFC DEBT FUND FOR CANCER CURE - 2014 NAV as on December 30, 2016 ` 10.2528
A. Cumulative PerformanceDate Period NAV
per Unit (`)
Scheme Returns
(%)^
Benchmark Returns
(%)#
Additional Benchmark
Returns (%) ##
Value of Investment of Scheme ` 10000@
Scheme (`) Benchmark (`)#
Additional Benchmark
(`)##Dec 31, 15 Last 1 Year 10.3595 7.01 9.83 7.27 10,701 10,983 10,727Dec 31, 14 Last 2 Years 10.4198 7.61 9.24 7.75 11,581 11,934 11,609Mar 18, 14 Since Inception 10.0000 8.86 9.64 8.03 12,670 12,927 12,404
B. Discrete 12 month Returns (%)Period Scheme
^Benchmark
#Additional
Benchmark ##
Dec 31, 15 To Dec 30, 16 7.01 9.83 7.27Dec 31, 14 To Dec 31, 15 8.22 8.66 8.22
^Past performance may or may not be sustained in the future. Returns greater than 1 year period are compounded annualized (CAGR). # CRISIL Short-Term Bond Fund Index ## CRISIL 1 year T-Bill Index.Performance of close-ended Scheme is not strictly comparable with that of open-ended schemes since the investment strategy for close ended schemes is primarily buy and hold whereas open ended schemes are actively managed. Returns of HDFC Debt Fund For Cancer Cure - 2014 are computed based on nAV of Dividend Option and all dividends (after statutory levy) are assumed to be reinvested in the units of the scheme at the then prevailing nAV (ex-dividend nAV).
HDFC FMP 370D JULY 2013 (3) NAV as on December 30, 2016 ` 13.4980
A. Cumulative PerformanceDate Period NAV
per Unit (`)
Scheme Returns
(%)^
Benchmark Returns
(%)#
Additional Benchmark
Returns (%) ##
Value of Investment of Scheme ` 10000@
Scheme (`) Benchmark (`)#
Additional Benchmark
(`)##Dec 31, 15 Last 1 Year 12.4858 8.11 9.83 7.27 10,811 10,983 10,727Dec 31, 14 Last 2 Years 11.4914 8.38 9.24 7.75 11,746 11,934 11,609Dec 31, 13 Last 3 Years 10.4291 8.98 9.65 8.02 12,943 13,183 12,603Jul 31, 13 Since Inception 10.0000 9.17 9.85 8.10 13,498 13,789 13,052
B. Discrete 12 month Returns (%)Period Scheme
^Benchmark
#Additional
Benchmark ##
Dec 31, 15 To Dec 30, 16 8.11 9.83 7.27Dec 31, 14 To Dec 31, 15 8.65 8.66 8.22Dec 31, 13 To Dec 31, 14 10.19 10.47 8.56
^Past performance may or may not be sustained in the future. Returns greater than 1 year period are compounded annualized (CAGR). # CRISIL Short Term Bond Fund Index ## CRISIL 1 year T-Bill Index
ANIL BAMBOLI....CONTINUED
Performance of dividend option under the schemes for the investors would be net of distribution tax as applicable. Load is not taken into consideration for computation of performance.@ shows the current value of ` 10,000/- invested at the beginning of a given period. n.A.: not Available
Performance of FMP schemes, being close-ended in nature, is not strictly comparable with that of open-ended schemes since the investment strategy for FMP schemes is primarily buy-and-hold whereas open-ended schemes are actively managed.
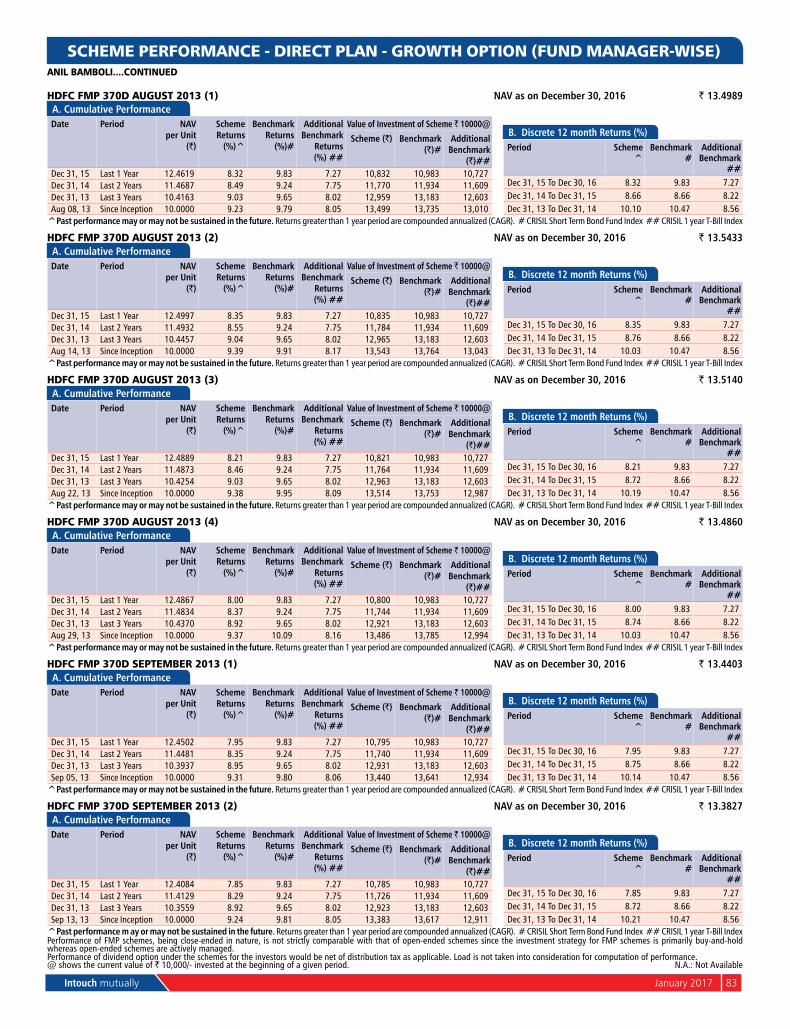
Intouch mutually January 2017 83
SCHEME PERFORMANCE - DIRECT PLAN - GROWTH OPTION (FUND MANAGER-WISE)
HDFC FMP 370D AUGUST 2013 (1) NAV as on December 30, 2016 ` 13.4989A. Cumulative PerformanceDate Period NAV
per Unit (`)
Scheme Returns
(%)^
Benchmark Returns
(%)#
Additional Benchmark
Returns (%) ##
Value of Investment of Scheme ` 10000@
Scheme (`) Benchmark (`)#
Additional Benchmark
(`)##Dec 31, 15 Last 1 Year 12.4619 8.32 9.83 7.27 10,832 10,983 10,727Dec 31, 14 Last 2 Years 11.4687 8.49 9.24 7.75 11,770 11,934 11,609Dec 31, 13 Last 3 Years 10.4163 9.03 9.65 8.02 12,959 13,183 12,603Aug 08, 13 Since Inception 10.0000 9.23 9.79 8.05 13,499 13,735 13,010
B. Discrete 12 month Returns (%)Period Scheme
^Benchmark
#Additional
Benchmark ##
Dec 31, 15 To Dec 30, 16 8.32 9.83 7.27Dec 31, 14 To Dec 31, 15 8.66 8.66 8.22Dec 31, 13 To Dec 31, 14 10.10 10.47 8.56
^Past performance may or may not be sustained in the future. Returns greater than 1 year period are compounded annualized (CAGR). # CRISIL Short Term Bond Fund Index ## CRISIL 1 year T-Bill Index
HDFC FMP 370D AUGUST 2013 (2) NAV as on December 30, 2016 ` 13.5433A. Cumulative PerformanceDate Period NAV
per Unit (`)
Scheme Returns
(%)^
Benchmark Returns
(%)#
Additional Benchmark
Returns (%) ##
Value of Investment of Scheme ` 10000@
Scheme (`) Benchmark (`)#
Additional Benchmark
(`)##Dec 31, 15 Last 1 Year 12.4997 8.35 9.83 7.27 10,835 10,983 10,727Dec 31, 14 Last 2 Years 11.4932 8.55 9.24 7.75 11,784 11,934 11,609Dec 31, 13 Last 3 Years 10.4457 9.04 9.65 8.02 12,965 13,183 12,603Aug 14, 13 Since Inception 10.0000 9.39 9.91 8.17 13,543 13,764 13,043
B. Discrete 12 month Returns (%)Period Scheme
^Benchmark
#Additional
Benchmark ##
Dec 31, 15 To Dec 30, 16 8.35 9.83 7.27Dec 31, 14 To Dec 31, 15 8.76 8.66 8.22Dec 31, 13 To Dec 31, 14 10.03 10.47 8.56
^Past performance may or may not be sustained in the future. Returns greater than 1 year period are compounded annualized (CAGR). # CRISIL Short Term Bond Fund Index ## CRISIL 1 year T-Bill Index
HDFC FMP 370D AUGUST 2013 (3) NAV as on December 30, 2016 ` 13.5140A. Cumulative PerformanceDate Period NAV
per Unit (`)
Scheme Returns
(%)^
Benchmark Returns
(%)#
Additional Benchmark
Returns (%) ##
Value of Investment of Scheme ` 10000@
Scheme (`) Benchmark (`)#
Additional Benchmark
(`)##Dec 31, 15 Last 1 Year 12.4889 8.21 9.83 7.27 10,821 10,983 10,727Dec 31, 14 Last 2 Years 11.4873 8.46 9.24 7.75 11,764 11,934 11,609Dec 31, 13 Last 3 Years 10.4254 9.03 9.65 8.02 12,963 13,183 12,603Aug 22, 13 Since Inception 10.0000 9.38 9.95 8.09 13,514 13,753 12,987
B. Discrete 12 month Returns (%)Period Scheme
^Benchmark
#Additional
Benchmark ##
Dec 31, 15 To Dec 30, 16 8.21 9.83 7.27Dec 31, 14 To Dec 31, 15 8.72 8.66 8.22Dec 31, 13 To Dec 31, 14 10.19 10.47 8.56
^Past performance may or may not be sustained in the future. Returns greater than 1 year period are compounded annualized (CAGR). # CRISIL Short Term Bond Fund Index ## CRISIL 1 year T-Bill Index
HDFC FMP 370D AUGUST 2013 (4) NAV as on December 30, 2016 ` 13.4860A. Cumulative PerformanceDate Period NAV
per Unit (`)
Scheme Returns
(%)^
Benchmark Returns
(%)#
Additional Benchmark
Returns (%) ##
Value of Investment of Scheme ` 10000@
Scheme (`) Benchmark (`)#
Additional Benchmark
(`)##Dec 31, 15 Last 1 Year 12.4867 8.00 9.83 7.27 10,800 10,983 10,727Dec 31, 14 Last 2 Years 11.4834 8.37 9.24 7.75 11,744 11,934 11,609Dec 31, 13 Last 3 Years 10.4370 8.92 9.65 8.02 12,921 13,183 12,603Aug 29, 13 Since Inception 10.0000 9.37 10.09 8.16 13,486 13,785 12,994
B. Discrete 12 month Returns (%)Period Scheme
^Benchmark
#Additional
Benchmark ##
Dec 31, 15 To Dec 30, 16 8.00 9.83 7.27Dec 31, 14 To Dec 31, 15 8.74 8.66 8.22Dec 31, 13 To Dec 31, 14 10.03 10.47 8.56
^Past performance may or may not be sustained in the future. Returns greater than 1 year period are compounded annualized (CAGR). # CRISIL Short Term Bond Fund Index ## CRISIL 1 year T-Bill Index
HDFC FMP 370D SEPTEMBER 2013 (1) NAV as on December 30, 2016 ` 13.4403A. Cumulative PerformanceDate Period NAV
per Unit (`)
Scheme Returns
(%)^
Benchmark Returns
(%)#
Additional Benchmark
Returns (%) ##
Value of Investment of Scheme ` 10000@
Scheme (`) Benchmark (`)#
Additional Benchmark
(`)##Dec 31, 15 Last 1 Year 12.4502 7.95 9.83 7.27 10,795 10,983 10,727Dec 31, 14 Last 2 Years 11.4481 8.35 9.24 7.75 11,740 11,934 11,609Dec 31, 13 Last 3 Years 10.3937 8.95 9.65 8.02 12,931 13,183 12,603Sep 05, 13 Since Inception 10.0000 9.31 9.80 8.06 13,440 13,641 12,934
B. Discrete 12 month Returns (%)Period Scheme
^Benchmark
#Additional
Benchmark ##
Dec 31, 15 To Dec 30, 16 7.95 9.83 7.27Dec 31, 14 To Dec 31, 15 8.75 8.66 8.22Dec 31, 13 To Dec 31, 14 10.14 10.47 8.56
^Past performance may or may not be sustained in the future. Returns greater than 1 year period are compounded annualized (CAGR). # CRISIL Short Term Bond Fund Index ## CRISIL 1 year T-Bill Index
HDFC FMP 370D SEPTEMBER 2013 (2) NAV as on December 30, 2016 ` 13.3827A. Cumulative PerformanceDate Period NAV
per Unit (`)
Scheme Returns
(%)^
Benchmark Returns
(%)#
Additional Benchmark
Returns (%) ##
Value of Investment of Scheme ` 10000@
Scheme (`) Benchmark (`)#
Additional Benchmark
(`)##Dec 31, 15 Last 1 Year 12.4084 7.85 9.83 7.27 10,785 10,983 10,727Dec 31, 14 Last 2 Years 11.4129 8.29 9.24 7.75 11,726 11,934 11,609Dec 31, 13 Last 3 Years 10.3559 8.92 9.65 8.02 12,923 13,183 12,603Sep 13, 13 Since Inception 10.0000 9.24 9.81 8.05 13,383 13,617 12,911
B. Discrete 12 month Returns (%)Period Scheme
^Benchmark
#Additional
Benchmark ##
Dec 31, 15 To Dec 30, 16 7.85 9.83 7.27Dec 31, 14 To Dec 31, 15 8.72 8.66 8.22Dec 31, 13 To Dec 31, 14 10.21 10.47 8.56
^Past performance m ay or may not be sustained in the future. Returns greater than 1 year period are compounded annualized (CAGR). # CRISIL Short Term Bond Fund Index ## CRISIL 1 year T-Bill Index
ANIL BAMBOLI....CONTINUED
Performance of dividend option under the schemes for the investors would be net of distribution tax as applicable. Load is not taken into consideration for computation of performance.@ shows the current value of ` 10,000/- invested at the beginning of a given period. n.A.: not Available
Performance of FMP schemes, being close-ended in nature, is not strictly comparable with that of open-ended schemes since the investment strategy for FMP schemes is primarily buy-and-hold whereas open-ended schemes are actively managed.

84 January 2017 Intouch mutually
SCHEME PERFORMANCE - DIRECT PLAN - GROWTH OPTION (FUND MANAGER-WISE)
HDFC FMP 371D JULY 2013 (1) NAV as on December 30, 2016 ` 13.4691A. Cumulative PerformanceDate Period NAV
per Unit (`)
Scheme Returns
(%)^
Benchmark Returns
(%)#
Additional Benchmark
Returns (%) ##
Value of Investment of Scheme ` 10000@
Scheme (`) Benchmark (`)#
Additional Benchmark
(`)##Dec 31, 15 Last 1 Year 12.4463 8.22 9.83 7.27 10,822 10,983 10,727Dec 31, 14 Last 2 Years 11.4573 8.42 9.24 7.75 11,756 11,934 11,609Dec 31, 13 Last 3 Years 10.4572 8.80 9.65 8.02 12,880 13,183 12,603Jul 24, 13 Since Inception 10.0000 9.05 9.87 8.09 13,469 13,820 13,065
B. Discrete 12 month Returns (%)Period Scheme
^Benchmark
#Additional
Benchmark ##
Dec 31, 15 To Dec 30, 16 8.22 9.83 7.27Dec 31, 14 To Dec 31, 15 8.63 8.66 8.22Dec 31, 13 To Dec 31, 14 9.56 10.47 8.56
^Past performance may or may not be sustained in the future. Returns greater than 1 year period are compounded annualized (CAGR). # CRISIL Short Term Bond Fund Index ## CRISIL 1 year T-Bill Index
HDFC FMP 371D AUGUST 2013 (1) NAV as on December 30, 2016 ` 13.5080A. Cumulative PerformanceDate Period NAV
per Unit (`)
Scheme Returns
(%)^
Benchmark Returns
(%)#
Additional Benchmark
Returns (%) ##
Value of Investment of Scheme ` 10000@
Scheme (`) Benchmark (`)#
Additional Benchmark
(`)##Dec 31, 15 Last 1 Year 12.4657 8.36 9.83 7.27 10,836 10,983 10,727Dec 31, 14 Last 2 Years 11.4704 8.52 9.24 7.75 11,776 11,934 11,609Dec 31, 13 Last 3 Years 10.4294 9.00 9.65 8.02 12,952 13,183 12,603Aug 07, 13 Since Inception 10.0000 9.25 9.81 8.05 13,508 13,745 13,013
B. Discrete 12 month Returns (%)Period Scheme
^Benchmark
#Additional
Benchmark ##
Dec 31, 15 To Dec 30, 16 8.36 9.83 7.27Dec 31, 14 To Dec 31, 15 8.68 8.66 8.22Dec 31, 13 To Dec 31, 14 9.98 10.47 8.56
^Past performance may or may not be sustained in the future. Returns greater than 1 year period are compounded annualized (CAGR). # CRISIL Short Term Bond Fund Index ## CRISIL 1 year T-Bill Index
HDFC FMP 504D DECEMBER 2013 (1) NAV as on December 30, 2016 ` 12.9234A. Cumulative PerformanceDate Period NAV
per Unit (`)
Scheme Returns
(%)^
Benchmark Returns
(%)#
Additional Benchmark
Returns (%) ##
Value of Investment of Scheme ` 10000@
Scheme (`) Benchmark (`)#
Additional Benchmark
(`)##Dec 31, 15 Last 1 Year 11.9237 8.38 9.83 7.27 10,838 10,983 10,727Dec 31, 14 Last 2 Years 10.9936 8.42 9.24 7.75 11,755 11,934 11,609Dec 31, 13 Last 3 Years 10.0011 8.92 9.65 8.02 12,922 13,183 12,603Dec 27, 13 Since Inception 10.0000 8.89 9.65 8.01 12,923 13,198 12,610
B. Discrete 12 month Returns (%)Period Scheme
^Benchmark
#Additional
Benchmark ##
Dec 31, 15 To Dec 30, 16 8.38 9.83 7.27Dec 31, 14 To Dec 31, 15 8.46 8.66 8.22Dec 31, 13 To Dec 31, 14 9.92 10.47 8.56
^Past performance may or may not be sustained in the future. Returns greater than 1 year period are compounded annualized (CAGR). # CRISIL Short Term Bond Fund Index ## CRISIL 1 year T-Bill Index
HDFC FMP 531D DECEMBER 2013 (1) NAV as on December 30, 2016 ` 12.9020A. Cumulative PerformanceDate Period NAV
per Unit (`)
Scheme Returns
(%)^
Benchmark Returns
(%)#
Additional Benchmark
Returns (%) ##
Value of Investment of Scheme ` 10000@
Scheme (`) Benchmark (`)#
Additional Benchmark
(`)##Dec 31, 15 Last 1 Year 11.9494 7.97 9.83 7.27 10,797 10,983 10,727Dec 31, 14 Last 2 Years 11.0038 8.28 9.24 7.75 11,725 11,934 11,609Dec 31, 13 Last 3 Years 10.0189 8.80 9.65 8.02 12,878 13,183 12,603Dec 20, 13 Since Inception 10.0000 8.77 9.64 7.99 12,902 13,215 12,622
B. Discrete 12 month Returns (%)Period Scheme
^Benchmark
#Additional
Benchmark ##
Dec 31, 15 To Dec 30, 16 7.97 9.83 7.27Dec 31, 14 To Dec 31, 15 8.59 8.66 8.22Dec 31, 13 To Dec 31, 14 9.83 10.47 8.56
^Past performance may or may not be sustained in the future. Returns greater than 1 year period are compounded annualized (CAGR). # CRISIL Short Term Bond Fund Index ## CRISIL 1 year T-Bill Index
HDFC FMP 1143D JULY 2013 (1) NAV as on December 30, 2016 ` 13.5947A. Cumulative PerformanceDate Period NAV
per Unit (`)
Scheme Returns
(%)^
Benchmark Returns
(%)#
Additional Benchmark
Returns (%) ##
Value of Investment of Scheme ` 10000@
Scheme (`) Benchmark (`)#
Additional Benchmark
(`)##Dec 31, 15 Last 1 Year 12.5778 8.08 12.93 7.27 10,808 11,293 10,727Dec 31, 14 Last 2 Years 11.6004 8.26 10.76 7.75 11,719 12,268 11,609Dec 31, 13 Last 3 Years 10.4360 9.21 11.93 8.02 13,027 14,023 12,603Aug 06, 13 Since Inception 10.0000 9.44 11.17 8.05 13,595 14,340 13,016
B. Discrete 12 month Returns (%)Period Scheme
^Benchmark
#Additional
Benchmark ##
Dec 31, 15 To Dec 30, 16 8.08 12.93 7.27Dec 31, 14 To Dec 31, 15 8.43 8.63 8.22Dec 31, 13 To Dec 31, 14 11.16 14.31 8.56
^Past performance may or may not be sustained in the future. Returns greater than 1 year period are compounded annualized (CAGR). # CRISIL Composite Bond Fund Index ## CRISIL 1 year T-Bill Index
HDFC FMP 1846D AUGUST 2013 (1) NAV as on December 30, 2016 ` 13.9437A. Cumulative PerformanceDate Period NAV
per Unit (`)
Scheme Returns
(%)^
Benchmark Returns
(%)#
Additional Benchmark
Returns (%) ##
Value of Investment of Scheme ` 10000@
Scheme (`) Benchmark (`)#
Additional Benchmark
(`)##Dec 31, 15 Last 1 Year 12.8030 8.91 12.93 7.27 10,891 11,293 10,727Dec 31, 14 Last 2 Years 11.7744 8.82 10.76 7.75 11,842 12,268 11,609Dec 31, 13 Last 3 Years 10.4889 9.96 11.93 8.02 13,294 14,023 12,603Aug 14, 13 Since Inception 10.0000 10.33 11.68 8.17 13,944 14,528 13,043
B. Discrete 12 month Returns (%)Period Scheme
^Benchmark
#Additional
Benchmark ##
Dec 31, 15 To Dec 30, 16 8.91 12.93 7.27Dec 31, 14 To Dec 31, 15 8.74 8.63 8.22Dec 31, 13 To Dec 31, 14 12.26 14.31 8.56
^Past performance may or may not be sustained in the future. Returns greater than 1 year period are compounded annualized (CAGR). # CRISIL Composite Bond Fund Index ## CRISIL 1 year T-Bill Index
ANIL BAMBOLI....CONTINUED
Performance of dividend option under the schemes for the investors would be net of distribution tax as applicable. Load is not taken into consideration for computation of performance.@ shows the current value of ` 10,000/- invested at the beginning of a given period. n.A.: not Available
Performance of FMP schemes, being close-ended in nature, is not strictly comparable with that of open-ended schemes since the investment strategy for FMP schemes is primarily buy-and-hold whereas open-ended schemes are actively managed.

Intouch mutually January 2017 85
SCHEME PERFORMANCE - DIRECT PLAN - GROWTH OPTION (FUND MANAGER-WISE)
HDFC FMP 1875D AUGUST 2013 (1) NAV as on December 30, 2016 ` 14.0982
A. Cumulative PerformanceDate Period NAV
per Unit (`)
Scheme Returns
(%)^
Benchmark Returns
(%)#
Additional Benchmark
Returns (%) ##
Value of Investment of Scheme ` 10000@
Scheme (`) Benchmark (`)#
Additional Benchmark
(`)##Dec 31, 15 Last 1 Year 12.8414 9.79 12.93 7.27 10,979 11,293 10,727Dec 31, 14 Last 2 Years 11.7224 9.67 10.76 7.75 12,027 12,268 11,609Dec 31, 13 Last 3 Years 10.3887 10.71 11.93 8.02 13,571 14,023 12,603Sep 04, 13 Since Inception 10.0000 10.89 11.52 8.06 14,098 14,368 12,937
B. Discrete 12 month Returns (%)Period Scheme
^Benchmark
#Additional
Benchmark ##
Dec 31, 15 To Dec 30, 16 9.79 12.93 7.27Dec 31, 14 To Dec 31, 15 9.55 8.63 8.22Dec 31, 13 To Dec 31, 14 12.84 14.31 8.56
^Past performance may or may not be sustained in the future. Returns greater than 1 year period are compounded annualized (CAGR). # CRISIL Composite Bond Fund Index ## CRISIL 1 year T-Bill Index
HDFC FMP 1095D MARCH 2014 (1) NAV as on December 30, 2016 ` 13.0907
A. Cumulative PerformanceDate Period NAV
per Unit (`)
Scheme Returns
(%)^
Benchmark Returns
(%)#
Additional Benchmark
Returns (%) ##
Value of Investment of Scheme ` 10000@
Scheme (`) Benchmark (`)#
Additional Benchmark
(`)##Dec 31, 15 Last 1 Year 11.9936 9.15 9.83 7.27 10,915 10,983 10,727Dec 31, 14 Last 2 Years 10.8777 9.70 9.24 7.75 12,034 11,934 11,609Mar 26, 14 Since Inception 10.0000 10.22 9.60 8.00 13,091 12,887 12,373
B. Discrete 12 month Returns (%)Period Scheme
^Benchmark
#Additional
Benchmark ##
Dec 31, 15 To Dec 30, 16 9.15 9.83 7.27Dec 31, 14 To Dec 31, 15 10.26 8.66 8.22
^Past performance may or may not be sustained in the future. Returns greater than 1 year period are compounded annualized (CAGR). # CRISIL Short Term Bond Fund Index ## CRISIL 1 year T-Bill Index
HDFC FMP 1127D MARCH 2014 (1) NAV as on December 30, 2016 ` 13.3000
A. Cumulative PerformanceDate Period NAV
per Unit (`)
Scheme Returns
(%)^
Benchmark Returns
(%)#
Additional Benchmark
Returns (%) ##
Value of Investment of Scheme ` 10000@
Scheme (`) Benchmark (`)#
Additional Benchmark
(`)##Dec 31, 15 Last 1 Year 12.2258 8.79 12.93 7.27 10,879 11,293 10,727Dec 31, 14 Last 2 Years 10.9914 10.00 10.76 7.75 12,100 12,268 11,609Mar 25, 14 Since Inception 10.0000 10.84 12.03 8.00 13,300 13,698 12,377
B. Discrete 12 month Returns (%)Period Scheme
^Benchmark
#Additional
Benchmark ##
Dec 31, 15 To Dec 30, 16 8.79 12.93 7.27Dec 31, 14 To Dec 31, 15 11.23 8.63 8.22
^Past performance may or may not be sustained in the future. Returns greater than 1 year period are compounded annualized (CAGR). # CRISIL Composite Bond Fund Index ## CRISIL 1 year T-Bill Index
HDFC FMP 1175D JANUARY 2014 (1) NAV as on December 30, 2016 ` 13.4776
A. Cumulative PerformanceDate Period NAV
per Unit (`)
Scheme Returns
(%)^
Benchmark Returns
(%)#
Additional Benchmark
Returns (%) ##
Value of Investment of Scheme ` 10000@
Scheme (`) Benchmark (`)#
Additional Benchmark
(`)##Dec 31, 15 Last 1 Year 12.4085 8.62 12.93 7.27 10,862 11,293 10,727Dec 31, 14 Last 2 Years 11.1880 9.76 10.76 7.75 12,046 12,268 11,609Feb 05, 14 Since Inception 10.0000 10.83 11.93 8.06 13,478 13,867 12,523
B. Discrete 12 month Returns (%)Period Scheme
^Benchmark
#Additional
Benchmark ##
Dec 31, 15 To Dec 30, 16 8.62 12.93 7.27Dec 31, 14 To Dec 31, 15 10.91 8.63 8.22
^Past performance may or may not be sustained in the future. Returns greater than 1 year period are compounded annualized (CAGR). # CRISIL Composite Bond Fund Index ## CRISIL 1 year T-Bill Index
HDFC FMP 366D MARCH 2014 (1) NAV as on December 30, 2016 ` 12.6569
A. Cumulative PerformanceDate Period NAV
per Unit (`)
Scheme Returns
(%)^
Benchmark Returns
(%)#
Additional Benchmark
Returns (%) ##
Value of Investment of Scheme ` 10000@
Scheme (`) Benchmark (`)#
Additional Benchmark
(`)##Dec 31, 15 Last 1 Year 11.6844 8.32 9.83 7.27 10,832 10,983 10,727Dec 31, 14 Last 2 Years 10.7522 8.50 9.24 7.75 11,771 11,934 11,609Mar 19, 14 Since Inception 10.0000 8.82 9.63 8.01 12,657 12,921 12,395
B. Discrete 12 month Returns (%)Period Scheme
^Benchmark
#Additional
Benchmark ##
Dec 31, 15 To Dec 30, 16 8.32 9.83 7.27Dec 31, 14 To Dec 31, 15 8.67 8.66 8.22
^Past performance may or may not be sustained in the future. Returns greater than 1 year period are compounded annualized (CAGR). # CRISIL Short Term Bond Fund Index ## CRISIL 1 year T-Bill Index
HDFC FMP 369D FEBRUARY 2014 (1) NAV as on December 30, 2016 ` 12.8112
A. Cumulative PerformanceDate Period NAV
per Unit (`)
Scheme Returns
(%)^
Benchmark Returns
(%)#
Additional Benchmark
Returns (%) ##
Value of Investment of Scheme ` 10000@
Scheme (`) Benchmark (`)#
Additional Benchmark
(`)##Dec 31, 15 Last 1 Year 11.8223 8.36 9.83 7.27 10,836 10,983 10,727Dec 31, 14 Last 2 Years 10.8737 8.54 9.24 7.75 11,782 11,934 11,609Feb 07, 14 Since Inception 10.0000 8.93 9.67 8.06 12,811 13,065 12,515
B. Discrete 12 month Returns (%)Period Scheme
^Benchmark
#Additional
Benchmark ##
Dec 31, 15 To Dec 30, 16 8.36 9.83 7.27Dec 31, 14 To Dec 31, 15 8.72 8.66 8.22
^Past performance may or may not be sustained in the future. Returns greater than 1 year period are compounded annualized (CAGR). # CRISIL Short Term Bond Fund Index ## CRISIL 1 year T-Bill Index
ANIL BAMBOLI....CONTINUED
Performance of dividend option under the schemes for the investors would be net of distribution tax as applicable. Load is not taken into consideration for computation of performance.@ shows the current value of ` 10,000/- invested at the beginning of a given period. n.A.: not Available
Performance of FMP schemes, being close-ended in nature, is not strictly comparable with that of open-ended schemes since the investment strategy for FMP schemes is primarily buy-and-hold whereas open-ended schemes are actively managed.
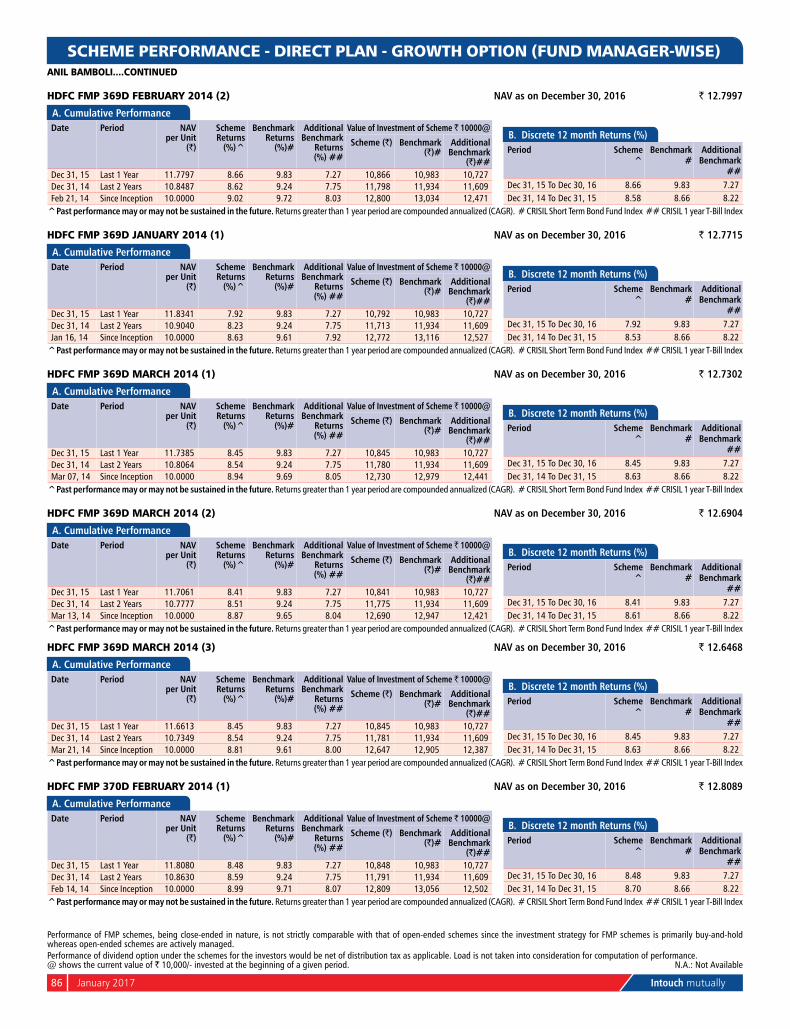
86 January 2017 Intouch mutually
HDFC FMP 369D FEBRUARY 2014 (2) NAV as on December 30, 2016 ` 12.7997
A. Cumulative PerformanceDate Period NAV
per Unit (`)
Scheme Returns
(%)^
Benchmark Returns
(%)#
Additional Benchmark
Returns (%) ##
Value of Investment of Scheme ` 10000@
Scheme (`) Benchmark (`)#
Additional Benchmark
(`)##Dec 31, 15 Last 1 Year 11.7797 8.66 9.83 7.27 10,866 10,983 10,727Dec 31, 14 Last 2 Years 10.8487 8.62 9.24 7.75 11,798 11,934 11,609Feb 21, 14 Since Inception 10.0000 9.02 9.72 8.03 12,800 13,034 12,471
B. Discrete 12 month Returns (%)Period Scheme
^Benchmark
#Additional
Benchmark ##
Dec 31, 15 To Dec 30, 16 8.66 9.83 7.27Dec 31, 14 To Dec 31, 15 8.58 8.66 8.22
^Past performance may or may not be sustained in the future. Returns greater than 1 year period are compounded annualized (CAGR). # CRISIL Short Term Bond Fund Index ## CRISIL 1 year T-Bill Index
HDFC FMP 369D JANUARY 2014 (1) NAV as on December 30, 2016 ` 12.7715
A. Cumulative PerformanceDate Period NAV
per Unit (`)
Scheme Returns
(%)^
Benchmark Returns
(%)#
Additional Benchmark
Returns (%) ##
Value of Investment of Scheme ` 10000@
Scheme (`) Benchmark (`)#
Additional Benchmark
(`)##Dec 31, 15 Last 1 Year 11.8341 7.92 9.83 7.27 10,792 10,983 10,727Dec 31, 14 Last 2 Years 10.9040 8.23 9.24 7.75 11,713 11,934 11,609Jan 16, 14 Since Inception 10.0000 8.63 9.61 7.92 12,772 13,116 12,527
B. Discrete 12 month Returns (%)Period Scheme
^Benchmark
#Additional
Benchmark ##
Dec 31, 15 To Dec 30, 16 7.92 9.83 7.27Dec 31, 14 To Dec 31, 15 8.53 8.66 8.22
^Past performance may or may not be sustained in the future. Returns greater than 1 year period are compounded annualized (CAGR). # CRISIL Short Term Bond Fund Index ## CRISIL 1 year T-Bill Index
HDFC FMP 369D MARCH 2014 (1) NAV as on December 30, 2016 ` 12.7302
A. Cumulative PerformanceDate Period NAV
per Unit (`)
Scheme Returns
(%)^
Benchmark Returns
(%)#
Additional Benchmark
Returns (%) ##
Value of Investment of Scheme ` 10000@
Scheme (`) Benchmark (`)#
Additional Benchmark
(`)##Dec 31, 15 Last 1 Year 11.7385 8.45 9.83 7.27 10,845 10,983 10,727Dec 31, 14 Last 2 Years 10.8064 8.54 9.24 7.75 11,780 11,934 11,609Mar 07, 14 Since Inception 10.0000 8.94 9.69 8.05 12,730 12,979 12,441
B. Discrete 12 month Returns (%)Period Scheme
^Benchmark
#Additional
Benchmark ##
Dec 31, 15 To Dec 30, 16 8.45 9.83 7.27Dec 31, 14 To Dec 31, 15 8.63 8.66 8.22
^Past performance may or may not be sustained in the future. Returns greater than 1 year period are compounded annualized (CAGR). # CRISIL Short Term Bond Fund Index ## CRISIL 1 year T-Bill Index
HDFC FMP 369D MARCH 2014 (2) NAV as on December 30, 2016 ` 12.6904
A. Cumulative PerformanceDate Period NAV
per Unit (`)
Scheme Returns
(%)^
Benchmark Returns
(%)#
Additional Benchmark
Returns (%) ##
Value of Investment of Scheme ` 10000@
Scheme (`) Benchmark (`)#
Additional Benchmark
(`)##Dec 31, 15 Last 1 Year 11.7061 8.41 9.83 7.27 10,841 10,983 10,727Dec 31, 14 Last 2 Years 10.7777 8.51 9.24 7.75 11,775 11,934 11,609Mar 13, 14 Since Inception 10.0000 8.87 9.65 8.04 12,690 12,947 12,421
B. Discrete 12 month Returns (%)Period Scheme
^Benchmark
#Additional
Benchmark ##
Dec 31, 15 To Dec 30, 16 8.41 9.83 7.27Dec 31, 14 To Dec 31, 15 8.61 8.66 8.22
^Past performance may or may not be sustained in the future. Returns greater than 1 year period are compounded annualized (CAGR). # CRISIL Short Term Bond Fund Index ## CRISIL 1 year T-Bill Index
HDFC FMP 369D MARCH 2014 (3) NAV as on December 30, 2016 ` 12.6468
A. Cumulative PerformanceDate Period NAV
per Unit (`)
Scheme Returns
(%)^
Benchmark Returns
(%)#
Additional Benchmark
Returns (%) ##
Value of Investment of Scheme ` 10000@
Scheme (`) Benchmark (`)#
Additional Benchmark
(`)##Dec 31, 15 Last 1 Year 11.6613 8.45 9.83 7.27 10,845 10,983 10,727Dec 31, 14 Last 2 Years 10.7349 8.54 9.24 7.75 11,781 11,934 11,609Mar 21, 14 Since Inception 10.0000 8.81 9.61 8.00 12,647 12,905 12,387
B. Discrete 12 month Returns (%)Period Scheme
^Benchmark
#Additional
Benchmark ##
Dec 31, 15 To Dec 30, 16 8.45 9.83 7.27Dec 31, 14 To Dec 31, 15 8.63 8.66 8.22
^Past performance may or may not be sustained in the future. Returns greater than 1 year period are compounded annualized (CAGR). # CRISIL Short Term Bond Fund Index ## CRISIL 1 year T-Bill Index
HDFC FMP 370D FEBRUARY 2014 (1) NAV as on December 30, 2016 ` 12.8089
A. Cumulative PerformanceDate Period NAV
per Unit (`)
Scheme Returns
(%)^
Benchmark Returns
(%)#
Additional Benchmark
Returns (%) ##
Value of Investment of Scheme ` 10000@
Scheme (`) Benchmark (`)#
Additional Benchmark
(`)##Dec 31, 15 Last 1 Year 11.8080 8.48 9.83 7.27 10,848 10,983 10,727Dec 31, 14 Last 2 Years 10.8630 8.59 9.24 7.75 11,791 11,934 11,609Feb 14, 14 Since Inception 10.0000 8.99 9.71 8.07 12,809 13,056 12,502
B. Discrete 12 month Returns (%)Period Scheme
^Benchmark
#Additional
Benchmark ##
Dec 31, 15 To Dec 30, 16 8.48 9.83 7.27Dec 31, 14 To Dec 31, 15 8.70 8.66 8.22
^Past performance may or may not be sustained in the future. Returns greater than 1 year period are compounded annualized (CAGR). # CRISIL Short Term Bond Fund Index ## CRISIL 1 year T-Bill Index
SCHEME PERFORMANCE - DIRECT PLAN - GROWTH OPTION (FUND MANAGER-WISE)ANIL BAMBOLI....CONTINUED
Performance of dividend option under the schemes for the investors would be net of distribution tax as applicable. Load is not taken into consideration for computation of performance.@ shows the current value of ` 10,000/- invested at the beginning of a given period. n.A.: not Available
Performance of FMP schemes, being close-ended in nature, is not strictly comparable with that of open-ended schemes since the investment strategy for FMP schemes is primarily buy-and-hold whereas open-ended schemes are actively managed.
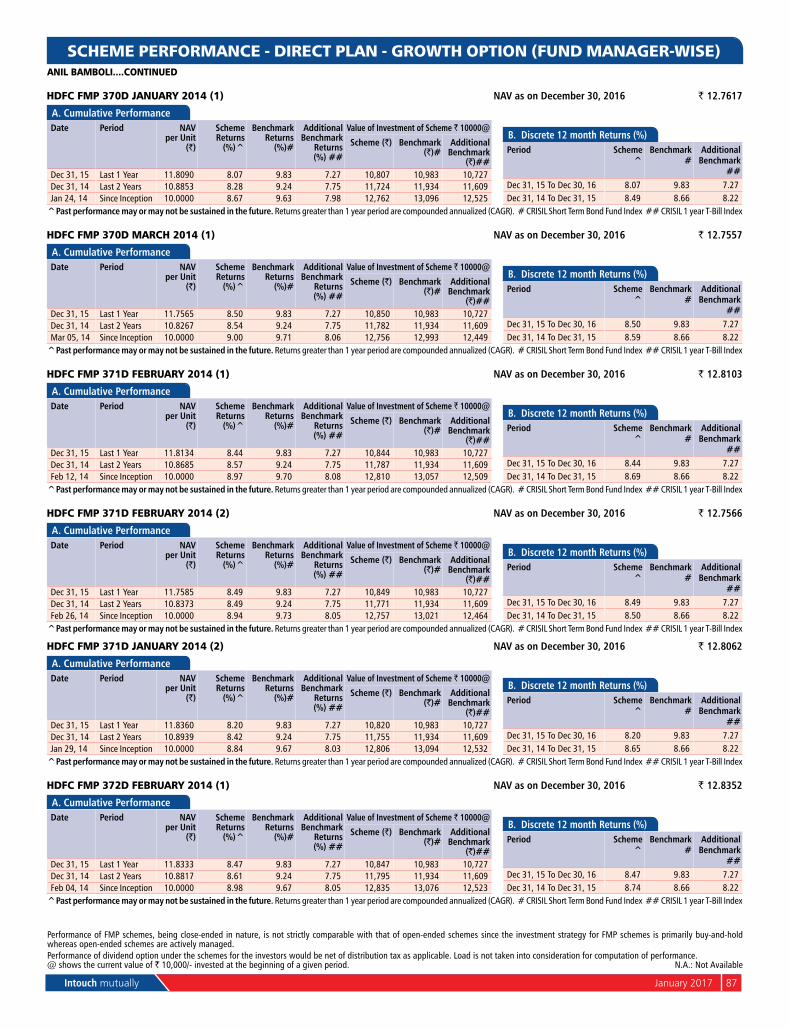
Intouch mutually January 2017 87
HDFC FMP 370D JANUARY 2014 (1) NAV as on December 30, 2016 ` 12.7617
A. Cumulative PerformanceDate Period NAV
per Unit (`)
Scheme Returns
(%)^
Benchmark Returns
(%)#
Additional Benchmark
Returns (%) ##
Value of Investment of Scheme ` 10000@
Scheme (`) Benchmark (`)#
Additional Benchmark
(`)##Dec 31, 15 Last 1 Year 11.8090 8.07 9.83 7.27 10,807 10,983 10,727Dec 31, 14 Last 2 Years 10.8853 8.28 9.24 7.75 11,724 11,934 11,609Jan 24, 14 Since Inception 10.0000 8.67 9.63 7.98 12,762 13,096 12,525
B. Discrete 12 month Returns (%)Period Scheme
^Benchmark
#Additional
Benchmark ##
Dec 31, 15 To Dec 30, 16 8.07 9.83 7.27Dec 31, 14 To Dec 31, 15 8.49 8.66 8.22
^Past performance may or may not be sustained in the future. Returns greater than 1 year period are compounded annualized (CAGR). # CRISIL Short Term Bond Fund Index ## CRISIL 1 year T-Bill Index
HDFC FMP 370D MARCH 2014 (1) NAV as on December 30, 2016 ` 12.7557
A. Cumulative PerformanceDate Period NAV
per Unit (`)
Scheme Returns
(%)^
Benchmark Returns
(%)#
Additional Benchmark
Returns (%) ##
Value of Investment of Scheme ` 10000@
Scheme (`) Benchmark (`)#
Additional Benchmark
(`)##Dec 31, 15 Last 1 Year 11.7565 8.50 9.83 7.27 10,850 10,983 10,727Dec 31, 14 Last 2 Years 10.8267 8.54 9.24 7.75 11,782 11,934 11,609Mar 05, 14 Since Inception 10.0000 9.00 9.71 8.06 12,756 12,993 12,449
B. Discrete 12 month Returns (%)Period Scheme
^Benchmark
#Additional
Benchmark ##
Dec 31, 15 To Dec 30, 16 8.50 9.83 7.27Dec 31, 14 To Dec 31, 15 8.59 8.66 8.22
^Past performance may or may not be sustained in the future. Returns greater than 1 year period are compounded annualized (CAGR). # CRISIL Short Term Bond Fund Index ## CRISIL 1 year T-Bill Index
HDFC FMP 371D FEBRUARY 2014 (1) NAV as on December 30, 2016 ` 12.8103
A. Cumulative PerformanceDate Period NAV
per Unit (`)
Scheme Returns
(%)^
Benchmark Returns
(%)#
Additional Benchmark
Returns (%) ##
Value of Investment of Scheme ` 10000@
Scheme (`) Benchmark (`)#
Additional Benchmark
(`)##Dec 31, 15 Last 1 Year 11.8134 8.44 9.83 7.27 10,844 10,983 10,727Dec 31, 14 Last 2 Years 10.8685 8.57 9.24 7.75 11,787 11,934 11,609Feb 12, 14 Since Inception 10.0000 8.97 9.70 8.08 12,810 13,057 12,509
B. Discrete 12 month Returns (%)Period Scheme
^Benchmark
#Additional
Benchmark ##
Dec 31, 15 To Dec 30, 16 8.44 9.83 7.27Dec 31, 14 To Dec 31, 15 8.69 8.66 8.22
^Past performance may or may not be sustained in the future. Returns greater than 1 year period are compounded annualized (CAGR). # CRISIL Short Term Bond Fund Index ## CRISIL 1 year T-Bill Index
HDFC FMP 371D FEBRUARY 2014 (2) NAV as on December 30, 2016 ` 12.7566
A. Cumulative PerformanceDate Period NAV
per Unit (`)
Scheme Returns
(%)^
Benchmark Returns
(%)#
Additional Benchmark
Returns (%) ##
Value of Investment of Scheme ` 10000@
Scheme (`) Benchmark (`)#
Additional Benchmark
(`)##Dec 31, 15 Last 1 Year 11.7585 8.49 9.83 7.27 10,849 10,983 10,727Dec 31, 14 Last 2 Years 10.8373 8.49 9.24 7.75 11,771 11,934 11,609Feb 26, 14 Since Inception 10.0000 8.94 9.73 8.05 12,757 13,021 12,464
B. Discrete 12 month Returns (%)Period Scheme
^Benchmark
#Additional
Benchmark ##
Dec 31, 15 To Dec 30, 16 8.49 9.83 7.27Dec 31, 14 To Dec 31, 15 8.50 8.66 8.22
^Past performance may or may not be sustained in the future. Returns greater than 1 year period are compounded annualized (CAGR). # CRISIL Short Term Bond Fund Index ## CRISIL 1 year T-Bill Index
HDFC FMP 371D JANUARY 2014 (2) NAV as on December 30, 2016 ` 12.8062
A. Cumulative PerformanceDate Period NAV
per Unit (`)
Scheme Returns
(%)^
Benchmark Returns
(%)#
Additional Benchmark
Returns (%) ##
Value of Investment of Scheme ` 10000@
Scheme (`) Benchmark (`)#
Additional Benchmark
(`)##Dec 31, 15 Last 1 Year 11.8360 8.20 9.83 7.27 10,820 10,983 10,727Dec 31, 14 Last 2 Years 10.8939 8.42 9.24 7.75 11,755 11,934 11,609Jan 29, 14 Since Inception 10.0000 8.84 9.67 8.03 12,806 13,094 12,532
B. Discrete 12 month Returns (%)Period Scheme
^Benchmark
#Additional
Benchmark ##
Dec 31, 15 To Dec 30, 16 8.20 9.83 7.27Dec 31, 14 To Dec 31, 15 8.65 8.66 8.22
^Past performance may or may not be sustained in the future. Returns greater than 1 year period are compounded annualized (CAGR). # CRISIL Short Term Bond Fund Index ## CRISIL 1 year T-Bill Index
HDFC FMP 372D FEBRUARY 2014 (1) NAV as on December 30, 2016 ` 12.8352
A. Cumulative PerformanceDate Period NAV
per Unit (`)
Scheme Returns
(%)^
Benchmark Returns
(%)#
Additional Benchmark
Returns (%) ##
Value of Investment of Scheme ` 10000@
Scheme (`) Benchmark (`)#
Additional Benchmark
(`)##Dec 31, 15 Last 1 Year 11.8333 8.47 9.83 7.27 10,847 10,983 10,727Dec 31, 14 Last 2 Years 10.8817 8.61 9.24 7.75 11,795 11,934 11,609Feb 04, 14 Since Inception 10.0000 8.98 9.67 8.05 12,835 13,076 12,523
B. Discrete 12 month Returns (%)Period Scheme
^Benchmark
#Additional
Benchmark ##
Dec 31, 15 To Dec 30, 16 8.47 9.83 7.27Dec 31, 14 To Dec 31, 15 8.74 8.66 8.22
^Past performance may or may not be sustained in the future. Returns greater than 1 year period are compounded annualized (CAGR). # CRISIL Short Term Bond Fund Index ## CRISIL 1 year T-Bill Index
Performance of dividend option under the schemes for the investors would be net of distribution tax as applicable. Load is not taken into consideration for computation of performance.@ shows the current value of ` 10,000/- invested at the beginning of a given period. n.A.: not Available
Performance of FMP schemes, being close-ended in nature, is not strictly comparable with that of open-ended schemes since the investment strategy for FMP schemes is primarily buy-and-hold whereas open-ended schemes are actively managed.
SCHEME PERFORMANCE - DIRECT PLAN - GROWTH OPTION (FUND MANAGER-WISE)ANIL BAMBOLI....CONTINUED

88 January 2017 Intouch mutually
HDFC FMP 372D JANUARY 2014 (1) NAV as on December 30, 2016 ` 12.7669
A. Cumulative PerformanceDate Period NAV
per Unit (`)
Scheme Returns
(%)^
Benchmark Returns
(%)#
Additional Benchmark
Returns (%) ##
Value of Investment of Scheme ` 10000@
Scheme (`) Benchmark (`)#
Additional Benchmark
(`)##Dec 31, 15 Last 1 Year 11.8065 8.13 9.83 7.27 10,813 10,983 10,727Dec 31, 14 Last 2 Years 10.8886 8.28 9.24 7.75 11,725 11,934 11,609Jan 21, 14 Since Inception 10.0000 8.66 9.59 7.88 12,767 13,094 12,502
B. Discrete 12 month Returns (%)Period Scheme
^Benchmark
#Additional
Benchmark ##
Dec 31, 15 To Dec 30, 16 8.13 9.83 7.27Dec 31, 14 To Dec 31, 15 8.43 8.66 8.22
^Past performance may or may not be sustained in the future. Returns greater than 1 year period are compounded annualized (CAGR). # CRISIL Short Term Bond Fund Index ## CRISIL 1 year T-Bill Index
HDFC FMP 378D MARCH 2014 (1) NAV as on December 30, 2016 ` 12.6118
A. Cumulative PerformanceDate Period NAV
per Unit (`)
Scheme Returns
(%)^
Benchmark Returns
(%)#
Additional Benchmark
Returns (%) ##
Value of Investment of Scheme ` 10000@
Scheme (`) Benchmark (`)#
Additional Benchmark
(`)##Dec 31, 15 Last 1 Year 11.6003 8.72 9.83 7.27 10,872 10,983 10,727Dec 31, 14 Last 2 Years 10.7164 8.48 9.24 7.75 11,769 11,934 11,609Mar 26, 14 Since Inception 10.0000 8.75 9.60 8.00 12,612 12,887 12,373
B. Discrete 12 month Returns (%)Period Scheme
^Benchmark
#Additional
Benchmark ##
Dec 31, 15 To Dec 30, 16 8.72 9.83 7.27Dec 31, 14 To Dec 31, 15 8.25 8.66 8.22
^Past performance may or may not be sustained in the future. Returns greater than 1 year period are compounded annualized (CAGR). # CRISIL Short Term Bond Fund Index ## CRISIL 1 year T-Bill Index
HDFC FMP 384D MARCH 2014 (1) NAV as on December 30, 2016 ` 12.6341
A. Cumulative PerformanceDate Period NAV
per Unit (`)
Scheme Returns
(%)^
Benchmark Returns
(%)#
Additional Benchmark
Returns (%) ##
Value of Investment of Scheme ` 10000@
Scheme (`) Benchmark (`)#
Additional Benchmark
(`)##Dec 31, 15 Last 1 Year 11.6339 8.60 9.83 7.27 10,860 10,983 10,727Dec 31, 14 Last 2 Years 10.7531 8.39 9.24 7.75 11,749 11,934 11,609Mar 20, 14 Since Inception 10.0000 8.76 9.63 8.01 12,634 12,915 12,393
B. Discrete 12 month Returns (%)Period Scheme
^Benchmark
#Additional
Benchmark ##
Dec 31, 15 To Dec 30, 16 8.60 9.83 7.27Dec 31, 14 To Dec 31, 15 8.19 8.66 8.22
^Past performance may or may not be sustained in the future. Returns greater than 1 year period are compounded annualized (CAGR). # CRISIL Short Term Bond Fund Index ## CRISIL 1 year T-Bill Index
HDFC FMP 390D MARCH 2014 (1) NAV as on December 30, 2016 ` 12.6662
A. Cumulative PerformanceDate Period NAV
per Unit (`)
Scheme Returns
(%)^
Benchmark Returns
(%)#
Additional Benchmark
Returns (%) ##
Value of Investment of Scheme ` 10000@
Scheme (`) Benchmark (`)#
Additional Benchmark
(`)##Dec 31, 15 Last 1 Year 11.6634 8.60 9.83 7.27 10,860 10,983 10,727Dec 31, 14 Last 2 Years 10.7718 8.44 9.24 7.75 11,759 11,934 11,609Mar 14, 14 Since Inception 10.0000 8.81 9.65 8.03 12,666 12,943 12,414
B. Discrete 12 month Returns (%)Period Scheme
^Benchmark
#Additional
Benchmark ##
Dec 31, 15 To Dec 30, 16 8.60 9.83 7.27Dec 31, 14 To Dec 31, 15 8.28 8.66 8.22
^Past performance may or may not be sustained in the future. Returns greater than 1 year period are compounded annualized (CAGR). # CRISIL Short Term Bond Fund Index ## CRISIL 1 year T-Bill Index
HDFC FMP 400D MARCH 2014 (1) NAV as on December 30, 2016 ` 12.6849
A. Cumulative PerformanceDate Period NAV
per Unit (`)
Scheme Returns
(%)^
Benchmark Returns
(%)#
Additional Benchmark
Returns (%) ##
Value of Investment of Scheme ` 10000@
Scheme (`) Benchmark (`)#
Additional Benchmark
(`)##Dec 31, 15 Last 1 Year 11.6813 8.59 9.83 7.27 10,859 10,983 10,727Dec 31, 14 Last 2 Years 10.7896 8.43 9.24 7.75 11,757 11,934 11,609Mar 11, 14 Since Inception 10.0000 8.84 9.66 8.05 12,685 12,955 12,429
B. Discrete 12 month Returns (%)Period Scheme
^Benchmark
#Additional
Benchmark ##
Dec 31, 15 To Dec 30, 16 8.59 9.83 7.27Dec 31, 14 To Dec 31, 15 8.26 8.66 8.22
^Past performance may or may not be sustained in the future. Returns greater than 1 year period are compounded annualized (CAGR). # CRISIL Short Term Bond Fund Index ## CRISIL 1 year T-Bill Index
HDFC FMP 434D FEBRUARY 2014 (1) NAV as on December 30, 2016 ` 12.7854
A. Cumulative PerformanceDate Period NAV
per Unit (`)
Scheme Returns
(%)^
Benchmark Returns
(%)#
Additional Benchmark
Returns (%) ##
Value of Investment of Scheme ` 10000@
Scheme (`) Benchmark (`)#
Additional Benchmark
(`)##Dec 31, 15 Last 1 Year 11.7825 8.51 9.83 7.27 10,851 10,983 10,727Dec 31, 14 Last 2 Years 10.8349 8.63 9.24 7.75 11,800 11,934 11,609Feb 25, 14 Since Inception 10.0000 9.02 9.73 8.05 12,785 13,024 12,465
B. Discrete 12 month Returns (%)Period Scheme
^Benchmark
#Additional
Benchmark ##
Dec 31, 15 To Dec 30, 16 8.51 9.83 7.27Dec 31, 14 To Dec 31, 15 8.75 8.66 8.22
^Past performance may or may not be sustained in the future. Returns greater than 1 year period are compounded annualized (CAGR). # CRISIL Short Term Bond Fund Index ## CRISIL 1 year T-Bill Index
Performance of dividend option under the schemes for the investors would be net of distribution tax as applicable. Load is not taken into consideration for computation of performance.@ shows the current value of ` 10,000/- invested at the beginning of a given period. n.A.: not Available
SCHEME PERFORMANCE - DIRECT PLAN - GROWTH OPTION (FUND MANAGER-WISE)ANIL BAMBOLI....CONTINUED
Performance of FMP schemes, being close-ended in nature, is not strictly comparable with that of open-ended schemes since the investment strategy for FMP schemes is primarily buy-and-hold whereas open-ended schemes are actively managed.

Intouch mutually January 2017 89
ANIL BAMBOLI....CONTINUED
SCHEME PERFORMANCE - DIRECT PLAN - GROWTH OPTION (FUND MANAGER-WISE)
Performance of dividend option under the schemes for the investors would be net of distribution tax as applicable. Load is not taken into consideration for computation of performance.@ shows the current value of ` 10,000/- invested at the beginning of a given period. n.A.: not Available
HDFC FMP 435D MARCH 2014 (1) NAV as on December 30, 2016 ` 12.7544
A. Cumulative PerformanceDate Period NAV
per Unit (`)
Scheme Returns
(%)^
Benchmark Returns
(%)#
Additional Benchmark
Returns (%) ##
Value of Investment of Scheme ` 10000@
Scheme (`) Benchmark (`)#
Additional Benchmark
(`)##Dec 31, 15 Last 1 Year 11.7668 8.39 9.83 7.27 10,839 10,983 10,727Dec 31, 14 Last 2 Years 10.8095 8.62 9.24 7.75 11,799 11,934 11,609Mar 06, 14 Since Inception 10.0000 9.00 9.71 8.06 12,754 12,990 12,446
B. Discrete 12 month Returns (%)Period Scheme
^Benchmark
#Additional
Benchmark ##
Dec 31, 15 To Dec 30, 16 8.39 9.83 7.27Dec 31, 14 To Dec 31, 15 8.86 8.66 8.22
^Past performance may or may not be sustained in the future. Returns greater than 1 year period are compounded annualized (CAGR). # CRISIL Short Term Bond Fund Index ## CRISIL 1 year T-Bill Index
HDFC FMP 441D FEBRUARY 2014 (1) NAV as on December 30, 2016 ` 12.8150
A. Cumulative PerformanceDate Period NAV
per Unit (`)
Scheme Returns
(%)^
Benchmark Returns
(%)#
Additional Benchmark
Returns (%) ##
Value of Investment of Scheme ` 10000@
Scheme (`) Benchmark (`)#
Additional Benchmark
(`)##Dec 31, 15 Last 1 Year 11.8118 8.49 9.83 7.27 10,849 10,983 10,727Dec 31, 14 Last 2 Years 10.8550 8.65 9.24 7.75 11,806 11,934 11,609Feb 18, 14 Since Inception 10.0000 9.04 9.71 8.07 12,815 13,041 12,491
B. Discrete 12 month Returns (%)Period Scheme
^Benchmark
#Additional
Benchmark ##
Dec 31, 15 To Dec 30, 16 8.49 9.83 7.27Dec 31, 14 To Dec 31, 15 8.81 8.66 8.22
^Past performance may or may not be sustained in the future. Returns greater than 1 year period are compounded annualized (CAGR). # CRISIL Short Term Bond Fund Index ## CRISIL 1 year T-Bill Index
HDFC FMP 447D FEBRUARY 2014 (1) NAV as on December 30, 2016 ` 12.8075
A. Cumulative PerformanceDate Period NAV
per Unit (`)
Scheme Returns
(%)^
Benchmark Returns
(%)#
Additional Benchmark
Returns (%) ##
Value of Investment of Scheme ` 10000@
Scheme (`) Benchmark (`)#
Additional Benchmark
(`)##Dec 31, 15 Last 1 Year 11.8109 8.44 9.83 7.27 10,844 10,983 10,727Dec 31, 14 Last 2 Years 10.8671 8.56 9.24 7.75 11,786 11,934 11,609Feb 12, 14 Since Inception 10.0000 8.96 9.70 8.08 12,808 13,057 12,509
B. Discrete 12 month Returns (%)Period Scheme
^Benchmark
#Additional
Benchmark ##
Dec 31, 15 To Dec 30, 16 8.44 9.83 7.27Dec 31, 14 To Dec 31, 15 8.68 8.66 8.22
^Past performance may or may not be sustained in the future. Returns greater than 1 year period are compounded annualized (CAGR). # CRISIL Short Term Bond Fund Index ## CRISIL 1 year T-Bill Index
HDFC FMP 453D FEBRUARY 2014 (1) NAV as on December 30, 2016 ` 12.8253
A. Cumulative PerformanceDate Period NAV
per Unit (`)
Scheme Returns
(%)^
Benchmark Returns
(%)#
Additional Benchmark
Returns (%) ##
Value of Investment of Scheme ` 10000@
Scheme (`) Benchmark (`)#
Additional Benchmark
(`)##Dec 31, 15 Last 1 Year 11.8263 8.45 9.83 7.27 10,845 10,983 10,727Dec 31, 14 Last 2 Years 10.8730 8.61 9.24 7.75 11,796 11,934 11,609Feb 06, 14 Since Inception 10.0000 8.96 9.67 8.06 12,825 13,067 12,521
B. Discrete 12 month Returns (%)Period Scheme
^Benchmark
#Additional
Benchmark ##
Dec 31, 15 To Dec 30, 16 8.45 9.83 7.27Dec 31, 14 To Dec 31, 15 8.77 8.66 8.22
^Past performance may or may not be sustained in the future. Returns greater than 1 year period are compounded annualized (CAGR). # CRISIL Short Term Bond Fund Index ## CRISIL 1 year T-Bill Index
HDFC FMP 472D JANUARY 2014 (1) NAV as on December 30, 2016 ` 12.8003
A. Cumulative PerformanceDate Period NAV
per Unit (`)
Scheme Returns
(%)^
Benchmark Returns
(%)#
Additional Benchmark
Returns (%) ##
Value of Investment of Scheme ` 10000@
Scheme (`) Benchmark (`)#
Additional Benchmark
(`)##Dec 31, 15 Last 1 Year 11.8234 8.26 9.83 7.27 10,826 10,983 10,727Dec 31, 14 Last 2 Years 10.8938 8.40 9.24 7.75 11,750 11,934 11,609Jan 28, 14 Since Inception 10.0000 8.81 9.66 8.01 12,800 13,095 12,527
B. Discrete 12 month Returns (%)Period Scheme
^Benchmark
#Additional
Benchmark ##
Dec 31, 15 To Dec 30, 16 8.26 9.83 7.27Dec 31, 14 To Dec 31, 15 8.53 8.66 8.22
^Past performance may or may not be sustained in the future. Returns greater than 1 year period are compounded annualized (CAGR). # CRISIL Short Term Bond Fund Index ## CRISIL 1 year T-Bill Index
HDFC FMP 478D JANUARY 2014 (1) NAV as on December 30, 2016 ` 12.8471
A. Cumulative PerformanceDate Period NAV
per Unit (`)
Scheme Returns
(%)^
Benchmark Returns
(%)#
Additional Benchmark
Returns (%) ##
Value of Investment of Scheme ` 10000@
Scheme (`) Benchmark (`)#
Additional Benchmark
(`)##Dec 31, 15 Last 1 Year 11.8473 8.44 9.83 7.27 10,844 10,983 10,727Dec 31, 14 Last 2 Years 10.9016 8.56 9.24 7.75 11,785 11,934 11,609Jan 24, 14 Since Inception 10.0000 8.91 9.63 7.98 12,847 13,096 12,525
B. Discrete 12 month Returns (%)Period Scheme
^Benchmark
#Additional
Benchmark ##
Dec 31, 15 To Dec 30, 16 8.44 9.83 7.27Dec 31, 14 To Dec 31, 15 8.67 8.66 8.22
^Past performance may or may not be sustained in the future. Returns greater than 1 year period are compounded annualized (CAGR). # CRISIL Short Term Bond Fund Index ## CRISIL 1 year T-Bill Index
Performance of FMP schemes, being close-ended in nature, is not strictly comparable with that of open-ended schemes since the investment strategy for FMP schemes is primarily buy-and-hold whereas open-ended schemes are actively managed.

90 January 2017 Intouch mutually
SCHEME PERFORMANCE - DIRECT PLAN - GROWTH OPTION (FUND MANAGER-WISE)
Performance of dividend option under the schemes for the investors would be net of distribution tax as applicable. Load is not taken into consideration for computation of performance.@ shows the current value of ` 10,000/- invested at the beginning of a given period. n.A.: not Available
HDFC FMP 491D JANUARY 2014 (1) NAV as on December 30, 2016 ` 12.8822
A. Cumulative PerformanceDate Period NAV
per Unit (`)
Scheme Returns
(%)^
Benchmark Returns
(%)#
Additional Benchmark
Returns (%) ##
Value of Investment of Scheme ` 10000@
Scheme (`) Benchmark (`)#
Additional Benchmark
(`)##Dec 31, 15 Last 1 Year 11.8909 8.34 9.83 7.27 10,834 10,983 10,727Dec 31, 14 Last 2 Years 10.9482 8.47 9.24 7.75 11,767 11,934 11,609Jan 09, 14 Since Inception 10.0000 8.88 9.65 7.99 12,882 13,152 12,569
B. Discrete 12 month Returns (%)Period Scheme
^Benchmark
#Additional
Benchmark ##
Dec 31, 15 To Dec 30, 16 8.34 9.83 7.27Dec 31, 14 To Dec 31, 15 8.61 8.66 8.22
^Past performance may or may not be sustained in the future. Returns greater than 1 year period are compounded annualized (CAGR). # CRISIL Short Term Bond Fund Index ## CRISIL 1 year T-Bill Index
HDFC FMP 793D FEBRUARY 2014 (1) NAV as on December 30, 2016 ` 13.1129
A. Cumulative PerformanceDate Period NAV
per Unit (`)
Scheme Returns
(%)^
Benchmark Returns
(%)#
Additional Benchmark
Returns (%) ##
Value of Investment of Scheme ` 10000@
Scheme (`) Benchmark (`)#
Additional Benchmark
(`)##Dec 31, 15 Last 1 Year 12.1639 7.80 9.83 7.27 10,780 10,983 10,727Dec 31, 14 Last 2 Years 10.9979 9.19 9.24 7.75 11,923 11,934 11,609Feb 26, 14 Since Inception 10.0000 10.00 9.73 8.05 13,113 13,021 12,464
B. Discrete 12 month Returns (%)Period Scheme
^Benchmark
#Additional
Benchmark ##
Dec 31, 15 To Dec 30, 16 7.80 9.83 7.27Dec 31, 14 To Dec 31, 15 10.60 8.66 8.22
^Past performance may or may not be sustained in the future. Returns greater than 1 year period are compounded annualized (CAGR). # CRISIL Short Term Bond Fund Index ## CRISIL 1 year T-Bill Index
HDFC FMP 840D JANUARY 2014 (1) NAV as on December 30, 2016 ` 12.9871
A. Cumulative PerformanceDate Period NAV
per Unit (`)
Scheme Returns
(%)^
Benchmark Returns
(%)#
Additional Benchmark
Returns (%) ##
Value of Investment of Scheme ` 10000@
Scheme (`) Benchmark (`)#
Additional Benchmark
(`)##Dec 31, 15 Last 1 Year 12.0275 7.98 9.83 7.27 10,798 10,983 10,727Dec 31, 14 Last 2 Years 11.0057 8.63 9.24 7.75 11,800 11,934 11,609Feb 06, 14 Since Inception 10.0000 9.44 9.67 8.06 12,987 13,067 12,521
B. Discrete 12 month Returns (%)Period Scheme
^Benchmark
#Additional
Benchmark ##
Dec 31, 15 To Dec 30, 16 7.98 9.83 7.27Dec 31, 14 To Dec 31, 15 9.28 8.66 8.22
^Past performance may or may not be sustained in the future. Returns greater than 1 year period are compounded annualized (CAGR). # CRISIL Short Term Bond Fund Index ## CRISIL 1 year T-Bill Index
HDFC FMP 1113D AUGUST 2014 (1) NAV as on December 30, 2016 ` 12.4313
A. Cumulative PerformanceDate Period NAV
per Unit (`)
Scheme Returns
(%)^
Benchmark Returns
(%)#
Additional Benchmark
Returns (%) ##
Value of Investment of Scheme ` 10000@
Scheme (`) Benchmark (`)#
Additional Benchmark
(`)##Dec 31, 15 Last 1 Year 11.4062 8.99 12.93 7.27 10,899 11,293 10,727Dec 31, 14 Last 2 Years 10.4477 9.08 10.76 7.75 11,899 12,268 11,609Aug 27, 14 Since Inception 10.0000 9.72 11.90 7.93 12,431 13,017 11,959
B. Discrete 12 month Returns (%)Period Scheme
^Benchmark
#Additional
Benchmark ##
Dec 31, 15 To Dec 30, 16 8.99 12.93 7.27Dec 31, 14 To Dec 31, 15 9.17 8.63 8.22
^Past performance may or may not be sustained in the future. Returns greater than 1 year period are compounded annualized (CAGR). # CRISIL Composite Bond Fund Index ## CRISIL 1 year T-Bill Index
HDFC FMP 1099D AUGUST 2014 (1) NAV as on December 30, 2016 ` 12.4119
A. Cumulative PerformanceDate Period NAV
per Unit (`)
Scheme Returns
(%)^
Benchmark Returns
(%)#
Additional Benchmark
Returns (%) ##
Value of Investment of Scheme ` 10000@
Scheme (`) Benchmark (`)#
Additional Benchmark
(`)##Dec 31, 15 Last 1 Year 11.3886 8.99 12.93 7.27 10,899 11,293 10,727Dec 31, 14 Last 2 Years 10.4243 9.12 10.76 7.75 11,907 12,268 11,609Sep 05, 14 Since Inception 10.0000 9.76 11.89 7.92 12,412 12,980 11,934
B. Discrete 12 month Returns (%)Period Scheme
^Benchmark
#Additional
Benchmark ##
Dec 31, 15 To Dec 30, 16 8.99 12.93 7.27Dec 31, 14 To Dec 31, 15 9.25 8.63 8.22
^Past performance may or may not be sustained in the future. Returns greater than 1 year period are compounded annualized (CAGR). # CRISIL Composite Bond Fund Index ## CRISIL 1 year T-Bill Index
HDFC FMP 1134D SEPTEMBER 2014 (1) NAV as on December 30, 2016 ` 12.5058
A. Cumulative PerformanceDate Period NAV
per Unit (`)
Scheme Returns
(%)^
Benchmark Returns
(%)#
Additional Benchmark
Returns (%) ##
Value of Investment of Scheme ` 10000@
Scheme (`) Benchmark (`)#
Additional Benchmark
(`)##Dec 31, 15 Last 1 Year 11.3946 9.75 12.93 7.27 10,975 11,293 10,727Dec 31, 14 Last 2 Years 10.3886 9.72 10.76 7.75 12,038 12,268 11,609Sep 19, 14 Since Inception 10.0000 10.29 11.81 7.92 12,506 12,903 11,900
B. Discrete 12 month Returns (%)Period Scheme
^Benchmark
#Additional
Benchmark ##
Dec 31, 15 To Dec 30, 16 9.75 12.93 7.27Dec 31, 14 To Dec 31, 15 9.68 8.63 8.22
^Past performance may or may not be sustained in the future. Returns greater than 1 year period are compounded annualized (CAGR). # CRISIL Composite Bond Fund Index ## CRISIL 1 year T-Bill Index
ANIL BAMBOLI....CONTINUED
Performance of FMP schemes, being close-ended in nature, is not strictly comparable with that of open-ended schemes since the investment strategy for FMP schemes is primarily buy-and-hold whereas open-ended schemes are actively managed.
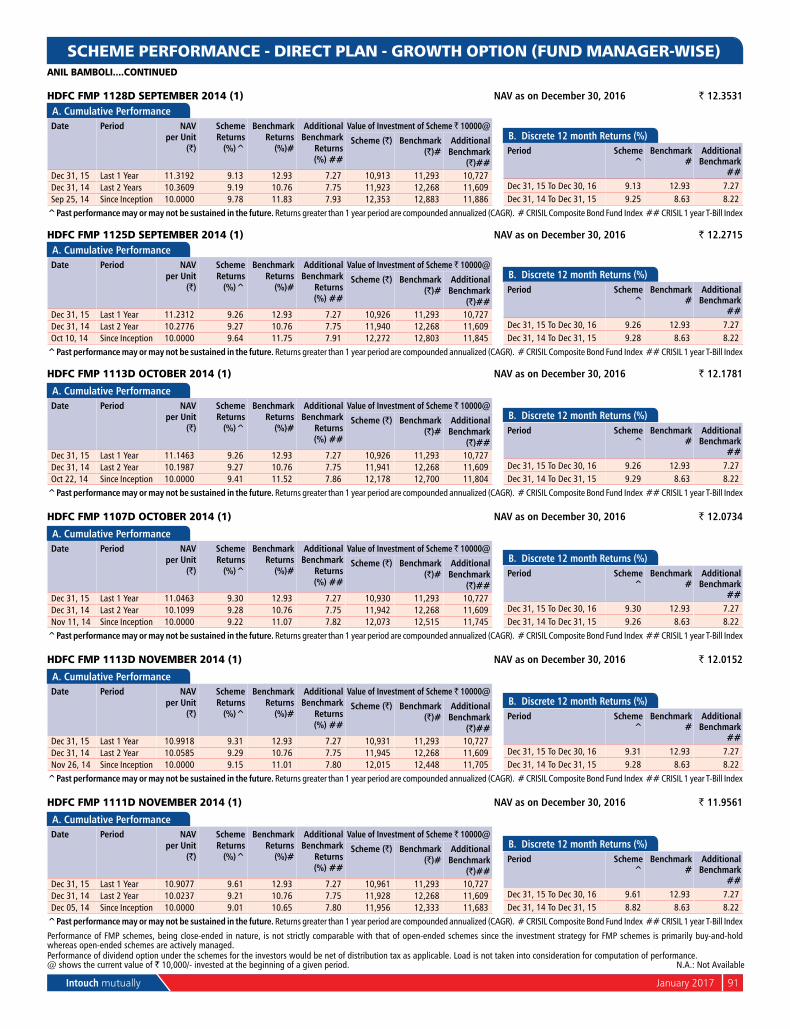
Intouch mutually January 2017 91
SCHEME PERFORMANCE - DIRECT PLAN - GROWTH OPTION (FUND MANAGER-WISE)
HDFC FMP 1128D SEPTEMBER 2014 (1) NAV as on December 30, 2016 ` 12.3531A. Cumulative PerformanceDate Period NAV
per Unit (`)
Scheme Returns
(%)^
Benchmark Returns
(%)#
Additional Benchmark
Returns (%) ##
Value of Investment of Scheme ` 10000@
Scheme (`) Benchmark (`)#
Additional Benchmark
(`)##Dec 31, 15 Last 1 Year 11.3192 9.13 12.93 7.27 10,913 11,293 10,727Dec 31, 14 Last 2 Years 10.3609 9.19 10.76 7.75 11,923 12,268 11,609Sep 25, 14 Since Inception 10.0000 9.78 11.83 7.93 12,353 12,883 11,886
B. Discrete 12 month Returns (%)Period Scheme
^Benchmark
#Additional
Benchmark ##
Dec 31, 15 To Dec 30, 16 9.13 12.93 7.27Dec 31, 14 To Dec 31, 15 9.25 8.63 8.22
^Past performance may or may not be sustained in the future. Returns greater than 1 year period are compounded annualized (CAGR). # CRISIL Composite Bond Fund Index ## CRISIL 1 year T-Bill Index
HDFC FMP 1125D SEPTEMBER 2014 (1) NAV as on December 30, 2016 ` 12.2715A. Cumulative PerformanceDate Period NAV
per Unit (`)
Scheme Returns
(%)^
Benchmark Returns
(%)#
Additional Benchmark
Returns (%) ##
Value of Investment of Scheme ` 10000@
Scheme (`) Benchmark (`)#
Additional Benchmark
(`)##Dec 31, 15 Last 1 Year 11.2312 9.26 12.93 7.27 10,926 11,293 10,727Dec 31, 14 Last 2 Year 10.2776 9.27 10.76 7.75 11,940 12,268 11,609Oct 10, 14 Since Inception 10.0000 9.64 11.75 7.91 12,272 12,803 11,845
B. Discrete 12 month Returns (%)Period Scheme
^Benchmark
#Additional
Benchmark ##
Dec 31, 15 To Dec 30, 16 9.26 12.93 7.27Dec 31, 14 To Dec 31, 15 9.28 8.63 8.22
^Past performance may or may not be sustained in the future. Returns greater than 1 year period are compounded annualized (CAGR). # CRISIL Composite Bond Fund Index ## CRISIL 1 year T-Bill Index
HDFC FMP 1113D OCTOBER 2014 (1) NAV as on December 30, 2016 ` 12.1781
A. Cumulative PerformanceDate Period NAV
per Unit (`)
Scheme Returns
(%)^
Benchmark Returns
(%)#
Additional Benchmark
Returns (%) ##
Value of Investment of Scheme ` 10000@
Scheme (`) Benchmark (`)#
Additional Benchmark
(`)##Dec 31, 15 Last 1 Year 11.1463 9.26 12.93 7.27 10,926 11,293 10,727Dec 31, 14 Last 2 Year 10.1987 9.27 10.76 7.75 11,941 12,268 11,609Oct 22, 14 Since Inception 10.0000 9.41 11.52 7.86 12,178 12,700 11,804
B. Discrete 12 month Returns (%)Period Scheme
^Benchmark
#Additional
Benchmark ##
Dec 31, 15 To Dec 30, 16 9.26 12.93 7.27Dec 31, 14 To Dec 31, 15 9.29 8.63 8.22
^Past performance may or may not be sustained in the future. Returns greater than 1 year period are compounded annualized (CAGR). # CRISIL Composite Bond Fund Index ## CRISIL 1 year T-Bill Index
HDFC FMP 1107D OCTOBER 2014 (1) NAV as on December 30, 2016 ` 12.0734
A. Cumulative PerformanceDate Period NAV
per Unit (`)
Scheme Returns
(%)^
Benchmark Returns
(%)#
Additional Benchmark
Returns (%) ##
Value of Investment of Scheme ` 10000@
Scheme (`) Benchmark (`)#
Additional Benchmark
(`)##Dec 31, 15 Last 1 Year 11.0463 9.30 12.93 7.27 10,930 11,293 10,727Dec 31, 14 Last 2 Year 10.1099 9.28 10.76 7.75 11,942 12,268 11,609nov 11, 14 Since Inception 10.0000 9.22 11.07 7.82 12,073 12,515 11,745
B. Discrete 12 month Returns (%)Period Scheme
^Benchmark
#Additional
Benchmark ##
Dec 31, 15 To Dec 30, 16 9.30 12.93 7.27Dec 31, 14 To Dec 31, 15 9.26 8.63 8.22
^Past performance may or may not be sustained in the future. Returns greater than 1 year period are compounded annualized (CAGR). # CRISIL Composite Bond Fund Index ## CRISIL 1 year T-Bill Index
HDFC FMP 1113D NOVEMBER 2014 (1) NAV as on December 30, 2016 ` 12.0152
A. Cumulative PerformanceDate Period NAV
per Unit (`)
Scheme Returns
(%)^
Benchmark Returns
(%)#
Additional Benchmark
Returns (%) ##
Value of Investment of Scheme ` 10000@
Scheme (`) Benchmark (`)#
Additional Benchmark
(`)##Dec 31, 15 Last 1 Year 10.9918 9.31 12.93 7.27 10,931 11,293 10,727Dec 31, 14 Last 2 Year 10.0585 9.29 10.76 7.75 11,945 12,268 11,609nov 26, 14 Since Inception 10.0000 9.15 11.01 7.80 12,015 12,448 11,705
B. Discrete 12 month Returns (%)Period Scheme
^Benchmark
#Additional
Benchmark ##
Dec 31, 15 To Dec 30, 16 9.31 12.93 7.27Dec 31, 14 To Dec 31, 15 9.28 8.63 8.22
^Past performance may or may not be sustained in the future. Returns greater than 1 year period are compounded annualized (CAGR). # CRISIL Composite Bond Fund Index ## CRISIL 1 year T-Bill Index
HDFC FMP 1111D NOVEMBER 2014 (1) NAV as on December 30, 2016 ` 11.9561
A. Cumulative PerformanceDate Period NAV
per Unit (`)
Scheme Returns
(%)^
Benchmark Returns
(%)#
Additional Benchmark
Returns (%) ##
Value of Investment of Scheme ` 10000@
Scheme (`) Benchmark (`)#
Additional Benchmark
(`)##Dec 31, 15 Last 1 Year 10.9077 9.61 12.93 7.27 10,961 11,293 10,727Dec 31, 14 Last 2 Year 10.0237 9.21 10.76 7.75 11,928 12,268 11,609Dec 05, 14 Since Inception 10.0000 9.01 10.65 7.80 11,956 12,333 11,683
B. Discrete 12 month Returns (%)Period Scheme
^Benchmark
#Additional
Benchmark ##
Dec 31, 15 To Dec 30, 16 9.61 12.93 7.27Dec 31, 14 To Dec 31, 15 8.82 8.63 8.22
^Past performance may or may not be sustained in the future. Returns greater than 1 year period are compounded annualized (CAGR). # CRISIL Composite Bond Fund Index ## CRISIL 1 year T-Bill Index
ANIL BAMBOLI....CONTINUED
Performance of dividend option under the schemes for the investors would be net of distribution tax as applicable. Load is not taken into consideration for computation of performance.@ shows the current value of ` 10,000/- invested at the beginning of a given period. n.A.: not Available
Performance of FMP schemes, being close-ended in nature, is not strictly comparable with that of open-ended schemes since the investment strategy for FMP schemes is primarily buy-and-hold whereas open-ended schemes are actively managed.

92 January 2017 Intouch mutually
SCHEME PERFORMANCE - DIRECT PLAN - GROWTH OPTION (FUND MANAGER-WISE)
HDFC FMP 1107D DECEMBER 2014 (1) NAV as on December 30, 2016 ` 11.8795A. Cumulative PerformanceDate Period NAV
per Unit (`)
Scheme Returns
(%)^
Benchmark Returns
(%)#
Additional Benchmark
Returns (%) ##
Value of Investment of Scheme ` 10000@
Scheme (`) Benchmark (`)#
Additional Benchmark
(`)##Dec 31, 15 Last 1 Year 10.8882 9.10 12.93 7.27 10,910 11,293 10,727Jan 06, 15 Since Inception 10.0000 9.07 10.90 7.75 11,880 12,278 11,597
B. Discrete 12 month Returns (%)Period Scheme
^Benchmark
#Additional
Benchmark ##
Dec 31, 15 To Dec 30, 16 9.10 12.93 7.27^Past performance may or may not be sustained in the future. Returns greater than 1 year period are compounded annualized (CAGR). # CRISIL Composite Bond Fund Index ## CRISIL 1 year T-Bill Index
HDFC FMP 1115D JANUARY 2015 (1) NAV as on December 30, 2016 ` 11.8244A. Cumulative PerformanceDate Period NAV
per Unit (`)
Scheme Returns
(%)^
Benchmark Returns
(%)#
Additional Benchmark
Returns (%) ##
Value of Investment of Scheme ` 10000@
Scheme (`) Benchmark (`)#
Additional Benchmark
(`)##Dec 31, 15 Last 1 Year 10.8208 9.27 12.93 7.27 10,927 11,293 10,727Jan 14, 15 Since Inception 10.0000 8.92 10.64 7.72 11,824 12,193 11,570
B. Discrete 12 month Returns (%)Period Scheme
^Benchmark
#Additional
Benchmark ##
Dec 31, 15 To Dec 30, 16 9.27 12.93 7.27^Past performance may or may not be sustained in the future. Returns greater than 1 year period are compounded annualized (CAGR). # CRISIL Composite Bond Fund Index ## CRISIL 1 year T-Bill Index
HDFC FMP 1134D July 2015 (1) NAV as on December 30, 2016 ` 11.4034A. Cumulative PerformanceDate Period NAV
per Unit (`)
Scheme Returns
(%)^
Benchmark Returns
(%)#
Additional Benchmark
Returns (%) ##
Value of Investment of Scheme ` 10000@
Scheme (`) Benchmark (`)#
Additional Benchmark
(`)##Dec 31, 15 Last 1 Year 10.3802 9.86 12.93 7.27 10,986 11,293 10,727Jul 15, 15 Since Inception 10.0000 9.39 11.90 7.45 11,403 11,788 11,109
B. Discrete 12 month Returns (%)Period Scheme
^Benchmark
#Additional
Benchmark ##
Dec 31, 15 To Dec 30, 16 9.86 12.93 7.27^Past performance may or may not be sustained in the future. Returns greater than 1 year period are compounded annualized (CAGR). # CRISIL Composite Bond Fund Index ## CRISIL 1 year T-Bill Index
HDFC FMP 1126D July 2015 (1) NAV as on December 30, 2016 ` 11.3693A. Cumulative PerformanceDate Period NAV
per Unit (`)
Scheme Returns
(%)^
Benchmark Returns
(%)#
Additional Benchmark
Returns (%) ##
Value of Investment of Scheme ` 10000@
Scheme (`) Benchmark (`)#
Additional Benchmark
(`)##Dec 31, 15 Last 1 Year 10.3558 9.79 12.93 7.27 10,979 11,293 10,727Jul 23, 15 Since Inception 10.0000 9.31 11.88 7.46 11,369 11,755 11,092
B. Discrete 12 month Returns (%)Period Scheme
^Benchmark
#Additional
Benchmark ##
Dec 31, 15 To Dec 30, 16 9.79 12.93 7.27^Past performance may or may not be sustained in the future. Returns greater than 1 year period are compounded annualized (CAGR). # CRISIL Composite Bond Fund Index ## CRISIL 1 year T-Bill Index
HDFC FMP 1141D July 2015 (1) NAV as on December 30, 2016 ` 11.3157A. Cumulative PerformanceDate Period NAV
per Unit (`)
Scheme Returns
(%)^
Benchmark Returns
(%)#
Additional Benchmark
Returns (%) ##
Value of Investment of Scheme ` 10000@
Scheme (`) Benchmark (`)#
Additional Benchmark
(`)##Dec 31, 15 Last 1 Year 10.3125 9.73 12.93 7.27 10,973 11,293 10,727Aug 06, 15 Since Inception 10.0000 9.21 11.81 7.46 11,316 11,695 11,062
B. Discrete 12 month Returns (%)Period Scheme
^Benchmark
#Additional
Benchmark ##
Dec 31, 15 To Dec 30, 16 9.73 12.93 7.27^Past performance may or may not be sustained in the future. Returns greater than 1 year period are compounded annualized (CAGR). # CRISIL Composite Bond Fund Index ## CRISIL 1 year T-Bill Index
HDFC FMP 1108D September 2015 (1) NAV as on December 30, 2016 ` 11.2238A. Cumulative PerformanceDate Period NAV
per Unit (`)
Scheme Returns
(%)^
Benchmark Returns
(%)#
Additional Benchmark
Returns (%) ##
Value of Investment of Scheme ` 10000@
Scheme (`) Benchmark (`)#
Additional Benchmark
(`)##Dec 31, 15 Last 1 Year 10.2168 9.86 12.93 7.27 10,986 11,293 10,727Sep 23, 15 Since Inception 10.0000 9.51 11.99 7.42 11,224 11,548 10,953
B. Discrete 12 month Returns (%)Period Scheme
^Benchmark
#Additional
Benchmark ##
Dec 31, 15 To Dec 30, 16 9.86 12.93 7.27^Past performance may or may not be sustained in the future. Returns greater than 1 year period are compounded annualized (CAGR). # CRISIL Composite Bond Fund Index ## CRISIL 1 year T-Bill Index
HDFC FMP 1105D October 2015 (1) NAV as on December 30, 2016 ` 11.1097A. Cumulative PerformanceDate Period NAV
per Unit (`)
Scheme Returns
(%)^
Benchmark Returns
(%)#
Additional Benchmark
Returns (%) ##
Value of Investment of Scheme ` 10000@
Scheme (`) Benchmark (`)#
Additional Benchmark
(`)##Dec 31, 15 Last 1 Year 10.1009 9.99 12.93 7.27 10,999 11,293 10,727Oct 15, 15 Since Inception 10.0000 9.08 11.31 7.16 11,110 11,385 10,874
B. Discrete 12 month Returns (%)Period Scheme
^Benchmark
#Additional
Benchmark ##
Dec 31, 15 To Dec 30, 16 9.99 12.93 7.27^Past performance may or may not be sustained in the future. Returns greater than 1 year period are compounded annualized (CAGR). # CRISIL Composite Bond Fund Index ## CRISIL 1 year T-Bill Index
Performance of dividend option under the schemes for the investors would be net of distribution tax as applicable. Load is not taken into consideration for computation of performance.@ shows the current value of ` 10,000/- invested at the beginning of a given period. n.A.: not Available
ANIL BAMBOLI....CONTINUED
Performance of FMP schemes, being close-ended in nature, is not strictly comparable with that of open-ended schemes since the investment strategy for FMP schemes is primarily buy-and-hold whereas open-ended schemes are actively managed.
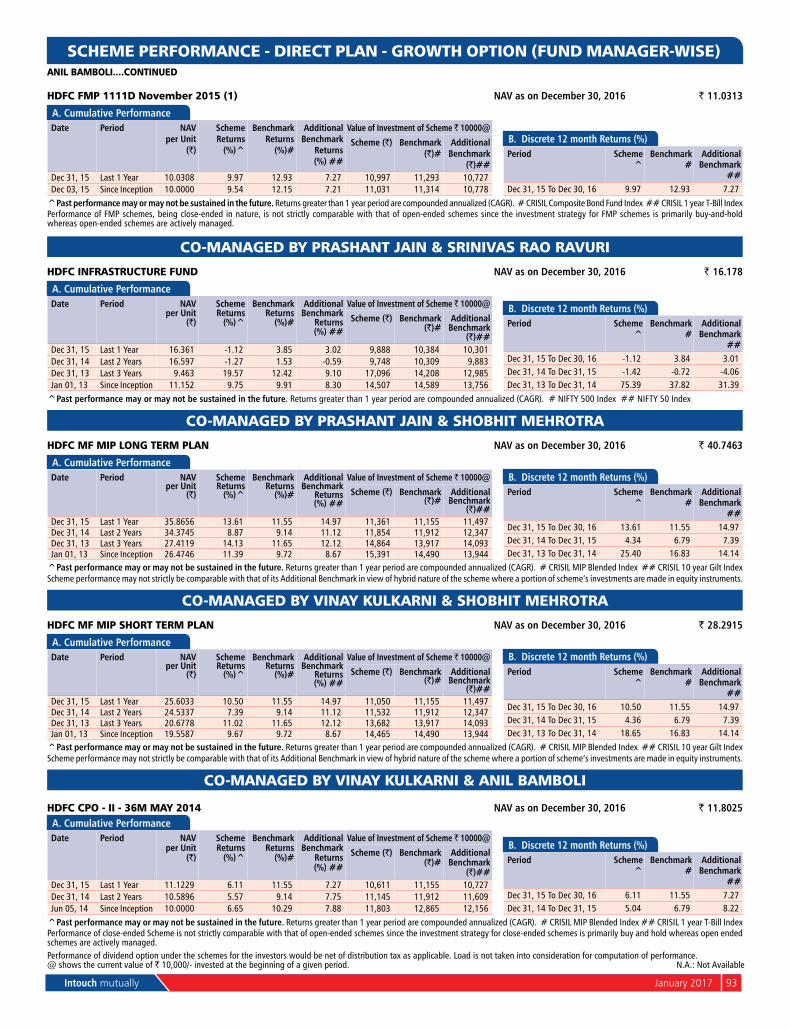
Intouch mutually January 2017 93
SCHEME PERFORMANCE - DIRECT PLAN - GROWTH OPTION (FUND MANAGER-WISE)ANIL BAMBOLI....CONTINUED
HDFC FMP 1111D November 2015 (1) NAV as on December 30, 2016 ` 11.0313
A. Cumulative PerformanceDate Period NAV
per Unit (`)
Scheme Returns
(%)^
Benchmark Returns
(%)#
Additional Benchmark
Returns (%) ##
Value of Investment of Scheme ` 10000@
Scheme (`) Benchmark (`)#
Additional Benchmark
(`)##Dec 31, 15 Last 1 Year 10.0308 9.97 12.93 7.27 10,997 11,293 10,727Dec 03, 15 Since Inception 10.0000 9.54 12.15 7.21 11,031 11,314 10,778
B. Discrete 12 month Returns (%)Period Scheme
^Benchmark
#Additional
Benchmark ##
Dec 31, 15 To Dec 30, 16 9.97 12.93 7.27^Past performance may or may not be sustained in the future. Returns greater than 1 year period are compounded annualized (CAGR). # CRISIL Composite Bond Fund Index ## CRISIL 1 year T-Bill IndexPerformance of FMP schemes, being close-ended in nature, is not strictly comparable with that of open-ended schemes since the investment strategy for FMP schemes is primarily buy-and-hold whereas open-ended schemes are actively managed.
CO-MANAGED BY PRASHANT JAIN & SRINIVAS RAO RAVURI
HDFC INFRASTRUCTURE FUND NAV as on December 30, 2016 ` 16.178
A. Cumulative PerformanceDate Period NAV
per Unit (`)
Scheme Returns
(%)^
Benchmark Returns
(%)#
Additional Benchmark
Returns (%) ##
Value of Investment of Scheme ` 10000@
Scheme (`) Benchmark (`)#
Additional Benchmark
(`)##Dec 31, 15 Last 1 Year 16.361 -1.12 3.85 3.02 9,888 10,384 10,301Dec 31, 14 Last 2 Years 16.597 -1.27 1.53 -0.59 9,748 10,309 9,883Dec 31, 13 Last 3 Years 9.463 19.57 12.42 9.10 17,096 14,208 12,985Jan 01, 13 Since Inception 11.152 9.75 9.91 8.30 14,507 14,589 13,756
B. Discrete 12 month Returns (%) Period Scheme
^Benchmark
#Additional
Benchmark ##
Dec 31, 15 To Dec 30, 16 -1.12 3.84 3.01Dec 31, 14 To Dec 31, 15 -1.42 -0.72 -4.06Dec 31, 13 To Dec 31, 14 75.39 37.82 31.39
^Past performance may or may not be sustained in the future. Returns greater than 1 year period are compounded annualized (CAGR). # nIFTY 500 Index ## nIFTY 50 Index
CO-MANAGED BY PRASHANT JAIN & SHOBHIT MEHROTRA
HDFC MF MIP LONG TERM PLAN NAV as on December 30, 2016 ` 40.7463
A. Cumulative PerformanceDate Period NAV
per Unit (`)
Scheme Returns
(%)^
Benchmark Returns
(%)#
Additional Benchmark
Returns (%) ##
Value of Investment of Scheme ` 10000@
Scheme (`) Benchmark (`)#
Additional Benchmark
(`)##Dec 31, 15 Last 1 Year 35.8656 13.61 11.55 14.97 11,361 11,155 11,497Dec 31, 14 Last 2 Years 34.3745 8.87 9.14 11.12 11,854 11,912 12,347Dec 31, 13 Last 3 Years 27.4119 14.13 11.65 12.12 14,864 13,917 14,093Jan 01, 13 Since Inception 26.4746 11.39 9.72 8.67 15,391 14,490 13,944
B. Discrete 12 month Returns (%)Period Scheme
^Benchmark
#Additional
Benchmark ##
Dec 31, 15 To Dec 30, 16 13.61 11.55 14.97Dec 31, 14 To Dec 31, 15 4.34 6.79 7.39Dec 31, 13 To Dec 31, 14 25.40 16.83 14.14
^Past performance may or may not be sustained in the future. Returns greater than 1 year period are compounded annualized (CAGR). # CRISIL MIP Blended Index ## CRISIL 10 year Gilt IndexScheme performance may not strictly be comparable with that of its Additional Benchmark in view of hybrid nature of the scheme where a portion of scheme’s investments are made in equity instruments.
CO-MANAGED BY VINAY KULKARNI & SHOBHIT MEHROTRA
HDFC MF MIP SHORT TERM PLAN NAV as on December 30, 2016 ` 28.2915
A. Cumulative PerformanceDate Period NAV
per Unit (`)
Scheme Returns
(%)^
Benchmark Returns
(%)#
Additional Benchmark
Returns (%) ##
Value of Investment of Scheme ` 10000@
Scheme (`) Benchmark (`)#
Additional Benchmark
(`)##Dec 31, 15 Last 1 Year 25.6033 10.50 11.55 14.97 11,050 11,155 11,497Dec 31, 14 Last 2 Years 24.5337 7.39 9.14 11.12 11,532 11,912 12,347Dec 31, 13 Last 3 Years 20.6778 11.02 11.65 12.12 13,682 13,917 14,093Jan 01, 13 Since Inception 19.5587 9.67 9.72 8.67 14,465 14,490 13,944
B. Discrete 12 month Returns (%)Period Scheme
^Benchmark
#Additional
Benchmark ##
Dec 31, 15 To Dec 30, 16 10.50 11.55 14.97Dec 31, 14 To Dec 31, 15 4.36 6.79 7.39Dec 31, 13 To Dec 31, 14 18.65 16.83 14.14
^Past performance may or may not be sustained in the future. Returns greater than 1 year period are compounded annualized (CAGR). # CRISIL MIP Blended Index ## CRISIL 10 year Gilt IndexScheme performance may not strictly be comparable with that of its Additional Benchmark in view of hybrid nature of the scheme where a portion of scheme’s investments are made in equity instruments.
CO-MANAGED BY VINAY KULKARNI & ANIL BAMBOLI
HDFC CPO - II - 36M MAY 2014 NAV as on December 30, 2016 ` 11.8025A. Cumulative PerformanceDate Period NAV
per Unit (`)
Scheme Returns
(%)^
Benchmark Returns
(%)#
Additional Benchmark
Returns (%) ##
Value of Investment of Scheme ` 10000@
Scheme (`) Benchmark (`)#
Additional Benchmark
(`)##Dec 31, 15 Last 1 Year 11.1229 6.11 11.55 7.27 10,611 11,155 10,727Dec 31, 14 Last 2 Years 10.5896 5.57 9.14 7.75 11,145 11,912 11,609Jun 05, 14 Since Inception 10.0000 6.65 10.29 7.88 11,803 12,865 12,156
B. Discrete 12 month Returns (%)Period Scheme
^Benchmark
#Additional
Benchmark ##
Dec 31, 15 To Dec 30, 16 6.11 11.55 7.27Dec 31, 14 To Dec 31, 15 5.04 6.79 8.22
^Past performance may or may not be sustained in the future. Returns greater than 1 year period are compounded annualized (CAGR). # CRISIL MIP Blended Index ## CRISIL 1 year T-Bill IndexPerformance of close-ended Scheme is not strictly comparable with that of open-ended schemes since the investment strategy for close-ended schemes is primarily buy and hold whereas open ended schemes are actively managed.Performance of dividend option under the schemes for the investors would be net of distribution tax as applicable. Load is not taken into consideration for computation of performance.@ shows the current value of ` 10,000/- invested at the beginning of a given period. n.A.: not Available
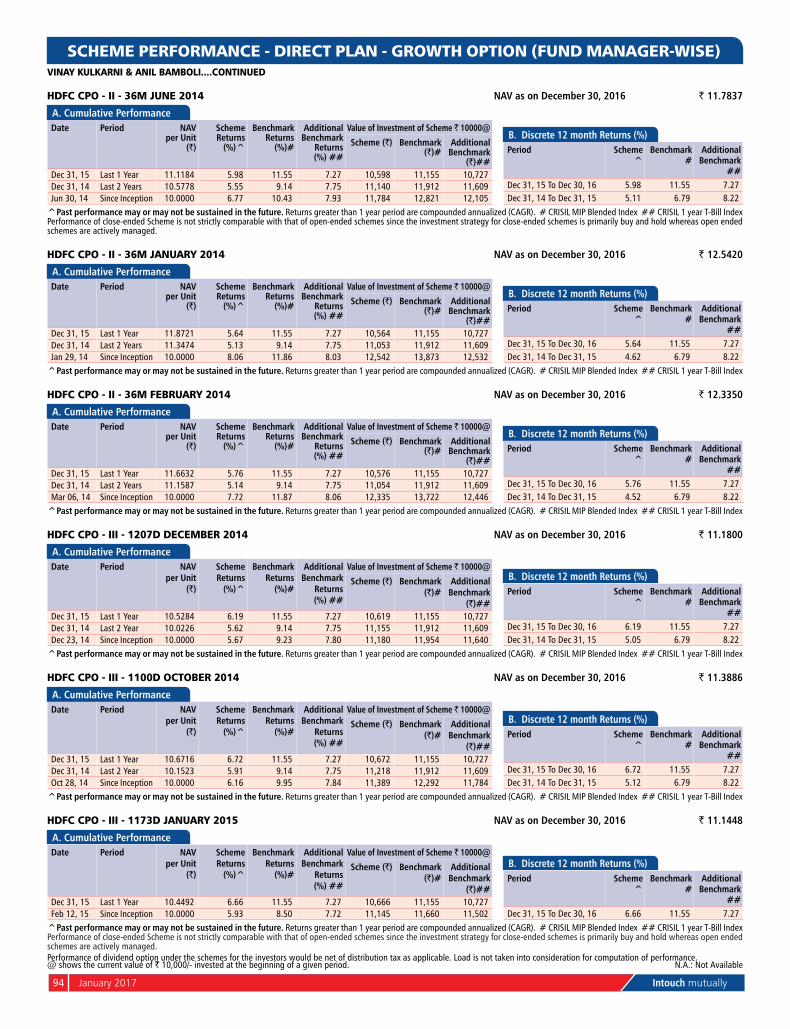
94 January 2017 Intouch mutually
SCHEME PERFORMANCE - DIRECT PLAN - GROWTH OPTION (FUND MANAGER-WISE)
Performance of dividend option under the schemes for the investors would be net of distribution tax as applicable. Load is not taken into consideration for computation of performance.@ shows the current value of ` 10,000/- invested at the beginning of a given period. n.A.: not Available
HDFC CPO - II - 36M JUNE 2014 NAV as on December 30, 2016 ` 11.7837
A. Cumulative PerformanceDate Period NAV
per Unit (`)
Scheme Returns
(%)^
Benchmark Returns
(%)#
Additional Benchmark
Returns (%) ##
Value of Investment of Scheme ` 10000@
Scheme (`) Benchmark (`)#
Additional Benchmark
(`)##Dec 31, 15 Last 1 Year 11.1184 5.98 11.55 7.27 10,598 11,155 10,727Dec 31, 14 Last 2 Years 10.5778 5.55 9.14 7.75 11,140 11,912 11,609Jun 30, 14 Since Inception 10.0000 6.77 10.43 7.93 11,784 12,821 12,105
B. Discrete 12 month Returns (%)Period Scheme
^Benchmark
#Additional
Benchmark ##
Dec 31, 15 To Dec 30, 16 5.98 11.55 7.27Dec 31, 14 To Dec 31, 15 5.11 6.79 8.22
^Past performance may or may not be sustained in the future. Returns greater than 1 year period are compounded annualized (CAGR). # CRISIL MIP Blended Index ## CRISIL 1 year T-Bill IndexPerformance of close-ended Scheme is not strictly comparable with that of open-ended schemes since the investment strategy for close-ended schemes is primarily buy and hold whereas open ended schemes are actively managed.
HDFC CPO - II - 36M JANUARY 2014 NAV as on December 30, 2016 ` 12.5420
A. Cumulative PerformanceDate Period NAV
per Unit (`)
Scheme Returns
(%)^
Benchmark Returns
(%)#
Additional Benchmark
Returns (%) ##
Value of Investment of Scheme ` 10000@
Scheme (`) Benchmark (`)#
Additional Benchmark
(`)##Dec 31, 15 Last 1 Year 11.8721 5.64 11.55 7.27 10,564 11,155 10,727Dec 31, 14 Last 2 Years 11.3474 5.13 9.14 7.75 11,053 11,912 11,609Jan 29, 14 Since Inception 10.0000 8.06 11.86 8.03 12,542 13,873 12,532
B. Discrete 12 month Returns (%)Period Scheme
^Benchmark
#Additional
Benchmark ##
Dec 31, 15 To Dec 30, 16 5.64 11.55 7.27Dec 31, 14 To Dec 31, 15 4.62 6.79 8.22
^Past performance may or may not be sustained in the future. Returns greater than 1 year period are compounded annualized (CAGR). # CRISIL MIP Blended Index ## CRISIL 1 year T-Bill Index
HDFC CPO - II - 36M FEBRUARY 2014 NAV as on December 30, 2016 ` 12.3350
A. Cumulative PerformanceDate Period NAV
per Unit (`)
Scheme Returns
(%)^
Benchmark Returns
(%)#
Additional Benchmark
Returns (%) ##
Value of Investment of Scheme ` 10000@
Scheme (`) Benchmark (`)#
Additional Benchmark
(`)##Dec 31, 15 Last 1 Year 11.6632 5.76 11.55 7.27 10,576 11,155 10,727Dec 31, 14 Last 2 Years 11.1587 5.14 9.14 7.75 11,054 11,912 11,609Mar 06, 14 Since Inception 10.0000 7.72 11.87 8.06 12,335 13,722 12,446
B. Discrete 12 month Returns (%)Period Scheme
^Benchmark
#Additional
Benchmark ##
Dec 31, 15 To Dec 30, 16 5.76 11.55 7.27Dec 31, 14 To Dec 31, 15 4.52 6.79 8.22
^Past performance may or may not be sustained in the future. Returns greater than 1 year period are compounded annualized (CAGR). # CRISIL MIP Blended Index ## CRISIL 1 year T-Bill Index
HDFC CPO - III - 1207D DECEMBER 2014 NAV as on December 30, 2016 ` 11.1800
A. Cumulative PerformanceDate Period NAV
per Unit (`)
Scheme Returns
(%)^
Benchmark Returns
(%)#
Additional Benchmark
Returns (%) ##
Value of Investment of Scheme ` 10000@
Scheme (`) Benchmark (`)#
Additional Benchmark
(`)##Dec 31, 15 Last 1 Year 10.5284 6.19 11.55 7.27 10,619 11,155 10,727Dec 31, 14 Last 2 Year 10.0226 5.62 9.14 7.75 11,155 11,912 11,609Dec 23, 14 Since Inception 10.0000 5.67 9.23 7.80 11,180 11,954 11,640
B. Discrete 12 month Returns (%)Period Scheme
^Benchmark
#Additional
Benchmark ##
Dec 31, 15 To Dec 30, 16 6.19 11.55 7.27Dec 31, 14 To Dec 31, 15 5.05 6.79 8.22
^Past performance may or may not be sustained in the future. Returns greater than 1 year period are compounded annualized (CAGR). # CRISIL MIP Blended Index ## CRISIL 1 year T-Bill Index
HDFC CPO - III - 1100D OCTOBER 2014 NAV as on December 30, 2016 ` 11.3886
A. Cumulative PerformanceDate Period NAV
per Unit (`)
Scheme Returns
(%)^
Benchmark Returns
(%)#
Additional Benchmark
Returns (%) ##
Value of Investment of Scheme ` 10000@
Scheme (`) Benchmark (`)#
Additional Benchmark
(`)##Dec 31, 15 Last 1 Year 10.6716 6.72 11.55 7.27 10,672 11,155 10,727Dec 31, 14 Last 2 Year 10.1523 5.91 9.14 7.75 11,218 11,912 11,609Oct 28, 14 Since Inception 10.0000 6.16 9.95 7.84 11,389 12,292 11,784
B. Discrete 12 month Returns (%)Period Scheme
^Benchmark
#Additional
Benchmark ##
Dec 31, 15 To Dec 30, 16 6.72 11.55 7.27Dec 31, 14 To Dec 31, 15 5.12 6.79 8.22
^Past performance may or may not be sustained in the future. Returns greater than 1 year period are compounded annualized (CAGR). # CRISIL MIP Blended Index ## CRISIL 1 year T-Bill Index
HDFC CPO - III - 1173D JANUARY 2015 NAV as on December 30, 2016 ` 11.1448
A. Cumulative PerformanceDate Period NAV
per Unit (`)
Scheme Returns
(%)^
Benchmark Returns
(%)#
Additional Benchmark
Returns (%) ##
Value of Investment of Scheme ` 10000@
Scheme (`) Benchmark (`)#
Additional Benchmark
(`)##Dec 31, 15 Last 1 Year 10.4492 6.66 11.55 7.27 10,666 11,155 10,727Feb 12, 15 Since Inception 10.0000 5.93 8.50 7.72 11,145 11,660 11,502
B. Discrete 12 month Returns (%)Period Scheme
^Benchmark
#Additional
Benchmark ##
Dec 31, 15 To Dec 30, 16 6.66 11.55 7.27^Past performance may or may not be sustained in the future. Returns greater than 1 year period are compounded annualized (CAGR). # CRISIL MIP Blended Index ## CRISIL 1 year T-Bill IndexPerformance of close-ended Scheme is not strictly comparable with that of open-ended schemes since the investment strategy for close-ended schemes is primarily buy and hold whereas open ended schemes are actively managed.
VINAY KULKARNI & ANIL BAMBOLI....CONTINUED
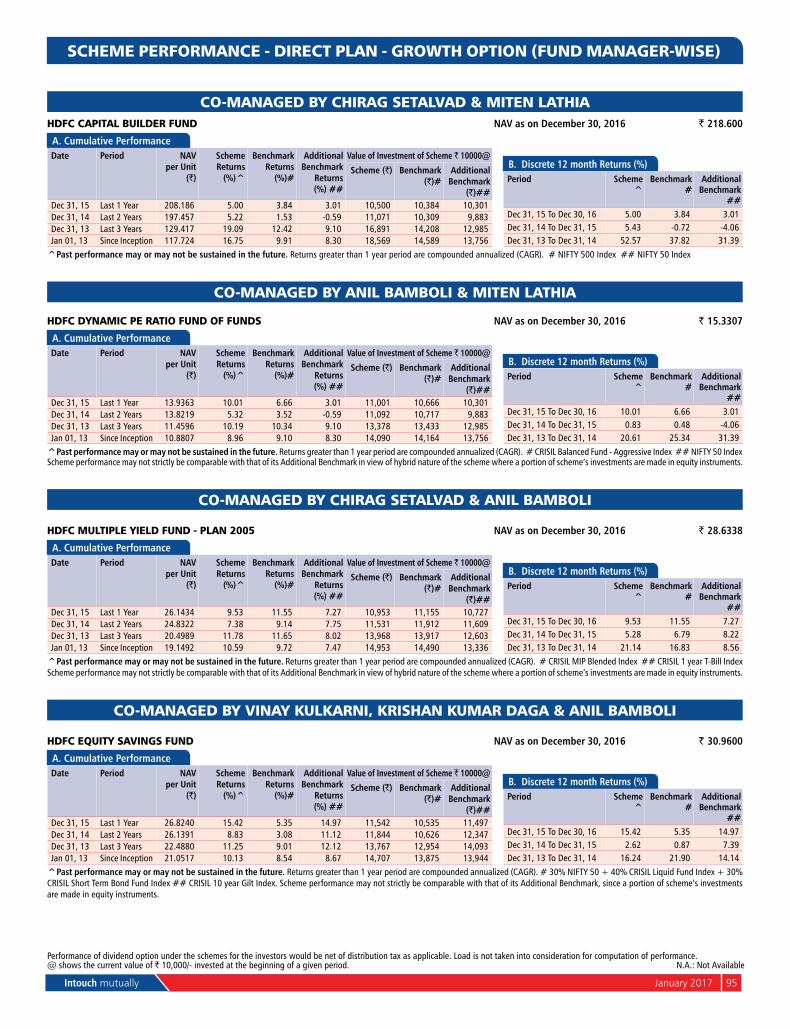
Intouch mutually January 2017 95
SCHEME PERFORMANCE - DIRECT PLAN - GROWTH OPTION (FUND MANAGER-WISE)
Performance of dividend option under the schemes for the investors would be net of distribution tax as applicable. Load is not taken into consideration for computation of performance.@ shows the current value of ` 10,000/- invested at the beginning of a given period. n.A.: not Available
CO-MANAGED BY CHIRAG SETALVAD & MITEN LATHIAHDFC CAPITAL BUILDER FUND NAV as on December 30, 2016 ` 218.600
A. Cumulative PerformanceDate Period NAV
per Unit (`)
Scheme Returns
(%)^
Benchmark Returns
(%)#
Additional Benchmark
Returns (%) ##
Value of Investment of Scheme ` 10000@
Scheme (`) Benchmark (`)#
Additional Benchmark
(`)##Dec 31, 15 Last 1 Year 208.186 5.00 3.84 3.01 10,500 10,384 10,301Dec 31, 14 Last 2 Years 197.457 5.22 1.53 -0.59 11,071 10,309 9,883Dec 31, 13 Last 3 Years 129.417 19.09 12.42 9.10 16,891 14,208 12,985Jan 01, 13 Since Inception 117.724 16.75 9.91 8.30 18,569 14,589 13,756
B. Discrete 12 month Returns (%)Period Scheme
^Benchmark
#Additional
Benchmark ##
Dec 31, 15 To Dec 30, 16 5.00 3.84 3.01Dec 31, 14 To Dec 31, 15 5.43 -0.72 -4.06Dec 31, 13 To Dec 31, 14 52.57 37.82 31.39
^Past performance may or may not be sustained in the future. Returns greater than 1 year period are compounded annualized (CAGR). # nIFTY 500 Index ## nIFTY 50 Index
CO-MANAGED BY ANIL BAMBOLI & MITEN LATHIA
HDFC DYNAMIC PE RATIO FUND OF FUNDS NAV as on December 30, 2016 ` 15.3307
A. Cumulative PerformanceDate Period NAV
per Unit (`)
Scheme Returns
(%)^
Benchmark Returns
(%)#
Additional Benchmark
Returns (%) ##
Value of Investment of Scheme ` 10000@
Scheme (`) Benchmark (`)#
Additional Benchmark
(`)##Dec 31, 15 Last 1 Year 13.9363 10.01 6.66 3.01 11,001 10,666 10,301Dec 31, 14 Last 2 Years 13.8219 5.32 3.52 -0.59 11,092 10,717 9,883Dec 31, 13 Last 3 Years 11.4596 10.19 10.34 9.10 13,378 13,433 12,985Jan 01, 13 Since Inception 10.8807 8.96 9.10 8.30 14,090 14,164 13,756
B. Discrete 12 month Returns (%)Period Scheme
^Benchmark
#Additional
Benchmark ##
Dec 31, 15 To Dec 30, 16 10.01 6.66 3.01Dec 31, 14 To Dec 31, 15 0.83 0.48 -4.06Dec 31, 13 To Dec 31, 14 20.61 25.34 31.39
^Past performance may or may not be sustained in the future. Returns greater than 1 year period are compounded annualized (CAGR). # CRISIL Balanced Fund - Aggressive Index ## nIFTY 50 IndexScheme performance may not strictly be comparable with that of its Additional Benchmark in view of hybrid nature of the scheme where a portion of scheme’s investments are made in equity instruments.
CO-MANAGED BY CHIRAG SETALVAD & ANIL BAMBOLI
HDFC MULTIPLE YIELD FUND - PLAN 2005 NAV as on December 30, 2016 ` 28.6338
A. Cumulative PerformanceDate Period NAV
per Unit (`)
Scheme Returns
(%)^
Benchmark Returns
(%)#
Additional Benchmark
Returns (%) ##
Value of Investment of Scheme ` 10000@
Scheme (`) Benchmark (`)#
Additional Benchmark
(`)##Dec 31, 15 Last 1 Year 26.1434 9.53 11.55 7.27 10,953 11,155 10,727Dec 31, 14 Last 2 Years 24.8322 7.38 9.14 7.75 11,531 11,912 11,609Dec 31, 13 Last 3 Years 20.4989 11.78 11.65 8.02 13,968 13,917 12,603Jan 01, 13 Since Inception 19.1492 10.59 9.72 7.47 14,953 14,490 13,336
B. Discrete 12 month Returns (%)Period Scheme
^Benchmark
#Additional
Benchmark ##
Dec 31, 15 To Dec 30, 16 9.53 11.55 7.27Dec 31, 14 To Dec 31, 15 5.28 6.79 8.22Dec 31, 13 To Dec 31, 14 21.14 16.83 8.56
^Past performance may or may not be sustained in the future. Returns greater than 1 year period are compounded annualized (CAGR). # CRISIL MIP Blended Index ## CRISIL 1 year T-Bill IndexScheme performance may not strictly be comparable with that of its Additional Benchmark in view of hybrid nature of the scheme where a portion of scheme’s investments are made in equity instruments.
CO-MANAGED BY VINAY KULKARNI, KRISHAN KUMAR DAGA & ANIL BAMBOLI
HDFC EQUITY SAVINGS FUND NAV as on December 30, 2016 ` 30.9600
A. Cumulative PerformanceDate Period NAV
per Unit (`)
Scheme Returns
(%)^
Benchmark Returns
(%)#
Additional Benchmark
Returns (%) ##
Value of Investment of Scheme ` 10000@
Scheme (`) Benchmark (`)#
Additional Benchmark
(`)##Dec 31, 15 Last 1 Year 26.8240 15.42 5.35 14.97 11,542 10,535 11,497Dec 31, 14 Last 2 Years 26.1391 8.83 3.08 11.12 11,844 10,626 12,347Dec 31, 13 Last 3 Years 22.4880 11.25 9.01 12.12 13,767 12,954 14,093Jan 01, 13 Since Inception 21.0517 10.13 8.54 8.67 14,707 13,875 13,944
B. Discrete 12 month Returns (%)Period Scheme
^Benchmark
#Additional
Benchmark ##
Dec 31, 15 To Dec 30, 16 15.42 5.35 14.97Dec 31, 14 To Dec 31, 15 2.62 0.87 7.39Dec 31, 13 To Dec 31, 14 16.24 21.90 14.14
^Past performance may or may not be sustained in the future. Returns greater than 1 year period are compounded annualized (CAGR). # 30% nIFTY 50 + 40% CRISIL Liquid Fund Index + 30% CRISIL Short Term Bond Fund Index ## CRISIL 10 year Gilt Index. Scheme performance may not strictly be comparable with that of its Additional Benchmark, since a portion of scheme’s investments are made in equity instruments.

96 January 2017 Intouch mutually
Fund ManagerAn employee of the asset management company such as a mutual fund or life insurer, who manages investments of the scheme. He is usually part of a larger team of fund managers and research analysts.
Application Amount for Fresh SubscriptionThis is the minimum investment amount for a new investor in a mutual fund scheme.
Minimum Additional AmountThis is the minimum investment amount for an existing investor in a mutual fund scheme.
Yield to MaturityThe Yield to Maturity or the YTM is the rate of return anticipated on a bond if held until maturity. YTM is expressed as an annual rate. The YTM factors in the bond’s current market price, par value, coupon interest rate and time to maturity.
SIPSIP or systematic investment plan works on the principle of making periodic investments of a fixed sum. It works similar to a recurring bank deposit. For instance, an investor may opt for an SIP that invests Rs 500 every 15th of the month in an equity fund for a period of three years.
NAVThe nAV or the net asset value is the total asset value per unit of the mutual fund after deducting all related and permissible expenses. The nAV is calculated at the end of every business day. It is the value at which the investor enters or exits the mutual fund.
BenchmarkA group of securities, usually a market index, whose performance is used as a standard or benchmark to measure investment performance of mutual funds, among other investments. Some typical benchmarks include the nIFTY, Sensex, BSE200, BSE500, 10-Year Gsec.
Entry LoadA mutual fund may have a sales charge or load at the time of entry and/or exit to compensate the distributor/agent. Entry load is charged at the time an investor purchases the units of a mutual fund.
The entry load is added to the prevailing nAV at the time of investment. For instance, if the nAV is Rs. 100 and the entry load is 1 %, the investor will enter the fund at Rs. 101. (note: SEBI, vide circular dated June 30, 2009 has abolished entry load and mandated that the upfront commission to distributors will be paid by the investor directly to the distributor, based on his assessment of various factors including the service rendered by the distributor).
Exit LoadExit load is charged at the time an investor redeems the units of a mutual fund. The exit load is reduced from the prevailing nAV at the time of redemption. The investor will receive redemption proceed at net value of nAV less Exit Load. For instance if the nAV is Rs. 100 and the exit load is 1%, the investor will receive Rs. 99.
Modified DurationModified duration is the price sensitivity and the percentage change in price for a unit change in yield.
Standard DeviationStandard deviation is a statistical measure of the range of an investment’s performance. When a mutual fund has a high standard deviation, its means its range of performance is wide, implying greater volatility.
Sharpe RatioThe Sharpe Ratio, named after its founder, the nobel Laureate William Sharpe, is a measure of risk-adjusted returns. It is calculated using standard deviation and excess return to determine reward per unit of risk.
Beta Ratio (Portfolio Beta)Beta is a measure of an investment’s volatility vis-a-vis the market. Beta of less than 1 means that the security will be less volatile than the market. A beta of greater than 1 implies that the security’s price will be more volatile than the market.
Average portfolio PE (Average P/E)It is price to earnings ratio of the stocks calculated for the entire portfolio on a weighted average basis.
Average portfolio price to book ratio (Average P/BV)It is price to book value of the stocks calculated for the entire portfolio on a weighted average basis.
Average portfolio dividend yield (Average Dividend Yield)It is dividend yield of the stocks calculated for the entire portfolio on a weighted average basis.
Net Equitynet equity level is the net equity exposure percentage adjusted for any derivative positions in stocks or index for hedging or rebalancing purpose.
R SquaredIt is a statistical measure of how closely the portfolio returns are correlated with its benchmark.
AUMAUM or assets under management refers to the recent / updated cumulative market value of investments managed by a mutual fund or any investment firm.
HoldingsThe holdings or the portfolio is a mutual fund’s latest or updated reported statement of investments/securities. These are usually displayed in terms of percentage to net assets or the rupee value or both. The objective is to give investors an idea of where their money is being invested by the fund manager.
Nature of SchemeThe investment objective and underlying investments determine the nature of the mutual fund scheme. For instance, a mutual fund that aims at generating capital appreciation by investing in stock markets is an equity fund or growth fund. Likewise, a mutual fund that aims at capital preservation by investing in debt markets is a debt fund or income fund. Each of these categories may have sub-categories.
Rating ProfileMutual funds invest in securities after evaluating their creditworthiness as disclosed by the ratings. A depiction of the mutual fund in various investments based on their ratings becomes the rating profile of the fund. Typically, this is a feature of debt funds.
HOW TO READ FACTSHEET
Sharpe RatioSharpe Ratio is a risk to reward ratio, it measures portfolio returns generated in excess to the investment in risk-free asset, for per unit of total risk taken. While, positive Sharpe ratio indicates, portfolio compensating investors with excess returns (over risk-free rate) for the commensurate risk taken; negative Sharpe ratio indicates, investors are better off investing in risk-free assets.
BetaBeta ( ) of a portfolio is a number indicating the relation between portfolio returns with that of the market index i.e. it measure the volatility, or systematic risk, of a portfolio in comparison to the market as a whole.
Modified DurationA formula that expresses the measurable change in the value of a security in response to a change in interest rates. Modified duration of portfolio can be used to anticipate the change in market value of portfolio for every change in portfolio yield.
Standard DeviationA statistical measure that defines expected volatility/risk associated with a portfolio. This explains the variation/deviation from the average returns delivered by the portfolio. A higher standard deviation means higher volatility (risk) and a lower standard deviation means lower volatility.
Risk Free ReturnThe theoretical rate of return of an investment with safest (zero risk) investment in a country.
Tracking ErrorTracking error indicates how closely the portfolio return is tracking the benchmark Index return. It measures the deviation between portfolio return and benchmark index return. A lower tracking error indicates portfolio closely tracking benchmark index and higher tracking error indicates portfolio returns with higher deviation from benchmark index returns.
Total Expense RatioTotal expenses charged to scheme for the month expressed as a percentage to average monthly net assets.
Average MaturityWeighted average maturity of the securities in scheme.
Portfolio Yield (Yield To Maturity)Weighted average yield of the securities in scheme portfolio.
GLOSSARY

Intouch mutually January 2017 97
Dividend History ^
^ Past performance may or may not be sustained in the future. There is no assurance or guarantee to Unit holders as to rate/quantum of dividend distribution nor that the dividends will be paid regularly. All dividends are on face value of ` 10 per Unit. After payment of the dividend, the per Unit nAV falls to the extent of the payout and statutory levy, if any. * Please log on to www.hdfcfund.com for Record Date-wise listing of dividends declared.
HDFC Growth Fund (Past 3 years) Dividend Option
Record Date Regular Plan Direct Plan
Cum Div NAV (`)
Dividend per Unit (`) For Cum Div NAV (`)
Dividend per Unit (`) For
Individuals & HUF Others Individuals & HUF OthersFeb 13, 14 25.019 3.00 3.00 25.143 3.00 3.00Feb 12, 15 33.959 3.50 3.50 34.313 3.50 3.50Feb 18, 16 25.839 2.50 2.50 26.276 2.50 2.50
HDFC Equity Fund (Past 3 years) Dividend Option
Record Date Regular Plan Direct Plan
Cum Div NAV (`)
Dividend per Unit (`) For Cum Div NAV (`)
Dividend per Unit (`) For
Individuals & HUF Others Individuals & HUF OthersMar 20, 14 43.809 4.00 4.00 44.172 4.00 4.00Mar 19, 15 59.842 5.50 5.50 60.828 5.50 5.50Mar 17, 16 45.848 4.50 4.50 47.059 4.50 4.50
HDFC Top 200 Fund (Past 3 years) Dividend Option
Record Date Regular Plan Direct Plan
Cum Div NAV (`)
Dividend per Unit (`) For Cum Div NAV (`)
Dividend per Unit (`) For
Individuals & HUF Others Individuals & HUF OthersMar 06, 14 42.484 4.00 4.00 42.768 4.00 4.00Mar 05, 15 58.076 5.00 5.00 58.852 5.00 5.00Mar 03, 16 43.228 3.50 3.50 44.146 3.50 3.50
HDFC Capital Builder Fund (Past 3 years) Dividend Option
Record Date Regular Plan Direct Plan
Cum Div NAV (`)
Dividend per Unit (`) For Cum Div NAV (`)
Dividend per Unit (`) For
Individuals & HUF Others Individuals & HUF OthersFeb 20, 14 21.788 2.50 2.50 21.897 2.50 2.50Feb 19, 15 31.424 3.00 3.00 31.766 3.00 3.00Feb 25, 16 23.429 2.75 2.75 23.920 2.75 2.75
HDFC Core & Satellite Fund (Past 3 years) Dividend Option
Record Date Regular Plan Direct Plan
Cum Div NAV (`)
Dividend per Unit (`) For Cum Div NAV (`)
Dividend per Unit (`) For
Individuals & HUF Others Individuals & HUF OthersFeb 20, 14 15.197 1.50 1.50 15.327 1.50 1.50Feb 19, 15 22.392 2.00 2.00 22.738 2.00 2.00Feb 25, 16 16.580 2.00 2.00 16.988 2.00 2.00
HDFC Premier Multi-Cap Fund (Past 3 years) Dividend Option
Record Date Regular Plan Direct Plan
Cum Div NAV (`)
Dividend per Unit (`) For Cum Div NAV (`)
Dividend per Unit (`) For
Individuals & HUF Others Individuals & HUF OthersFeb 06, 14 10.783 0.60 0.60 10.854 0.60 0.60Feb 05, 15 16.770 1.50 1.50 16.981 1.50 1.50Feb 11, 16 11.626 1.25 1.25 11.858 1.25 1.25
HDFC Arbitrage Fundnormal Dividend Option Record Date Wholesale Plan Direct Plan
Cum Div NAV (`)
Dividend per Unit (`) For Cum Div NAV (`)
Dividend per Unit (`) For
Individuals & HUF Others Individuals & HUF Othersnov 21, 16 10.569 0.050 0.050 10.775 0.050 0.050Dec 26, 16 10.564 0.050 0.050 10.776 0.050 0.050Jan 23, 17 10.550 0.050 0.050 10.776 0.050 0.050
Monthly Dividend Option (Past 3 months )Record Date Wholesale Plan Wholesale Plan - Direct Plan
Cum Div NAV (`)
Dividend per Unit (`) For Cum Div NAV (`)
Dividend per Unit (`) For
Individuals & HUF Others Individuals & HUF Othersnov 21, 16 10.936 0.050 0.050 10.532 0.050 0.050Dec 26, 16 10.933 0.050 0.050 10.532 0.050 0.050Jan 23, 17 10.920 0.050 0.050 10.521 0.050 0.050
HDFC Large Cap Fund (Past 3 years) Dividend Option
Record Date Regular Plan Direct Plan
Cum Div NAV (`)
Dividend per Unit (`) For Cum Div NAV (`)
Dividend per Unit (`) For
Individuals & HUF Others Individuals & HUF OthersFeb 26, 15 25.817 2.50 2.50 26.048 2.50 2.50Feb 18, 16 - - - 19.186 1.75 1.75
HDFC Mid-Cap Opportunities Fund (Past 3 years) Dividend Option
Record Date Regular Plan Direct Plan
Cum Div NAV (`)
Dividend per Unit (`) For Cum Div NAV (`)
Dividend per Unit (`) For
Individuals & HUF Others Individuals & HUF OthersFeb 26, 14 17.588 1.75 1.75 - - -Mar 24, 15 27.636 2.00 2.00 31.131 2.25 2.25Mar 23, 16 25.133 1.50 1.50 28.582 1.50 1.50
HDFC Small Cap Fund (Past 3 years) Dividend Option
Record Date Regular Plan Direct Plan
Cum Div NAV (`)
Dividend per Unit (`) For Cum Div NAV (`)
Dividend per Unit (`) For
Individuals & HUF Others Individuals & HUF OthersFeb 19, 15 22.769 2.00 2.00 23.165 2.00 2.00Feb 25, 16 17.986 2.00 2.00 18.565 1.99 1.99
HDFC Balanced Fund (Past 3 quarters) Dividend Option
Record Date Regular Plan Direct Plan
Cum Div NAV (`)
Dividend per Unit (`) For Cum Div NAV (`)
Dividend per Unit (`) For
Individuals & HUF Others Individuals & HUF OthersJune 27, 16 26.820 0.500 0.500 28.686 0.500 0.500Sep 26, 16 28.897 0.500 0.500 31.031 0.500 0.500Dec 26, 16 26.950 0.500 0.500 29.053 0.500 0.500
HDFC Prudence Fund (Past 3 months) Dividend Option
Record Date Regular Plan Direct Plan
Cum Div NAV (`)
Dividend per Unit (`) For Cum Div NAV (`)
Dividend per Unit (`) For
Individuals & HUF Others Individuals & HUF Othersnov 25, 16 29.796 0.30 0.30 33.972 0.30 0.30Dec 26, 16 28.320 0.300 0.300 32.360 0.300 0.300Jan 25, 17 30.216 0.300 0.300 34.607 0.300 0.300
HDFC Long Term Advantage Fund (Past 3 years) Dividend Option(An open-ended equity linked savings scheme with a lock-in period of 3 years)
Record Date Regular Plan Direct Plan
Cum Div NAV (`)
Dividend per Unit (`) For Cum Div NAV (`)
Dividend per Unit (`) For
Individuals & HUF Others Individuals & HUF OthersFeb 06, 14 32.125 3.50 3.50 32.304 3.50 3.50Feb 05, 15 43.781 4.00 4.00 44.279 4.00 4.00Feb 11, 16 33.317 3.50 3.50 33.909 2.99 2.99
HDFC TaxSaver (Past 3 years) Dividend Option(An open-ended equity linked savings scheme with a lock-in period of 3 years)
Record Date Regular Plan Direct Plan
Cum Div NAV (`)
Dividend per Unit (`) For Cum Div NAV (`)
Dividend per Unit (`) For
Individuals & HUF Others Individuals & HUF OthersMar 13, 14 52.658 6.00 6.00 53.067 6.00 6.00Mar 12, 15 73.673 7.00 7.00 74.679 7.00 7.00Mar 10, 16 53.821 6.00 6.00 54.911 6.00 6.00
HDFC Infrastructure Fund (Past 3 years) Dividend Option
Record Date Regular Plan Direct Plan
Cum Div NAV (`)
Dividend per Unit (`) For Cum Div NAV (`)
Dividend per Unit (`) For
Individuals & HUF Others Individuals & HUF OthersMar 05, 15 17.557 1.500 1.500 - - -Mar 17, 16 12.129 1.000 1.000 - - -
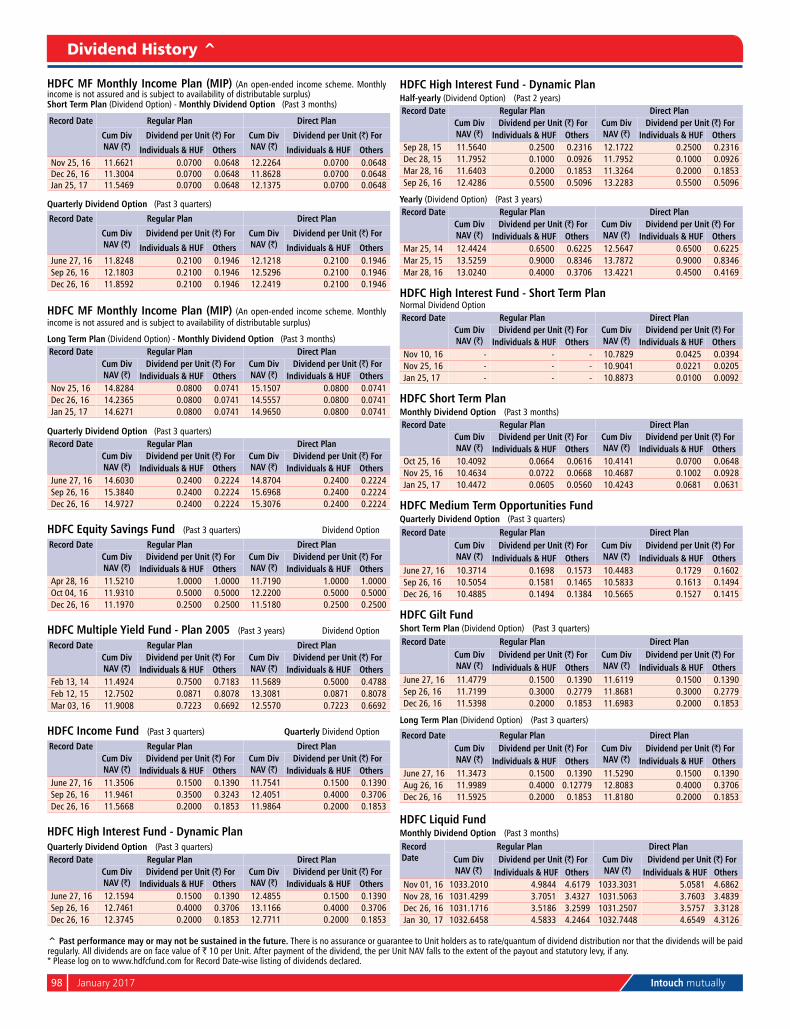
98 January 2017 Intouch mutually
Dividend History ^
^ Past performance may or may not be sustained in the future. There is no assurance or guarantee to Unit holders as to rate/quantum of dividend distribution nor that the dividends will be paid regularly. All dividends are on face value of ` 10 per Unit. After payment of the dividend, the per Unit nAV falls to the extent of the payout and statutory levy, if any.* Please log on to www.hdfcfund.com for Record Date-wise listing of dividends declared.
HDFC MF Monthly Income Plan (MIP) (An open-ended income scheme. Monthly income is not assured and is subject to availability of distributable surplus) Short Term Plan (Dividend Option) - Monthly Dividend Option (Past 3 months)
Record Date Regular Plan Direct Plan
Cum Div NAV (`)
Dividend per Unit (`) For Cum Div NAV (`)
Dividend per Unit (`) For
Individuals & HUF Others Individuals & HUF Othersnov 25, 16 11.6621 0.0700 0.0648 12.2264 0.0700 0.0648Dec 26, 16 11.3004 0.0700 0.0648 11.8628 0.0700 0.0648Jan 25, 17 11.5469 0.0700 0.0648 12.1375 0.0700 0.0648
Quarterly Dividend Option (Past 3 quarters)
Record Date Regular Plan Direct Plan
Cum Div NAV (`)
Dividend per Unit (`) For Cum Div NAV (`)
Dividend per Unit (`) For
Individuals & HUF Others Individuals & HUF OthersJune 27, 16 11.8248 0.2100 0.1946 12.1218 0.2100 0.1946Sep 26, 16 12.1803 0.2100 0.1946 12.5296 0.2100 0.1946Dec 26, 16 11.8592 0.2100 0.1946 12.2419 0.2100 0.1946
HDFC MF Monthly Income Plan (MIP) (An open-ended income scheme. Monthly income is not assured and is subject to availability of distributable surplus)
Long Term Plan (Dividend Option) - Monthly Dividend Option (Past 3 months)Record Date Regular Plan Direct Plan
Cum Div NAV (`)
Dividend per Unit (`) For Cum Div NAV (`)
Dividend per Unit (`) ForIndividuals & HUF Others Individuals & HUF Others
nov 25, 16 14.8284 0.0800 0.0741 15.1507 0.0800 0.0741Dec 26, 16 14.2365 0.0800 0.0741 14.5557 0.0800 0.0741Jan 25, 17 14.6271 0.0800 0.0741 14.9650 0.0800 0.0741
Quarterly Dividend Option (Past 3 quarters)Record Date Regular Plan Direct Plan
Cum Div NAV (`)
Dividend per Unit (`) For Cum Div NAV (`)
Dividend per Unit (`) ForIndividuals & HUF Others Individuals & HUF Others
June 27, 16 14.6030 0.2400 0.2224 14.8704 0.2400 0.2224Sep 26, 16 15.3840 0.2400 0.2224 15.6968 0.2400 0.2224Dec 26, 16 14.9727 0.2400 0.2224 15.3076 0.2400 0.2224
HDFC Equity Savings Fund (Past 3 quarters) Dividend Option
Record Date Regular Plan Direct PlanCum Div NAV (`)
Dividend per Unit (`) For Cum Div NAV (`)
Dividend per Unit (`) ForIndividuals & HUF Others Individuals & HUF Others
Apr 28, 16 11.5210 1.0000 1.0000 11.7190 1.0000 1.0000Oct 04, 16 11.9310 0.5000 0.5000 12.2200 0.5000 0.5000Dec 26, 16 11.1970 0.2500 0.2500 11.5180 0.2500 0.2500
HDFC Multiple Yield Fund - Plan 2005 (Past 3 years) Dividend Option
Record Date Regular Plan Direct PlanCum Div NAV (`)
Dividend per Unit (`) For Cum Div NAV (`)
Dividend per Unit (`) ForIndividuals & HUF Others Individuals & HUF Others
Feb 13, 14 11.4924 0.7500 0.7183 11.5689 0.5000 0.4788Feb 12, 15 12.7502 0.0871 0.8078 13.3081 0.0871 0.8078Mar 03, 16 11.9008 0.7223 0.6692 12.5570 0.7223 0.6692
HDFC Income Fund (Past 3 quarters) Quarterly Dividend Option
Record Date Regular Plan Direct PlanCum Div NAV (`)
Dividend per Unit (`) For Cum Div NAV (`)
Dividend per Unit (`) ForIndividuals & HUF Others Individuals & HUF Others
June 27, 16 11.3506 0.1500 0.1390 11.7541 0.1500 0.1390Sep 26, 16 11.9461 0.3500 0.3243 12.4051 0.4000 0.3706Dec 26, 16 11.5668 0.2000 0.1853 11.9864 0.2000 0.1853
HDFC High Interest Fund - Dynamic PlanQuarterly Dividend Option (Past 3 quarters) Record Date Regular Plan Direct Plan
Cum Div NAV (`)
Dividend per Unit (`) For Cum Div NAV (`)
Dividend per Unit (`) ForIndividuals & HUF Others Individuals & HUF Others
June 27, 16 12.1594 0.1500 0.1390 12.4855 0.1500 0.1390Sep 26, 16 12.7461 0.4000 0.3706 13.1166 0.4000 0.3706Dec 26, 16 12.3745 0.2000 0.1853 12.7711 0.2000 0.1853
HDFC High Interest Fund - Dynamic PlanHalf-yearly (Dividend Option) (Past 2 years) Record Date Regular Plan Direct Plan
Cum Div NAV (`)
Dividend per Unit (`) For Cum Div NAV (`)
Dividend per Unit (`) ForIndividuals & HUF Others Individuals & HUF Others
Sep 28, 15 11.5640 0.2500 0.2316 12.1722 0.2500 0.2316Dec 28, 15 11.7952 0.1000 0.0926 11.7952 0.1000 0.0926Mar 28, 16 11.6403 0.2000 0.1853 11.3264 0.2000 0.1853Sep 26, 16 12.4286 0.5500 0.5096 13.2283 0.5500 0.5096
Yearly (Dividend Option) (Past 3 years) Record Date Regular Plan Direct Plan
Cum Div NAV (`)
Dividend per Unit (`) For Cum Div NAV (`)
Dividend per Unit (`) ForIndividuals & HUF Others Individuals & HUF Others
Mar 25, 14 12.4424 0.6500 0.6225 12.5647 0.6500 0.6225Mar 25, 15 13.5259 0.9000 0.8346 13.7872 0.9000 0.8346Mar 28, 16 13.0240 0.4000 0.3706 13.4221 0.4500 0.4169
HDFC High Interest Fund - Short Term Plannormal Dividend OptionRecord Date Regular Plan Direct Plan
Cum Div NAV (`)
Dividend per Unit (`) For Cum Div NAV (`)
Dividend per Unit (`) ForIndividuals & HUF Others Individuals & HUF Others
nov 10, 16 - - - 10.7829 0.0425 0.0394nov 25, 16 - - - 10.9041 0.0221 0.0205Jan 25, 17 - - - 10.8873 0.0100 0.0092
HDFC Short Term PlanMonthly Dividend Option (Past 3 months)Record Date Regular Plan Direct Plan
Cum Div NAV (`)
Dividend per Unit (`) For Cum Div NAV (`)
Dividend per Unit (`) ForIndividuals & HUF Others Individuals & HUF Others
Oct 25, 16 10.4092 0.0664 0.0616 10.4141 0.0700 0.0648nov 25, 16 10.4634 0.0722 0.0668 10.4687 0.1002 0.0928Jan 25, 17 10.4472 0.0605 0.0560 10.4243 0.0681 0.0631
HDFC Medium Term Opportunities FundQuarterly Dividend Option (Past 3 quarters) Record Date Regular Plan Direct Plan
Cum Div NAV (`)
Dividend per Unit (`) For Cum Div NAV (`)
Dividend per Unit (`) ForIndividuals & HUF Others Individuals & HUF Others
June 27, 16 10.3714 0.1698 0.1573 10.4483 0.1729 0.1602Sep 26, 16 10.5054 0.1581 0.1465 10.5833 0.1613 0.1494Dec 26, 16 10.4885 0.1494 0.1384 10.5665 0.1527 0.1415
HDFC Gilt FundShort Term Plan (Dividend Option) (Past 3 quarters) Record Date Regular Plan Direct Plan
Cum Div NAV (`)
Dividend per Unit (`) For Cum Div NAV (`)
Dividend per Unit (`) ForIndividuals & HUF Others Individuals & HUF Others
June 27, 16 11.4779 0.1500 0.1390 11.6119 0.1500 0.1390Sep 26, 16 11.7199 0.3000 0.2779 11.8681 0.3000 0.2779Dec 26, 16 11.5398 0.2000 0.1853 11.6983 0.2000 0.1853
Long Term Plan (Dividend Option) (Past 3 quarters)
Record Date Regular Plan Direct PlanCum Div NAV (`)
Dividend per Unit (`) For Cum Div NAV (`)
Dividend per Unit (`) ForIndividuals & HUF Others Individuals & HUF Others
June 27, 16 11.3473 0.1500 0.1390 11.5290 0.1500 0.1390Aug 26, 16 11.9989 0.4000 0.12779 12.8083 0.4000 0.3706Dec 26, 16 11.5925 0.2000 0.1853 11.8180 0.2000 0.1853
HDFC Liquid FundMonthly Dividend Option (Past 3 months) Record Date
Regular Plan Direct PlanCum Div NAV (`)
Dividend per Unit (`) For Cum Div NAV (`)
Dividend per Unit (`) ForIndividuals & HUF Others Individuals & HUF Others
nov 01, 16 1033.2010 4.9844 4.6179 1033.3031 5.0581 4.6862nov 28, 16 1031.4299 3.7051 3.4327 1031.5063 3.7603 3.4839Dec 26, 16 1031.1716 3.5186 3.2599 1031.2507 3.5757 3.3128Jan 30, 17 1032.6458 4.5833 4.2464 1032.7448 4.6549 4.3126

Intouch mutually January 2017 99
Dividend History ^
Disclaimer: The information contained herein should not be altered in any way, transmitted to, copied or distributed, in part or in whole, to any other person or to the media or reproduced in any form, without prior written consent of HDFC Asset Management Company Limited (HDFC AMC) or the relevant owner of the intellectual property, as the case may be. All Intellectual property and intellectual property rights belong to the relevant owner of the intellectual property, and “Intouch Mutually” is a trademark of HDFC AMC. Any information herein contained does not constitute and shall be deemed not to constitute an advice, an offer to sell/ purchase or as an invitation or solicitation to do so for any securities of any entity, and further, HDFC AMC/its subsidiaries/affiliates/sponsors/trustee (HDFC AMC Group) or their officers, employees, personnel, directors may be associated in a commercial, professional or personal capacity or may have a commercial interest including as proprietary traders in or with the securities and/ or companies or issues or matters as contained in this publication and such commercial capacity or interest whether or not differing with or conflicting with this publication, shall not make or render (HDFC AMC Group) liable in any manner whatsoever & (HDFC AMC Group) or any of their officers, employees, personnel, directors shall not be liable for any loss, damage, liability whatsoever for any direct or indirect loss arising from the use or access of any informa-tion that may be displayed in this publication from time to time. Recipients of the information contained herein should exercise due care and caution and read the Scheme Information Document(s) and Statement of Additional Information (including if necessary, obtaining the advice of tax/legal/accounting/financial/other professionals) prior to taking of any decision, acting or omitting to act, on the basis of the information contained herein. The printing and mailing cost of this newsletter is charged to the respective schemes subject to Securities & Exchange Board of India (Mutual Funds) Regulations, 1996.
HDFC Index Fund – SEnSEx Plan & SEnSEx Plus Plan (“Schemes”) is based on the S&P BSE SEnSEx Index. S&P® is a registered trademark of S&P Financial Services Limited (S&P). BSE® and SEnSEx® are registered trade-marks of BSE Limited. The Schemes is not sponsored, endorsed marketed or promoted by S&P, BSE or their respective affiliates. Please refer to the Scheme Information Document for disclaimers w.r.t. S&P BSE SENSEX Index.
For HDFC Index Fund - nIFTY Plan: The Scheme of HDFC Mutual Fund (the “Product(s)”) are not sponsored, endorsed, sold or promoted by India Index Services & Products Limited (“IISL”). IISL does not make any representation or warranty, express or implied, to the owners of the Product(s) or any member of the public regarding the advisability of investing in securities generally or in the Product(s) particularly or the ability of the nIFTY Indices to track general stock market performance in India. The relationship of IISL with HDFC Asset Management Company Limited (“the Issuer/Licensee”) is only in respect of the licensing of the Indices and certain trademarks and trade names associated with such Indices which is determined, composed and calculated by IISL without regard to the Issuer /Licensee or the Product(s). IISL does not have any obligation to take the needs of the Issuer/Licensee or the owners of the Product(s) into consideration in determining, composing or calculating the nIFTY Indices. IISL is not responsible for or has participated in the determination of the timing of, prices at, or quantities of the Product(s) to be issued or in the determination or calculation of the equation by which the Product(s) is to be converted into cash. IISL has no obligation or liability in connection with the administration, marketing or trading of the Product(s).
IISL is engaged in the business of developing, constructing, compiling, computing and maintaining various equity indices. The relationship of IISL to HDFC AMC is only in respect of the rights granted to use certain trademarks and trade names of the Index in connection with the utilisation of the Index data relating to such Index. The Index is determined, composed and calculated by IISL without regard to HDFC AMC. IISL has no obligation to take the needs of HDFC AMC into consideration in determining, composing or calculating the nIFTY Indices.
IISL do not guarantee the accuracy and/or the completeness of nIFTY Indices or any data included therein and they shall have no liability for any errors, omissions, or interruptions therein. IISL make no warranty, express or implied, as to results to be obtained by HDFC AMC or any other person or entity from the use of nIFTY Indices or any data included therein. IISL make no express or implied warranties, and expressly disclaim all warranties of merchantability or fitness for a particular purpose or use with respect to the Index or any data included therein. Without limiting any of the foregoing, IISL expressly disclaim any and all liability for any damages or losses aris-ing out of the use of NIFTY Indices or any data included therein by any third party, including any and all direct, special, punitive, indirect, or consequential damages (including lost profits), even if notified of the possibility of such damages. An investor, by subscribing or purchasing an interest in the Product(s), will be regarded as having acknowledged, understood and accepted the disclaimer referred to in Clauses above and will be bound by it.
HDFC Floating Rate Income Fund - Short Term PlanMonthly Dividend Option (Past 3 months) Record Date Wholesale Option Wholesale Option - Direct Plan
Cum Div NAV (`)
Dividend per Unit (`) For Cum Div NAV (`)
Dividend per Unit (`) ForIndividuals & HUF Others Individuals & HUF Others
nov 28, 16 10.2505 0.0768 0.0712 10.2512 0.0774 0.0717Dec 26, 16 10.1489 0.0035 0.0032 10.1496 0.0040 0.0037Jan 30, 17 10.2370 0.0671 0.0622 10.2380 0.0678 0.0628Record Date Retail Option
Cum Div NAV (`)
Dividend per Unit (`) ForIndividuals & HUF Others
nov 28, 16 10.2489 0.0757 0.0701Dec 26, 16 10.1474 0.0024 0.0022Jan 30, 17 10.2350 0.0657 0.0608
HDFC Cash Management Fund - Treasury Advantage PlanMonthly Dividend Option (Past 3 months) Record Date Retail Option Retail Option - Direct Plan
Cum Div NAV (`)
Dividend per Unit (`) For Cum Div NAV (`)
Dividend per Unit (`) ForIndividuals & HUF Others Individuals & HUF Others
nov 01, 16 10.1681 0.0546 0.0506 10.2352 0.0670 0.0620nov 28, 16 10.2031 0.0456 0.0422 10.2593 0.0844 0.0782Dec 26, 16 - - - 10.1448 0.0017 0.0015Record Date Wholesale Option
Cum Div NAV (`)
Dividend per Unit (`) ForIndividuals & HUF Others
nov 01, 16 10.1954 0.0599 0.0555nov 28, 16 10.2286 0.0495 0.0459Dec 26, 16 10.1621 0.0015 0.0014
HDFC Corporate Debt Opportunities FundHalf-yearly Dividend Option (Past 2 years)
Record Date Regular Plan Direct Plan
Cum Div NAV (`)
Dividend per Unit (`) For Cum Div NAV (`)
Dividend per Unit (`) For
Individuals & HUF Others Individuals & HUF OthersMar 25, 15 10.7056 0.3397 0.3150 10.7523 0.3750 0.3478Sep 28, 15 10.6648 0.3229 0.2992 10.7159 0.3613 0.3347Mar 28, 16 10.7078 0.1560 0.1445 10.7651 0.1560 0.1445Sep 26, 16 11.1534 0.4842 0.4486 11.2653 0.5649 0.5234
^ Past performance may or may not be sustained in the future.There is no assurance or guarantee to Unit holders as to rate/quantum of dividend distribution nor that the dividends will be paid regularly.All dividends are on face value of ` 10 per Unit. After payment of the dividend, the per Unit nAV falls to the extent of the payout and statutory levy, if any.* Please log on to www.hdfcfund.com for Record Date-wise listing of dividends declared
WAnT TO HAVE THE LATEST InFORMATIOn ABOUT US?Visit us at www.hdfcfund.com
Telephone ServicesToll-free number: 1800 3010 6767 / 1800 419 7676
For any query or suggestions:-
Investors may contact us at:[email protected]
Distributors may contact us at:[email protected]
SMS: HDFCMF to 56767
Registered Office: HDFC House, 2nd Floor, H.T. Parekh Marg, 165-166 Backbay Reclamation, Churchgate, Mumbai - 400 020.
MUTUAL FUND INVESTMENTS ARE SUBJECT TO MARKET RISKS, READ ALL SCHEME RELATED DOCUMENTS CAREFULLY.