january 2016 dresner advisory services, llc - oracle · january 2016 dresner advisory services, llc...
TRANSCRIPT

January 2016
Dresner Advisory Services, LLC
2016 Edition
Location Intelligence Market Study
Wisdom of Crowds® Series
Licensed to Oracle

DAS Location Intelligence Market Study 2016
Disclaimer:
This report is for informational purposes only. You should make vendor and product selections based on multiple information sources, face-to-face meetings, customer reference checking, product demonstrations, and proof-of-concept applications.
The information contained in this Wisdom of Crowds® Location Intelligence Business Intelligence Market Study Report is a summary of the opinions expressed in the online responses of individuals that chose to respond to our online questionnaire and does not represent a scientific sampling of any kind. Dresner Advisory Services, LLC shall not be liable for the content of this report, the study results, or for any damages incurred or alleged to be incurred by any of the companies included in the report as a result of the report’s content.
Reproduction and distribution of this publication in any form without prior written permission is forbidden.
COPYRIGHT 2016 DRESNER ADVISORY SERVICES, LLC Page | 2

DAS Location Intelligence Market Study 2016
Definitions
Business Intelligence Defined Business intelligence (BI) is “knowledge gained through the access and analysis of business information.”
Business Intelligence tools and technologies include query and reporting, OLAP (online analytical processing), data mining and advanced analytics, end-user tools for ad hoc query and analysis, and dashboards for performance monitoring.
Howard Dresner, The Performance Management Revolution: Business Results Through Insight and Action (John Wiley & Sons, 2007)
Location Intelligence Defined Location Intelligence is a form of business intelligence where the dominant dimension used for analysis is location or geography. Most typically, though not exclusively, analyses are conducted by viewing data points overlaid onto an interactive map interface.
COPYRIGHT 2016 DRESNER ADVISORY SERVICES, LLC Page | 3

DAS Location Intelligence Market Study 2016
Contents Definitions ....................................................................................................................... 3
Business Intelligence Defined ...................................................................................... 3
Location Intelligence Defined ....................................................................................... 3
Introduction ..................................................................................................................... 6
About Howard Dresner and Dresner Advisory Services .................................................. 7
About Jim Ericson ........................................................................................................... 8
Focus of Research .......................................................................................................... 9
Benefits of the Study ..................................................................................................... 10
Consumer Guide ........................................................................................................ 10
Supplier Tool .............................................................................................................. 10
External Awareness ................................................................................................ 10
Internal Planning ..................................................................................................... 10
Survey Method and Data Collection .............................................................................. 11
Data Quality ............................................................................................................... 11
Executive Summary ...................................................................................................... 12
Study Demographics ..................................................................................................... 13
Geography ................................................................................................................. 13
Functions ................................................................................................................... 14
Vertical Industries ...................................................................................................... 15
Organization Size ....................................................................................................... 16
Analysis of Findings ...................................................................................................... 17
Importance of Location Intelligence ........................................................................... 17
Level of Geographic Detail Required ......................................................................... 24
Prioritized Geocoding Features .................................................................................. 29
Targeted Users for Location Intelligence ................................................................... 35
Location Intelligence Features ................................................................................... 40
Location Intelligence User Penetration ...................................................................... 46
Devices Where Location Intelligence Will Be Utilized ................................................ 52
Mobile Location Intelligence Features ........................................................................ 58
Required Integration with GIS Vendors ...................................................................... 64 COPYRIGHT 2016 DRESNER ADVISORY SERVICES, LLC
Page | 4

DAS Location Intelligence Market Study 2016
Industry Support for Location Intelligence ..................................................................... 70
Industry Support for Geocoding ................................................................................. 71
Industry Support for Location Intelligence Features ................................................... 73
Industry Support for Third-Party GIS Platforms .......................................................... 75
Industry Support for Mobile Location Intelligence Features ....................................... 76
Demand versus Supply Priorities for Location Intelligence ........................................ 78
Location Intelligence Vendor Ratings ............................................................................ 79
Other Dresner Advisory Services Research Reports .................................................... 80
Appendix: Location Intelligence Survey Instrument ....................................................... 81
COPYRIGHT 2016 DRESNER ADVISORY SERVICES, LLC Page | 5

DAS Location Intelligence Market Study 2016
Introduction This year we celebrate the ninth anniversary of Dresner Advisory Services! Our thanks to all of you for your continued support and ongoing encouragement.
Since our founding in 2007, we have worked hard to set the “bar” high—challenging ourselves to innovate and lead the market—offering ever greater value with each successive year.
Our first market report in 2010 set the stage for where we are today. Since that time we have expanded our agenda and have added new research topics every year since. For 2016 we plan to release 15 major reports, including our original BI flagship report—in its seventh year of publication!
For 2016, in addition to our usual lineup of research, we are adding coverage for systems integrators as well as a new convergence topic which we call Collective Insights TM.
Like so many of our industry reports, we invest in those that we believe will emerge and become significant. Of course, early on it’s impossible to be certain. It’s only after several years that clear trends begin to materialize.
With this, our third year of publishing our Location Intelligence report, some of these trends are just now becoming apparent.
We hope you enjoy this report!
Best,
Chief Research Officer Dresner Advisory Services
COPYRIGHT 2016 DRESNER ADVISORY SERVICES, LLC Page | 6

DAS Location Intelligence Market Study 2016
About Howard Dresner and Dresner Advisory Services The DAS Location Intelligence Market Study was conceived, designed and executed by Dresner Advisory Services, LLC—an independent advisory firm—and Howard Dresner, its President, Founder and Chief Research Officer.
Howard Dresner is one of the foremost thought leaders in business intelligence and performance management, having coined the term “Business Intelligence” in 1989. He
has published two books on the subject, The Performance Management Revolution – Business Results through Insight and Action (John Wiley & Sons, Nov. 2007) and Profiles in Performance – Business Intelligence Journeys and the Roadmap for Change (John Wiley & Sons, Nov. 2009). He lectures at forums around the world and is often cited by the business and trade press.
Prior to Dresner Advisory Services, Howard served as chief strategy officer at Hyperion Solutions and was a research fellow at Gartner, where he led its business intelligence research practice for 13 years.
Howard has conducted and directed numerous in-depth primary research studies over the past two decades and is an expert in analyzing these markets.
Through the Wisdom of Crowds® Business Intelligence market research reports, we engage with a global community to redefine how research is created and shared. Other research reports include:
- Wisdom of Crowds “Flagship” Business Intelligence Market study
- Advanced and Predictive Analytics
- Cloud Computing and Business Intelligence
- Collaborative Computing and Business Intelligence
- Internet of Things and Business Intelligence
- Small and Mid-Sized Enterprise Business Intelligence
Howard conducts a weekly Twitter “tweetchat” on Fridays at 1:00 p.m. ET. During these live events the #BIWisdom “tribe” discusses a wide range of business intelligence topics.
You can find more information about Dresner Advisory Services at www.dresneradvisory.com.
COPYRIGHT 2016 DRESNER ADVISORY SERVICES, LLC Page | 7

DAS Location Intelligence Market Study 2016
About Jim Ericson Jim Ericson is a research director with Dresner Advisory Services.
Jim has served as a consultant and journalist who studies end-user management practices and industry trending in the data and information management fields.
From 2004 to 2013 he was the editorial director at Information Management magazine (formerly DM Review), where he created architectures for user and industry coverage for hundreds of contributors across the breadth of the data and information management industry.
As lead writer he interviewed and profiled more than 100 CIOs, CTOs, and program directors in a 2010-2012 program called “25 Top Information Managers.” His related feature articles earned ASBPE national bronze and multiple Mid-Atlantic region gold and silver awards for Technical Article and for Case History feature
writing.
A panelist, interviewer, blogger, community liaison, conference co-chair, and speaker in the data-management community, he also sponsored and co-hosted a weekly podcast in continuous production for more than five years.
Jim’s earlier background as senior morning news producer at NBC/Mutual Radio Networks and as managing editor of MSNBC’s first Washington, D.C. online news bureau cemented his understanding of fact-finding, topical reporting, and serving broad audiences.
COPYRIGHT 2016 DRESNER ADVISORY SERVICES, LLC Page | 8

DAS Location Intelligence Market Study 2016
Focus of Research In this study, we address key location intelligence issues including:
• Perceptions and intentions surrounding location intelligence • End-user requirements and features:
o Geocoding support o Location intelligence capabilities o Third-party GIS integration o Mobile location intelligence features
• Industry support for location intelligence • User requirements versus industry capabilities • Vendor ratings
.
COPYRIGHT 2016 DRESNER ADVISORY SERVICES, LLC Page | 9

DAS Location Intelligence Market Study 2016
Benefits of the Study The DAS Location Intelligence Market Study provides a wealth of information and analysis, offering value to both consumers and producers of business intelligence technology and services.
Consumer Guide As an objective source of industry research, consumers use the DAS Location Intelligence Market Study to understand how their peers leverage and invest in location intelligence and related technologies.
Using our unique vendor performance measurement system, users glean key insights into BI software supplier performance, which enables:
• Comparisons of current vendor performance to industry norms • Identification and selection of new vendors
Supplier Tool Vendor licensees use the DAS Location Intelligence Market Study in several important ways:
External Awareness • Build awareness for business intelligence markets and supplier brands, citing
DAS Location Intelligence Market Study trends and vendor performance • Gain lead and demand generation for supplier offerings through association with
DAS Location Intelligence Market Study brand, findings, webinars, etc.
Internal Planning • Refine internal product plans and align with market priorities and realities as
identified in the DAS Location Intelligence Market Study • Better understand customer priorities, concerns, and issues • Identify competitive pressures and opportunities
COPYRIGHT 2016 DRESNER ADVISORY SERVICES, LLC Page | 10

DAS Location Intelligence Market Study 2016
Survey Method and Data Collection As with all of our Wisdom of Crowds® Market Studies, we constructed a survey instrument to collect data and used social media and crowdsourcing techniques to recruit participants. Data for this report was collected between July and October of 2015.
Data Quality We carefully scrutinized and verified all respondent entries to ensure that only qualified participants were included in the study.
COPYRIGHT 2016 DRESNER ADVISORY SERVICES, LLC Page | 11

DAS Location Intelligence Market Study 2016
Executive Summary • Among 25 topics under study, location intelligence ranks 12th, at the midpoint of
technologies and initiatives strategic to business intelligence (p. 17). • More than half of respondents say location intelligence is "critically" or "very"
important, a view that has increased over time (pp.18-23). • Respondents are interested or pursuing activity across a wide span of location
parameters, led increasingly by province/state and country (pp. 24-28). • Respondent feature priorities are led by built-in (native) geocoding, followed by
street level and automated geocoding support (pp. 30-35). • User targets for location intelligence follow a hierarchy from executives through
management ranks and increasingly external parties (pp. 36-40). • The most important location intelligence features include map-based
visualizations, drill down, and dashboard embedding (pp. 41-46). • User penetration of location intelligence remains modest in 2016 (pp. 47-52). • Users pursue a mix of location intelligence across mobile, desktop/laptop, and
multiple platforms but increasingly prefer the desktop/laptop (pp. 53-58). • Mobile location feature priorities are led by location based query filtering,
followed by reverse geocoding and geo fence alerting (pp. 59-64). • Respondents overwhelmingly specify Google (followed distantly by Esri,
database extensions, Microsoft Bing, and lesser targets) as required integration with GIS vendors (pp. 65-70).
• If not hype-laden enthusiasm, the software industry has a positive view of location intelligence that has shifted from "important" to "very important" (p. 71).
• After the top feature, built-in (native) geocoding, industry support for geocoding features is somewhat poorly aligned with user preferences (p. 72).
• Over the last three years, industry support for core integration of geocoding features has increased generally (fig. 60) though not in line with customer priorities (p. 73).
• Business intelligence vendors are attending to a span of location intelligence capabilities with top features supported by more than 80 percent, somewhat in line with user priorities (pp. 74-75).
• Industry support for Google, Esri, Microsoft Bing, and database extensions are mostly in line with user demands for GIS platform integration (p. 76).
• Industry support for mobile location intelligence features remains immature with less than 50 percent support for location-based query filtering (p. 77-78).
• Industry estimations of the importance of location intelligence are somewhat higher than end-user sentiment, suggesting an emerging market dynamic (p. 79).
COPYRIGHT 2016 DRESNER ADVISORY SERVICES, LLC Page | 12
DAS Location Intelligence Market Study 2016
Study Demographics We sought a rich cross-section of data across geographies, functions, organization size, and vertical industries. We believe that, unlike other industry research, we offer a more characteristic sample and better indicator of true market dynamics.
We constructed cross-tab analyses using these demographics to identify and illustrate important industry trends.
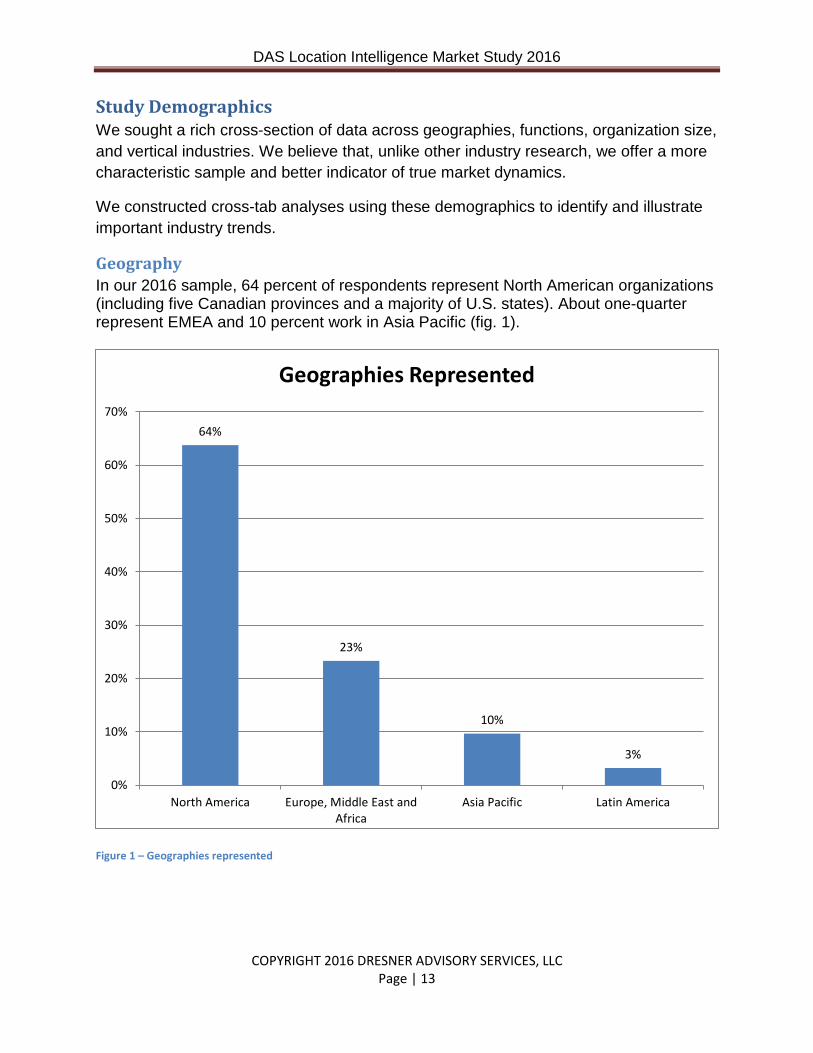
Geography In our 2016 sample, 64 percent of respondents represent North American organizations (including five Canadian provinces and a majority of U.S. states). About one-quarter represent EMEA and 10 percent work in Asia Pacific (fig. 1).
Figure 1 – Geographies represented
64%
23%
10%
3%
0%
10%
20%
30%
40%
50%
60%
70%
North America Europe, Middle East andAfrica
Asia Pacific Latin America
Geographies Represented
COPYRIGHT 2016 DRESNER ADVISORY SERVICES, LLC Page | 13

DAS Location Intelligence Market Study 2016
Functions IT accounts for the largest group of respondents (50 percent) by function. Twenty percent come from executive management and the remaining 30 percent mostly represent finance, sales and marketing, and R&D (fig. 2).
Tabulating results by function enables us to compare and contrast the plans and priorities of different departments within organizations.
Figure 2 - Functions represented
50%
20%
11% 8% 8%
1% 2%
0%
10%
20%
30%
40%
50%
60%
InformationTechnology
(IT)
ExecutiveManagement
Finance Sales andMarketing
Research andDevelopment
(R&D)
Manufacturing Other
Functions Represented
COPYRIGHT 2016 DRESNER ADVISORY SERVICES, LLC Page | 14

DAS Location Intelligence Market Study 2016
Vertical Industries Vertical industry participation in 2016 is well distributed and led by technology (17 percent) followed by consulting (12 percent), healthcare (10 percent), and financial services (10 percent). We encourage the participation of consultants—who often have deeper industry knowledge than their customer counterparts. Third-party relationships give us insight into the partner ecosystem for BI vendors (fig. 3).
Figure 3 - Vertical industries represented
17%
12%
10% 10%
9%
7%
6% 5%
2% 2% 2% 2% 2% 1% 1% 1% 1% 1%
6%
0%
2%
4%
6%
8%
10%
12%
14%
16%
18%
Vertical Industries Represented
COPYRIGHT 2016 DRESNER ADVISORY SERVICES, LLC Page | 15

DAS Location Intelligence Market Study 2016
Organization Size Our survey sample is well distributed across organizations of different sizes (fig. 4). Twenty-eight percent come from small (1-100 employees) organizations, 28 percent represent midsize (101-1,000) organizations, and the remaining 44 percent represent large organizations of 1,000 or more.
Segmenting respondents by organization size helps us identify differences in behavior, attitudes, and planning.
Figure 4 – Organization sizes represented
28% 28%
17%
27%
0%
5%
10%
15%
20%
25%
30%
1 - 100 101 - 1000 1001 - 5000 More than 5000
Organization Sizes Represented
COPYRIGHT 2016 DRESNER ADVISORY SERVICES, LLC Page | 16

DAS Location Intelligence Market Study 2016
Analysis of Findings In this third annual market study, we examine the nature of location intelligence, exploring user sentiment and perceptions, the nature of current implementations, and plans for the future.
Importance of Location Intelligence Among 25 topics under study, location intelligence ranks 12th, the midpoint among technologies and initiatives strategic to business intelligence in 2016 (fig. 5). Location intelligence trails traditional topics including dashboards, end-user self-service, and data visualization, but is ahead of other familiar topics that include cloud computing and big data. As a maturing BI-related topic under study, we believe this attitude reflects a level of awareness and valued experience with location intelligence.
Figure 5 - Technologies and initiatives strategic to business intelligence
0% 20% 40% 60% 80% 100%
DashboardsEnd-user "self service"
Data warehousingAdvanced visualization
Integration with operational processesData discovery
Enterprise planning/budgetingData mining, advanced algorithms,…Embedded BI (contained within an…
Mobile device supportEnd-user data "blending" (data mashups)
Location intelligence/analyticsCollaborative support for group-based…
In-memory analysisSoftware-as-a-service and cloud…
Search-based interfacePre-packaged vertical/functional…
Big data (e.g., Hadoop)Ability to write to transactional…
Text analyticsSocial media analysis (Social BI)
Open source softwareComplex event processing (CEP)
Internet of Things (IoT)Cognitive BI (e.g., artificial intelligence-…
Technologies and Initiatives Strategic to Business Intelligence
Critical Very important Important Somewhat important Not important
COPYRIGHT 2016 DRESNER ADVISORY SERVICES, LLC Page | 17

DAS Location Intelligence Market Study 2016
Respondents have a generally high estimation of the importance of location intelligence in 2016 (fig. 6). More than half consider the topic to be "critically" or "very" important. Another 34 percent say location intelligence is, at minimum, "somewhat" important, and just 13 percent say it is "not important." This finding is well ahead of other “hot” topics as already noted.
Figure 6 - Importance of location intelligence
Critically important, 16.0%
Very important, 36.9%
Somewhat important, 34.2%
Not important, 12.8%
Importance of Location Intelligence
COPYRIGHT 2016 DRESNER ADVISORY SERVICES, LLC Page | 18

DAS Location Intelligence Market Study 2016
Though experience varies from organization to organization, the perceived importance of location intelligence increased slightly across three years of study (fig. 7). Though views are similarly mixed over time, we believe this shows a level of "stickiness" rather than a typical hype cycle of excitement and disillusion. Slightly fewer respondents say location intelligence is "critical" compared to 2015, but the "very important" to "critical segment has grown slightly. Over time, fewer respondents say location intelligence is "not important. Shifts in sentiment also could reflect experience or greater familiarity with the technology’s importance.
Figure 7 – Importance of location intelligence 2014 to 2016
2
2.1
2.2
2.3
2.4
2.5
2.6
2.7
2.8
2.9
3
0%
10%
20%
30%
40%
50%
60%
70%
80%
90%
100%
2014 2015 2016
Location Intelligence Importance 2014 to 2016
Critically important Very important Somewhat important
Not important Mean
COPYRIGHT 2016 DRESNER ADVISORY SERVICES, LLC Page | 19

DAS Location Intelligence Market Study 2016
We would generally expect respondents who deal with the “outside world” would value location intelligence more than internal or back-office functions. In 2016, while high marks for sales and marketing support this notion, we also find the highest levels of “critical” importance in research and development (R&D) and information technology (fig. 8). One perspective to explain this might be that priorities and budgeting for location intelligence initiatives are becoming more important to support functions in IT and R&D. Somewhat curiously, finance stakeholders have similar interest and even greater estimations of “critical” importance than do traditional trendsetters in executive management.
Figure 8 - Importance of location intelligence by function
0% 10% 20% 30% 40% 50% 60% 70% 80% 90% 100%
Research and Development (R&D)
Sales and Marketing
Information Technology (IT)
Executive Management
Finance
Importance of Location Intelligence by Function
Critically important Very important Somewhat important Not important
COPYRIGHT 2016 DRESNER ADVISORY SERVICES, LLC Page | 20

DAS Location Intelligence Market Study 2016
Culture, custom, and circumstance are tied to geography and drive the perceived importance of location intelligence across different regions. Geographies with an identified preponderance of smartphones and tablets (versus landlines, PCs, and networks), the use of social media, and local customs (such as banking and payment via smart devices) all drive attitudes toward location intelligence.
In 2016, Latin America, Asia Pacific and EMEA place a slightly higher mean level of importance on location intelligence than North America, though the difference narrowed somewhat over time (fig. 9). “Critical” importance is highest in Asia Pacific followed by Latin America. North America, however, holds equal or higher combined “critical” and “very important” interest compared to all other geographical regions.
Figure 9 - Importance of location intelligence by geography
0
0.5
1
1.5
2
2.5
3
3.5
4
0%
10%
20%
30%
40%
50%
60%
70%
80%
90%
100%
Latin America Asia Pacific North America Europe, MiddleEast and Africa
Importance of Location Intelligence by Geography
Critically important
Very important
Somewhat important
Not important
Mean
COPYRIGHT 2016 DRESNER ADVISORY SERVICES, LLC Page | 21

DAS Location Intelligence Market Study 2016
Small organizations, most flexible to adopting enterprise change through technology experimentation, are very likely to view location intelligence as very important or critically important to their planning (fig. 10). These results are almost exactly replicated in very large organizations of 5,000 or more employees where standardization and economies of scale are benefits of widespread adoption. As we often find, as organizational headcount increases, we see a familiar U-shaped or “ski jump” effect where interest declines and then increases among the largest organizations with greater resources and vision of scale.
Figure 10 - Importance of location intelligence by organization size
0
0.5
1
1.5
2
2.5
3
3.5
4
0%
10%
20%
30%
40%
50%
60%
70%
80%
90%
100%
1 - 100 101 - 1000 1001 - 5000 More than 5000
Importance of Location Intelligence by Organization Size
Critically important
Very important
Somewhat important
Not important
Mean
COPYRIGHT 2016 DRESNER ADVISORY SERVICES, LLC Page | 22

DAS Location Intelligence Market Study 2016
Across the variables studied, the perceived importance of location intelligence in 2016 differentiates most notably by industry. As we found in 2015, retail and wholesale organizations are most likely to see location intelligence as critically or very important and, perhaps, a cost of doing business (fig. 11). Manufacturing, with distributed capital assets and logistic interests, are the next most likely to view location intelligence as critical or very important. Healthcare and education, which have the lowest mean interest, also have select audiences with critical interest in location intelligence, which may reflect select initiatives such as asset tracking.
Figure 11 - Importance of location intelligence by selected vertical industry
0
0.5
1
1.5
2
2.5
3
3.5
4
0%
10%
20%
30%
40%
50%
60%
70%
80%
90%
100%
Importance of Location Intelligence by Selected Vertical Industry
Critically important
Very important
Somewhat important
Not important
Mean
COPYRIGHT 2016 DRESNER ADVISORY SERVICES, LLC Page | 23

DAS Location Intelligence Market Study 2016
Level of Geographic Detail Required The granularity or level of geographic detail that respondents say is more or less important to them speaks to the business processes or analysis related to location intelligence. Postal codes or countries, for example, are useful to supply chain or fulfillment but also to sales region performance or demographics. Latitudinal/longitudinal or custom geographies that are less address related are important assets for discovery/recovery, natural resources, wellheads, or unmarked boundaries.
As in previous studies, respondents are interested or pursuing activity across a wide span of marked, unmarked, and virtual location parameters (fig. 12). In 2016, a large majority of respondents identify at least some value in mapped locations of province/state (84 percent), country (79 percent), or postal codes (83 percent). These map to traditional enterprise systems supported by business intelligence. A significant percentage (65 percent or more) identifies value in latitude/longitude, custom mapping, and physical plant/store mapping.
Figure 12 - Level of geographic detail
1
1.2
1.4
1.6
1.8
2
2.2
2.4
2.6
2.8
3
0%
10%
20%
30%
40%
50%
60%
70%
80%
90%
100%
Level of Geographic Detail
Critical Very important Somewhat important Not important Mean
COPYRIGHT 2016 DRESNER ADVISORY SERVICES, LLC Page | 24

DAS Location Intelligence Market Study 2016
Figure 13 shows three years of geographic detail requirements prioritized from left to right by their 2016 rank (fig. 13). The two most popular 2016 requirements, province/state and country, are the same as found in 2015 but declined slightly. The third most popular, postal code, increased slightly year by year. Other popular measures (latitude/longitude, physical facility, custom geography) declined slightly from 2015 levels..
Figure 13 - Level of geographic detail required 2014 to 2016
0.00
0.50
1.00
1.50
2.00
2.50
3.00
Level of Geographic Detail Required 2014 to 2016
2014
2015
2016
COPYRIGHT 2016 DRESNER ADVISORY SERVICES, LLC Page | 25

DAS Location Intelligence Market Study 2016
At a glance, fig. 14 shows sales and marketing as the function most likely to show interest in a range (province/state, country, latitude/longitude, custom geography) of geographic detail levels. Research and development (country, facility) and executive management (postal code) are the next most interested and closely followed by manufacturing. Finance trails interest in all levels of detail.
Figure 14 - Level of geographic detail by function
0
0.5
1
1.5
2
2.5
3
3.5
Level of Geographic Detail by Function
Executive Management Sales and MarketingResearch and Development (R&D) Information Technology (IT)Finance Mean
COPYRIGHT 2016 DRESNER ADVISORY SERVICES, LLC Page | 26

DAS Location Intelligence Market Study 2016
Very large organizations with more than 5,000 employees lead interest in all levels of geographic detail (fig. 15). This implies that scale, which can leverage variety and high-volume processes, is a driver of interest. Small (1-100 employees) organizations are the next most interested in geographic details. Midsized (101-1,000) and some large (1,001-5,000) organizations generally trail small and very large organizations. The parameter with the most affinity for organizations of any size is postal code.
Figure 15 - Level of geographic detail by organization size
0
0.5
1
1.5
2
2.5
3
3.5
Level of Geographic Detail by Organization Size
1 - 100 101 - 1000 1001 - 5000 More than 5000 Mean
COPYRIGHT 2016 DRESNER ADVISORY SERVICES, LLC Page | 27

DAS Location Intelligence Market Study 2016
Retail and wholesale have the greatest affinity with several parameters of geographic detail, notably postal code, province state, physical store, and latitude/longitude (fig. 16). This interest relates predictably to retail's emphasis on supply chain management/execution, fulfillment, and logistics.
As found in earlier studies, government has the greatest interest in custom geographies and latitude/longitude, consistent with managing public infrastructure, natural resources, and capital assets. Manufacturing's greatest interest falls expectedly to physical plant and property assets. Healthcare's greatest interest is in postal code, followed by province/state.
Figure 16 - Level of geographic detail by vertical industry
0.0
0.5
1.0
1.5
2.0
2.5
3.0
3.5
Level of Geographic Detail by Vertical Industry
Retail and Wholesale
Business services
Manufacturing
Government
Haealthcare
Mean
COPYRIGHT 2016 DRESNER ADVISORY SERVICES, LLC Page | 28

DAS Location Intelligence Market Study 2016
Prioritized Geocoding Features Respondents place the greatest importance (28 percent say critical and another 33 percent say very important) on built-in or native geocoding (fig. 17). (This assumes a native understanding of geography on the part of the software.)
Street-level geocoding is critical or very important to 45 percent of respondents. (This requirement assumes the software can cross-reference latitude/longitude and street-level address.)
More than 40 percent say automated geocoding (in which software automatically recognizes geographic data elements, for example, address) is critical or very important.
Geocoding features (none of which are mutually exclusive) for customer-created extensions, offline, and worldwide support are slightly less critical but at least somewhat important to at least half of all respondents.
Figure 17 - Prioritized geocoding features
0% 20% 40% 60% 80% 100%
Built-in (native)geocoding (e.g.,country, region,
postal code, CBSA)
Street-levelgeocoding support
Automatedgeocoding support
Customer extensionsto map data (e.g.,
custom POIs)
Offline geocodingsupport
Worldwide geocodingsupport
Prioritized Geocoding Features
Critical Very important Somewhat important Not important
COPYRIGHT 2016 DRESNER ADVISORY SERVICES, LLC Page | 29

DAS Location Intelligence Market Study 2016
Year over year, interest in geocoding fell slightly across most measures and closer to 2014 sentiment. Interest in built-in (native) geocoding remained the most popular feature for a third year, followed by automated support and street-level geocoding. Interest in customer extensions fell most noticeably to last place among the features sampled (fig. 18). Overall, these features lend themselves to less manual manipulation or input.
Figure 18 - Prioritized geocoding features 2014 to 2016
0.00
0.50
1.00
1.50
2.00
2.50
3.00
Built-in (native)geocoding (e.g.,country, region,
postal code,CBSA)
Automatedgeocoding
support
Street-levelgeocoding
support
Offlinegeocoding
support
Worldwidegeocoding
support
Customerextensions to
map data (e.g.,custom POIs)
Prioritized Geocoding Features 2014 to 2016
2014 2015 2016
COPYRIGHT 2016 DRESNER ADVISORY SERVICES, LLC Page | 30

DAS Location Intelligence Market Study 2016
As with cumulative prioritization, the most prioritized feature identified by function in 2016 is built-in or native geocoding related to political boundaries or regions (fig. 19). Sales and marketing lead interest in the top three prioritized geocoding features and show above-mean interest in the full range of prioritized features. Generally, executive management and research and development are the next most interested; IT interest mostly follows mean levels and finance expectedly trails interest in all geocoding features.
Figure 19 - Prioritized geocoding features by function
0
0.5
1
1.5
2
2.5
3
3.5
Built-in (native)geocoding (e.g.,country, region,
postal code, CBSA)
Street-levelgeocoding support
Automatedgeocoding support
Customer extensionsto map data (e.g.,
custom POIs)
Offline geocodingsupport
Worldwide geocodingsupport
Prioritized Geocoding Features by Function
Executive Management Sales and MarketingResearch and Development (R&D) Information Technology (IT)Finance Mean
COPYRIGHT 2016 DRESNER ADVISORY SERVICES, LLC Page | 31

DAS Location Intelligence Market Study 2016
Organizations in different geographies (led by EMEA) all place the highest priority on built-in or native geocoding against country, region, or postal code information (fig. 20). Mean interest across all prioritized features is mostly consistent across North America, EMEA, and Asia Pacific geographies. (Latin America is excluded due to small sample size.) Mean levels below 3.0 place all prioritized features as only somewhat important to respondents.
Figure 20 - Prioritized geocoding features by geography
0
0.5
1
1.5
2
2.5
3
Built-in (native)geocoding (e.g.,country, region,
postal code, CBSA)
Street-levelgeocoding support
Automatedgeocoding support
Customer extensionsto map data (e.g.,
custom POIs)
Offline geocodingsupport
Worldwide geocodingsupport
Prioritized Geocoding Features by Geography
North America Asia/Pacific Europe, Middle East and Africa Mean
COPYRIGHT 2016 DRESNER ADVISORY SERVICES, LLC Page | 32

DAS Location Intelligence Market Study 2016
Organizations of all sizes consistently place the highest priority on built-in or native geocoding against country, region, or postal code information (fig. 21). Small (1-100 employees) and very large (>5,000) organizations generally show the greatest interest in geocoding features, and midsized (101-1,000) organizations show the least interest. Small organizations have the greatest affinity to built-in (native) geocoding, street-level and automated geocoding support. Very large organizations have the highest interest in customer extensions, offline support, and world geocoding support.
Figure 21 - Prioritized geocoding features by organization size
0
0.5
1
1.5
2
2.5
3
3.5
Built-in (native)geocoding (e.g.,country, region,
postal code, CBSA)
Street-levelgeocoding support
Automatedgeocoding support
Customer extensionsto map data (e.g.,
custom POIs)
Offline geocodingsupport
Worldwide geocodingsupport
Prioritized Geocoding Features by Organization Size
1 - 100 101 - 1000 1001 - 5000 More than 5000 Mean
COPYRIGHT 2016 DRESNER ADVISORY SERVICES, LLC Page | 33

DAS Location Intelligence Market Study 2016
Retail and wholesale, government, and business services generally lead interest in several categories of geocoding features (fig. 22). Government respondents show outsized interest in street level and offline support and low interest in worldwide geocoding support. Retail and wholesale respondents lead interest in built-in (native) geocoding and automated support. Business services shows the highest interest in customer extensions to map data.
Figure 22 - Prioritized geocoding features by selected vertical industry
0.0
0.5
1.0
1.5
2.0
2.5
3.0
3.5
Built-in (native)geocoding (e.g.,country, region,
postal code, CBSA)
Street-levelgeocoding support
Automatedgeocoding support
Customer extensionsto map data (e.g.,
custom POIs)
Offline geocodingsupport
Worldwide geocodingsupport
Prioritized Geocoding Features by Vertical Industry
Retail and Wholesale Government Business services
Manufacturing Financial services Mean
COPYRIGHT 2016 DRESNER ADVISORY SERVICES, LLC Page | 34

DAS Location Intelligence Market Study 2016
Targeted Users for Location Intelligence The targeted users of location intelligence in 2016 follow a traditional linear hierarchy that extends from executives down through the management ranks and finally to external parties (fig. 23). More than half of executives are primary targets. Middle managers (44 percent) and line managers (38 percent) are the next most served as primary targets. Eighty percent or more of executives and middle managers are targeted as either primary or secondary targeted users. Most customers and a large majority of suppliers still fall into the ignored “not applicable” category. Organization size and management structure color the distinctions between executives, middle, and line managers; but, as in 2015, respondents say that location intelligence targets organizational leaders more than rank-and-file workers.
Figure 23 – Targeted users for location intelligence
0%
10%
20%
30%
40%
50%
60%
70%
80%
90%
100%
Executives Middlemanagers
Line managers Individualcontributors and
professionals
Customers Suppliers
Targeted Users for Location Intelligence
Primary Secondary Not applicable
COPYRIGHT 2016 DRESNER ADVISORY SERVICES, LLC Page | 35

DAS Location Intelligence Market Study 2016
Despite the historical emphasis toward targeting of executive and middle management audiences, location intelligence is moving downstream to line managers and individual contributors at an uneven pace (fig. 24). That said, a 2015 increase in targeting line managers and individual contributors reversed somewhat to 2014 levels. Targeting of customers and suppliers increased somewhat in 2016 though remain at low levels. Anecdotally, there is a lingering hesitancy toward data sharing and fear of errors or contradictions in data that could challenge relationships among partners.
Figure 24 - Primary location intelligence targeted users 2014 to 2016
0%
10%
20%
30%
40%
50%
60%
Executives Middlemanagers
Line managers Individualcontributors
andprofessionals
Customers Suppliers
Primary Location Intelligence Targeted Users 2014 to 2016
2014
2015
2016
COPYRIGHT 2016 DRESNER ADVISORY SERVICES, LLC Page | 36

DAS Location Intelligence Market Study 2016
Targets by geography vary somewhat in 2016, reflective of regional customs and business structure (fig. 25). Executives are most targeted in all geographies except EMEA, which for the first time targets middle managers (49 percent) and line managers (48 percent) above executives (44 percent) and all others. North America and Asia Pacific pay the most attention to individual contributors in 2016 but otherwise follow the “trickle-down” distribution by rank of executive through external parties.
Figure 25 – Primary targets for location intelligence by geography
0%
10%
20%
30%
40%
50%
60%
North America Asia/Pacific Latin America Europe, Middle East andAfrica
Primary Targets for Location Intelligence by Geography
Executives Middle managers
Line managers Individual contributors and professionals
Customers Suppliers
COPYRIGHT 2016 DRESNER ADVISORY SERVICES, LLC Page | 37

DAS Location Intelligence Market Study 2016
Across enterprises of different size, executives and middle managers followed by individual contributors, are the most likely target audience for location intelligence (fig. 26). Small organizations, which are more likely to value coworkers collegially or equally, are apt to label more users “executives.” Small organizations are also less likely than larger peers to categorize line managers. Midsized (101-1,000 employees) organizations place the greatest emphasis on middle management. In a likely reflection of the distributed and increasingly outsourced workplace, very large (>5,000) organizations in 2016 now target individual contributors with the same frequency as middle and line managers. Very large organizations are also most likely to target customers, a preference formerly held by small organizations.
Figure 26 - Primary targets for location intelligence by organization size
0%
10%
20%
30%
40%
50%
60%
1 - 100 101 - 1000 1001 - 5000 More than 5000
Primary Targets for Location Intelligence by Organization Size
Executives Middle managers
Line managers Individual contributors and professionals
Customers Suppliers
COPYRIGHT 2016 DRESNER ADVISORY SERVICES, LLC Page | 38

DAS Location Intelligence Market Study 2016
The primary targets for location intelligence skew strongly when differentiated by vertical industry (fig. 27). Healthcare is extremely focused on senior management, almost to the exclusion of other functions; financial services and business services also have well-above-mean focus on executive empowerment. Manufacturing conversely deemphasizes executives in favor of operational resources including mostly middle managers, line managers, and individual contributors. Retail and wholesale serves a more balanced mix of executives, managers, and individual contributors.
Figure 27 - Primary targets for location intelligence by selected vertical industry
0%
10%
20%
30%
40%
50%
60%
70%
80%
Healthcare Education Financial services Manufacturing Retail andWholesale
Business services
Primary Targets for Location Intelligence by Selected Vertical Industry
Executives Middle managers
Line managers Individual contributors and professionals
Customers Suppliers
COPYRIGHT 2016 DRESNER ADVISORY SERVICES, LLC Page | 39

DAS Location Intelligence Market Study 2016
Location Intelligence Features As we have historically found, the most important location intelligence features identified by respondents in 2016 are also the most conventional: map-based visualization of information, drill-down navigation that includes zoom and pan, and maps that are embedded in dashboards or other displays (fig. 28). These top three categories are at least somewhat important to more than 80 percent of respondents. Layered visualizations and value/range shading are the two next most important features and are considered critical or very important by close to 60 percent of respondents. Interestingly, integration with third-party GIS systems (e.g., Google, ESRI) are somewhat important or not important to a majority of respondents.
Figure 28 - Location intelligence prioritized features
0% 20% 40% 60% 80% 100%
Map-based visualization of data/information
Drill-down navigation through map interface
Dashboard inclusion of maps
Layering of visualizations on top of maps (e.g.,heat maps, cartograms)
Value/range-based shading of maps
Use of symbols to depict values
Integration with third party GIS systems (e.g., ESRI,Google Maps)
Custom region definition and selection (e.g.,polygons, geofencing)
Support for location calculations (e.g., drive time,distance, routing)
Choropleths (area fill) maps
Animation of data on maps
Off-line mapping
Syndicated demographic/psychographic dataintegration (e.g., Experian, Axiom)
Support for interior spaces (e.g., retail stores,office buildings, conference centers)
Location Intelligence Prioritized Features
Critical Very important Somewhat important Not important #N/A
COPYRIGHT 2016 DRESNER ADVISORY SERVICES, LLC Page | 40

DAS Location Intelligence Market Study 2016
In 2016, interest in location intelligence features fell slightly across most features (fig. 29). Map-based visualization remains the most important feature, followed by drill-down navigation, dashboard inclusion, layering of visualizations, and other conventional feature preferences. Support for location calculations moved ahead of area fill maps in 2016.
Figure 29 - Location intelligence - prioritized features 2014 to 2016
0.00
0.50
1.00
1.50
2.00
2.50
3.00
3.50
Location Intelligence - Prioritized Features 2014 to 2016
2014 2015 2016
COPYRIGHT 2016 DRESNER ADVISORY SERVICES, LLC Page | 41

DAS Location Intelligence Market Study 2016
By function, sales and marketing holds the most bullish interest across the full span of location intelligence features (fig. 30) and the highest overall interest in several predictable sales support areas including map-based visualization, drill-down navigation, dashboard inclusion, and layering of visualizations. R&D is generally the next-most interested in features, followed by information technology, executives, and finance. Executives appear to have the greatest interest in use of symbols to depict values, and third-party GIS integration.
Figure 30 - Location intelligence prioritized features by function
1
1.5
2
2.5
3
3.5
4
Map-based visualization ofdata/information
Drill-down navigation throughmap interface
Dashboard inclusion of maps
Layering of visualizations ontop of maps (e.g., heat maps,
cartograms)
Value/range-based shading ofmaps
Use of symbols to depict values
Integration with third party GISsystems (e.g., ESRI, Google
Maps)Custom region definition and
selection (e.g., polygons,geofencing)
Support for locationcalculations (e.g., drive time,
distance, routing)
Choropleths (area fill) maps
Animation of data on maps
Off-line mapping
Syndicateddemographic/psychographic
data integration (e.g.,…
Support for interior spaces(e.g., retail stores, office
buildings, conference centers)
Location Intelligence Prioritized Features by Function
Executive Management Sales and Marketing Research and Development (R&D)Information Technology (IT) Finance
COPYRIGHT 2016 DRESNER ADVISORY SERVICES, LLC Page | 42

DAS Location Intelligence Market Study 2016
Respondents in all geographies (led slightly by North America) show similar favorable interest to the most popular feature—map-based visualization (fig. 31). Latin American interest leads several top categories including drill-down navigation, dashboards, layering on maps, range-based shading, use of symbols, and GIS integration. Asia Pacific interest tends to trail among more nuanced location intelligence features, including dashboards, layering, symbols, and custom regions. North American and EMEA interest falls in the middle for most feature priorities.
Figure 31 - Location intelligence prioritized features by geography
1
1.5
2
2.5
3
3.5
4
Map-based visualization ofdata/information
Drill-down navigation throughmap interface
Dashboard inclusion of maps
Layering of visualizations ontop of maps (e.g., heat maps,
cartograms)
Value/range-based shading ofmaps
Use of symbols to depictvalues
Integration with third partyGIS systems (e.g., ESRI, Google
Maps)Custom region definition and
selection (e.g., polygons,geofencing)
Support for locationcalculations (e.g., drive time,
distance, routing)
Choropleths (area fill) maps
Animation of data on maps
Off-line mapping
Syndicateddemographic/psychographic
data integration (e.g.,…
Support for interior spaces(e.g., retail stores, office
buildings, conference centers)
Location Intelligence Prioritized Features by Geography
North America Asia/Pacific Latin America Europe, Middle East and Africa
COPYRIGHT 2016 DRESNER ADVISORY SERVICES, LLC Page | 43

DAS Location Intelligence Market Study 2016
Organizations of different sizes show varying interest in the range of location intelligence features we sampled (fig. 32). Small organizations (1-100 employees) have slightly higher interest in fundamental features including map-based visualizations and dashboards. Small and very large (>5,000) organizations report similar interest in drill-down navigation, layered visualizations, range-based shading, and use of symbols. Very large organizations have the highest interest in GIS integration, custom regions, support for location calculations and animations. Mid-sized (101-1000) and some large (1,001-5,000) organizations have the least interest across the range of location intelligence features.
Figure 32 - Location intelligence prioritized features by organization size
1
1.5
2
2.5
3
3.5
4
Map-based visualization ofdata/information
Drill-down navigation throughmap interface
Dashboard inclusion of maps
Layering of visualizations ontop of maps (e.g., heat maps,
cartograms)
Value/range-based shading ofmaps
Use of symbols to depict values
Integration with third party GISsystems (e.g., ESRI, Google
Maps)Custom region definition and
selection (e.g., polygons,geofencing)
Support for locationcalculations (e.g., drive time,
distance, routing)
Choropleths (area fill) maps
Animation of data on maps
Off-line mapping
Syndicateddemographic/psychographic
data integration (e.g.,…
Support for interior spaces(e.g., retail stores, office
buildings, conference centers)
Location Intelligence Prioritized Features by Organization Size
1 - 100 101 - 1000 1001 - 5000 More than 5000
COPYRIGHT 2016 DRESNER ADVISORY SERVICES, LLC Page | 44
DAS Location Intelligence Market Study 2016
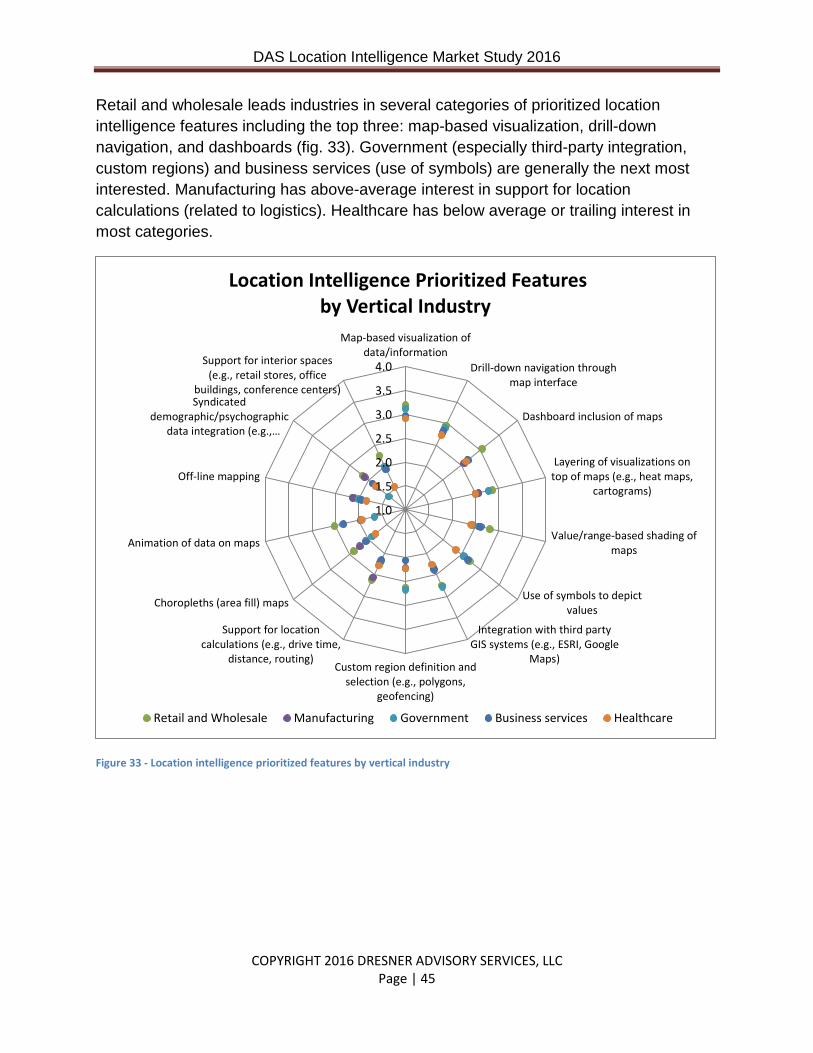
Retail and wholesale leads industries in several categories of prioritized location intelligence features including the top three: map-based visualization, drill-down navigation, and dashboards (fig. 33). Government (especially third-party integration, custom regions) and business services (use of symbols) are generally the next most interested. Manufacturing has above-average interest in support for location calculations (related to logistics). Healthcare has below average or trailing interest in most categories.
Figure 33 - Location intelligence prioritized features by vertical industry
1.0
1.5
2.0
2.5
3.0
3.5
4.0
Map-based visualization ofdata/information
Drill-down navigation throughmap interface
Dashboard inclusion of maps
Layering of visualizations ontop of maps (e.g., heat maps,
cartograms)
Value/range-based shading ofmaps
Use of symbols to depictvalues
Integration with third partyGIS systems (e.g., ESRI, Google
Maps)Custom region definition and
selection (e.g., polygons,geofencing)
Support for locationcalculations (e.g., drive time,
distance, routing)
Choropleths (area fill) maps
Animation of data on maps
Off-line mapping
Syndicateddemographic/psychographic
data integration (e.g.,…
Support for interior spaces(e.g., retail stores, office
buildings, conference centers)
Location Intelligence Prioritized Features by Vertical Industry
Retail and Wholesale Manufacturing Government Business services Healthcare
COPYRIGHT 2016 DRESNER ADVISORY SERVICES, LLC Page | 45

DAS Location Intelligence Market Study 2016
Location Intelligence User Penetration Among users, location intelligence penetration remains modest in 2016, but respondents expect increases over the next three years (fig. 34). Today, 67 percent of respondents report less than 10 percent penetration. As in other technology areas (e.g., mobile, predictive analytics), longer-term projections generally fall short. With a higher likelihood of being closer to budgeted reality, 12-month predictions call for the “less than 10 percent” to decrease to 43 percent. In the same 12-month time frame, penetration in the 11 to 20 percent range is expected to increase from 12 percent to 29 percent, and the highest (81 percent and greater) audience is expected to grow by about 50 percent.
Figure 34 - Location intelligence user penetration 2016 to 2019
0% 10% 20% 30% 40% 50% 60% 70% 80% 90% 100%
In 36 months
In 24 months
In 12 months
Today
Location Intelligence User Penetration 2016 to 2019
81% or more 61 - 80% 41 - 60% 21 - 40% 11 - 20% Under 10%
COPYRIGHT 2016 DRESNER ADVISORY SERVICES, LLC Page | 46

DAS Location Intelligence Market Study 2016
Across three years of data we have seen modest improvements in location intelligence penetration (fig. 35). Since 2014, the lowest level (<10 percent has decreased consecutively while penetration in the 11 to 20 percent range has incrementally moved higher than 10 percent. Higher penetration levels remain at less than 10 percent overall and grew only slightly year over year. Whatever the sentiment toward location intelligence’s importance as a strategic business intelligence initiative, improvements in penetration are undeniably modest.
Figure 35 - Location intelligence penetration 2014 to 2016
0%
10%
20%
30%
40%
50%
60%
70%
80%
Under 10% 11 - 20% 21 - 40% 41 - 60% 61 - 80% 81% or more
Location Intelligence Penetration 2014 to 2016
2014 2015 2016
COPYRIGHT 2016 DRESNER ADVISORY SERVICES, LLC Page | 47

DAS Location Intelligence Market Study 2016
User penetration is expected to improve across all functions in the coming timeframes (fig. 36). The greatest 12-month improvements will occur in R&D followed by sales and marketing. Twelve-month predictions for information technology and finance are comparatively flat. Longer term (and less reliable) predictions of improved penetration are greatest for R&D and executive management. Based on current and future levels of interest, we believe that R&D will predictively pave the way for increased penetration in all other functional areas.
Figure 36 - Location intelligence user penetration 2016 to 2019 by function
0%
10%
20%
30%
40%
50%
60%
70%
80%
90%
100%
Toda
y
In 1
2 m
onth
s
In 2
4 m
onth
s
In 3
6 m
onth
s
Toda
y
In 1
2 m
onth
s
In 2
4 m
onth
s
In 3
6 m
onth
s
Toda
y
In 1
2 m
onth
s
In 2
4 m
onth
s
In 3
6 m
onth
s
Toda
y
In 1
2 m
onth
s
In 2
4 m
onth
s
In 3
6 m
onth
s
Toda
y
In 1
2 m
onth
s
In 2
4 m
onth
s
In 3
6 m
onth
sExecutive Management Sales and Marketing Research and
Development (R&D)Information Technology
(IT)Finance
Location Intelligence User Penetration 2016 to 2019 by Function
81% or more 61 - 80% 41 - 60% 21 - 40% 11 - 20% Under 10%
COPYRIGHT 2016 DRESNER ADVISORY SERVICES, LLC Page | 48

DAS Location Intelligence Market Study 2016
Low user penetration of location intelligence products and services extends across all geographic regions with some variation (fig. 37). Asia Pacific and EMEA report the greatest current levels of penetration, followed by North America. Asia Pacific, followed by North America and EMEA, has the most aggressive 12-month timeframe for penetration. Latin America reports the most optimistic projections in extended future timeframes (though Latin American results are possibly skewed by small sample representation).
Figure 37 - Location intelligence user penetration 2016 to 2019 by geography
0% 10% 20% 30% 40% 50% 60% 70% 80% 90% 100%
TodayIn 12 monthsIn 24 monthsIn 36 months
TodayIn 12 monthsIn 24 monthsIn 36 months
TodayIn 12 monthsIn 24 monthsIn 36 months
TodayIn 12 monthsIn 24 monthsIn 36 months
Nor
th A
mer
ica
Asia
/Pac
ific
Latin
Am
eric
a
Euro
pe,
Mid
dle
East
and
Afric
a
Location Intelligence User Penetration 2016 to 2019 by Geography
81% or more 61 - 80% 41 - 60% 21 - 40% 11 - 20% Under 10%
COPYRIGHT 2016 DRESNER ADVISORY SERVICES, LLC Page | 49

DAS Location Intelligence Market Study 2016
Organizations of different sizes all expect location intelligence penetration levels to increase consecutively in the coming timeframes (fig. 38). Small (1-100 employees) organizations claim the highest current levels of penetration, a likely finding among low headcount groups. But small organizations also have consistently higher penetration expectations than all other organizations. After small organizations, very large organizations have the most aggressive plans for future penetration while midsized (101-1,000) and some large (1,001-5,000) organizations are less ambitious.
Figure 38 - Location intelligence user penetration 2016 to 2019 by organization size
0% 10% 20% 30% 40% 50% 60% 70% 80% 90% 100%
TodayIn 12 monthsIn 24 monthsIn 36 months
TodayIn 12 monthsIn 24 monthsIn 36 months
TodayIn 12 monthsIn 24 monthsIn 36 months
TodayIn 12 monthsIn 24 monthsIn 36 months
1 - 1
0010
1 - 1
000
1001
- 50
00M
ore
than
5000
Location Intelligence User Penetration 2016 to 2019 by Organization Size
81% or more 61 - 80% 41 - 60% 21 - 40% 11 - 20% Under 10%
COPYRIGHT 2016 DRESNER ADVISORY SERVICES, LLC Page | 50

DAS Location Intelligence Market Study 2016
Uptake and future plans for location intelligence across industry verticals is uneven and low in overall measures (fig. 39). Retail and wholesale report the greatest current penetration and the most ambitious future plans for location intelligence. Business services has the strongest 12-month plans and, along with financial services, is comparatively ambitious. As we found in earlier studies, healthcare is the least ambitious across future timeframes, though above average in current adoption. Manufacturing and education are slightly less penetrated and lead only healthcare in current adoption and future plans.
Figure 39 - Location intelligence user penetration 2016 to 2019 by vertical industry
0%
10%
20%
30%
40%
50%
60%
70%
80%
90%
100%
Toda
y
In 1
2 m
onth
s
In 2
4 m
onth
s
In 3
6 m
onth
s
Toda
y
In 1
2 m
onth
s
In 2
4 m
onth
s
In 3
6 m
onth
s
Toda
y
In 1
2 m
onth
s
In 2
4 m
onth
s
In 3
6 m
onth
s
Toda
y
In 1
2 m
onth
s
In 2
4 m
onth
s
In 3
6 m
onth
s
Toda
y
In 1
2 m
onth
s
In 2
4 m
onth
s
In 3
6 m
onth
s
Toda
y
In 1
2 m
onth
s
In 2
4 m
onth
s
In 3
6 m
onth
sEducation Healthcare Financial
servicesManufacturing Retail and
WholesaleBusiness services
Location Intelligence User Penetration 2016 to 2019 by Vertical Industry
81% or more 61 - 80% 41 - 60% 21 - 40% 11 - 20% Under 10%
COPYRIGHT 2016 DRESNER ADVISORY SERVICES, LLC Page | 51

DAS Location Intelligence Market Study 2016
Devices Where Location Intelligence Will Be Utilized Each year we examine how users access the outputs of location intelligence technologies and services via fixed and/or mobile platforms and devices (fig. 40). In 2016 (as in 2015 and 2014), the answer is “all of the above.” Desktops and laptops remain most popular (31 percent) and well ahead of mobile devices only (20 percent. But about half expect location intelligence access across both platforms. As other dimensions of use reveal, roles, industry, and geography help explain this distribution of users. More broadly, we can expect to tie mobile use, fixed use, or both to shifts in device preference over time.
Figure 40 – Location intelligence usage: mobile versus desktop
Primarily mobile devices, 20%
Primarily desktop or laptop computers,
31%
Both, 49%
Location Intelligence Usage: Mobile versus Desktop
COPYRIGHT 2016 DRESNER ADVISORY SERVICES, LLC Page | 52

DAS Location Intelligence Market Study 2016
Across three years of data, respondents showed an increased preference for desktop/laptop versus mobile devices. Likewise, the desire for multiple platforms declined proportionately (fig. 41). We can likely ascribe part of this to the greater real estate and perhaps processing power of PCs to manage rich applications, detailed maps, and other visual representations. Likewise, we find the use of mobile devices retreating to less detailed tasks and general information management (email, etc.) usage.
Figure 41 - Location intelligence usage: mobile versus desktop 2014 to 2016
0%
10%
20%
30%
40%
50%
60%
Primarily desktop or laptopcomputers
Primarily mobile devices Both
Location Intelligence Usage: Mobile versus Desktop 2014 to 2016
2014 2015 2016
COPYRIGHT 2016 DRESNER ADVISORY SERVICES, LLC Page | 53

DAS Location Intelligence Market Study 2016
Business functions agree that mobile use of location intelligence technology will be a mix of deskbound and mobile use and, by degrees, related to the extent business roles are executed outside the office confines (fig. 42). When we momentarily set aside “both,” it is apparent that executives, who are more often on the go and less likely to run in-depth applications, have a preference for mobile platforms and devices. Somewhat surprisingly, IT respondents have the next highest interest in mobile devices, though this is very possibly in monitoring/support obligations and not workplace use. With more reporting and pipeline/follow-up work, sales and marketing respondents are likely to need both mobile and desktop access under different circumstances. Research and development takes the most holistic approach in combined environments. Finance, as the most deskbound function, has a clear preference for desktop over mobile use.
Figure 42 - Location intelligence usage: mobile versus desktop by function
0%
10%
20%
30%
40%
50%
60%
70%
80%
90%
100%
ExecutiveManagement
InformationTechnology
(IT)
Sales andMarketing
Research andDevelopment
(R&D)
Finance
Location Intelligence Usage: Mobile versus Desktop by Function
Primarily mobile devices
Primarily desktop or laptopcomputers
Both
COPYRIGHT 2016 DRESNER ADVISORY SERVICES, LLC Page | 54

DAS Location Intelligence Market Study 2016
A mixed-use model of mobile and fixed technologies holds across geographical regions in 2016, though desktop/laptop preference holds a clear edge across all regions (fig. 43). Interestingly, North American respondents have the strongest preference for mobile only, but also a very strong mixed use agenda. EMEA now shows the greatest preference for desktop/laptop and the lowest preference for mobile-only location intelligence. Asia Pacific and Latin America have the greatest preference for mixed use along with the aforementioned preference for desktop only versus mobile only.
Figure 43 - Location intelligence usage: mobile versus desktop by geography
0%
10%
20%
30%
40%
50%
60%
70%
80%
90%
100%
North America Europe, MiddleEast and Africa
Latin America Asia/Pacific
Location Intelligence Usage: Mobile versus Desktop by Geography
Primarily mobile devices
Primarily desktop or laptopcomputers
Both
COPYRIGHT 2016 DRESNER ADVISORY SERVICES, LLC Page | 55

DAS Location Intelligence Market Study 2016
Across organizations of different sizes, enterprises expect mixed use of location intelligence technologies and services between desktop and mobile platforms (fig. 44). Small organizations and midsized organizations share the greatest preference for mixed environments. Very large organizations have the highest affinity for mobile only, though still more prefer desktop/laptop and mixed environments.
Figure 44 - Location intelligence usage: mobile versus desktop by organization size
0%
10%
20%
30%
40%
50%
60%
70%
80%
90%
100%
1 - 100 101 - 1000 1001 - 5000 More than 5000
Location Intelligence Usage: Mobile versus Desktop by Organization Size
Primarily mobile devices
Primarily desktop or laptopcomputers
Both
COPYRIGHT 2016 DRESNER ADVISORY SERVICES, LLC Page | 56

DAS Location Intelligence Market Study 2016
Across vertical industries, enterprises expect that desktop, mobile, and mixed location intelligence environments will all find use in 2016 (fig. 45). Business services most prefers primarily mobile use and is the industry least likely to use desktops/laptops only. Healthcare is predictably least likely to employ mobile-only environments and most likely to use desktop/laptop only. Other industries we sampled prefer desktop/laptop use but liberally employ mixed, mobile, and desktop use.
Figure 45 - Location intelligence usage: mobile versus desktop by vertical industry
0%
10%
20%
30%
40%
50%
60%
70%
80%
90%
100%
Location Intelligence Usage: Mobile versus Desktop by Vertical Industry
Primarily mobile devices
Primarily desktop or laptopcomputers
Both
COPYRIGHT 2016 DRESNER ADVISORY SERVICES, LLC Page | 57

DAS Location Intelligence Market Study 2016
Mobile Location Intelligence Features For the third year, we measured three mobile location intelligence feature priorities: location-based query filtering, reverse geocoding, and geo fence alerting. In 2016, respondents strongly chose mobile location-based query filtering (the software’s ability to query data using current location as a filter parameter) as their highest priority (fig. 46). This feature is considered critical to 19 percent of respondents and very important to another 40 percent. Less than 20 percent consider location-based query filtering "not important." About 60 percent of respondents say the other two features, reverse geocoding (creating a physical address or place name from coordinate information) and geo fence alerting (alerting when a device crosses a defined boundary), are, at minimum, somewhat important.
Figure 46 - Mobile location intelligence feature priorities
1
1.5
2
2.5
3
3.5
4
0%
10%
20%
30%
40%
50%
60%
70%
80%
90%
100%
Mobile Location Intelligence Feature Priorities
Critical
VeryimportantSomewhatimportantNotimportant
COPYRIGHT 2016 DRESNER ADVISORY SERVICES, LLC Page | 58

DAS Location Intelligence Market Study 2016
Across three years of data, interest in mobile location feature priorities has been flat or declined very slightly (fig. 47). In 2016, location-based query filtering returned to 2014 levels while reverse geocoding and geo fence alerting were down very slightly. Overall measures below 3.0 show these features to be only somewhat important to organizations over time.
Figure 47 - Mobile location intelligence feature priorities 2014 to 2016
0.00
0.50
1.00
1.50
2.00
2.50
3.00
Location-based query filtering Reverse geocoding Geo fence alerting
Mobile Location Intelligence Feature Priorities 2014 to 2016
2014
2015
2016
COPYRIGHT 2016 DRESNER ADVISORY SERVICES, LLC Page | 59

DAS Location Intelligence Market Study 2016
Location-based query filtering is the most popular mobile location intelligence feature among respondents across all functions studied in 2016 (fig. 48). Sales and marketing leads interest in all three features studied, followed by R&D, IT, executive management, and finance.
Figure 48 - Mobile location intelligence feature priorities by function
0
0.5
1
1.5
2
2.5
3
Executive Management Sales and Marketing Research andDevelopment (R&D)
Information Technology(IT)
Finance
Mobile Location Intelligence Feature Priorities by Function
Location-based query filtering Reverse geocoding Geo fence alerting
COPYRIGHT 2016 DRESNER ADVISORY SERVICES, LLC Page | 60

DAS Location Intelligence Market Study 2016
The emphasis on location-based query filtering extends to all geographic regions in 2016 (fig. 49). Latin America leads all regions in interest across all location intelligence feature priorities including “tell me where I am” reverse geocoding and geo fence boundary alerting. Asia Pacific polls slightly ahead of North America and EMEA in feature prioritization.
Figure 49 - Mobile location intelligence feature priorities by geography
0
0.5
1
1.5
2
2.5
3
3.5
North America Asia/Pacific Latin America Europe, Middle East and Africa
Mobile Location Intelligence Feature Priorities by Geography
Location-based query filtering Reverse geocoding Geo fence alerting
COPYRIGHT 2016 DRESNER ADVISORY SERVICES, LLC Page | 61

DAS Location Intelligence Market Study 2016
As found in other measures, location-based query filtering is the strongest priority for organizations of any size (fig. 50). Small (1-100 employees) organizations and very large (> 5,000) organizations have slightly higher interest in all three types of mobile location intelligence features sampled. Very large organizations have slightly higher interest in reverse geocoding and geo fence alerting compared to small peers. We would expect that large organizations (more likely to be far-flung or regionally managed) would lead these secondary categories of interest.
Figure 50 - Mobile location intelligence feature priorities by organization size
0
0.5
1
1.5
2
2.5
3
1 - 100 101 - 1000 1001 - 5000 More than 5000
Mobile Location Intelligence Feature Priorities by Organization Size
Location-based query filtering Reverse geocoding Geo fence alerting
COPYRIGHT 2016 DRESNER ADVISORY SERVICES, LLC Page | 62

DAS Location Intelligence Market Study 2016
Location-based query filtering is the most prioritized mobile location intelligence feature across the six vertical industries highlighted in 2016 (fig. 51). Business services, followed by manufacturing, is next most interested. Retail and wholesale lead all industries in all three features measured. Healthcare, education, and financial services generally trail in all categories.
Figure 51 - Mobile location intelligence feature priorities by vertical industry
0.0
0.5
1.0
1.5
2.0
2.5
3.0
3.5
Retail and Wholesale Business services Manufacturing Healthcare Education Financial services
Mobile Location Intelligence Feature Priorities by Vertical Industry
Location-based query filtering Reverse geocoding Geo fence alerting
COPYRIGHT 2016 DRESNER ADVISORY SERVICES, LLC Page | 63

DAS Location Intelligence Market Study 2016
Required Integration with GIS Vendors We asked respondents to prioritize integration requirements with geographic information system vendors in 2016 (fig. 52). The overwhelming favorite integration target, with 75 percent in favor for 2016, is Google. Esri follows distantly with 30 percent. Database extensions (27 percent) and Microsoft Bing (24 percent) are the next most popular. All other GIS vendors are cited by fewer than 10 percent of respondents.
Figure 52 - Required integration with GIS vendors
0%
10%
20%
30%
40%
50%
60%
70%
80%
90%
100%
Google ESRI Databaseextensions
(e.g., Oracle,Postgres)
Microsoft(Bing)
Mapinfo WMS (WebMap
Service)
TomTom NavTec
Required Integration with GIS Vendors
COPYRIGHT 2016 DRESNER ADVISORY SERVICES, LLC Page | 64

DAS Location Intelligence Market Study 2016
Across three years of data, user-requested / required integration with GIS vendors shifted somewhat (fig. 53). Required Google integration declined by about 5 percent in each of the last two years; Esri dipped a similar amount compared to 2016. Database extensions grew in favor by about 8 percent between 2015 and 2016 while interest in Microsoft Bing rebounded slightly.
Figure 53 - Required Integration with GIS vendors 2014 to 2016
0%
10%
20%
30%
40%
50%
60%
70%
80%
90%
100%
Google ESRI Microsoft(Bing)
Databaseextensions
(e.g., Oracle,Postgres)
Mapinfo WMS (WebMap
Service)
TomTom NavTec
Required Integration with GIS Vendors 2014 to 2016
2014 2015 2016
COPYRIGHT 2016 DRESNER ADVISORY SERVICES, LLC Page | 65
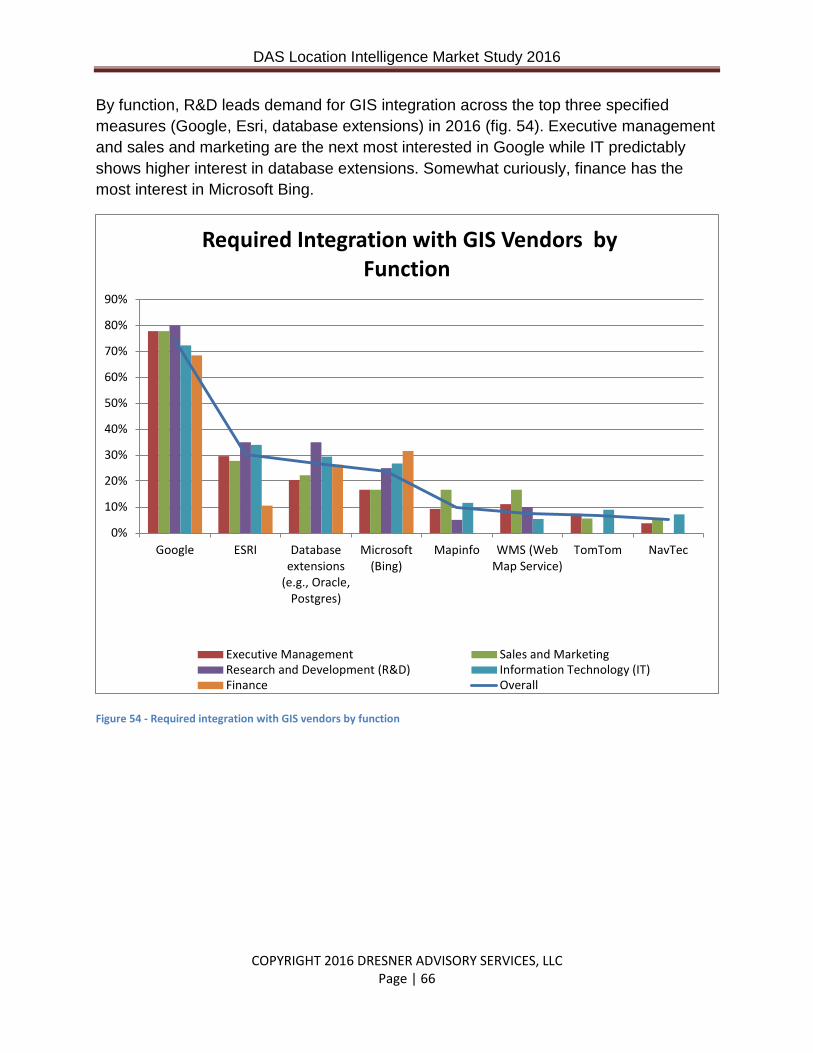
DAS Location Intelligence Market Study 2016
By function, R&D leads demand for GIS integration across the top three specified measures (Google, Esri, database extensions) in 2016 (fig. 54). Executive management and sales and marketing are the next most interested in Google while IT predictably shows higher interest in database extensions. Somewhat curiously, finance has the most interest in Microsoft Bing.
Figure 54 - Required integration with GIS vendors by function
0%
10%
20%
30%
40%
50%
60%
70%
80%
90%
Google ESRI Databaseextensions
(e.g., Oracle,Postgres)
Microsoft(Bing)
Mapinfo WMS (WebMap Service)
TomTom NavTec
Required Integration with GIS Vendors by Function
Executive Management Sales and MarketingResearch and Development (R&D) Information Technology (IT)Finance Overall
COPYRIGHT 2016 DRESNER ADVISORY SERVICES, LLC Page | 66

DAS Location Intelligence Market Study 2016
Google integration demand extends its dominance across all geographic regions, led by Asia Pacific and Latin America (fig. 55). Asia Pacific users are clearly less familiar with Esri than are other regions while Latin America has a lower preference for Microsoft Bing. All other GIS vendors are required by fewer than 10 percent of respondents.
Figure 55 - Required integration with GIS vendors by geography
0%
10%
20%
30%
40%
50%
60%
70%
80%
90%
100%
Google ESRI Databaseextensions
(e.g., Oracle,Postgres)
Microsoft(Bing)
Mapinfo WMS (WebMap
Service)
TomTom NavTec
Required Integration with GIS Vendors by Geography
North America Asia/PacificLatin America Europe, Middle East and AfricaOverall
COPYRIGHT 2016 DRESNER ADVISORY SERVICES, LLC Page | 67

DAS Location Intelligence Market Study 2016
Organizations of all sizes adhere to their preference for Google GIS integration (fig. 56). Small (1-100 employees) organizations above all are most likely (>80 percent) to specify Google integration, followed by very large (>5,000) organizations (74 percent). Conversely, large (1,001-5,000) and very large organizations are more likely to specify Esri integration (39 percent and 36 percent, respectively). Very large organizations are most likely to seek database extension and/or Microsoft Bing integration. Mapinfo is the only other vendor to exceed a 10 percent requirement in small and very large organizations.
Figure 56 - Required integration with GIS vendors by organization size
0%
10%
20%
30%
40%
50%
60%
70%
80%
90%
Google ESRI Databaseextensions
(e.g., Oracle,Postgres)
Microsoft(Bing)
Mapinfo WMS (WebMap Service)
TomTom NavTec
Required Integration with GIS Vendors by Organization Size
1 - 100 101 - 1000 1001 - 5000 More than 5000 Overall
COPYRIGHT 2016 DRESNER ADVISORY SERVICES, LLC Page | 68

DAS Location Intelligence Market Study 2016
Across industries, Google easily tops demand among GIS vendor integration (fig. 57). More than 80 percent of education respondents specify Google followed by business services (75 percent), healthcare (70 percent) and financial services (60 percent). Microsoft Bing is notably specified by 53 percent of healthcare respondents while database extensions appeal most strongly in financial services (40 percent). Healthcare and business services have somewhat higher interest in Esri compared to other industries.
Figure 57 - Required integration with GIS vendors by vertical industry
0%
10%
20%
30%
40%
50%
60%
70%
80%
90%
Google ESRI Databaseextensions
(e.g., Oracle,Postgres)
Microsoft(Bing)
Mapinfo WMS (WebMap Service)
TomTom NavTec
Required Integration with GIS Vendors by Vertical Industry
Business services Education Healthcare Financial services Overall
COPYRIGHT 2016 DRESNER ADVISORY SERVICES, LLC Page | 69

DAS Location Intelligence Market Study 2016
Industry Support for Location Intelligence If not hype-laden enthusiasm, the software industry nonetheless has a positive view of the importance of location intelligence across three years of data collection (fig. 58). The plural view in 2016 is that location intelligence is very important in 2016, a view held by 44 percent of respondents. This view comes at the expense of the fewer number who consider location intelligence merely important (21 percent). Critical and not important views are both slightly lower than in 2015. Over time, we can conclude that the perceived importance generally shifted from important to very important, somewhat ahead of consumer enthusiasm for location intelligence.
Figure 58 - Industry importance of location intelligence 2014 to 2016
0%
5%
10%
15%
20%
25%
30%
35%
40%
45%
50%
Critically important Very important Important Not important
Industry Importance of Location Intelligence 2014 to 2016
2014 2015 2016
COPYRIGHT 2016 DRESNER ADVISORY SERVICES, LLC Page | 70

DAS Location Intelligence Market Study 2016
Industry Support for Geocoding As depicted in fig. 59, industry support for geocoding features is somewhat poorly aligned with user preferences (fig. 17). The top industry-supported feature, built-in geocoding, is also the top customer preference. However, street-level and automated geocoding support (second and third in customer preference) rank fifth and fourth, respectively, in industry support. Worldwide support, least important to the respondent base, is the second most supported feature by industry vendors in 2016.
Figure 59 - Industry support for geocoding
0%
10%
20%
30%
40%
50%
60%
70%
80%
90%
100%
Built-ingeocoding
(e.g.,country,region,postalclode,CBSA)
Worldwidegeocoding
support
Customerextensions
to map data(e.g.,
customPOIs)
Automatedgeocoding
support
Street-levelgeocoding
support
Offlinegeocoding
support
Industry Support for Geocoding
No Plans
24 months
12 months
Today: "Mash ups"
Today: Core integration
COPYRIGHT 2016 DRESNER ADVISORY SERVICES, LLC Page | 71

DAS Location Intelligence Market Study 2016
Over the last three years, industry support for core integration of geocoding features has increased generally (fig. 60), though not in line with customer priorities (fig. 17). Support is 68 percent for built-in geocoding and greater than 50 percent for customer extensions and worldwide geocoding support (the fourth and sixth most popular customer features). Support for street level geocoding (the second most requested customer feature) has been flat, while automated geocoding support, the third highest customer priority, now has greater than 40 percent industry support.
Figure 60 - Industry support for geocoding: core integration 2014 to 2016
0%
10%
20%
30%
40%
50%
60%
70%
80%
Built-ingeocoding (e.g.,country, region,
postal code,CBSA)
Automatedgeocoding
support
Worldwidegeocoding
support
Street-levelgeocoding
support
Customerextensions to
map data (e.g.,custom POIs)
Offlinegeocoding
support
Industry Support for Geocoding: Core Integration 2014 to 2016
2014 2015 2016
COPYRIGHT 2016 DRESNER ADVISORY SERVICES, LLC Page | 72

DAS Location Intelligence Market Study 2016
Industry Support for Location Intelligence Features As a group, business intelligence vendors are attending to a full span of location intelligence features. The top three categories of industry priorities are supported by more than 80 percent of vendors, and the top five categories are supported by at least 70 percent (fig. 61). Industry support is only somewhat aligned with user expectations (fig. 28). The top three user requirements are included in the top four features supported by the industry. Layering of visualization, fourth most important among users, ranks sixth in industry support. Choropleths, the fifth most popular industry support feature, is only the 10th most requested by users.
Figure 61 - Industry support for location intelligence features
0%10%20%30%40%50%60%70%80%90%
100%
Industry Support for Location Intelligence Features
Today: Core integration Today: "Mash ups" 12 months 24 months No plans
COPYRIGHT 2016 DRESNER ADVISORY SERVICES, LLC Page | 73

DAS Location Intelligence Market Study 2016
Following a decrease in 2015, industry support for top location intelligence support features increased year over year, led by rebounds in dashboards, map-based visualizations, drill-down navigation, range-based shading, and layering of visualizations (fig. 62). These improvements map better to user-prioritized features compared to the current support depicted in fig 61, a sign of industry attention to user needs.
Figure 62 - Industry support for location intelligence features: core integration 2014 to 2016
0%10%20%30%40%50%60%70%80%90%
100%
Industry Support for Location Intelligence Features : Core Integration 2014 to 2016
2014 2015 2016
COPYRIGHT 2016 DRESNER ADVISORY SERVICES, LLC Page | 74

DAS Location Intelligence Market Study 2016
Industry Support for Third-Party GIS Platforms Industry support for integration to third-party GIS platforms varies somewhat across three years of data (fig. 63). Support for Google, Esri, Microsoft Bing, and database extensions retaining the top four slots, mostly in line with the top four user demands for GIS platform integration (fig. 52). Industry support for WMS and lesser GIS platforms mostly exceeded user demand over time.
Figure 63 - Industry support for third-party GIS platforms 2014 to 2016
0%
10%
20%
30%
40%
50%
60%
70%
80%
90%
Google ESRI Microsoft(Bing)
Databaseextensions
(e.g., Oracle,Postgres)
WMS (WebMap Service)
Mapinfo TomTom NavTec
Industry Support for Third Party GIS Platforms 2014 to 2016
2014 2015 2016
COPYRIGHT 2016 DRESNER ADVISORY SERVICES, LLC Page | 75

DAS Location Intelligence Market Study 2016
Industry Support for Mobile Location Intelligence Features Industry support for mobile location intelligence features remains at a somewhat immature stage with less than 50 percent support for location-based query filtering (fig. 64). About one-third of the vendors we polled currently offer location-based query filtering, and 20 percent or lower current support for reverse geocoding and geo fence alerting. Industry support aligns with the current user priorities for mobile location intelligence features (fig. 46).
Figure 64 - Industry support for mobile location intelligence features
0%
10%
20%
30%
40%
50%
60%
70%
80%
90%
100%
Location-based queryfiltering
Reverse Geocoding Geo fence alerting
Industry Support for Mobile Location Intelliegnce Features
No plans
24 months
12 months
Today
COPYRIGHT 2016 DRESNER ADVISORY SERVICES, LLC Page | 76

DAS Location Intelligence Market Study 2016
Industry support for location-based query filtering increased noticeably in 2016, while reverse geocoding and geo fence alerting fell slightly (fig. 65). Again, these findings align with user priorities, but industry support appears to lag user estimates of criticality (fig. 46).
Figure 65 - Industry support for mobile location intelligence features 2014 to 2016
0%
5%
10%
15%
20%
25%
30%
35%
40%
45%
50%
Location-based query filtering Reverse geocoding Geo fence alerting
Industry Support for Mobile Location Intelligence Features 2014 to 2016
2014 2015 2016
COPYRIGHT 2016 DRESNER ADVISORY SERVICES, LLC Page | 77

DAS Location Intelligence Market Study 2016
Demand versus Supply Priorities for Location Intelligence Despite the aforementioned gap in industry feature prioritization and support, the vendor product and services industry places a higher estimation on the importance of location intelligence than does the user community (fig. 66). Typical of an emerging-market dynamic, industry respondents are more likely than users to see location intelligence as critical or very important, and less likely than users to see location intelligence as somewhat important or not important.
Figure 66 - User versus industry importance of location intelligence
0%
5%
10%
15%
20%
25%
30%
35%
40%
45%
50%
Critically important Very important Important Not important
User Versus Industry Importance of Location Intelligence
Industry Users
COPYRIGHT 2016 DRESNER ADVISORY SERVICES, LLC Page | 78

DAS Location Intelligence Market Study 2016
Location Intelligence Vendor Ratings This year we include 19 business intelligence vendors in our Location Intelligence ratings (fig. 67). For each vendor we considered geocoding support, integration, and location features. Only vendors that scored 50 percent or greater are included in this report.
Top vendors include Oracle (1st), OpenText (2nd), SAP (2nd), TIBCO (3rd), Tableau (4th) and Logi Analytics (5th).
Figure 67 - Location Intelligence vendor ratings
1
2
4
8
16
32Oracle
OpenText (Actuate)
SAP
TIBCO
Tableau
Logi Analytics
Domo
IBM
GoodDataMicroStrategyInformation Builders
Qlik
Panorama
Birst
ClearStory
InetSoft
Microsoft
Pentaho (Hitachi)
Pyramid Analytics
Location Intelligence Vendor Ratings
Geocoding + Integration Score Features Score Total Score
COPYRIGHT 2016 DRESNER ADVISORY SERVICES, LLC Page | 79

DAS Location Intelligence Market Study 2016
Other Dresner Advisory Services Research Reports
- Wisdom of Crowds “Flagship” Business Intelligence Market study - Advanced and Predictive Analytics - Big Data Analytics - Business Intelligence Competency Center - Cloud Computing and Business Intelligence - Collaborative Computing and Business Intelligence - Embedded Business Intelligence - End User Data Preparation - Enterprise Planning - Internet of Things and Business Intelligence - Mobile Computing and Business Intelligence - Small and Mid-sized Enterprise Business Intelligence
COPYRIGHT 2016 DRESNER ADVISORY SERVICES, LLC Page | 80

DAS Location Intelligence Market Study 2016
Appendix: Location Intelligence Survey Instrument
COPYRIGHT 2016 DRESNER ADVISORY SERVICES, LLC Page | 81

DAS Location Intelligence Market Study 2016
COPYRIGHT 2016 DRESNER ADVISORY SERVICES, LLC Page | 82

DAS Location Intelligence Market Study 2016
COPYRIGHT 2016 DRESNER ADVISORY SERVICES, LLC Page | 83

DAS Location Intelligence Market Study 2016
COPYRIGHT 2016 DRESNER ADVISORY SERVICES, LLC Page | 84