jane bown executive assistant highlights …2012/04/30 · • main zone 10.8 metres @ 6.3g/t au...
TRANSCRIPT

1
FOR THE PERIOD ENDING 31 March 2012
Denis Waddell DEPUTY CHAIRMAN Jane Bown EXECUTIVE ASSISTANT
HIGHLIGHTS COYOTE GOLD PROJECT
• Quarterly gold production of 8,953 ounces from the Coyote Gold Project has increased year to date gold production to
29,003 ounces. • Capital and pre-production development completed in high grade Coyote West Zone. • West Zone - First ore drive produces a pay run totalling 85 metres (strike) x 0.3m (ore width) x 98.6g/t Au. • New underground loader delivered to site, and 40 tonne underground truck procured. • Surface diamond rig mobilised to site and the Coyote Deeps drill program has commenced.
CENTRAL TANAMI PROJECT
• Exploration at the Groundrush deposit returns exceptional results during the Quarter including:
• Southern Deeps 38 metres @ 45.9g/t Au - including 2 metres @ 826g/t Au • Southern Deeps 34 metres @ 3.0g/t Au • Footwall Vein 9 metres @ 260.0g/t Au from 113 metres (including 4 metres @ 583g/t Au from 114 metres) • Main Zone 17.3 metres @ 4.7g/t Au • Main Zone 12.5 metres @ 5.8g/t Au • Main Zone 10.8 metres @ 6.3g/t Au • Main Zone 9.2 metres @ 5.2g/t Au • Main Zone 7.7 metres @ 8.5g/t Au
• Drilling at the Ripcord prospect identifies significant mineralisation, with the following results:
• 52 metres @ 2.1g/t Au • 11 metres @ 4.0g/t Au • 12 metres @ 2.2g/t Au
Based on recent drilling at Groundrush, an updated Resource Statement is scheduled to be published in late May 2012. CORPORATE
• Debt reduced by 51% to $22.8 million as at 31 March 2012 following the sale of the majority of the Company’s interests in ABM Resources NL (ABM).
• Ongoing growth drives increase in market capitalisation and secures the Company’s admission to S&P ASX 300 Index. • Memorandum of Understanding (MOU) entered into with ABM to investigate mining and processing of high grade gold
mineralisation from ABM’s Old Pirate prospect at the Company’s Coyote Gold Project treatment plant, which if successful will provide the Company with an additional revenue stream.
For
per
sona
l use
onl
y

2
FOR THE PERIOD ENDING 31 March 2012
OPERATIONS – Coyote Gold Project and Central Tanami Operations Summary
Table 1: 2011-12 Annual and Quarterly Treatment and Gold Production Summary
Underground Open Pit Total
Period
Tonnes Treated
Grade
g/t
Recovered Ounces
Tonnes Treated
Grade
g/t
Recovered Ounces
Tonnes Treated
Grade
g/t
Recovered Ounces
Recovery
Gold
Sales
Ozs
Average Sale
Price/oz $A
Sept---11 27,479 9.2 7,811 42,169 2.71 3,158 69,649 5.3 10,969 92.9 10,198 $1,627 Dec---11 30,184 6.6 6,145 40,084 2.5 2,936 70,268 4.3 9,081 93.8 8,906 $1,661 Mar-12 24,965 7.8 6,255 36,242 2.7 2,698 61,207 4.5 8,953 93.9 9,124 $1,604
TOTAL 11/12
82,628
7.9
20,211
118,495
2.7
8,792
201,123
4.8
29,003
93.5
28,228
$1,630
Note to Table 1: 1. Recovered ounces calculated by tonnes x grade x recovery.
Coyote Gold Project Underground Mining During the Quarter, the underground mine produced a total of 6,255 ounces of gold from 24,965 tonnes of ore at an average grade of 7.8g/t. Early in the Quarter, a significant capital development program commenced at the Coyote underground operations, designed to access the new strongly mineralised West Zone. The first phase of this program is now complete with the upper two ore development drives established and stoping has commenced. The high gold grades intersected to date have been in line with expectations, the ground conditions are good and decline development down to the next level is well advanced. Mechanised long hole stoping in the developed sections of the Gonzales lode has been completed, with ore won during the Quarter coming from the Bommie, GZ12, South and West Zone lodes. Development to the lower Gonzales and Bommie lodes was deferred to concentrate activities in the high grade West Zone lode (see Figure 1), however, this work is expected to recommence in the June 2012 Quarter. A new Caterpillar R1700 loader was purchased and arrived towards the end of March 2012 which will help increase the reliability of the Company’s front line fleet. The Company has also procured a 40 tonne truck which will further improve haulage efficiencies as the 20 tonne truck fleet is replaced. Additionally, the Company has commenced a capital refurbishment program to upgrade its underground mobile fleet which will reduce maintenance costs and improve availability. Underground diamond drilling has returned the following significant intersections from infill and extensional drilling: Significant Intersections from the Coyote Underground for the March 2012 Quarter:
• CYUG0245 0.3m @ 70.7g/t • CYUG0246 0.3m @ 166.0g/t • CYUG0285 1.0m @ 41.2g/t • CYUG0315 0.3m @ 166.0g/t • CYUG0502 1.0m @ 15.1g/t • CYUG0528 0.3m @ 100.0g/t • CYUG0546 0.3m @ 189.0g/t • CYUG0553 0.6m @ 26.2g/t • CYUG0554 0.3m @ 70.1g/t • CYUG0557 0.95m @ 24.1g/t • CYUG0560 0.3m @ 146.0g/t • CYUG0563 0.42m @ 37.9g/t
For
per
sona
l use
onl
y

3
FOR THE PERIOD ENDING 31 March 2012
A total of 788.7 metres of level and capital development was completed during the March 2012 Quarter with access to the high grade West Zone being prioritised. An extended primary ventilation study was also completed and development aimed at further improving the vent circuit has commenced.
Figure 1: Coyote Underground – Schematic Long Section Looking North
Surface Mining Stage 2 of the Bald Hill Mining Program was completed during the December 2011 Quarter. Further metallurgical test work is underway at Bald Hill as part of a Scoping Study to determine the viability of underground mining of the down plunge extension of the wide high grade zones below the Kookaburra Pit. This work is also subject to further geotechnical assessment and is expected to be completed over the coming months. During the Quarter, the Company was given approval to increase the tailings dam capacity at the Coyote Gold Project. As a result, Broome Contracting were awarded a contract in March 2012 to complete the upgrade. Broome Contracting mobilised to site during the last week of March 2012 and the tailings dam lift has commenced. Processing and Metallurgy Gold production for the March 2012 Quarter was 8,953 ounces from a mill throughput of 61,207 tonnes at a calculated head grade of 4.5g/t with a recovery of 93.9%. Gold bullion sold through the quarter was 9,124 ounces. Ore processed for the quarter was 24,965 tonnes from underground and 36,242 tonnes from the Bald Hill stockpile. A major delay to processing activities of 6.25 days occurred during the Quarter as a result of a failure of the ball mill power feed cables. A scheduled shut down to replace a worn feed end trunnion bearing on the ball mill occurred during March 2012 and a partial ball mill reline was completed in February 2012. A combination of these events caused lower than anticipated production.
For
per
sona
l use
onl
y

4
FOR THE PERIOD ENDING 31 March 2012
EXPLORATION AND RESOURCE DELINEATION Exploration and Resource delineation drilling continued predominately at the Groundrush and Coyote Deposits as the onset of the wet season limited exploration activities in regional areas. A total of 62 holes for 9,228 metres of predominately diamond core was drilled during the Quarter. Central Tanami Project The decision to delay the Central Tanami Project (CTP) Pre-Feasibility Study (PFS) in the previous Quarter to allow a more detailed evaluation of Resources and Reserves at the Groundrush deposit has proven to be a sound decision given the positive drill results returned during the Quarter, including the outstanding results from the Southern Deeps drilling (ASX release on 30 March 2012) which remains open in several directions. These results, along with ongoing success in the main zone clearly demonstrate the potential for the deposit to continue to expand at a significant rate. Given the continued exploration success at the CTP, the Company has taken the view that the exploration potential of the CTP area is compelling, and as such it will remain the primary focus of the Company for the immediate future. Based on the continued exploration success, a decision has been made to defer completion of the PFS and a Feasibility Study (FS) until the ongoing drill programs provide additional information on the size, grade distribution and geometry of the mineralised lodes at Groundrush which will enable a much improved optimised mine plan and economic analysis to be completed. Initial scoping studies have demonstrated the Groundrush deposit has significant economic potential. As a significant amount of work has been completed on components of the CTP PFS, a decision has been made to progress to a FS during 2012 as the Resources increase and more detail is gained from the ongoing intensive drill program. The anticipated exploration success that will be forthcoming during this year’s field season will be continually fed back into the FS process, thus allowing the Company to complete the FS at the earliest opportunity with the aim of developing the CTP. This process will be completed without compromising the overarching objectives of the exploration effort. Exploration has continued strongly at Groundrush with a combination of Resource definition and exploration drilling during the wet season. A total of 24 holes for 5,893 metres were drilled during the Quarter. The drilling was predominately diamond coring, utilising tri-cone roller or reverse circulation (RC) pre-collaring through the near surface weathered horizons and hanging wall sediments. Results from preliminary RC drilling at the Ripcord prospect confirmed significant mineralisation, and geological logging has identified the same host dolerite that is present at the Groundrush Deposit to the north. Ripcord displays multiple similarities to Groundrush including the same host dolerite, alteration assemblages, geometry and magnetic signature. Drilling is scheduled to recommence in April 2012 with a drill rig secured to complete the drilling program that was suspended in December 2011 due to the onset of the wet season. An orientation soil sampling program was undertaken over part of the Ripcord prospect (ML22934) prior to the RC drilling program commencing. The principal aim of this program is to test partial leach analysis techniques on known significant gold mineralisation under shallow to moderate cover. This is typical of approximately 90% of the Company’s tenements and if the program is successful, will advance effective surface exploration. Results from this program have not yet been received and interpreted. Groundrush: Southern Deeps Exploration Results were received during the Quarter from the two southern deep holes drilled at Groundrush with substantial mineralisation defined that has identified a wide high grade mineralised zone below the south end of the current open pit. Mineralisation remains open in multiple directions.
• GRDD61 - 34m @ 3.0g/t Au from 375m including 4m @ 13.6g/t Au from 396m • GRDD63 - 38m @ 45.9g/t Au from 421m including 2m @ 826g/t Au from 433m
GRDD61 and GRDD63 were designed to test the upper plunge component of a larger target that was a product of an update to the Groundrush geological model. GRDD61 and GRDD63 intersected minimal internal sediment, a wide quartz dolerite host, along with key structural features that are interpreted to have a significant impact on mineralisation potential at depth, indicating potential for broad mineralisation to continue down plunge.
For
per
sona
l use
onl
y

5
FOR THE PERIOD ENDING 31 March 2012
Figure 2: Groundrush Schematic Long Section
Figure 3 : Groundrush Schematic Cross Section: 24400N
For
per
sona
l use
onl
y
6
FOR THE PERIOD ENDING 31 March 2012
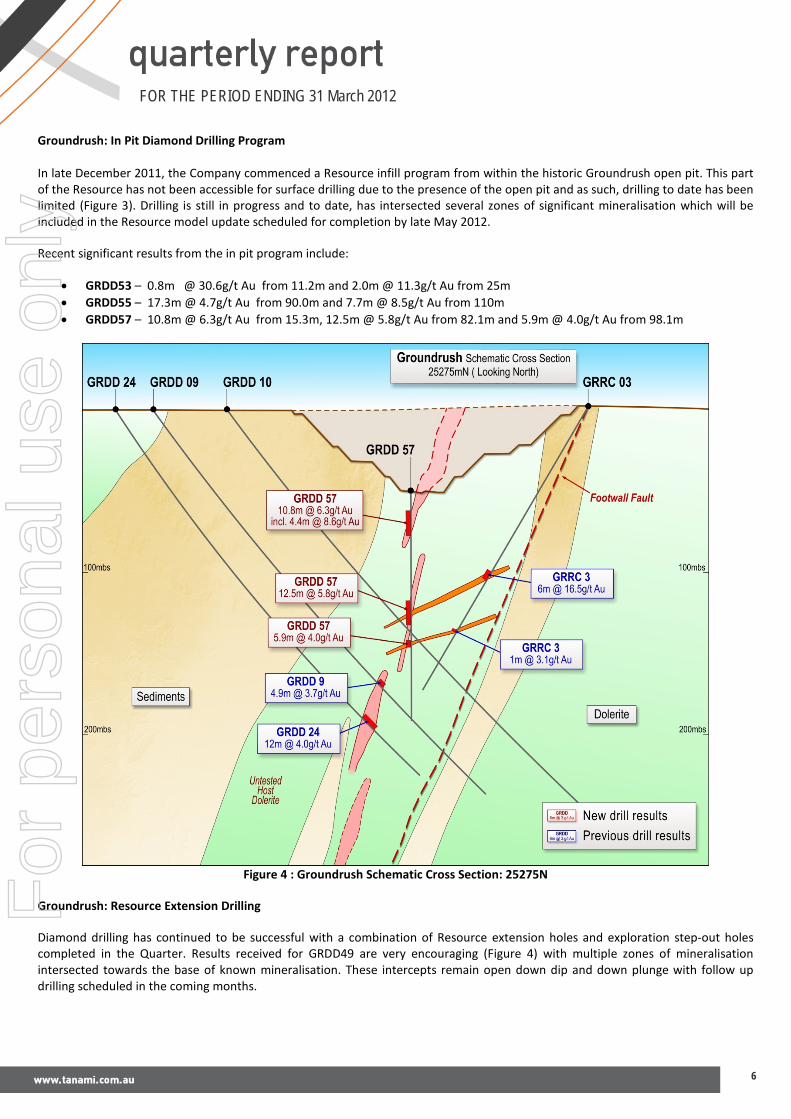
Groundrush: In Pit Diamond Drilling Program In late December 2011, the Company commenced a Resource infill program from within the historic Groundrush open pit. This part of the Resource has not been accessible for surface drilling due to the presence of the open pit and as such, drilling to date has been limited (Figure 3). Drilling is still in progress and to date, has intersected several zones of significant mineralisation which will be included in the Resource model update scheduled for completion by late May 2012. Recent significant results from the in pit program include:
• GRDD53 – 0.8m @ 30.6g/t Au from 11.2m and 2.0m @ 11.3g/t Au from 25m • GRDD55 – 17.3m @ 4.7g/t Au from 90.0m and 7.7m @ 8.5g/t Au from 110m • GRDD57 – 10.8m @ 6.3g/t Au from 15.3m, 12.5m @ 5.8g/t Au from 82.1m and 5.9m @ 4.0g/t Au from 98.1m
Figure 4 : Groundrush Schematic Cross Section: 25275N
Groundrush: Resource Extension Drilling Diamond drilling has continued to be successful with a combination of Resource extension holes and exploration step-out holes completed in the Quarter. Results received for GRDD49 are very encouraging (Figure 4) with multiple zones of mineralisation intersected towards the base of known mineralisation. These intercepts remain open down dip and down plunge with follow up drilling scheduled in the coming months.
For
per
sona
l use
onl
y

7
FOR THE PERIOD ENDING 31 March 2012
Significant intercepts from the Resource extension drilling include:
• GRDD49 – 8.0m @ 4.9g/t Au from 378m, 2.9m @ 9.1g/t Au from 396m and 5.3m @ 8.0g/t Au from 408m • GRDD50 – 4.0m @ 4.3g/t Au from 250m and 9.2m @ 5.2g/t Au from 293m
Figure 5 : Groundrush Schematic Cross Section: 25050N
Ripcord Prospect
A comprehensive RC program began in December 2011 and was suspended due to the onset of the wet season. A total of eight RC holes were completed in that time focussing on the southern extents of the known mineralisation. The shortened program was successful in defining the presence of gold mineralisation with the following significant intercepts being returned:
• RPRC5 - 52m @ 2.14g/t Au from 34m and 11m @ 4.0g/t Au from 99m (estimated true width 12-25m) • RPRC6 - 12m @ 2.20g/t Au from 35m (estimated true width 12m) • RPRC8 - 20m @ 1.23g/t Au from 63m including 8m @ 1.9g/t Au (estimated true width 20m)
The mineralisation is hosted within the Killi Killi Formation and is locally proximal to the contact between the competent dolerite package and the less competent sedimentary rocks. Mineralisation occurs within a broad shear hosted zone of gold mineralisation that has been defined over a 1,000 metre strike length to date.
For
per
sona
l use
onl
y

8
FOR THE PERIOD ENDING 31 March 2012
The current mineralisation model has been based on the Groundrush deposit which displays multiple similarities including the same host dolerite, alteration assemblages, geometry and magnetic signature. The Tanami geological team believes that the current 200 metre spaced drill sections at Ripcord, most of which is shallow reconnaissance drilling, is inadequate to effectively quantify the potential of this style of mineralisation. Additional drilling is planned to infill the current zones of significant mineralisation to a 50 x 50 metre drill pattern while actively exploring along strike and down dip from known mineralisation.
The Groundrush deposit is a +1 million ounce deposit which remains open down plunge and down dip. Tanami delineated 535,000 ounces of gold (see Table 6 - ML22934) in six months at Groundrush during 2011 and Newmont previously produced 611,000 ounces of gold from the Groundrush open pit prior to Tanami acquiring the Central Tanami Project.
Figure 6: Ripcord Geological Interpretation
For
per
sona
l use
onl
y

9
FOR THE PERIOD ENDING 31 March 2012
Table 3: Significant Intersections from Central Tanami for the March 2012 Quarter
Hole_ID Collar Easting
Collar Northing Collar RL Collar
Dip Collar
Azimuth Max
Depth m From m To Interval Width Grade
GRDD49 603844 7820062 420 -55 48.5 453.8
363.5 364.3 0.75 27.0
378.0 386.0 8.0 4.9
396.0 398.9 2.9 9.1
407.7 413.0 5.3 8.0
GRDD50 604142 7820446 421 -52 227.5 408.7 250.0 254.0 4.0 4.3
293.0 302.2 9.2 5.2
GRDD53 603978 7820340 359 -45 49.7 136 11.2 12.0 0.8 30.6
25.0 27.0 2.0 11.3
GRDD55 603983 7820360 361 -50 349.7 141.5 90.5 107.3 17.3 4.7
110.3 118.0 7.7 8.5
GRDD57 603955 7820451 371 -90 3.5 149.1
15.3 26.0 10.8 6.3*
incl. 21.6 26.0 4.4 8.6
69.6 82.0 12.5 5.8
98.1 104.0 5.9 4.0
GRDD61 604132 7819454 420 -67 45.5 512.1
53.0 65.0 14.0 0.94*
375.0 409.0 34.0 3.0*
396.0 400.0 4.0 13.6
GRDD63 604130 7819450 420 -71 45.5 623.1
80.0 82.0 2. 0.8
421.0 459.4 38.4 45.9*
Incl 433.0 435.0 2.0 826.0
RPRC4 605854 7816653 414 -55 53.5 138 75.0 77.0 2.0 2.9
RPRC5
605929 7816910 414 -55 230 132
34.0 86.0 52.0 2.1
99.0 114.0 11.0 4.0
RPRC6 605909 7816897 414 -60 50 150 35.0 47.0 12.0 2.2
RPRC7 605795 7816800 414 -55 50 180 110.0 113.0 3.0 3.1
149.0 153.0 4.0 1.1
RPRC8 605839 7816903 414 -60 50 150 63.0 83.0 20.0 1.2
Incl.75 83.0 8.0 1.9 Notes to accompany Table 3
1. Collar Northing, Easting and Azimuth are all in MGA Grid coordinates. Collar RL is relative to AHD. Collar coordinates may vary upon final survey. 2. Analyses by 50g fire assay with AAS finish of half diamond core samples. 3. No cutting of grades has been applied. Assays are rounded to nearest 0.1g/t. 4. Significant intersections are greater than 0.5g/t with maximum 2 metres internal dilution. 5. *Significant intersections are greater than 0.2g/t with maximum 3 metres internal dilution 6. Intervals are all down hole length.
For
per
sona
l use
onl
y

10
FOR THE PERIOD ENDING 31 March 2012
Western Tanami Operations Greenfields Exploration The remainder of the assaying results from the 2011 air core drilling campaign were received from Big Bustard (E80/1905), Montecristo (E80/2133), Popeye (E80/3389) and Pebbles North (E80/1679) prospects. Low level gold anomalism occurs at all prospects, however only Montecristo has significantly anomalous results for which follow up drilling is planned. At the Montecristo prospect, significantly anomalous results occurred in one air core drill hole (4m @ 2.3g/t Au in weathered mafic bedrock). This anomalism is open for 800 metres along regional strike and 400 metres across strike in an area with sparse historic exploration. Further infill air core drilling has been planned for the 2012 field season to follow up. Coyote Underground Diamond drilling continued at the Coyote Gold Project with a total of 3,335 metres (38 holes) completed during the March 2012 Quarter. Drilling predominately focused on extension and definition drilling at the West Zone and Bommie regions of the deposit. The results returned to date have been pleasing, and correlate well with the new geological model that defines high-grade mineralised shoots that have been folded by a late stage deformation. This new geological model has opened up multiple new untested potential repeats and extensions within the vicinity of the current mine area that will be tested in the June 2012 Quarter with a combination of underground and surface drilling.
Table 4: Significant intersections from Coyote Underground diamond drilling
Hole_ID Collar Easting
Collar Northing Collar RL Collar
Dip Collar
Azimuth Max
Depth m From m To Interval Width Grade
CYUG0245 481716 7799559 205 146 -46.0 140.8 42.4 42.7 0.3 70.7
CYUG0246 481770 7799561 205 203 -40.5 116.3 30.6 30.9 0.3 166.0
CYUG0285 481997 7799684 155 145 -33.5 90.7 32.0 33.0 1.0 41.2
CYUG0315 482142 7799673 102 313 -15.0 80.5 53.1 53.4 0.3 166.0
CYUG0502 482045 7799640 165 161 -15.5 65.0 25.1 26.1 1.0 15.1
CYUG0528 482213 7799746 117 339 3.4 73.3 14.0 14.3 0.3 100.0
CYUG0546 481809 7799566 204 193 -47.0 50.2 17.3 17.6 0.3 189.0
CYUG0553 481723 7799586 208 135 50.0 71.3 52.4 53.0 0.6 26.2
CYUG0554 481723 7799586 208 133 29.0 59.4 28.6 28.9 0.3 70.1
CYUG0557 481723 7799586 208 223 44.0 70.5 30.15 31.1 0.95 24.1
CYUG0560 481717 7799586 207 241 17.5 79.6 58.1 58.4 0.3 146.0
CYUG0563 481717 7799586 207 250 13.0 100.5 50.9 51.3 0.42 37.9
Notes to accompany Table 4 1. Collar Northing, Easting and Azimuth are all in MGA Grid coordinates. Collar RL is relative to AHD. Collar coordinates may vary upon final survey. 2. Analyses by 50g fire assay with AAS finish of half diamond core samples. 3. No cutting of grades has been applied. Assays are rounded to nearest 0.1g/t. 4. Intervals are all down hole length.
F
or p
erso
nal u
se o
nly

11
FOR THE PERIOD ENDING 31 March 2012
CORPORATE Financial The Company achieved the following cash cost per ounce for the Quarter ended 31 March 2012:
March 2012 Quarter Cash cost per ounce – including royalties 1,211 Cash cost per ounce – excluding royalties 1,116
Cash and Cash Equivalents As at 31 March 2012, the Company had cash and gold in transit of $2.2 million. Sale of Shares in ABM Resources NL During the Quarter, the Company sold its shareholding in ABM (being 508,014,212 shares at 5 cents per share). In addition, the Company converted its 300 million options in ABM (at 1.5 cents per option) and sold a further 139,896,797 shares (at 5 cents per share) arising from the exercise of the options. The gross sale proceeds of $32,395,550 were used to:
• Partially repay the Company’s debt with AP Finance Limited; and
• Fund the exercise of the Company’s options in ABM and provide the Company with additional working capital.
As at 31 March 2012, the Company had 160,103,203 shares in ABM valued at approximately $7.8 million as at 31 March 2012. Loan Facilities As advised above, the Company reduced its debt (secured to the extent permitted by ASX Listing Rule 10.1) to AP Finance Limited, by HKD 189 million (approximately AUD 23.4 million as at 31 March 2012) to HKD 184.2 million (approximately AUD 22.8 million as at 31 March 2012). As at 31 March 2012, the Company had HKD 16.5 million (approximately AUD 2.0 million) in undrawn loan funds under its loan facility with AP Finance Limited. Memorandum of Understanding During the Quarter, the Company announced that it had entered into a Memorandum of Understanding with ABM to collaborate in assessing the economic potential of processing high grade gold mineralisation from ABM’s 100% owned Old Pirate gold prospect at the Company’s Coyote Gold Project processing plant. The Old Pirate prospect is located 45 kilometres from the Coyote Gold Project. F
or p
erso
nal u
se o
nly

12
FOR THE PERIOD ENDING 31 March 2012
Figure 7: Project Location Plan
For
per
sona
l use
onl
y

13
FOR THE PERIOD ENDING 31 March 2012
Mineral Resources Table 5: Tanami Gold NL Mineral Resources as at 30 September 2011
Project
Resource Category
Measured Indicated Inferred Total
Tonnes Grade Ounces Tonnes Grade Ounces Tonnes Grade Ounces Tonnes Grade Ounces
WT 497,000 5.5 88,000 1,214,000 6.5 255,000 1,393,000 4.3 194,000 3,104,000 5.4 538,000
CT 6,755,000 3 645,000 8,016,000 2.7 699,000 6,505,000 3.3 686,000 21,277,000 3 2,031,000
Sub Total 7,252,000 3.1 734,000 9,230,000 3.2 954,000 7,898,000 3.5 880,000 24,381,000 3.3 2,569,000
CT Stockpile 1,700,000 0.9 48,000 1,700,000 0.9 48,000
Total 8,952,000 2.7 781,000 9,230,000 3.2 954,000 7,898,000 3.5 880,000 26,081,000 3.1 2,617,000
Notes to accompany Table 5 1. WT is Western Tanami and CT is Central Tanami 2. Resource estimations completed using MineMap, Vulcan and Micromine software packages comprising a combination of ellipsoidal inverse distance and ordinary kriging grade
interpolation methods. 3. Grade estimation was constrained to material within >0.7g/t mineralisation outlines. 4. Variable gold assay top cuts were applied based on geostatistical parameters and historical production reconciliation. 5. Resources reported above 0.7g/t block model grade. 6. Stockpile figures from previously reported Otter Gold Mines NL 2001 Mineral Resource estimate less recorded treatment by Newmont Asia Pacific. 7. Tonnes and ounces rounded to the nearest thousand and grade rounded to 0.1g/t. Rounding may affect tallies. 8. The information in this report pertaining to Mineral Resources for the Central Tanami Project was compiled by Mr Bill Makar (MAusIMM), Consultant Geologist – Tanami Gold NL, Mr
Michael Thomson (MAusIMM), Resource Geologist for Tanami Gold NL, Mr Steven Nicholls (MAIG), former Senior Geologist for Tanami Gold NL, Mrs Claire Hillyard (MAusIMM), Contract Geologist for Tanami Gold NL and Mr Peter Ball (MAusIMM), Director of Datageo Geological Consultants. Mr Makar, Mr Thomson, Mr Nicholls, Mrs Hillyard and Mr Ball have sufficient experience which is relevant to the style of mineralisation and type of deposit under consideration to qualify as Competent Persons as defined in the December 2004 edition of the Australasian Code for Reporting of Exploration Results, Mineral Resources and Ore Reserves (JORC Code). Mr Makar, Mr Nicholls, Mrs Hillyard and Mr Ball consent to the inclusion in this report of the matters based on their information in the form and context in which it appears.
9. The Western Tanami Resource figure stated has not been depleted for Coyote mine production of 41,467 ounces during the period 1 July 2010 30 September 2011.
Table 6: Central Tanami Project Mineral Resources by Tenement as at 30 September 2011
Mineral Lease
Resource Category
Measured Indicated Inferred Total
Tonnes Grade Ounces Tonnes Grade Ounces Tonnes Grade Ounces Tonnes Grade Ounces
MLS153 1,051,000 2.2 73,000 3,046,000 2.2 217,000 849,000 2.7 74,000 4,946,000 2.3 365,000 MLS167 2,709,000 3.4 293,000 2,613,000 2.9 244,000 2,050,000 2.9 191,000 7,373,000 3.1 728,000 MLS168 854,000 2.2 60,000 314,000 1.6 16,000 1,094,000 1.6 58,000 2,262,000 1.8 133,000 MLS180 545,000 3.3 57,000 872,000 2.7 76,000 269,000 2 18,000 1,685,000 2.8 151,000
MLSA172 1,096,000 2.7 96,000 176,000 1.8 10,000 142,000 2.7 12,000 1,415,000 2.6 119,000 ML22934 500,000 4.1 66,000 995,000 4.3 136,000 2,101,000 4.9 333,000 3,596,000 4.6 535,000* Sub Total 6,755,000 3.0 645,000 8,016,000 2.7 699,000 6,505,000 3.3 686,000 21,277,000 3.0 2,031,000 Stockpiles 1,700,000 0.9 48,000 1,700,000 0.9 48,000
Total 8,455,000 2.6 693,000 8,016,000 2.7 699,000 6,505,000 3.3 686,000 22,977,000 2.8 2,079,000
Notes to accompany Table 6 1. Resource estimations completed using MineMap, Vulcan and Micromine software packages comprising a combination of ellipsoidal inverse distance and ordinary kriging grade
interpolation methods. 2. Grade estimation was constrained to material within >0.7g/t mineralisation outlines. 3. Variable gold assay top cuts were applied based on geostatistical parameters and historical production reconciliation. 4. Resources reported above 0.7g/t block model grade. 5. * Resources reported above 1.0g/t block model grade. 6. Stockpile figures from previously reported Otter Gold Mines NL 2001 Mineral Resource estimate less recorded treatment by Newmont Asia Pacific. 7. Tonnes and ounces rounded to the nearest thousand and grade rounded to 0.1g/t. Rounding may affect tallies. 8. The information in this report pertaining to Mineral Resources for the Central Tanami Project was compiled by Mr Bill Makar (MAusIMM), Consultant Geologist – Tanami Gold NL, Mr
Michael Thomson (MAusIMM), Resource Geologist for Tanami Gold NL, Mr Steven Nicholls (MAIG), former Senior Geologist for Tanami Gold NL, Mrs Claire Hillyard (MAusIMM), Contract Geologist for Tanami Gold NL and Mr Peter Ball (MAusIMM), Director of Datageo Geological Consultants. Mr Makar, Mr Thomson, Mr Nicholls, Mrs Hillyard and Mr Ball have sufficient experience which is relevant to the style of mineralisation and type of deposit under consideration to qualify as Competent Persons as defined in the December 2004 edition of the Australasian Code for Reporting of Exploration Results, Mineral Resources and Ore Reserves (JORC Code). Mr Makar, Mr Nicholls, Mrs Hillyard and Mr Ball consent to the inclusion in this report of the matters based on their information in the form and context in which it appears.
For
per
sona
l use
onl
y

14
FOR THE PERIOD ENDING 31 March 2012
Table 7: Western Tanami Project Mineral Resources as at 30 September 2011
Deposit
Resource Category
Measured Indicated Inferred Total
Tonnes Grade Ounces Tonnes Grade Ounces Tonnes Grade Ounces Tonnes Grade Ounces
Coyote * 78,000 25.6 64,000 473,000 11.5 174,000 329,000 7 74,000 880,000 11 312,000
Sandpiper 27,000 3.3 3,000 455,000 4.1 59,000 635,000 4.4 90,000 1,117,000 4.2 152,000
Kookaburra 55,000 2.6 5,000 286,000 2.4 22,000 353,000 2.1 24,000 694,000 2.3 51,000
Pebbles - - - - - - 76,000 2.5 6,000 76,000 2.5 6,000
Stockpiles 337,000 1.6 17,000 - - - - - - 337,000 1.6 17,000
Total 497,000 5.6 89,000 1,214,000 6.5 255,000 1,393,000 4.3 194,000 3,104,000 5.4 538,000
Notes to accompany Table 7 1. The Western Tanami Project Resource estimations were completed using Micromine, Surpac and Datamine software, comprising inverse distance grade interpolation within block
models constrained by 3D wireframed geological boundaries. The wireframes defining the mineralisation were based on structural, assay and lithological information. 2. Various top cuts have been applied to the drill hole samples based on lode domain analysis, with the exception of Kookaburra where the effect of top cutting was deemed immaterial.
Where top cuts were applied they ranged from 35g/t for Sandpiper to 120g/t for Coyote. 3. The search constraints applied to the grade estimation were controlled by the orientation of the lodes and the known dip and plunge of the mineralisation within the lodes based on
geological knowledge and mining experience. 4. The Mineral Resource Estimate is reported at a 1g/t Au lower cut-off. 5. Tonnes are rounded to the nearest thousand and grade to 0.1g/t. Rounding may affect tallies. 6. Deposit ounces rounded to nearest thousand. Stockpile ounces rounded to nearest hundred. 7. The Resource estimations used bulk density measurements conducted on a deposit scale and broken down by regolith profile. As such the density measurements applied were based
on test work applicable to the deposit of interest. These ranged from 2.00 t/m3 (base of transported) to 2.72t/m3 (Fresh rock). 8. The Measured Resource at Coyote has been based on the high level of confidence of the location and grade of mineralisation between the current underground development drives.
The development drives have typically six metres separation. The Sandpiper and Kookaburra Measured Resources have been based on a 10 metre distance below the current pit floor, which is supported by a combination of mining at the base of the pits, and five metre deep grade control drilling below the floor of the pit.
9. Resource estimation of Coyote and Sandpiper deposits was completed by Mr Steven Nicholls, former Senior Geologist of Tanami Gold NL. 10. The Kookaburra Resource estimation was conducted by Mr Peter Ball, Director of Datageo Geological Consultants. 11. The Pebbles Resource estimate was completed in 2007 by Mr Malcolm Titley of CSA Australia Pty Ltd. 12. Mr Nicholls (MAIG), Mr Ball (MAusIMM) and Mr Titley (MAusIMM, MAIG) qualify as Competent Persons as defined by the December 2004 edition of the Australasian Code for
Reporting of Exploration Results, Mineral Resources and Ore Reserves (JORC Code) and consent to the inclusion in this report of the matters based on their information in the form and context in which it appears.
13. * The Western Tanami Resource figure stated has not been depleted for combined Coyote mine production of 41,467 ounces during the period 1 July 2010 30th September 2011.
Ore Reserves
Table 8: Total Tanami Gold NL Ore Reserves as at 31 March 2011
Project
Reserve Category Proven Probable Total
Tonnes Grade Ounces Tonnes Grade Ounces Tonnes Grade Ounces
WT 84,100 10.5 28,500 692,600 4.7 104,400 776,700 5.3 132,900
CT 355,000 5.5 62,400 1,689,000 2.9 159,000 2,044,000 3.4 221,300
Sub Total 439,100 6.4 90,900 2,381,600 3.7 263,400 2,820,700 3.9 354,200
CT Stockpile 1,700,000 0.9 48,000 1,700,000 0.9 48,000
Total 2,139,100 2.0 138,900 2,381,600 3.7 263,400 4,520,700 2.8 402,200 Notes to accompany Table 8 1. WT is Western Tanami and CT is Central Tanami 2. Tonnes are rounded to the nearest thousand and grade to 0.1g/t. Rounding may affect tallies. 3. These Ore reserves have been compiled by Mr Peter Lock (MAusIMM), of Mining Plus Pty Ltd, Mr Brad Evans (MAusIMM), of Mining Plus Pty Ltd, Mr Colin McVie (MAusIMM), of
Mining Plus Pty Ltd, Mr Bill Makar, Consultant Geologist – Tanami Gold NL, and Mr Peter Clifford, of MineMap Pty Ltd. Mr Lock, Mr Evans, Mr McVie, Mr Makar and Mr Clifford have sufficient experience which is relevant to the style of mineralisation and type of deposit under consideration and to the activity which they have undertaken as a Competent Person as defined in the 2004 Edition of the Australasian Code of Reporting for Exploration Results, Mineral Resources and Ore reserves (the JORC Code) 2004 edition. Mr Lock, Mr Evans, Mr McVie, Mr Makar and Mr Clifford consent to the inclusion in this report of the matters based on their information in the form and context in which it appears.
For
per
sona
l use
onl
y

15
FOR THE PERIOD ENDING 31 March 2012
Table 9: Central Tanami Project Ore Reserves as at 31 March 2011
Mineral Lease
Reserve Category
Proven Probable Total
Tonnes Grade Ounces Tonnes Grade Ounces Tonnes Grade Ounces
MLS153 - - - 363,100 2.4 27,500 363,100 2.4 27,500
MLS167 355,000 5.5 62,400 120,500 5.4 21,100 475,500 5.5 83,400
MLSA172 - - - 844,800 2.3 62,000 844,800 2.3 62,000
ML22934 - - - 360,600 4.2 48,400 360,600 4.2 48,400
Sub Total 355,000 5.5 62,400 1,689,000 2.9 159,000 2,044,000 3.4 221,300
Stockpiles 1,700,000 0.9 48,000 1,700,000 0.9 48,000
Total 2,055,000 1.7 110,400 1,689,000 2.9 159,000 3,744,000 2.2 269,300 Note to accompany Table 9
1. These Ore Reserves have been compiled by Mr Peter Lock (MAusIMM), of Mining Plus Pty Ltd, Mr Brad Evans (MAusIMM), of Mining Plus Pty Ltd, Mr Colin McVie (MAusIMM), of Mining Plus Pty Ltd and Mr Bill Makar, Consultant Geologist – Tanami Gold NL. Mr Lock, Mr Evans, Mr McVie and Mr Makar have sufficient experience which is relevant to the style of mineralisation and type of deposit under consideration and to the activity which they have undertaken as a Competent Person as defined in the 2004 Edition of the Australasian Code of Reporting for Exploration Results, Mineral Resources and Ore reserves (the JORC Code) 2004 edition. Mr Lock, Mr Evans, Mr McVie and Mr Makar consent to the inclusion in this report of the matters based on their information in the form and context in which it appears.
2. Tonnes are rounded to the nearest thousand and grade to 0.1g/t. Rounding may affect tallies.
Table 10: Western Tanami Operations Mineral Reserves as at 31 March 2011
Deposit
Reserve Category
Proven Probable Total
Tonnes Grade Ounces Tonnes Grade Ounces Tonnes Grade Ounces
Coyote 84,100 10.5 28,500 231,600 8.4 62,400 315,700 9.0 90,900
Sandpiper - - - 53,000 3.0 5,000 53,000 3.0 5,000
Kookaburra - - - 408,000 2.8 37,000 408,000 2.8 37,000
Total 84,100 10.5 28,500 692,600 4.7 104,400 776,700 5.3 132,900 Note to accompany Table 10
1. These Ore reserves have been compiled by Mr Peter Lock (MAusIMM), of Mining Plus Pty Ltd, and Mr Peter Clifford, of MineMap Pty Ltd. Mr Lock, and Mr Clifford have sufficient experience which is relevant to the style of mineralisation and type of deposit under consideration and to the activity which he is undertaking as a Competent Person as defined in the 2004 Edition of the Australasian Code of Reporting for Exploration Results, Mineral Resources and Ore reserves (the JORC Code) 2004 edition. Mr Lock and Mr Clifford consents to the inclusion in this report of the matters based on their information in the form and context in which it appears.
2. Tonnes are rounded to the nearest thousand and grade to 0.1g/t. Rounding may affect tallies.
For
per
sona
l use
onl
y