jan verhagen (wageningen ur) june 19, 2015 - oecd.org · jan verhagen (wageningen ur) june 19, ......
TRANSCRIPT

Climate Smart Agriculture
Measuring Policy impact
Jan Verhagen (Wageningen UR)
June 19, 2015

Challenges for agriculture
feeding the world
low vulnerability
low emissions
= Sustainable development
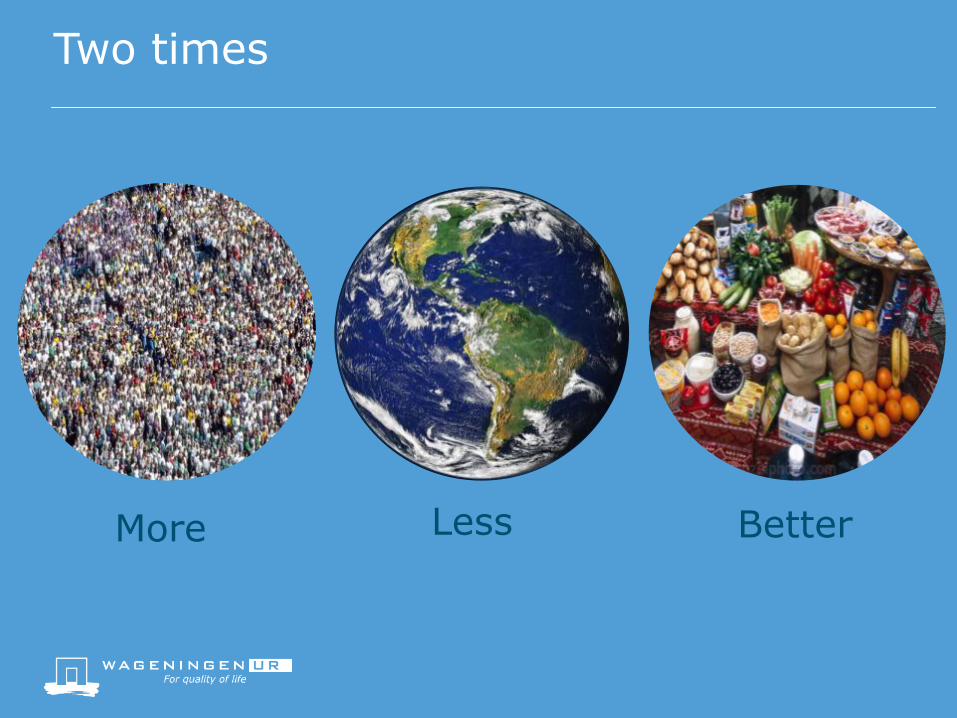
Two times
More Better Less
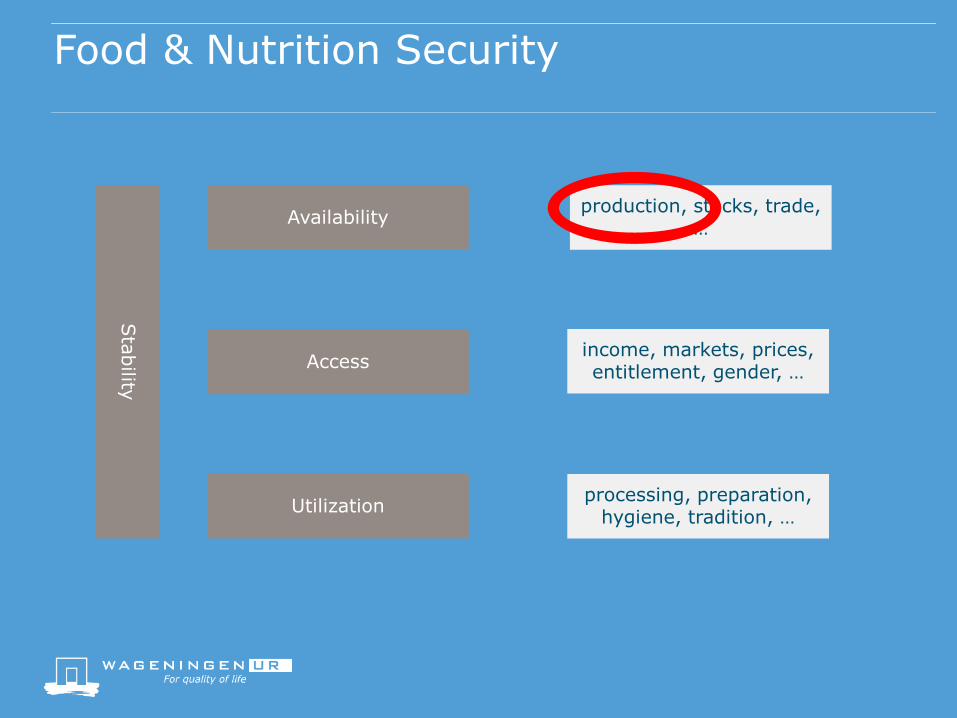
Food & Nutrition Security
Availability
Access
Utilization
production, stocks, trade, …
income, markets, prices, entitlement, gender, …
processing, preparation, hygiene, tradition, …
Sta
bility
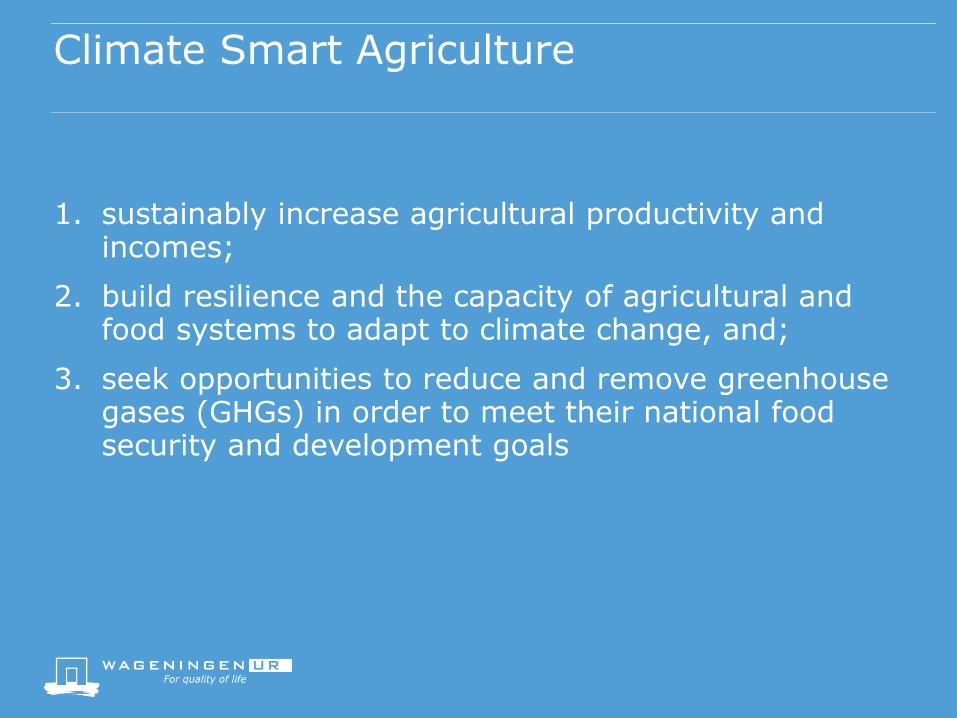
Climate Smart Agriculture
1. sustainably increase agricultural productivity and incomes;
2. build resilience and the capacity of agricultural and food systems to adapt to climate change, and;
3. seek opportunities to reduce and remove greenhouse gases (GHGs) in order to meet their national food security and development goals
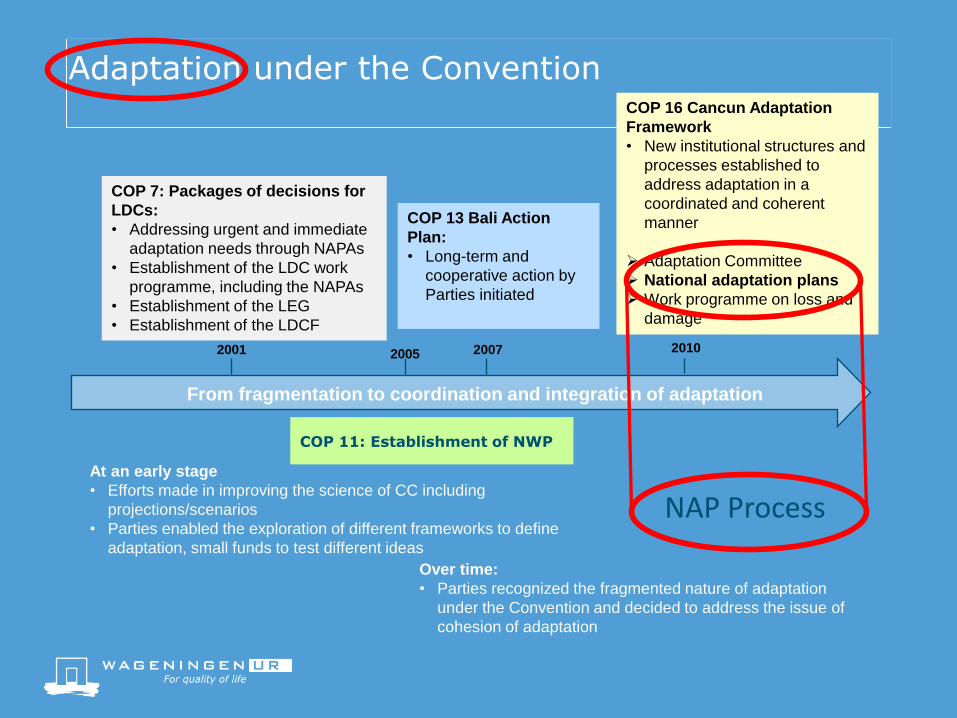
Adaptation under the Convention
From fragmentation to coordination and integration of adaptation
COP 7: Packages of decisions for
LDCs:
• Addressing urgent and immediate
adaptation needs through NAPAs
• Establishment of the LDC work
programme, including the NAPAs
• Establishment of the LEG
• Establishment of the LDCF
2007
COP 13 Bali Action
Plan:
• Long-term and
cooperative action by
Parties initiated
2001
Over time:
• Parties recognized the fragmented nature of adaptation
under the Convention and decided to address the issue of
cohesion of adaptation
2010
COP 16 Cancun Adaptation
Framework
• New institutional structures and
processes established to
address adaptation in a
coordinated and coherent
manner
Adaptation Committee
National adaptation plans
Work programme on loss and
damage
At an early stage
• Efforts made in improving the science of CC including
projections/scenarios
• Parties enabled the exploration of different frameworks to define
adaptation, small funds to test different ideas
COP 11: Establishment of NWP
2005
NAP Process
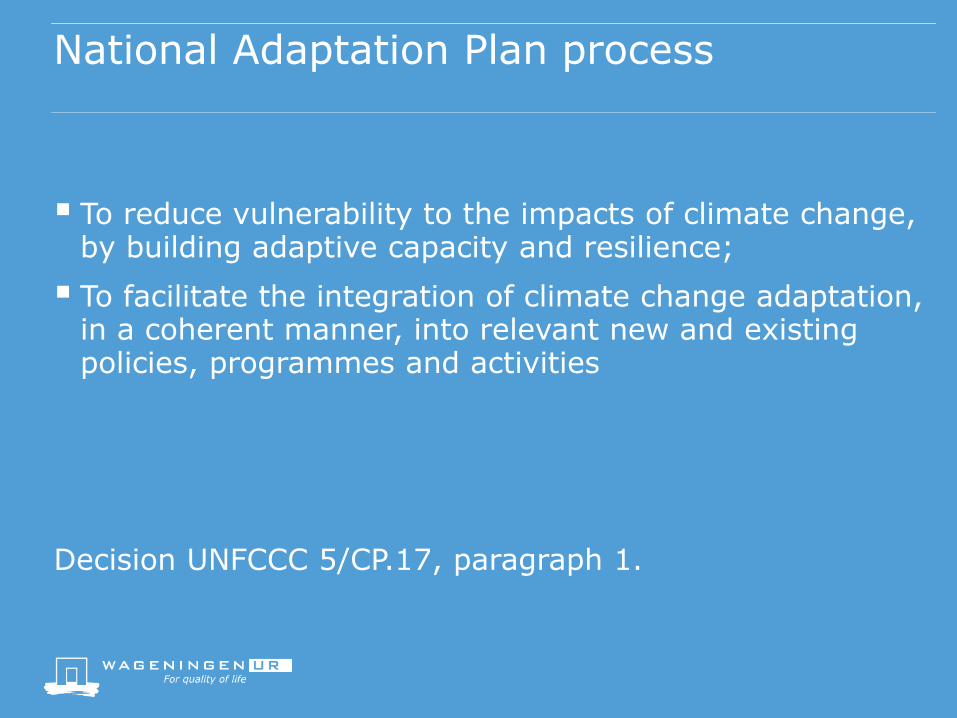
National Adaptation Plan process
To reduce vulnerability to the impacts of climate change, by building adaptive capacity and resilience;
To facilitate the integration of climate change adaptation, in a coherent manner, into relevant new and existing policies, programmes and activities
Decision UNFCCC 5/CP.17, paragraph 1.
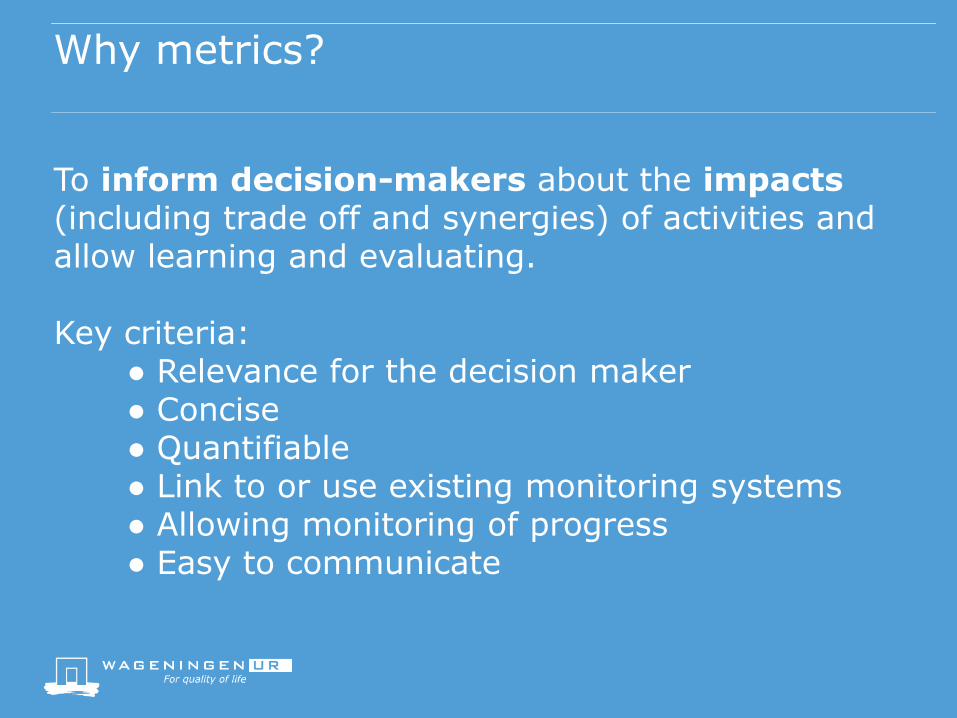
Why metrics?
To inform decision-makers about the impacts (including trade off and synergies) of activities and allow learning and evaluating. Key criteria:
● Relevance for the decision maker ● Concise ● Quantifiable ● Link to or use existing monitoring systems ● Allowing monitoring of progress ● Easy to communicate
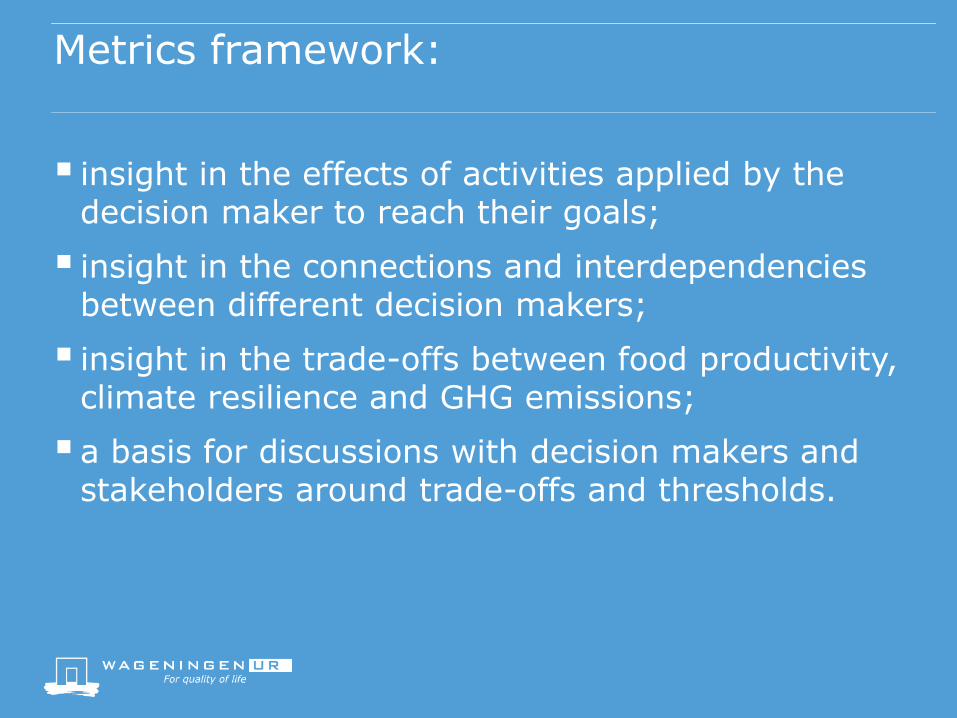
Metrics framework:
insight in the effects of activities applied by the decision maker to reach their goals;
insight in the connections and interdependencies between different decision makers;
insight in the trade-offs between food productivity, climate resilience and GHG emissions;
a basis for discussions with decision makers and stakeholders around trade-offs and thresholds.

Steps
1. Identify the decision maker and understand the objectives and activities the decision maker;
2. Understand the context (social, financial, technical, natural, human) of the decision maker;
3. Map activities undertaken by the decision maker to reach the objectives
4. Understand the impacts of the activities (trade-offs and synergies)

Scales
Global Global
Spatial scale Jurisdiction scale Main stakeholders
Farm/Household Household level/farm Farmer
Community Landscape Commodity processor
Macro(basin) District Weatherboard/ Retailer
National Consumer
Governments
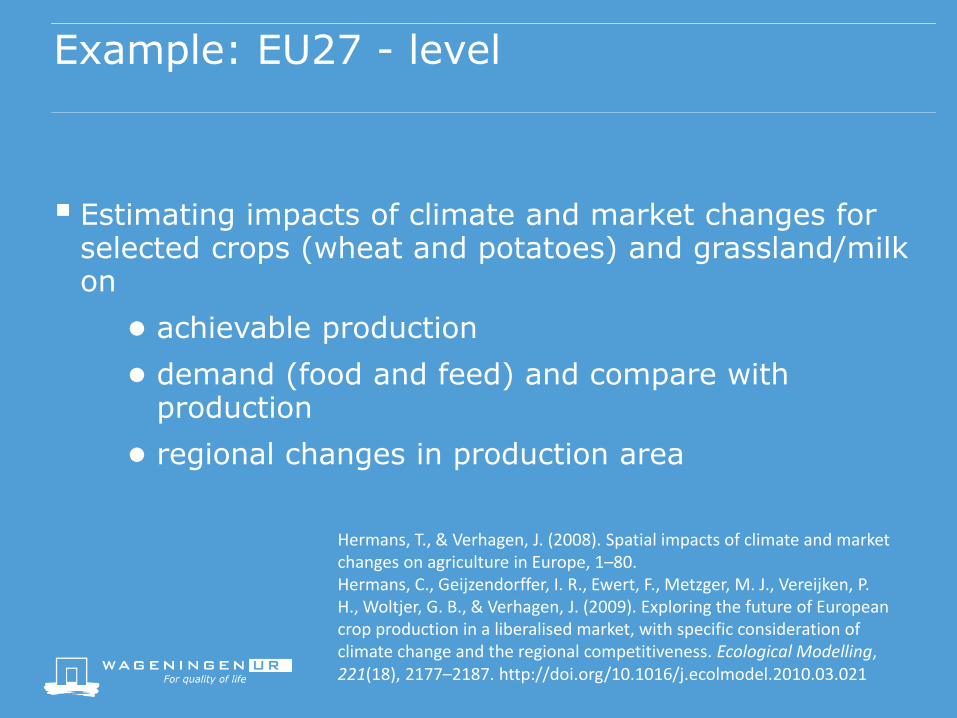
Example: EU27 - level
Estimating impacts of climate and market changes for selected crops (wheat and potatoes) and grassland/milk on
● achievable production
● demand (food and feed) and compare with production
● regional changes in production area
Hermans, T., & Verhagen, J. (2008). Spatial impacts of climate and market changes on agriculture in Europe, 1–80. Hermans, C., Geijzendorffer, I. R., Ewert, F., Metzger, M. J., Vereijken, P. H., Woltjer, G. B., & Verhagen, J. (2009). Exploring the future of European crop production in a liberalised market, with specific consideration of climate change and the regional competitiveness. Ecological Modelling, 221(18), 2177–2187. http://doi.org/10.1016/j.ecolmodel.2010.03.021
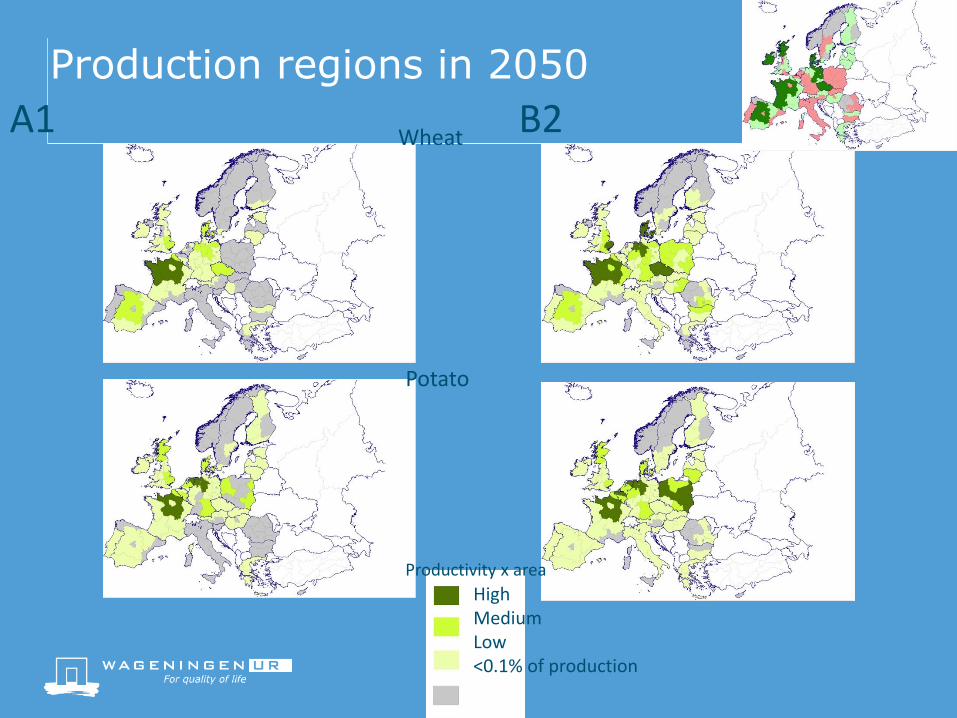
Production regions in 2050
A1 B2 Wheat
Potato
High Medium Low <0.1% of production
Productivity x area
Concluding remarks EU 27
The effects of technology and market change are more pronounced than the effect of climate change;
A wide variability in regional production in Europe is predicted, due to
● differences in productivity of regions
● differences in competitiveness of regions;
Surplus of land is predicted in the global economic scenario A1 and a shortage of land in the regional environmental scenario B2.
Relevance for policymakers
‘Relative’ maps; regions are compared to each other;
Possible policy responses should differ depending on the region;
● Need of support for agricultural innovation
● Need of support for conservation of nature, landscape, water
● Need of support for provision of alternative employment
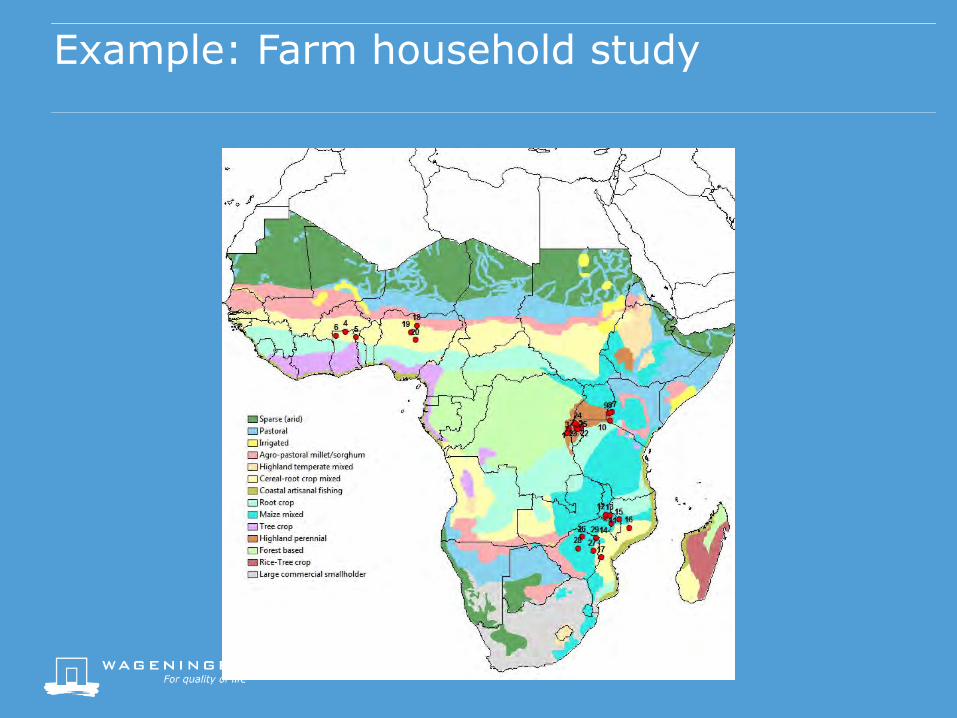
Example: Farm household study
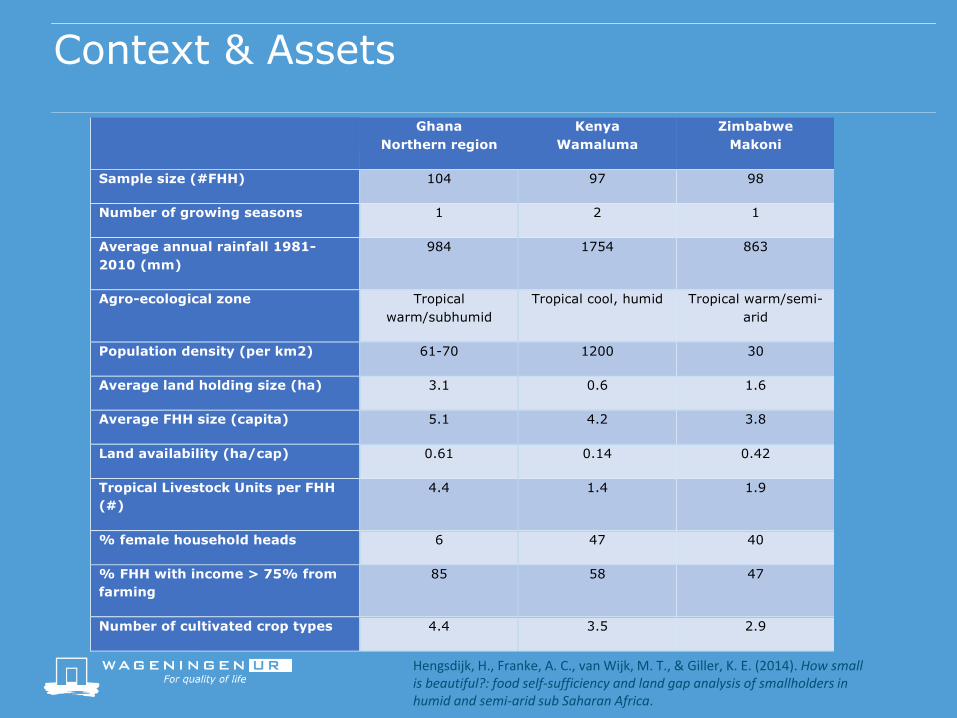
Context & Assets
Ghana
Northern region
Kenya
Wamaluma
Zimbabwe
Makoni
Sample size (#FHH) 104 97 98
Number of growing seasons 1 2 1
Average annual rainfall 1981-
2010 (mm)
984 1754 863
Agro-ecological zone Tropical
warm/subhumid
Tropical cool, humid Tropical warm/semi-
arid
Population density (per km2) 61-70 1200 30
Average land holding size (ha) 3.1 0.6 1.6
Average FHH size (capita) 5.1 4.2 3.8
Land availability (ha/cap) 0.61 0.14 0.42
Tropical Livestock Units per FHH
(#)
4.4 1.4 1.9
% female household heads 6 47 40
% FHH with income > 75% from
farming
85 58 47
Number of cultivated crop types 4.4 3.5 2.9
Hengsdijk, H., Franke, A. C., van Wijk, M. T., & Giller, K. E. (2014). How small is beautiful?: food self-sufficiency and land gap analysis of smallholders in humid and semi-arid sub Saharan Africa.
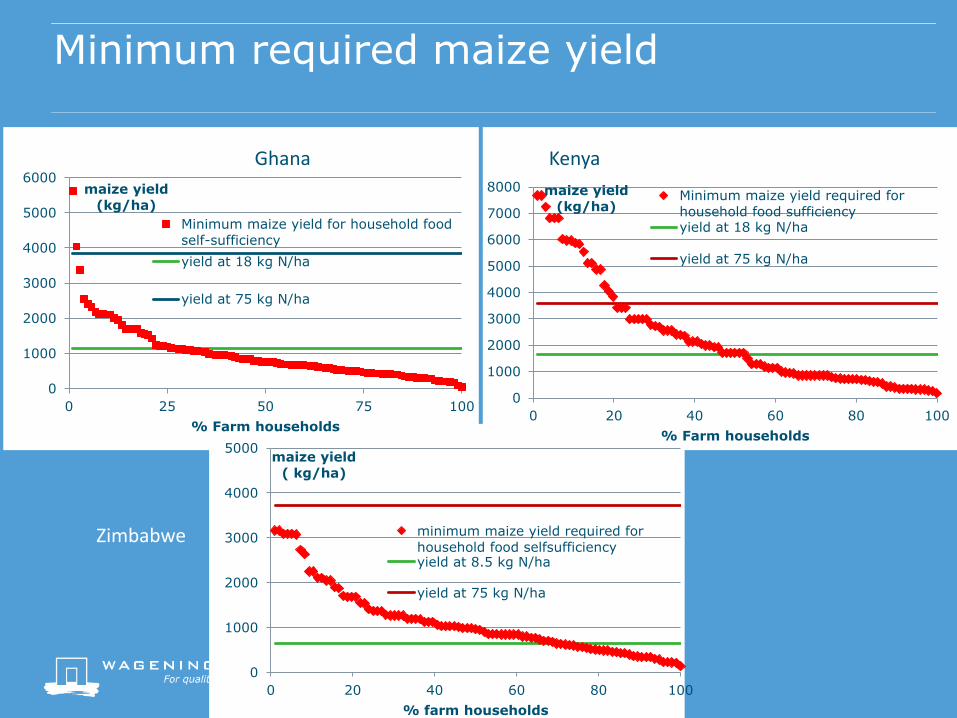
Minimum required maize yield
0
1000
2000
3000
4000
5000
6000
0 25 50 75 100
maize yield
(kg/ha)
% Farm households
Minimum maize yield for household food
self-sufficiency
yield at 18 kg N/ha
yield at 75 kg N/ha
0
1000
2000
3000
4000
5000
6000
7000
8000
0 20 40 60 80 100
maize yield
(kg/ha)
% Farm households
Minimum maize yield required for
household food sufficiencyyield at 18 kg N/ha
yield at 75 kg N/ha
0
1000
2000
3000
4000
5000
0 20 40 60 80 100
maize yield
( kg/ha)
% farm households
minimum maize yield required for
household food selfsufficiencyyield at 8.5 kg N/ha
yield at 75 kg N/ha
Ghana Kenya
Zimbabwe

Income effects
0
0.5
1
1.5
2
2.5
3
0 20 40 60 80 100
Crop
income /
capita
(USD/cap)
% Farm households
actual maize (31 kg N/ha) and actual soya
yieldimproved maize yield (150 kg N/ha) and
improved soya yieldpoverty line
0
1
2
3
4
5
6
0 20 40 60 80 100
crop
income/
capita
(USD/cap)
% farm households
actual maize (8.5 kg
N/ha) and actual soya
yield
improved maize yield
(150 kg N/ha), improved
soya yield
Kenya
Zimbabwe

Impact of CC
Negative in all regions: outcomes are worse than for baseline period (mainly related to increased
temperature): will have a negative affect the other indicators
2.0
2.5
3.0
3.5
4.0
4.5
1990 1995 2000 2005 2010
t/ha
current climate-current variety
future climate-current variety
future climate-modified variety
Kenya
Simulations of maize (with 75 kg N/ha)
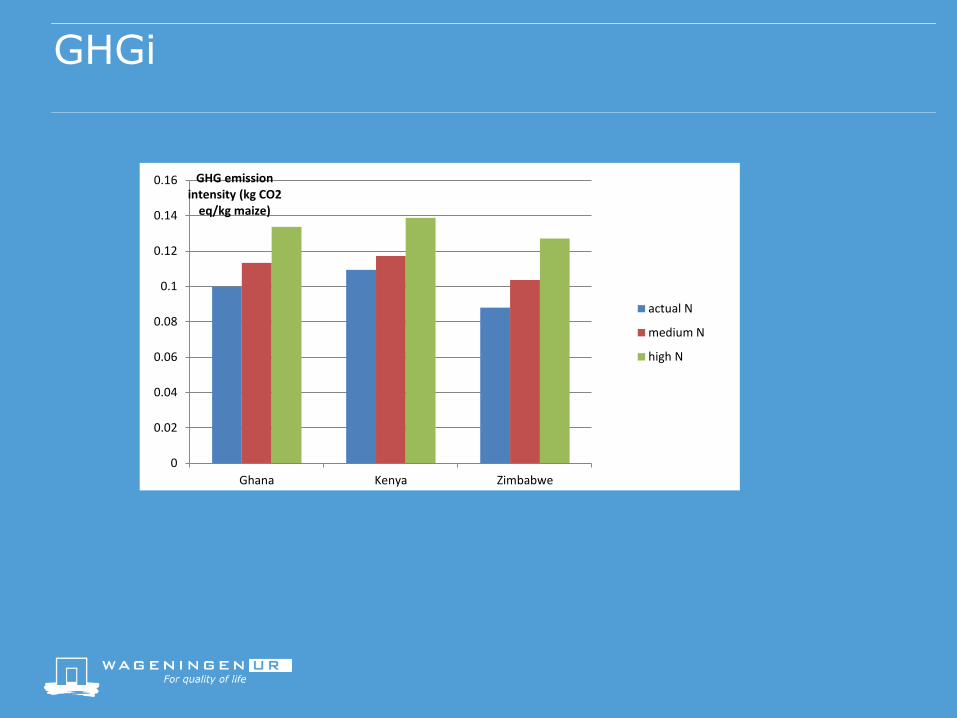
GHGi
0
0.02
0.04
0.06
0.08
0.1
0.12
0.14
0.16
Ghana Kenya Zimbabwe
GHG emission intensity (kg CO2
eq/kg maize)
actual N
medium N
high N
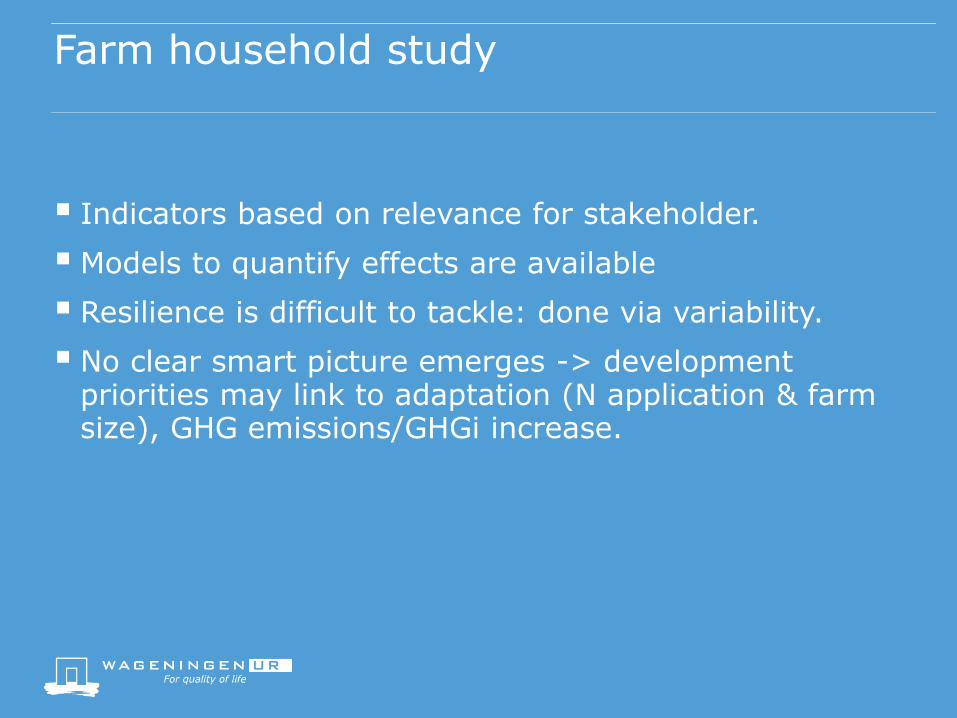
Farm household study
Indicators based on relevance for stakeholder.
Models to quantify effects are available
Resilience is difficult to tackle: done via variability.
No clear smart picture emerges -> development priorities may link to adaptation (N application & farm size), GHG emissions/GHGi increase.
Key messages
Start from political and economic context (awareness and commitment to act)
Set indicators to address development and CC with focus on user group/scale
Make climate information available for everyday practices of stakeholders
● Indicators for and quantitative insight in effects of activities
● Quantitative insight in the trade-offs between food productivity, climate resilience and GHG emissions
Show realism in dealing with synergies and trade-offs
Effectiveness and efficiency not always easy: time scales
Adaptation should lead mitigation: priority remains with feeding the increasing population

Thanks