(jan. to dec. 2018)
TRANSCRIPT

MonotaRO Co., Ltd. www.monotaro.com
Fiscal Year of 2018 (Jan. to Dec. 2018)

2
1. Company Profile
MonotaRO means
• Maintenance, Repair, and Operation • “The sufficient number of products” in Japanese • Like “Momotaro,” fight against unfair-old
distribution system
MonotaRO Business • Providing MRO products through Internet and catalogs,
targeting small to mid-sized domestic manufacturers which are not treated well by conventional retailers.
MRO products • Cutting tools/Safety products/Bearings/Fasteners/Industrial
equipment (number of product SKU 17 million as of Dec. 2018)
Number of Customers • More than 3.3 million
Capital Stock • 1.97 billion JPY or 17.8 million USD (USD1=JPY111.00)
Number of Employees • 2,064 including 480 regular employees
(as of Dec. 31, 2018 consolidated)
Head Office • Amagasaki-city, Hyogo Prefecture
Major Distribution
Center
• Amagasaki-city, Hyogo Prefecture • Kasama-city, Ibaraki Prefecture • Sapporo-city, Hokkaido Prefecture
Image of “Momotaro” in Japanese folk tale

3
2. Product Category
• Safety Protection, Wear, Shoes • Logistic, Packing & Handling Material, Safety Signs • Office, Tape, Cleaning • Cutting Tools, Abrasives • Measuring & Surveying Tools • Hand Tools, Power Tools, Pneumatics Tools • Chemicals, Adhesive, Welding • Hydraulics, Pneumatics, Hose • Bearing, Mechanical Parts, Caster • Electrical Parts, Control Equipment, Solder,
Anti-static Elec. • Construction, Painting, Interior • Air Conditioning, Electric Facilities, Piping,
Plumbing • Screws, Bolts, Nails, Material • Auto, Cargo Truck Maintenance & Parts
(May 2008-) • Motor Bike, Bicycle Maintenance & Parts • Laboratory (Oct. 2010-) • Kitchen Equipment & Supplies (May 2014-) • Agricultural Equipment & Supplies (May 2014-) • Medical & Nursing care Equipment & Supplies
(May 2015-)

4
3. Strength
After (MonotaRO) Before (Conventional Suppliers)
Efficient Sales through Internet
Labor Intensive and localized & small sized
Sales through internet, realizing economies of scale. Efficient promotions, leveraging IT, and cutting-edge &
data-base marketing.
One-Price Policy
Individual and unclear price Providing same price to all customers on web site. Customers trust in open, fair, and proper prices and are
free from bothers in asking quotes every time.
Product Availability
Limited product availability and small selection
Selling more than 17 million items; 524 thousand items are available for same day shipment.
411 thousand items out of the same day shipment products are in inventory.
Private Label Brand and Direct Import Products
Sell mainly National Brand products
Introducing private label brand and direct import products, so that customers can choose the best one to meet their needs among quite a few options.

5
4. Marketing
1. Customer Acquisition • Search engine marketing (SEO and paid search) • Sending direct e-mail, flyers, and faxes to prospects • Broadcasting CM
2. Website • Recommendations and personalized contents
3. Direct e-mail, Flyers, and Faxes • Semi-personalized contents
4. Direct Mail Flyers • Small batches of on-demand printed flyers with DTP
5. Catalog • 19 separate volumes for better targeting
6. Data Mining and Campaign Management • Personalized promotion for more effectiveness and
efficiency

6
5. Procurement
Enhancement of Product Sources
• Developing new suppliers and new products through various channels
Direct Import and Private Brand Products
• Higher margin with national brand quality maintained
• Unique-competitive advantage

7
6-1. Growth – Development Cycle
Broaden Product Lineup
Sales Growth
Increase Inventory
SKU
Increase Customers
More products in inventory for shortening Lead-time
Improving profit margin by introducing PB products
Broadening peripheral market
More keywords for Internet search
Increasing frequently ordered products
Scale ↑ = Convenience ↑

8
6-2. Growth – Industrial Beachhead Expansion
2002 • Started with small-to-mid sized manufacturing companies, iron works, metal works, and
machine assembly companies
2008 • Entered automotive aftermarket
2009 • Entered independent contractor market
2010 • Introduced laboratory products • Started US business with providing consulting service to Zoro Tools • Business with large corporations started to grow
2011 • Established Tagajyo Distribution Center in Miyagi Prefecture
2013 • Started South Korean business by establishing a subsidiary NAVIMRO
2014 • Established Amagasaki Distribution Center in Hyogo Prefecture • Expanded product lineup: agricultural equipment and kitchen equipment • Introduced “MonotaRO One Source” procurement system for large corporations
2015 • Introduced medical & nursing care equipment category
2016 • Started Indonesian business by acquiring majority (51%) of PT MONOTARO
INDONESIA and consolidated to MonotaRO’s in Q4
2017
• Established Kasama Distribution Center in Ibaraki Prefecture • Introduced simplified and easy-installation system “MonotaRO One Source Lite” for large
corporations • Closed Tagajyo Distribution Center • Established Hokkaido Distribution Center
2018
• Established a real shop in Saga Prefecture for demonstration experiment • Launched business in Shanghai, China • Number of Accounts exceeded 3.3 million • Product lineup SKU exceeded 17 million

9
Sales: 105,331 million JPY (YonY +24.4%, A/F +1.2%) • Improving listing ad., working on search engine optimization (SEO), broadcasting new version of TV
ad., expanding product lineup, etc. contributed to acquiring new customers (625 thousand). Due to continuous-expanding effect of campaign for raising usage frequency (started in Mar. 2017), etc. sales to existing customers increased. Monotaro.com sales exceeded last year and plan.
• Number of new customers of large corporations increased, and sales exceeded last year and plan.
Gross Profit: 31,147 million JPY (YonY +18.9%, A/F △0.8%) • Delivery charge hike, etc. increased delivery cost ratio (△0.6 pt.), change in product mix and increase
in large corp. sales (△0.3 pt.), and decrease in consulting/royalty earnings from overseas, etc. resulted in lower Gross Profit (GP%) from Last Year by 1.4 pt.
• Continuous expanding effect of campaign for raising usage frequency and delivery charge hike, etc. increased delivery cost ratio (△0.2 pt.) and decrease in consulting/royalty, etc. resulted in lower product GP% from Plan by 0.6 pt.
SG&A Expense: 16,868 million JPY (YonY +20.2%, A/F +0.8%) • Although Outsourcing Expense ratio increased due to securing personnel for Amagasaki DC
(decrease in productivity caused by weather factors) and for Amagasaki Call Center, sales increase and decrease of expenses concerning Kasama DC’s launch last year not incurred this year contributed to decreasing SG&A ratio from last year by 0.6 pt.
• Although Outsourcing Expense ratio increased due to securing personnel for Amagasaki DC and for Amagasaki Call Center, decline of other expense amounts contributed to decreasing SG&A ratio from plan by 0.1 pt.
Operating Income: 14,278 million JPY (YonY +17.3%, A/F △2.7 %) Net Income: 9,825 million JPY (YonY +12.9%, A/F △4.5%)
• Tax benefit granted last year for investment in Kasama DC for high-productivity not applicable, resulting in higher tax % this year and in lower Net Income (NI) % than last year by 1.0 pt.
• Because Op. Income fell below plan and tax benefits for salary growth included in plan was not granted, tax rate increased, resulting lower amount of NI and in lower NI% by 0.6pt.
7-1. (Non-consolidated) 2018 Financial Result P/L Outline
Jan. – Dec. 2017 Result Jan. – Dec. 2018 Plan Jan. – Dec. 2018 Result
No. Corp. Million JPY YonY /Total Sales Million JPY YonY /Total Sales No. Corp. Million JPY YonY A/F /Total Sales
429 8,800 +58% 10.4% 12,900 +47% 12.5% 604 13,500 +54% +5% 12.9%

10
7-2. (Non-consolidated) 2018 Financial Result P/L
2017 Result
2018 Plan
2018 Result
Amount (million JPY)
Ratio to Sales
Amount (million JPY)
Ratio to Sales
Amount (million JPY)
Ratio to Sales
YonY vs
Plan
Sales 84,656 104,066 105,331 +24.4% +1.2%
Gross Profit 26,204 31.0% 31,405 30.2% 31,147 29.6% +18.9% △0.8%
SG&A Exp. 14,035 16.6% 16,736 16.1% 16,868 16.0% +20.2% +0.8%
Operating Income
12,168 14.4% 14,668 14.1% 14,278 13.6% +17.3% △2.7%
Current Income
12,177 14.4% 14,590 14.0% 14,250 13.5% +17.0% △2.3%
Net Income 8,699 10.3% 10,292 9.9% 9,825 9.3% +12.9% △4.5%
(Tax Rate) (28.5%) (29.4%) (30.9%)

11
7-3. (Non-consolidated) 2018 Financial Result B/S
Short-term Debt & etc. includes short-term debt & current portion of long-term debt.
Dec. 2017
Dec. 2018
Million JPY Million JPY Ratio
Assets
Cash 8,097 11,610 22.5%
Accounts Receivable 9,977 11,476 22.2%
Inventory 7,689 9,543 18.5%
Other 3,861 4,421 8.6%
Total Current Asset 29,626 37,052 71.8%
Tangible Fixed Asset 9,852 9,598 18.6%
Intangible Fixed Assets 1,218 1,316 2.6%
Other 2,827 3,619 7.0%
Total Fixed Asset 13,898 14,533 28.2%
Total Assets 43,525 51,585
Dec. 2017
Dec. 2018
Million JPY Million JPY Ratio
Liabilities
Accounts
Payable 6,510 8,015 15.5%
Short-term
Debt & etc. 2,125 2,000 3.9%
Others 5,150 7,523 14.6%
Total
Current Liabilities 13,786 17,539 34.0%
Total Long term Liabilities 5,418 2,879 5.6%
Total Liabilities 19,205 20,419 39.6%
Net Assets
Shareholder’s
Equity 24,281 31,130 60.3%
Others 38 35 0.1%
Total Net Assets 24,320 31,166 60.4%
Total Liabilities &
Net Assets 43,525 51,585

12
0 2,000,000,000 4,000,000,000
.
.
.
.
.
.
.
.
.
.
.
.
+2,971 mil.JPY
Improving listing ad., SEO, new TV ad., expanding product lineup contributed for acquiring new customers. Expanding effect of raising usage frequency campaign (since Mar. 2017), sales to existing customers increased. Number of new customers of and sales to large corporations increased.
△1,456 mil. JPY
Delivery charge hike, etc. increased delivery cost ratio, change in product mix and increase in large corp. sales, and decrease in consulting/royalty earnings from overseas, etc. resulted in lower Gross GP% from last year.
+594 mil.JPY SG&A decreased due to following reasons.
△187 mil.JPY • Increased due to securing personnel for Amagasaki DC
(weather factor lowered productivity) and for Amagasaki Call Center.
+243 mil.JPY • Although expense amount increased due to campains for
aquiring new customers, implementing efficient ad., and sales increase improved Ad. & Prom. Exp. Sales Ratio.
+172 mil.JPY • Although expense amount increased (Tokyo Office, Osaka
Office, Amagasaki HQ expansion, Kasama Call Center, etc.), sales increase improved Facility Rental Charge Sales Ratio.
+101 mil.JPY • Although catalog shipping costs increased due to increased
number of customers, sales increase contributed to improving Communication Expense Sales Ratio.
+83 mil.JPY • Although Depreciation Expenses for Kasama DC (launched in
Apr. 2017) incurred for full fiscal year, sales increase contributed to improve Depreciation Expense Sales Ratio.
+27 mil.JPY • Despite recognition of liability 237 mill. JPY by incurring
expense en bloc in applying retirement benefit accounting, sales increase improved Labor Expense Sales Ratio.
+154 mil.JPY
• Expenses for launching Kasama DC were not incurred this year and negative expense of 270 mill. JPY was incurred en bloc in applying retirement benefit accounting (to recognize asset concerning retirement benefit). As a result, Other Exp. Sales Ratio improved.
7-4. (Non-consolidated) Operating Income Change Factors
※ Amounts are effects on O/P margin by changes of rates, not actual amounts.
Sales
Increase
• Improvement of Depreciation
Exp. Sales Ratio
• Improvement of Ad. &
Promotion Exp.Sales Ratio
Improvement of SG&A
Expense Sales Ratio
12,168 mil. JPY
14,278 mil. JPY (YonY: +2,109 mil. JPY, +17.3%)
2017 OP
2018 OP
Decrease of GP Ratio
• Improvement of Facility
Rental Charge Sales Ratio
• Improvement of Other
Exp. Sales Ratio
• Improvement of Labor
Exp. Sales Ratio
• Increase of Outsoursing
Exp Sales Ratio
• Improvement of
Communication Exp.Sales Ratio

13
8-1. (Consolidated) 2018 Financial Result P/L
2017
Result 2018 Plan
2018 Result
Amount (million JPY)
Ratio to Sales
Amount (million JPY)
Ratio to Sales
Amount (million JPY)
Ratio to Sales
YonY vs
Plan
Sales 88,347 109,469 109,553 +24.0% +0.1%
Gross Profit 26,929 30.5% 32,604 29.8% 32,027 29.2% +18.9% △1.8%
SG&A Exp. 15,091 17.1% 18,355 16.8% 18,236 16.6% +20.8% △0.6%
Operating Income
11,837 13.4% 14,249 13.0% 13,790 12.6% +16.5% △3.2%
Current Income 11,858 13.4% 14,191 13.0% 13,788 12.6% +16.3% △2.8%
Net Income 8,378 9.5% 9,894 9.0% 9,366 8.6% +11.8% △5.3%
(Tax Rate) (29.3%) (30.2%) (32.0%) Net Income
attributable to owners of the parent
8,464 9.6% 10,044 9.2% 9,515 8.7% +12.4% △5.3%

14
NAVIMRO (South Korea) • Sales grew by10% YonY but was10% below plan (in local currency) due to macro economic
deterioration and to lower repeat rate of existing customers. • Attaining fiscal year break-even postponed from 2018 to 2019.
MONOTARO INDONESIA (Indonesia) • Sales grew by 40% YonY but 30% below plan (in local currency) due to lower repeat rate of
existing customers. • Operating loss within plan.
ZORO SHANGHAI (China) • Launched business in end of June 2018. • Sales plan not attained due to lower customer acquisition and usage rate than plan.
8-2. (Consolidated) 2018 Financial Result P/L Outline
2017 Result 2018 Plan 2018 Result Amount (mil.JPY) YonY
YonY (Local Currency)
Amount (mil.JPY) YonY
YonY (Local Currency)
Amount (mil.JPY) YonY vs Plan
YonY (Local Currency)
vs Plan (Local Currency)
Sales 3,510 +40.9% +32.4% 4,890 +39.4% +32.8% 3,970 +13.2% △18.8% +12.0% △15.7%
Op. Income △130 - - 20 - - △60 - - - -
2017 Result 2018 Plan 2018 Result Amount (mil.JPY) YonY
YonY (Local Currency)
Amount (mil.JPY) YonY
YonY (Local Currency)
Amount (mil.JPY) YonY vs Plan
YonY (Local Currency)
vs Plan (Local Currency)
Sales 190 - - 440 +127.6% +127.6% 260 +34.5% △40.9% +44.9% △36.3%
Op. Income △200 - - △250 - - △240 - - - -
2017 Result 2018 Plan 2018 Result Amount (mil.JPY) YonY
YonY (Local Currency)
Amount (mil.JPY) YonY
YonY (Local Currency)
Amount (mil.JPY) YonY vs Plan
YonY (Local Currency)
vs Plan (Local Currency)
Sales - - - 60 - - 10 - △82.7% - △82.2%
Op. Income - - - △170 - - △180 - - - -

15
8-3. (Consolidated) 2018 Financial Result B/S
Dec. 2017
Dec. 2018
Million JPY Million JPY Ratio
Assets
Cash 8,688 12,381 24.4%
Accounts Receivable 10,039 11,546 22.8%
Inventory 8,081 9,987 19.7%
Other 3,926 4,465 8.8%
Total Current Asset 30,736 38,380 75.7%
Tangible Fixed Asset 9,881 9,620 19.0%
Intangible Fixed Assets 1,347 1,483 2.9%
Other 896 1,220 2.4%
Total Fixed Asset 12,125 12,325 24.3%
Total Assets 42,861 50,706
Dec. 2017
Dec. 2018
Million JPY Million JPY Ratio
Liabilities
Accounts
Payable 6,829 8,318 16.4%
Short-term
Debt & etc. 2,125 2,000 3.9%
Others 5,249 7,642 15.1%
Total Current Liabilities 14,203 17,961 35.4%
Total Long term Liabilities 5,441 2,906 5.7%
Total Liabilities 19,644 20,867 41.2%
Net Assets
Shareholder’s Equity 23,004 29,544 58.3%
Others 212 293 0.6%
Total Net Assets 23,216 29,838 58.8%
Total Liabilities & Net Assets 42,861 50,706
Short-term Debt & etc. includes short-term debt & current portion of long-term debt.

16
8-4. (Consolidated) 2018 Financial Result Outline C/F
2017 Result 2018 Result
Million JPY Million JPY
Cash Flow from Operating Activity
Net Income before Tax 11,853 13,767 Increase or Decrease in Accounts Receivable (△ = increase) △2,466 △1,513 Increase or Decrease in Inventory (△ = increase) △2,057 △1,932 Increase or Decrease in Accounts Payable (△ = decrease) 1,501 1,511 Tax payment △3,324 △3,630 Others 589 2,334 Total 6,097 10,537
Cash Flow from Investing Activity
Acquisition of Tangible Assets △3,236 △423 Acquisition of Intangible Assets △564 △629 Others 515 △413 Total △3,284 △1,467
Cash Flow from Financing Activity
Repayments of Long-term Loans △225 △2,125
Cash Dividends Paid △2,478 △2,978 Proceeds from Sales and Leasebacks 2,440 ー Repayments of Lease Obligations △1,120 △845 Others 4 275 Total △1,379 △5,673
Currency Exchange Adjustment 26 △44 Net Increase or Decrease in Cash and Cash Equivalent (△ = decrease) 1,459 3,352 Cash and Cash Equivalent at Beginning of Period 7,229 8,688 Cash and Cash Equivalent at End of Period 8,688 12,040
17
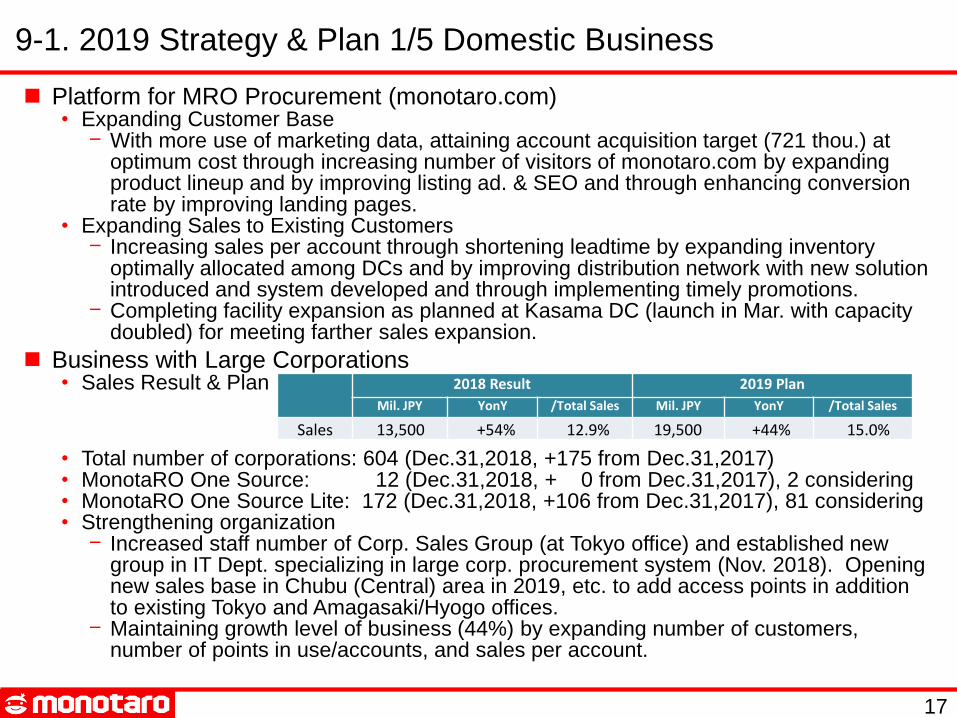
Platform for MRO Procurement (monotaro.com) • Expanding Customer Base
- With more use of marketing data, attaining account acquisition target (721 thou.) at optimum cost through increasing number of visitors of monotaro.com by expanding product lineup and by improving listing ad. & SEO and through enhancing conversion rate by improving landing pages.
• Expanding Sales to Existing Customers - Increasing sales per account through shortening leadtime by expanding inventory
optimally allocated among DCs and by improving distribution network with new solution introduced and system developed and through implementing timely promotions.
- Completing facility expansion as planned at Kasama DC (launch in Mar. with capacity doubled) for meeting farther sales expansion.
Business with Large Corporations • Sales Result & Plan
• Total number of corporations: 604 (Dec.31,2018, +175 from Dec.31,2017) • MonotaRO One Source: 12 (Dec.31,2018, + 0 from Dec.31,2017), 2 considering • MonotaRO One Source Lite: 172 (Dec.31,2018, +106 from Dec.31,2017), 81 considering • Strengthening organization
- Increased staff number of Corp. Sales Group (at Tokyo office) and established new group in IT Dept. specializing in large corp. procurement system (Nov. 2018). Opening new sales base in Chubu (Central) area in 2019, etc. to add access points in addition to existing Tokyo and Amagasaki/Hyogo offices.
- Maintaining growth level of business (44%) by expanding number of customers, number of points in use/accounts, and sales per account.
9-1. 2019 Strategy & Plan 1/5 Domestic Business
2018 Result 2019 Plan
Mil. JPY YonY /Total Sales Mil. JPY YonY /Total Sales
Sales 13,500 +54% 12.9% 19,500 +44% 15.0%

18
Consulting/ Royalty Business • Grainger’s Zoro Business (US, Europe) sales growth maintains. • Operating Profit of Zoro is planned to decrease since it prioritizes system development to
acquire customers and expand product lineup for maintaining sales growth. Royalty to receive is hence planned to decrease.
Strengthening Marketing and System Development Skills based on Data Science • Continuing to hire data-scientists and IT engineers (30 people at Tokyo Office in 2-3 years). • Several joined MonotaRO and started working at Amagasaki HQ and Tokyo Office. • Working on marketing and system development (monotaro.com and core system).
9-2. 2019 Strategy & Plan 2/5 Domestic Business & Organization
19
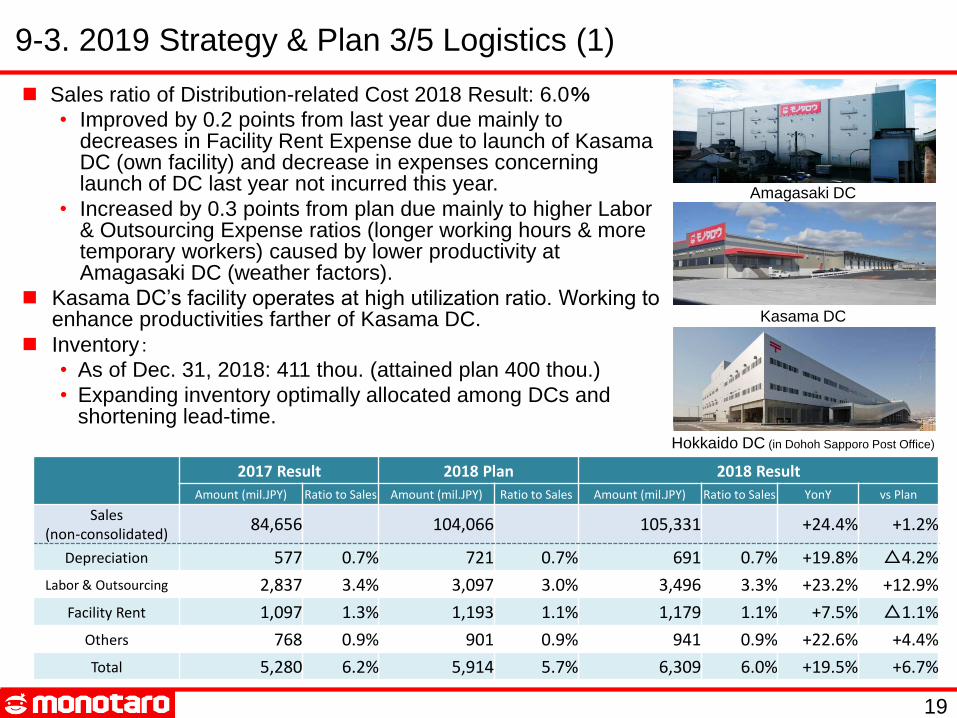
Sales ratio of Distribution-related Cost 2018 Result: 6.0%
• Improved by 0.2 points from last year due mainly to decreases in Facility Rent Expense due to launch of Kasama DC (own facility) and decrease in expenses concerning launch of DC last year not incurred this year.
• Increased by 0.3 points from plan due mainly to higher Labor & Outsourcing Expense ratios (longer working hours & more temporary workers) caused by lower productivity at Amagasaki DC (weather factors).
Kasama DC’s facility operates at high utilization ratio. Working to enhance productivities farther of Kasama DC.
Inventory:
• As of Dec. 31, 2018: 411 thou. (attained plan 400 thou.)
• Expanding inventory optimally allocated among DCs and shortening lead-time.
9-3. 2019 Strategy & Plan 3/5 Logistics (1)
2017 Result 2018 Plan 2018 Result
Amount (mil.JPY) Ratio to Sales Amount (mil.JPY) Ratio to Sales Amount (mil.JPY) Ratio to Sales YonY vs Plan
Sales (non-consolidated)
84,656 104,066 105,331 +24.4% +1.2%
Depreciation 577 0.7% 721 0.7% 691 0.7% +19.8% △4.2%
Labor & Outsourcing 2,837 3.4% 3,097 3.0% 3,496 3.3% +23.2% +12.9%
Facility Rent 1,097 1.3% 1,193 1.1% 1,179 1.1% +7.5% △1.1%
Others 768 0.9% 901 0.9% 941 0.9% +22.6% +4.4%
Total 5,280 6.2% 5,914 5.7% 6,309 6.0% +19.5% +6.7%
Kasama DC
Hokkaido DC (in Dohoh Sapporo Post Office)
Amagasaki DC

20
9-4. 2019 Strategy & Plan 4/5 Logistics (2)
Expansion of Kasama DC Facility • Investing about 3 billion JPY in facility expansion.
- Adding 114 AGV robots. - Adding 28 picking stations. - Technology of projection mapping is utilized at
picking stations. This is expected to raise qualities of distribution (accuracies of kinds/types and numbers of products).
- Becoming capable to meet 160 billion JPY sales after expansion is completed.
Operation capacity expansion for sales increase • Working to expand capacity for year 2021.
• Considering to utilize existing technology (AGV robots, etc.) and adopt new technology.
• When opening a new DC, region to be considered based upon disaster risks, accessablility to market, etc.
Picking Operation with Projection Mapping Utilized
AGV robots, shelfs installed

21
9-5. 2019 Strategy & Plan 5/5 Logistics (3)
2019 Q1-2 Plan (Jan. - Jun.) 2019 Q3-4 Plan (Jul. - Dec.)
Amount (mil.JPY) Ratio to Sales YonY Amount (mil.JPY) Ratio to Sales YonY
Sales (non-consolidated) 61,193 +23.1% 69,401 +24.8%
Depreciation 423 0.7% +24.2% 535 0.8% +52.8%
Labor & Outsourcing 2,044 3.3% +29.3% 2,139 3.1% +11.7%
Facility Rent 705 1.2% +28.9% 791 1.1% +25.2%
Others 563 0.9% +33.1% 574 0.8% +11.1%
Total 3,737 6.1% +29.2% 4,041 5.8% +18.3%
2018 Result 2019 Plan
Amount (mil.JPY) Ratio to Sales Amount (mil.JPY) Ratio to Sales YonY
Sales (non-consolidated) 105,331 130,594 +24.0% Depreciation 691 0.7% 958 0.7% +38.7%
Labor & Outsourcing 3,496 3.3% 4,183 3.2% +19.7% Facility Rent 1,179 1.1% 1,497 1.1% +26.9%
Others 941 0.9% 1,138 0.9% +21.0% Total 6,309 6.0% 7,778 6.0% +23.3%
Distribution-related Cost Plan for 2019
• Depreciation % increases in second half due to completion of facility expansion at Kasama DC (Mar. 2019)
• Due to extension of working hours since summer 2018 and higher hourly pay caused by growing needs for staff, Labor & Outsourcing Expense % increases in first half (YonY). Shipment is planned to be shifted to Kasama DC with higher productivities, improving Labor & Outsourcing Expense % in second half and in whole 2019 (YonY).
22
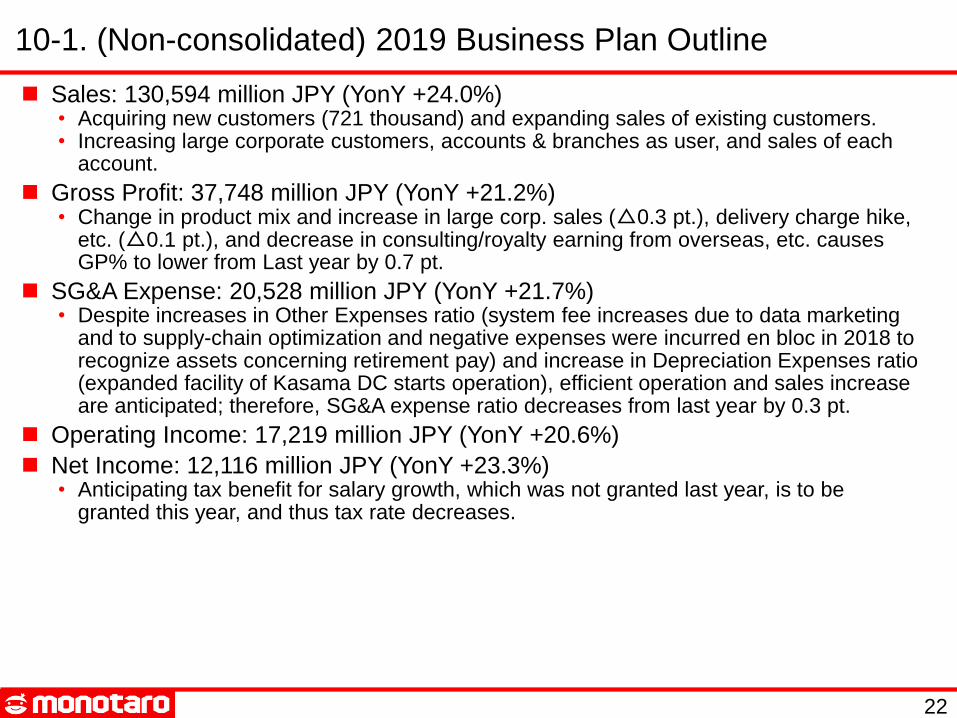
10-1. (Non-consolidated) 2019 Business Plan Outline
Sales: 130,594 million JPY (YonY +24.0%) • Acquiring new customers (721 thousand) and expanding sales of existing customers. • Increasing large corporate customers, accounts & branches as user, and sales of each
account.
Gross Profit: 37,748 million JPY (YonY +21.2%) • Change in product mix and increase in large corp. sales (△0.3 pt.), delivery charge hike,
etc. (△0.1 pt.), and decrease in consulting/royalty earning from overseas, etc. causes GP% to lower from Last year by 0.7 pt.
SG&A Expense: 20,528 million JPY (YonY +21.7%) • Despite increases in Other Expenses ratio (system fee increases due to data marketing
and to supply-chain optimization and negative expenses were incurred en bloc in 2018 to recognize assets concerning retirement pay) and increase in Depreciation Expenses ratio (expanded facility of Kasama DC starts operation), efficient operation and sales increase are anticipated; therefore, SG&A expense ratio decreases from last year by 0.3 pt.
Operating Income: 17,219 million JPY (YonY +20.6%)
Net Income: 12,116 million JPY (YonY +23.3%) • Anticipating tax benefit for salary growth, which was not granted last year, is to be
granted this year, and thus tax rate decreases.

23
10-2. (Non-consolidated) 2019 Business Plan – P/L
2019 Q1-2 Plan (Jan. - Jun.) 2019 Q3-4 Plan (Jul. - Dec.)
Amount (mil.JPY) Ratio to Sales YonY Amount (mil.JPY) Ratio to Sales YonY
Sales 61,193 +23.1% 69,401 +24.8%
Gross Profit 17,691 28.9% +18.2% 20,056 28.9% +23.9%
SG&A Exp. 9,856 16.1% +23.1% 10,671 15.4% +20.4%
Operating Income 7,834 12.8% +12.6% 9,384 13.5% +28.2%
Current Income 7,815 12.8% +12.9% 9,374 13.5% +27.9%
Net Income 5,421 8.9% +13.8% 6,694 9.6% +32.3% (Tax Rate) (30.6%) (28.6%)
2018 Result 2019 Plan
Amount (mil.JPY) Ratio to Sales Amount (mil.JPY) Ratio to Sales YonY
Sales 105,331 130,594 +24.0%
Gross Profit 31,147 29.6% 37,748 28.9% +21.2%
SG&A Exp. 16,868 16.0% 20,528 15.7% +21.7%
Operating Income 14,278 13.6% 17,219 13.2% +20.6%
Current Income 14,250 13.5% 17,189 13.2% +20.6%
Net Income 9,825 9.3% 12,116 9.3% +23.3% (Tax Rate) (30.9%) (29.5%)

24
NAVIMRO (South Korea) • Expanding customer base and raising customers’ procurements even in worsening macro
economic environment. Planning to attain fiscal year break-even in 2019.
MONOTARO INDONESIA (Indonesia) • Continuing to work on optimizing supply chain, on acquiring customers with continued use,
and on expanding inventory.
ZORO SHANGHAI (China) • Expanding customer base by improving listing ad. and search engine optimization and by
contacting with prospect customers.
10-3. (Consolidated) 2019 Business Plan (Overseas Subsidiaries)
2018 Result 2019 Plan
Amount (mil.JPY) YonY YonY (local Currency) Amount (mil.JPY) YonY YonY (local Currency)
Sales 3,970 +13.2% +12.0% 5,000 +25.9% +26.5%
Op.Income △60 ― ― 7 ― ―
2018 Result 2019 Plan
Amount (mil.JPY) YonY YonY (local Currency) Amount (mil.JPY) YonY YonY (local Currency)
Sales 260 +34.5% +44.9% 430 +66.3% +66.3%
Op.Income △240 ― ― △250 ― ―
2018 Result 2019 Plan
Amount (mil.JPY) YonY YonY (local Currency) Amount (mil.JPY) YonY YonY (local Currency)
Sales 10 ― ― 220 ― ―
Op.Income △180 ― ― △420 ― ― *
* Business launched in June 2018.
*

25
10-4. (Consolidated) 2019 Business Plan – P/L
2019 Q1-2 (Jan. - Jun.) 2019 Q3-4 (Jul. - Dec.)
Amount (mil.JPY) Ratio to Sales YonY Amount (mil.JPY) Ratio to Sales YonY
Sales 63,780 +23.4% 72,478 +25.3%
Gross Profit 18,284 28.7% +18.8% 20,780 28.7% +24.9%
SG&A Exp. 10,816 17.0% +24.7% 11,712 16.2% +22.5%
Operating Income 7,468 11.7% +11.3% 9,068 12.5% +28.1%
Current Income 7,462 11.7% +11.6% 9,068 12.5% +27.7%
Net Income 5,069 7.9% +11.4% 6,388 8.8% +32.7% (Tax Rate) (32.1%) (29.5%)
Net Income attributable to owners of the parent 5,191 8.1% +12.7% 6,523 9.0% +32.9%
2018 Result 2019 Plan
Amount (mil.JPY) Ratio to Sales Amount (mil.JPY) Ratio to Sales YonY
Sales 109,553 136,258 +24.4%
Gross Profit 32,027 29.2% 39,065 28.7% +22.0%
SG&A Exp. 18,236 16.6% 22,529 16.5% +23.5%
Operating Income 13,790 12.6% 16,536 12.1% +19.9%
Current Income 13,788 12.6% 16,530 12.1% +19.9%
Net Income 9,366 8.6% 11,457 8.4% +22.3% (Tax Rate) (32.0%) (30.7%)
Net Income attributable to owners of the parent 9,515 8.7% 11,715 8.6% +23.1%

26
11-1. (Non-consolidated) Progress - Sales & Customer
(期末計画値)
130,594
2,426 4,608 6,785 9,175 10,897 14,068 14,209 17,685 22,220 28,639
34,484 44,057
55,607 67,105
84,656
105,331
2,737
52 82 121 176 239 342
454 572
703 892
1,122
1,405
1,776
2,207
3,364
4,084
0
300
600
900
1,200
1,500
1,800
2,100
2,400
2,700
3,000
3,300
3,600
3,900
4,200
4,500
0
10,000
20,000
30,000
40,000
50,000
60,000
70,000
80,000
90,000
100,000
110,000
120,000
130,000
140,000
150,000
2003 2004 2005 2006 2007 2008 2009 2010 2011 2012 2013 2014 2015 2016 2017 2018 2019
Sales 2019 Plan (left axis)
Sales 2003-2018 Actual (left axis)
Number of Customers Registered 2019 Plan (right axis)
Number of Customers Registered 2003-2018 Actual (right axis)
(million JPY) (Thousand Account)
Dec. 2017 Dec. 2018 Dec. 2019 (Plan)
Number of Customers (Registered Accounts)
2,737,820 3,363,711 +625,891 (vs. Dec. 2017) 4,084,711 +721,000
(vs. Dec. 2018)

27
16.1%
19.9%
25.0% 25.3% 26.4%
28.5% 27.9% 27.5%
28.1%
28.5%
30.2%
29.0%
30.5%
31.9% 31.0%
29.6%
28.9%
0.0%
5.0%
10.0%
15.0%
20.0%
25.0%
30.0%
35.0%
2003 2004 2005 2006 2007 2008 2009 2010 2011 2012 2013 2014 2015 2016 2017 2018 2019
11-2. (Non-consolidated) Progress - Gross Profit
※ Credit Card Payment Charge is reported as Cost of Sales from 2017 (if the effect of this change is removed, 2017 Result GP% is 31.5%, 2018 is 30.1%, 2019 Plan is 29.4%).
(Plan)

28
53.7%
26.9%
22.0%
20.2%
22.0%
20.2%
21.5% 20.1% 19.0% 18.4% 18.3% 18.5% 17.3% 17.3%
16.6% 16.0%
15.7%
0.0%
10.0%
20.0%
30.0%
40.0%
50.0%
60.0%
2003 2004 2005 2006 2007 2008 2009 2010 2011 2012 2013 2014 2015 2016 2017 2018 2019
Labor & Outsourcing
Facility Rent
Ad. Prom. & Mailing
Depreciation
Others
Total
11-3. (Non-consolidated) Progress - SG&A Expense
Expense Breakdown
2018 Result
2019 Plan
Labor 4.8% 4.7%
Outsourcing 2.6% 2.3%
Facility Rent 1.3% 1.3%
Ad. & Promotion 3.8% 3.5%
Mailing 0.8% 0.8%
Depreciation 1.1% 1.1%
Others 1.7% 2.0%
Total 16.0% 15.7%
※ Credit Card Payment Charge, reported as “Others” in and before 2016, is reported as Cost of Sales from 2017 (if the effect of this change is removed, 2017 SG&A Exp.% Result is 17.1%, 2018 is 16.5%, 2019 Plan is 16.2%).
(Plan)

29
Construction 19%
Manufacturer 40%
Automotive After-market
12%
Other 29%
Reference 1. Customer Demographics
Industry
Ratio by sales amount in 2018 (Sales through Shopping website-excluding sales through API connection)

30
Reference 2. Internet PO Ratio
Based on Sales in each FY
0%
10%
20%
30%
40%
50%
60%
70%
80%
90%
100%
2003 2004 2005 2006 2007 2008 2009 2010 2011 2012 2013 2014 2015 2016 2017 2018
Other
TEL
FAX
WEB

31
5,000
8,000 9,000
10,000
13,000
17,000
126
200
256
298 302
411
0
44
88
132
176
220
264
308
352
396
440
0
2,000
4,000
6,000
8,000
10,000
12,000
14,000
16,000
18,000
20,000
2003 2004 2005 2006 2007 2008 2009 2010 2011 2012 2013 2014 2015 2016 2017 2018
取扱点数(左軸)
在庫点数(右軸)
Reference 3. Product Lineup & Inventory
(Thousand) (Thousand)
Number of Product Lineup (left axis)
Number of Inventory SKU (right axis)

32
Reference 4. Customers’ Purchase Growth History
(Growth Rate of Sales) (Number of Registered Customers)
The history of the total purchase amounts of customers who registered in a year, setting total purchase amount in the first year as 1.
0
50,000
100,000
150,000
200,000
250,000
300,000
350,000
400,000
450,000
500,000
550,000
600,000
1.00
1.20
1.40
1.60
1.80
2.00
2.20
2008 2009 2010 2011 2012 2013 2014 2015 2016 2017 2018
No. of customers registered in the year(RHS/Thousand)
Purchase growth of customers registered in 2008
Purchase growth of customers registered in 2009
Purchase growth of customers registered in 2010
Purchase growth of customers registered in 2011
Purchase growth of customers registered in 2012
Purchase growth of customers registered in 2013
Purchase growth of customers registered in 2014
Purchase growth of customers registered in 2015
Purchase growth of customers registered in 2016
Purchase growth of customers registered in 2017
Purchase growth of customers registered in 2018

33
0.938 0.938 1.4 2.0 3.0 3.5
6.0
9.0
11.0
13.0
15.0
0
5
10
15
20
2009 2010 2011 2012 2013 2014 2015 2016 2017 2018 2019
Dividend • Dividend Policy: Distributing dividend consistent with stable and ongoing growth • 2018: 13 JPY/share (interim dividend 6.5 JPY and year-end dividend 6.5 JPY to be
proposed in annual shareholders meeting). • 2019: 15 JPY/share Plan
Shareholders’ Benefit • Shareholders having held one or more unit (100 shares) of
MonotaRO share for 6 months or longer on continuous basis as of Dec. 31 are eligible for benefit.
• Eligible shareholders can choose products from MonotaRO’s private brand as benefit, and amount of benefit varies in accordance with holding period (as in right chart).
※ Amounts in graph above based upon share splits including one implemented on Oct. 2018.
Annual Dividend (JPY)
Holding Period Amount Benefit
6 months or more 3,000 JPY (excl. tax)
3 years or more 5,000 JPY (excl. tax)
5 years or more 7,000 JPY (excl. tax)
Reference 5. Dividend & Shareholder Benefit

34
Reference 6. Other MRO Market Players
(M):Apr.[Year] to Mar.[Year+1], (F):Mar.[Year] to Feb.[Year+1], (D) Jan.[Year] to Dec.[Year]
As of Jan. 30, 2019
Upper: Sales
Lower: Operating Profit
Fiscal Year Change
2007 2015 2016 2017 2018 2007 to 2018
Yuasa (8074) - (M) Wholesaler 468,476 442,042 446,335 461,749 480,000 +2.5%
8,254 10,357 10,923 11,402 12,750 +54.5%
Yamazen (8051) - (M) Wholesaler 376,852 447,774 447,698 497,963 520,000 +38.0%
11,518 13,258 13,113 15,383 17,000 +47.6%
Trusco (9830) - (D) Wholesaler 134,430 166,565 177,053 195,096 213,000 +58.4%
9,120 12,976 14,163 14,276 13,600 +49.1%
Misumi (9962) - (M) Retailer 126,668 240,139 259,015 312,969 335,200 +164.6%
16,317 25,690 27,127 34,848 32,800 +101.0%
Nichiden (9902) - (M) Wholesaler 92,745 101,508 103,736 119,712 126,000 +35.9%
5,533 5,066 5,037 6,051 6,270 +13.3%
NaITO (7624) - (F) Wholesaler 51,479 43,483 43,473 46,587 49,000 △4.8%
1,343 585 496 728 920 △31.5%
Sugimoto (9932) - (M) Wholesaler
Retailer
41,461 41,361 41,597 44,315 47,750 +15.2%
2,292 1,843 1,950 2,461 2,800 +22.2%
Toba (7472) - (M) Retailer 25,800 22,881 22,185 28,500 28,000 +8.5%
2,115 1,279 1,050 1,774 1,740 △17.7%
Uematsu (9914) - (M) Retailer 7,647 5,755 6,217 7,125 7,000 △8.5%
190 0 40 92 67 △64.7%
MonotaRO (3064) - (D) Retailer 10,897 57,563 69,647 88,347 109,553 +905.4%
480 7,087 9,493 11,837 13,790 +2,772.9%
35
Contact Us
E-mail:[email protected]
TEL: 81-6-4869-7190
FAX: 81-6-4869-7178
Cautionary Statement concerning Forward-looking Statements
This presentation may include forward-looking statements relating to our future plans, forecasts,
objectives, expectations, and intentions. Actual results may differ materially, for a wide range of
possible reasons. In light of the many risks and uncertainties, you are advised not to put undue
reliance on these statements.
IR information: www.monotaro.com/main/ir/english/