james tupper, ecr learning & change manager, igd · © igd 2012 james tupper, ecr learning...
TRANSCRIPT

© IGD 2012
James Tupper, ECR Learning & Change Manager, IGD
13.30 – 14:55 Secondary Hall, ECR Baltic Forum (Vilnius), 8th November 2012

© IGD 2012
Who is attending the workshop?
Trading Partners
Sup
plier
e.g. Pack
Man
ufactu
rer
Distrib
uto
r
Wh
olesaler
Retailer
Co
lleagues
Brand / Marketing
Category / Buying
Supply Chain
Production
Customer Service
Corp Responsibility

© IGD 2012
How to Improve Performance Together?
As a result of this workshop – which builds upon the earlier presentation – you will :
• Gauge the extent to which preventing material waste from occurring in the first place should be more firmly on your agenda
• Use the evidence provided to engage colleagues and trade partners to improve end-to-end waste performance
• Identify actions to truly engage others, embed waste elimination disciplines into day-to-day operations and sustain low waste
• Adapt the methods proven elsewhere and apply them in the Baltic States
13.30 – 14:55 Secondary Hall, ECR Baltic Forum (Vilnius), 8th November 2012

© IGD 2012
Agenda
• Preventing it together rather than just managing it ourselves – Internal – amongst colleagues
– External – with trading partners
• Types of Supply Chain Waste and their root causes
• How to – see what material is wasted, where and when
– identifying how and why wastage is occurring
– generate ideas and design trials to test impacts
• Redistribution

© IGD 2012
Great individual initiatives
We can achieve more!
Connecting the UK Business
UK Business Units
UK Factories
UK Supply Chain
Head Office Financial Tracking
Portfolio Management
Corporate Reporting

© IGD 2012
Deploying “5 to drive”
Consolidated approach
Connecting the UK Business
UK Business Units
UK Factories
UK Supply Chain
Head Office Financial Tracking
Portfolio Management
Corporate Reporting

© IGD 2012
Marketing Finance Operations Sales
X X
Supply Chain
Changes to the Waste Structure

© IGD 2012
Senior Management
Sales & Marketing
Operations
Finance
Lifecycle Team
Changes to the Waste Structure

© IGD 2012
Waste Governance
Objective: Effectively manage business operations to prevent the generation of product and packaging waste in the supply chain
Inputs
• Outputs from previous review
• Latest KPI performance
• Activity status
• External updates (legislative, environmental, supply chain)
• Key topics for this review
Purpose/agenda
1.Performance review
KPI performance
Key changes
Gaps v’s target – action planning
2.Waste Prevention Activities
Latest status
New activities for agreement
Review of implemented activities
3.Risks & Opportunities
Any escalation points?
4.Decisions, actions & outputs
Outputs
• KPI scorecard v’s targets
• Agreed action plan to drive improvement
• Opportunities/issues/risks to be investigated
• Issues/outputs/decisions made
• Escalation points to management forums
`
Attendees
Management Team sponsor - Chair
Waste /Sustainability Manager - Lead
Finance
Functional Waste representatives
Timing
Once per business cycle
KPI‘s
Total waste generated v’s target (total, by product group, by supply chain)
Waste generated / tonne sold v’s target (total, by product group, by supply chain)

© IGD 2012
Need to work cross functionally
Category, Brand and Marketing
Range, product and packaging decisions
Operations Monitoring and communication of material efficiency Processes improvement
Commercial Prioritisation of improvement opportunities Tracking of waste performance across products and trade partners
Sustainability Help others to align decisions based on factual wastage data alongside sales, customer satisfaction and cost information
Function Major Influences Include
Supply Chain Forecasting of and responsiveness to demand Management of product flow and stock life

© IGD 2012
Agenda
• Preventing it together rather than just managing it ourselves – Internal – amongst colleagues
– External – with trading partners
• Types of Supply Chain Waste and their root causes
• How to – see what material is wasted, where and when
– identifying how and why wastage is occurring
– generate ideas and design trials to test impacts
• Redistribution

© IGD 2012
Preventing waste with trading partners
• To help trading partners, the group launched
a free Collaborative Waste Prevention toolkit:
• Assist in launching successful collaborative
initiatives
• Providing clear principles
• Giving structure through step-by-step
process to deliver greatest benefits

© IGD 2012
Working together to root out supply chain waste

© IGD 2012
Agenda
• Preventing it together rather than just managing it ourselves – Internal – amongst colleagues
– External – with trading partners
• Types of Supply Chain Waste and their root causes
• How to – see what material is wasted, where and when
– identifying how and why wastage is occurring
– generate ideas and design trials to test impacts
• Redistribution

© IGD 2012
A few examples

© IGD 2012
Food & Packaging
Waste
Measurement Machine/Equipment People
Methods Environment Materials
Availability Targets
Forecasting error
Refrigeration
equipment
Promotions
Weather
Shelf-life
Information sharing Packaging
Freshness
Storage
Inventory management
Customer
preferences
Lead times
Forecasting
Transport
Training
Handling
Seasonality
Quality control
Supply chain design
Planning
Different
goals
Source Major events
Production efficiencies

© IGD 2012
Food Supply Chain Waste Root Causes
Defra report: Evidence on the role of supplier – retailer trading relations and practice in waste generation in the food chain
1. Food and Packaging
waste is created between
suppliers and retailers
23. Demand for
certain products has
high variability
25. Promotions create
uncertainty in demand for
promoted product and for other
products (cannibalisation)
21. Forecast are
often inaccurate
26. Weather
fluctuations create
variability of demand
for many products
73. Performance indicators
focus on cost, efficiency
and availability
27. Seasonality and
cyclicality can create
unstable in demand
61. Failure of
refrigeration
equipment (retail
display, transport
and warehousing)
can spoil product
80. Imported products
tend to have longer
lead times
90. Product
recalls create
waste
120. Product gets
damaged or spoilt along
the supply chain
13. Packaging is
sometimes fragile
12. Product is not
always handled
appropriately
30. A structured
approach to running
promotions is not
always followed
110. Packaging
waste arises
along the chain
62. Product
can be
damaged
from chilling
42. People are
increasingly
demanding fresh food
without preservatives
3. Products with poor
appearance often remain
unsold - wasted
60. Poor retailer
chilled displays can
affect appearance
and reduce shelf-life
15. Stacking and
shelving procedures are
not always followed
46. Product rejected by
mainstream retailers can
sometimes be wasted (e.g.
own brand)
20. Over-ordering
and over-
production can
take place
41. Fresh products
tend to have short
shelf-lives 50. Availability
takes priority over
waste
44. Mainstream
retailers demand the
majority of the shelf shelf-
life (60-75%)
45. Short shelf-life
products have been
increasing
32. Retailers and
manufactures don’t
have confidence on
each others’ data
130. Waste may not be
managed systematically
across the supply chain
33. Product stock
can often exceed
demand 70. Products with
shorter shelf-life
left can remain
unsold
82. A higher proportion
of the shelf-life is used
in the supply chain
83. People are
demanding more
products out of season
71. Consumers want
product to be as fresh
as possible
72. Stock rotation
practices are not
always followed81. Out of season
products have to be
imported
63. Poor practices in
cold chain management
can affect the product
91. Failures in Quality
management and
Health & Safety will
cause product recalls
111. Changes in
pricing and labelling
can cause packaging
waste at the
producer
112.
Intermediate
packaging can
create waste
15. Packaging is not
always designed to
minimize waste
Root Cause Analysis – Food Waste
Version 5.0 10/07/09
Prepared by C. Mena
35. Retailers enforce
penalties for not
delivering OTIF
16. Temporally labour is
often not sufficiently trained
47. Own brand
products cannot be
sold to alternative
customers
36. Forecast and orders
can be inflated for
various reasons (e.g.
meet financial targets,
make shelves look full)
37. Forecasting
practices in the
industry are variable
121. Customers
expect consistency in
product appearance
122. Retailers will
reject products
with sub-standard
appearance
2. Products exceeding
their shelf life will be
wasted
100. Responsibility
for managing waste
is not clear in many
organisations
132. Waste is
not measured
consistently
31. Sharing of demand
information between
retailers and suppliers
can be limited
300. Handling
discounts are
offered to increase
efficiency
301. Price sensitive
information cannot
be shared
302. Some
organisations are not
always open to
sharing information

© IGD 2012
Best Practice Sub-Group Survey Q1
© IGD 2012
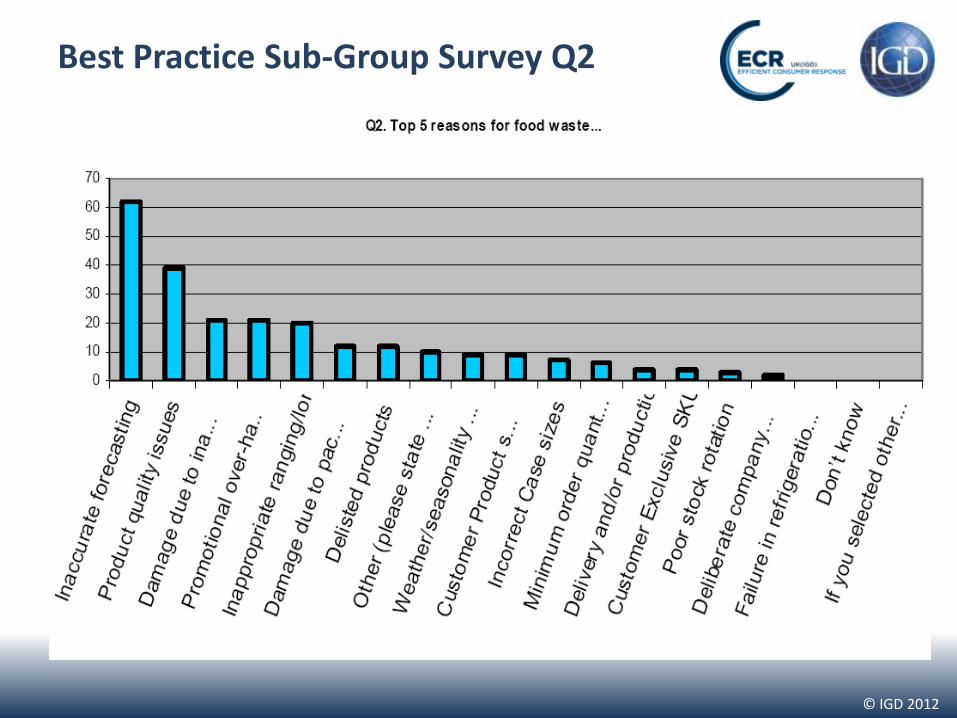
Best Practice Sub-Group Survey Q2

© IGD 2012
Best Practice Sub-Group Survey Q3
© IGD 2012
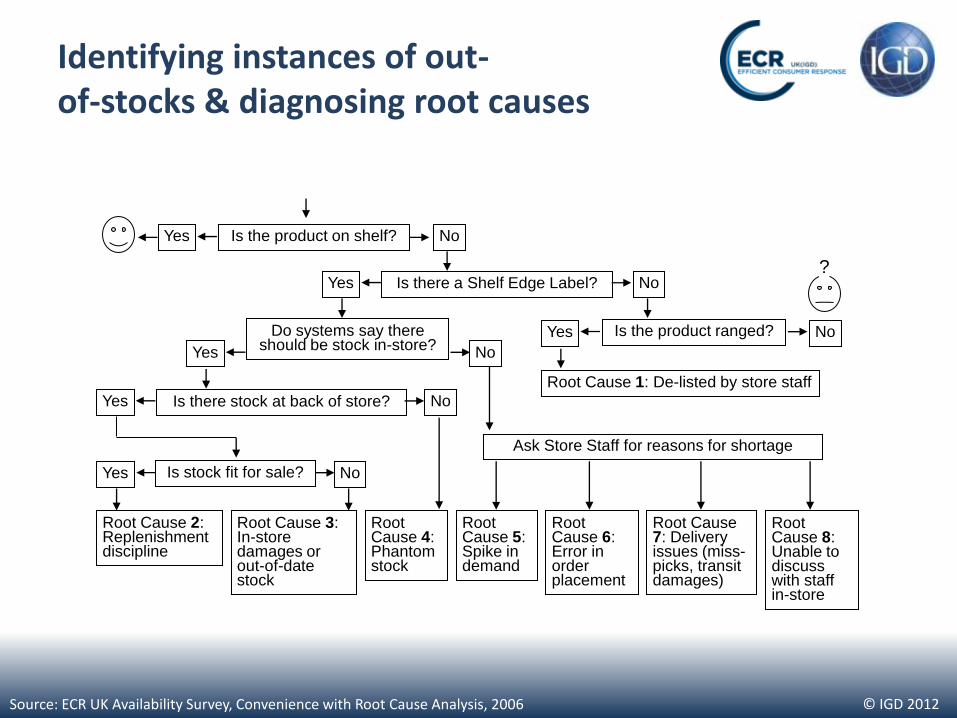
Identifying instances of out- of-stocks & diagnosing root causes
Source: ECR UK Availability Survey, Convenience with Root Cause Analysis, 2006
Is the product on shelf? No Yes
Root Cause 1: De-listed by store staff
Is the product ranged? No Yes
? Is there a Shelf Edge Label? No Yes
Root Cause 4: Phantom stock
Is stock fit for sale? No Yes
Is there stock at back of store? No Yes
Root Cause 3: In-store damages or out-of-date stock
Root Cause 2: Replenishment discipline
Root Cause 5: Spike in demand
Root Cause 6: Error in order placement
Root Cause 7: Delivery issues (miss-picks, transit damages)
Root Cause 8: Unable to discuss with staff in-store
Ask Store Staff for reasons for shortage
Do systems say there should be stock in-store?
No Yes

© IGD 2012
Agenda
• Preventing it together rather than just managing it ourselves – Internal – amongst colleagues
– External – with trading partners
• Types of Supply Chain Waste and their root causes
• How to – see what material is wasted, where and when
– identifying how and why wastage is occurring
– generate ideas and design trials to test impacts
• Redistribution

© IGD 2012
SET UP MEASURE &
UNDERSTAND REDESIGN
& PILOT ROLL OUT
& SUSTAIN
• See what material is wasted, where and when
• See how and why material waste is occurring
• Generate ideas / solutions to prevent waste occurring in the first or redistribute it via alternative markets
Waste Performance Improvement

© IGD 2012
• See what material is wasted, where and when
• See how and why material waste is occurring
• Generate ideas / solutions to prevent waste occurring in the first or redistribute it via alternative markets
Waste Performance Improvement

© IGD 2012
• See what material is wasted, where and when
• See how and why material waste is occurring
• Generate ideas / solutions to prevent waste occurring in the first or redistribute it via alternative markets
Waste Performance Improvement

© IGD 2012
See what is wasted, where and when
• Retailer-supplier team focus on one of their product families where the opportunity to prevent supply chain waste is likely to be most substantial
• Select product family by sharing and combining top level aggregate data about the absolute and percentage values and volumes of material waste between factory in-gate and till
• Material waste can arise at many stages of the supply chain; from goods-in, through processing, packing, storage, picking, dispatch, transport, to shelf replenishment and shopping
• This material waste can take the form of raw material processing loses, clean down waste, and contaminated, damaged, obsolete or expired stocks of product and packaging materials, work-in-progress and finished goods

© IGD 2012
See what is wasted, where and when
• Interrogate SKU / location / time specific data on ERP or similar systems to identify instances of material waste
• Waste type and reason codes are often entered into these systems to explain waste when a manual adjustment is made – Warehouse codes may include: “promotion”, “minimum order
quantity”, “sales below forecast”, “season exit stock” or “damaged”
• Bring together granular data about the absolute and percentage values and volumes of material waste
• Use the ECR Collaborative Waste Prevention Toolkit and Waste Matrix Wastage Matrix by Product Area
Time Period
of Measure
(Daily,
Weekly,
Periodically)
Value Volume
Product AreaSell Value
(£)Damages Out of Date
Wastage %
to £ Sales
Wastage %
to Total £
Sales
Sell Volume Damages Out of DateWastage %
to Sales (vol)
Wastage %
to Total
Sales (vol)
Example A £425,000 £390 £1,220 0.38 % 0.22 % 3,602 3 10 0.38 % 0.02 %
Example B £82,000 £125 £2,225 2.87 % 0.32 % 9,111 14 247 2.87 % 0.45 %
Example C £225,000 £1,110 £1,375 1.10 % 0.34 % 45,000 222 275 1.10 % 0.86 %
Product Area 4 #DIV/0! 0.00 % #DIV/0! 0.00 %
Product Area 5 #DIV/0! 0.00 % #DIV/0! 0.00 %
Product Area 6 #DIV/0! 0.00 % #DIV/0! 0.00 %
Product Area 7 #DIV/0! 0.00 % #DIV/0! 0.00 %
Product Area 8 #DIV/0! 0.00 % #DIV/0! 0.00 %
Product Area 9 #DIV/0! 0.00 % #DIV/0! 0.00 %
Product Area 10 #DIV/0! 0.00 % #DIV/0! 0.00 %
Totals £732,000 £1,625 £4,820 0.88 % 57,713 239 533 1.34 %
Wastage Matrix for (Product Area )
Time Period
of Measure
(Daily,
Weekly,
Periodically)
Value Volume
SKUSell Value
(£)Damages Out of Date
Wastage %
to £ Sales
Wastage %
to Total £
Sales
Sell Volume Damages Out of DateWastage %
to Sales (vol)
Wastage %
to Total
Sales (vol)
Example A £100,000 £32 £287 0.32 % 0.12 % 8,333 3 24 0.32 % 0.10 %
Example B £50,000 £1 £4,754 9.51 % 1.76 % 12,500 0 1,189 9.51 % 4.32 %
Example C £120,000 £2,400 £850 2.71 % 1.20 % 6,667 133 47 2.71 % 0.66 %
Product 4 #DIV/0! 0.00 % #DIV/0! 0.00 %
Product 5 #DIV/0! 0.00 % #DIV/0! 0.00 %
Product 6 #DIV/0! 0.00 % #DIV/0! 0.00 %
Product 7 #DIV/0! 0.00 % #DIV/0! 0.00 %
Product 8 #DIV/0! 0.00 % #DIV/0! 0.00 %
Product 9 #DIV/0! 0.00 % #DIV/0! 0.00 %
Product 10 #DIV/0! 0.00 % #DIV/0! 0.00 %
Totals £270,000 £2,433 £5,891 3.08 % 27,500 136 1,260 5.08 %
Wastage Matrix by Location
Time Period
of Measure
(Daily,
Weekly,
Preiodically)
Value Volume
LocationSell Value
(£)Damages Out of Date
Wastage %
to £ Sales
Wastage %
to Total £
Sales
Sell Volume Damages Out of DateWastage %
to Sales (vol)
Wastage %
to Total
Sales (vol)
Example A £500,000 £850 £1,250 0.42 % 0.09 % 41,667 71 104 0.42 % 0.09 %
Example B £750,000 £525 £1,700 0.30 % 0.10 % 62,500 44 142 0.30 % 0.10 %
Example C £1,000,000 £650 £1,450 0.21 % 0.09 % 83,333 54 121 0.21 % 0.09 %
Location 4 #DIV/0! 0.00 % #DIV/0! 0.00 %
Location 5 #DIV/0! 0.00 % #DIV/0! 0.00 %
Location 6 #DIV/0! 0.00 % #DIV/0! 0.00 %
Location 7 #DIV/0! 0.00 % #DIV/0! 0.00 %
Location 8 #DIV/0! 0.00 % #DIV/0! 0.00 %
Location 9 #DIV/0! 0.00 % #DIV/0! 0.00 %
Location 10 #DIV/0! 0.00 % #DIV/0! 0.00 %
Totals £2,250,000 £2,025 £4,400 0.29 % 187,500 169 367 0.29 %
Wastage Matrix by Time Period
Value Volume
Time PeriodSell Value
(£)Damages Out of Date
Wastage %
to £ Sales
Wastage %
to Total £
Sales
Sell Volume Damages Out of DateWastage %
to Sales (vol)
Wastage %
to Total
Sales (vol)
Week/Period 1 £2,000,000 £100 £30,000 1.51 % 0.14 % 166,667 8 2,500 1.51 % 0.14 %
Week/Period 2 £1,700,000 £80 £16,150 0.95 % 0.08 % 141,667 7 1,346 0.95 % 0.08 %
Week/Period 3 £1,650,000 £75 £15,675 0.95 % 0.08 % 137,500 6 1,306 0.95 % 0.08 %
Week/Period 4 £1,625,000 £70 £15,450 0.96 % 0.07 % 135,417 6 1,288 0.96 % 0.07 %
Week/Period 5 £1,850,000 £85 £17,575 0.95 % 0.08 % 154,167 7 1,465 0.95 % 0.08 %
Week/Period 6 £1,690,000 £80 £16,055 0.95 % 0.08 % 140,833 7 1,338 0.95 % 0.08 %
Week/Period 7 £1,575,000 £65 £14,965 0.95 % 0.07 % 131,250 5 1,247 0.95 % 0.07 %
Week/Period 8 £1,595,000 £65 £15,150 0.95 % 0.07 % 132,917 5 1,263 0.95 % 0.07 %
Week/Period 9 £1,705,000 £80 £16,200 0.95 % 0.08 % 142,083 7 1,350 0.95 % 0.08 %
Week/Period 10 £1,750,000 £85 £16,625 0.95 % 0.08 % 145,833 7 1,385 0.95 % 0.08 %
Week/Period 11 £1,825,000 £85 £17,340 0.95 % 0.08 % 152,083 7 1,445 0.95 % 0.08 %
Week/Period 12 £1,900,000 £95 £28,500 1.51 % 0.14 % 158,333 8 2,375 1.51 % 0.14 %
Totals £20,865,000 £965 £219,685 1.06 % 1,738,750 80 18,307 1.06 %

© IGD 2012
See what is wasted, where and when
• Bring together and analyse system data to identify – hot products – which
– hot spots – or locations along the chain – where
– hot times – of day, days of the week, periods in the promotion cycle, seasons – when
• the numbers of instances or the absolute or percentage volumes of different types of waste are or seem extreme, peculiar or inexplicable
• This office based system data analysis is an essential precursor to further investigations which it will shape
• Go through all the data together, face-to-face

© IGD 2012
Waste Performance Improvement
• See what material is wasted, where and when
• See how and why material waste is occurring
• Generate ideas / solutions to prevent waste occurring in the first or redistribute it via alternative markets

© IGD 2012
See how and why waste is occurring
• The system data analysis sheds some light on top level types of and reasons for material waste
• Before effective solutions can be generated the mechanics and root causes of the material waste need to be identified
• The how and why cannot be detected from the system
• They can be too easily assumed; the temptation to make assumptions, jump to conclusions and invest in changes that don’t prevent material waste has to be guarded against
• Your retailer-supplier team need to go to the hot spots at the key times, investigate the products and use investigative techniques such as the “5 Whys” to learn from those involved
© IGD 2012
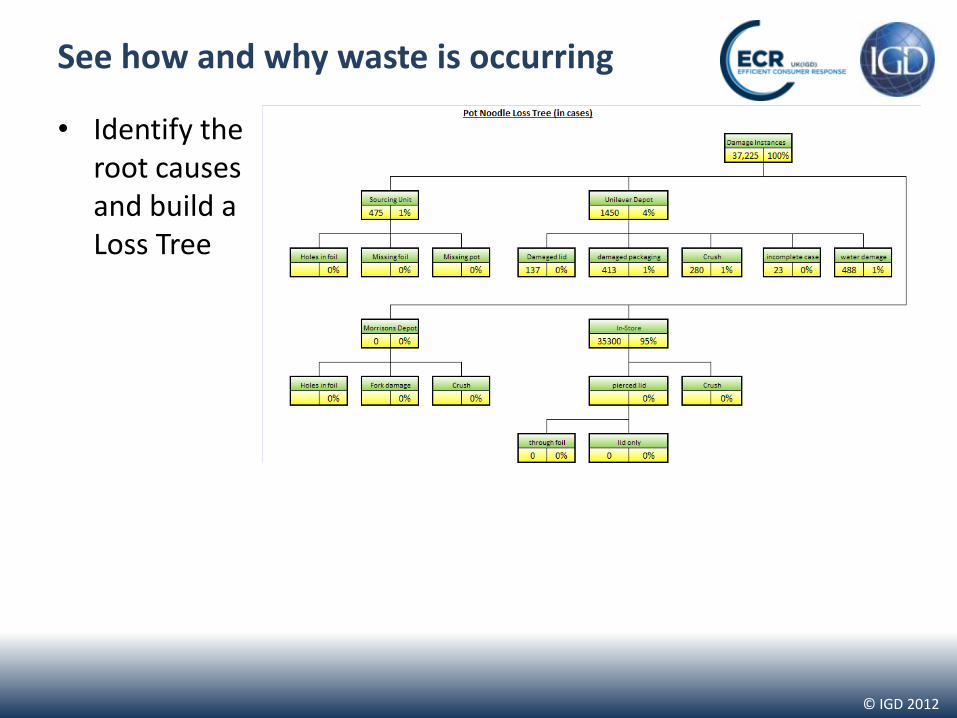
See how and why waste is occurring
• Identify the root causes and build a Loss Tree

© IGD 2012
© IGD 2012
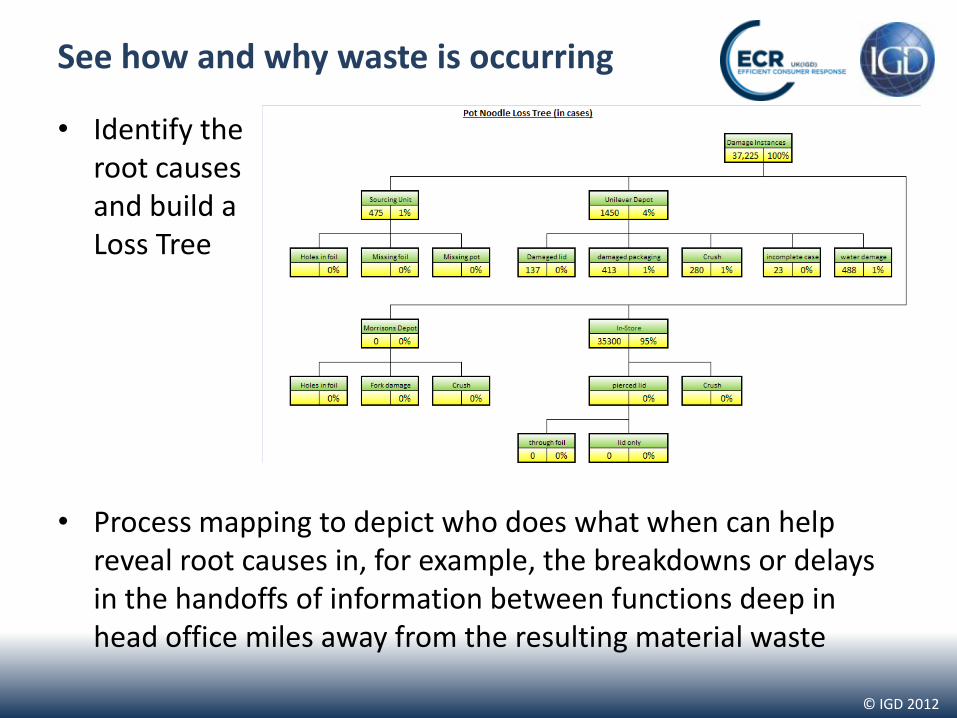
See how and why waste is occurring
• Identify the root causes and build a Loss Tree
• Process mapping to depict who does what when can help reveal root causes in, for example, the breakdowns or delays in the handoffs of information between functions deep in head office miles away from the resulting material waste

© IGD 2012
See how and why waste is occurring
• The retailer and supplier team need to work together all the way from till to factory in-gate and through their respective head offices taking different roles depending whose territory they are on – When visiting, team members should concentrate on asking all their
questions and making all their requests to help build understanding
– When hosting, team members should concentrate on facilitating access to front line staff who can answer questions and to responding to other requests as possible
• The learning is maximised when all this can be undertaken by a cross-functional trading partner team
• Sometimes the true significance of something seen at one point is only recognised by somebody who works somewhere else along the supply chain

© IGD 2012
See how and why waste is occurring
• Such “supply chain walks” should be arranged very carefully to maximise access and learning
• It is often tempting for a site host to dress things up in preparation for a visiting delegation without realising that this defeats the purpose of the visit
• Previously agreed working principles such as those in the ECR Collaborative Waste Prevention Toolkit help build the trust and openness required for maximum effectiveness
• Alongside its competition compliance policy IGD has a new statement of the conduct expected of participants when working on supply side projects (see www.igd.com/policies)
• This is to provide maximum clarity about what can and cannot be done with trading partners on projects such as material waste prevention projects

© IGD 2012
Improve on what is going on, not what you think is going on

© IGD 2012
• See what material is wasted, where and when
• See how and why material waste is occurring
• Generate ideas / solutions to prevent waste occurring in the first or redistribute it via alternative markets
Waste Performance Improvement
© IGD 2012
Generate solutions to prevent or redistribute
• A potentially very wide range of waste prevention opportunities will arise, some with no (or low) cost
• Evidence may have emerged that justifies further consideration of opportunities such as: – Joined-up management of promotions
planning, implementation and review
– Order process improvement
– Secondary packaging design improvement
– Warehouse picker responsibility alignment and education
– Tertiary packaging load stabilisation
– Avoidance of co-packing
– Line by line performance analysis and range adjustment
• These opportunities will need to be prioritised

© IGD 2012
Opportunity assessment

© IGD 2012
Agenda
• Preventing it together rather than just managing it ourselves – Internal – amongst colleagues
– External – with trading partners
• Types of Supply Chain Waste and their root causes
• How to – see what material is wasted, where and when
– identifying how and why wastage is occurring
– generate ideas and design trials to test impacts
• Redistribution