jail mail: ten things you should know about indian prisons mail- ten... · 4 november, 2019 jail...
TRANSCRIPT

4 November, 2019
JAIL MAIL: Ten Things You Should Know About Indian Prisons
An Analysis of Prison Statistics India 2017
Dear Friends,
Greetings from CHRI!
The National Crimes Records Bureau (NCRB) released its annual publication on prisons in India for the year
2017, on 21st October, 2019. The Prison Statistics India (PSI) report is the only national annual statistical
record of the various aspects of prison conditions, administration and prisoners. Since 2015, CHRI analyses
the annual prison statistics released by NCRB to come up with trends and comments on some significant
parameters that reflect status of prisons and prisoners in India. You may read our analysis of Prison Statistics
India 2016 here.
The Prison Statistics India 2017 is a compilation of statistical information received from all the states and
UTs on various aspects running into twelve chapters. As an addition, PSI 2017 has included an ‘additional
table’ on Crimes committed by prison staff against prisoners which includes data on number of incidents,
number of staff involved and other data on actions taken by police, prison and court. Only Jharkhand, Kerala,
Madhya Pradesh and Maharashtra reported one incident each involving 9 prison staff in total. We hope that
states provide more information in subsequent reports. The religion and caste demographics of prisoners
continue to be omitted in the 2017 report as well after it was dropped from PSI 2016, released earlier this
year.
There were 4,50,696 prisoners in 1361 prisons in the country as on 31st December 2017. This year the number
of undertrial prisoners has crossed 3 lakhs. CHRI’s analysis, attached with this newsletter, presents major
findings, trends and a comparative commentary on ten important parameters - proportion of undertrial
prisoners, period of detention, offences, educational qualification of Prisoners, prison staff, women and
prisons: inmates and staff, prison inspections, expenditure on a prisoner per day, foreign national prisoners
and mentally ill prisoners.

What you can do
1. Individuals and organisations working on prisons may,
a) access the data on prisons in their state and conduct trend analysis on key aspects to produce evidence-
based research, and/or b) write to appropriate authorities to bring to their notice any disturbing trends or data that warrants
immediate action such as vacancies in staff, occupancy rates, custodial deaths etc.
2. Individuals and organisations working on prisons may,
a) Prison administrators may, b) ensure that a standardised prisoner file management system is maintained in their prison/s, which
would guarantee accuracy of national prison statistics, and c) make efforts to proactively disclose data on their websites, preferably every quarter.
You can also write to us at [email protected] with comments and suggestions.
Please send us an email if you wish to unsubscribe from these updates.
With best regards,
Madhurima Dhanuka
Programme Head, Prison Reforms Programme
Commonwealth Human Rights Initiative
3rd floor, 55A, Siddhartha Chambers I, Kalu Sarai, New Delhi-110016
Tel: +91-11-4318 0200, 9331127001, 9748927001
*This jail mail has been prepared by Siddharth Lamba, Project Officer, Prison Reforms, Access to Justice
Programme

TEN THINGS YOU SHOULD KNOW ABOUT INDIAN PRISONS
-- Prison Statistics India 2017 --

I. PROPORTION OF UNDERTRIAL PRISONERS
Findings of PSI 2017 Report:
There is no improvement in the country’s undertrial to convict prisoners ratio for more than a decade. Seven out of ten prisoners
are awaiting completion of their trial.
The increase in number of undertrial prisoners is 21.1% from 2012 to 2017, while the increase in total prison population is 17%.
Uttar Pradesh has highest number of undertrial prisoners with 22.3% of the total undertrial prisoners in country, followed by Bihar
at 11%.
Among the 29 states, Meghalaya at 88.4%, Manipur at 84.4%, Bihar at 84.4% and Jammu & Kashmir at 82.6% are the four states
which have the worst undertrial to convict ratio within their state.
Tripura and Andaman & Nicobar Islands are the only state and UT to have less undertrial prisoners than convict prisoners.
CHRI’s Comment: The total undertrial prison population (3, 08, 718) has crossed 3 Lac mark in 2017. A closer look at the number
of undertrial prisons and the total prison population in the last six years reveals that while the latter increased by 65, 561 inmates,
there was an increase of 53, 861 (82.15% of increase in total prison population) in the undertrial prison population. According to
the World Prison Brief’s data, India with 68.5% undertrial prisoners has only 15 countries above it with higher percentage of
Undertrial68.50%
Convict30.87%
Detenue0.47%
Others0.15%
Prison Population in December 2017
Undertrial Convict Detenue Others

undertrial/pre-trial prison population. Among the commonwealth countries India stands at 4th rank with only Nigeria, Pakistan and
Bangladesh above it in the order of highest percentage of undertrial/pre-trial prison population. The estimated world average of
undertrials in prisons is below 20%. High undertrial prison population is an administrative burden on the state which requires critical
attention especially when the prison administration is facing more than 30% staff shortage in the country. It is also a cause of
concern for the judiciary as undertrial prisoners are vulnerable to rights violation in prisons.
Some of the factors leading to an inexorably high undertrial to convict prisoner ratio are unnecessary arrests, long delays in trials
due to administrative convenience of lawyers and prosecuting agency and vacancies in magistracy and lack of escort guards
(police) for ensuring timely court production of prisoners for their hearings. Over a decade CHRI has worked extensively on
numerous policy and statute based safeguards (available here) to ensure reduction in undertrial population. CHRI believes that
transformation of prisons from places of incarceration to correctional homes cannot be a reality without reducing the undertrial
prison population.
II. PERIOD OF DETENTION
Findings of PSI 2017 Report:
25% of undertrial prisoners have been inside prison for more than a year. The share of undertrial prisoners who had been in
prison for more than a year was 20% in 2002.
The number of prisoners behind bars for more than 5 years without being held guilty has increased by 140% from 2012 to 2017.
In 2012 there were 2028 such prisoners while the number jumped to 4876 in 2017.
Jammu & Kashmir and Gujarat combined have 18.7% of total undertrial prisoners in the country who have been incarcerated
for more than 5 years.
9 State and UTs, namely Andhra Pradesh, Arunachal Pradesh, Haryana, Mizoram, Sikkim, Tripura, Andaman & Nicobar Islands,
Daman & Diu and Lakshadweep have no undertrial prisoners who are incarcerated for more than 5 years.
The number of undertrial prisoners incarcerated for longer durations (more than 2 years) is increasing unabated since 2002.
The percentage of undertrial prisoners who spend less than 3 months in prison has decreased form 41.5% in 2002 to 36.7% in
2017.

CHRI’s Comment: The percentage share of prisoners spending shorter time in prison has decreased significantly in the last decade
implying an increase in the percentage of undertrials who continue to be incarcerated for longer durations. Given that the undertrial
population is continuously increasing, the number of prisoners behind bars for longer durations without being convicted is also
increasing without any effective checks.
Longer duration of incarceration has irrevocable socio-economic implications, both on the person and their families. It also shows
that the safeguards such as Cr.P.C. section 436-A which provide for release on bail/personal bond of an undertrial who has spent
upto one half of the maximum sentence under the offence accused of, are not being implemented in spirit. According to the 2017
report, only 1074 (60%) undertrial inmates were released out of 1793 inmates who were found eligible to be released under section
436A. 18 states and 6 UTs reported nil prisoners to be eligible under Section 436 A. Prolonged trials raise doubt on the quality of justice
for both the accused and victims in any case. Jammu & Kashmir which has 10.5% of undertrial prisoners who are incarcerated for
more than 5 years only found 2 undertrials as eligible for release under 436A.
Proper implementation of safeguards like Section 436A, can result in reduction of prisoners spending longer durations in prisons. The
National Legal Services Authority (NALSA) has prepared a Standard Operating Procedure for the smooth functioning of the Undertrial
Review Committees (UTRCs) which review individual cases of inmates falling under 14 categories, for release on bail or other
appropriate action. The Supreme Court, through its orders in 'Re-Inhuman Conditions in 1382 Prisons' mandated formation of UTRCs
41.55 41.33
37.75 36.7
21.84 20.93 22.09 22.1
16.88 17.32 17.64 16.2
11.8 11.48 12.38 12.3
5.33 5.48 5.926.9
2.14 2.71 3.42 4.3
0.5 0.8 0.81.6
0
5
10
15
20
25
30
35
40
45
2002 2007 2012 2017
PER
CEN
TAG
E O
F U
ND
ERTR
IAL
PR
ISO
NER
S
Period of Detention
Upto 3 months
3-6 months
6-12 months
1-2 years
2-3 years
3-5 years
above 5 years

in every district. CHRI believes that an effective implementation of the NASLA’s SOP on UTRCs shall ensure that unnecessary and
prolonged detention is kept under check.
III. OFFENCES
Findings of PSI 2017 Report:
Out of 1, 39,149 convicts, 62% of them of were sentenced for offences against human body (excluding such offences against
women).
17% percent of undertrials are accused of offences against women, while sentenced under these offences form 13% of the
total sentenced prisoners.
There are 34 civil undertrial prisoners and 284 civil convicts in prisons.
The largest difference between the number of undertrials and convicts is among inmates incarcerated under the offences
against property and offences under special and local laws (SLL).
Out of 65, 081 prisoners (undertrials and convicts combined) incarcerated for offences under Special and Local Laws (SLL),
57% are incarcerated for Liquor & Narcotics Drugs offences.
Offences affecting
human body(excluding offences
against womenacts)
Offences againstwomen
Offences againstproperty
Offences underSpecial and Local
Laws
Other IPC Crimes Offences againstpublic tranquility
Civil
109968
50669
7050265081
107141750 34
85493
1836514243 16866
3500 396 286
Prisoners as per Offences
Undertrials Convicts
CHRI’s Comment: Highest share of undertrial population is incarcerated for offences against human body at 36% followed by
offences against property at 23% and SLL offences at 22%. Highest share of convict population is incarcerated for offences against
human body at 61% followed by offences against women at 13% and SLL offences at 12%. Offences against human body is the only
category of offence which has higher share of inmates among convicts than undertrial population. 62% of convicts are sentenced
for offences against human body while undertrials accused of offences falling in this category is 37%. In contrast to this offences
against property and SLL offences have largest difference in the number of convicts and undertrial. Convicts in prison sentenced
under offences against property are only 20% of the total undertrials in prison accused of offences falling in this category. Similarly
convicts in prison sentenced under SLL offences are 26% of the total undertrials under this category. CHRI believes that this analysis
can be used by the state administration for framing targeted undertrial population reduction policies.
IV. EDUCATIONAL QUALIFICATION OF PRISONERS
Findings of PSI 2017 Report:
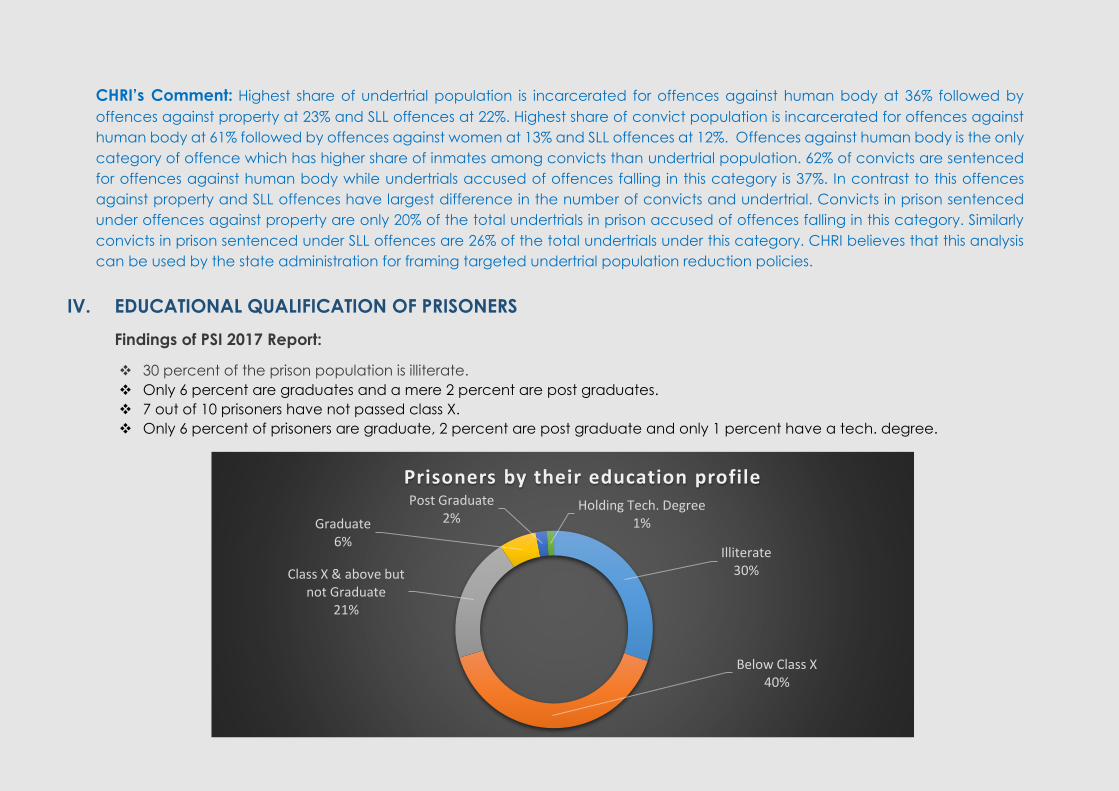
30 percent of the prison population is illiterate.
Only 6 percent are graduates and a mere 2 percent are post graduates.
7 out of 10 prisoners have not passed class X.
Only 6 percent of prisoners are graduate, 2 percent are post graduate and only 1 percent have a tech. degree.
Illiterate30%
Below Class X40%
Class X & above but not Graduate
21%
Graduate6%
Post Graduate2%
Holding Tech. Degree1%
Prisoners by their education profile
CHRI’s Comment: High illiterate and uneducated prison population implies that majority of prisoners are vulnerable because of their
incapacity to understand and participate in the legal process. Illiteracy is often coupled with poverty which means the quality of
legal representation accessed by the illiterate prisoners is also not at par. An overburdened police, prison and judicial system fails to
ensure fair treatment to such prisoners and thus their vulnerability to torture, unfair trial because of non-production, poor defence,
etc. also increases.
The data reported in the year wise Prison Statistics of India shows that from 2012 to 2017, more than 1 Lac prisoners each year have
been benefitted by education facilities in the prisons which include elementary education, adult education, higher education and
computer education. However, the impact of these educational facilities is not reflected in the data analysed above. From 2012 to
2017, 28 to 30 percent of total prisoners continue to be illiterate in Indian prisons. CHRI believes that an administrative introspection
of the education facilities in prisons might reduce the level of illiteracy among convict and undertrial prisoners who spend long
durations in prison. The states in coordination with the Human Resource Ministry must develop literacy programmes for prisoners.
Further, ensuring robust legal services is imperative to guarantee fair treatment and trial of illiterate prisoners.
V. PRISON STAFF
Findings of PSI 2017 Report:
There are 57,307 actual staff in Indian prisons against a sanctioned strength of 83,288 staff. The staff vacancy in Indian prisons
in 2017 is 31.2%, mere 2 percentage points less than that of 2012.
There are 7 inmates per staff. However, there are 737 inmates per correctional staff and 255 inmates per medical staff.
17 States and UTs have not sanctioned probation officers / welfare officers in their prisons.
26 States and UTs have not sanctioned psychologists in their prisons.
20 States and UTs have not sanctioned social workers in their prisons.
Jharkhand has highest vacancy at 66.5%, followed by Delhi at 46.6%, Karnataka at 44.8% and Bihar at 42.3%.
With only 53 psychiatrist/psychologists sanctioned and 23 actual strength in the country, there is one for every 19, 595 inmates.
After ‘others’ category, highest vacancy is in Correctional Staff at 40.3% followed by Medical Staff at 35%.

CHRI’s Comment: The poor state of prison administration in India is outlined by 31% of short staffing and lack of regular trainings.
Only 15.7% of prison staff received training (refresher, specialised or re-orientation course) in 2017. The findings of the data on prison
staff reflects systematic fault lines in the human resource policy on prisons. Even sanctioned Correctional and Medical staff combined
forms mere 4.9% of the total sanctioned strength, actual strength of the two categories is even lower at 4.5% of the total actual
strength. This implies that prisons are still far from being correctional homes. West Bengal with 537 inmates per correctional staff
(national average is 737:1) shows that mere changing the nomenclature from prison services to correctional services is not effective.
Poor proportion of sanctioned as well as actual medical staff explains the reasons behind unabated rate of deaths in prisons.
Short staffing in prisons is far worse than reflected in the PSI figures as it does not take into account suspensions and other factors like
absence on leave or additional administrative duties. PSI data further states that a meagre 15 percent of the total prison officials
and staff have received training in 2016. Lack of trainings hamper both prisoners and the staff as both remain far from the real
objectives of prison services in a modern day civilised state. High overburden implies poor and exploitative work conditions causing
severe distress among the prison official and staff. Senior positions of responsibility are inevitably filled by higher ranking personnel
551611
16191996
3764
4544
37803539
2610
2367
38034
44250
0
5000
10000
15000
20000
25000
30000
35000
40000
45000
400
900
1400
1900
2400
2900
3400
3900
4400
4900
2012 2017
Change in Actual Strength in last 5 years
CorrectionalStaff
MedicalStaff
Officers
Ministerial
Others
Jail Cadre
16.3%
20.7%
-6.4%
-9.3%
23.3%
10.9%

from the police who have neither the training nor experience to run prisons as anything more than holding cells with no thought of
them possibly being correctional facilities as the policies on paper seem to suggest they should be.
VI. WOMEN AND PRISONS – INMATES & STAFF
Findings of PSI 2017 Report:
There are 18873 women prisoners which is 4.2% of total prison population.
There are 5248 women staff which is 9% of the actual staff strength in Indian prisons.
There were 1454 women prisoners with 1681 children in prisons. 74% of women prisoners with children are undertrials.
Worst female occupancy rate is in Chhattisgarh at 166.7% followed by Uttarakhand at 155% and Uttar Pradesh at 114%. Rest
of the states and UTs have female occupancy rate below 100.
The number of women staff increased by 98 from 2016 to 2017. However, the percentage of women staff against total
actual staff decreased from 9.65% to 9.16%.
Telangana has recorded highest increase in percentage of women staff against total actual staff from 2.29% in 2016 to
6.54% in 2017.
12047
1540116951
18873
2525 30963935
5248
0
2000
4000
6000
8000
10000
12000
14000
16000
18000
20000
2002 2007 2012 2017
Increase in Women Inmates and Women Staff
Women prisoners
Women Staff
CHRI’s Comment: From 1999 to 2017, there has been an increase of 118% in women prisoners which is much higher than the increase
in men prisoners. Such a rapid increase in women prisoners calls for significant reforms in the overall prison administration keeping in
mind gender based vulnerabilities of women prisoners. As per the PSI 201 report, only 13 states namely Tamil Nadu, Kerala, Bihar,
Rajasthan, Delhi, Andhra Pradesh, Gujarat, Maharashtra, Odisha, Punjab, Telangana, Uttar Pradesh and West Bengal have a total
of 22 women jails in the country. Rest of the states do not have any prison exclusively for women inmates. Women prisoners are
confined to women enclosures in prisons housing both men and women, impliedly restricting them from open spaces in prisons
including community areas, playgrounds, etc. CHRI believes that reforms with regards to women prisoners must involve them in the
planning process as gender vulnerabilities in prisons are multi-layered.
9% of women representation in the actual prison staff strength is much below than the aspired 33% women representation in public
sector. Modern day prison administration is ought to be far away from socially assigned gender roles. CHRI believes that prison
institutions like any other workplace should be adequately represented by all the genders visible in the society. Gender data on
inmates as well as staff as reported in PSI also reflects that transgender is still not recognised in data calculation as a separate gender.
VII. PRISON INSPECTIONS
Findings of PSI 2017 Report:
With 51099 total prison inspections, there were 3 inspections per prison per month in 2017 on an average.
Medical inspections at 38.5% form the highest share of total inspections, followed by Executive inspections at 21.4%, Judicial
inspections at 28% and other inspections at 12.1% of total inspections.
Andhra Pradesh with 15869 inspections accounted for 31.1% of total prison inspections in the country.
Chandigarh with only one prison and 378 inspections has the highest 31.5 inspections per prison per month, followed by
Andhra Pradesh at 12.6, Haryana at 8.5, Tripura at 7.9 and Gujarat at 7.1.
With 14326 total judicial inspections in 2017, there was not even one judicial inspection per prison per month on an average.
The highest rate of judicial inspections per prison per month is in Gujarat at 3.4 followed by Haryana at 2.7, Punjab at 2.4 and
Tripura at 2.2.

CHRI’s Comment: Prisons are traditionally closed institutions often perceived places of punishment. However, courts have
invariably observed that prisons require regular and strict monitoring to ensure that they administered as per the law. External and
internal visits to prisons aid in prison administration and safeguard rights of prisoners. Prison visitors include magistrates and judges,
human rights commissions, officers from public works, medical and health, social welfare departments and respected people
drawn from local society. They monitor and report prison infrastructure, prison records, prisoners’ living conditions, et. al. and listen
to grievances of the prisoners, making the prisons transparent and accountable to the society. There is also a Board of Visitors
which comprises official as well as non-official visitors who are required to meet regularly to discuss issues of concern and
recommend solutions.
CHRI’s two national reports on prison monitoring ‘Looking into the Haze 2016’ and its second edition of 2018 which will be released
in December 2019 finds that prison visiting boards are not operational in most of the prisons and the states performed very poor
on their state-wise mandates on prison monitoring. The report reflects poor rate of appointments of visitors in prisons across the
country. The second report shows that the appointments remain poor, Boards do not meet at all in some states while meet rarely
in others and non-official visitors do not visit the prisons as per the mandate. So poor is the oversight of prisons that the Supreme
Court has taken on to itself the task of monitoring prisons through the judiciary as well as monitoring and directing the rectification
of the system through an on-going case aptly named “ Inhuman Conditions in 1382 Prisons”.
31.5
12.6
8.5 7.9 7.1 6.3 6.0 5.3 5.3 5.2 5.2 4.9 3.8 3.6 3.5 3.2 3.1 2.7 2.6 2.4 2.3 2.1 2.0 2.0 1.7 1.7 1.6 1.3 1.1 1.0 1.0 0.6 0.4 0.4 0.3 0.20.0
5.0
10.0
15.0
20.0
25.0
30.0
35.0
Number of Inspections per Prison per Month in 2017
The PSI data showing 3 visits per prison per month does not show the real situation of prison inspection as visits without proper
reports and full inspection are not effective. The NCRB data does not mention number of reports submitted by the
visitors/inspectors. The ‘per prison per month inspection’ average is based on the assumption that all 1361 prisons were evenly
visited throughout the year. The reality of prison inspections in India is far grim than it is reflected in any data on prison visits. CHRI
has been advocating for the implementation of the statutory requirement of the constitution of Board of Visitors (BOV) in every
jail for effective prison monitoring.
VIII. EXPENDITURE ON A PRISONER PER DAY
Findings of PSI 2017 Report:
The prison department spent Rs. 103 per prisoner every day in 2017-2018 which is Rs. 21.5 more than what was spent last year.
On an average, 35.6% of the total budget is spent on inmates.
Haryana spent the highest share of its total expenditure on inmates at 99.1%, followed by 92.9% by Andhra Pradesh and 61.6%
by Delhi. Andaman & Nicobar Islands spent least share of total expenditure on inmates at 6.9% followed by Nagaland at 6.7%.
Sanctioned budget in 2017-2018 decreased by 3.8% from last fiscal year’s sanctioned budget. There was a corresponding
decrease in actual expenditure by 3.8% in 2017-2018 in comparison to the last fiscal year.
Expenditure on Educational/ Vocational, Medical, Clothing and Welfare Activities combined formed a mere 8% of the total
expenditure on inmates. Rs. 4.24 per inmate per day were spent on medical and Rs. 1.67 per inmate per day were spent on
welfare activities, in 2017-2018.
CHRI’s Comment: Expenditure on per inmate per day has increased but it still remains very low to ensure decent living conditions
for prisoners. This can be evidenced by the distribution of expenditure on inmates which shows that 92% of the total expenditure
on inmates is on food and ‘other’ activities which include transport, hygiene, sanitation etc. The data also reflects that are huge
variations in budget allocations in different states. For instance the gap between the state spending highest share of expenditure
on inmates to lowest is more than 80 percentage points.

Nine states and UTs have reported nil expenditure on ‘other’ activities. 13 States and UTs have reported nil expenditure on
Education and vocational activities. Maharashtra reported to have provided education facilities to 6172 prisoners and
vocational trainings to 2985 prisoners in 2017 but recorded nil expenditure in this category in 2017-2018. However, educational
and vocational facilities might be actually provided by NGOs with no cost burden on the state; Maharashtra has second highest
number of NGOs (143) after Gujarat (155) working exclusively on prison reforms. Nevertheless, these variations in the expenditure
data call for revision of budgetary allocation and expense distribution policies.
IX. FOREIGN NATIONAL PRISONERS
Findings of PSI 2017 Report:
There are 4917 foreign national prisoners in Indian Prisons. 2227 are convicted, 2250 are undertrials, 40 are detenues and 400
categorised as ‘others’.
The number of foreign national prisoners in India has decreased by 25.7% from 2015 to 2017. Highest decrease (40.7%) from
3795 in 2015 to 2250 in 2017 is in undertrial category.
In 2017, 45.8% of foreign national prisoners are undertrials, 45.3% are convicts, 8.1% are categorised as ‘others’ and 0.8% are
detenue.
46.2 percent of foreign national prisoners are from Bangladesh (2272) followed by Nepal (683) and Nigeria (532) at 13.9 and
10.8 percent respectively.
Highest decrease in foreign national prisoners from 2015 to 2017 is recorded in Andaman & Nicobar Islands at 90.8% followed
by Tripura at 69.3% and West Bengal at 39.8%.

CHRI’s Comment: All 40 foreign national detenues are incarcerated in the prisons of Jammu Kashmir. 368 ‘others’ are
incarcerated in West Bengal followed by 38 in Punjab and 1 in Bihar. These two categories combined form 8.9% of the foreign
national prisoners who are either awaiting repatriation or whose nationalities are yet to be established. Further, the PSI data has
put 46 foreign national convicts and 113 foreign national undertrials in the category of ‘other foreign national prisons’, which
leaves ambiguity on whether the nationalities of these prisoner are known. Further, it does not include the persons detained in the
detention centres such as that of Assam, making the reported number much lower than actual number of foreign nationals in
detention.
CHRI’s 2019 report on Foreigners in Indian Prisons – Strangers to Justice documented the challenges and issues faced by foreign
national prisoners in India based on RTI data. The findings of the report shows that there is a huge variation in the PSI figures and
data received through RTI responses on the number of foreign national prisoners. Further, it revealed that only 5.7% percent of
foreign national prisoners received consular access. RTI responses also stated that 522 out of 3908 such prisoners are ‘persons
whose nationality is not provided’. The NCRB data on foreign national prisoners remains devoid of these figures without which the
actual situation of these prisoners remain partially presented.
2353 23662227
3795
3258
2250
37 4340
435703 400
66206370
4917
2000
2500
3000
3500
4000
4500
5000
5500
6000
6500
7000
0
500
1000
1500
2000
2500
3000
3500
4000
4500
5000
Chart Title
Convicts
Undertrials
Detenue
Others
Total
-25.7%
-40.7%
-5.4%
-8%
8.1%
Despite bilateral agreements for transfer of sentenced prisoners, lack of diligent consular assistance, restrictions on making
restrictions on making international calls to family, lack of implementation of agreements on transferring of prisoners between India
and Bangladesh, sketchy application of deportation/repatriation procedures and absence of alternative facilities to house the
released prisoners contribute to this enormous humanitarian and administrative problem. CHRI believes that a more expansive
documentation of foreign national prisoners would help in dealing with the plight of these prisoners who face lingual and
procedural challenges in access to justice.
X. MENTALLY ILL PRISONERS
Findings of PSI 2017 Report:
There are 6634 inmates suffering with mental illness in Indian prisons, out of which, 3372 are convicts, 3200 are undertrials, 56
are categorised as ‘ others’ and 6 are detenues.
Out of 6 mentally ill detenues, 2 are in Uttar Pradesh, 2 in Jammu and Kashmir and 1 each in Assam and Telangana.
Out of 56 mentally ill prisoners categorised as ‘others’, 32 are in Rajasthan and 24 are in Punjab.
The share of mentally prisoners has increased from 0.7% in 2002 to 1.5% in 2017, with a whopping 186.8% increase in their
number from 2002 to 2017.
Highest number of mentally ill prisoners are in Uttar Pradesh at 1156 followed by Odisha at 787, Maharashtra at 744, West
Bengal at 558 and Madhya Pradesh at 479. Combined, these 5 states have 56.1% of total mentally ill prisoners.
10 States and UTs namely Arunachal Pradesh, Himachal Pradesh, Mizoram, Nagaland, Sikkim, Chandigarh, Dadar & Nagar
Haveli, Daman & Diu, Lakshadweep and Puducherry do not have any mentally ill prisoner.
CHRI’s Comment: There are 288 mentally ill prisoners against one psychologist/ psychiatrist appointed in Indian prisons in 2017.
However, this average is far better than reality as 26 states have no sanctioned position for psychologists/ psychiatrists. Among the
top 5 states with highest mentally ill prisoners, Uttar Pradesh, Odisha and Madhya Pradesh do not have any sanctioned position
for psychologists/ psychiatrists. Maharashtra has 4 against 8 sanctioned and West Bengal has 3 against 8 sanctioned posts for
psychologists/ psychiatrists. Mentally ill prisoners are extremely vulnerable to not only the violation of rights as a prisoner but also
to further deterioration of their mental health. CHRI believes that incarceration of mentally ill persons should be a rarity. The officer
in charge of prisons must appraise the UTRCs about such prisoners from time to time and take steps towards their transfer to
psychiatric institutions. Read CHRI’s detailed comment on the issue of mentally ill prisoners, here.